˙53$-& %&/3*48 12&%*$43 $)/(&3 */ #0/& %&/3*48 /% … with high muscle fat...
TRANSCRIPT

195
Introduction
Peak bone strength achieved in early adulthood is a primary
predictor of fracture risk later in life1,2. Notably, >90% of bone
mineral is accrued by the end of adolescence3 making this pe-
riod the most opportune time to achieve maximal volumetric
bone mineral density (vBMD) and promote adaptations in
bone structure, the primary determinants of bone strength4.
Disruption of normal bone development, resulting in subopti-
mal bone strength, would likely increase risk for developing
future osteoporotic fractures1,5.
The relationship between adiposity and bone in children is
complex and uncertain. While some studies in children have
found a link between adiposity and impaired bone develop-
ment5-7, others have found that adiposity is protective of the
skeleton8. The conflicting results are perhaps due to a failure
to distinguish between fat depots, which are likely to have dif-
ferent consequences for bone9,10. Indeed, recent studies have
shown that abdominal visceral fat and skeletal muscle fat de-
pots are inversely associated with vBMD in adults11 and may
impair skeletal growth and mineralization in young children7,12.
Adults with high muscle fat content also have higher marrow
fat content13, which has been linked to a weaker skeleton14.
These findings suggest the same metabolic processes may be
regulating fat infiltration of skeletal muscle and bone remod-
eling15. Type 2 diabetes mellitus (T2DM) is also independently
associated with both fatty infiltration of skeletal muscle and
reductions in vBMD in adults16,17 and youth18,19. Given that
nearly 20% of the pediatric population is obese20, and that
J Musculoskelet Neuronal Interact 2014; 14(2):195-204
Muscle density predicts changes in bone density and strength:
a prospective study in girls
D.R. Laddu1, J.N. Farr2, V.R. Lee3, R.M. Blew3, C. Stump4, L. Houtkooper1,
T.G. Lohman3, S.B. Going1,3
1Department of Nutritional Sciences, University of Arizona, Tucson, AZ, USA; 2Department of Endocrinology, College of Medicine,
Mayo Clinic, Rochester, Minnesota, USA; 3Department of Physiological Sciences, University of Arizona, Tucson, AZ, USA; 4Faculty of Medicine, Department of Endocrinology, University of Arizona, Tucson, AZ, USA
Abstract
Objective: We sought to determine whether muscle density, an index of skeletal muscle fat content, was predictive of 2-year
changes in weight-bearing bone parameters in young girls. Methods: Two-year prospective data from 248 girls, aged 8-13 years
at baseline. Peripheral quantitative computed tomography was used to measure changes in bone strength indices (bone strength
index [BSI, mg2/mm4] and strength-strain index [SSIp, mm3]) and volumetric bone mineral density [vBMD, mg/cm3] at distal
metaphyseal and diaphyseal regions of the femur and tibia, as well as calf and thigh muscle density (mg/cm3), and muscle cross-
sectional area (MCSA, mm2), indices of skeletal muscle fat content and muscle force production, respectively. Results: After
controlling for potential confounders, greater gains in femur BSI (44%, P<0.002), total femur vBMD (114%, P<0.04) and femur
trabecular vBMD (306%, P<0.002) occurred in girls in the lowest versus the highest groups of baseline thigh muscle density.
Greater gains in tibial BSI (25%, P<0.03) and trabecular vBMD (190%, P<0.002) were also observed in the lowest versus the
highest baseline calf muscle density groups. Conclusion: Baseline muscle density is a significant predictor of changes in bone
density and bone strength in young girls during a period of rapid skeletal development. NIH/NICHD #HD-050775.
Keywords: Skeletal Muscle Fat Content, Bone Development, Girls, volumetric Bone Mineral Density (vBMD), peripheral Quantitative
Computed Tomography (pQCT)
Original Article Hylonome
The authors have no conflict of interest. All phases of this study were
supported by an NIH/NICHD grant #HD-050775.
Corresponding author: Deepika Laddu, Department of Nutritional Sciences,
The University of Arizona, 1713 E. University Blvd. #93, Tucson, AZ, USA
85721-0093
E-mail: [email protected]
Edited by: F. Rauch
Accepted 6 April 2014
D.R. Laddu et al.: Muscle density and bone development in girls
196
overweight and obese children are over-represented in child-
hood fracture cases21,22, excess skeletal muscle fat may serve
as an important risk factor for suboptimal bone development
as well as metabolic dysfunction16,23,24, in youth.
Previous cross-sectional studies in children and adults have
reported significant positive associations between muscle den-
sity, which is inversely associated with skeletal muscle fat con-
tent25, and bone parameters assessed by peripheral quantitative
computed tomography (pQCT)26-28. For example, in a cross-
sectional analysis, we found that muscle density was independ-
ently associated with bone strength of the femur and tibia after
adjusting for potential confounders in girls26. To our knowledge,
only one other study has assessed prospectively, the relationship
between muscle, particularly muscle size, and bone growth dur-
ing puberty29. However, because longitudinal data on the rela-
tionships between skeletal muscle fat, and bone strength and
development in children and adolescents are scarce, we con-
ducted a 2-year longitudinal study in 248 girls to show that
changes in muscle density of the calf an thigh was positively
associated with changes in weight-bearing vBMD and bone
strength30. These findings suggest that skeletal muscle fat may
serve as a predictor of poor skeletal development in children
and adolescents. However, whether baseline levels of skeletal
muscle fat content are a useful predictor of longitudinal changes
in bone parameters in pediatric patients is not known.
Therefore, in the present analysis, we sought to determine
whether baseline calf and thigh muscle density, an index of
skeletal muscle fat content, predicted 2-year changes in vBMD
and indices of bone strength at weight-bearing skeletal sites
(i.e., femur and tibia) in girls. On the basis of our previous
findings26,30, as well as the contention that osteoporosis-prone
individuals may be identified even before puberty by virtue of
low bone parameters for their age31, we hypothesized that mus-
cle density would be associated with 2-year changes in vBMD
and bone strength at weight-bearing skeletal sites in girls.
Methods
Participants
The study was approved by the University of Arizona
Human Subjects Protection Committee and was conducted in
accordance with the Helsinki Declaration. All girls and
guardians provided written informed consent. Details regard-
ing subject recruitment as well as the study protocol have been
published previously26,30. The data presented in this paper came
from healthy fourth and sixth grade girls (n=248; aged 8 to 13
years at baseline), who were recruited as participants in the
Jump-In: Building Better Bones study24. The primary aim of
Jump-In was to evaluate the effects of a school-based exercise
intervention on bone development in girls. The exercise inter-
vention, lasting 5-10 minutes/session, was delivered 3 times
per week in physical education class and/or recess, depending
on school schedules. Additional details regarding the exercise
intervention have been previously reported30. Exclusion crite-
ria included medications known to affect bone metabolism and
medical disorders associated with altered skeletal structure or
function. Baseline bone and soft tissue composition data were
available on 444 girls26 after exclusion of 65 pQCT scans due
to the presence of motion artifact. Of those girls, 248 com-
pleted 2-year laboratory assessments and acceptable pQCT
scans for soft tissue analysis; thus, these subjects were in-
cluded in the present analysis. Motion artifact was determined
by trained staff who rated the level of movement as described
previously32. Each scan was visually inspected and rated using
a linear, ordinal scale of 1 to 5 to assess the level of motion ar-
tifact present. A score of 1 represented a scan with no move-
ment and 5 represented extreme movement such that
significant image streaking and disruption of the cortical shell
was present. Images graded 4 or 5 were deemed to have unac-
ceptable motion artifact for bone and soft tissue analysis.
Anthropometry
Measures of body mass, standing height, sitting height and
bone lengths were obtained following standardized protocols33.
Body mass was measured (nearest 0.1 kg) using a calibrated
scale (Seca, Model 881, Hamburg, Germany). Standing and
sitting height were measured at full inhalation (nearest mil-
limeter, mm) using a calibrated stadiometer (Shorr Height
Measuring Board, Olney, MD). Femur and tibia lengths (near-
est mm) were measured on the non-dominant leg. Leg domi-
nance was determined by asking participants which foot they
would use to kick a ball when playing soccer/kickball. If the
subject was uncertain, she was asked to identify the hand used
for writing, and that was determined to be her side of domi-
nance. Femur length was measured from the proximal aspect
of the patella to the inguinal crease. Tibia length was measured
from the proximal end of the medial border of the tibial plateau
to the distal edge of the medial malleolus. Baseline coefficients
of variation (CVs; intra-operator variability) for femur and
tibia lengths (n=444 girls), calculated as described by Glüer et
al34, are 0.34% and 0.51%, respectively35. For each anthropo-
metric variable, two measurements were taken and averaged.
Both measurements were repeated if the first two trials differed
by more than 4 mm for height, sitting height and bone lengths
and 0.3 kg for body mass, and the average of the second set of
measures was used.
Physical maturation
Maturation was assessed using maturity offset over the more
conventional method of Tanner staging due to its reliance on
objective anthropometric measurements of linear growth. Ma-
turity offset is based on estimated years from peak height ve-
locity (PHV) using Mirwald’s equation36. These algorithms
include interactions among anthropometric measures (i.e.,
height, weight, sitting height, leg length) and chronologic age
to derive a maturity-offset value. The following equation from
Mirwald et al.36 was used to derive maturity offset in our sample
of young females: Maturity offset (y)= -9.376+0.0001882*Leg
Length (cm) and Sitting Height (cm) interaction+0.0022*Age
(y) and Leg Length (cm) interaction+0.005841*Age (y) and
Sitting Height (cm) interaction – 0.002658*Age (y) and Weight
(kg) interaction+0.07693*Weight (kg) by Height (cm) ratio.
D.R. Laddu et al.: Muscle density and bone development in girls
197
Positive maturity offset values represent years after PHV while
a negative maturity offset value represents years before PHV.
In Mirwald’s sample, the maturity offset equation for girls ex-
plained 89% of the variance in years from PHV.36
Physical activity
Physical activity (PA) was assessed by the modified Past
Year Physical Activity Questionnaire (PYPAQ), a survey of
all sport and leisure-time physical activity in which the respon-
dent engaged at least 10 times in the past year outside of phys-
ical education class37,38. The modified PYPAQ (mPYPAQ)
solicits information regarding the average duration, weekly
frequency and the number of months of participation for each
activity. Previous cross-sectional analyses from our laboratory
have shown that the modified version of the PYPAQ is posi-
tively associated with geometric adaptations of the femur and
tibia and is a stronger predictor of bone strength compared to
other assessments of physical activity (i.e., 3-day physical ac-
tivity recall questionnaire (3DPAR) pedometer, bone-specific
physical activity questionnaire, BPAQ)38. The mPYPAQ was
administered in an interview with the participant and guardian.
Total mPYPAQ score was computed using a modified equation
from Shedd and colleagues39, which incorporated weight-bear-
ing load, frequency and duration of each activity reported:
PYPAQ score=Σ1–n [duration (minutes/session) × frequency
(days/week) × load (peak strain score )], where n was the num-
ber of activities a subject reported during the past year35.
Bone and body composi\tion assessment
pQCT – Bone measures
Changes in vBMD and bone strength were assessed using
pQCT (XCT 3000, Stratec Medizintechnik GmbH, Pforzheim,
Germany, Division of Orthometrix; White Plains, NY, USA)
at the distal 4% and 20% femur and distal 4% and 66% tibia
sites relative to the respective distal growth plates on the non-
dominant limb. Scout scans were performed to locate the distal
growth plates, with the scanner programmed to find the sites
of interest based on skeletal lengths. Slice thickness was set to
2.3 mm and voxel size was set to 0.4 mm. Scanner speed was
set at 25 mm/s. Additional details regarding pQCT bone meas-
urements, image processing, calculations, and analysis, are
published elsewhere40. pQCT data acquisition and analyses fol-
lowed guidelines provided by Bone Diagnostics, Inc. (Fort
Atkinson, WI, USA). All pQCT scans were performed by a
single operator, and one investigator (J.N.F) analyzed all scans
using the Stratec software (version 6.0). The pQCT instrument
was calibrated and quality assurance procedures were com-
pleted daily in order to ensure precision of measurements.
Trabecular vBMD (mg/cm3) and bone strength index (BSI,
mg2/mm4) were assessed at the distal metaphyseal (4%) sites
of the femur and tibia, and cortical vBMD (mg/cm3) and polar
strength-strain index (SSIp, mm3) at the femur (20%) and tibia
(66%) diaphyseal sites. BSI estimates the bone’s ability to with-
stand compression at metaphyseal regions, and is calculated as
the total area x total vBMD.2 41 SSIp is used to estimate the
bone’s ability to resist torsion and bending forces at diaphyseal
regions. Diaphyseal SSIp was calculated using Stratec software
as the integrated product of the geometric properties (i.e., sec-
tion modulus) with the material properties of bone: Strength-
strain index (SSIp, mm3)=Σi=1, n ([(r2i x a)/rmax] x (cortical
vBMD/ND)39 Σi=1; section modulus is calculated as (r2ix a)/rmax,
where a is the area of a voxel (mm2), r is the distance of a voxel
from the center of gravity (mm), and rmax is the maximum dis-
tance of a voxel from the center of gravity (mm). The material
properties of bone are calculated as the quotient of measured
cortical density (cortical vBMD, mg/cm3) and normal physio-
logic cortical density (ND,1200 mg/cm3). To establish precision
errors, 29 subjects were scanned twice with repositioning be-
tween scans; CVs calculated as described by Glüer and col-
leagues34 were less than 1.1% for vBMD and indices of bone
strength (i.e., BSI and SSIp)26.
pQCT – Soft tissue measures
Muscle density (mg/cm3) and muscle cross sectional area
(MCSA, mm2) were assessed at the 20% femur (thigh) and
66% tibia (calf) sites of the non-dominant limb using pQCT
as described previously26. Tissue characteristics (i.e., adipose,
muscle, and bone) were separated using edge detection and
threshold techniques based on attenuation characteristics,
which are directly related to tissue composition and density.
Details describing edge detection and image filtration for tis-
sue analysis in our laboratory have been previously reported26.
All images were filtered subsequently with a 7x7 image filter
that clearly defined the edge of the muscle and eliminated all
bone above 120 mg/cm3, thereby ensuring that muscle density
was the only soft-tissue component being measured within the
edge of the muscle. A limitation of pQCT is the inability to
distinguish between intra- and extramyocellular fat compart-
ments; however, several controlled studies have established a
clear relationship between lower muscle density and higher
skeletal muscle fat content25,42. Thus, muscle density was used
as a composite index of skeletal muscle fat content in the intra-
and extramyocellular stores. Coefficients of variation (CVs;
intra-investigator) for MCSA and muscle density obtained at
the calf and thigh regions were 1.4% and 0.9%, respectively,
whereas CVs for these parameters at the thigh region were
1.2% and 0.4%, respectively (n=29)26.
Statistical analysis
Data were checked for outliers and normality using his-
tograms, and skewness and kurtosis were calculated for all
variables. All bone variables were normally distributed; thus,
no transformations were applied. Descriptive statistics (means,
SDs, and ranges) were calculated for the entire sample. Quin-
tiles were subsequently used to divide the sample into 5 muscle
density groups (fifths). Bone strength and density outcomes
did not differ significantly among the three middle fifths of
muscle density; thus, we collapsed these groups into a single
group and compared bone parameters among the lowest, mid-
dle (average of the middle three fifths), and highest groups.
Analysis of covariance (ANCOVA) was used to determine

D.R. Laddu et al.: Muscle density and bone development in girls
198
whether there were significant differences in bone develop-
ment parameters among the 3 groups of baseline calf and thigh
muscle density, respectively, after adjusting for ethnicity, ran-
domization, baseline measures of maturity offset, bone lengths
(femur or tibia), MCSA, 2-year change in maturity offset, and
average physical activity level. Bonferroni post hoc tests were
used to adjust for multiple comparisons among groups of base-
line thigh and calf muscle density. Prior to ANCOVA analyses,
linear regression analyses were used to assess the influence of
the model covariates (e.g., ethnicity, randomization, baseline
measures of maturity offset, bone lengths (femur or tibia),
MCSA, 2-year change in maturity offset and average physical
activity level) on bone outcomes. All regression models were
assessed for linearity, normality and homoscedasticity using
residual plots. The average value for physical activity (average
PYPAQ) was used as a covariate over baseline or 2-year
PYPAQ scores, to control for the overall effect of physical ac-
tivity on bone development over the 2-year study period. The
2-year change in maturity offset was included as a covariate
to capture changes in maturation, which is known to signifi-
cantly influence linear growth and body composition2. Femur
length or tibia length (without height) was included in regres-
sion models for thigh and calf muscle density, respectively. It
should be noted that 52% of the girls included in this analysis
participated in a school-based exercise intervention. However,
additional analyses showed that the relationships were essen-
tially identical in models with and without control for the ex-
ercise intervention with a categorical variable Previous results
from our laboratory30 confirm that, after adjusting for similar
covariates, no interactions or effect modifications were present
for any of the independent variables, supporting the use of a
collapsed versus stratified group. Nevertheless, to control for
any potential confounding introduced by the intervention, all
analyses were adjusted for inclusion in the intervention versus
control group. All analyses were performed using the Statisti-
cal Package for the Social Sciences for Windows, Version 20.0
(SPSS, Chicago, IL,USA). The level of statistical significance
was set at P<0.05 (two-tailed).
Results
Descriptive characteristics
Descriptive statistics for the study subjects are provided in
Table 1. Sample ethnicity was 23% Hispanic and 77% non-
Hispanic. Sample race was 90% white, 6.4% Asian, 2.4%
black or African American, 0.8% Native American or Pacific
Baseline 24-months % changea
Age (years) 10.6±1.1 12.7±1.1 -
Maturity offset (years) -1.2±1.0 0.70±1.0 -
Tanner (%; 1/2/3/4/5) 35/33/28/4/0 6/13/37/37/8 -
Menarche (%; Post) 6 48 -
Height (cm) 144.2±9.9 156.9±9.1 8.8a
Weight (kg) 38.6±9.9 50.0±12.2 29.5a
BMI (kg/cm2) 18.3±3.2 20.1±3.8 9.8a
Femur length (cm) 34.0±3.1 36.8±2.6 8.0a
Tibia length (cm) 33.1±2.9 36.4±2.5 9.9a
Physical activity score 5322.8±4670.0 5182.8±4204.6 -2.6
Total body fat mass (kg) 11.0±6.0 15.4±7.9 39.5a
Whole body lean mass (kg) 25.5±5.0 32.2±5.6 26.3a
Thigh muscle density (mg/cm3) 76.3±1.5 77.5±1.4 1.6a
Calf muscle density (mg/cm3) 79.0±1.2 80.0±1.2 1.2a
Thigh muscle cross-sectional area (mm2) 3557.3±713.7 4407.5±916.0 23.9a
Calf muscle cross-sectional area (mm2) 3193.6±576.7 3876.0±659.1 21.3a
Femur BSI (mg2/mm4) 94.3±27.0 123.4±36.1 30.8a
Femur SSI (mm3) 1320.0±399.3 1881.1±521.6 42.5a
4% Femur total density (mg/cm3) 274.5±33.5 289.4±40.1 5.4a
20% Femur cortical density (mg/cm3) 1046.5±22.9 1068.5±31.7 2.1a
4% Femur trabecular density (mg/cm3) 236.2±31.9 246.1±37.0 4.2a
4% Tibia BSI (mg2/mm4) 50.6±12.8 68.0±19.7 34.4a
66%Tibia SSI (mm3) 1153.3±328.4 1593.3±417.4 38.1a
4% Tibia total density (mg/cm3) 293.7±34.1 321.2±46.1 9.4a
66% Tibia cortical density (mg/cm3) 1027.9±31.9 1057.1±36.7 2.8a
4% Tibia trabecular density (mg/cm3) 221.9±25.3 229.2±30.7 3.3a
Values are presented as mean ± SD. P values represent paired samples t-Test for difference between the baseline and 2-year study visit.
BSI=bone strength index (mg2/mm4); SSI=strength–strain index (mm3); aSignificant at P<0.0001.
Table 1. Sample descriptive characteristics (n=248).

D.R. Laddu et al.: Muscle density and bone development in girls
199
Islander, and 0.4% other. Based on body mass index (BMI,
kg/m2), at baseline, 3.2% of the sample was underweight
(BMI<5th percentile), 75.4% of the sample was healthy weight
(BMI 5th to 85th percentile), 13.7% of the sample was over-
weight (BMI 85th to 95th percentile), and 7.7% of the sample
was obese (BMI>95th percentile)43. At the 2-year follow up,
2.3% of the sample was underweight, 72.7% of the sample was
healthy weight, 17.7% of the sample was overweight, and
7.3% of the sample was obese. At baseline, 67% of the girls
were early pubertal (Tanner stages II) and 7% of the girls had
reached menarche. By the 2-year follow-up, 48% (n=118) of
the girls were postmenarcheal. On average, participants were
1.2 years away from achieving PHV at baseline, ranging from
3.2 years prior to PHV to 1.0 years post PHV. At the two-year
follow-up, maturity offset averaged 0.70 years post PHV
(range: -1.73 to 3.21).
As expected, significant increases in age, maturity, height,
body weight, body mass index (BMI), femur length, tibia
length, total body fat mass and lean mass, calf and thigh
MCSA, calf and thigh muscle density, and femur and tibia
bone strength and bone density indices were observed (all p
values <0.001) from baseline to the 2-year follow-up.
Associations between covariates and changes in bone outcomes
Multiple linear regression analyses were used to assess the
independent relationships between model covariates and bone
parameters. Baseline maturity offset was positively associated
with change in total vBMD at the femur (all r=0.31) and tibia
(r=0.37) and with change in cortical vBMD at the diaphyseal
femur (r=0.31) (all P<0.0001). Similar positive relationships
were observed between the 2-year change in maturity offset
and changes in total and trabecular vBMD at the femur
(r=0.32; r=0.41) and tibia (r=0.23; r=0.21) sites, as well as with
all indices of bone strength (femur: r=0.48-0.64; tibia: r=0.40-
0.61) (all P<0.0001). Lastly, significant, positive associations
were found between baseline thigh MCSA and change in BSI
(r=0.24) and SSIp (r=0.29) at the femur and baseline calf
MCSA and change in bone strength indices at the tibia (r=0.30-
0.34) (all P<0.0001). In contrast, in all analyses, covariates in-
cluding randomization, ethnicity, physical activity, and bone
length did not significantly influence the relationships between
thigh and calf muscle density and bone outcomes.
Comparison of bone parameters across muscle density groups
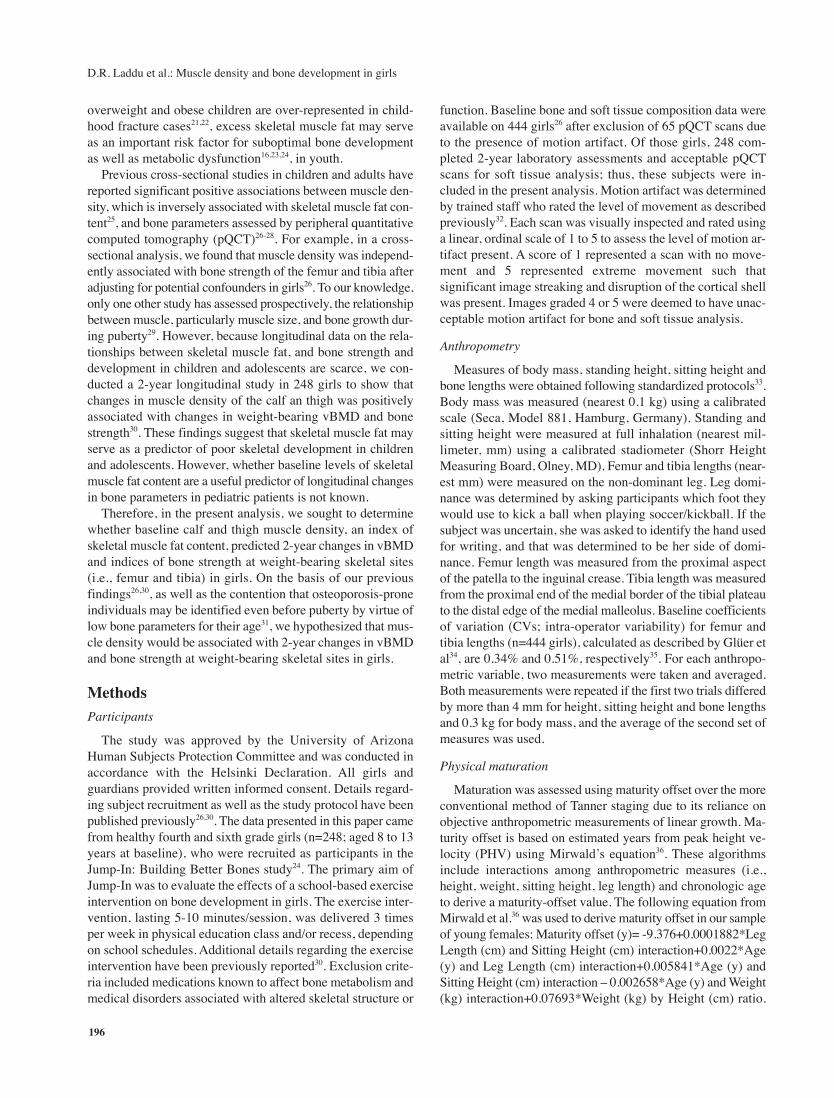
Figures 1 and 2 show the adjusted means (± standard errors)
for change in vBMD (Figure 1) and bone strength (Figure 2)
across groups of baseline thigh (Panel A) and calf muscle den-
sity (panel B). Participants in the lowest compared to the high-
est group of baseline thigh muscle density gained significantly
more total vBMD (1.14 fold) at the femur whereas the middle
versus highest group of baseline thigh muscle density in-
creased more in cortical vBMD at the diaphyseal femur (all
P<0.04). The largest increase in trabecular vBMD occurred at
femur and tibia metaphyseal (4%) sites. Participants in the
lowest group of baseline thigh muscle density had a 3.06 fold
greater increase at the distal femur in trabecular vBMD
(P<0.002) compared to participants in the highest group of
baseline thigh muscle density. Participants in the lowest group
of baseline calf muscle density similarly experienced a 1.9 fold
greater gain in trabecular vBMD at the distal tibia versus the
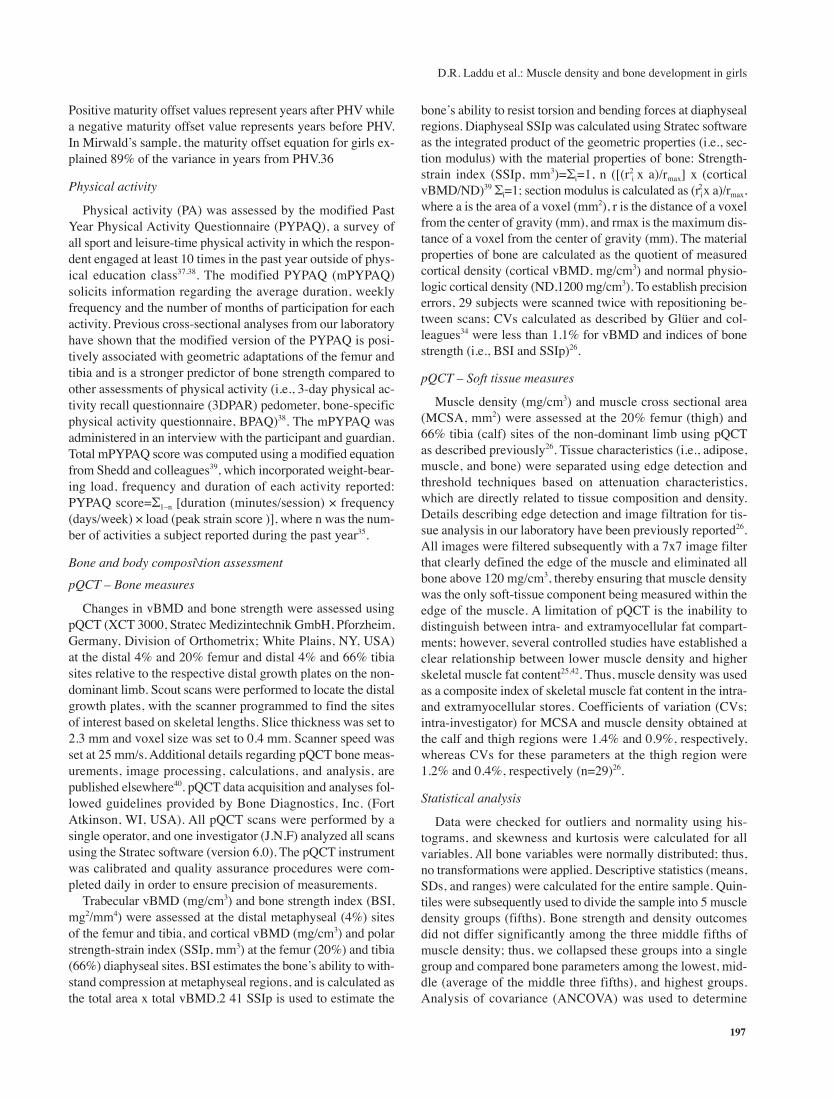
highest group of calf muscle density (P<0.013). Importantly,
these changes reflected similar gains in bone strength. Partic-
Figure 1. Adjusted (±SE) change in femur and tibia vBMD across groups of baseline thigh (A) and calf (B) muscle density. Differences among
groups of baseline muscle density were evaluated by ANCOVA using randomization, ethnicity, baseline measures of maturity offset, bone
lengths, MCSA, 2-year change in maturity offset and average physical activity. MD= muscle density (mg/cm3); Tot BMD= total (average) vol-
umetric bone mineral density (mg/cm3); Cort BMD=cortical volumetric bone mineral density (mg/cm3); Trab BMD=trabecular volumetric bone
mineral density (mg/cm3). aSignificantly different (P<0.05) from highest group; ANCOVA; †Significantly different (P<0.01) from highest group;
ANCOVA; bSignificantly (P<0.05) different from middle group; ANCOVA.

D.R. Laddu et al.: Muscle density and bone development in girls
200
ipants in the lowest group had 44% (P<0.002) greater increase
in femur BSI compared to the highest group of thigh muscle
density and a 22% (P<0.032) gain in BSI compared to the mid-
dle group of thigh muscle density. Similarly, participants in the
lowest group of baseline calf muscle density gained 19% and
25% more BSI (all P<0.03) at the tibia versus girls in the mid-
dle and highest group of calf muscle density, respectively.
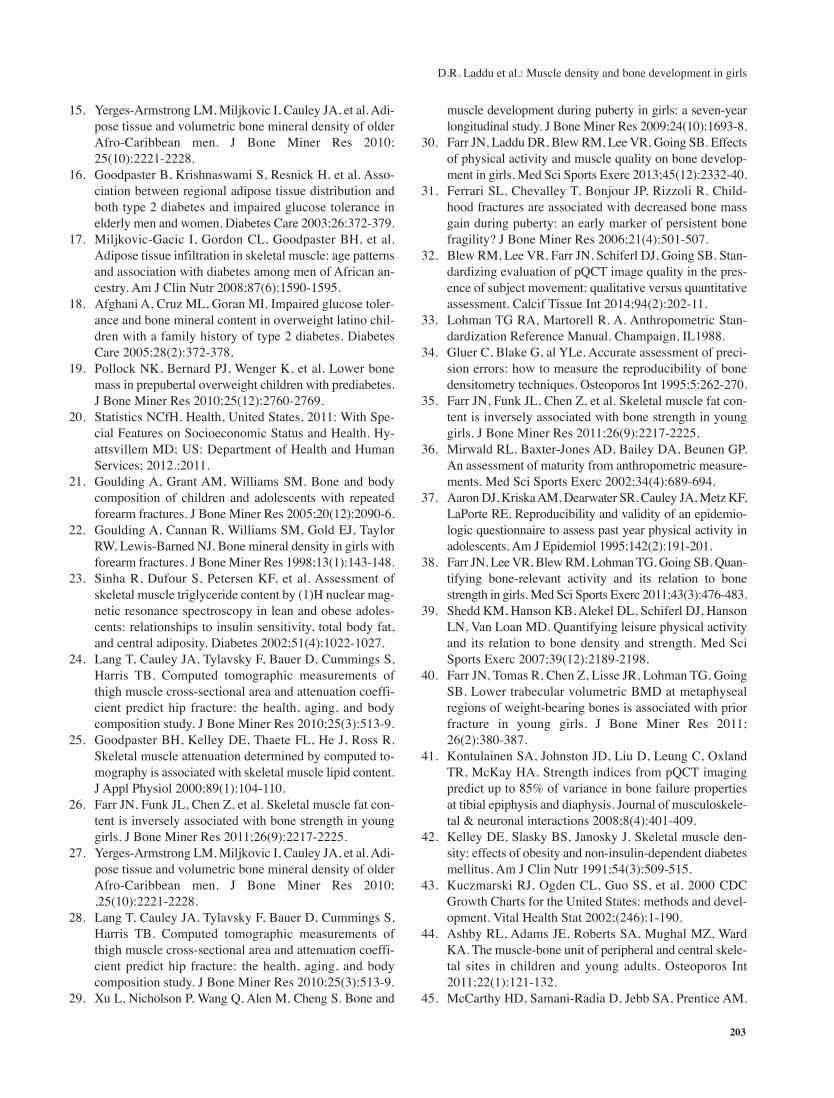
Comparisons of the change in muscle density across the
lowest, middle (average of the middle three fifths), and highest
groups of baseline muscle density of the thigh and calf, after
adjusting for the same covariates are shown in Figure 3. Girls
in the lowest group of muscle density at baseline experienced
the greatest increase in muscle density as well as the greatest
increase in vBMD and bone strength compared to girls in the
middle and highest groups (all P<0.0001).
Discussion
In the present longitudinal analysis, we investigated the as-
sociation of baseline muscle density, an index of skeletal mus-
cle fat, with changes in vBMD and indices of bone strength in
girls. Based on our previous work showing positive associa-
tions between muscle density and bone strength23,26, we hy-
pothesized that girls with higher levels of calf and thigh muscle
density would gain more bone over a critical 2-year period of
skeletal development. Our results show that across differences
of baseline muscle density, changes in bone parameters were
evident, with the greatest gains in muscle density and bone pa-
rameters occurring in girls with the lowest muscle density
(Figures 1-3). These results were independent of an exercise
intervention effect on baseline and 2-year physical activity lev-
els. Further, because no differences in age or maturation were
observed among the muscle density groups at baseline, these
findings suggest that increases in bone development parame-
ters occur independent of changes in maturation and related
biological factors that are known to affect linear growth, and
therefore rules out these potential confounders as explanations.
Indeed, these longitudinal data support our previous cross-sec-
tional26 and longitudinal findings30, and suggest that muscle
Figure 2. Adjusted (±SE) changes in femur and tibia BSI (A) and SSIp (B) across groups of baseline thigh and calf muscle density. Differences
among groups of baseline muscle density. were evaluated by ANCOVA using randomization, ethnicity, baseline measures of maturity offset,
bone lengths, MCSA, 2-year change in maturity offset and average physical activity. MD=muscle density (mg/cm3); BSI=bone strength index
(mg2/mm4); SSI=strength–strain index (mm3). aSignificantly different (P<0.03) from highest group; ANCOVA; bSignificantly (P<0.05) different
from middle group; ANCOVA.
Figure 3. Adjusted (±SE) changes in thigh and calf across groups of
baseline thigh and calf muscle density. Differences among groups for
respective groups of baseline muscle density were evaluated by AN-
COVA using randomization, ethnicity, baseline measures of maturity
offset, bone lengths, MCSA, 2-year change in maturity offset and av-
erage physical activity. MD=muscle density (mg/cm3). aSignificantly
different (P<0.0001) from highest group; ANCOVA.

D.R. Laddu et al.: Muscle density and bone development in girls
201
density is a significant predictor of changes in weight-bearing
bone density and strength during rapid growth. Together, these
findings support the idea that muscle and bone are related and
suggest that changes in muscle density help to predict changes
in bone parameters during growth. These results have impor-
tant implications given that muscle development plateaus at
an earlier age in females, resulting in a greater accrual of fat
relative to muscle mass during adolescence44. Because 25% of
bone mass is accrued in the two years surrounding peak height
velocity1, understanding the contributory effects of skeletal
muscle quality on bone during this “window of opportunity”
could inform preventive strategies aimed to optimize gains in
vBMD and bone strength during growth and possibly reduce
fracture risk later in life.
Our previous cross-sectional work26 showed that higher
skeletal muscle fat was associated with lower bone strength in
pre- and early-pubertal girls. In the present analysis, we show
that greater gains in vBMD and bone strength at metaphyseal
and diaphyseal sites of the femur and tibia as well as greater
increases in muscle density, occurred in girls with the lowest
baseline muscle density, which supports our previous analysis
showing changes in muscle density predict changes in bone
outcomes30. Thus, given that lower muscle density is an index
of greater skeletal muscle fat content25, our findings suggest
that fatty infiltration of the skeletal muscle may impair bone
development during growth and act as an important risk factor
for the development of osteoporosis later in life. These results
are consistent with previous studies in adults reported by
Yerges-Armstrong et al.15 and Lang et al.28 who both found that
indices of skeletal muscle fat content, measured by pQCT, were
inversely associated with vBMD at weight-bearing skeletal
sites, as well as the results of recently published longitudinal
analyses from our laboratory30 showing that reductions in skele-
tal muscle density (increased skeletal muscle fat content) were
related to lesser gains in vBMD and bone strength at the femur
and tibia during a 2-year follow up. Further studies will be nec-
essary to determine how muscle density predicts fracture risk.
The underlying mechanisms that explain the relations be-
tween skeletal muscle fat and bone are not fully understood,
although evidence linking metabolic dysfunction to muscu-
loskeletal abnormalities is mounting. For example, studies in
children and adults have suggested a strong link between low
muscle mass and muscular strength45 and fat deposition in
skeletal muscle (i.e., intramyocellular fat stores), insulin re-
sistance, and Type 2 diabetes mellitus23. Likewise, because the
insulin signaling is involved in maintaining skeletal muscle
mass as well as bone remodeling, skeletal muscle atrophy and
subsequent compromises in bone strength could occur as a
consequence of increased skeletal muscle triglyceride deposi-
tion46. In adults, increased storage of triglycerides and smaller
lipid droplets that form along the muscle membrane has been
shown to contribute to the loss of muscle strength and a decline
in lower extremity performance and an increased risk of falls
and fractures24. Epidemiologic studies in older adults have re-
ported relationships between muscle mass measurements and
fractures that were related to lower BMD, functional decline,
and metabolic dysfunction47. In support of these data, a recent
study24 reported that in elderly men and women, a 1 SD de-
crease in thigh muscle Hounsfield units (HU) resulted in a 50%
increase in hip fracture risk. After appropriate adjustments for
chronic disorders (e.g., diabetes, hypertension), the association
of thigh muscle HU value with hip fracture risk remained sig-
nificant (40% risk), although the decline in risk supports the
additional effect of metabolic dysregulation on bone mainte-
nance and skeletal integrity24. The relationship between skele-
tal muscle fat content and muscle function in young girls is
unclear. Nevertheless, from our prior and current analyses, it
is clear that skeletal muscle density, an established surrogate
of skeletal muscle fat content25, is an important factor to con-
sider in understanding the developing bone.
Increasing evidence demonstrates a molecular link between
adipocytes, osteocytes and myocytes. Adipocytes, skeletal my-
ocytes and osteoblasts originate from a common progenitor,
multipotential mesenchymal stem cells, located within the
bone marrow microenvironment. Upon activation by various
growth factors47, these cells have an equal propensity to dif-
ferentiate into the adipogenic, myogenic and osteogenic
cells48,49. Proliferation of existing muscle satellite cells into
myogenic precursor cells is specifically activated by transcrip-
tion factors (MyoD, Myf5, and Pax7) released in response to
increased weight bearing and mechanical stimulation from
muscle contractions. Recent in vitro studies show that muscle
satellite cells are capable of differentiating into osteocytes and
adipocytes as well as skeletal myocytes46. Thus enhanced use
and growth of muscle fibers during development contributing
to gains in muscle density and muscle strength also helps drive
the bone modeling and remodeling processes. Consequently,
lack of mechanical stimulation from muscle contraction con-
tributes to the differentiation of muscle satellite cells into
adipocytes rather than myocytes or osteocytes. Further evi-
dence is needed to examine whether it is possible for adi-
pogenic cell differentiation into myocytes to occur in response
to reductions in skeletal muscle fat (gains muscle density).
This study has several important strengths. The large sample
size and the longitudinal design improves upon the limitations
of past cross-sectional studies7,50, by providing an opportunity
to assess the effects of soft tissue composition, such as fat
within skeletal muscle, independent of bone loading physical
activity, on bone development in girls. A novel aspect was the
use of pQCT-derived measures of thigh and calf-specific mus-
cle cross-sectional areas, surrogates for muscle size and
strength, to control for mechanical stimulation from muscle
forces that undoubtedly influence bone development during
the pubertal transition51. Evaluating vBMD and bone strength
in the context of muscle strength and bone length components
is important when evaluating pediatric bone health52-54. Given
the large range of physical maturation among individuals of
the same chronological age our use of Mirawald’s36 equation
to objectively assess bone age assessment was an additional
study strength.
It should be noted that our study had a number of limitations.
For example, as noted earlier, while muscle density is directly

D.R. Laddu et al.: Muscle density and bone development in girls
202
related to skeletal muscle fat content, it does not distinguish be-
tween intramyocellular (IMCL) and extramyocellular (EMCL)
fat compartments, although previous studies using proton mag-
netic resonance spectroscopy (MRS) to measure intra- and ex-
tramyocellular fat stores in adults55 and in children23 have
demonstrated that composite measures of IMCL and EMCL
such as skeletal muscle density are acceptable indices of skele-
tal muscle fat content. Thus, muscle density from pQCT is a
cost-effective and low-radiation (<0.001 mSV) surrogate for
skeletal muscle fat content that is feasible for relatively large-
scale studies. An additional concern was that we did not meas-
ure functional skeletal muscle parameters, which may also
serve as useful surrogates for skeletal muscle quality and force
production. However, in addition to the assessment of muscle
density, as noted above, a significant strength was the measure-
ment of muscle-cross sectional area, which is strongly related
to skeletal muscle force production56. Another potential concern
is the limited range in growth of muscle density in this popula-
tion, which may have resulted in the underestimation of the im-
pact of skeletal muscle fat content on changes in bone
parameters. Indeed, in a longer follow-up study, we would ex-
pect that the differences in changes in bone parameters between
the highest and lowest baseline muscle density groups would
be even larger than those observed in our 2-year study. Finally,
it is important to note that during the 2-year period of the pres-
ent study, 52% of the girls included in this analysis participated
in a school-based exercise intervention. In order to account for
any bias the intervention may have introduced, we included
randomization as a covariate in all statistical analyses. Never-
theless, we acknowledge that this approach may not have com-
pletely removed all potential bias.
Conclusion
In conclusion, we show that increases in bone density and
bone strength vary significantly across levels of initial muscle
density. Girls with lower muscle density experienced the great-
est increases in bone density and strength compared to girls
with higher muscle density. Girls with lower initial muscle
density also experienced the greatest gains in muscle density
supporting previous findings that gains in muscle density are
related to gains in bone density and bone strength. Given that
muscle density is a surrogate for skeletal muscle fat, these find-
ings support the premise that skeletal muscle fat may con-
tribute to impaired bone development in peri-pubertal girls.
Increased skeletal muscle fat may serve as an important risk
factor for suboptimal bone development in children and ado-
lescents as well as for metabolic disorder16,23,24.
Acknowledgements
The project was supported by Award Number HD-050775 (SG) from
the National Institute of Child Health and Human Development. The con-
tent is solely the responsibility of the authors and does not necessarily
represent the official views of the National Institute of Child Health and
Human Development or the National Institutes of Health. DRL is sup-
ported by the United States department of Agriculture (USDA) National
Needs Fellowship: Graduate Training in Nutritional Sciences (Grant Sup-
port: NIH/NICHD #HD-050775).
References
1. Faulkner RA, Bailey DA. Osteoporosis: a pediatric con-
cern? Medicine and sport science 2007;51:1-12.
2. Foley S, Quinn S, Jones G. Tracking of bone mass from
childhood to adolescence and factors that predict devia-
tion from tracking. Bone 2009;44(5):752-757.
3. Bailey DA, McKay HA, Mirwald RL, Crocker PR,
Faulkner RA. A six-year longitudinal study of the rela-
tionship of physical activity to bone mineral accrual in
growing children: the university of Saskatchewan bone
mineral accrual study. J Bone Miner Res 1999;
14(10):1672-1679.
4. Seeman E, Delmas PD. Bone quality - the material and
structural basis of bone strength and fragility. N Engl J
Med 2006;354(21):2250-2261.
5. Dimitri P, Wales JK, Bishop N. Fat and bone in children:
differential effects of obesity on bone size and mass ac-
cording to fracture history. J. Bone Miner Res 2010;
25(3):527-536.
6. Manias K, McCabe D, Bishop N. Fractures and recurrent
fractures in children; varying effects of environmental
factors as well as bone size and mass. Bone 2006;
39(3):652-657.
7. Goulding A, Taylor RW, Jones IE, McAuley KA, Man-
ning PJ, Williams SM. Overweight and obese children
have low bone mass and area for their weight. Int J Obes
Relat Metab Disord 2000;24(5):627-632.
8. Sayers A, Tobias JH. Fat mass exerts a greater effect on
cortical bone mass in girls than boys. J Clin Endocrinol
Metab 2010;95(2):699-706.
9. Gilsanz V, Chalfant J, Mo AO, Lee DC, Dorey FJ, Mit-
telman SD. Reciprocal relations of subcutaneous and vis-
ceral fat to bone structure and strength. J Clin Endocrinol
Metab 2009;94(9):3387-3393.
10. Russell M, Mendes N, Miller KK, et al. Visceral fat is a neg-
ative predictor of bone density measures in obese adolescent
girls. J Clin Endocrinol Metab 2010;95(3):1247-55.
11. Yamaguchi T, Kanazawa I, Yamamoto M, et al. Associa-
tions between components of the metabolic syndrome
versus bone mineral density and vertebral fractures in pa-
tients with type 2 diabetes. Bone 2009;45:174-179.
12. Russell M, Mendes N, Miller KK, et al. Visceral fat is a neg-
ative predictor of bone density measures in obese adolescent
girls. J Clin Endocrinol Metab 2010;95(3):1247-55.
13. Pluijm SM, Visser M, Smit JH, Popp-Snijders C, Roos
JC, Lips P. Determinants of bone mineral density in older
men and women: body composition as mediator. J Bone
Miner Res 2001;16(11):2142-2151.
14. Kuk JL, Saunders TJ, Davidson LE, Ross R. Age-related
changes in total and regional fat distribution. Ageing re-
search reviews 2009;8(4):339-348.
D.R. Laddu et al.: Muscle density and bone development in girls
203
15. Yerges-Armstrong LM, Miljkovic I, Cauley JA, et al. Adi-
pose tissue and volumetric bone mineral density of older
Afro-Caribbean men. J Bone Miner Res 2010;
25(10):2221-2228.
16. Goodpaster B, Krishnaswami S, Resnick H, et al. Asso-
ciation between regional adipose tissue distribution and
both type 2 diabetes and impaired glucose tolerance in
elderly men and women. Diabetes Care 2003;26:372-379.
17. Miljkovic-Gacic I, Gordon CL, Goodpaster BH, et al.
Adipose tissue infiltration in skeletal muscle: age patterns
and association with diabetes among men of African an-
cestry. Am J Clin Nutr 2008;87(6):1590-1595.
18. Afghani A, Cruz ML, Goran MI. Impaired glucose toler-
ance and bone mineral content in overweight latino chil-
dren with a family history of type 2 diabetes. Diabetes
Care 2005;28(2):372-378.
19. Pollock NK, Bernard PJ, Wenger K, et al. Lower bone
mass in prepubertal overweight children with prediabetes.
J Bone Miner Res 2010;25(12):2760-2769.
20. Statistics NCfH. Health, United States, 2011: With Spe-
cial Features on Socioeconomic Status and Health. Hy-
attsvillem MD; US: Department of Health and Human
Services; 2012.;2011.
21. Goulding A, Grant AM, Williams SM. Bone and body
composition of children and adolescents with repeated
forearm fractures. J Bone Miner Res 2005;20(12):2090-6.
22. Goulding A, Cannan R, Williams SM, Gold EJ, Taylor
RW, Lewis-Barned NJ. Bone mineral density in girls with
forearm fractures. J Bone Miner Res 1998;13(1):143-148.
23. Sinha R, Dufour S, Petersen KF, et al. Assessment of
skeletal muscle triglyceride content by (1)H nuclear mag-
netic resonance spectroscopy in lean and obese adoles-
cents: relationships to insulin sensitivity, total body fat,
and central adiposity. Diabetes 2002;51(4):1022-1027.
24. Lang T, Cauley JA, Tylavsky F, Bauer D, Cummings S,
Harris TB. Computed tomographic measurements of
thigh muscle cross-sectional area and attenuation coeffi-
cient predict hip fracture: the health, aging, and body
composition study. J Bone Miner Res 2010;25(3):513-9.
25. Goodpaster BH, Kelley DE, Thaete FL, He J, Ross R.
Skeletal muscle attenuation determined by computed to-
mography is associated with skeletal muscle lipid content.
J Appl Physiol 2000;89(1):104-110.
26. Farr JN, Funk JL, Chen Z, et al. Skeletal muscle fat con-
tent is inversely associated with bone strength in young
girls. J Bone Miner Res 2011;26(9):2217-2225.
27. Yerges-Armstrong LM, Miljkovic I, Cauley JA, et al. Adi-
pose tissue and volumetric bone mineral density of older
Afro-Caribbean men. J Bone Miner Res 2010;
,25(10):2221-2228.
28. Lang T, Cauley JA, Tylavsky F, Bauer D, Cummings S,
Harris TB. Computed tomographic measurements of
thigh muscle cross-sectional area and attenuation coeffi-
cient predict hip fracture: the health, aging, and body
composition study. J Bone Miner Res 2010;25(3):513-9.
29. Xu L, Nicholson P, Wang Q, Alen M, Cheng S. Bone and
muscle development during puberty in girls: a seven-year
longitudinal study. J Bone Miner Res 2009;24(10):1693-8.
30. Farr JN, Laddu DR, Blew RM, Lee VR, Going SB. Effects
of physical activity and muscle quality on bone develop-
ment in girls. Med Sci Sports Exerc 2013;45(12):2332-40.
31. Ferrari SL, Chevalley T, Bonjour JP, Rizzoli R. Child-
hood fractures are associated with decreased bone mass
gain during puberty: an early marker of persistent bone
fragility? J Bone Miner Res 2006;21(4):501-507.
32. Blew RM, Lee VR, Farr JN, Schiferl DJ, Going SB. Stan-
dardizing evaluation of pQCT image quality in the pres-
ence of subject movement: qualitative versus quantitative
assessment. Calcif Tissue Int 2014;94(2):202-11.
33. Lohman TG RA, Martorell R. A. Anthropometric Stan-
dardization Reference Manual. Champaign, IL1988.
34. Gluer C, Blake G, al YLe. Accurate assessment of preci-
sion errors: how to measure the reproducibility of bone
densitometry techniques. Osteoporos Int 1995;5:262-270.
35. Farr JN, Funk JL, Chen Z, et al. Skeletal muscle fat con-
tent is inversely associated with bone strength in young
girls. J Bone Miner Res 2011;26(9):2217-2225.
36. Mirwald RL, Baxter-Jones AD, Bailey DA, Beunen GP.
An assessment of maturity from anthropometric measure-
ments. Med Sci Sports Exerc 2002;34(4):689-694.
37. Aaron DJ, Kriska AM, Dearwater SR, Cauley JA, Metz KF,
LaPorte RE. Reproducibility and validity of an epidemio-
logic questionnaire to assess past year physical activity in
adolescents. Am J Epidemiol 1995;142(2):191-201.
38. Farr JN, Lee VR, Blew RM, Lohman TG, Going SB. Quan-
tifying bone-relevant activity and its relation to bone
strength in girls. Med Sci Sports Exerc 2011;43(3):476-483.
39. Shedd KM, Hanson KB, Alekel DL, Schiferl DJ, Hanson
LN, Van Loan MD. Quantifying leisure physical activity
and its relation to bone density and strength. Med Sci
Sports Exerc 2007;39(12):2189-2198.
40. Farr JN, Tomas R, Chen Z, Lisse JR, Lohman TG, Going
SB. Lower trabecular volumetric BMD at metaphyseal
regions of weight-bearing bones is associated with prior
fracture in young girls. J Bone Miner Res 2011;
26(2):380-387.
41. Kontulainen SA, Johnston JD, Liu D, Leung C, Oxland
TR, McKay HA. Strength indices from pQCT imaging
predict up to 85% of variance in bone failure properties
at tibial epiphysis and diaphysis. Journal of musculoskele-
tal & neuronal interactions 2008;8(4):401-409.
42. Kelley DE, Slasky BS, Janosky J. Skeletal muscle den-
sity: effects of obesity and non-insulin-dependent diabetes
mellitus. Am J Clin Nutr 1991;54(3):509-515.
43. Kuczmarski RJ, Ogden CL, Guo SS, et al. 2000 CDC
Growth Charts for the United States: methods and devel-
opment. Vital Health Stat 2002;(246):1-190.
44. Ashby RL, Adams JE, Roberts SA, Mughal MZ, Ward
KA. The muscle-bone unit of peripheral and central skele-
tal sites in children and young adults. Osteoporos Int
2011;22(1):121-132.
45. McCarthy HD, Samani-Radia D, Jebb SA, Prentice AM.

D.R. Laddu et al.: Muscle density and bone development in girls
204
Skeletal muscle mass reference curves for children and
adolescents. Pediatric obesity 2013.
46. Sishi B, Loos B, Ellis B, Smith W, du Toit EF, Engel-
brecht AM. Diet-induced obesity alters signalling path-
ways and induces atrophy and apoptosis in skeletal
muscle in a prediabetic rat model. Exp Physiol 2011;
96(2):179-193.
47. Di Monaco M, Vallero F, Di Monaco R, Tappero R, Ca-
vanna A. Fat mass and skeletal muscle mass in hip-frac-
ture women: a cross-sectional study. Maturitas 2007;
56(4):404-410.
48. Zhao LJ, Jiang H, Papasian CJ, et al. Correlation of obe-
sity and osteoporosis: effect of fat mass on the determi-
nation of osteoporosis. J Bone Miner Res 2008;
23(1):17-29.
49. Asakura A, Komaki M, Rudnicki M. Muscle satellite cells
are multipotential stem cells that exhibit myogenic, os-
teogenic, and adipogenic differentiation. Differentiation
2001;68(4-5):245-253.
50. Roemmich JN, Clark PA, Lusk M, et al. Pubertal alter-
ations in growth and body composition. VI. Pubertal in-
sulin resistance: relation to adiposity, body fat distribution
and hormone release. Int J Obes Relat Metab Disord
2002;26(5):701-709.
51. Frost HM. Bone “mass” and the “mechanostat”: a pro-
posal. Anat Rec 1987;219(1):1-9.
52. Pollock NK, Laing EM, Baile CA, Hamrick MW, Hall
DB, Lewis RD. Is adiposity advantageous for bone
strength? A peripheral quantitative computed tomography
study in late adolescent females. Am J Clin Nutr 2007;
86(5):1530-1538.
53. Petit MA, Beck TJ, Kontulainen SA. Examining the de-
veloping bone: What do we measure and how do we do
it? Journal of musculoskeletal & neuronal interactions
2005;5(3):213-224.
54. Klein GL, Fitzpatrick LA, Langman CB, et al. The state
of pediatric bone: summary of the ASBMR pediatric bone
initiative. J Bone Miner Res 2005;20(12):2075-2081.
55. Jacob S, Machann J, Rett K, et al. Association of in-
creased intramyocellular lipid content with insulin resist-
ance in lean nondiabetic offspring of type 2 diabetic
subjects. Diabetes 1999;48(5):1113-1119.
56. Maughan RJ, Watson JS, Weir J. Relationships between
muscle strength and muscle cross-sectional area in male
sprinters and endurance runners. Eur J Appl Physiol
Occup Physiol 1983;50(3):309-318.