5. special weather features of the arctic
TRANSCRIPT

5. SPECIAL WEATHER FEATURESOF THE ARCTIC
5.1 Pollution Versus Arctic Haze
A popular notion exists that the vast, underpopulated, and pristine regions of the Arcticmust have crisp, clean air. But such is not the case. In fact, the Arctic atmosphere isbeclouded by at least two distinct types of turbidity. On the one hand, population centerslike Anchorage and Fairbanks in Alaska produce in situ pollution, and on the other hand,industrial pollutants from midlatitudes have been traced all the way to the Arctic Ocean.
The principal implications regarding the climate of the Arctic due to Arctic haze andpollution involve a significant change in the heat balance of the Arctic and the acidificationof Arctic waters. This section concentrates on pollution problems in Alaska for whichadequate information is available. Populated areas of the Arctic are shown in Fig. 5-1.
In situ pollution will be discussed first. As elsewhere in the world, locally producedair pollution results when three factors are present: a source of polluting material, lightwinds, and strong temperature inversions. Anchorage and Fairbanks have all three. In fact,previous sections described how very common and persistent light winds and strong inver-sions are in the Arctic, especially in winter months. Elevated inversions occur when a layerof warm air glides up over a cold air layer, such as in frontal inversions. Inversions willform right at the ground, however, if radiational cooling of the Earth's surface is the maincooling mechanism. In the Arctic the latter type inversion can occur during the day aswell as at night due to the radiative properties of snow and ice cover and because longperiods occur in winter when no sunlight is present.
Under the low temperature conditions of winter in Fairbanks, according to Bensonand Rizzo (1980), the most visible type of air pollution is ice fog. Ice fog occurs at -30 0F(-35 QC) or below when all water vapor emitted into the atmosphere (from car exhausts,houses, industrial plants, and open water surfaces) condenses onto hygroscopic nuclei andforms droplets. These droplets then freeze almost at once to form tiny ice crystals. Becauseof this origin, ice fog can be considered as a type of air pollution, in which the majorpollutant is ice.
In addition to water, however, other air pollutants, including lead, sulfur dioxide,nitrogen oxides, carbon monoxide, and hydrocarbons are present and often in high con-centrations. Pollutant concentrations in the Fairbanks area in winter are, in fact, found tobe as high as those in cities such as New York, Detroit, and Los Angeles.
5-1

Vt
7-
-El
-I.--,
Populatd pines.
Economic activity
(h pr d I =
0-1
OtGher hyuohect'Ct powe plnt
Figure 5-1. Population Centers of the Arctic (Jones and Bartlett, 1981).
5-2
I-
t . .,
A
I
•O
W rý. -;z
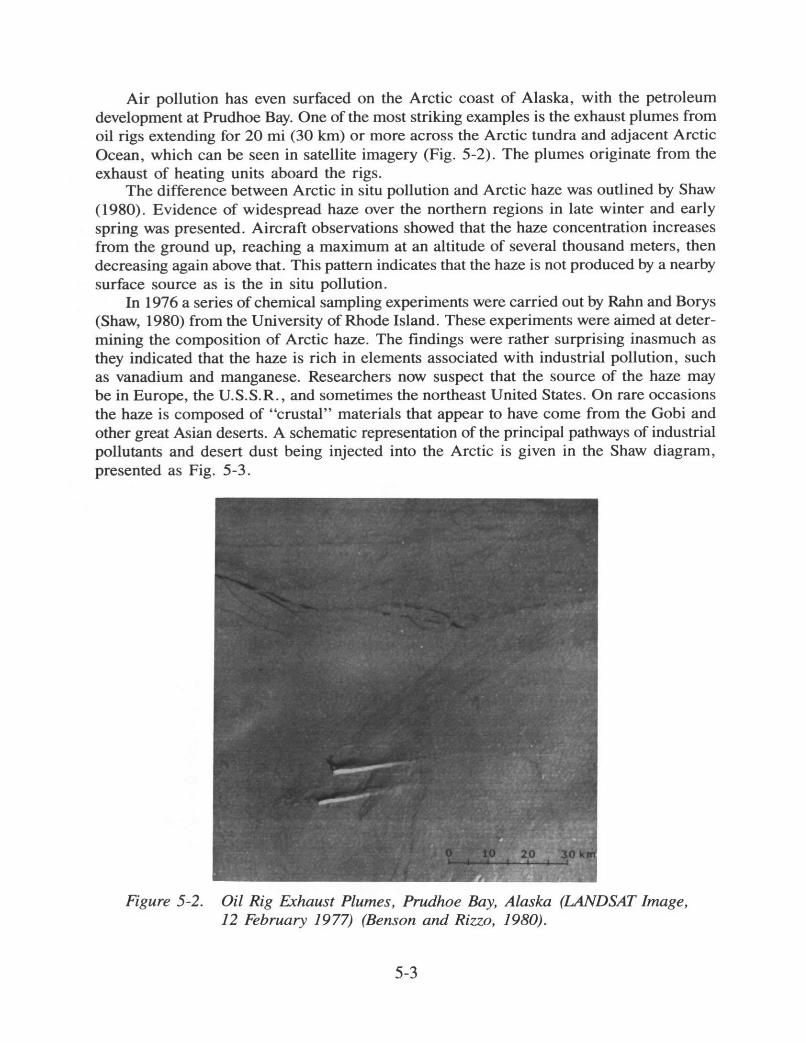
Air pollution has even surfaced on the Arctic coast of Alaska, with the petroleumdevelopment at Prudhoe Bay. One of the most striking examples is the exhaust plumes fromoil rigs extending for 20 mi (30 km) or more across the Arctic tundra and adjacent ArcticOcean, which can be seen in satellite imagery (Fig. 5-2). The plumes originate from theexhaust of heating units aboard the rigs.
The difference between Arctic in situ pollution and Arctic haze was outlined by Shaw(1980). Evidence of widespread haze over the northern regions in late winter and earlyspring was presented. Aircraft observations showed that the haze concentration increasesfrom the ground up, reaching a maximum at an altitude of several thousand meters, thendecreasing again above that. This pattern indicates that the haze is not produced by a nearbysurface source as is the in situ pollution.
In 1976 a series of chemical sampling experiments were carried out by Rahn and Borys(Shaw, 1980) from the University of Rhode Island. These experiments were aimed at deter-mining the composition of Arctic haze. The findings were rather surprising inasmuch asthey indicated that the haze is rich in elements associated with industrial pollution, suchas vanadium and manganese. Researchers now suspect that the source of the haze maybe in Europe, the U.S.S.R., and sometimes the northeast United States. On rare occasionsthe haze is composed of "crustal" materials that appear to have come from the Gobi andother great Asian deserts. A schematic representation of the principal pathways of industrialpollutants and desert dust being injected into the Arctic is given in the Shaw diagram,presented as Fig. 5-3.
Figure 5-2. Oil Rig Exhaust Plumes, Prudhoe Bay, Alaska (LANDSAT Image,12 February 1977) (Benson and Rizzo, 1980).
5-3

Figure 5-3. Source Regions of Arctic Haze (Shaw, 1980).
In addition to the presence of vanadium and manganese, a strong indicator of pollutionis the gray coloration on filters taken from air sampling devices. The color comes fromthe presence of sooty, unburned carbon, an element that most likely originates from manmadecombustion processes. Also, an abundance of sulfates is found in the haze particles overBarrow, Alaska. Presumably, these sulfates come from conversion of sulfur dioxide gas,the major source of which is midlatitude pollution.
5-4

Arctic haze investigators were initially surprised that the Arctic haze made its appearancein winter whereas summer haze is more characteristic of the midlatitudes. The winter-summer contrast is apparently Arctic-wide. Samples from the air at Thule, Greenland,at Spitsbergen, and near Fairbanks in interior Alaska all show pronounced winter maxima.In general, Arctic air can be termed clean in summer but dirty in winter. Four possiblereasons account for the fact that the Arctic haze is most pronounced in winter: (1) increasedwinter emission of pollutants, (2) more rapid and efficient poleward transport, (3) greaterprevalence of strong inversions (greater stability/less mixing) in winter, and (4) longeratmospheric residence times of the haze particles in winter due to the lack of precipitationto scavenge the pollution particles from the air.
5.2 Arctic Plumes
Matson (1986) reported that in a routine search for satellite ice imagery of the SovietArctic, large cold plumes were discovered emanating from Novaya Zemlya Island, U.S.S.R.(74 0N 57 0E). Since then numerous other instances of such plumes have been found.Figure 5-4 is a dramatic example of such plumes. The plume is 95 n mi (175 km) longand originates from the northern part of the island.
Figure 5-4. JR Image of Novaya Zemlya Plume, 12 March 1982 (Matson, 1986).
5-5

Subsequent plumes ranged in length from 95 to 200 n mi (175-375 kin). Gray scaletemperatures suggest the plume-top temperatures are around -76 0F (-60 'C). Maximumplume altitudes appear to be in the 23,000- to 33,000-ft (7-10 km) range.
Of course, the interesting question about these plumes is: What is their origin? In hisarticle Matson speculated on the following: (1) the origin is volcanic, (2) methane gasreleased from coal beds decomposing beneath the sea floor is responsible, and (3) the islandis used for military testing, and the plumes result from huge energy sources.
In no instance, however, was the author able to define the originating mechanism con-clusively. No known volcanoes exist in the area, and it is difficult to find a mechanismthat could lift the methane gas to altitudes as high as the observed plumes. Finally, theenergy required to account for these plumes far exceeds any likely ordnance on NovayaZemlya. (The Soviets have not replied to any of the author's contact efforts.)
A year later, Parmenter-Holt (1987) challenged Matson's hypotheses and suggestedthat the cold plumes were naturally occurring, orographically induced events. She pointedout that Novaya Zemlya Island is a northeast-to-southwest-oriented island. The topographyof the northern portion of the island, where the plumes were observed, is characterizedby a continuous glacial ridge located at the center of the landmass. This glacier rises quicklyfrom sea level to more than 2,500 ft (760 m) as shown in Fig. 5-5. In addition, the northernportion of the island arcs to the northeast, generally perpendicular to the movements ofprevailing winds and weather systems.
Depending on wind strength, static stability, and moisture availability, air flow overan orographic barrier, such as Novaya Zemlya, establishes lee waves. Figure 5-6 illustratesthe atmospheric motions and resulting cloud distribution of the long orographic gravitywave, or arch cloud.
Figure 5-5. Major Features of Novaya Zemlya Island (Parmenter-Holt, 1987).
5-6

Figure 5-6. Air Flow and Mountain Formation (Parmenter-Holt, 1987).
According to Parmenter-Holt, when viewed from above, a point source plume andan orographic cloud may appear similar. This resemblance may be due to the rightcombination of terrain, stability, winds, and moisture. Regarding moisture, the northeastend of Novaya Zemlya often appears ice free because prevailing winds blow the ice awayfrom the coast. The suggestion is that Novaya Zemlya may be a source of both polynya-produced plumes and orographic plumes. Note that orographic plumes are often accompaniedby strong upper level turbulence and mountain waves that can be extremely hazardous toaircraft operations.
Recent satellite imagery shows evidence of plume generation in many areas of the Arctic.Examples include plumes from Wrangel Island, Spitsbergen, Franz Josef Land, EllesmereIsland, Jan Mayen, and even Bear Island. Polynya-produced plumes are generally revealedin IR satellite data as warm plumes radiating at temperatures reflecting the low-level inversionbelow which they form. Stronger inversions act as a lid, preventing further vertical develop-ment. Under weaker inversions, or more unstable conditions, polynya-produced plumesmay break through the inversion or extend to higher altitudes, so that in IR satellite data,the plumes appear as colder, rather than warmer, than the surrounding environment. Insuch instances polynya-produced plumes can be readily confused with plumes generatedas a result of orographic effects. The polynya plumes are generated as cold, dry, low-levelair from over the ice advects over the relatively warm open water of the polynya. Interestingly,plumes generally form when relatively high speed, sinking air is in the vicinity. Thischaracteristic suggests that plumes are also related to the presence of the jet stream; however,more work must be done on this subject before conclusive relationships can be made.Figure 5-7 is an example of a polynya plume.
5-7

tie
-1
'4.
r
K,
*4 ,-.
Figure 5-7. A Polynya Plume.
5-8
V 4'
4 '1�
PI
f
i

5.3 Small Island Wakes
Even the casual observer of satellite imagery will sooner or later come upon distinctivecloud signatures formed in the wake of small islands, especially in the northeast AtlanticOcean. Jan Mayen (east of Greenland/north of Iceland) produces a variety of wake cloudsthat can shed some light on synoptic conditions in the area.
Scorer (1986) chose to present dozens of images of wakes in the lee of Jan Mayen(Chapter 2, Subsection 2.3.10) and discussed the probable synoptic and subsynoptic featuresassociated with them. Jan Mayen is the closest landmass to Greenland and Iceland, a distanceof 270 n mi (500 kin) and 325 n mi (600 km), respectively. The Norwegian Sea is southeastof Jan Mayen, and it remains unfrozen during the winter. By contrast, the Greenland Sea,to the west, is frozen most of the time during winter and frozen within 110 to 160 n mi(200-300 kin) of the coastline of Greenland during the summer.
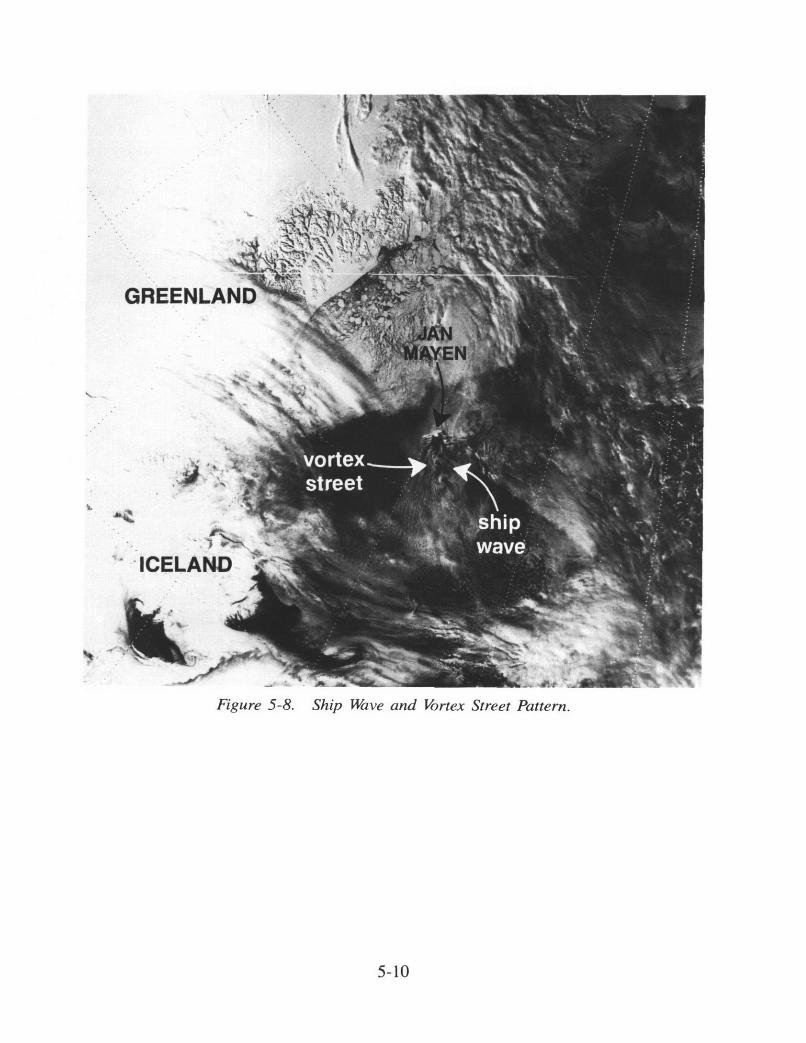
Aside from the orographic plume patterns previously described, two additional flowpatterns are set up by the island: the ship wave pattern and the vortex street. Accordingto Scorer (1986), the ship wave pattern occurs when the air passes over the top of the higherpeak and the flow below is not restricted, by a stable layer, from flowing over the topeverywhere on the island. The vortex streets are produced when a low level, stable layerprevents the flow below from passing over the island so that the flow can only pass aroundthe ends of the island (see Navy Tactical Applications Guide [NTAG] Vol. 1, Sec. 2C).Often the lower peak and ridge line may produce wave clouds while the higher peak producesa vortex street. The wake patterns and vortex streets provide evidence of the direction oflow-level flow and of the existence of a low-level inversion in the area. Figure 5-8 showsboth a ship wave pattern and a vortex street in the wake of Jan Mayen. Figure 5-9 showsanother example of a vortex street in the wake (south) of the Aleutians.
Another isolated island in the Arctic is Bear Island. Lying 130 n mi (240 kin) southof the southern tip of Spitsbergen, Bear Island, on occasion, displays ship wave patternsin its lee wake. Due to the relatively flat topography, Bear Island signatures are rather rare.
5-9
%
Figure 5-8. Ship Wave and Vortex Street Pattern.
5-10

Figure 5-9. Vortex Street.
5-11

5.4 Contrails and Ship Trails
In Europe and in the North Atlantic Ocean, contrails can be seen in satellite imagerymost frequently in the latitude belt between 45 'N and 60 'N. Arguably, three requirementsexist for the formation of contrails: (1) the air must be ice saturated, (2) it must be waterunsaturated, and (3) it must be colder than -40'F (-40'C).
Contrails are often easy to see in the infrared, but are difficult to see in the visiblesatellite imagery except over darker ocean and land areas. They are often perceptible dueto their shadows on layer clouds below, and both the trail and its shadow are visible whenthe area below has an intermediate shade. In Channel 3 (3.53-3.93 Jm) imagery, the trailand its shadow often appear with equal intensity as darker than the scene below. Occasionallythe trails are especially white, an indication that they are composed either of smaller thannormal water drops or of unusually small ice particles, as might be the case if the air wereonly just saturated for ice. Also the possibility exists that with small ice crystals (about5 millimicrons), sufficient forward scattering may occur in this wavelength for the crystalsto appear white when viewed toward the Sun. Figure 5-10 shows contrails over the BeaufortSea in IR DMSP imagery.
Figure 5-10. Satellite Imagery Showing Aircraft Contrails.
5-12
i

Figure 5-11 is included here to facilitate the forecasting of contrails. To use the graphto evaluate potential contrail formation on a Skew T, Log P Diagram, the trace of thetemperature curve on the diagram is related to the "yes" "possible," or "no" sectors ofthe graph. That portion of the temperature curve in the "yes" sector indicates that contrailswill form; in the "no" sector, contrails will not form; and in the "possible" sector, formationwill be determined by the relative humidity at the selected temperature versus pressurelevel. A manual (Air Weather Service, 1960) is available for detailed guidance on contrailforecasting for jet aircraft.
Pressure Pressure Altitude(mb) (1000 ft)
70
65
60
55
50
45
40
35
30
25
20
I5
10
5
07n
Temperature (0 C)
Figure 5-11. Graph of Relative Humidity Required for Jet Aircraft ContrailFormation as a Function of Pressure and Temperature (Fett, 1983).
5-13
2
2
3'
44
5,
6O
7,
8194
ty (%)
70

Ship trails, conversely, form at lower levels and seem to be quite rare at high latitudes.That such trails can be seen on satellite imagery is not surprising when considering thatthese trails form in stable air and extend, relatively undisturbed, over hundreds of miles.Figure 5-12 shows a local view of a ship's trail.
Ship trails are seen in thin stratus over the sea where the cloud has a cellular structureinduced by the loss of heat by radiation from the cloud top. The water vapor and condensationnuclei emitted from the ship rise into the cloud, but no further, inducing a helical circulationwith rising motion in the center of the plume and sinking motion along the edges (see NTAG,Vol. 2, Sec. IC). The broken nature of the cloud reduces the radiative heat loss so thatthe overturning of the mixed layer down to the sea surface is very slow. The trail of airwith more moisture remains visible for many hours. Even so the trail undergoes a wideningthat can be seen clearly. The point of formation of the trail is at the narrow tip, and thewidening is a measure of the horizontal spreading by the internal motion in the layer.
Ship trails are rare, probably because the ship makes a difference to the cloud onlywhen the cloudy air is very clean and deficient in numbers of condensation nuclei.Figure 5-13 shows ship trails in the eastern Pacific.
ACP
wrq
Figure 5-12. Pollution from a Cruise Ship (Benson and Rizzo, 1980).
5-14

Figure 5-13. Ship Trails in the Eastern Pacific.
5-15

5.5 Wind Fields of the Arctic
5.5.1 Mountain Waves
When the wind blows over a relatively narrow mountain ridge (< 60 mi or < 100 kin),air parcels are displaced in the vertical, and, if the atmosphere is stably stratified, theydescend and may oscillate about their equilibrium positions. The gravity waves that result,called mountain waves or lee waves, have been observed in mountainous regions all overthe world.
The presence of mountain waves is frequently revealed by distinctive orographic cloudsthat form in the wave crests. Various types of mountain waves produce the different typesof wave clouds. An identification of a particular type of wave cloud can be used to makesome qualitative deductions about the vertical variation in wind speed and stability overthe mountains.
Large amplitude mountain waves can produce several weather phenomena thatsignificantly affect human activity and, therefore, require the attention of the weather fore-caster. The strong downslope winds observed along the lee slopes of mountain barriersare usually associated with large-amplitude waves. Dangerous regions of clear air turbulenceand sustained, strong downdrafts are also produced by these waves.
Wave induced orographic clouds are often evident in satellite photographs. Wheninterpreting these photographs, however, operational meteorologists tend to assume thatall cloud producing mountain waves propagate horizontally. In fact, vertically propagatingwaves commonly generate clouds as well, and usually the two types of clouds can bedistinguished. Horizontally propagating waves are trapped, due to an inversion, and indicatestable conditions in the area of the clouds. Vertical propagating waves are not trapped byan inversion and are allowed to propagate upward in unstable air. Once the type of wavehas been identified, certain general conclusions can be drawn about the atmosphericconditions in the vicinity of the waves. The two types are clouds from trapped waves andclouds from vertically propagating waves.
Figure 5-14 is an IR NOAA-9 view of the northern Norway coastal region on9 March 1988. Trapped wave clouds are evident stretching for several degrees from south-southwest to north-northeast along the rugged coastal terrain. Just inland from the trappedwave clouds occur a series of vertically propagating wave clouds in the region of TromsO,Norway. An observer at the Earth's surface would view the trapped waves as rows of middleand high clouds.
5-16

Ar
Sr p.I
Figure 5-14. Satellite Imagery of Two Kinds of Lee Waves.
The vertically-propagating wave clouds are layered and stacked vertically. Figure 5-15is a photograph of the wave cloud just west of Tromst, taken from a hotel window lookingwestward within minutes of the satellite view.
The two types of lee waves obviously have very different characteristics. These featuresare summarized in the following paragraphs.
5-17

�#V
I
I
fr 4
Figure 5-15. Observer's View of Vertically Propagating Lee Waves.
Trapped waves can be recognized by (1) multiple wave crests occurring downstreamfrom the initial disturbance and (2) a characteristic wavelength that varies between 6 and13 mi (10-25 kin). Given that the waves are trapped, general conclusions can be drawnabout the state of the atmosphere in their vicinity. In order for mountain waves of any typeto exist, a sufficiently strong wind must be directed across the mountain at the ridge-toplevel. The minimum wind speed required for waves will vary with the size and shape ofthe mountain but seems to lie in the range from 15 to 30 kt (7-15 m/s). Also, usuallya large vertical wind shear will occur, or an increase of wind speed with height, and thepresence of one or more stable layers in the lower troposphere. Moist layers that containthe wave clouds are also apparent in these cases.
Vertically propagating waves have only one wave crest visible, and the horizontalwavelength (though hard to determine) exceeds the width of the wave cloud, which is roughly60 mi (100 kin). As mentioned earlier, the wavelength for trapped waves is much shorter.Given that the waves are vertically propagating, a significant flow across the mountainsshould be expected, but in this case the vertical wind shear may be less pronounced, andthe low level stable layers are weaker than in the trapped wave case.
5-18

Note that topographical differences may exist. For example, a wide mountain rangewill tend to force long waves that can propagate vertically even with small, vertical windshear and weak, stable layers. Conversely, trapped waves indicate stronger vertical shearand stronger stable layers. Figure 5-16 provides a unique opportunity to examine an extremelyinteresting case of a vertically propagating lee wave.
Figure 5-16 Vertical Propagating Lee Wave (Brooks Range).
5-19

At first glance, the clouds on the south side of the Brooks Range appear perhaps tobe associated with southerly flow being orographically lifted and subsequently saturatedon the windward slope. If this were the case, a narrow region of clearing would also beexpected on the lee (north) side of the range. But this case is not simple orographic lifting.
The first clue that the above analysis is faulty appears as a long stretch of jet streamcirrus extending from the North Slope northward toward the pole. Additionally, a vortexis suggested to the northeast just off the North Slope of Alaska. The FNOC surface analysisnear the time of the DMSP data on 30 October 1985 at 0000 GMT (Fig. 5-17) providesadditional information.
Figure 5-17. Surface Chart, 0000 GMT 30 October 1985.
5-20
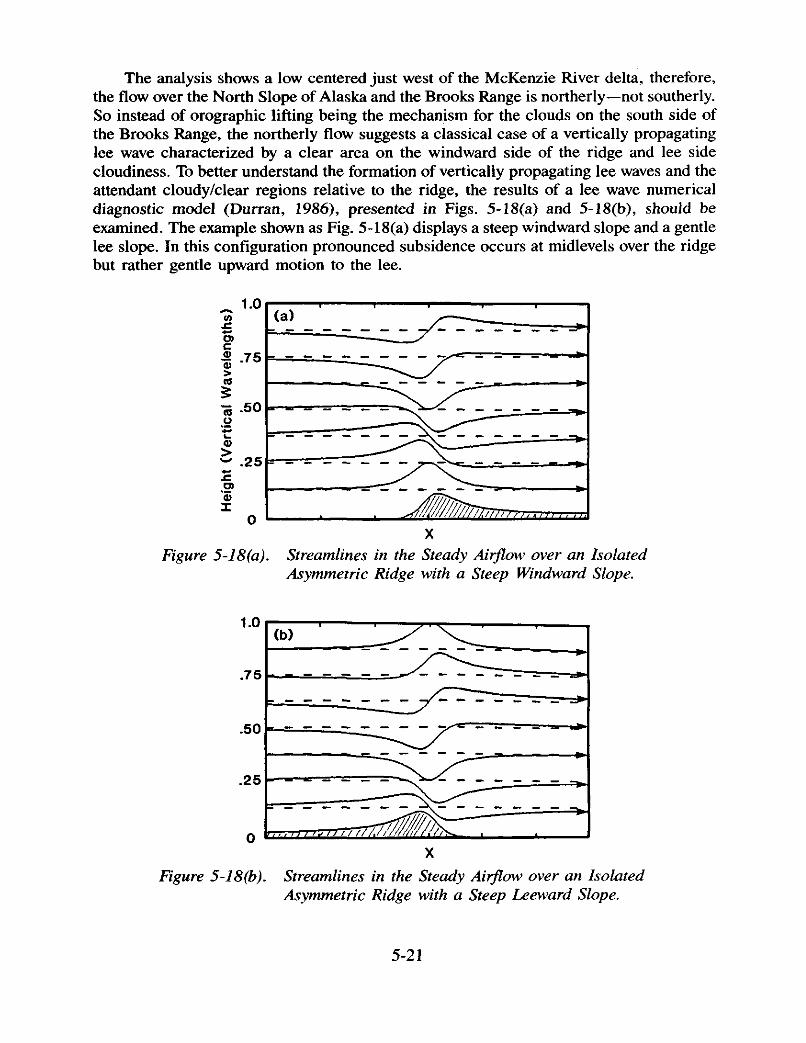
The analysis shows a low centered just west of the McKenzie River delta, therefore,the flow over the North Slope of Alaska and the Brooks Range is northerly-not southerly.So instead of orographic lifting being the mechanism for the clouds on the south side ofthe Brooks Range, the northerly flow suggests a classical case of a vertically propagatinglee wave characterized by a clear area on the windward side of the ridge and lee sidecloudiness. To better understand the formation of vertically propagating lee waves and theattendant cloudy/clear regions relative to the ridge, the results of a lee wave numericaldiagnostic model (Durran, 1986), presented in Figs. 5-18(a) and 5-18(b), should beexamined. The example shown as Fig. 5-18(a) displays a steep windward slope and a gentlelee slope. In this configuration pronounced subsidence occurs at midlevels over the ridgebut rather gentle upward motion to the lee.
4)
4)Tu
1.0
.75
.50
.25
0
Figure 5-18(a).
1.U
.75
.50
.25
A'F
Figure 5-18(b).
XStreamlines in the Steady Airflow over an IsolatedAsymmetric Ridge with a Steep Windward Slope.
XStreamlines in the Steady Airflow over an IsolatedAsymmetric Ridge with a Steep Leeward Slope.
5-21

The Brooks Range, however, has a reverse configuration, with a more gentle slopeon the north side and a very severe slope to the south. Figure 5-18b illustrates the BrooksRange configuration and relates very well to the satellite data (Fig. 5-16) that suggest strongsubsidence down the lee slope, followed by vigorous upward vertical motion to the lee.This pattern of circulation is required to produce the pronounced vertically propagatingwave cloud found south of the Brooks Ridge.
Fortunately, a radiosonde observation is available from Barrow, Alaska on the northcoast, which is the windward side in this case. Figure 5-19 may be typical of the verticalstructure on the windward side of a mountain producing a vertically propagating lee wave.Its main features are (1) a deep, moist layer from just above the ground to 450 mb, (2) astrong, low-level inversion between 900 and 950 mb, and (3) strong, vertical wind shearfrom the surface (20 kt) to 400 mb (75 kt).
-105 100 -95 -90 -85 -80 -75 -70 -65 -60 -M5 -1o
5-22
Figure 5-19. Sounding for Barrow, Alaska, 0000 GMT 30 October 1985.

The following guidelines should be helpful in forecasting the conditions in which stronglee waves will develop:
1. The mountain barrier in question has a steep lee slope. Asymmetric mountainswith steep leeward and gentle windward slopes are the most effective generatorsof large amplitude mountain waves.
2. The wind is directed across the mountain (roughly within 30 degrees of beingperpendicular to the ridge line) throughout a deep layer of the troposphere. Thewind speed at the level of the crest should exceed a terrain-dependent value of15 to 30 kt (7-15 m/s) and should increase with height.
3. The upstream temperature profile exhibits an inversion or a layer of strong stabilitynear mountain-top height, with weaker stability at higher levels. Weak, low-levelstability also favors development of waves in the lee of the mountain.
4. If strong waves of any type are forecast, clear air turbulence and downslope windsare likely to develop as well.
5.5.2 Drainage or Slope Winds
Drainage and slope winds are usually diurnal in nature and arise from the daily cycleof local solar heating in the daytime and long wave radiational cooling at night. Considerthe left-hand side of Fig. 5-20, which represents the daytime situation.
During the day the south slopes of hills receive abundant short wave solar heating.By contrast, a point at the same elevation above the valley will be relatively cool duringthe day because of the lack of an effective absorbing medium. This thermal gradient inthe horizontal requires, by the thickness equation, that pressure surfaces in the warm airbe separated further than the pressure surfaces in the cooler air. This condition will giverise to the configuration of isobars as shown in the figure on the left. Thus, on the levelsurface (A to A') a pressure gradient is set up that will accelerate air parcels at this level
Figure 5-20. Slope Wind Schematic.
5-23

from a point over the hill to a point over the valley. Continuity then requires that theconverging air over the valley will sink and spread out near the surface in such a way asto set a direct thermal circulation in the hill-valley system. A direct thermal circulationis one in which cold air sinks and warm air rises. An indirect circulation prevails whenwarm air sinks and cold air rises. This latter situation normally arises from some dynamicforcing of the wind and temperature fields, such as in the vicinity of jet cores. Duringthe day the flow will be up the hill and subsidence will occur in the valley. These conditionscould, in the presence of sufficient moisture, induce cloud formation at the top of the ridgeand clearing in the valley. Note that the pressure surfaces at low elevations in the figuredictate gradient flow from the valley to the ridge slope.
In the evening the slopes of the hill will cool rapidly as long wave radiational coolingtakes place over the previously heated ground. At corresponding elevations over the valley,the infrared cooling is much less because the air there is a poor radiator compared to theland on the side of the hill.
As a result of the reversal of the horizontal temperature gradient, the pressure surfaceat night must conform to the pattern shown on the right side of Fig. 5-20. This patternreverses the direction of the thermal circulation such that, at night, air sinks down intothe valley. The circulation is still a direct thermal circulation, but it is reversed from nightto day because of the heating/cooling reversal.
At the base of Parry Peninsula in Canada's Northwest Territories, west of the villageof Paulatak, a drop of about 600 ft (182 m) occurs over a distance of 10 mi (21 kim)(Fig. 5-2 1). The interior drainage, as indicated by the rivers, is toward the north-northwest.To the east and west higher terrain, up to 1,500 ft (457 in), occurs so that a broad passis centered roughly at the base of Parry Peninsula. Darnley Bay and Franklin Bay on eitherside of the peninsula remain ice free well into December. For this reason, a strongtemperature gradient often occurs through the pass and down the slope. Infrequently,southerly flow develops, and the winds down the slope may reach velocities of hurricaneforce (64 kt plus). Due to lulls that occur, these winds are locally referred to as "pumpingwinds."
Slope winds also occur in the eastern foothills area of Alberta. The Rockies lienorthwest-southeast. With a flow of stable air from the north or north-northeast, the windstend to be very strong along and just windward of the foothills. From old reports of damageto buildings, speeds over 100 kt (50 m/s) must have occurred occasionally. Another goodexample is Resolute, which is on the south side of Cornwallis Island. Although winds over50 kt (26 m/s) are usually from the north-northeast to east-northeast, winds of 35 kt (18 m/s)are frequent when the flow is from the southeast or south-southeast, with an onshore orupslope component.
5.5.3 Glacier Winds
Although glacier winds are related to slope winds, the presence of an ice surface changesthe physics by adding another factor: the ice surface cannot be warmer than 32 0F (0 0C).Also, glaciers begin at high elevations and have slopes that are usually flat at the sourcebut increase downward. A shallow downdraft along the icy surface of the glacier continuesall day, therefore, regardless of insolation. Its thermal cause is the continuously present
5-24
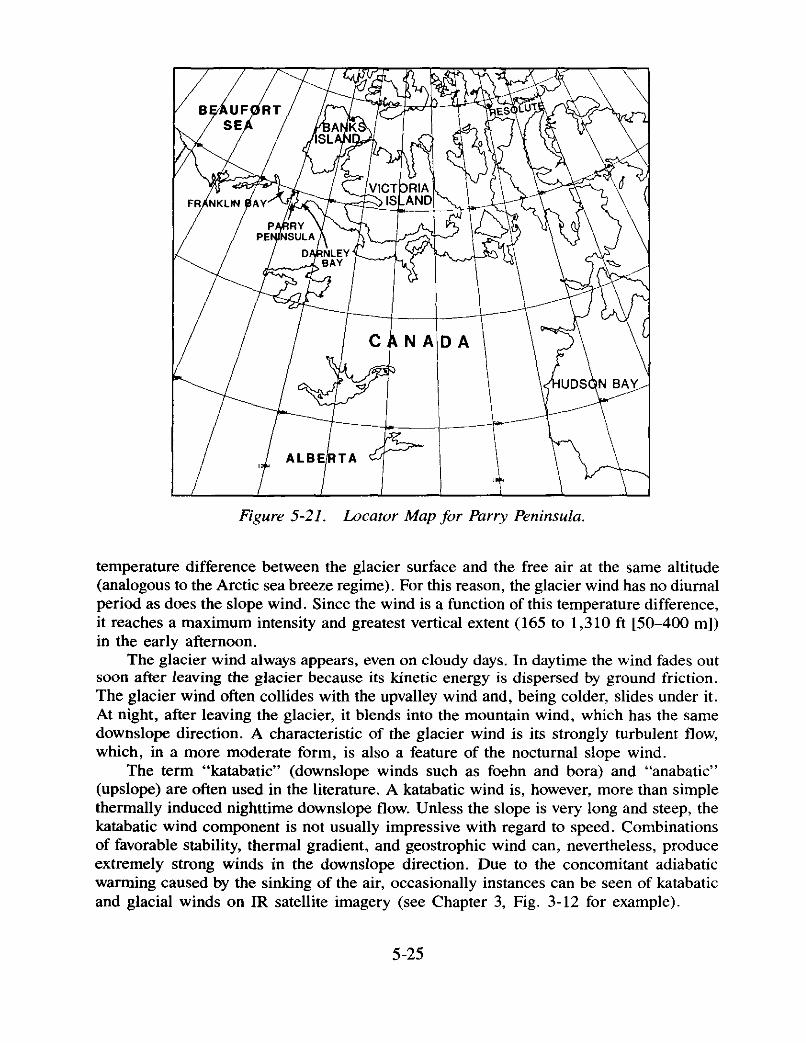
Figure 5-21. Locator Map for Parry Peninsula.
temperature difference between the glacier surface and the free air at the same altitude(analogous to the Arctic sea breeze regime). For this reason, the glacier wind has no diurnalperiod as does the slope wind. Since the wind is a function of this temperature difference,it reaches a maximum intensity and greatest vertical extent (165 to 1,310 ft [50-400 m])in the early afternoon.
The glacier wind always appears, even on cloudy days. In daytime the wind fades outsoon after leaving the glacier because its kinetic energy is dispersed by ground friction.The glacier wind often collides with the upvalley wind and, being colder, slides under it.At night, after leaving the glacier, it blends into the mountain wind, which has the samedownslope direction. A characteristic of the glacier wind is its strongly turbulent flow,which, in a more moderate form, is also a feature of the nocturnal slope wind.
The term "katabatic" (downslope winds such as foehn and bora) and "anabatic"(upslope) are often used in the literature. A katabatic wind is, however, more than simplethermally induced nighttime downslope flow. Unless the slope is very long and steep, thekatabatic wind component is not usually impressive with regard to speed. Combinationsof favorable stability, thermal gradient, and geostrophic wind can, nevertheless, produceextremely strong winds in the downslope direction. Due to the concomitant adiabaticwarming caused by the sinking of the air, occasionally instances can be seen of katabaticand glacial winds on IR satellite imagery (see Chapter 3, Fig. 3-12 for example).
5-25

5.6 Fog Near Marginal Ice Zones
The Marginal Ice Zones (MIZ) of the Arctic are defined by Kozo and Diachok (1973) as"the active part of the ice canopy between the ice edge and the point where consolidated multiyearice predominates?' They are regions of strong horizontal temperature and moisture gradients and,therefore, areas where fog formation often occurs.
Fog is reported, under World Meteorological Organization (WMO) guidelines, when thehorizontal visibility is reduced to 1 km or less (except for present weather code 10, which is usedfor visibilities over 1 km). Ships and aircraft operating near the edge of the MIZ are subject toicing and severely reduced visibility under conditions of off-ice flow. Since fog often consists ofsupercooled water drops, impact with superstructures can cause instantaneous formation of rime ice.
Guest (1989) experienced a variety of fog and icing conditions during his work aboard shipsrecording observations during the MIZEX in 1984, 1987, and 1988. He noted, in particular, variouscauses of fog near the MIZ. First, radiation fog tends to form during long wave radiational coolingin the absence of clouds. Second, advection fog forms when warm, moist air flows from the seato the ice surface and is cooled by the air over the ice.
Guest described another fog type known as stratus-lowering fog. This type occurs when astratus deck lowers to the surface, normally happening when the top of the stratus cools to suchan extent that it is colder than the underlying air, a thermally unstable situation. This instability
then results in mixing, which extends the cooling to the surface, and produces fog, and usuallyoccurs also during sea-to-ice winds. Another mechanism producing fog in the vicinity of the MIZis precipitation into a lower, dryer layer that then becomes saturated to the point where "rain fog"or scud (stratus fractus) forms.
Finally, fog can be expected to form over leads and polynyi in winter when a sort of steamfog forms as cold, dry air moves over the warmer, moisture source in the lead or polynya. Figure 5-22is a NOAA satellite image of low stratus or fog along an ice edge. The stratus, or fog, appearsdarker in the infrared than the surface snow cover because the top of the stratus, or fog layer,is near the top of an inversion with temperatures higher than the surface.
Fog formation is frequent in areas of the Arctic away from the MIZ. Fog is frequently observedaround the periphery of high pressure centers and in the ridges emanating from the centers, especiallyin regions of "wet" ice or other moist areas. Fog is not often found in the center of Arctic highsbecause subsidence there is strong enough to overcome fog formation.
Another place to look for Arctic fog is along coasts, wherever an onshore component of thewind occurs. This is a form of upslope fog.
5-26

Figure 5-22. iR Satellite Imagery of Fog near the MIZ.
5-27
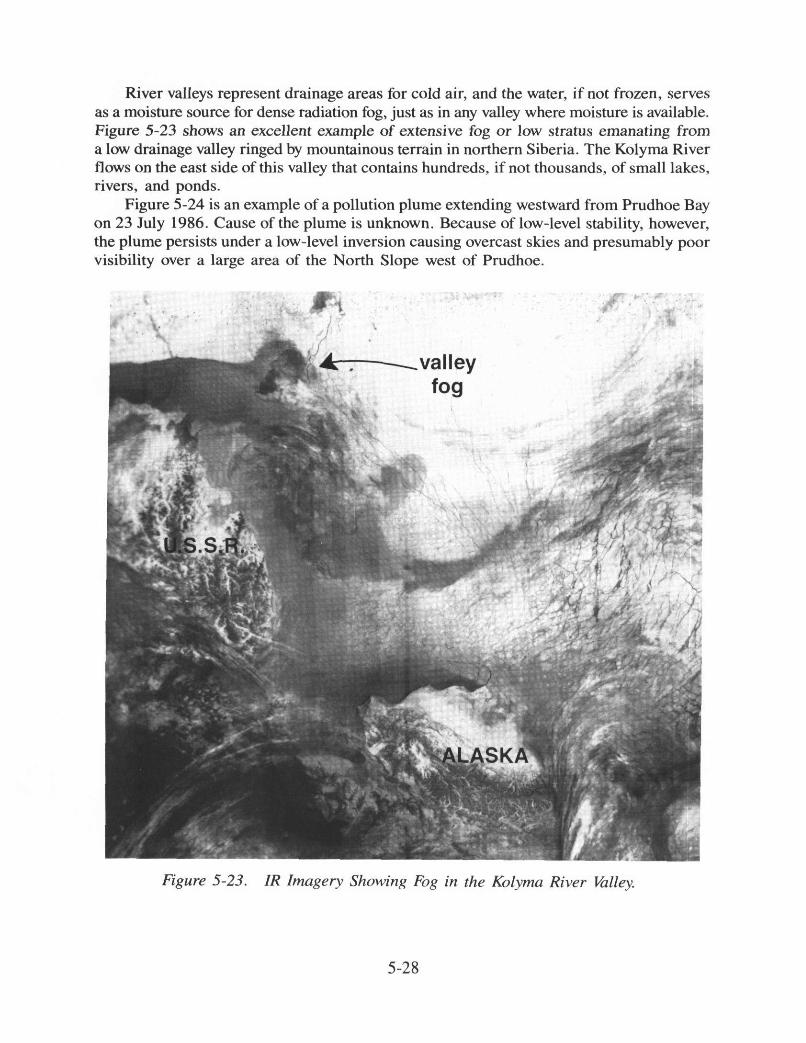
River valleys represent drainage areas for cold air, and the water, if not frozen, servesas a moisture source for dense radiation fog, just as in any valley where moisture is available.Figure 5-23 shows an excellent example of extensive fog or low stratus emanating froma low drainage valley ringed by mountainous terrain in northern Siberia. The Kolyma Riverflows on the east side of this valley that contains hundreds, if not thousands, of small lakes,rivers, and ponds.
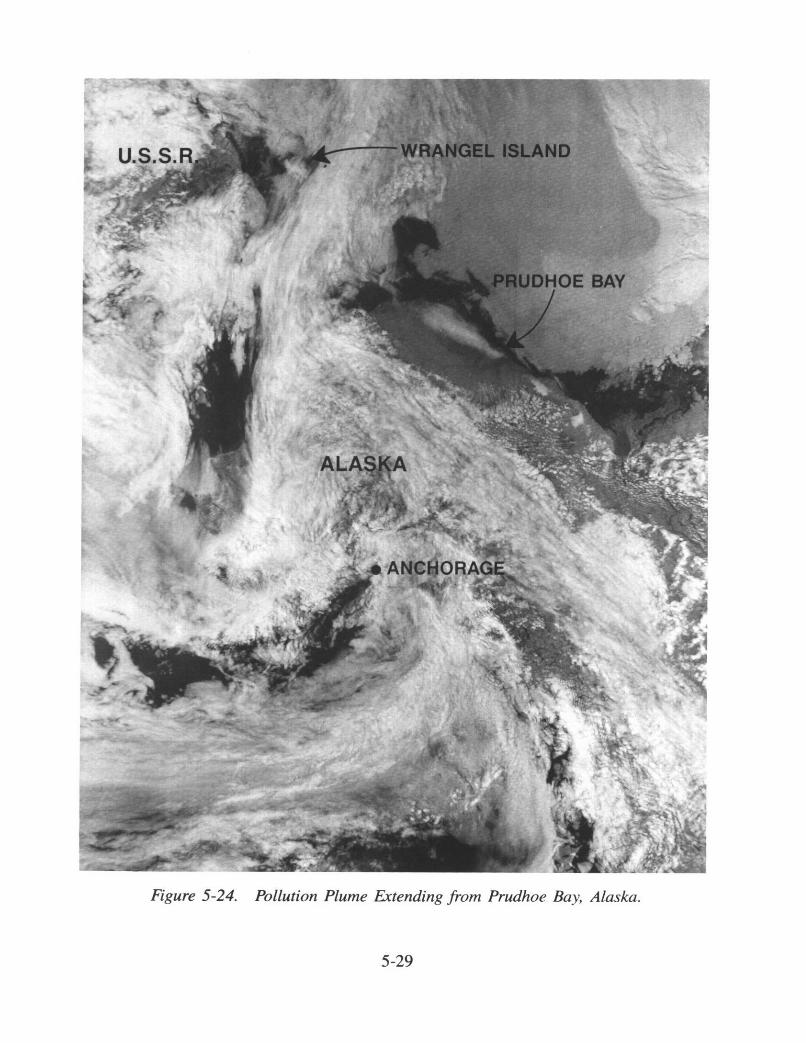
Figure 5-24 is an example of a pollution plume extending westward from Prudhoe Bayon 23 July 1986. Cause of the plume is unknown. Because of low-level stability, however,the plume persists under a low-level inversion causing overcast skies and presumably poorvisibility over a large area of the North Slope west of Prudhoe.
ON
SfvalleyS~fog
Figure 5-23. IR Imagery Showing Fog in the Kolyma River Valley.
5-28
C
9- V
I'. �fl
1i. 4 A�
-V A
Irt�a
11
a
Figure 5-24. Pollution Plume Extending from Prudhoe Bay, Alaska.
5-29
US.

A typical example of fog and/or low stratus banked up against the North Slope coastis shown in Fig. 5-25, an IR DMSP view of the region on 17 June 1985. All of the NorthSlope coastal stations were reporting overcast skies in low stratus or fog at the time ofthese data. Barter Island's visibility was reduced to 2 mi in the fog. Some of the overcasthad spread inland in the region just east of Barrow.
In addition, cases are known where fog will occur in the vicinity of low pressure systemspositioned partially over the ice and partially over open water. Normally a strong surface-based inversion exists over the ice. On the west side of the low, as the air moves fromthe ice in northerly flow over the water, the heat and moisture fluxes from the water willinitially erode the inversion only slightly. Steam fog results, and it spreads out under theinversion that gradually rises to the south. After about 60 to 120 n mi (100-200 km) thefog will dissipate and cloud streets develop, reflecting the effect of cold air flowing overwarm water. This fog is often noted when drift ice is present, as opposed to consolidatedpack ice. Steam fog also occurs over polynyi and leads when air moves from over the iceto over the moisture source.
5.7 Boundary Layer Fronts
Satellite imagery revealed an especially significant boundary layer frontal type in theFram Strait during MIZEX in 1984 and 1987. The front is formed as relatively strongflow, normally from the east or northeast, comes off the ice pack and over the open water.Winds turn strongly anticyclonically as they approach the front. An enhanced cloud bandappears, which represents the leading edge of the boundary layer front. A streamline analysisof the wind field associated with a boundary layer front takes on the appearance of an invertedtrough-much like an easterly wave, Another example of a boundary layer front in the BeringSea appears in Fig. 5-26. Often a band of convective cumulus development occurs in thevicinity of the boundary layer front. In any case it has a distinctive signature in satelliteimagery, as can be noted in Fig. 5-26.
Shapiro et al. (1987) contributed an exhaustive study of one of the 1984 cases throughthe use of extensive observations made by aircraft flying in the vicinity of Spitsbergen.Schultz (1987) described a boundary layer front that occurred during the 1987 MIZEXperiod. In both cases, the boundary layer front was associated with the outbreak of coldArctic air advected southward by north winds east of Svalbard. A major difference betweenthe findings of Shapiro and Schultz was the location of the higher inversion layer. In theShapiro case study, the boundary layer inversion was higher over the west side of the front.In the Schultz study, the boundary layer front was observed to propagate across theFram Strait from east to west, while in Shapiro's study it was a stationary ice-edge front.Also among the differences was the lack of a low-level wind maximum in the Schultz case.The Shapiro study, by contrast, shows a low-level jet at 870 mb with speeds up to 60 kt(30 m/s).
5-30

It€
,- a -
�t7aSi,
VV
t
At
2
t
F)
Figure 5-25. North Slope Fog.
5-31
S
isr- I IN

'K
N
N
I
4.
boun
4 front
N4
Figure 5-26 IR Imagery of a Boundary Layer Front.
5-32
�14

Fett (1990(b)) observed that wind speeds were higher in the southeasterly flow eastof the front and lighter in the northerly flow west of the April 1987 front. This wind patternmaximizes the cyclonic vorticity at the frontal boundary, which is favorable for vortexdevelopment. Fett also links development of the infamous polar lows of the Arctic withthe boundary layer fronts. Chapter 6 is devoted entirely to descriptions of the structureand evolution of polar lows in the Arctic.
5.8 Turbulence
Turbulence has been the subject of many publications, and any attempt to present sucha wealth of knowledge in this section is unrealistic. For indepth information on turbulencesome good references are Ellrod, 1985; Ellrod, 1989; and Lee et al., 1979. A brief summaryon turbulence follows.
Satellite imagery gives some signs of telltale cloud patterns in areas where turbulenceshould be expected.
1 . Turbulence of some degree can be expected near any convective activity. Severeturbulence can occur in the enhanced cumulus pattern near vorticity centers orin the dry tongue.
2. Turbulence occurs near jet streams (Fig. 5-27). Around the polar jet, turbulencecan be expected in the upper two-thirds of the cirrus shield. Clear air turbulencenear jet streams is encountered in three areas where wind shear is strongest: justnorth of the jet axis, near the tropopause and level of maximum winds, andelsewhere in regions close to the tropopause or level of maximum winds. Typically,clear air turbulence will occur where the vertical wind shear is in excess of8 kt per 1000 ft (4 m/s per 300 m). The term "clear air turbulence" may bemisleading. Although the majority (75 percent) of wind shear turbulence occursin clear air, it will also occur in cloudy areas that contain shear.
3. Mountain wave turbulence is indicated by lee-side rotor or lenticular clouds wheremountain wave activity is indicated (see Fig. 5-16).
5-33
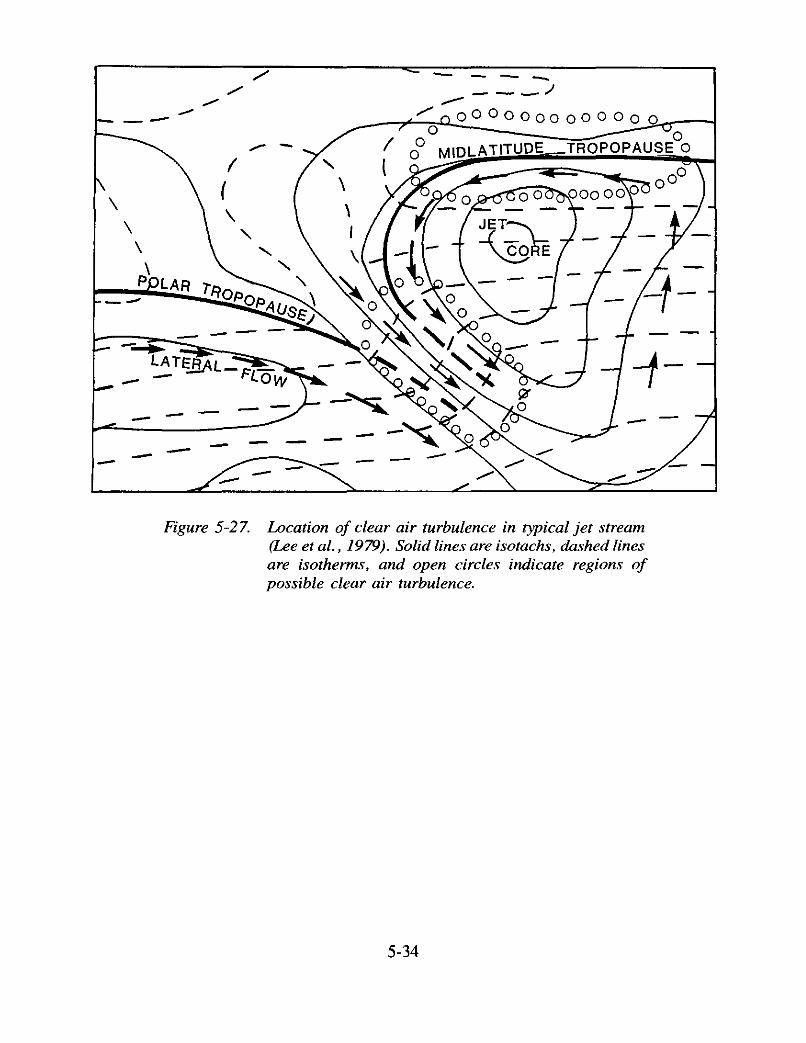
Figure 5-2 7. Location of clear air turbulence in typical jet stream(Lee et al., 1979). Solid lines are isotachs, dashed linesare isotherms, and open circles indicate regions ofpossible clear air turbulence.
5-34