validation of significant weather features and processes ... colle_pi_meeting_2016.pdf ·...
TRANSCRIPT
Validation of Significant Weather
Features and Processes in
Operational Models Using a Cyclone Relative Approach
Brian A. Colle and Edmund Chang
School of Marine and Atmospheric Sciences, Stony Brook University, Stony Brook, NY
Partners:
NCAR and Developmental Testbed Center,
Environmental Modeling Center, Weather Prediction Center, Ocean
Prediction Center, and Aviation Weather Center)
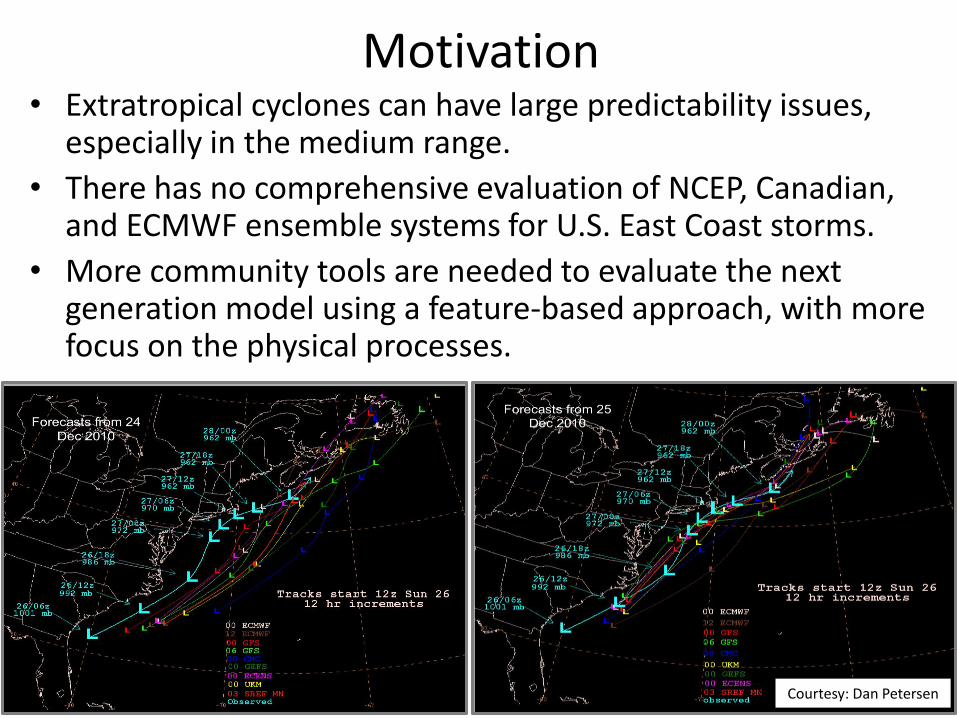
Motivation
• Extratropical cyclones can have large predictability issues, especially in the medium range.
• There has no comprehensive evaluation of NCEP, Canadian, and ECMWF ensemble systems for U.S. East Coast storms.
• More community tools are needed to evaluate the next generation model using a feature-based approach, with more focus on the physical processes.
Courtesy: Dan Petersen

Project Goals • Cyclone tracking, matching, and verification. Compare
GEFS, CMC, and EC for days 0-7.
• Use cyclone relative approach to investigate some of the relevant processes associated with various cyclone biases (moisture, precipitation, surface fluxes, stability, etc…).
• Develop Cyclone-relative verification and diagnostic software within NCAR MET (Model Evaluation Tools).
• Port the cyclone-relative software in MET to our Operational Center partners and iterate on parameters relevant to operations and Testbeds (e.g., WPC Winter Weather Experiment).

Extratropical Cyclone Data/Tracking • TIGGE: THORPEX Interactive Grand Global Ensemble (Oct-March 2007-2015)
• 20 member NCEP - GEFS: Global Ensemble Forecast System • 50 member ECMWF: European Center for Medium-Range Weather Forecasts • 20 member CMC: Canadian Meteorological Center Ensemble • Control Members are included for statistical comparison
*** Most ensemble mean results are calculated using the errors from each of the ensemble members ***
• Track and match ensemble, control, and reanalysis cyclones using Hodges (1995) surface cyclone tracking scheme – ECMWF ERA-Interim Re-Analysis is used to verify cyclone properties from October to March – All MSLP data is 1˚ x 1˚ resolution – Data is filtered to remove planetary scale effects (small wavenumber) and small scale effects (large wavenumber) – Cyclone tracking conditions: 24 h lifetime and 1000 km distance traveled (Colle et al. 2013) – The pairing distance d of a point in an individual forecast track to a point in the analysis track, which coincides in
time with the analysis track, is < dmax = 1500 km. –> modified (Froude et al. 2007). – At least 60% of the points in the forecast track coincided in time with the analysis track and satisfied d ≤ dmax.
Preprocess Data:
Bandpass Filter
Hodges Cyclone Tracking
Calculate Cyclone Intensity
Cyclone Verification/ Matching Process
Displacement/Intensity Error Calculations
Mean Error Calculations
Subset Tracks For Active Cyclone Regions
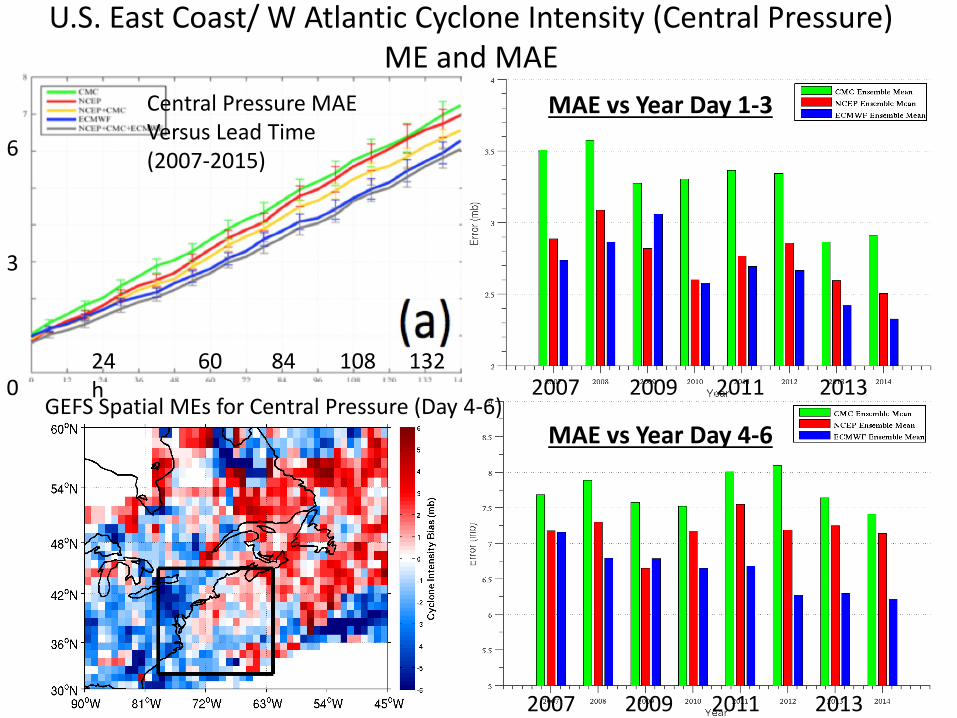
U.S. East Coast/ W Atlantic Cyclone Intensity (Central Pressure) ME and MAE
MAE vs Year Day 1-3
MAE vs Year Day 4-6
Central Pressure MAE Versus Lead Time (2007-2015)
GEFS Spatial MEs for Central Pressure (Day 4-6)
6
3
0 24 60 84 108 132 h 2007 2009 2011 2013
2007 2009 2011 2013
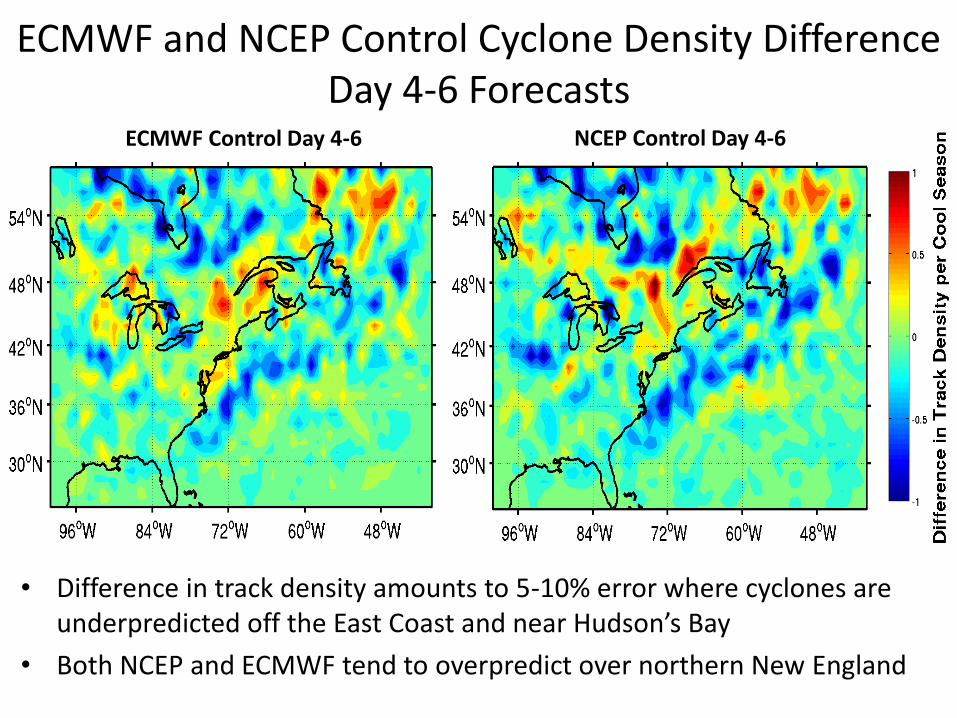
ECMWF and NCEP Control Cyclone Density Difference Day 4-6 Forecasts
• Difference in track density amounts to 5-10% error where cyclones are underpredicted off the East Coast and near Hudson’s Bay
• Both NCEP and ECMWF tend to overpredict over northern New England
ECMWF Control Day 4-6 NCEP Control Day 4-6
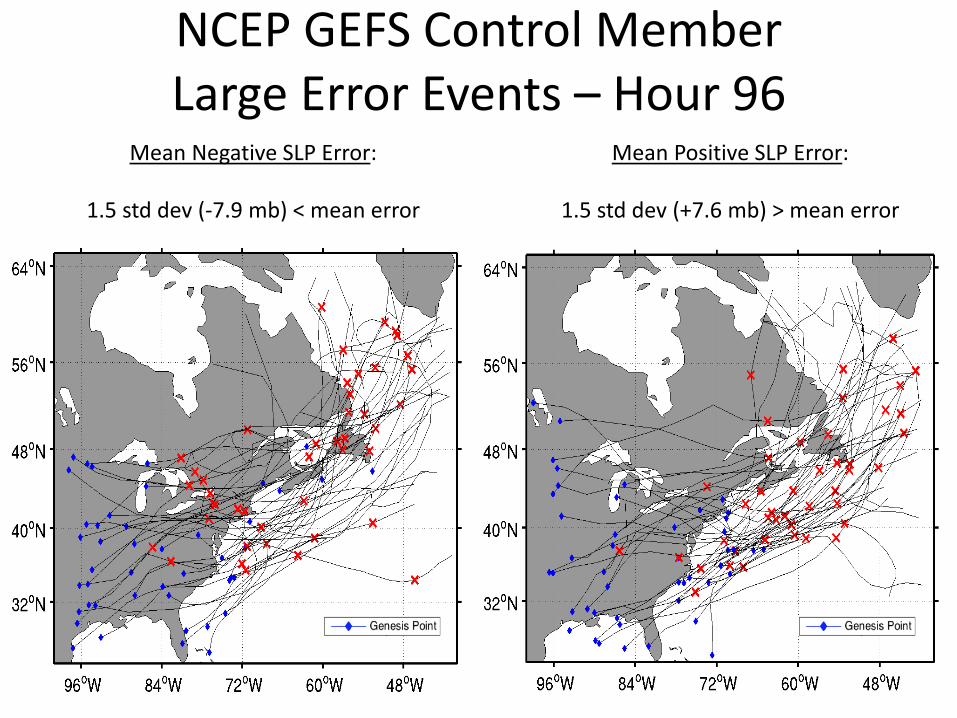
NCEP GEFS Control Member Large Error Events – Hour 96
Mean Positive SLP Error:
1.5 std dev (+7.6 mb) > mean error
Mean Negative SLP Error:
1.5 std dev (-7.9 mb) < mean error
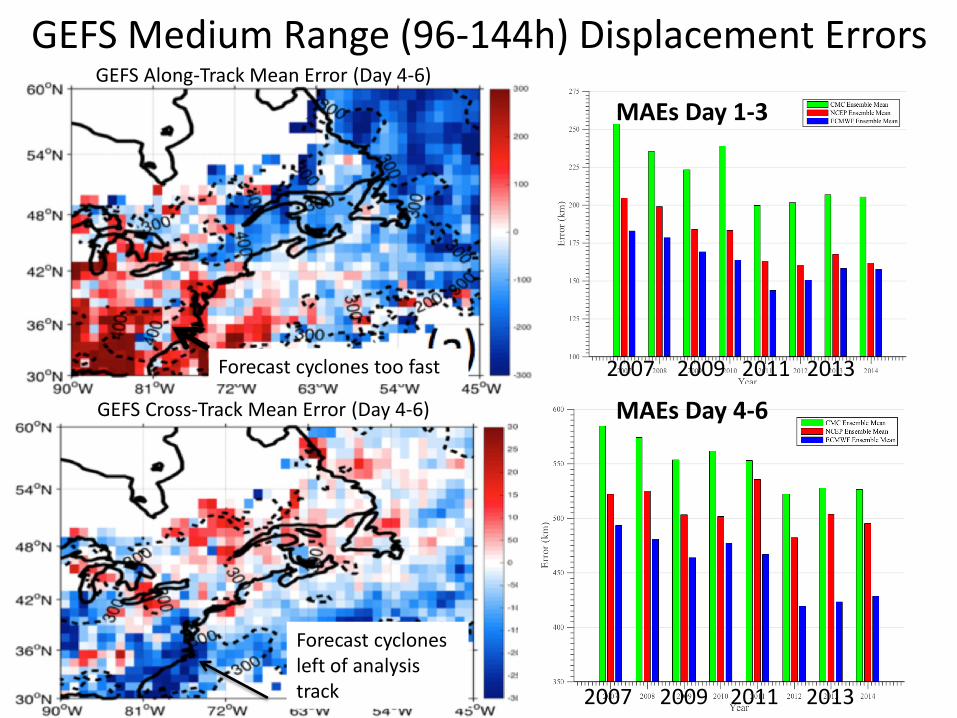
GEFS Medium Range (96-144h) Displacement Errors
MAEs Day 1-3
MAEs Day 4-6
Forecast cyclones too fast
Forecast cyclones left of analysis track
GEFS Along-Track Mean Error (Day 4-6)
GEFS Cross-Track Mean Error (Day 4-6)
2007 2009 2011 2013
2007 2009 2011 2013
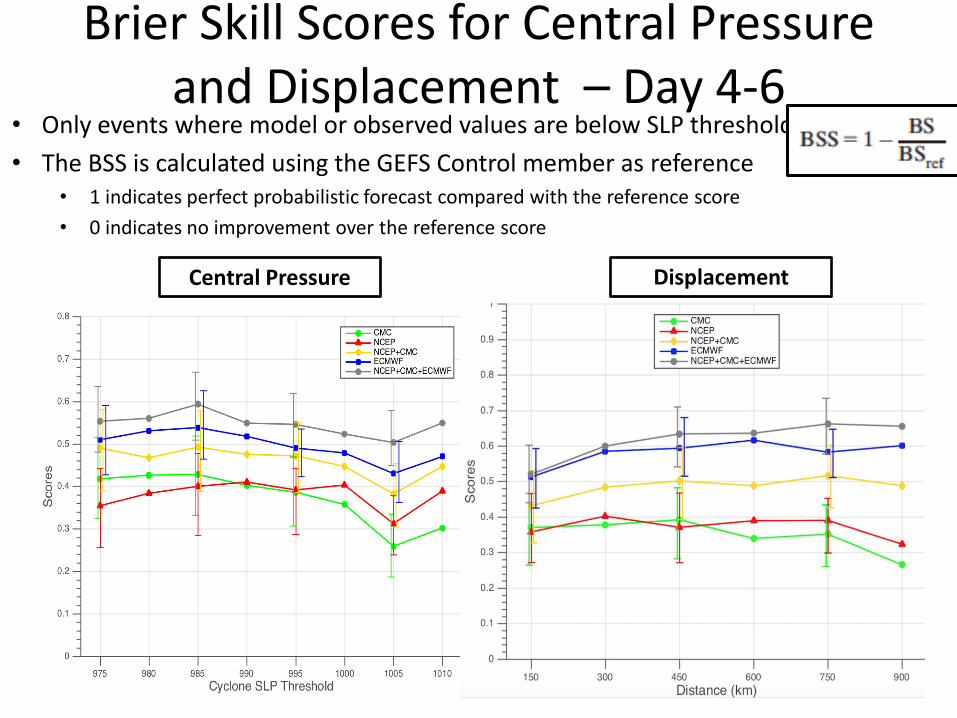
Brier Skill Scores for Central Pressure and Displacement – Day 4-6
• Only events where model or observed values are below SLP threshold
• The BSS is calculated using the GEFS Control member as reference • 1 indicates perfect probabilistic forecast compared with the reference score
• 0 indicates no improvement over the reference score
Central Pressure Displacement

Cyclone Relative Approach –Stony Brook Univ. Software
Hour 54-72 Hour 78-96 Hour 102-120
GEFS Control+7.5 hPa Bias 60 storms
GEFS Control -7.5 hPa Bias 52 storms`
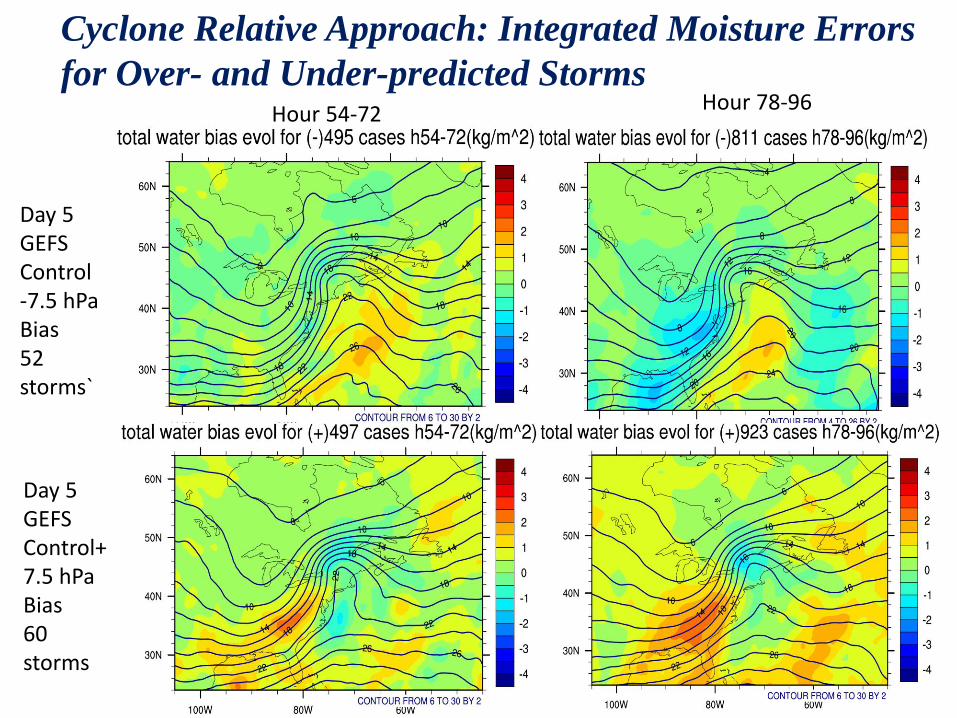
Cyclone Relative Approach: Integrated Moisture Errors
for Over- and Under-predicted Storms Hour 54-72 Hour 78-96
Day 5 GEFS Control+7.5 hPa Bias 60 storms
Day 5 GEFS Control -7.5 hPa Bias 52 storms`
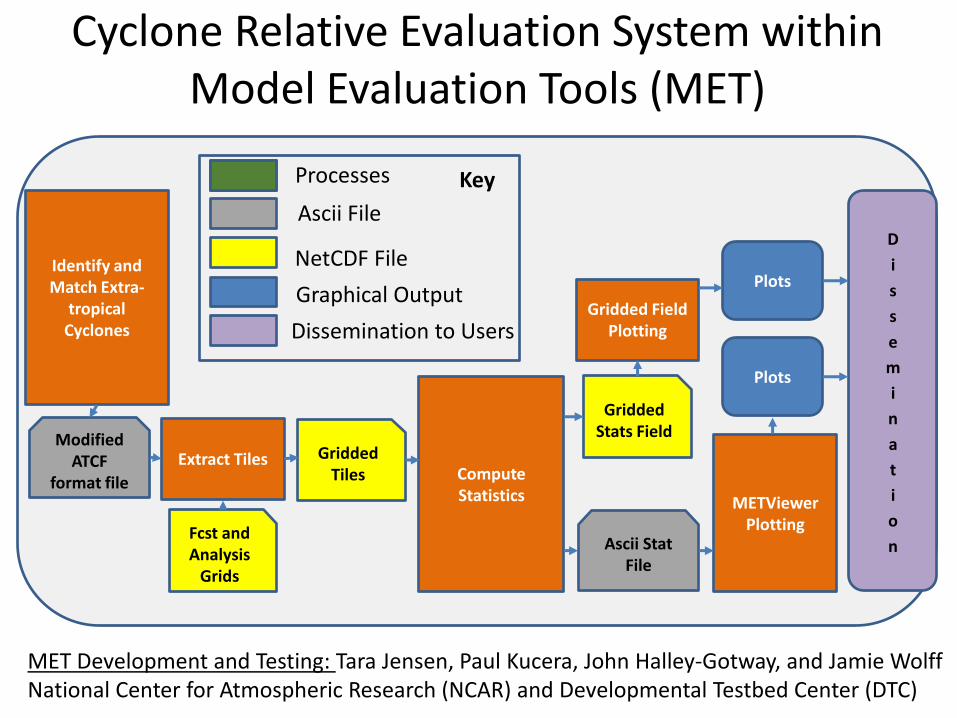
Cyclone Relative Evaluation System within Model Evaluation Tools (MET)
Identify and Match Extra-
tropical Cyclones
Extract Tiles Compute Statistics
Gridded Field Plotting
METViewer Plotting
Plots
Plots
Gridded Tiles
Modified ATCF
format file
Gridded Stats Field
Ascii Stat File
D
i
s
s
e
m
i
n
a
t
i
o
n
Fcst and Analysis
Grids
Processes
Ascii File
NetCDF File
Graphical Output
Dissemination to Users
Key
MET Development and Testing: Tara Jensen, Paul Kucera, John Halley-Gotway, and Jamie Wolff National Center for Atmospheric Research (NCAR) and Developmental Testbed Center (DTC)

Cyclone Relative Evaluation System
Identify and Match Extra-
tropical Cyclones
Extract Tiles Compute Statistics
Gridded Field Plotting
METViewer Plotting
Plots
Plots
Tiles
Modified ATCF
format file
Gridded Stats Field
Ascii Stat File
D
i
s
s
e
m
i
n
a
t
i
o
n
Fcst and Analysis
Grids
• Operational evaluation performed by Guang Ping Lou on GFS and GEFS mean
• Tracking performed using legacy (2009) GFDL Tracker with modifications to use pertinent variables to extra-tropical cyclone
• Tracks placed in a database • Matching between forecast and analysis
tracks performed monthly • Matched tracks written out to a modified
ATCF (format used by NHC) file format
Cyclone Relative Evaluation System
Identify and Match Extra-
tropical Cyclones
Extract Tiles Compute Statistics
Gridded Field Plotting
METViewer Plotting
Plots
Plots
Tiles
Modified ATCF
format file
Gridded Stats Field
Ascii Stat File
D
i
s
s
e
m
i
n
a
t
i
o
n
Fcst and Analysis
Grids
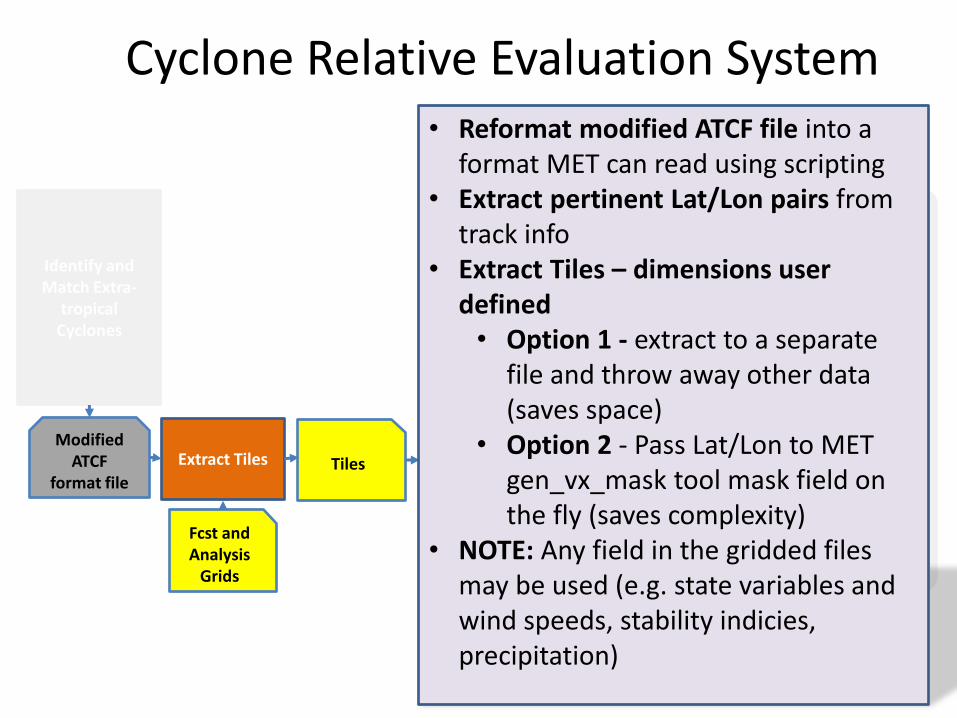
• Reformat modified ATCF file into a format MET can read using scripting
• Extract pertinent Lat/Lon pairs from track info
• Extract Tiles – dimensions user defined • Option 1 - extract to a separate
file and throw away other data (saves space)
• Option 2 - Pass Lat/Lon to MET gen_vx_mask tool mask field on the fly (saves complexity)
• NOTE: Any field in the gridded files may be used (e.g. state variables and wind speeds, stability indicies, precipitation)
Cyclone Relative Evaluation System
Identify and Match Extra-
tropical Cyclones
Extract Tiles
Gridded Field Plotting
METViewer Plotting
Plots
Plots
Tiles
Modified ATCF
format file
Gridded Stats Field
Ascii Stat File
D
i
s
s
e
m
i
n
a
t
i
o
n
Fcst and Analysis
Grids
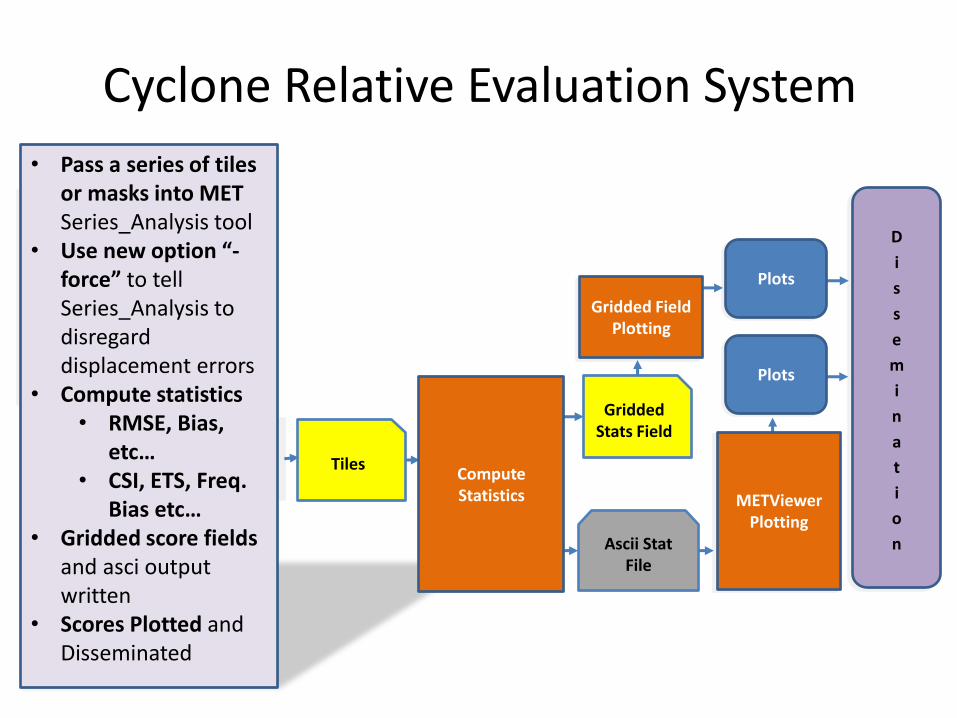
• Pass a series of tiles or masks into MET Series_Analysis tool
• Use new option “-force” to tell Series_Analysis to disregard displacement errors
• Compute statistics • RMSE, Bias,
etc… • CSI, ETS, Freq.
Bias etc… • Gridded score fields
and asci output written
• Scores Plotted and Disseminated
Compute Statistics
Gridded Field Plotting
METViewer Plotting
Plots
Plots
D
i
s
s
e
m
i
n
a
t
i
o
n
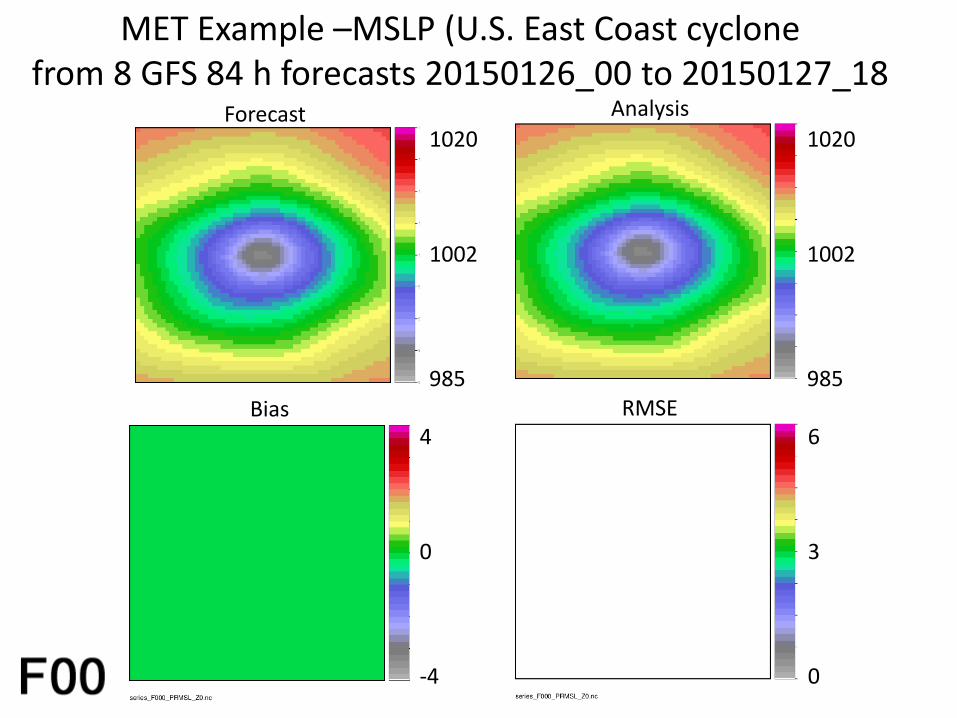
MET Example –MSLP (U.S. East Coast cyclone from 8 GFS 84 h forecasts 20150126_00 to 20150127_18
Analysis Forecast
RMSE
1020
1002
985
Bias
1020
1002
985
4
0
-4
6
3
0
Cyclone Relative Evaluation System
Identify and Match Extra-
tropical Cyclones
Extract Tiles Compute Statistics
Gridded Field Plotting
METViewer Plotting
Plots
Plots
Tiles
Modified ATCF
format file
Gridded Stats Field
Ascii Stat File
D
i
s
s
e
m
i
n
a
t
i
o
n
Fcst and Analysis
Grids
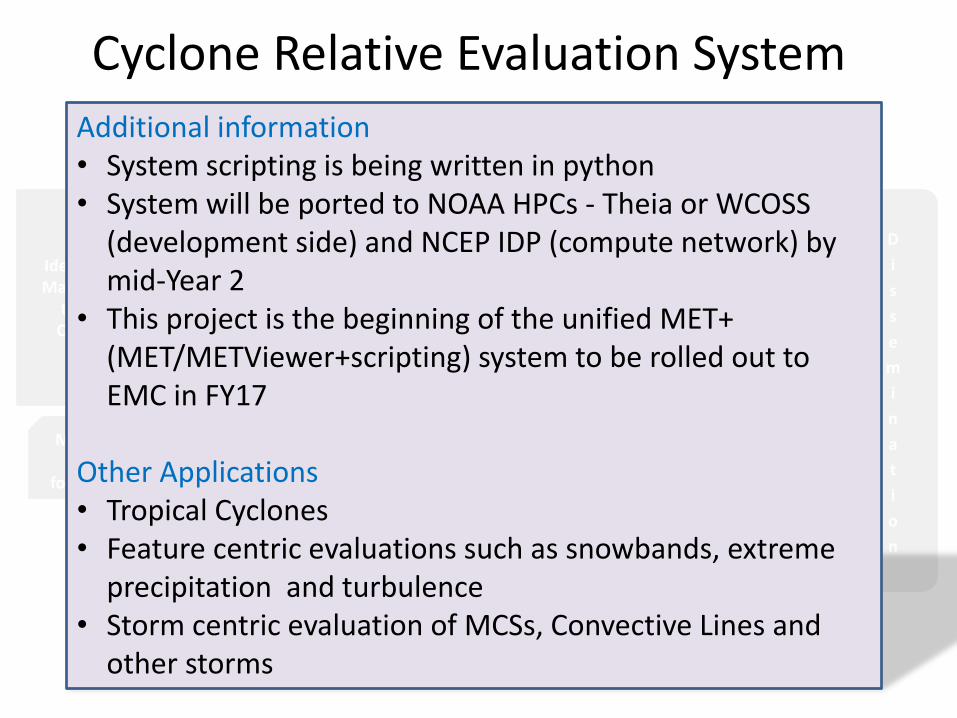
Additional information • System scripting is being written in python • System will be ported to NOAA HPCs - Theia or WCOSS
(development side) and NCEP IDP (compute network) by mid-Year 2
• This project is the beginning of the unified MET+ (MET/METViewer+scripting) system to be rolled out to EMC in FY17
Other Applications • Tropical Cyclones • Feature centric evaluations such as snowbands, extreme
precipitation and turbulence • Storm centric evaluation of MCSs, Convective Lines and
other storms
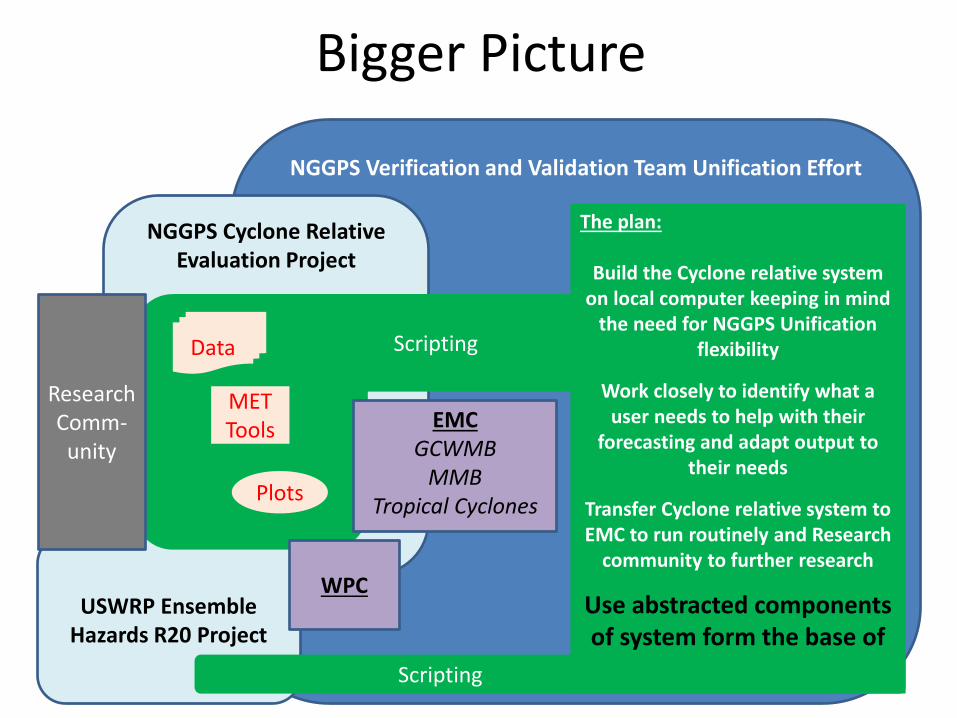
NGGPS Verification and Validation Team Unification Effort
Bigger Picture
NGGPS Cyclone Relative Evaluation Project
The plan:
Build the Cyclone relative system on local computer keeping in mind
the need for NGGPS Unification flexibility
Work closely to identify what a user needs to help with their
forecasting and adapt output to their needs
Transfer Cyclone relative system to EMC to run routinely and Research
community to further research
Use abstracted components of system form the base of
MET+ unified system
USWRP Ensemble Hazards R20 Project
Scripting Data
MET Tools
Plots
EMC GCWMB
MMB Tropical Cyclones
WPC
Scripting
Research Comm-unity
Cyclone Relative Evaluation System
Identify and Match Extra-
tropical Cyclones
Extract Tiles Compute Statistics
Gridded Field Plotting
METViewer Plotting
Plots
Plots
Tiles
Modified ATCF
format file
Gridded Stats Field
Ascii Stat File
D
i
s
s
e
m
i
n
a
t
i
o
n
Fcst and Analysis
Grids
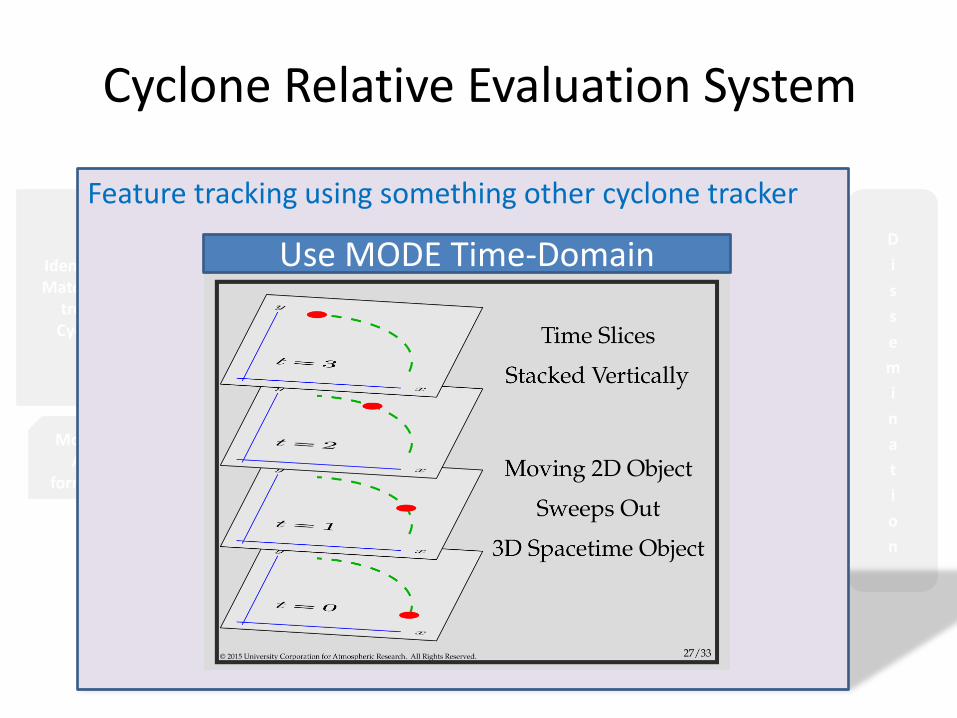
Feature tracking using something other cyclone tracker
Use MODE Time-Domain
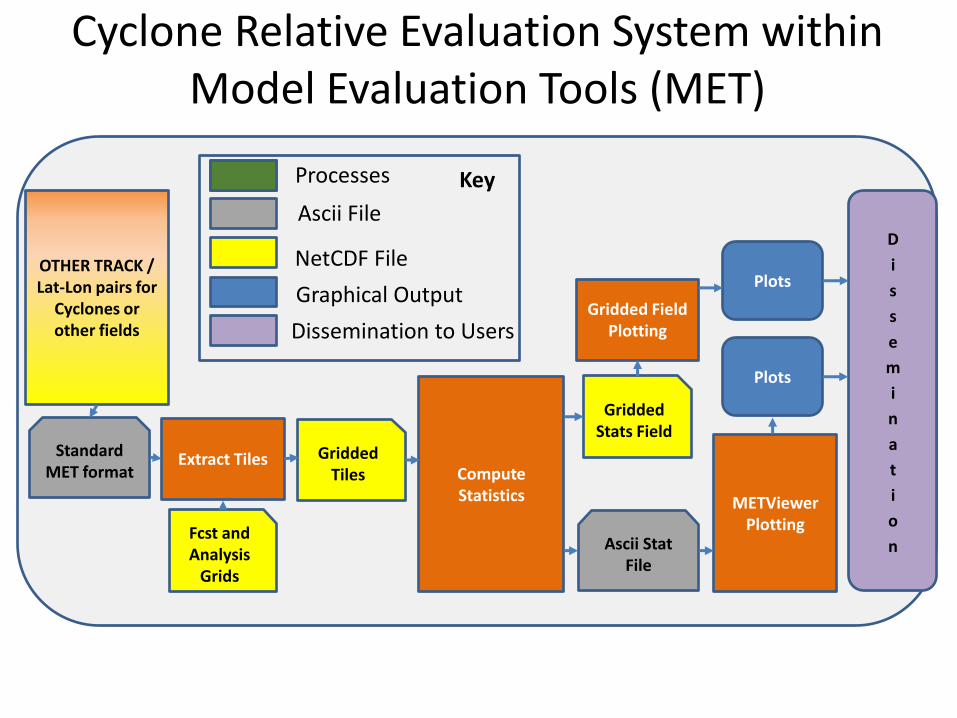
Cyclone Relative Evaluation System within Model Evaluation Tools (MET)
OTHER TRACK / Lat-Lon pairs for
Cyclones or other fields
Extract Tiles Compute Statistics
Gridded Field Plotting
METViewer Plotting
Plots
Plots
Gridded Tiles
Standard MET format
Gridded Stats Field
Ascii Stat File
D
i
s
s
e
m
i
n
a
t
i
o
n
Fcst and Analysis
Grids
Processes
Ascii File
NetCDF File
Graphical Output
Dissemination to Users
Key
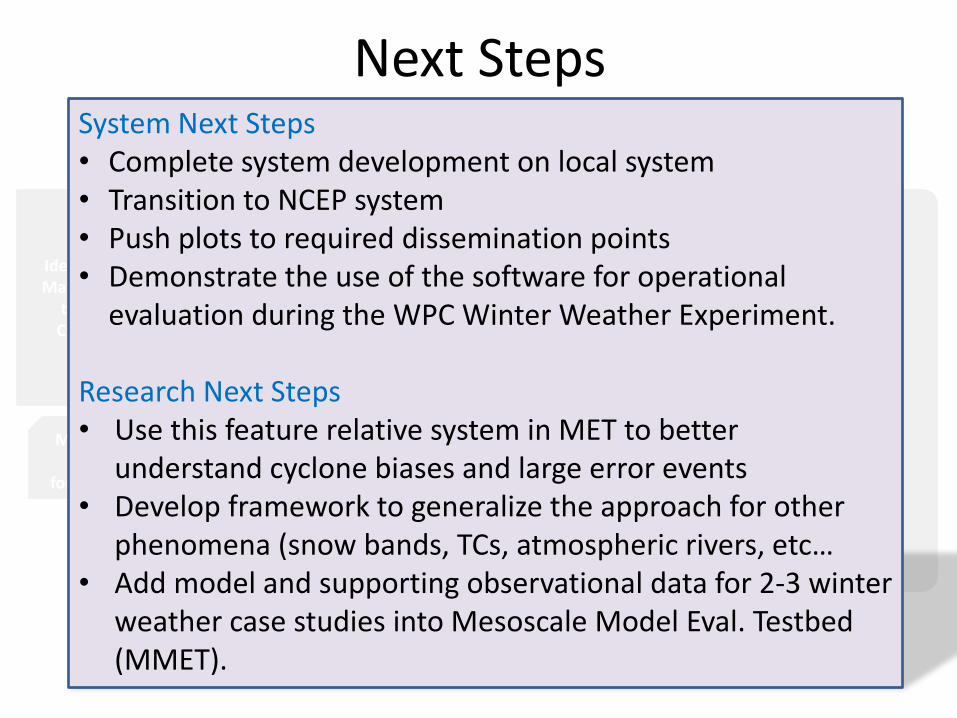
Next Steps
Identify and Match Extra-
tropical Cyclones
Extract Tiles Compute Statistics
Gridded Field Plotting
METViewer Plotting
Plots
Plots
Tiles
Modified ATCF
format file
Gridded Stats Field
Ascii Stat File
D
i
s
s
e
m
i
n
a
t
i
o
n
Fcst and Analysis
Grids
System Next Steps • Complete system development on local system • Transition to NCEP system • Push plots to required dissemination points • Demonstrate the use of the software for operational
evaluation during the WPC Winter Weather Experiment. Research Next Steps • Use this feature relative system in MET to better
understand cyclone biases and large error events • Develop framework to generalize the approach for other
phenomena (snow bands, TCs, atmospheric rivers, etc… • Add model and supporting observational data for 2-3 winter
weather case studies into Mesoscale Model Eval. Testbed (MMET).
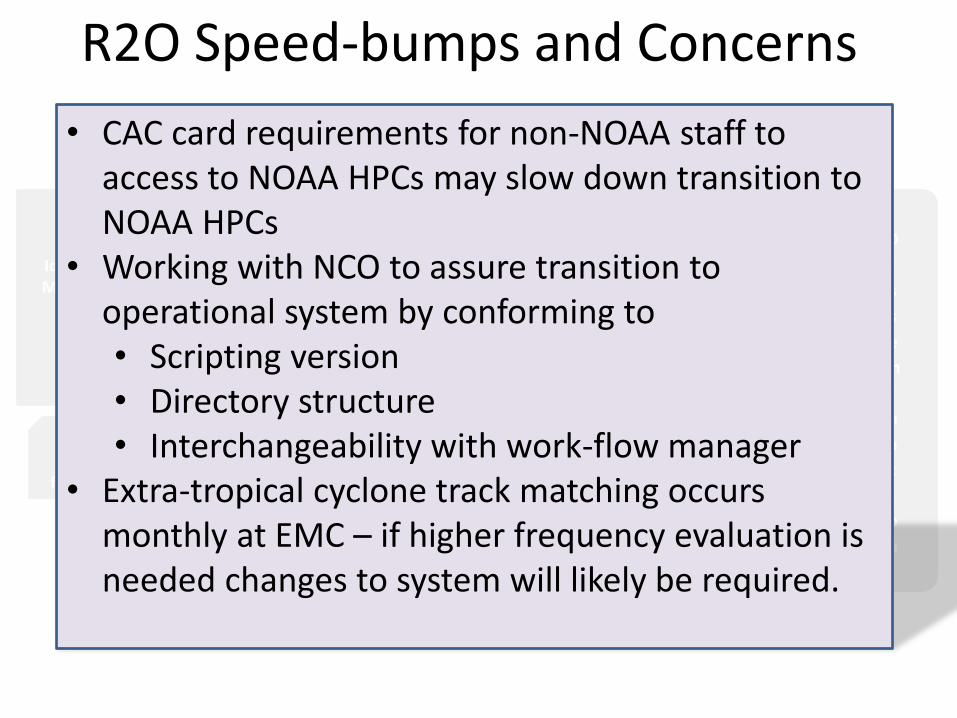
R2O Speed-bumps and Concerns
Identify and Match Extra-
tropical Cyclones
Extract Tiles Compute Statistics
Gridded Field Plotting
METViewer Plotting
Plots
Plots
Tiles
Modified ATCF
format file
Gridded Stats Field
Ascii Stat File
D
i
s
s
e
m
i
n
a
t
i
o
n
Fcst and Analysis
Grids
• CAC card requirements for non-NOAA staff to access to NOAA HPCs may slow down transition to NOAA HPCs
• Working with NCO to assure transition to operational system by conforming to • Scripting version • Directory structure • Interchangeability with work-flow manager
• Extra-tropical cyclone track matching occurs monthly at EMC – if higher frequency evaluation is needed changes to system will likely be required.