5. report date 6. performing organization … case study ..... 32 5 conclusions and recommendations...
TRANSCRIPT
i
STATE OF CALIFORNIA DEPARTMENT OF TRANSPORTATION
TECHNICAL REPORT DOCUMENTATION PAGE TR0003 (REV. 10/98)
1. REPORT NUMBER
CA13-2207
2. GOVERNMENT ASSOCIATION NUMBER
3. RECIPIENT’S CATALOG NUMBER
4. TITLE AND SUBTITLE
Strategies for Reducing Pedestrian and Bicyclist Injury at the Corridor Level
5. REPORT DATE
May 31, 2013 6. PERFORMING ORGANIZATION CODE
7. AUTHOR(S)
Offer Grembek, Yuanyuan Zhang, Afsaneh Yavari, Zhao Yang, and David Ragland
8. PERFORMING ORGANIZATION REPORT NO.
UCB-0407
9. PERFORMING ORGANIZATION NAME AND ADDRESS
UC Berkeley Safe Transportation Research & Education Center 2614 Dwight Way, #7374 Berkeley, CA 94720-7374
10. WORK UNIT NUMBER
11. CONTRACT OR GRANT NUMBER
65A0407 12. SPONSORING AGENCY AND ADDRESS
California Department of Transportation Division of Research and Innovation, MS-83 1227 O Street Sacramento CA 95814
13. TYPE OF REPORT AND PERIOD COVERED
Final report 14. SPONSORING AGENCY CODE
15. SUPPLEMENTAL NOTES
16. ABSTRACT
A systemic approach for identifying potential safety countermeasures and implementing them across groups of locations sharing the same risk characteristics has been developed for pedestrian-vehicle collisions. This study was funded by the California Department of Transportation (Caltrans) to develop methods for identifying sites where there is potential for significant reductions in pedestrian and bicyclist injury. Data collected between 1998 and 2007 from a 16.5-mile section of San Pablo Avenue (SR 123) in the San Francisco East Bay was used as the study area. A database containing all useful crash information was developed and applied to study the spatial patterns, crash types, and location types of pedestrian-related collision. Several data stratifications were investigated to determine appropriate data aggregations for pedestrian safety analysis. Bicycle-related collisions were also included in the analysis to show the differences between pedestrian and bicycle collisions. A systemic approach was developed to identify the systemic hot spots in the transportation system and then recommend countermeasures for systemic implementation across a targeted type of facility. 17. KEY WORDS
Pedestrian injury; Bicyclist injury; Expected injuries; Benefit-cost analyses; High collision locations
18. DISTRIBUTION STATEMENT
No restrictions. This document is available to the public through the National Technical Information Service, Springfield, VA 22161
19. SECURITY CLASSIFICATION (of this report)
Unclassified
20. NUMBER OF PAGES
68
21. PRICE
N/A Reproduction of completed page authorized
ii
STRATEGIES FOR REDUCING
PEDESTRIAN AND BICYCLIST INJURY
AT THE CORRIDOR LEVEL:
FINAL TECHNICAL REPORT
PREPARED BY THE
UC BERKELEY SAFE TRANSPORTATION RESEARCH AND EDUCATION CENTER
FOR THE
CALIFORNIA DEPARTMENT OF TRANSPORTATION
MAY 31, 2013
OFFER GREMBEK, PHD
YUANYUAN ZHANG, PHD
AFSANEH YAVARI
ZHAO YANG
DAVID R. RAGLAND, PHD, MPH
iii
DISCLAIMER STATEMENT
This document is disseminated in the interest of information exchange. The contents of this report reflect the views of the authors who are responsible for the facts and accuracy of the data presented herein. The contents do not necessarily reflect the official views or policies of the State of California or the Federal Highway Administration. This publication does not constitute a standard, specification or regulation. This report does not constitute an endorsement by the Department of any product described herein.
For individuals with sensory disabilities, this document is available in Braille, large print, audiocassette, or compact disk. To obtain a copy of this document in one of these alternate formats, please contact: the Division of Research and Innovation, MS-83, California Department of Transportation, P.O. Box 942873, Sacramento, CA 94273-0001.
1
ACKNOWLEDGEMENTS
The authors would like to thank the California Department of Transportation for their support of this project. We especially acknowledge the support and guidance of Brian Alconcel, Pedestrian Safety Chief at Caltrans and Jerry Kwong. We also acknowledge SafeTREC graduate researchers John Bigham and Swati Pande for their work on constructing data files and conducing analyses for the project.
2
Table of Contents
Executive Summary .......................................................................................................... 3
1 Introduction ............................................................................................................. 5
1.1 The Systemic Safety Approach .................................................................. 5
1.2 Comparison of the PBCAT and SMART Approaches ............................... 6
2 Developing a Database Structure ........................................................................... 7
2.2 Study Sites .................................................................................................. 7
3 Stratification Analysis ........................................................................................... 10
3.1 Information Found in TASAS Crash Data ............................................... 10
3.2 Technique ................................................................................................. 11
3.3 Identifying Stratifications ......................................................................... 14
3.4 Spatial Pattern Evaluation ......................................................................... 15
3.5 Spatial Consistency ................................................................................... 16
4 Pedestrian Systemic Monitoring Approach for Road Traffic Safety (PEDSMARTS) ...................................................................................................... 20
4.1 Procedure .................................................................................................. 20
4.2 Matrix introduction .............................................................................................. 20
4.3 Crash Type and Crash Location Classification .................................................... 22
4.4 Case Study ........................................................................................................... 32
5 Conclusions and Recommendations ...................................................................... 39
5.1 Conclusions .......................................................................................................... 39
5.2 Recommendations ................................................................................................ 39
References ........................................................................................................................ 40
Appendices ....................................................................................................................... 41
Appendix 1. Photographs of VRU Arterials Along San Pablo Avenue ....................... 41
Appendix 2. Level of danger consistency and number of collision consistency .......... 42
Appendix 3. Data Matching of Crash Information & Countermeasures ...................... 62

3
Executive Summary Urban arterials are different from most State Highway System (SHS) facilities; they have controlled intersections, divided multi-lanes, multimodal users, often with mixed land uses on both sides. This type of roadway comprises only 2% of the total miles in the California SHS, however it experiences 22% of SHS pedestrian injuries. Over the past decade, pedestrians accounted for approximately 12 percent of all traffic fatalities in the United States. Pedestrians and bicyclists are the most vulnerable road users (VRU) in all the crashes.
This study was funded by the California Department of Transportation (Caltrans) to develop methods for identifying sites where there is potential for significant reductions in pedestrian and bicyclist injury. To date, there are two approaches used by state agencies to allocate safety resources. One is the hotspot approach which focuses on identifying and recommending improvements for high collision concentration locations; the other is the systemic approach which seeks improvements that can be implemented at various sites across a network, based on specific roadway features that are associated with a particular crash type.
Systemic improvements generally have a lower per-site cost as they are implemented at multiple locations across a network. The systemic approach is a supplementary approach to the hot spot method. Using this approach, users can identify systemic hotspots which share the same high risk characteristics, and then recommend countermeasures for systemic implementation across groups of locations which may offer an economy of scale effect.
In this study, a systemic approach is developed to identify the appropriate blanket improvements along urban arterials across a targeted type of facility. Crashes along the study sites were counted for specific crash and facility type pairs. The data is assembled in a matrix which provides a snapshot of what types of crashes are occurring on what types of facilities and help in identifying the “systemic hotpsots”. This approach provides guidance about the possible set of countermeasures that can be used to reduce the specific type of crashes for each facility type. This method uses data from Caltrans Accident Surveillance and Analysis System (TASAS) and bridges the gap between low data availability and the detailed information requirements of the existing countermeasure selection tool.
The study sites used in this report are a 16.5-mile section of San Pablo Avenue (SR 123), an arterial corridor in San Francisco’s East Bay and a 4.9-mile section of Santa Monica Boulevard in Los Angeles County. A database including all VRU collisions was constructed using TASAS and SWITRS. The San Pablo Avenue Corridor is a system of freeways and major arterials serving the east shore of the San Francisco Bay, from downtown Oakland north to the City of Hercules, while the other study area is a major arterial in Southern California.
4
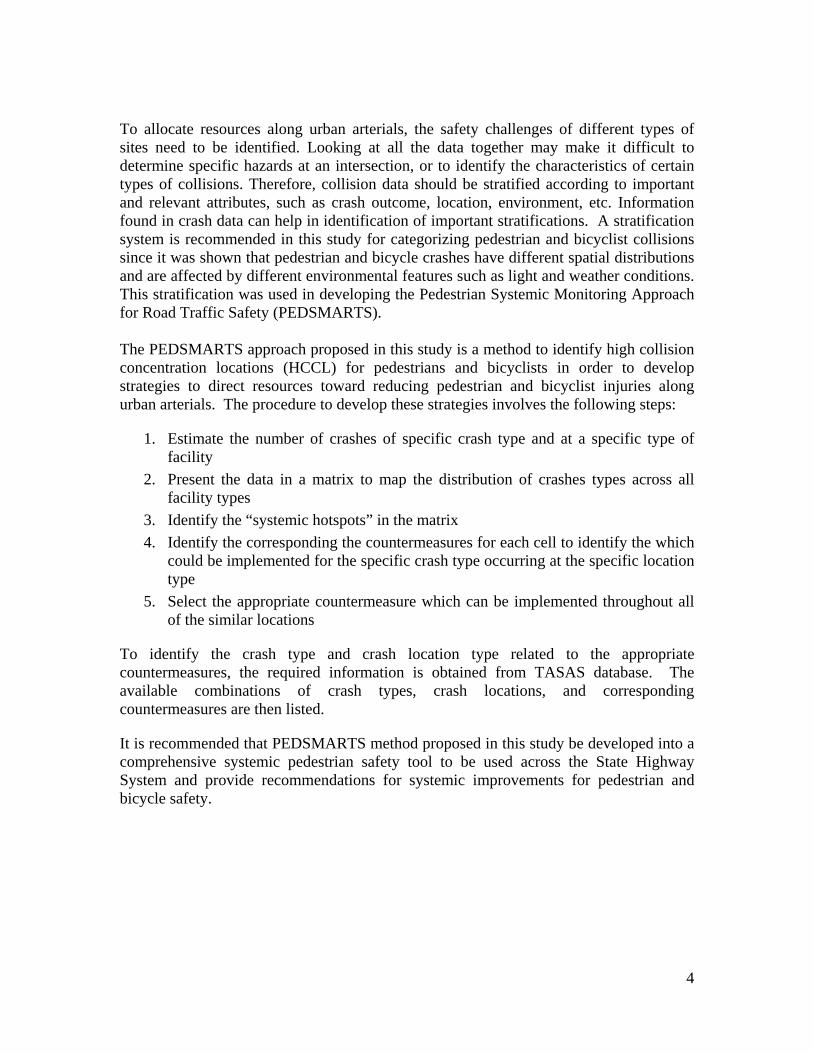
To allocate resources along urban arterials, the safety challenges of different types of sites need to be identified. Looking at all the data together may make it difficult to determine specific hazards at an intersection, or to identify the characteristics of certain types of collisions. Therefore, collision data should be stratified according to important and relevant attributes, such as crash outcome, location, environment, etc. Information found in crash data can help in identification of important stratifications. A stratification system is recommended in this study for categorizing pedestrian and bicyclist collisions since it was shown that pedestrian and bicycle crashes have different spatial distributions and are affected by different environmental features such as light and weather conditions. This stratification was used in developing the Pedestrian Systemic Monitoring Approach for Road Traffic Safety (PEDSMARTS). The PEDSMARTS approach proposed in this study is a method to identify high collision concentration locations (HCCL) for pedestrians and bicyclists in order to develop strategies to direct resources toward reducing pedestrian and bicyclist injuries along urban arterials. The procedure to develop these strategies involves the following steps:
1. Estimate the number of crashes of specific crash type and at a specific type of facility
2. Present the data in a matrix to map the distribution of crashes types across all facility types
3. Identify the “systemic hotspots” in the matrix
4. Identify the corresponding the countermeasures for each cell to identify the which could be implemented for the specific crash type occurring at the specific location type
5. Select the appropriate countermeasure which can be implemented throughout all of the similar locations
To identify the crash type and crash location type related to the appropriate countermeasures, the required information is obtained from TASAS database. The available combinations of crash types, crash locations, and corresponding countermeasures are then listed.
It is recommended that PEDSMARTS method proposed in this study be developed into a comprehensive systemic pedestrian safety tool to be used across the State Highway System and provide recommendations for systemic improvements for pedestrian and bicycle safety.

5
1 Introduction 1.1 The Systemic Safety Approach Over the past decade, pedestrians accounted for approximately 12 percent of all traffic fatalities in the United States, totaling more than 4,500 deaths per year. Worldwide, pedestrians suffer the largest share of the 1.2 million annual traffic fatalities. As people are being encouraged to walk more to reduce environmental impacts and improve public health, transportation professionals are obligated to make walking as safe as possible. Many of the risk factors and the spatio-temporal distributions of crashes that involve pedestrians are inherently different from crashes that only involve motorized vehicles. Moreover, potential safety improvements for pedestrians are typically dedicated solely for pedestrian safety applications (Bartlett 2012), meaning that many existing safety practices cannot be applied to improve pedestrian safety without significant modifications. Over 1,200,000 injuries took place in California, between 2006 to 2010 with a reduction rate of 18%. In the same period, the fatalities were 17,400 and from 2006 to 2010 the number has been reduced by 36%. But after 2010, the trend changed. From 2010 to 2011 the number of fatalities raised from 2,720 to 2,791. Pedestrians and bicyclists are the most vulnerable road users in all the crashes. They have the higher vulnerability than any other modes. To date, there are two approaches used by state agencies to allocate safety resources. One is the hotspot approach which focuses on identifying and recommending improvements for high collision concentration locations, while the other is the systemic approach which seeks improvements that can be implemented at various sites across a network, based on specific roadway features that are associated with a particular crash type. Systemic improvements generally have a lower per-site cost as they are implemented at multiple locations across a network. Currently, the hotspot approach is the dominant funding mechanism for most state agencies in the United States. However, some agencies are increasing the proportion of funding allocated to systemic road safety improvements to complement the hotspot approach (Preston 2010). The systemic approach is valuable for facilities that have relatively low crash frequencies (e.g., rural roads) and are therefore less likely to be identified as hotspots and subsequently considered for safety improvements. Similarly, pedestrian crashes exhibit lower crash frequencies and accordingly this approach results in few resources being allocated to conduct site investigations to improve pedestrian safety. In addition, pedestrian data is often missing essential elements (e.g., exposure) required for hotspot identification. In light of this, there is an urgency to increase the knowledge base available to public agencies and others for identifying systemic prevention mechanisms for pedestrian fatalities and injuries.
6
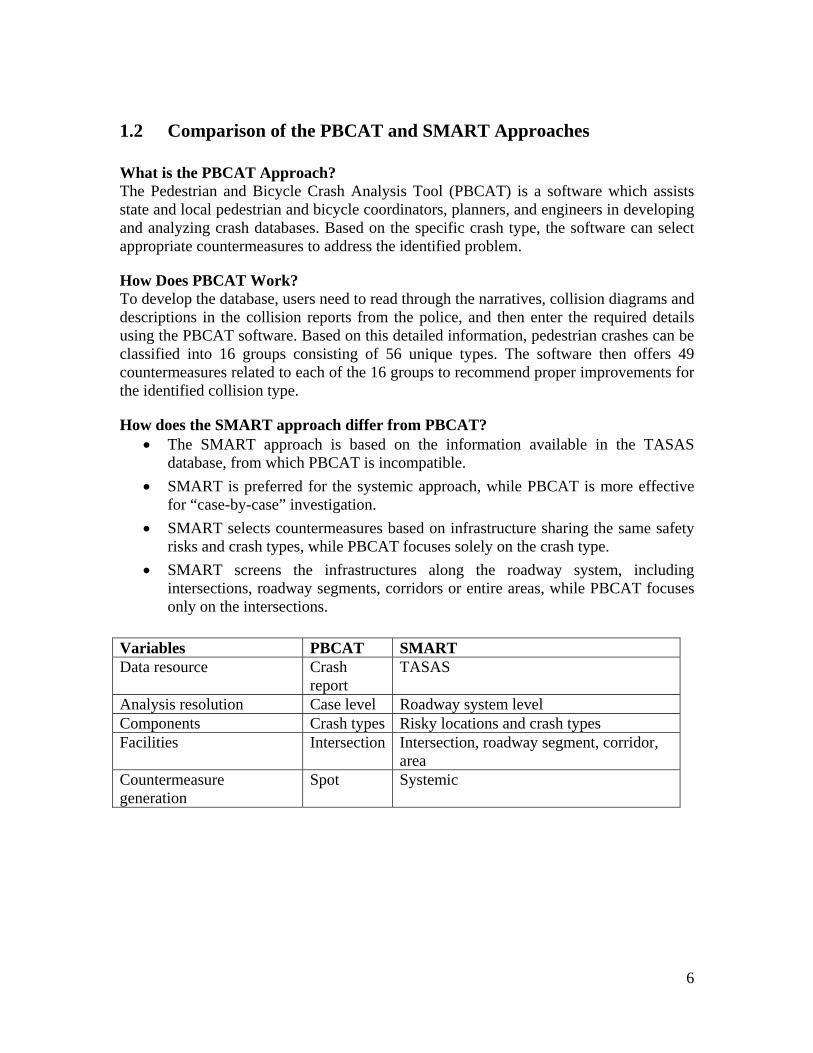
1.2 Comparison of the PBCAT and SMART Approaches What is the PBCAT Approach? The Pedestrian and Bicycle Crash Analysis Tool (PBCAT) is a software which assists state and local pedestrian and bicycle coordinators, planners, and engineers in developing and analyzing crash databases. Based on the specific crash type, the software can select appropriate countermeasures to address the identified problem.
How Does PBCAT Work? To develop the database, users need to read through the narratives, collision diagrams and descriptions in the collision reports from the police, and then enter the required details using the PBCAT software. Based on this detailed information, pedestrian crashes can be classified into 16 groups consisting of 56 unique types. The software then offers 49 countermeasures related to each of the 16 groups to recommend proper improvements for the identified collision type.
How does the SMART approach differ from PBCAT? The SMART approach is based on the information available in the TASAS
database, from which PBCAT is incompatible.
SMART is preferred for the systemic approach, while PBCAT is more effective for “case-by-case” investigation.
SMART selects countermeasures based on infrastructure sharing the same safety risks and crash types, while PBCAT focuses solely on the crash type.
SMART screens the infrastructures along the roadway system, including intersections, roadway segments, corridors or entire areas, while PBCAT focuses only on the intersections.
Variables PBCAT SMARTData resource Crash
report TASAS
Analysis resolution Case level Roadway system level Components Crash types Risky locations and crash types Facilities Intersection Intersection, roadway segment, corridor,
area Countermeasure generation
Spot Systemic
7
2 Developing a Database Structure 2.2 Study Sites
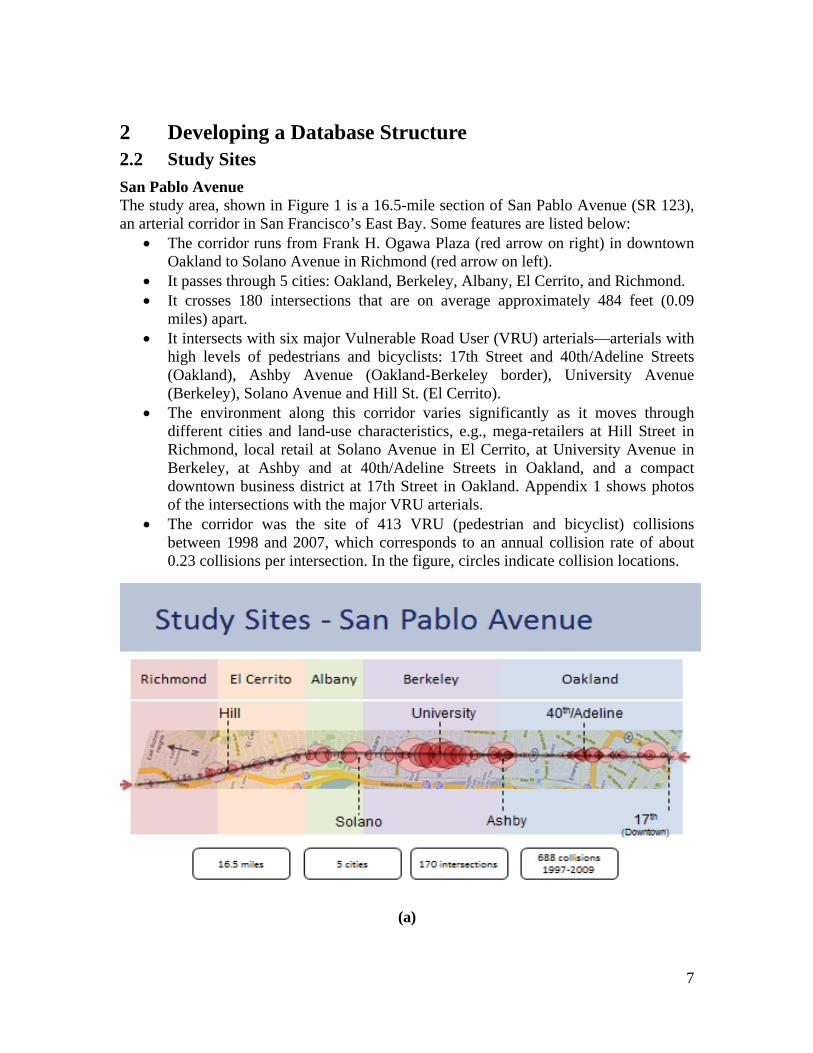
San Pablo Avenue The study area, shown in Figure 1 is a 16.5-mile section of San Pablo Avenue (SR 123), an arterial corridor in San Francisco’s East Bay. Some features are listed below:
The corridor runs from Frank H. Ogawa Plaza (red arrow on right) in downtown Oakland to Solano Avenue in Richmond (red arrow on left).
It passes through 5 cities: Oakland, Berkeley, Albany, El Cerrito, and Richmond. It crosses 180 intersections that are on average approximately 484 feet (0.09
miles) apart. It intersects with six major Vulnerable Road User (VRU) arterials—arterials with
high levels of pedestrians and bicyclists: 17th Street and 40th/Adeline Streets (Oakland), Ashby Avenue (Oakland-Berkeley border), University Avenue (Berkeley), Solano Avenue and Hill St. (El Cerrito).
The environment along this corridor varies significantly as it moves through different cities and land-use characteristics, e.g., mega-retailers at Hill Street in Richmond, local retail at Solano Avenue in El Cerrito, at University Avenue in Berkeley, at Ashby and at 40th/Adeline Streets in Oakland, and a compact downtown business district at 17th Street in Oakland. Appendix 1 shows photos of the intersections with the major VRU arterials.
The corridor was the site of 413 VRU (pedestrian and bicyclist) collisions between 1998 and 2007, which corresponds to an annual collision rate of about 0.23 collisions per intersection. In the figure, circles indicate collision locations.
(a)
8
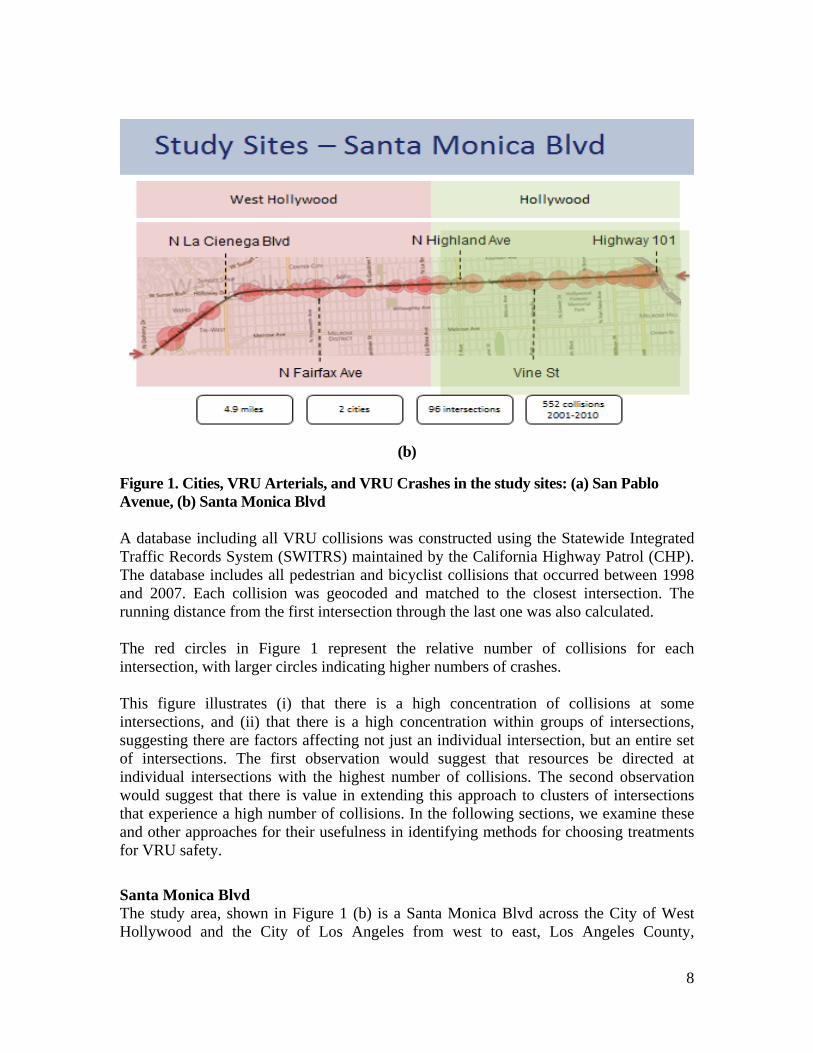
(b)
Figure 1. Cities, VRU Arterials, and VRU Crashes in the study sites: (a) San Pablo Avenue, (b) Santa Monica Blvd A database including all VRU collisions was constructed using the Statewide Integrated Traffic Records System (SWITRS) maintained by the California Highway Patrol (CHP). The database includes all pedestrian and bicyclist collisions that occurred between 1998 and 2007. Each collision was geocoded and matched to the closest intersection. The running distance from the first intersection through the last one was also calculated. The red circles in Figure 1 represent the relative number of collisions for each intersection, with larger circles indicating higher numbers of crashes. This figure illustrates (i) that there is a high concentration of collisions at some intersections, and (ii) that there is a high concentration within groups of intersections, suggesting there are factors affecting not just an individual intersection, but an entire set of intersections. The first observation would suggest that resources be directed at individual intersections with the highest number of collisions. The second observation would suggest that there is value in extending this approach to clusters of intersections that experience a high number of collisions. In the following sections, we examine these and other approaches for their usefulness in identifying methods for choosing treatments for VRU safety.
Santa Monica Blvd The study area, shown in Figure 1 (b) is a Santa Monica Blvd across the City of West Hollywood and the City of Los Angeles from west to east, Los Angeles County,
9
California. It starts from the intersection of Santa Monica Blvd and N Doheny Dr in the west to the intersection of Santa Monica Blvd and Highway 101 On Ramp in the east. Crashes took places on Santa Monica Blvd are defined as crashes located within a 30 feet both-side buffer zone generated by “Buffer” tools in ArcGIS 10 using road lines of Santa Monica Blvd. Intersection points are generated from Santa Monica Blvd and its cross roads in the study scale. There are 552 vulnerable road user crashes extracted out and 96 intersections generated for analysis.

10
3 Stratification Analysis This section evaluates the strengths and weaknesses of studying individual intersections using a single year as the sampling period. Table 1 summarizes the distribution of the frequency of VRU collisions per intersection for each of the 10 years, ranging from the percentage of intersections with zero (0) collisions to the percentage of intersections which experienced four (4), the greatest number of VRU collisions at any one intersection during this time period. Urban arterials are different from most state highway system (SHS) facilities. They have controlled intersections, divided multi-lanes, multimodal users, and mixed land use on both sides. This type of roadway comprises only two percent of the total miles in the SHS, however it experiences 22 percent of SHS pedestrian injuries. Urban arterials require special attention for the modes of walking and bicycling. To allocate resources along urban arterials, the safety problems affecting the most dangerous intersections should be identified. Putting all the data together may make it difficult to determine specific hazards at an intersection, or to identify the characteristics of certain types of collisions. Therefore, collision data should be stratified according to important and relevant feature categories, such as crash outcome, location, environment, etc. 3.1 Information Found in TASAS Crash Data Caltrans uses the Traffic Accident Surveillance and Analysis System (TASAS) database. Information found in this crash database can help in identification of important stratifications. As shown in Table 1 and Table 2, non-fatal crashes are more likely to occur during daylight hours, while fatal injuries are more likely to occur during nighttime hours. In addition, non-fatal crashes are more likely to occur while pedestrians are crossing at intersections, while fatal injuries are more likely to occur while pedestrians are crossing at a non-crosswalk location. These are examples of how injury severity and distance from intersection can be important stratifications in crash data.
Table 1. Pedestrian Crashes at Urban Arterials Under Different Light Conditions
Source: TASAS 2005‐
Light condition Non‐fatal injuries Fatal injuries All injuries
Daylight 1057 51 1108
Dusk‐dawn 64 2 66
Dark ‐ street lights 623 91 714
Dark ‐ no street lights 40 18 58
Dark ‐ street lights not functioning 5 3 8
(blank) 14 0 14
Total 1803 165 1968

11
Table 2. Pedestrian Crashes at Urban Arterials with Different Pedestrian Movements
Driver behavior may differ before and after a car passes through intersection. Upstream of an intersection, as a car approaches the intersection, the driver likely expects a stop and slows down, perhaps paying more attention to pedestrians. But when the car leaves an intersection, the driver is likely to speed up, perhaps paying less attention to the environment. Crash location—upstream or downstream of an intersection—can be an important stratification in crash data. 3.2 Technique Different transportation modes can be identified by selecting the fields of “Ped” or “Bike” in the database. In addition, crashes of various severity levels can also be obtained from the database in the corresponding fields.
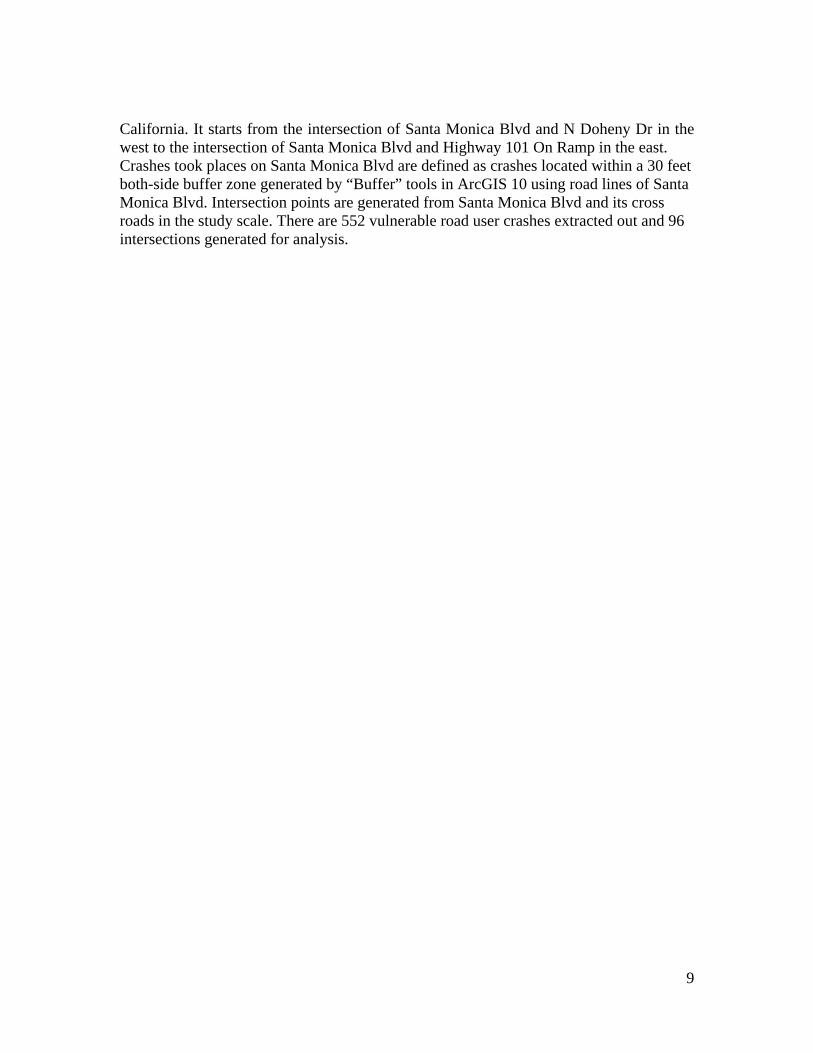
Technique to Determine the Distance Threshold To stratify collision data by their proximity to the intersections, a distance threshold is required. To obtain this threshold, the size of intersections and the distance from collisions to their closest intersection are analyzed. Figure 2 shows the histogram of the distance from intersection center to the inner side of the crosswalk. As shown in the figure, at 95% of intersections, the crosswalks are located within 50 feet from the center of intersection.
Pedestrain movement Non‐fatal injuries Fatal injuries All injuries
Crossing in crosswalk at Intersection 1001 50 1051
Crossing ‐ not in crosswalk 446 84 530
In roadway ‐ include shoulder 154 18 172
Not in Roadway 119 7 126
Crossing in crosswalk not at Intersection 26 0 26
Other 57 6 63
Total 1803 165 1968
Source: TASAS 2005‐
12
Figure 2. Histogram of Distance from Intersection Center to the Crosswalk
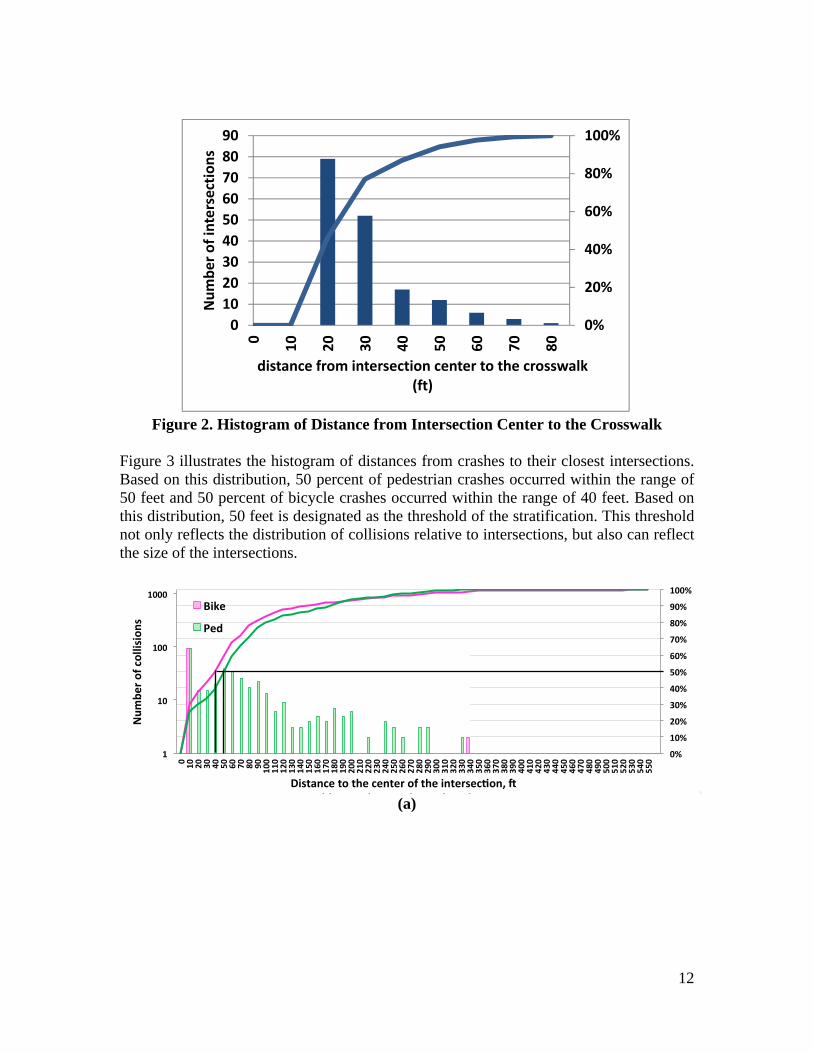
Figure 3 illustrates the histogram of distances from crashes to their closest intersections. Based on this distribution, 50 percent of pedestrian crashes occurred within the range of 50 feet and 50 percent of bicycle crashes occurred within the range of 40 feet. Based on this distribution, 50 feet is designated as the threshold of the stratification. This threshold not only reflects the distribution of collisions relative to intersections, but also can reflect the size of the intersections.
(a)
0%
20%
40%
60%
80%
100%
0
10
20
30
40
50
60
70
80
90
0
10
20
30
40
50
60
70
80
Number of intersections
distance from intersection center to the crosswalk (ft)
f d f h h l
0%
10%
20%
30%
40%
50%
60%
70%
80%
90%
100%
1
10
100
1000
0
10
20
30
40
50
60
70
80
90
100
110
120
130
140
150
160
170
180
190
200
210
220
230
240
250
260
270
280
290
300
310
320
330
340
350
360
370
380
390
400
410
420
430
440
450
460
470
480
490
500
510
520
530
540
550
Number of collisions
Distance to the center of the intersec on,
Bike
Ped
13
(b)
Figure 3. Histogram of Distance from Crashes to Their Closest Intersection Center: (a) San Pablo Ave, (b) Santa Monica Blvd
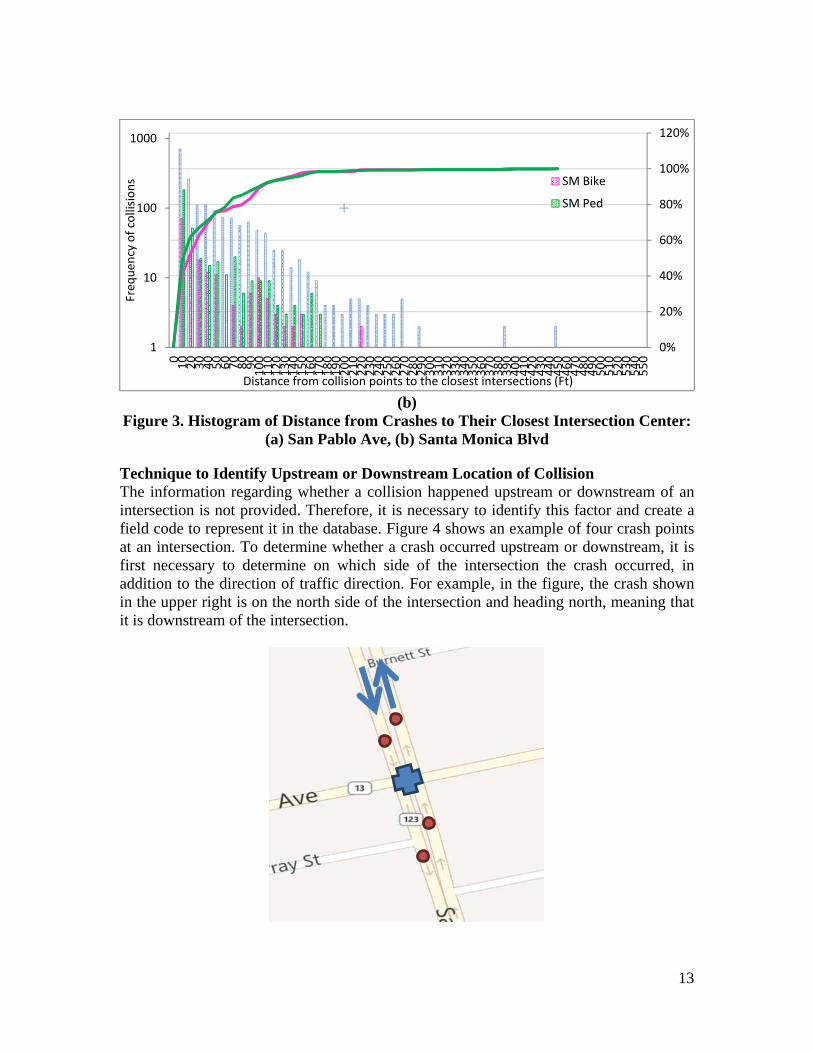
Technique to Identify Upstream or Downstream Location of Collision The information regarding whether a collision happened upstream or downstream of an intersection is not provided. Therefore, it is necessary to identify this factor and create a field code to represent it in the database. Figure 4 shows an example of four crash points at an intersection. To determine whether a crash occurred upstream or downstream, it is first necessary to determine on which side of the intersection the crash occurred, in addition to the direction of traffic direction. For example, in the figure, the crash shown in the upper right is on the north side of the intersection and heading north, meaning that it is downstream of the intersection.
0%
20%
40%
60%
80%
100%
120%
1
10
100
1000
010
20
30
40
50
60
70
80
90
100
110
120
130
140
150
160
170
180
190
200
210
220
230
240
250
260
270
280
290
300
310
320
330
340
350
360
370
380
390
400
410
420
430
440
450
460
470
480
490
500
510
520
530
540
550
Freq
uen
cy of collisions
Distance from collision points to the closest intersections (Ft)
SM Bike
SM Ped
14
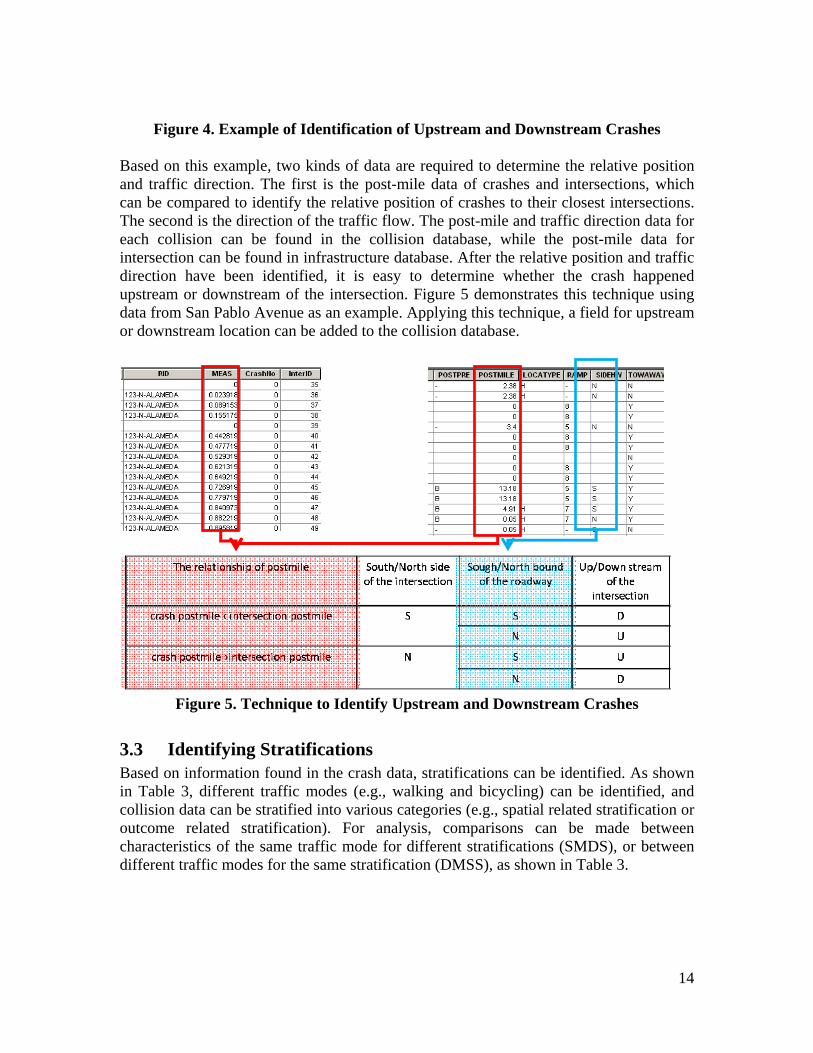
Figure 4. Example of Identification of Upstream and Downstream Crashes Based on this example, two kinds of data are required to determine the relative position and traffic direction. The first is the post-mile data of crashes and intersections, which can be compared to identify the relative position of crashes to their closest intersections. The second is the direction of the traffic flow. The post-mile and traffic direction data for each collision can be found in the collision database, while the post-mile data for intersection can be found in infrastructure database. After the relative position and traffic direction have been identified, it is easy to determine whether the crash happened upstream or downstream of the intersection. Figure 5 demonstrates this technique using data from San Pablo Avenue as an example. Applying this technique, a field for upstream or downstream location can be added to the collision database.
Figure 5. Technique to Identify Upstream and Downstream Crashes
3.3 Identifying Stratifications Based on information found in the crash data, stratifications can be identified. As shown in Table 3, different traffic modes (e.g., walking and bicycling) can be identified, and collision data can be stratified into various categories (e.g., spatial related stratification or outcome related stratification). For analysis, comparisons can be made between characteristics of the same traffic mode for different stratifications (SMDS), or between different traffic modes for the same stratification (DMSS), as shown in Table 3.

15
Table 3. Stratification Pairs Stratifications Modes
Spatial Related Stratification Outcome Related
Stratification Distance from
crash to intersection
Upstream or downstream of an intersection
Severity level
Within 50 ft.
Over 50 ft.
Upstream Downstream Fatal/severe Minor/moderate
Ped SMDS SMDS SMDS SMDS SMDS SMDS
Bike Ped DMSS DMSS DMSS Bike DMSS DMSS DMSS
3.4 Spatial Pattern Evaluation
Spatial Distribution Analysis will determine whether one type of collision is more aggregated than another type. If one type of collision is more aggregated than another, it means this type of collision is more clustered at several intersections instead of evenly distributed across along the urban arterial.
Method To quantify the degree of aggregation, the Lloyd Patchiness Index (PI) is calculated for collision data. As shown in Figure 6, if PI is bigger than 1, this indicates an aggregated distribution. If PI is equal to 1, this indicates a random distribution. If PI is smaller than 1, this indicates a regular distribution. A larger PI value indicates a higher degree of aggregation. When this index is calculated for collision data along urban arterial, it quantifies how the collisions are distributed across intersections.
Figure 6. Relationship Between PI Value and Distribution Pattern
Taking pedestrian and bicycle collision data from San Pablo Avenue and Santa Monica Blvd asexamples, the PI values are calculated, and PI values are shown from lowest (dark green) to highest (red) as presented in Table 4.
PI <1 PI =1 PI >1

16
Table 4. Patchiness Index for Different Crash Types, San Pablo Avenue and Santa Monica Blvd
San Pablo Ave
Pedestrians Bicyclists Within 50 ft. 2.38 1.8 Over 50 ft. 3.6 2.69 Upstream 3.34 2.4 Downstream 2.8 2.76 Fatal/Severe 1.84 2.01 Minor/Moderate 2.47 1.96
Santa Monica Blvd
Pedestrians Bicyclists within 50ft 2.13 1.51
over 50ft 2.22 2.07
fatality and severe 1.79 0
visable injury and complain of pains 1.88 1.42
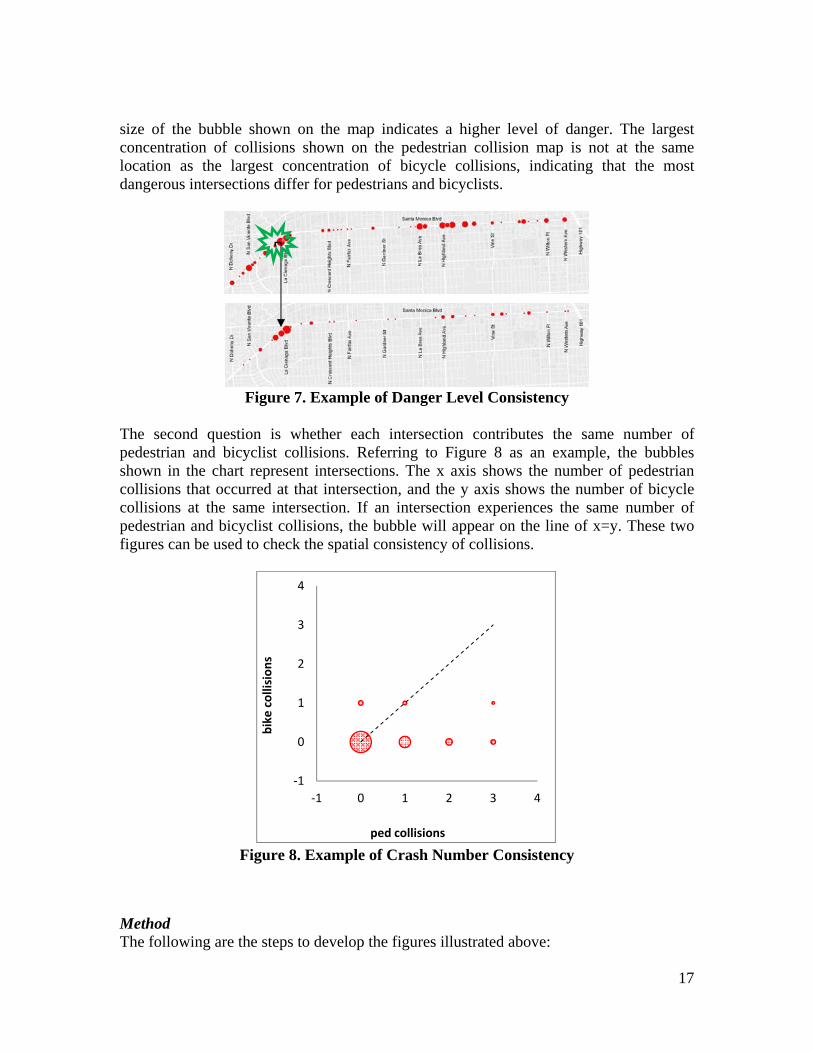
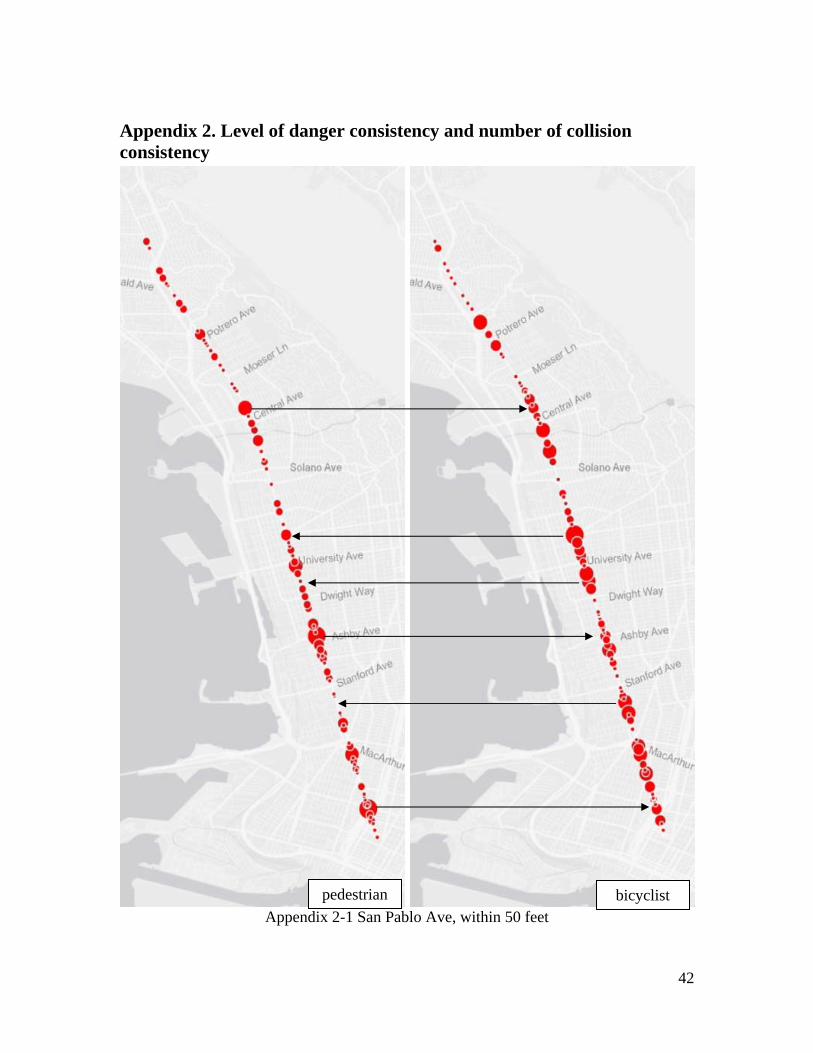
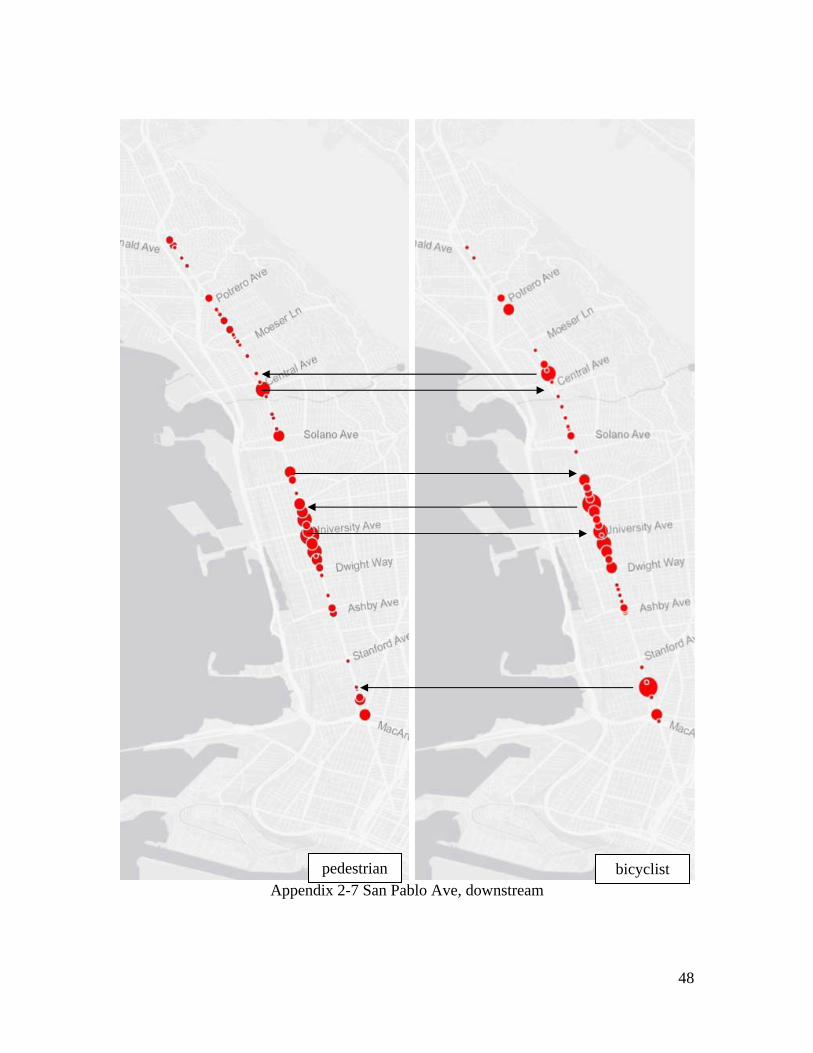
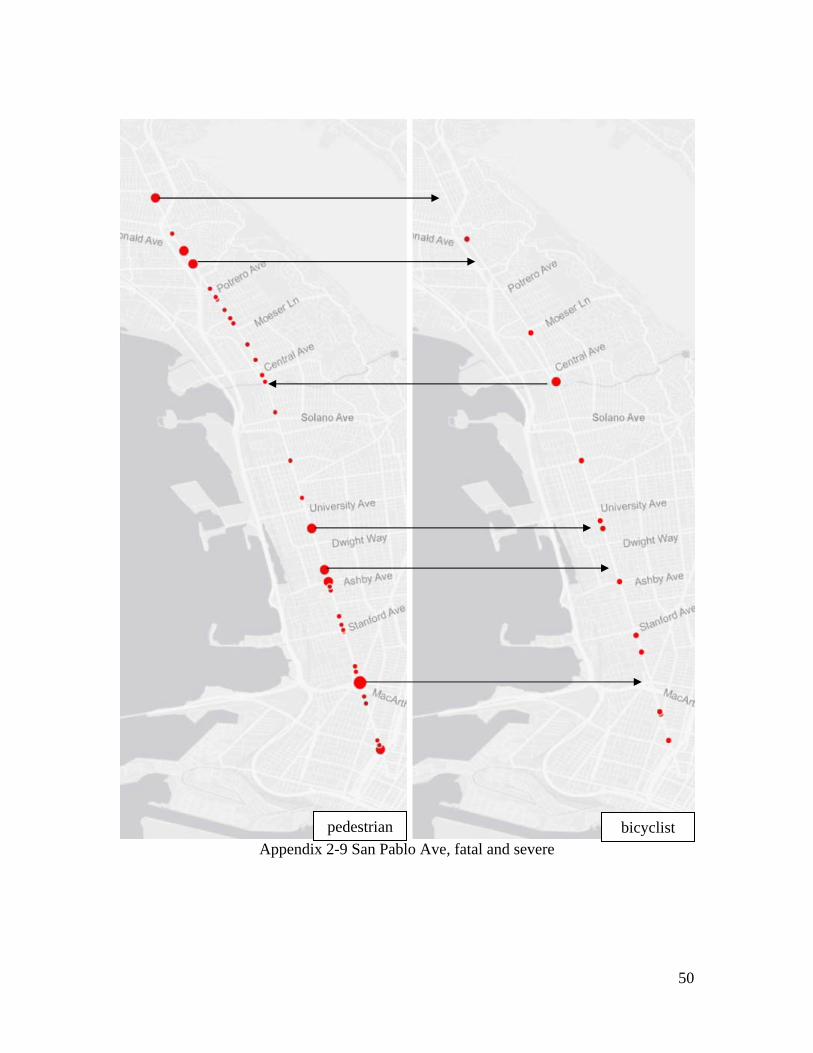
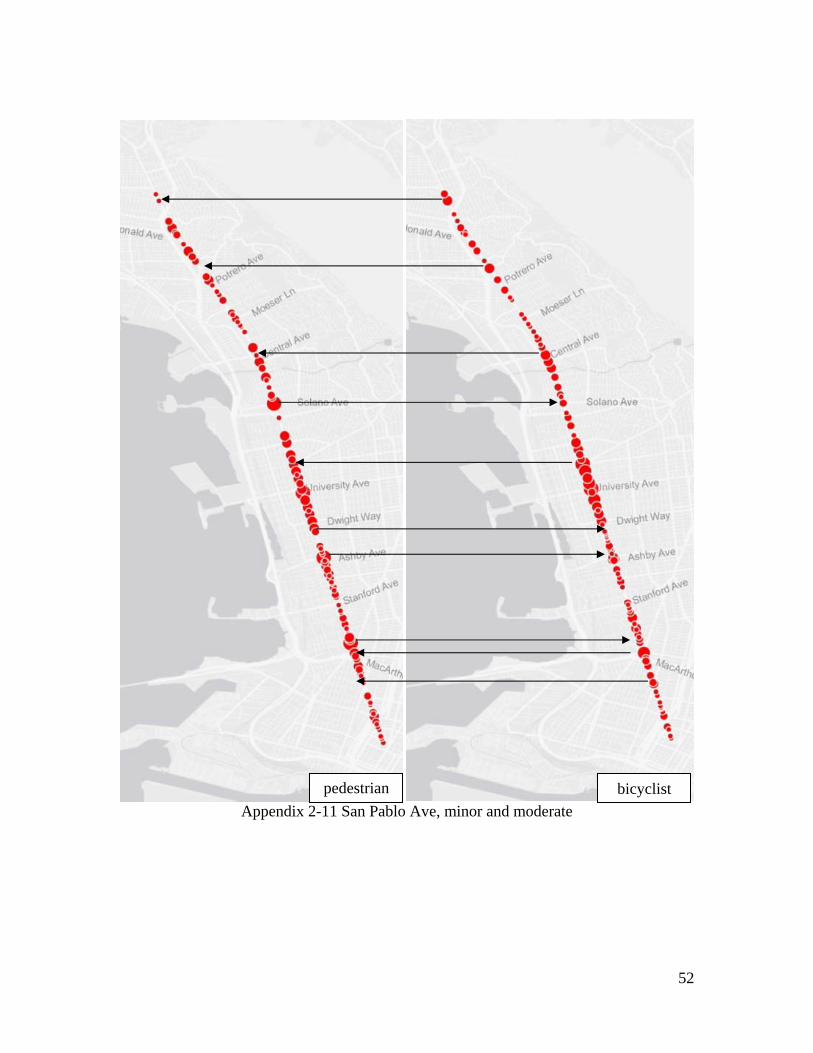
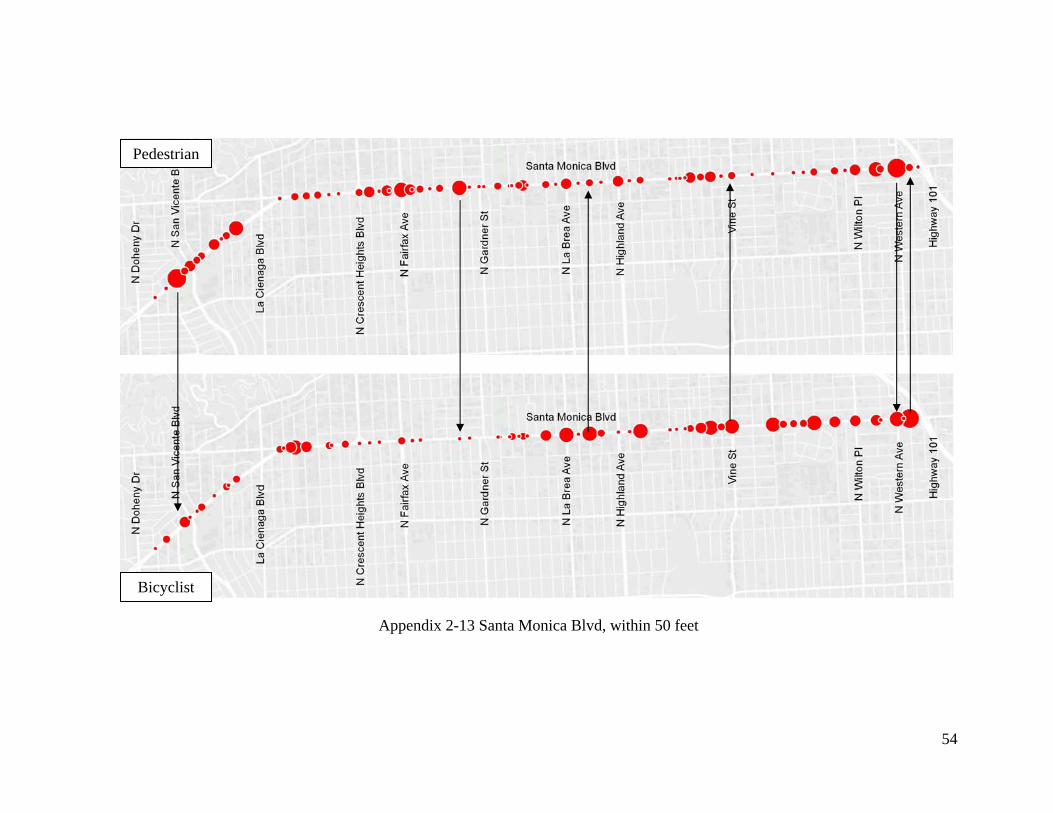
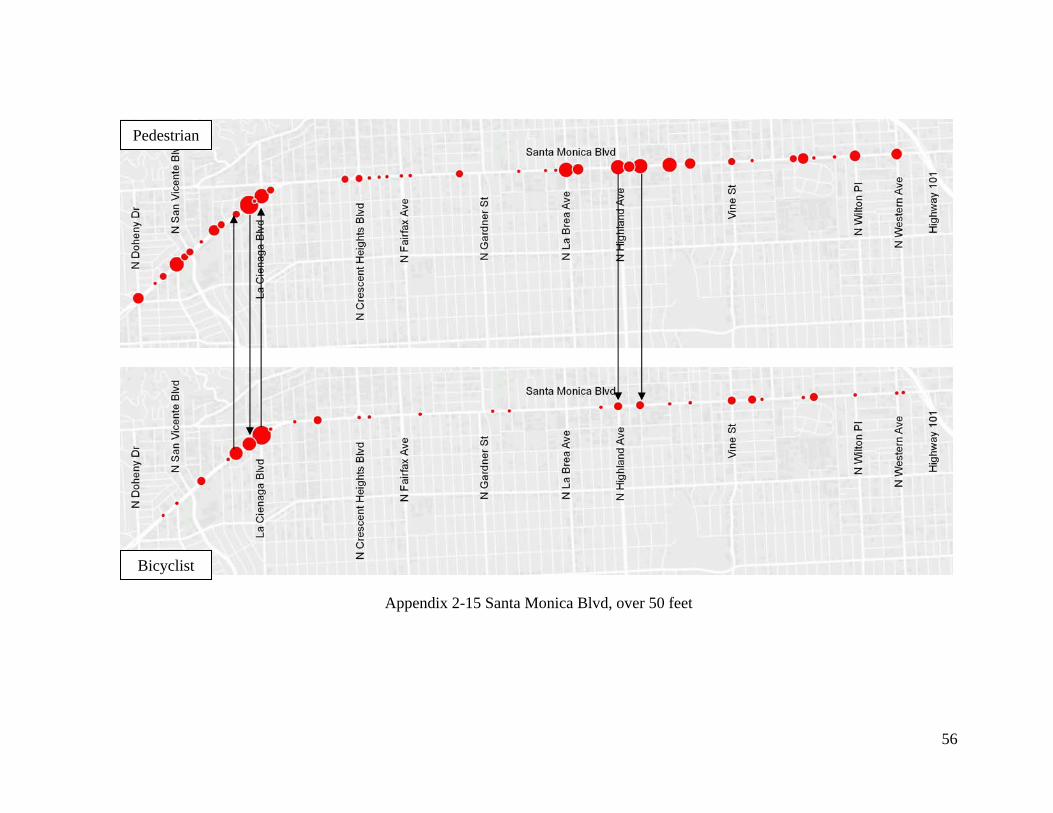
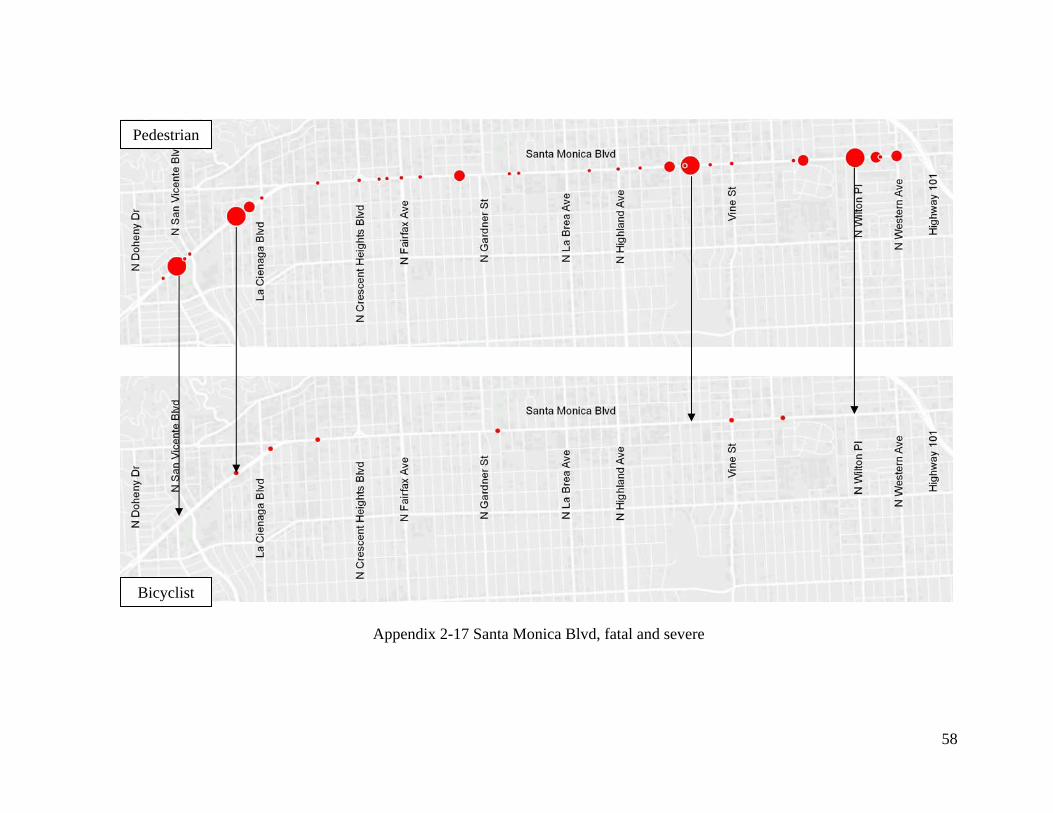
Result Based on the results, three conclusions can be made. First, pedestrian and bicycle collisions are distributed at different aggregation level in the same stratification. For example, pedestrian collisions within 50 feet of an intersection are more aggregated than bicycle collisions within the same stratification. Second, even the same traffic mode may experience different distribution patterns under different stratifications. For example, pedestrian collisions that occurred within 50 feet of an intersection are less aggregated than those that occurred over 50 feet from an intersection. Third, pedestrian collisions are more aggregated than bicycle collisions under each stratification method. Two observations could be noted. First, for the stratification of downstream collision, the difference between pedestrian and bicycle collisions is not significant. The same is true for the stratifications of fatal and severe collisions. This indicates that pedestrian and bicycle collisions can be combined for analysis under the stratification of downstream collisions or fatal and severe collisions. Second, the difference between bicycle collisions under fatal/severe and minor/moderate stratifications is not significant, suggesting that it may not be necessary to separate bicycle collisions by different severity levels. 3.5 Spatial Consistency Next step is to analyze the special consistency. The first question is whether the danger levels for pedestrian and bicyclists are the same at each intersection. Using Figure 7 as an example, the top map shows pedestrian collisions, and the bottom map shows bicycle collisions, and each red bubble represents an intersection along an arterial. The larger the
17
size of the bubble shown on the map indicates a higher level of danger. The largest concentration of collisions shown on the pedestrian collision map is not at the same location as the largest concentration of bicycle collisions, indicating that the most dangerous intersections differ for pedestrians and bicyclists.
Figure 7. Example of Danger Level Consistency
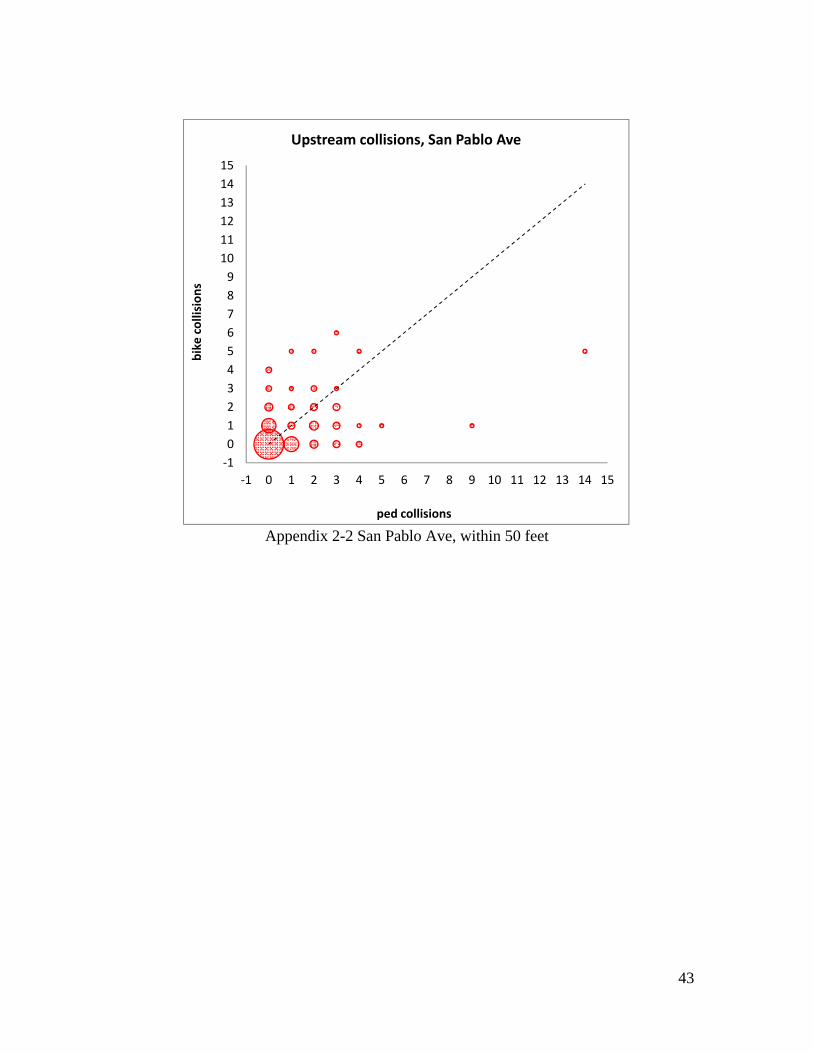
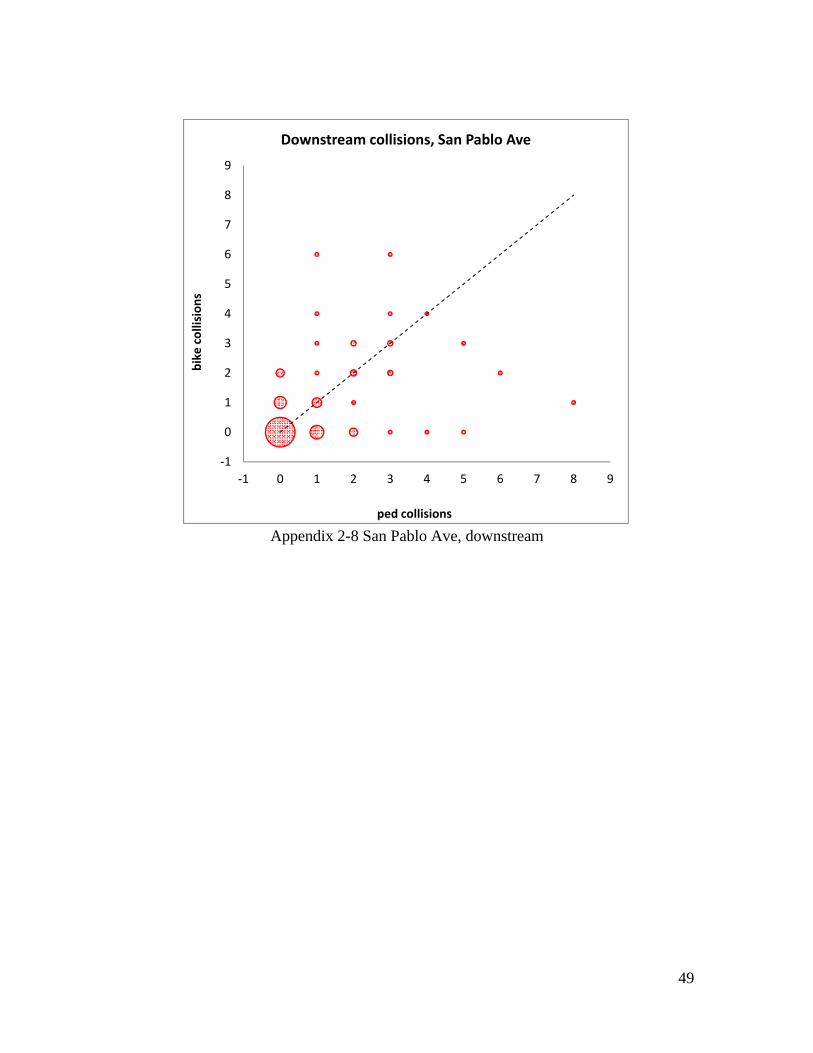
The second question is whether each intersection contributes the same number of pedestrian and bicyclist collisions. Referring to Figure 8 as an example, the bubbles shown in the chart represent intersections. The x axis shows the number of pedestrian collisions that occurred at that intersection, and the y axis shows the number of bicycle collisions at the same intersection. If an intersection experiences the same number of pedestrian and bicyclist collisions, the bubble will appear on the line of x=y. These two figures can be used to check the spatial consistency of collisions.
Figure 8. Example of Crash Number Consistency
Method The following are the steps to develop the figures illustrated above:
‐1
0
1
2
3
4
‐1 0 1 2 3 4
bike collisions
ped collisions
B

18
Step 1: Cluster collisions at their closest intersection Step 2: List intersection ID and its collision count Step 3: Display intersection points on map, using size of points to show number of
collisions Step 4: Conduct the Pearson Chi Square test for the two groups of data in a
comparison Step 5: Create a bubble chart of intersections, using the number of pedestrian and
bicyclist collisions as x and y axis, and the number of intersections to determine the bubble size.
Results Using collision data on San Pablo Avenue and Santa Monica Boulevard as examples, the spatial consistency can be checked using the above method. Different traffic modes for the same stratifications are analyzed, as shown in appendix 2. The danger levels of intersections are different for pedestrians and bicyclists. In addition, most of the intersections do not experience the same number of pedestrian and bicyclist collisions. This analysis can also be applied to the same transportation mode for different stratifications.

19
The P values for the Pearson Chi Square test are shown in Table 5, which demonstrates that the differences between pedestrian and bicyclist collisions for the same stratification are significant at the 95 percent confidence level (except the stratification of fatal/severe collisions, perhaps due to the small sample size for this data. The P values for pedestrian collisions for different stratifications are all smaller than 0.05, indicating that the difference between the comparisons is significant. The differences between bicycle collisions for different stratifications are also significant, except for the stratification of distance to intersections, which means that bicycle collisions occurring within 50 feet of an intersection or beyond 50 feet from an intersection can be combined for analysis. Table 5. P-values of Pearson Chi Square Test to Check Difference between Same Modes
with Different Stratification or Between Different Modes with Same Stratification
Spatial Consistency for San Pablo Avenue (Statistical Significance) Peds/Bike Peds Bike Within 50ft 0.00
0.00 0.31 Over 50ft 0.00
Upstream 0.00 0.00 0.00
Downstream 0.00 Fatal/Severe 0.07
0.00 0.00 Minor/Moderate 0.00
Spatial Consistency for Santa Monica Blvd. (Statistical Significance) Peds/Bike Peds Bike Within 50ft 0.00
0.00 0.00 Over 50ft 0.00 Upstream 0.00
Downstream 0.00 Fatal/Severe 0.31
0.00 0.00 Minor/Moderate 0.02
In summary a stratification system is recommended for categorizing pedestrian and bicyclist collisions, by which different traffic mode collisions can be stratified according to their spatial and outcome related features, and by environmental features such as light and weather conditions. Data can be stratified if the characteristics differ. Pattern evaluation can be used to test the difference between stratifications to determine whether collisions should be separated during analysis. Two spatial pattern evaluations were discussed: spatial distribution and spatial consistency.

20
4 Pedestrian Systemic Monitoring Approach for Road Traffic Safety (PEDSMARTS)
The proposed PEDSMARTS approach is a method to identify high collision concentration locations (HCCL) for pedestrians and bicyclists in order to develop strategies to direct resources toward reducing pedestrian and bicyclist injuries along urban arterials. 4.1 Procedure The procedure to develop these strategies involves the following steps:
1. Count the number of crashes of specific crash type and at a specific type of facility
2. Insert the numbers into a matrix to map the distribution of crashes across all infrastructures (Figure 9)
3. Identify systemic hot spot in the matrix
4. Identify the corresponding cell in the countermeasure matrix (Figure 10) to identify the potential countermeasures which could be implemented for the specific crash type occurring at the specific location type
5. From the countermeasures included in the list (Figure 11), select the appropriate countermeasure which can be implemented throughout all similar locations
4.2 Matrix introduction
Systemic Hot Spot Identification Matrix The systemic hot spot identification matrix is developed based on crash and location types for the selected sites. Figure 9 presents an example for systemic hot spot identification matrix on urban arterials. As shown in the figure, locations are classified into five types based on site features (e.g., intersection or mid-block, ADT, speed, number of lanes, traffic control method, etc.), and the crashes are classified into five types based on crash features (e.g., pedestrian and turning vehicle crashes, speeding, etc.). The number of sites for each location type is summarized in the second row. For example, there are 25 sites for location type 4. The value in each cell (xij) represents the number of type i crashes that occurred at location j. The values in the matrix are highlighted in different colors. The red cells represent the largest number of crashes, while the green cells represent the smallest number of crashes. The total number of crashes for each location type is summarized in the last row and the total number of crashes for each crash type is summarized in the last column. For example, there are 258 pedestrian crashes across all type 2 locations. Based on the data collected at selected sites, the cell with the largest number of crashes is identified as the “systemic hotspot.” In the example shown, the cell for crash type 3 and location type 3 with 98 crashes is identified as the systemic hotspot.

21
Figure 9. Example of the Systemic Hot Spot Identification Matrix
Systemic Countermeasure Matrix The systemic countermeasure matrix is also established based on the crash type and location type described above. As shown in Figure 10, values in each cell (yij) represent potential countermeasures to reduce crash type i for location j. For example, to reduce type 3 crashes at type 3 locations, which were identified as “systemic hotspots” in the previous section, transportation engineers can implement countermeasure 2 or 4, across all type 3 locations (n=51) along the arterial. The detailed attributes for each countermeasure are discussed in the following section.
Figure 10. The Systemic Countermeasure Matrix

22
Countermeasure List The countermeasure list provides a detailed description of the possible countermeasures to reduce pedestrian crashes at the selected sites, as shown in Figure 11. The attributes for each countermeasure include the cost and Crash Modification Factors (CMF) for various types of crashes. The Crash Modification Factors can be used to calculate the potential benefits associated with each countermeasure. Based on the benefit-cost analysis, decision makers can identify preferred countermeasures to implement at selected sites.
Figure 11. The Countermeasure List
4.3 Crash Type and Crash Location Classification In the systemic hot spot identification matrix, crashes and roadway facilities must be classified to correspond to available data, and must also be useful for selecting appropriate countermeasures. Therefore, the research is initiated from two opposite directions. The first is from the recommended countermeasures. From this direction, the appropriate countermeasure to reduce a specific type of crash at a specific type of location can be identified, and the relationships between crash types, facility types, and countermeasures can be determined. Based on this, the corresponding countermeasure matrix can be developed. The second direction is from the existing database. From this direction, useful information to identify crash and facility types is available, from which appropriate countermeasures can be selected. Based on this, the systemic hot spot identification matrix can be developed.
Crash type and Crash Location Information from Countermeasures in PBCAT and Local Manual The Local Roadway Safety-a Manual for California’s Local Road Owners was developed to provide an easy-to-use, straightforward, comprehensive framework of the steps and analysis tools needed to identify locations with roadway safety issues and the appropriate

23
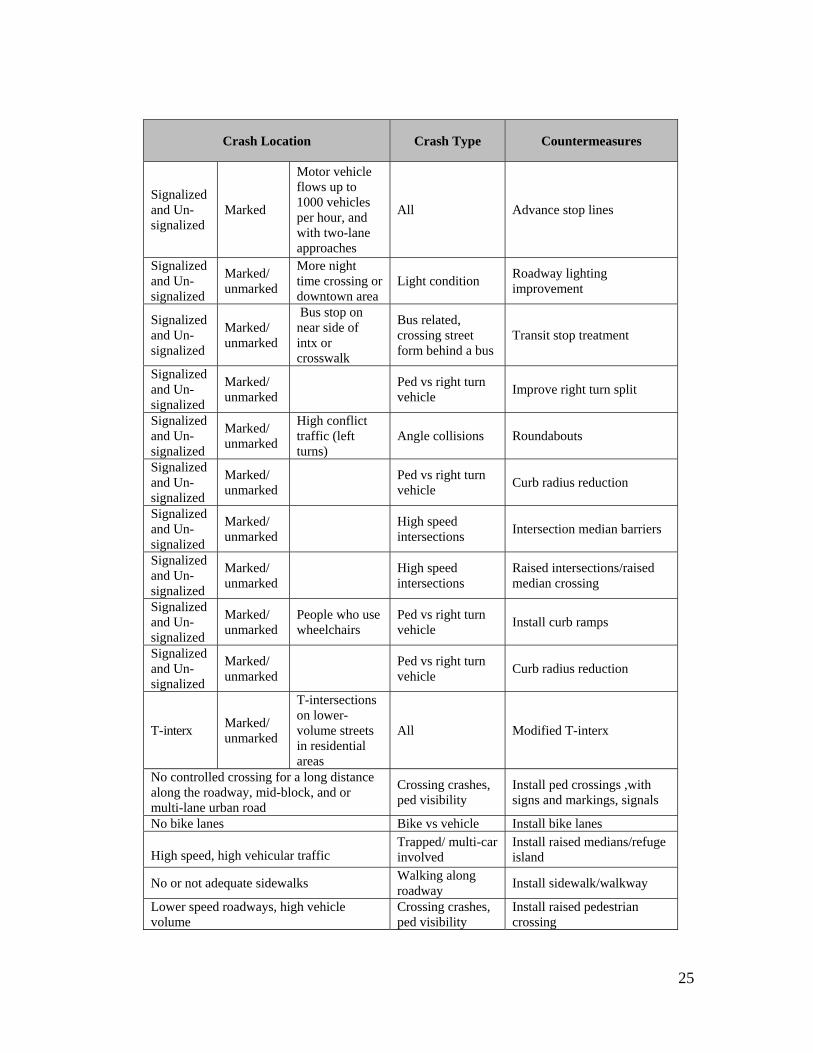
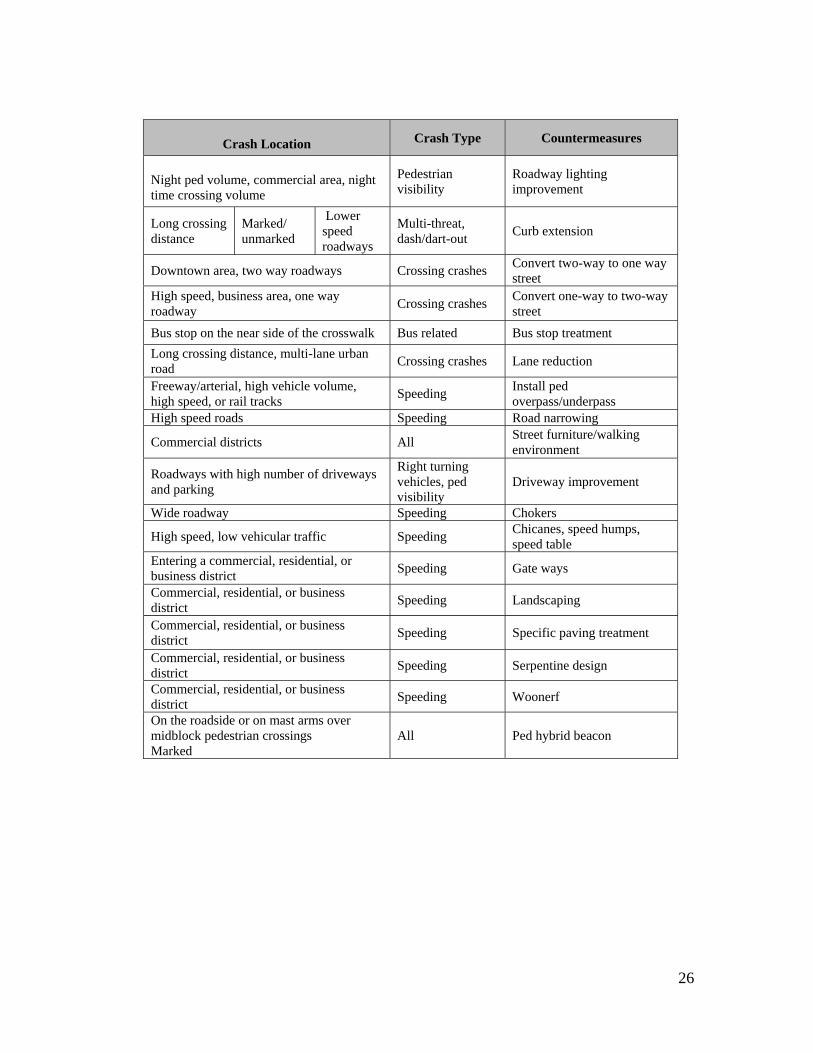
countermeasures (SafeTREC, 2012). In this manual, different recommended countermeasures are listed, with detailed descriptions and guidelines for implementation. Based on this manual, the pedestrian safety countermeasures and their associated crash types and location characteristics are listed in Table 6. In addition to the local manual, the Pedestrian and Bicycle Crash Analysis Tool Version 2.0 guide book was also reviewed. This software develops and analyzes the database containing details associated with crashes between motor vehicles and pedestrians or bicyclists. It uses this data to produce reports and select countermeasures to address the problems identified (David L. Harkey, 2006). In this manual, 49 countermeasures related to pedestrian safety are described in detail regarding purpose, considerations, estimated cost, and case studies. Based on this manual, supplementary information was added to Table 6. In this table, each row represents the specific roadway facility characteristics, the related crash type and the corresponding countermeasure. The crash locations can be classified into two large groups: intersection and roadway segment.

24
Table 6. The Relationship between Crash Type/Location and Countermeasures
Crash Location Crash Type Countermeasures
Signalized Marked Crosswalk
Indicator or not Single vehicle involved
Install Pedestrian countdown signal heads
Signalized Marked Crosswalk
High ped/bike volume
Speeding Install advanced stop bar before crosswalk
Signalized Unmarked crosswalk
No ped sig head, high vehicle turning movements
Ped vs. Turning vehicle
Install Pedestrian countdown signal heads or install crosswalk
Signalized Marked/ unmarked
Freeway/arterial interx, high vehicle volume, high speed, or rail tracks
All Install ped overpass/underpass
Signalized Marked/ unmarked
Limited sight distance, pedestrian interaction
Ped vs. Right turn vehicle
Right turn on red restrictions
Signalized Marked/ unmarked
High ped volume
All Pedestrian-only or pedestrian-lead phase
Signalized Marked/ unmarked
All Information signs on ped push buttons
Signalized Marked/ unmarked
All Push button functioning indicator
Un-signalized
Unmarked
High vehicle volume, school zone, left/right turn pocket
All Install crosswalk (signs and markings)
Un-signalized
Marked/ unmarked
Long crossing distance
Speeding, light condition
Install raised medians/refuge island
Un-signalized
Marked/ unmarked
High ped volume
All Install signal with ped. Signal
Un-signalized
Marked
High traffic volume, school zone, turns pockets
All Install enhanced ped safety features
Un-signalized
Marked/ unmarked
Parking lane, low vehicle speed
Multi threat Curb extension
Un-signalized
Marked/ unmarked
Intersections where volumes do not warrant a stop sign or a signal and intersection of two local streets
High speed intersections
Mini-circles
25
Crash Location Crash Type Countermeasures
Signalized and Un-signalized
Marked
Motor vehicle flows up to 1000 vehicles per hour, and with two-lane approaches
All Advance stop lines
Signalized and Un-signalized
Marked/ unmarked
More night time crossing or downtown area
Light condition Roadway lighting improvement
Signalized and Un-signalized
Marked/ unmarked
Bus stop on near side of intx or crosswalk
Bus related, crossing street form behind a bus
Transit stop treatment
Signalized and Un-signalized
Marked/ unmarked
Ped vs right turn vehicle
Improve right turn split
Signalized and Un-signalized
Marked/ unmarked
High conflict traffic (left turns)
Angle collisions Roundabouts
Signalized and Un-signalized
Marked/ unmarked
Ped vs right turn vehicle
Curb radius reduction
Signalized and Un-signalized
Marked/ unmarked
High speed intersections
Intersection median barriers
Signalized and Un-signalized
Marked/ unmarked
High speed intersections
Raised intersections/raised median crossing
Signalized and Un-signalized
Marked/ unmarked
People who use wheelchairs
Ped vs right turn vehicle
Install curb ramps
Signalized and Un-signalized
Marked/ unmarked
Ped vs right turn vehicle
Curb radius reduction
T-interx Marked/ unmarked
T-intersections on lower-volume streets in residential areas
All Modified T-interx
No controlled crossing for a long distance along the roadway, mid-block, and or multi-lane urban road
Crossing crashes, ped visibility
Install ped crossings ,with signs and markings, signals
No bike lanes Bike vs vehicle Install bike lanes
High speed, high vehicular traffic Trapped/ multi-car involved
Install raised medians/refuge island
No or not adequate sidewalks Walking along roadway
Install sidewalk/walkway
Lower speed roadways, high vehicle volume
Crossing crashes, ped visibility
Install raised pedestrian crossing
26
Crash Location Crash Type Countermeasures
Night ped volume, commercial area, night time crossing volume
Pedestrian visibility
Roadway lighting improvement
Long crossing distance
Marked/ unmarked
Lower speed roadways
Multi-threat, dash/dart-out
Curb extension
Downtown area, two way roadways Crossing crashes Convert two-way to one way street
High speed, business area, one way roadway
Crossing crashes Convert one-way to two-way street
Bus stop on the near side of the crosswalk Bus related Bus stop treatment
Long crossing distance, multi-lane urban road
Crossing crashes Lane reduction
Freeway/arterial, high vehicle volume, high speed, or rail tracks
Speeding Install ped overpass/underpass
High speed roads Speeding Road narrowing
Commercial districts All Street furniture/walking environment
Roadways with high number of driveways and parking
Right turning vehicles, ped visibility
Driveway improvement
Wide roadway Speeding Chokers
High speed, low vehicular traffic Speeding Chicanes, speed humps, speed table
Entering a commercial, residential, or business district
Speeding Gate ways
Commercial, residential, or business district
Speeding Landscaping
Commercial, residential, or business district
Speeding Specific paving treatment
Commercial, residential, or business district
Speeding Serpentine design
Commercial, residential, or business district
Speeding Woonerf
On the roadside or on mast arms over midblock pedestrian crossings Marked
All Ped hybrid beacon
27
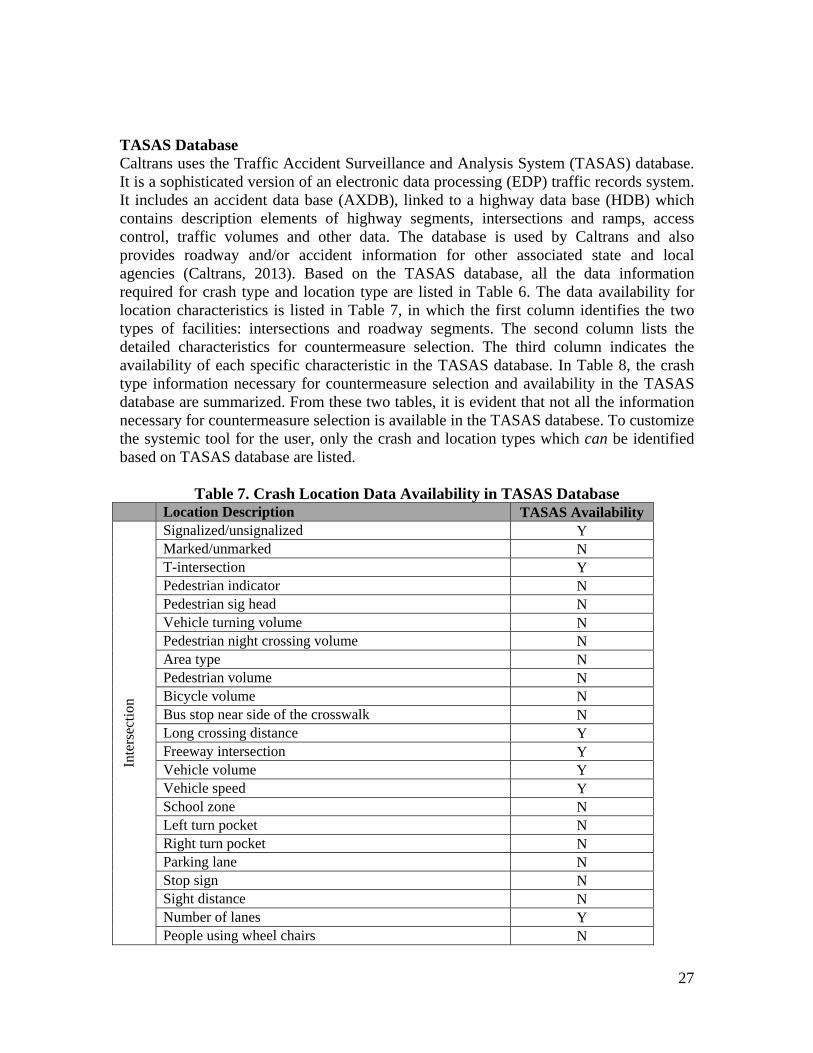
TASAS Database Caltrans uses the Traffic Accident Surveillance and Analysis System (TASAS) database. It is a sophisticated version of an electronic data processing (EDP) traffic records system. It includes an accident data base (AXDB), linked to a highway data base (HDB) which contains description elements of highway segments, intersections and ramps, access control, traffic volumes and other data. The database is used by Caltrans and also provides roadway and/or accident information for other associated state and local agencies (Caltrans, 2013). Based on the TASAS database, all the data information required for crash type and location type are listed in Table 6. The data availability for location characteristics is listed in Table 7, in which the first column identifies the two types of facilities: intersections and roadway segments. The second column lists the detailed characteristics for countermeasure selection. The third column indicates the availability of each specific characteristic in the TASAS database. In Table 8, the crash type information necessary for countermeasure selection and availability in the TASAS database are summarized. From these two tables, it is evident that not all the information necessary for countermeasure selection is available in the TASAS databese. To customize the systemic tool for the user, only the crash and location types which can be identified based on TASAS database are listed.
Table 7. Crash Location Data Availability in TASAS Database Location Description TASAS Availability
Inte
rsec
tion
Signalized/unsignalized Y Marked/unmarked N T-intersection Y Pedestrian indicator N Pedestrian sig head N Vehicle turning volume N Pedestrian night crossing volume N Area type N Pedestrian volume N Bicycle volume N Bus stop near side of the crosswalk N Long crossing distance Y Freeway intersection Y Vehicle volume Y Vehicle speed Y School zone N Left turn pocket N Right turn pocket N Parking lane N Stop sign N Sight distance N Number of lanes Y People using wheel chairs N
28
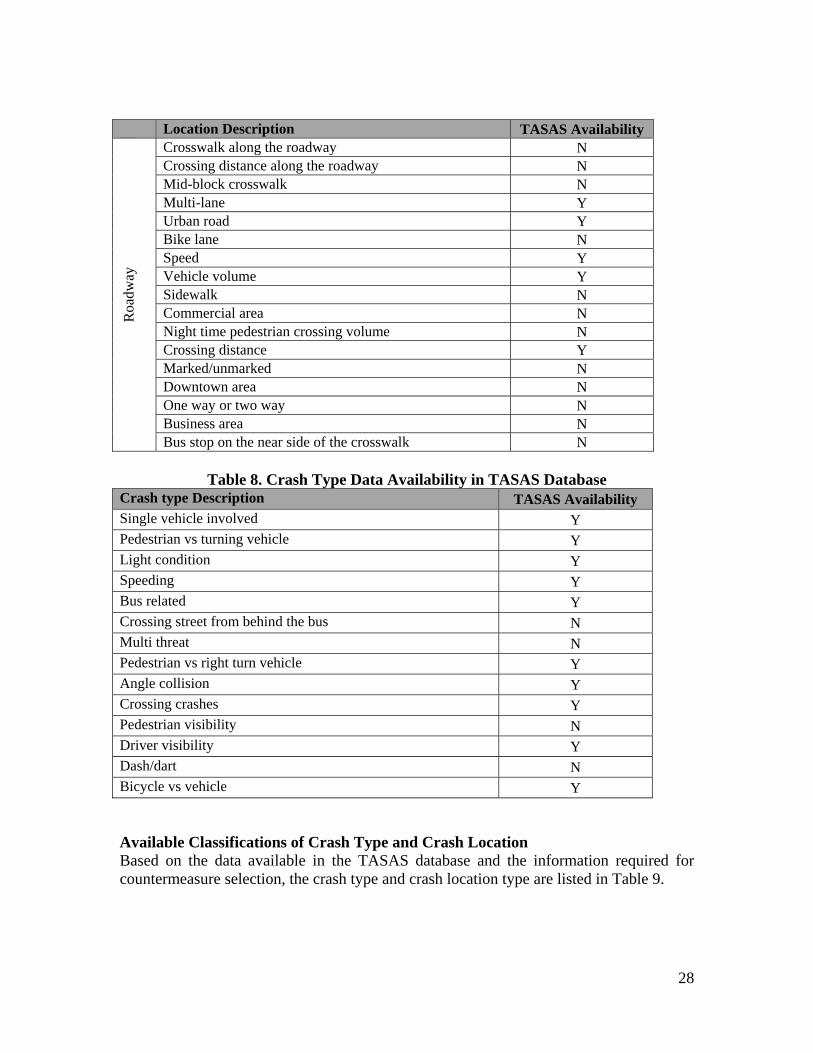
Location Description TASAS Availability R
oadw
ay
Crosswalk along the roadway N Crossing distance along the roadway N Mid-block crosswalk N Multi-lane Y Urban road Y Bike lane N Speed Y Vehicle volume Y Sidewalk N Commercial area N Night time pedestrian crossing volume N Crossing distance Y Marked/unmarked N Downtown area N One way or two way N Business area N Bus stop on the near side of the crosswalk N
Table 8. Crash Type Data Availability in TASAS Database
Crash type Description TASAS Availability Single vehicle involved Y Pedestrian vs turning vehicle Y Light condition Y Speeding Y Bus related Y Crossing street from behind the bus N Multi threat N Pedestrian vs right turn vehicle Y Angle collision Y Crossing crashes Y Pedestrian visibility N Driver visibility Y Dash/dart N Bicycle vs vehicle Y
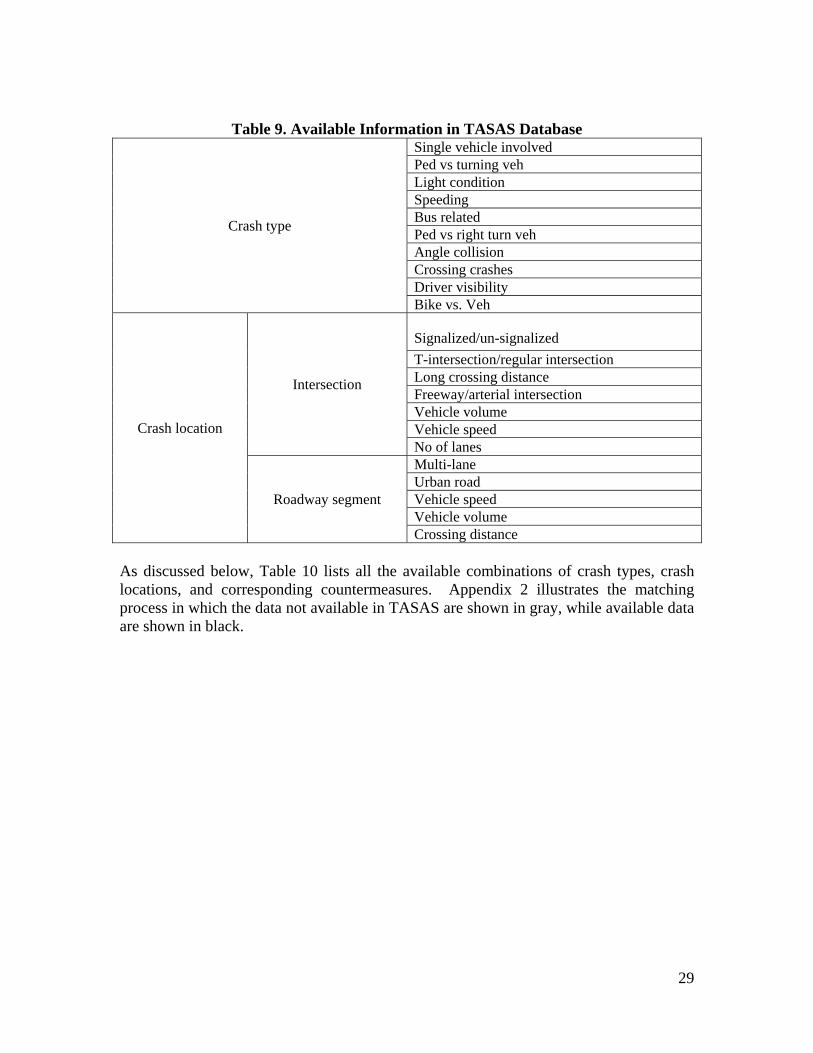
Available Classifications of Crash Type and Crash Location Based on the data available in the TASAS database and the information required for countermeasure selection, the crash type and crash location type are listed in Table 9.
29
Table 9. Available Information in TASAS Database
Crash type
Single vehicle involved Ped vs turning veh Light condition Speeding Bus related Ped vs right turn veh Angle collision Crossing crashes Driver visibility Bike vs. Veh
Crash location
Intersection
Signalized/un-signalized
T-intersection/regular intersection Long crossing distance Freeway/arterial intersection Vehicle volume Vehicle speed No of lanes
Roadway segment
Multi-lane Urban road Vehicle speed Vehicle volume Crossing distance
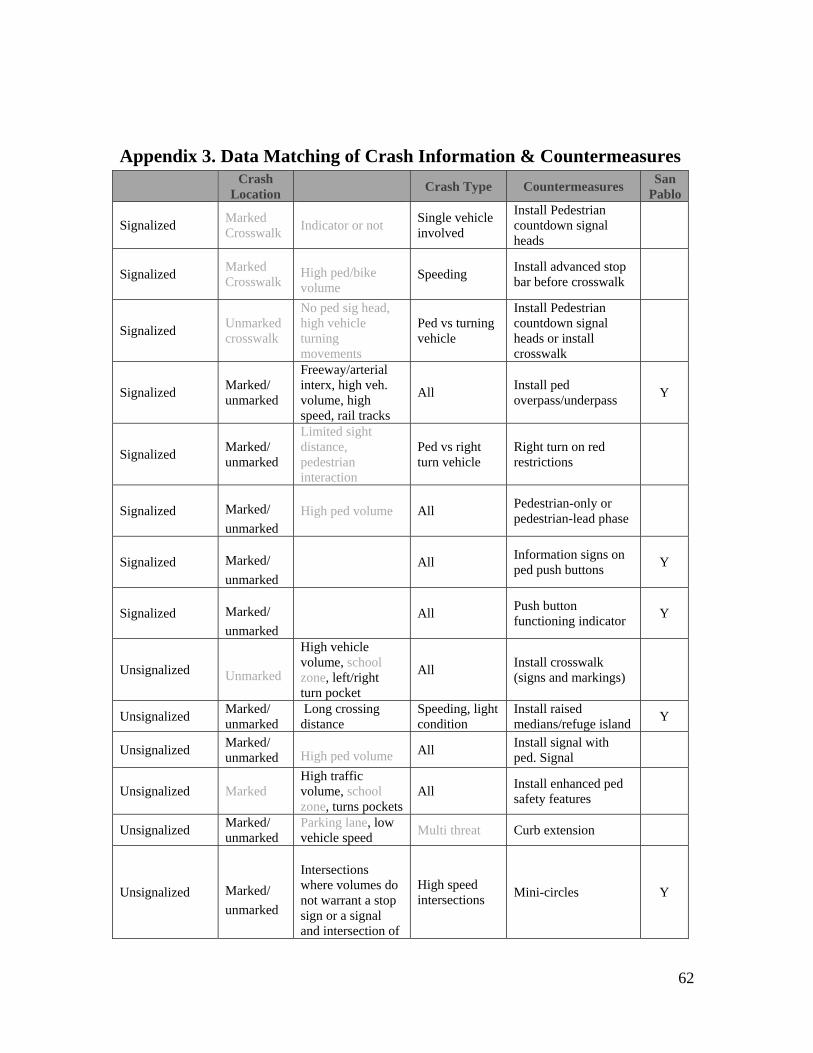
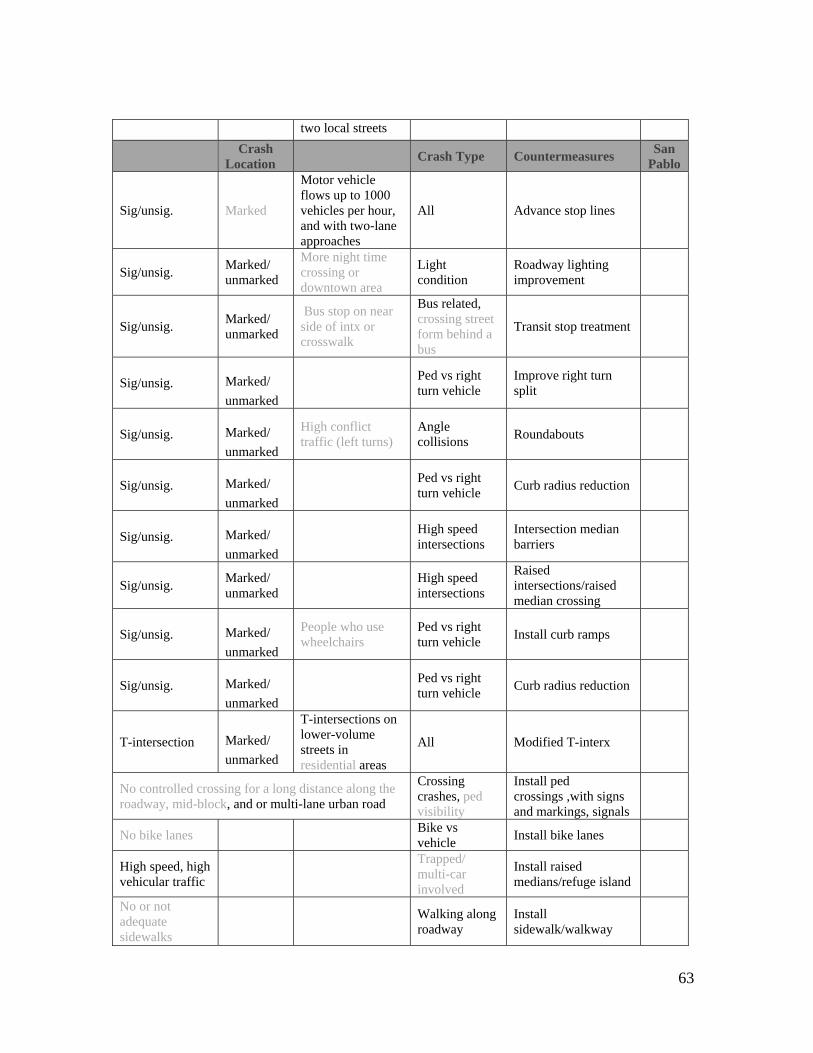
As discussed below, Table 10 lists all the available combinations of crash types, crash locations, and corresponding countermeasures. Appendix 2 illustrates the matching process in which the data not available in TASAS are shown in gray, while available data are shown in black.

30
Table 10. Usable Combination of Crash Types, Crash Locations, and Corresponding Countermeasures
Crash Location Crash Type Countermeasures
Inte
rsec
tion
s
Signalized Marked/ unmarked
Freeway/arterial interx, high vehicle volume, high speed, or rail tracks
All Install ped overpass/underpass
Signalized Marked/ unmarked
All Information signs on ped push buttons
Signalized Marked /unmarked
All Push button functioning indicator
Un-signalized Marked/ unmarked
Long crossing distance Speeding, light condition
Install raised medians/refuge island
Un-signalized Marked/ unmarked
Intersections where volumes do not warrant a stop sign or a signal and intersection of two local streets
High speed intersections
Mini-circles
Signalized and un-signalized
Marked/ unmarked
Ped vs right turn vehicle
Improve right turn split
Signalized and un-signalized
Marked/ unmarked
Ped vs right turn vehicle
Curb radius reduction
Signalized and un-signalized
Marked/ unmarked
High speed intersections
Intersection median barriers
Signalized and un-signalized
Marked /unmarked
High speed intersections
Raised intersections/raised median crossing
Signalized and un-signalized
Marked/ unmarked
Ped vs right turn vehicle
Curb radius reduction
Roa
dway
seg
men
t
Long crossing distance, multi-lane urban road
Crossing crashes
Lane reduction
Freeway/arterial, high vehicle volume, high speed, or rail tracks
Speeding Install ped overpass/underpass
High speed roads
Speeding Road narrowing
Wide roadway Speeding Chokers
High speed, low vehicular traffic
Speeding Chicanes, speed humps, speed table

31
Identifying the crash types and crash locations Based on Table 10, the crash types could be the combination of the types below:
1. Speeding or not
2. Light condition or not
3. Pedestrian vs. right turn vehicles or not
4. Crossing crashes or not
The crash location types could be the combination of the types below:
1. Signalized intersection or not
2. Wide road or not
3. Arterial road or not
4. High speed road or not
5. High volume road or not
6. Multi-lane road or not
Before developing the matrix, it should be determined whether the location type can divide the system into separate groups. For example, if the target is a corridor in an urban area, and all the road segments on it are multi-lane and arterial, then the two types “multi-lane or not” and “arterial road or not” are not effective for separating the road segments.
The location groups for roadway segment are:
Road segments with speed limit higher than 35 mph and narrow
Road segments with speed limit higher than 35 mph and wide
Road segments with speed limit lower than 35 mph and narrow
Road segments with speed limit lower than 35 mph and wide
The location groups for intersection are:
Un-signalized intersection with speed limit higher than 35 mph and narrow
Un-signalized intersection with speed limit higher than 35 mph and wide
Un-signalized intersection with speed limit lower than 35 mph and narrow
Un-signalized intersection with speed limit lower than 35 mph and wide
Signalized intersection with speed limit higher than 35 mph and narrow
Signalized intersection with speed limit higher than 35 mph and wide
Signalized intersection with speed limit lower than 35 mph and narrow
Signalized intersection with speed limit lower than 35 mph and wide

32
4.4 Case Study PEDSMARTS was applied to pedestrian systemic safety analysis for San Pablo Ave in California, from the intersection of Cutting Blvd. and San Pablo Ave. to the intersection of 35th St. and San Pablo Ave. The study section is comprised of 127 intersections and 30 road segments recorded in the TASAS database. There were 160 pedestrian collisions that occurred along this section of the roadway from 2002 to 2009, 67 of which occurred at intersections and 93 at road segments.
Step 1—Identifying crash types and location types Based on the method introduced in previous section, the first step is to check the database and determine the feasible crash and location types. For San Pablo Ave., all road segments are arterial and multi-lane. The AADT on this roadway is greater than 25,000, thererore location types 3, 5, and 6 are not useful for San Pablo Ave. The posted speed is either 35 or 40 mph, it is considered a high speed road. The road width is greater than 70 feet. The results are listed below.
Table 11. Crash Types and Crash Locations
Intersection
Crash types
Crashes with right turning vehicle Crashes with unsafe speed Crashes with pedestrian right of way in cross walk Crashes with pedestrian violation in cross walk Crashes with pedestrian violation not in cross walk Other than above
Location types
Un-signalized intersection with speed limit higher than 35 mph and narrow Un-signalized intersection with speed limit higher than 35 mph and wide Un-signalized intersection with speed limit lower than 35 mph and narrow Un-signalized intersection with speed limit lower than 35 mph and wide Signalized intersection with speed limit higher than 35 mph and narrow Signalized intersection with speed limit higher than 35 mph and wide Signalized intersection with speed limit lower than 35 mph and narrow Signalized intersection with speed limit lower than 35 mph and wide
Road segment
Crash types
Crashes with pedestrian right of way crossing in crosswalk Crashes with pedestrian right of way crossing not in crosswalk Crashes with pedestrian violation crossing in crosswalk Crashes with pedestrian violation crossing not in crosswalk Crashes with unsafe speed crossing in crosswalk Crashes with unsafe speed crossing not in crosswalk Other than above
Location types
Road segments with speed limit higher than 35 mph and narrow Road segments with speed limit higher than 35 mph and wide Road segments with speed limit lower than 35 mph and narrow Road segments with speed limit lower than 35 mph and wide

33
Step 2—Develop the Matrices and Input Data As was discussed previously in the matrices section, crash and location types identified in Step 1 are used to build the “systemic hot spot identification matrix” as shown in Figure 12. Then the number of crashes corresponding to each combination of crash type and location type are calculated and inserted into the matrix. Crash numbers are highlighted in different colors from green to red, indicating the numbers from smallest to largest. In addition, a systemic hot spot matrix can be developed for road segments as shown in Figure 13.
Figure 12. Systemic Hot Spots Identification Matrix for Intersections

34
Figure 13. Systemic Hot Spots Identification Matrix for Road Segments
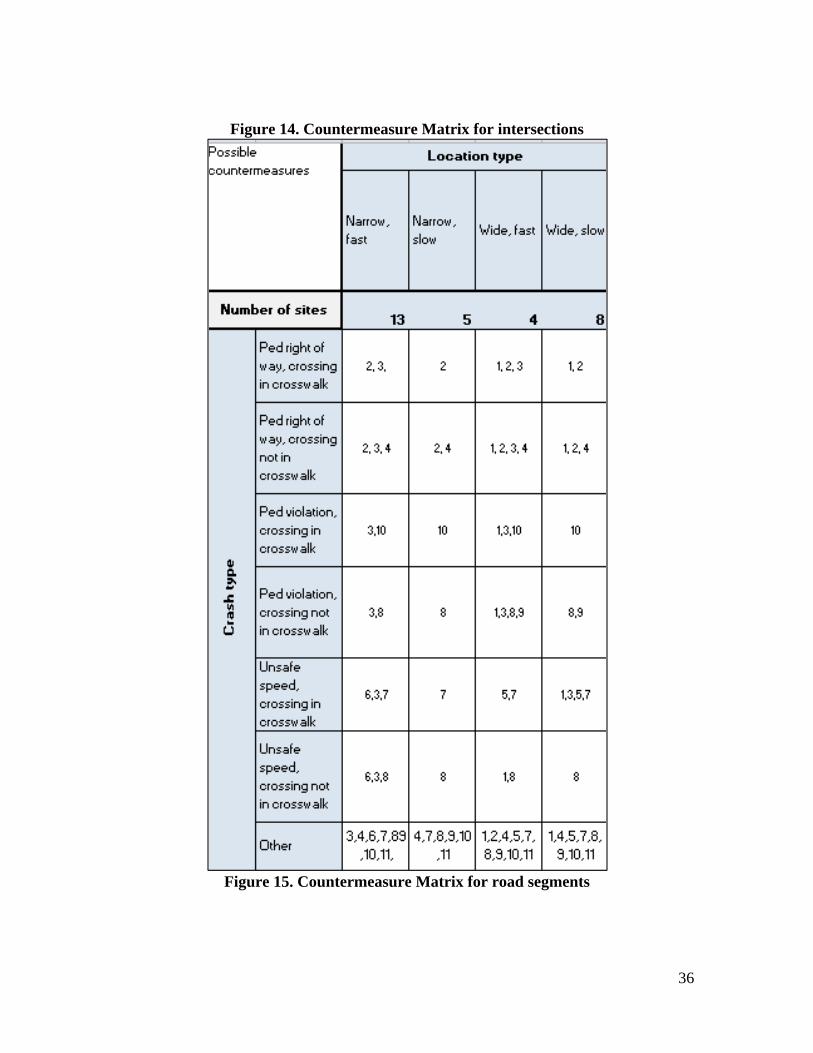
Step 3—Identify Corresponding Safety Countermeasures for Systemic Hot Spots Based on the data in the first matrix, the different types of collisions are distributed across various types of facilities. Each cell in the matrix relates to the corresponding safety countermeasures shown in the countermeasure matrix, Figure 14. For example, to reduce the eight collisions of crash type 3 that occurred at location type 5 (see Figure 12), the potential safety countermeasure could be either number 5, 8, or 12 which are located in the same cell as crash type 3 at location type 5 (see Figure 14). The countermeasure matrix for road segments are shown in figure 15.

35
36
Figure 14. Countermeasure Matrix for intersections
Figure 15. Countermeasure Matrix for road segments

37
Step 4—Select Potential Countermeasures Based on the results from the countermeasure table, there will be several appropriate potential countermeasures from which to choose. In addition to the consideration of crash modification factors for each countermeasure, it is important to keep in mind that the systemic countermeasures will be implemented throughout all similar locations, and that certain countermeasures will have economic scale benefits if they are implemented simultaneously. A typical table as shown in Figure 16 could be developed to identify the most appropriate countermeasures installed systemically over a corridor, based on the cost and crash modification factors of the proposed countermeasures.
Figure 16. Countermeasure List for intersections

38
Figure 17. Countermeasure List for road segments

39
5 Conclusions and Recommendations This chapter summarizes the results of this study and the recommendations. 5.1 Conclusions A database including all VRU collisions was constructed using Statewide Integrated Traffic Records System (SWITRS) data maintained by the California Highway Patrol (CHP). The database includes all pedestrian and bicycle collisions from 1998 to 2007. Each collision was geocoded and matched to the closest intersection. A stratification system was recommended. Different traffic modes collisions can be stratified according to their spatial related features and outcome related features, or by their environmental features such as light and weather conditions. A systemic approach was developed for pedestrian safety along urban arterials. Applying this method, users can identify systemic hotspots which share the same high risk characteristics and specific crash types. Then the systemic countermeasures can be selected and implemented throughout all similar types of locations. 5.2 Recommendations Data can be stratified according to the stratification method described in this report, if the characteristics are different. Pattern evaluation can test the difference between stratifications to determine whether collisions should be separated during analysis. This report offers two spatial pattern evaluations— spatial distribution and spatial consistency. Researchers also recommend that Caltrans utilize the method proposed in this research to study pedestrian/bicycle crashes on state arterial roadways. The systemic approach is valuable for facilities that have relatively low crash frequencies and are therefore less likely to be flagged as hotspots and be considered for safety improvements. Systemic improvements typically have a lower per-site cost as they are implemented at multiple locations across a network.

40
References Safe Transportation Research and Education Center, University of California at Berkeley. 2012. Local roadway safety—a manual for California’s local road owners, version 1.0. California Department of Transportation. David L. Harkey, Sean Tsai, Libby Thomas, and William W. Hunter. 2006. Pedestrian and bicycle crash analysis tool (PBCAT): version 2.0 application manual. Federal Highway Administration Office of Safety Research and Development. Caltrans. 2013. Traffic Manual (current version). http://www.dot.ca.gov/hq/traffops/signtech/signdel/trafficmanual-current.htm Accessed on June 12, 2013.

41
Appendices Appendix 1. Photographs of VRU Arterials Along San Pablo Avenue
42
Appendix 2. Level of danger consistency and number of collision consistency
Appendix 2-1 San Pablo Ave, within 50 feet
pedestrian bicyclist
43
Appendix 2-2 San Pablo Ave, within 50 feet
‐1
0
1
2
3
4
5
6
7
8
9
10
11
12
13
14
15
‐1 0 1 2 3 4 5 6 7 8 9 10 11 12 13 14 15
bike collisions
ped collisions
Upstream collisions, San Pablo Ave

44
Appendix 2-3 San Pablo Ave, over 50 feet
pedestrian bicyclist

45
Appendix 2-4 San Pablo Ave, over 50 feet of each intersection
‐1
0
1
2
3
4
5
6
7
8
9
10
11
12
13
14
15
‐1 0 1 2 3 4 5 6 7 8 9 10 11 12 13 14 15
bike collisions
ped collisions
Collisions 50+ ft. from intersections , San Pablo Ave

46
Appendix 2-5 San Pablo Ave, upstream
pedestrian bicyclist

47
Appendix 2-6 San Pablo Ave, upstream
‐1
0
1
2
3
4
5
6
7
8
9
10
11
12
13
14
15
‐1 0 1 2 3 4 5 6 7 8 9 10 11 12 13 14 15
bike collisions
ped collisions
Upstream collisions, San Pablo Ave
48
Appendix 2-7 San Pablo Ave, downstream
pedestrian bicyclist
49
Appendix 2-8 San Pablo Ave, downstream
‐1
0
1
2
3
4
5
6
7
8
9
‐1 0 1 2 3 4 5 6 7 8 9
bike collisions
ped collisions
Downstream collisions, San Pablo Ave
50
Appendix 2-9 San Pablo Ave, fatal and severe
pedestrian bicyclist

51
Appendix 2-10 San Pablo Ave, fatal and severe
‐1
0
1
2
3
4
‐1 0 1 2 3 4
bike collisions
ped collisions
Fatal and severe collisions, San Pablo Ave
52
Appendix 2-11 San Pablo Ave, minor and moderate
pedestrian bicyclist

53
Appendix 2-12 San Pablo Ave, minor and moderate
‐1
0
1
2
3
4
5
6
7
8
9
10
11
12
13
14
15
‐1 0 1 2 3 4 5 6 7 8 9 10 11 12 13 14 15
bike collisions
ped collisions
Minor to moderate collisions, San Pablo Ave
54
Appendix 2-13 Santa Monica Blvd, within 50 feet
Pedestrian
Bicyclist

55
Appendix 2-14 Santa Monica Blvd, within 50 feet
56
Appendix 2-15 Santa Monica Blvd, over 50 feet
Pedestrian
Bicyclist
57
Appendix 2-16 Santa Monica Blvd, over 50 feet
58
Appendix 2-17 Santa Monica Blvd, fatal and severe
Pedestrian
Bicyclist

59
Appendix 2-18 Santa Monica Blvd,, fatal and severe

60
Appendix 2-19 Santa Monica Blvd,, minor and moderate
Pedestrian
Bicyclist

61
Appendix 2-18 Santa Monica Blvd,, minor and moderate
62
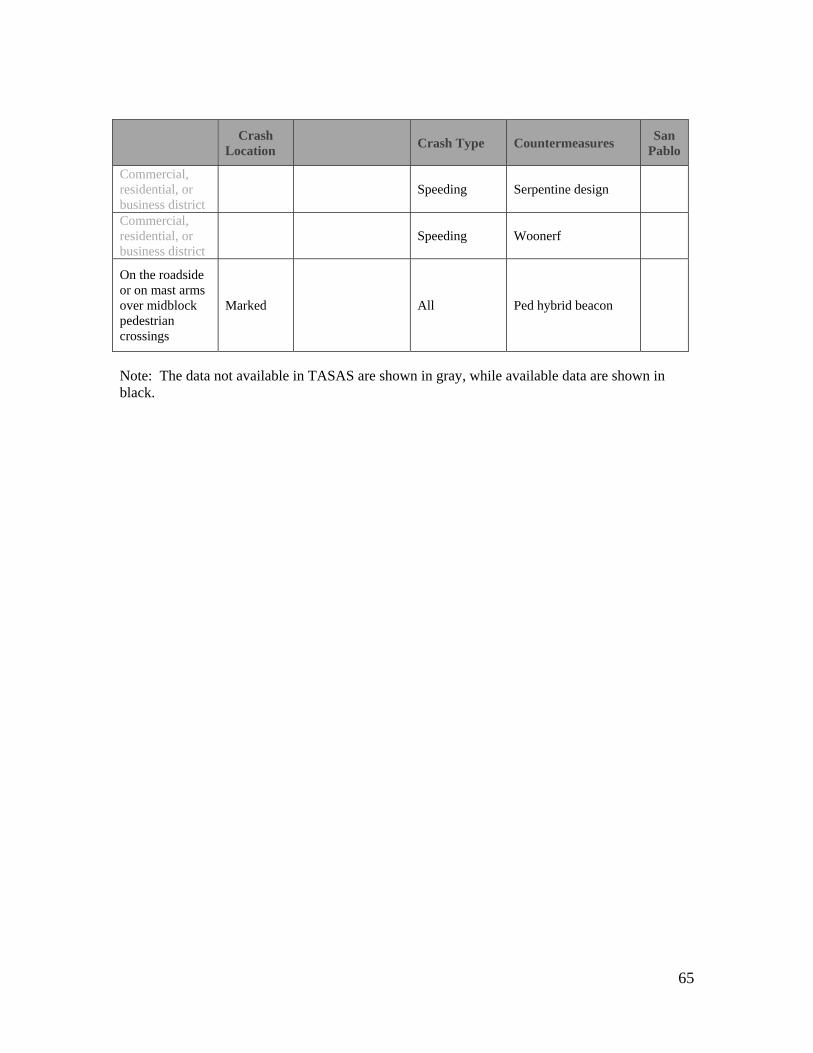
Appendix 3. Data Matching of Crash Information & Countermeasures
Crash
Location Crash Type Countermeasures
San Pablo
Signalized Marked Crosswalk
Indicator or not Single vehicle involved
Install Pedestrian countdown signal heads
Signalized Marked Crosswalk
High ped/bike volume
Speeding Install advanced stop bar before crosswalk
Signalized Unmarked crosswalk
No ped sig head, high vehicle turning movements
Ped vs turning vehicle
Install Pedestrian countdown signal heads or install crosswalk
Signalized Marked/ unmarked
Freeway/arterial interx, high veh. volume, high speed, rail tracks
All Install ped overpass/underpass
Y
Signalized Marked/ unmarked
Limited sight distance, pedestrian interaction
Ped vs right turn vehicle
Right turn on red restrictions
Signalized Marked/
unmarked High ped volume All
Pedestrian-only or pedestrian-lead phase
Signalized Marked/
unmarked
All Information signs on ped push buttons
Y
Signalized Marked/
unmarked
All Push button functioning indicator
Y
Unsignalized Unmarked
High vehicle volume, school zone, left/right turn pocket
All Install crosswalk (signs and markings)
Unsignalized Marked/ unmarked
Long crossing distance
Speeding, light condition
Install raised medians/refuge island
Y
Unsignalized Marked/ unmarked High ped volume All
Install signal with ped. Signal
Unsignalized Marked High traffic volume, school zone, turns pockets
All Install enhanced ped safety features
Unsignalized Marked/ unmarked
Parking lane, low vehicle speed
Multi threat Curb extension
Unsignalized Marked/
unmarked
Intersections where volumes do not warrant a stop sign or a signal and intersection of
High speed intersections
Mini-circles Y
63
two local streets
Crash
Location Crash Type Countermeasures
San Pablo
Sig/unsig. Marked
Motor vehicle flows up to 1000 vehicles per hour, and with two-lane approaches
All Advance stop lines
Sig/unsig. Marked/ unmarked
More night time crossing or downtown area
Light condition
Roadway lighting improvement
Sig/unsig. Marked/ unmarked
Bus stop on near side of intx or crosswalk
Bus related, crossing street form behind a bus
Transit stop treatment
Sig/unsig. Marked/
unmarked
Ped vs right turn vehicle
Improve right turn split
Sig/unsig. Marked/
unmarked
High conflict traffic (left turns)
Angle collisions
Roundabouts
Sig/unsig. Marked/
unmarked
Ped vs right turn vehicle
Curb radius reduction
Sig/unsig. Marked/
unmarked
High speed intersections
Intersection median barriers
Sig/unsig. Marked/ unmarked
High speed intersections
Raised intersections/raised median crossing
Sig/unsig. Marked/
unmarked
People who use wheelchairs
Ped vs right turn vehicle
Install curb ramps
Sig/unsig. Marked/
unmarked
Ped vs right turn vehicle
Curb radius reduction
T-intersection Marked/
unmarked
T-intersections on lower-volume streets in residential areas
All Modified T-interx
No controlled crossing for a long distance along the roadway, mid-block, and or multi-lane urban road
Crossing crashes, ped visibility
Install ped crossings ,with signs and markings, signals
No bike lanes Bike vs vehicle
Install bike lanes
High speed, high vehicular traffic
Trapped/ multi-car involved
Install raised medians/refuge island
No or not adequate sidewalks
Walking along roadway
Install sidewalk/walkway

64
Crash
Location Crash Type Countermeasures
San Pablo
Lower speed roadways, high vehicle volume
Crossing crashes, ped visibility
Install raised pedestrian crossing
Night ped volume, commercial area, night time crossing volume
Pedestrian visibility
Roadway lighting improvement
Long crossing distance
Marked/ unmarked
Lower speed roadways
Multi-threat, dash/dart-out
Curb extension
Downtown area, two way roadways
Crossing crashes
Convert two-way to one way street
High speed, business area, one way roadway
Crossing crashes
Convert one-way to two-way street
Bus stop on the near side of the crosswalk
Bus related Bus stop treatment
Long crossing distance, multi-lane urban road Crossing crashes
Lane reduction Y
Freeway/arterial, high vehicle volume, high speed, or rail tracks
Speeding Install ped overpass/underpass
Y
High speed roads
Speeding Road narrowing Y
Commercial districts
All Street furniture/walking environment
Y
Roadways with high number of driveways and parking
Right turning vehicles, ped visibility
Driveway improvement
Wide roadway Speeding Chokers Y High speed, low vehicular traffic
Speeding Chicanes, speed humps, speed table
Y
Entering a commercial, residential, or business district
Speeding Gate ways
Commercial, residential, or business district
Speeding Landscaping
Commercial, residential, or business district
Speeding Specific paving treatment
65
Crash
Location Crash Type Countermeasures
San Pablo
Commercial, residential, or business district
Speeding Serpentine design
Commercial, residential, or business district
Speeding Woonerf
On the roadside or on mast arms over midblock pedestrian crossings
Marked All Ped hybrid beacon
Note: The data not available in TASAS are shown in gray, while available data are shown in black.