5 harmonics tutorial 4 3 related to 1 southwestern
TRANSCRIPT

Shawnee Power Consulting, LLC, P.O. Box 3123, Williamsburg, VA 23187
-5
-4
-3
-2
-1
0
1
2
3
4
5
0 0.01 0.02 0.03 0.04 0.05 0.06 0.07 0.08 0.09 0.1
SPC SHAWNEE POWER CONSULTINGLLC
HARMONICS TUTORIAL
RELATED TO
SOUTHWESTERN CONNECTICUT ELECTRICRELIABILITY PROJECT
forforforforNortheast Utilities Service CompanyNortheast Utilities Service CompanyNortheast Utilities Service CompanyNortheast Utilities Service Company
SPC01-04
Prepared by:
W. Edward Reid, PE – Qual-Tech Engineers, Inc.Stephen R. Lambert, P.E. – Shawnee Power Consulting, LLC
17 February 2004

HARMONICS TUTORIAL RELATED TO
SOUTHWESTERN CONNECTICUT ELECTRIC RELIABILITY PROJECT
– TABLE OF CONTENTS –
Page 1.0 INTRODUCTION 1 1.1 Background 1 1.2 Harmonic Distortion Basics 1 1.3 Harmonic Distortion Limits 12 1.4 Measuring Harmonic Distortion 12 2.0 NORWALK – 345 KV SYSTEM UPGRADE 15 2.1 Basic Information 15 2.2 Detailed System Study – Impedance Scans 17 2.3 Sources of Harmonic Distortion 20 2.4 Cross Sound Cable Project 22 2.5 Other Locations 25 3.0 OTHER HARMONIC-RELATED ISSUES 27 4.0 EXECUTIVE SUMMARY 28

1.0 INTRODUCTION 1.1 Background Northeast Utilities is planning to enhance the power supply network into Southwest Connecticut by adding two 345 kV transmission lines. They are Bethel to Norwalk (20 Miles) and Middletown to Norwalk (70 miles). It is planned that some significant part of each line would be composed of 345 kV cable. The Phase 1 portion of the project (Bethel to Norwalk) has been approved for implementation, but Phase 2 (Middletown to Norwalk) is still under evaluation. A key technical aspect of these two lines is the amount of capacitive Mvar that would be added to the 345 kV network. The lengths of cable under consideration would result in high levels of capacitive Mvar, which would result in system natural frequencies that would be quite low. This characteristic can have a significant impact on system harmonic distortion, switching transients, and 60 Hz voltage rise. 1.2 Harmonic Distortion Basics Harmonic distortion on the power system is basically caused by the use of electronically controlled devices (such as rectifiers and power controllers), arcing loads (such as arc furnaces and arc welders), and magnetic devices (such as rotating ac machinery and transformers). These devices tend to have fairly well defined harmonic current characteristics; however, the voltage distortion is a function of the device current characteristic and the system impedance (V = I x Z). An example is used here to illustrate the concepts. A typical rectifier circuit is illustrated in Figure 1.1 for converting from three-phase ac to dc. A theoretical ac waveform is illustrated in the bottom of the figure for a zero ac system impedance and an infinite dc impedance. This rectangular wave shape is composed of the following integer multiples of the fundamental frequency: 1, 5, 7, 11, 13, 17, 19, etc. Actual waveforms associated with a 6-pulse thyristor-controlled rectifier are illustrated in Figure 1.2. The ac current waveform is at the top of the figure. The voltages on both sides of the transformer are shown in the bottom waveforms. The voltage distortion is highest on the secondary of the transformer near to the rectifier. The voltage distortion is lower the farther away from the rectifier that one gets electrically. (This is true on a system that does not have capacitors.) Figure 1.3 illustrates the waveform on the primary of the transformer when a capacitor bank is added; and Figure 1.4 illustrates the waveform on the primary of the transformer when a filter bank is added. With the capacitor bank the voltage distortion increased from 4.1% to 8.1% due to a resonance at the 5th harmonic. When a properly designed filter bank was used the voltage distortion was reduced to 1.6%. (The filter bank was designed to provide capacitive vars and control harmonic distortion.) For this example, a simple circuit is illustrated in the top of Figure 1.5. An equivalent of that circuit is given below for making harmonic calculations. The rectifier is shown as a current source, and the impedances of the source and the transformer are predominantly inductive. As stated above, most harmonic sources can be viewed as a current source. The system source voltage is shown as a short, since it is not a source of distortion in this example. The ohms-law equations are also given in the figure. From the equations, one can see that the voltage distortion
Page 1 Version 2.0

at Vs will always be larger than at Vp due to the relative equivalent impedance at each point. This observation agrees with the waveforms in Figure 1.2. In Figure 1.6, the capacitor bank is added to the circuit and the equation for the impedance at the primary of the transformer is given. In examining the equation, it is clear that when Xs = Xc, the equivalent impedance would go to infinity. (It would actually be limited by the equivalent resistance of the system.) The equation at the bottom of the figure indicates that when the impedance becomes very high and there is a significant current at that frequency, then the voltage (Vp) at that frequency could also be high. The system impedance with and without the capacitor is illustrated in Figure 1.7 for the previous example. With the capacitor, the system impedance is quite high near to the 5th harmonic (or 300 Hz). If there is any significant 5th harmonic current, then a significant 5th harmonic voltage could occur, such as in Figure 1.3. The basic equations associated with resonance are given in Figure 1.8. The resonance can be estimated from knowing the MVAsc and the Mvar for a simple system as is illustrated here. When a filter bank is used, the equivalent circuit and the resulting system impedance scan are illustrated in Figure 1.9. For reference, the key equations associated with this configuration are given in Figure 1.10. In the is particular case the filter was tuned to near the 5th harmonic which moved the system resonance to a frequency range (below the 5th harmonic) which typically would not have any significant current distortion. In conclusion, knowing the system impedance characteristic and the harmonic current injected at that point in the system would allow the voltage distortion to be calculated. (In practice, systems are often more complicated that in this example.)
Page 2 Version 2.0

Figure 1.1
Page 3 Version 2.0
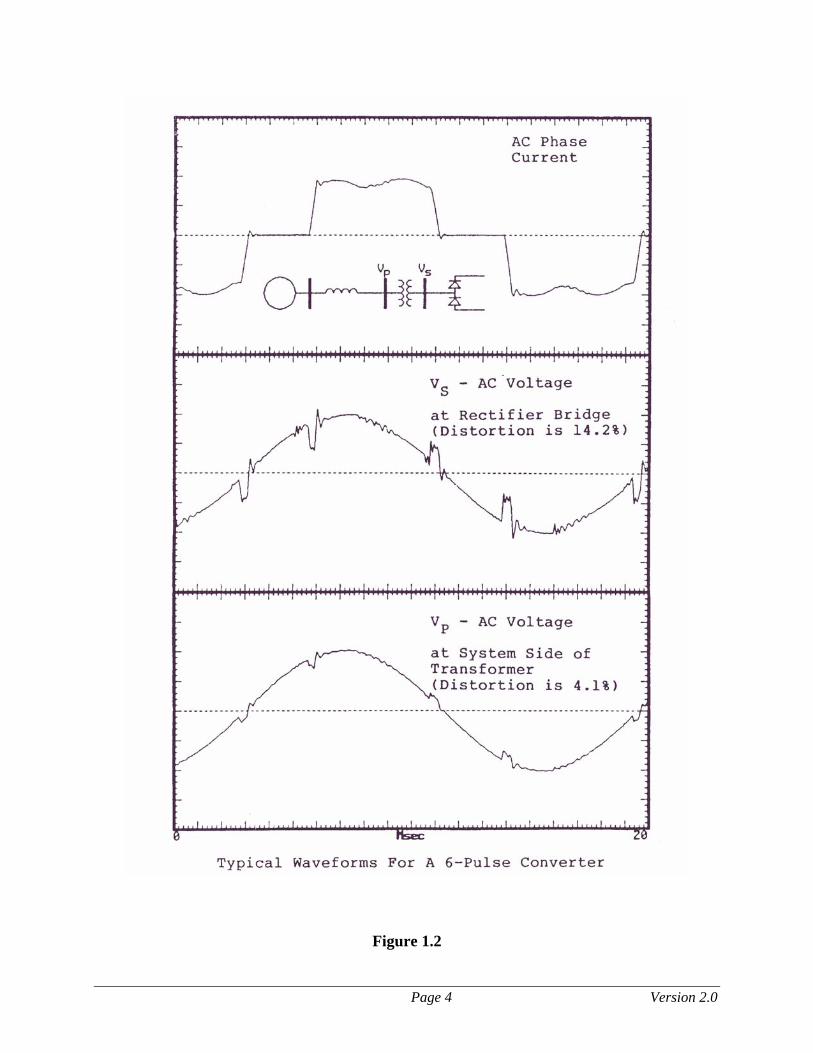
Figure 1.2
Page 4 Version 2.0

Figure 1.3
Figure 1.4
Page 5 Version 2.0

Figure 1.5
Page 6 Version 2.0

Figure 1.6
Page 7 Version 2.0

Figure 1.7
Page 8 Version 2.0

Figure 1.8
Page 9 Version 2.0

Figure 1.9
Page 10 Version 2.0

Figure 1.10
Page 11 Version 2.0
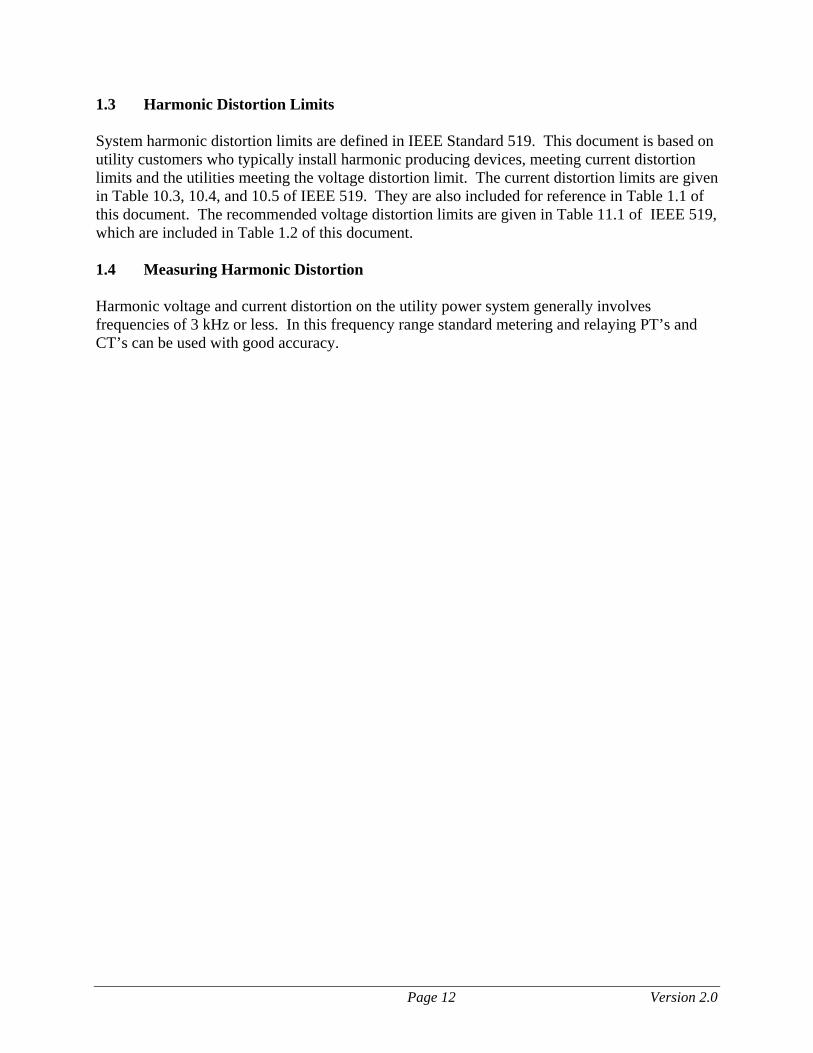
1.3 Harmonic Distortion Limits System harmonic distortion limits are defined in IEEE Standard 519. This document is based on utility customers who typically install harmonic producing devices, meeting current distortion limits and the utilities meeting the voltage distortion limit. The current distortion limits are given in Table 10.3, 10.4, and 10.5 of IEEE 519. They are also included for reference in Table 1.1 of this document. The recommended voltage distortion limits are given in Table 11.1 of IEEE 519, which are included in Table 1.2 of this document. 1.4 Measuring Harmonic Distortion Harmonic voltage and current distortion on the utility power system generally involves frequencies of 3 kHz or less. In this frequency range standard metering and relaying PT’s and CT’s can be used with good accuracy.
Page 12 Version 2.0

Table 1.1
Page 13 Version 2.0

Table 1.2
Page 14 Version 2.0

2.0 NORWALK – 345 KV SYSTEM UPGRADE
2.1 Basic Information As noted above, Northeast Utilities is planning to enhance the power supply network into Southwest Connecticut by adding two 345 kV transmission lines - Bethel to Norwalk (20 Miles) and Middletown to Norwalk (70 miles). In Table 2.1, a summary is given of the portions of each line which would be overhead conductors and under ground cables. Three options for the Phase 2 portion of the project are given. The approximate capacitive Mvar associate with each phase and option is estimated in Table 2.1. The approximate range is 500 to 4100 Mvar. The calculated short circuit currents on the 345 kV system for this project are in the range of 20 to 30 kA. Using a wider short circuit range of 10 to 40 kA and a capacitive Mvar range of 500 to 4100, the potential resonance is estimated in Table 2.3 based on the formula given in Figure 1.8 above. This simplified approach indicates a potential for resonance in the area of the 2nd to the 6th harmonics for the 20 to 30 kA range. The actual system is more complex than is indicated by this simple analysis. There would be multiple resonance points, but this does indicate that the system is likely to have a major resonance in the area indicated. In Table 2.3, an estimate is also made for the voltage rise associated with adding the given Mvar to the system without using shunt reactors. The voltage rise is estimated using the formula:
∆ V = Mvar/(MVAsc-Mvar) These high values of potential 60 Hz voltage rise indicate that the system must be operated very carefully to assure that none of these severe conditions occur.
Under-ground
Description of Circuit Total Overhead Cable Description of Underground Cable
Phase 1 - Bethel to Norwalk 345 kV 20 8 12 12 mi.-2 in parallel
Phase 2 - Middletown to Norwalk 345 kV Option M/N 69 45 24 24 mi.-2 in parallel Option M/N-P1 77 13 64 24 mi.-2 in parallel & 40 mi.-3 in parallel Option M/N-P2 70 26 44 24 mi.-2 in parallel & 20 mi.-3 in parallel
Length of Circuit (Miles)
Table 2.1Cable Lengths
Page 15 Version 2.0

TotalLength Per Phases
Description of Circuit (Miles) Phase 1 & 2
Phase 1 - Bethel to Norwalk 345 kV 24 511
Phase 2 - Middletown to Norwalk 345 kV Option M/N 48 1022 1534 Option M/N-P2 108 2300 2812 Option M/N-P1 168 3578 4090
* The Mvar estimate is based on 21.3 Mvar/mile.
Total Mvar*
Table 2.2Estimate of Cable Mvar
Underground Cable
Cable HarmonicIsc (kA) MVAsc Mvar of Parallel Voltage
at 345 kV at 345 kV at 345 kV Resonance Rise
10 5,976 500 3.5 9%1500 2.0 34%2800 1.5 88%4100 1.2 219%
20 11,951 500 4.9 4%1500 2.8 14%2800 2.1 31%4100 1.7 52%
30 17,927 500 6.0 3%1500 3.5 9%2800 2.5 19%4100 2.1 30%
40 23,902 500 6.9 2%1500 4.0 7%2800 2.9 13%4100 2.4 21%
Estimated
Table 2.3Estimate of Parallel Resonance
Page 16 Version 2.0
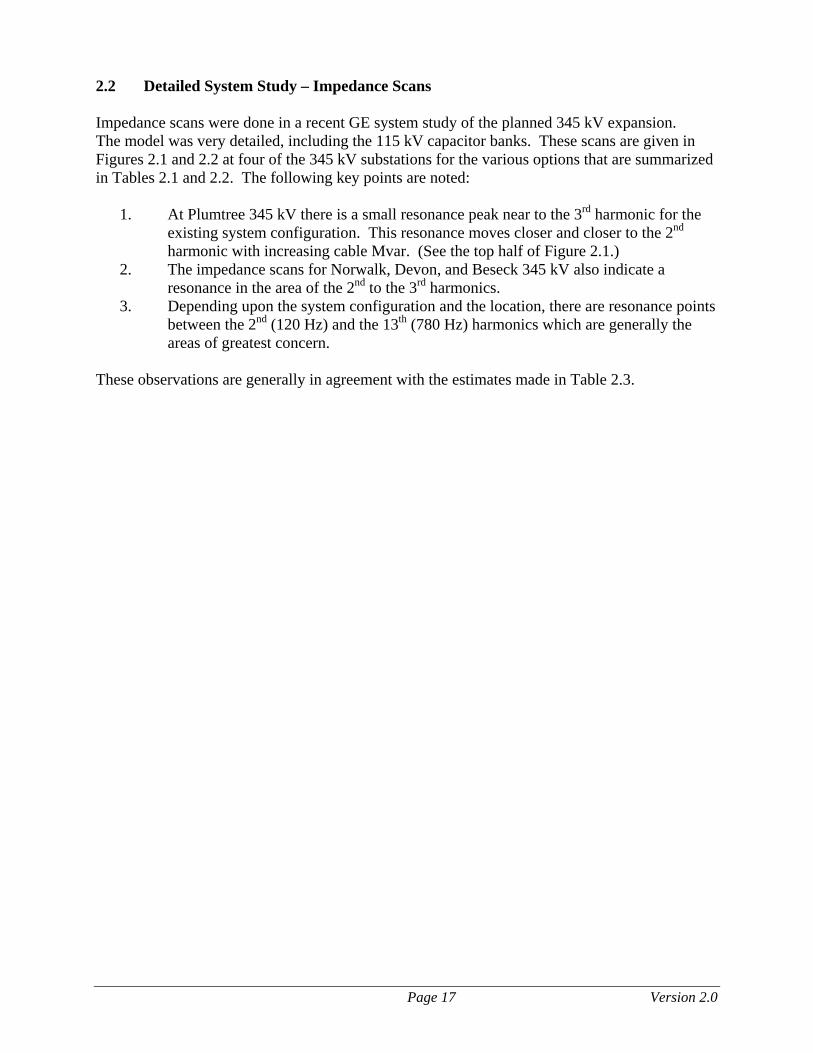
2.2 Detailed System Study – Impedance Scans Impedance scans were done in a recent GE system study of the planned 345 kV expansion. The model was very detailed, including the 115 kV capacitor banks. These scans are given in Figures 2.1 and 2.2 at four of the 345 kV substations for the various options that are summarized in Tables 2.1 and 2.2. The following key points are noted:
1. At Plumtree 345 kV there is a small resonance peak near to the 3rd harmonic for the existing system configuration. This resonance moves closer and closer to the 2nd harmonic with increasing cable Mvar. (See the top half of Figure 2.1.)
2. The impedance scans for Norwalk, Devon, and Beseck 345 kV also indicate a resonance in the area of the 2nd to the 3rd harmonics.
3. Depending upon the system configuration and the location, there are resonance points between the 2nd (120 Hz) and the 13th (780 Hz) harmonics which are generally the areas of greatest concern.
These observations are generally in agreement with the estimates made in Table 2.3.
Page 17 Version 2.0

Figure 2.1
Page 18 Version 2.0
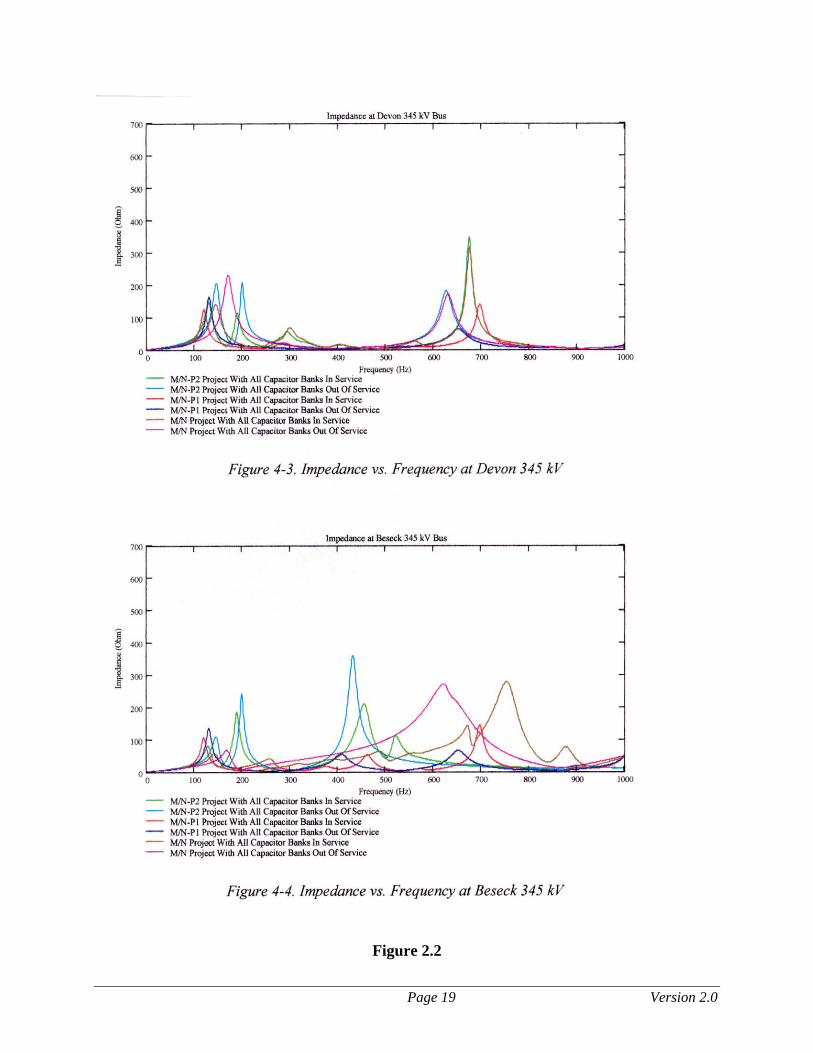
Figure 2.2
Page 19 Version 2.0

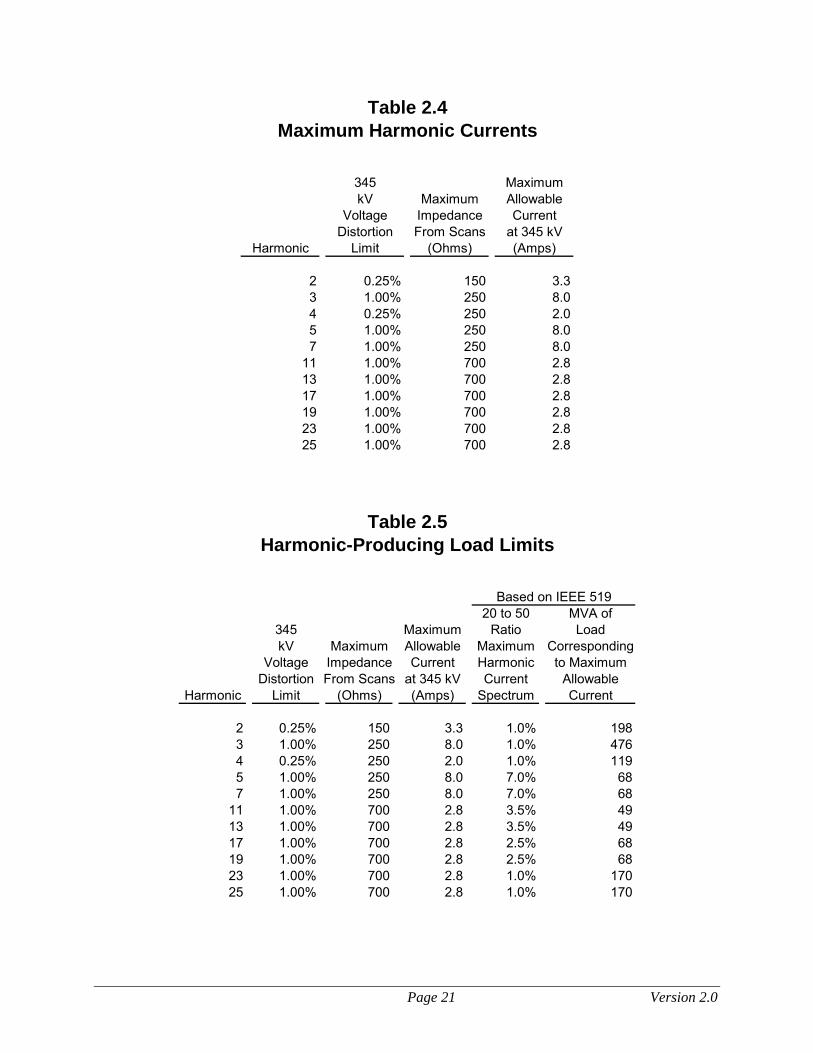
2.3 Sources of Harmonic Distortion The impedance characteristics illustrated in Figures 2.1 and 2.2 are not necessarily a problem. To produce any significant distortion, there must be a source of harmonic current. From these figures it is clear that changes in the system can result in resonances at nearly any frequency from the 2nd to the 13th harmonics. From the scans, an estimate of the maximum impedance at each harmonic is given in Table 2.4. Based on these impedances and the maximum allowable voltage distortion at each frequency as given in IEEE Standard 519 at 345 kV, an estimate of the maximum allowable current that could be injected into the 345 kV system is calculated in amps at 345 kV. IEEE Standard 519 gives recommended limits on current distortion for individual loads. Generally, large loads would fall into the category of the ratio of 20 to 50. The current limits associated with that category are given in Table 2.5. Assuming that each large load would meet this limit, this is translated into a maximum MVA of load. From the last column, one would conclude that loads below 50 MVA should not cause a distortion problem, as long as they meet the IEEE 519 limits on current distortion. The largest harmonic-producing devices on the system are believed to be the following:
1. Cross Sound Cable Project - +/- 150 kV dc This is rated at 330 MW and is fed from the East Shore 345 kV Substation.
2. Glenbrook Statcom’s There are two Statcom’s rated at +/- 75 Mvar each. They are connected to the Glenbrook 115 kV Substation which is near to Norwalk.
3. Railroad Substations a. Cos Cob – Two at 15/20/25 MVA, 115-27.6 kV single phase transformers b. Sasco Creek - Two at 15/20/28 MVA, 115-27.6 kV single phase transformers c. Devon - Two at 15/20/25 MVA, 115-27.6 kV single phase transformers
4. Other Large Customers a. Kimberly Clark – Fed at 13.8 kV from Rocky Road Substation – Approximately
25 MVA
Page 20 Version 2.0
345 MaximumkV Maximum Allowable
Voltage Impedance CurrentDistortion From Scans at 345 kV
Harmonic Limit (Ohms) (Amps)
2 0.25% 150 3.33 1.00% 250 8.04 0.25% 250 2.05 1.00% 250 8.07 1.00% 250 8.0
11 1.00% 700 2.813 1.00% 700 2.817 1.00% 700 2.819 1.00% 700 2.823 1.00% 700 2.825 1.00% 700 2.8
Table 2.4Maximum Harmonic Currents
20 to 50 MVA of345 Maximum Ratio LoadkV Maximum Allowable Maximum Corresponding
Voltage Impedance Current Harmonic to MaximumDistortion From Scans at 345 kV Current Allowable
Harmonic Limit (Ohms) (Amps) Spectrum Current
2 0.25% 150 3.3 1.0% 1983 1.00% 250 8.0 1.0% 4764 0.25% 250 2.0 1.0% 1195 1.00% 250 8.0 7.0% 687 1.00% 250 8.0 7.0% 68
11 1.00% 700 2.8 3.5% 4913 1.00% 700 2.8 3.5% 4917 1.00% 700 2.8 2.5% 6819 1.00% 700 2.8 2.5% 6823 1.00% 700 2.8 1.0% 17025 1.00% 700 2.8 1.0% 170
Based on IEEE 519
Table 2.5Harmonic-Producing Load Limits
Page 21 Version 2.0

2.4 Cross Sound Cable Project The largest harmonic producing device on the nearby system is the Cross Sound Cable Project. (It is the largest in MVA rating, but it is not necessarily the largest harmonic producer.) Applying the current limits determined in Table 2.4 to the Cross Sound terminal would give the maximum % harmonic currents at full load, as given in Table 2.6. If the harmonic currents produced by the Cross Sound Project exceed these percentages, then the voltage distortion limits given in Table 2.4 could be exceeded. Studies were done to evaluate the harmonic distortion associated with the Cross Sound Cable Project. In Figure 2.3, an impedance scan from those studies is given. (This scan includes the filters at the East Shore converter station, but other documentation in that report indicates that there is very little difference in this particular scan with or without those filters. This is true because of the significant converter reactors that are in the circuit. Consequently, this scan can be compared to those given in Figures 2.1 and 2.2.) Figure 2.3, which is from the Cross Sound Cable Project analysis, shows the first resonance to be between the 5th and 6th harmonics. It does not show the resonances in the area of the 2nd to the 5th harmonic, as is illustrated in Figures 2.1 and 2.2. (This is due to the relatively simple model of the Northeast Utilities System that was used at the East Shore substation for the Cross Sound Cable Project analysis.) A spectrum of the harmonic currents injected from the New Haven converter station were given in the Cross Sound Cable Project analysis. This spectrum is repeated here in Figure 2.4. The current percentages are estimated and summarized in Table 2.7. Comparing the maximum allowed values with the calculated values, it is apparent that the calculated values are all less than the maximum allowed values. The closest value to the maximum is at the 5th harmonic. The converter and filter designs have been chosen to significantly limit the harmonic distortion on the system.
Page 22 Version 2.0

CrossSound
330MW
345 Maximum MaximumkV Maximum Allowable Harmonic
Voltage Impedance Current CurrentDistortion From Scans at 345 kV %
Harmonic Limit (Ohms) (Amps) Allowed
2 0.25% 150 3.3 0.6%3 1.00% 250 8.0 1.4%4 0.25% 250 2.0 0.4%5 1.00% 250 8.0 1.4%7 1.00% 250 8.0 1.4%
11 1.00% 700 2.8 0.5%13 1.00% 700 2.8 0.5%17 1.00% 700 2.8 0.5%19 1.00% 700 2.8 0.5%23 1.00% 700 2.8 0.5%25 1.00% 700 2.8 0.5%
Table 2.6Harmonic-Producing Load LimitsFor Cross Sound Cable Project
At East Shore 345 kV Substation
Figure 2.3
Page 23 Version 2.0

Figure 2.4
345 Maximum 330 MWkV Maximum Allowable Maximum Maximum
Voltage Impedance Current Harmonic CalculatedDistortion From Scans at 345 kV Current Harmonic
Harmonic Limit (Ohms) (Amps) Allowed Current
2 0.25% 150 3.3 0.60%3 1.00% 250 8.0 1.44% 0.03%4 0.25% 250 2.0 0.36%5 1.00% 250 8.0 1.44% 1.03%7 1.00% 250 8.0 1.44% 0.23%
11 1.00% 700 2.8 0.52% 0.14%13 1.00% 700 2.8 0.52% 0.10%17 1.00% 700 2.8 0.52% 0.05%19 1.00% 700 2.8 0.52% 0.07%23 1.00% 700 2.8 0.52% 0.08%25 1.00% 700 2.8 0.52% 0.03%
Cross Sound
Table 2.7Harmonic-Producing Load LimitsFor Cross Sound Cable Project
At East Shore 345 kV SubstationCompared to Simulations
Page 24 Version 2.0

2.5 Other Locations Current distortion measurements were made at several places in the system in the Summer of 2003. These measurements are given in Table 2.8. The currents are referred to 345 kV in the bottom 3rd of the table. These measurements are at various locations throughout the system and they do not necessarily reflect any particular load conditions, but they do help to give an indication of the harmonic current flow on the system, which can be compared to the limits given in Table 2.4. Some of the values at the 2nd and 4th harmonics in Table 2.8 exceed the maximum allowable values that were derived in Table 2.4. The values of the 2nd harmonic at Plumtree and Frost Bridge are 3 to 4 times the estimated maximum allowable value. The reason for this significant value is not known.
Page 25 Version 2.0

Harmonic
30G-4H (345-115 kV, 8R-4H (345-115 kV, 9S-8H (115-13.8 kV, 1350-7R-1H (Two 305 MW 270/360/450 MVA Transformer) 360/480/600 MVA Transformer) 28/37.3/47 MVA Transformer) Milford Generators)
A B C A B C A B C A B C2 3.72% 3.29% 3.42% 2.35% 2.50% 2.52% 0.67% 0.61% 1.04%3 0.22% 0.25% 0.44% 0.18% 0.42% 0.19% 2.66% 1.97% 3.46%4 0.90% 0.86% 0.71% 0.52% 0.54% 0.38% 0.67% 0.18% 1.04%5 0.91% 0.89% 1.10% 1.31% 1.20% 1.25% 1.42% 2.95% 1.79%6 0.36% 0.28% 0.28% 0.25% 0.18% 0.13% 0.19% 0.65% 1.32%7 0.74% 0.86% 1.05% 0.31% 0.15% 0.12% 1.04% 0.49% 0.80%8 0.11% 0.21% 0.25% 0.07% 0.10% 0.10% 0.36% 0.59% 1.42%9 0.04% 0.13% 0.25% 0.05% 0.13% 0.10% 0.44% 0.49% 1.01%
10 0.20% 0.32% 0.26% 0.07% 0.18% 0.13% 0.66% 0.09% 1.63%11 0.15% 0.06% 0.27% 0.09% 0.04% 0.14% 0.60% 0.33% 0.30%12 0.05% 0.20% 0.14% 0.04% 0.18% 0.12% 0.43% 0.38% 0.26%13 0.10% 0.14% 0.32% 0.11% 0.11% 0.12% 1.48% 0.20% 0.59%14 0.13% 0.27% 0.17% 0.11% 0.04% 0.03% 0.97% 0.56% 0.65%15 0.10% 0.08% 0.10% 0.20% 0.12% 0.01% 0.61% 1.04% 0.40%16 0.19% 0.08% 0.17% 0.06% 0.08% 0.09% 1.30% 0.53% 0.19%
THD 4.04% 3.68% 3.90% 2.79% 2.89% 2.87% 4.20% 4.03% 5.15%
Harmonic
1.544 1.599 1.538 2.245 2.286 2.235 2.341 2.208 2.165 0.014 0.017 0.019CT Ratio 600 600 600 600 600 600 600 600 600kV 115 115 115 115 115 115 13.8 13.8 13.8MVA 185 191 184 268 273 267 34 32 31 No Load No Load No Load
2 34.5 31.6 31.6 31.7 34.3 33.8 9.4 8.1 13.53 2.0 2.4 4.1 2.4 5.8 2.5 37.4 26.1 44.94 8.3 8.3 6.6 7.0 7.4 5.1 9.4 2.4 13.55 8.4 8.5 10.2 17.6 16.5 16.8 19.9 39.1 23.36 3.3 2.7 2.6 3.4 2.5 1.7 2.7 8.6 17.17 6.9 8.3 9.7 4.2 2.1 1.6 14.6 6.5 10.48 1.0 2.0 2.3 0.9 1.4 1.3 5.1 7.8 18.49 0.4 1.2 2.3 0.7 1.8 1.3 6.2 6.5 13.1
10 1.9 3.1 2.4 0.9 2.5 1.7 9.3 1.2 21.211 1.4 0.6 2.5 1.2 0.5 1.9 8.4 4.4 3.912 0.5 1.9 1.3 0.5 2.5 1.6 6.0 5.0 3.413 0.9 1.3 3.0 1.5 1.5 1.6 20.8 2.6 7.714 1.2 2.6 1.6 1.5 0.5 0.4 13.6 7.4 8.415 0.9 0.8 0.9 2.7 1.6 0.1 8.6 13.8 5.216 1.8 0.8 1.6 0.8 1.1 1.2 18.3 7.0 2.5
MaximumHarmonic Allowable
ValueSystem kV: 115 115 115 115 115 115 13.8 13.8 13.8 115 115 115 FromCT Ratio: 600 600 600 600 600 600 600 600 600 Table 4
2 11.5 10.5 10.5 10.6 11.4 11.3 0.4 0.3 0.5 3.33 0.7 0.8 1.4 0.8 1.9 0.8 1.5 1.0 1.8 8.04 2.8 2.8 2.2 2.3 2.5 1.7 0.4 0.1 0.5 2.05 2.8 2.8 3.4 5.9 5.5 5.6 0.8 1.6 0.9 8.06 1.1 0.9 0.9 1.1 0.8 0.6 0.1 0.3 0.77 2.3 2.8 3.2 1.4 0.7 0.5 0.6 0.3 0.4 8.08 0.3 0.7 0.8 0.3 0.5 0.4 0.2 0.3 0.79 0.1 0.4 0.8 0.2 0.6 0.4 0.2 0.3 0.5 8.0
10 0.6 1.0 0.8 0.3 0.8 0.6 0.4 0.0 0.811 0.5 0.2 0.8 0.4 0.2 0.6 0.3 0.2 0.2 2.812 0.2 0.6 0.4 0.2 0.8 0.5 0.2 0.2 0.113 0.3 0.4 1.0 0.5 0.5 0.5 0.8 0.1 0.3 2.814 0.4 0.9 0.5 0.5 0.2 0.1 0.5 0.3 0.315 0.3 0.3 0.3 0.9 0.5 0.0 0.3 0.6 0.2 2.816 0.6 0.3 0.5 0.3 0.4 0.4 0.7 0.3 0.1
This value exceeds the maximum allowable value from Table 2.4.
Table 2.8Current Distortion Measurements
Current Distortion Meaurements (Amps Referred to 345 kV)Plumtree 115 kV Frost Bridge 115 kV Norwalk 13.8 kV Devon 115 kV
Current Distortion Meaurements (Amps At That Location)Plumtree 115 kV Frost Bridge 115 kV Norwalk 13.8 kV Devon 115 kV
Current Distortion Meaurements (%)Plumtree 115 kV Frost Bridge 115 kV Norwalk 13.8 kV Devon 115 kV
Page 26 Version 2.0

3.0 OTHER HARMONIC-RELATED ISSUES Harmonic distortion is basically a steady-state condition, as discussed in Sections 1.0 and 2.0. However, there are other harmonic-related issues, which are more transient in nature. These other issues can be viewed in a similar way, i.e. a significant current injected into a high impedance system can result in high voltage distortion or a high transient voltage. The key issues are summarized as follows:
1. Harmonic Distortion – See Sections 1.0 and 2.0. a. For large three-phase, harmonic-producing loads, the significant harmonics are
typically 5, 7, 11, 13, 17, 19, … (The magnitude of each harmonic tends to decrease as the harmonic number increases.) This current spectrum is characteristic of 6-pulse devices. Using higher order pulse numbers, such as 12, 18, 24, …, will significantly reduce the harmonic distortion.
b. For large single-phase, harmonic-producing loads, the significant harmonics are typically 3, 5, 7, 9, 11, 13, 15, 17, 19, … (The magnitude of each harmonic tends to decrease as the harmonic number increases.)
c. It is unusual for even harmonics to be significant on large harmonic-producing loads, but it is possible. Examples, where they can occur, are unsymmetrical SCR firing or using a 3-pulse rectifier bridge.
d. Harmonic distortion is generally controlled to acceptable levels by applying equipment with low harmonic current distortion and/or applying harmonic filters at the harmonic-producing loads.
2. Energizing a Transformer a. Energizing a transformer can produce significant harmonic current for a short period
of time – 10’s of cycles to seconds. The significant harmonics are typically 2, 3, 4, 5, 6, 7, … (The magnitude of each harmonic tends to decrease as the harmonic number increases.)
b. The transient voltage can be reduced by using closing resistors or controlled breaker closing.
3. Fault Application and Clearing a. The fault application transients are a function of the system characteristics. They
may be able to be reduced by the use of surge arresters throughout the system. This may require the replacing of existing surge arresters at 115 kV substations.
4. Geomagnetically Induced Currents a. Geomagnetic disturbances caused by solar storms can produce low frequency
currents in the earth’s surface. In a particular set of circumstances, it is possible to have near dc current flow in the transformer windings, resulting in transformer saturation. This results in harmonic currents which are 2, 3, 4, 5, 6, 7, … (The magnitude of each harmonic tends to decrease as the harmonic number increases.)
b. Significant GIC has not been recorded in southwestern Connecticut. Consequently, it is not expected to be an issue.
5. Subsynchronous Resonance a. Resonance near to 60 Hz can cause excessive torques on generator-turbine shafts
when the natural frequency of the mechanical system is excited. b. This condition should be investigated further if the high ohmic reactors are used in
circuits to limit the load flow.
Page 27 Version 2.0
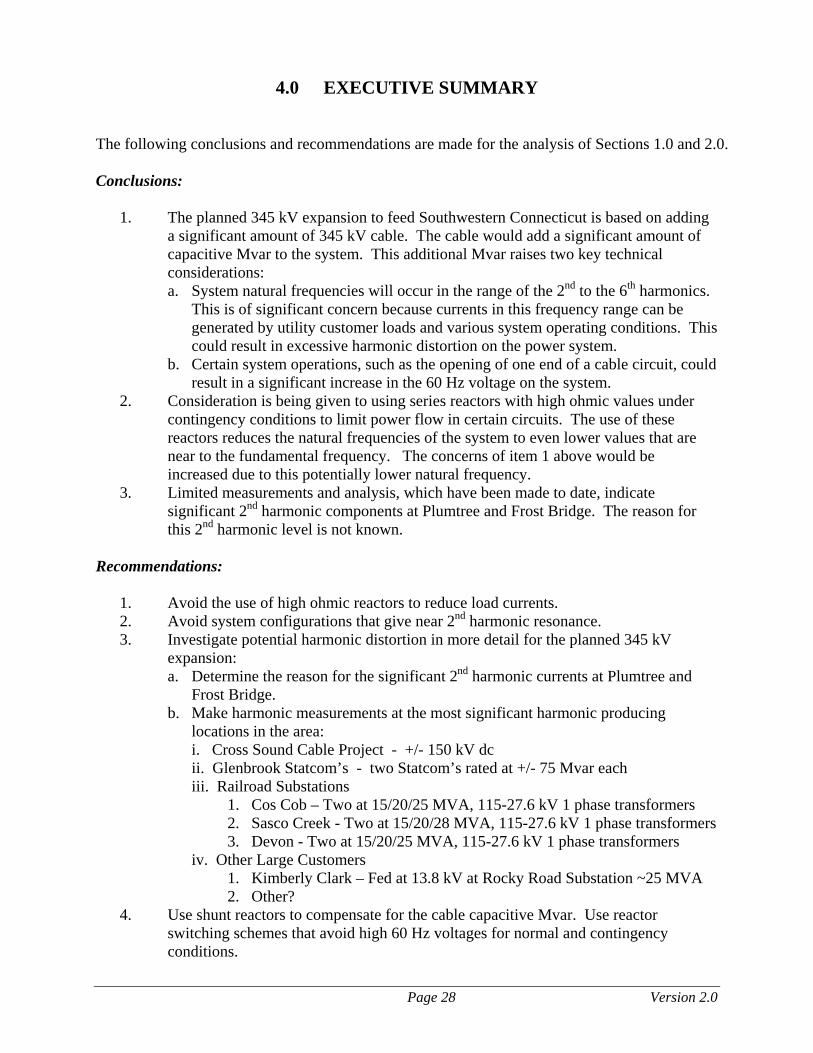
4.0 EXECUTIVE SUMMARY The following conclusions and recommendations are made for the analysis of Sections 1.0 and 2.0. Conclusions:
1. The planned 345 kV expansion to feed Southwestern Connecticut is based on adding a significant amount of 345 kV cable. The cable would add a significant amount of capacitive Mvar to the system. This additional Mvar raises two key technical considerations: a. System natural frequencies will occur in the range of the 2nd to the 6th harmonics.
This is of significant concern because currents in this frequency range can be generated by utility customer loads and various system operating conditions. This could result in excessive harmonic distortion on the power system.
b. Certain system operations, such as the opening of one end of a cable circuit, could result in a significant increase in the 60 Hz voltage on the system.
2. Consideration is being given to using series reactors with high ohmic values under contingency conditions to limit power flow in certain circuits. The use of these reactors reduces the natural frequencies of the system to even lower values that are near to the fundamental frequency. The concerns of item 1 above would be increased due to this potentially lower natural frequency.
3. Limited measurements and analysis, which have been made to date, indicate significant 2nd harmonic components at Plumtree and Frost Bridge. The reason for this 2nd harmonic level is not known.
Recommendations:
1. Avoid the use of high ohmic reactors to reduce load currents. 2. Avoid system configurations that give near 2nd harmonic resonance. 3. Investigate potential harmonic distortion in more detail for the planned 345 kV
expansion: a. Determine the reason for the significant 2nd harmonic currents at Plumtree and
Frost Bridge. b. Make harmonic measurements at the most significant harmonic producing
locations in the area: i. Cross Sound Cable Project - +/- 150 kV dc ii. Glenbrook Statcom’s - two Statcom’s rated at +/- 75 Mvar each iii. Railroad Substations
1. Cos Cob – Two at 15/20/25 MVA, 115-27.6 kV 1 phase transformers 2. Sasco Creek - Two at 15/20/28 MVA, 115-27.6 kV 1 phase transformers 3. Devon - Two at 15/20/25 MVA, 115-27.6 kV 1 phase transformers
iv. Other Large Customers 1. Kimberly Clark – Fed at 13.8 kV at Rocky Road Substation ~25 MVA 2. Other?
4. Use shunt reactors to compensate for the cable capacitive Mvar. Use reactor switching schemes that avoid high 60 Hz voltages for normal and contingency conditions.
Page 28 Version 2.0