4vtubjobcjmjuz pg uif $bobejbo )fbmui $bsf 4ztufn … · discussion and debate in canada. while...
TRANSCRIPT

Sustainability of the Canadian Health Care System and Impact of the 2014 Revision to the Canada Health Transfer
September 2013
Sponsored by the
Prepared by Stéphane Levert, FSA, FCIAPresident, Stephane Levert Consulting Services Inc.
© 2013 Canadian Institute of Actuaries and Society of Actuaries, All Rights Reserved
The opinions expressed and conclusions reached by the author are his own and do not represent an of cial position or opinion of the Canadian Institute of Actuaries or the Society of Actuaries or its members. The Canadian Institute of Actuaries and Society of Actuaries make no representation or warranty to the accuracy of this information.

© 2013 Society of Actuaries and Canadian Institute of Actuaries, All Rights Reserved Stephane Levert Consulting Services Inc.
Page i
Table of Contents Table of Contents ........................................................................................................................................... i
Acknowledgment ......................................................................................................................................... iv
Disclaimer of Liability .................................................................................................................................... v
Executive Summary ....................................................................................................................................... 1
Chapter 1—Introduction ............................................................................................................................... 4
Chapter 2—Description of the Canadian Health Care System ..................................................................... 6
Introduction .............................................................................................................................................. 6
Government Involvement ......................................................................................................................... 6
Scope of Coverage .................................................................................................................................... 7
Health Care Delivery System ..................................................................................................................... 8
Health Care Funding.................................................................................................................................. 8
Chapter 3—Current Cost of the Canadian Health Care System.................................................................. 10
Comment on Data ................................................................................................................................... 10
Current Cost of the Canadian Health Care System ................................................................................. 11
International Comparison ....................................................................................................................... 12
Measurement Items to Project ............................................................................................................... 13
Chapter 4—Economic and Demographic Models ....................................................................................... 14
Demographic Model ............................................................................................................................... 14
Supply of Physicians Considerations ....................................................................................................... 15
Economic Model ..................................................................................................................................... 15
Chapter 5—Projection of Physician Expenditures ...................................................................................... 17
Introduction ............................................................................................................................................ 17
Current Costs .......................................................................................................................................... 17
Projections .............................................................................................................................................. 18
Supply of Physicians Considerations ....................................................................................................... 22
Chapter 6—Projection of Hospital Expenditures ........................................................................................ 24
Introduction ............................................................................................................................................ 24
Current Costs .......................................................................................................................................... 24
Projections .............................................................................................................................................. 26

© 2013 Society of Actuaries and Canadian Institute of Actuaries, All Rights Reserved Stephane Levert Consulting Services Inc. Page ii
Chapter 7—Projection of “Other Institutions Expenditures” ..................................................................... 31
Introduction ............................................................................................................................................ 31
Current Costs .......................................................................................................................................... 31
Projections .............................................................................................................................................. 32
Chapter 8—Projection of “Other Professionals Expenditures” .................................................................. 36
Introduction ............................................................................................................................................ 36
Current Costs .......................................................................................................................................... 36
Projections .............................................................................................................................................. 38
Chapter 9—Projection of Drug Expenditures ............................................................................................. 41
Introduction ............................................................................................................................................ 41
Current Costs .......................................................................................................................................... 41
Projections .............................................................................................................................................. 44
Chapter 10—Projection of “Other Health Spending” ................................................................................. 47
Introduction ............................................................................................................................................ 47
Current Costs .......................................................................................................................................... 48
Projections .............................................................................................................................................. 48
Chapter 11—Public Accounts and the Canada Health Transfer ................................................................. 51
Introduction ............................................................................................................................................ 51
Implications on Public Accounts ............................................................................................................. 52
Canada Health Transfer .......................................................................................................................... 54
Canada Health Act Perspective ............................................................................................................... 57
Chapter 12—Impact on Private and Other Public Sectors .......................................................................... 59
Introduction ............................................................................................................................................ 59
Federal Government ............................................................................................................................... 60
Municipal Governments ......................................................................................................................... 61
Social Security Funds ............................................................................................................................... 62
Private Sector (including out-of-pocket payments) ................................................................................ 63
Chapter 13—Conclusion ............................................................................................................................. 64
References .................................................................................................................................................. 67
Appendix 1—Benefits Covered under Canadian Medicare Programs ........................................................ 69
Appendix 2—Demographic Projection Model ............................................................................................ 71
2011 Population ...................................................................................................................................... 71

© 2013 Society of Actuaries and Canadian Institute of Actuaries, All Rights Reserved Stephane Levert Consulting Services Inc. Page iii
Population Projection Methodology ....................................................................................................... 72
2013 to 2037 Population Projections ..................................................................................................... 75
Appendix 3—Economic Projections ............................................................................................................ 78
Introduction ............................................................................................................................................ 78
Real GDP Growth Parameters ................................................................................................................. 78
Real GDP Growth Forecast ...................................................................................................................... 80
General Inflation ..................................................................................................................................... 81
Appendix 4—Projections Using Different Scenarios ................................................................................... 82
Appendix 5—Provincial/Territorial Public Accounts ................................................................................... 83
Introduction ............................................................................................................................................ 83
Newfoundland & Labrador ..................................................................................................................... 83
Prince Edward Island ............................................................................................................................... 84
Nova Scotia ............................................................................................................................................. 85
New Brunswick ........................................................................................................................................ 86
Quebec .................................................................................................................................................... 87
Ontario .................................................................................................................................................... 88
Manitoba ................................................................................................................................................. 89
Saskatchewan ......................................................................................................................................... 90
Alberta..................................................................................................................................................... 91
British Columbia ...................................................................................................................................... 92
Yukon ...................................................................................................................................................... 93
Northwest Territories ............................................................................................................................. 94
Nunavut................................................................................................................................................... 95
Appendix 6—Description of the U.S. Health Care System .......................................................................... 96
Introduction ............................................................................................................................................ 96
Government Involvement ....................................................................................................................... 96
Scope of Coverage .................................................................................................................................. 97
Health Care Delivery System ................................................................................................................... 98
Health Care Funding................................................................................................................................ 98

© 2013 Society of Actuaries and Canadian Institute of Actuaries, All Rights Reserved Stephane Levert Consulting Services Inc.
Page iv
Acknowledgment The author would like to thank the Society of Actuaries (SOA), the Canadian Institute of Actuaries (CIA) and the following members of the Project Oversight Group and SOA and CIA staff for their time and guidance throughout this research:
Project Oversight Group: Faizel Alladina, FSA, FCIA Marc-André Belzil, FSA, FCIA Greg Durant, FSA, FCIA Gary Walters, FSA, FCIA, FIA Joyce Zhang, FSA
SOA Staff:
Joseph De Dominicis, FSA, FCIA Bruce Iverson Jan Schuh Ronora Stryker, ASA, MAAA Sara Teppema, FSA, FCA, MAAA
CIA Staff:
Les Dandridge Chris Fievoli, FSA, FCIA Josée Racette

© 2013 Society of Actuaries and Canadian Institute of Actuaries, All Rights Reserved Stephane Levert Consulting Services Inc.
Page v
Disclaimer of Liability Any distribution of this report must be in its entirety. Nothing contained in this report is to be used in any filing with any public body. Stephane Levert Consulting Services Inc. and the author disclaim liability for any loss or damage arising or resulting from an error or omission in Stephane Levert Consulting Services Inc.’s analysis and summary of the results or any other information contained here. The report is to be reviewed and understood as a complete document for education and research purposes. This report is published by the Society of Actuaries and the Canadian Institute of Actuaries. The information published in this report was developed based on assumptions intended to be representative of the environment and reasonable when those assumptions were developed. The Society of Actuaries, the Canadian Institute of Actuaries, Stephane Levert Consulting Services Inc. and t he author do not recommend, encourage, or endorse any particular use of the information provided in this report. The Society of Actuaries, the Canadian Institute of Actuaries, Stephane Levert Consulting Services Inc. and the author make no warrant, guarantee, or representation whatsoever and assume no liability or responsibility in connection with the use or misuse of this report.

© 2013 Society of Actuaries and Canadian Institute of Actuaries, All Rights Reserved Stephane Levert Consulting Services Inc.
Page 1
Executive Summary The cost of the Canadian health care system has been increasing steadily with health care expenditures of provinces and territories over the last five years outpacing the annual rate of inflation by nearly 4 percent. The question of how to fund and even contain growing health care costs is the topic of significant discussion and debate in Canada. While Canadian provinces and territories are predominantly responsible for their own health care delivery, the federal government provides funding support through the Canada Health Transfer (CHT). The objective of this report is to estimate the future costs of the Canadian health care system, assess the sustainability of the system over a 25-year horizon, and analyze the implications of the changes to the CHT proposed on Dec. 19, 2011 by the federal government. The findings indicate that, without significant government intervention, the Canadian health care system in its current form is not sustainable. Key findings from the analysis show that:
• Assuming no governmental steps to curb health care expenditures, provincial/territorial spending on health care is estimated to increase at 5.1 percent real growth per year, increasing from 44 percent today to 103 percent of total provincial/territorial revenues by 2037.
• Even after assuming some governmental action (for the base scenario, see Appendix 4) to limit real growth rates to 3.5 percent—and thus to decrease 2037 health care expenditures by 30 percent—health care will still absorb 69 percent of total revenues available to provinces/territories by 2037 (86 percent of own-source revenues).
• The proposed changes to the CHT will impact total revenues available to provinces/territories, reducing the federal government’s portion of provincial/territorial health care expenditures from the current 21.0 percent to 14.3 percent by 2037.
• The supply of physicians needs to increase by at least 46 percent over the next 25 years just to keep up with increased demand for services as a result of aging and population growth.
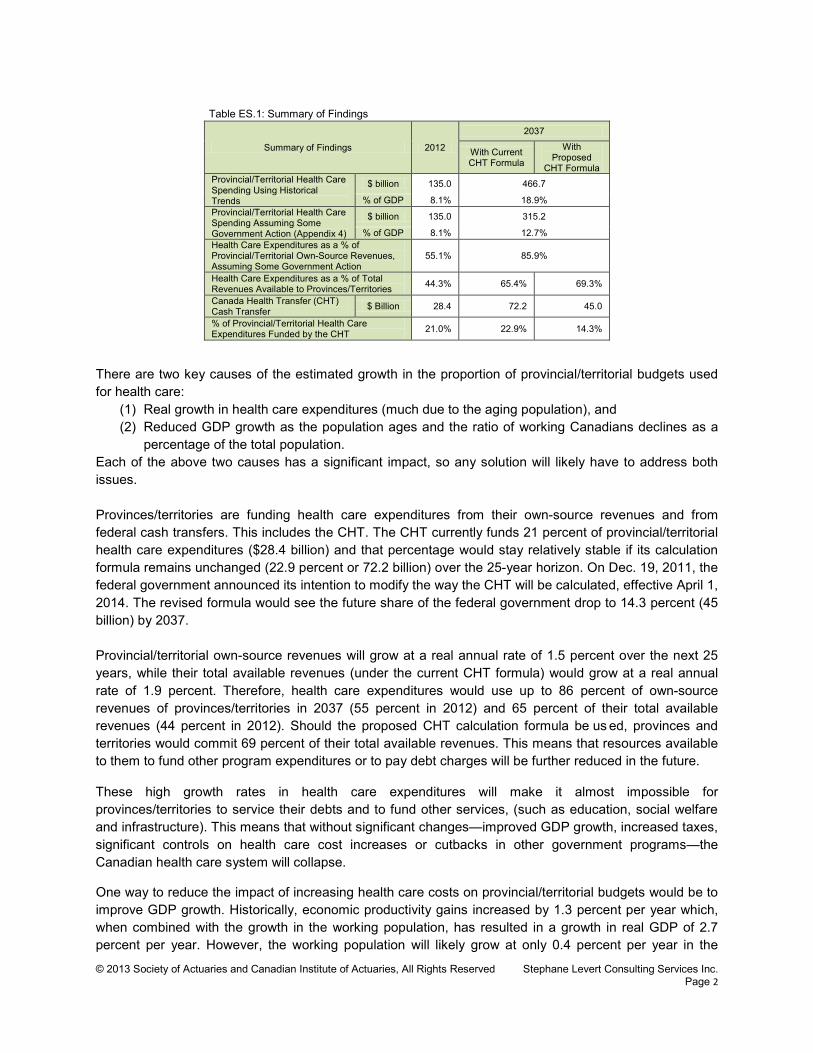
In summary, the research shows that in order to safeguard the sustainability of its health care system, Canada has to significantly limit health care cost increases, or boost GDP growth, or raise taxes/fees, or substantially reduce or cut altogether other government programs/services, or implement some combination of these. Unlike studies that have attempted to forecast and discuss the future costs of the Canadian health care system using a macroeconomic approach, this report uses a demographic approach and the application of actuarial techniques to directly capture the increase in health care costs associated with the aging of the population. Table ES.1 summarizes the findings of the research on the cost to provincial/territorial governments and f urther illustrates the need for sizable changes to current policies to preserve the Canadian health care system.
© 2013 Society of Actuaries and Canadian Institute of Actuaries, All Rights Reserved Stephane Levert Consulting Services Inc. Page 2
Table ES.1: Summary of Findings
There are two key causes of the estimated growth in the proportion of provincial/territorial budgets used for health care:
(1) Real growth in health care expenditures (much due to the aging population), and (2) Reduced GDP growth as the population ages and the ratio of working Canadians declines as a
percentage of the total population. Each of the above two causes has a significant impact, so any solution will likely have to address both issues. Provinces/territories are funding health care expenditures from their own-source revenues and from federal cash transfers. This includes the CHT. The CHT currently funds 21 percent of provincial/territorial health care expenditures ($28.4 billion) and that percentage would stay relatively stable if its calculation formula remains unchanged (22.9 percent or 72.2 billion) over the 25-year horizon. On Dec. 19, 2011, the federal government announced its intention to modify the way the CHT will be calculated, effective April 1, 2014. The revised formula would see the future share of the federal government drop to 14.3 percent (45 billion) by 2037. Provincial/territorial own-source revenues will grow at a real annual rate of 1.5 percent over the next 25 years, while their total available revenues (under the current CHT formula) would grow at a real annual rate of 1.9 percent. Therefore, health care expenditures would use up to 86 percent of own-source revenues of provinces/territories in 2037 (55 percent in 2012) and 65 percent of their total available revenues (44 percent in 2012). Should the proposed CHT calculation formula be us ed, provinces and territories would commit 69 percent of their total available revenues. This means that resources available to them to fund other program expenditures or to pay debt charges will be further reduced in the future.
These high growth rates in health care expenditures will make it almost impossible for provinces/territories to service their debts and to fund other services, (such as education, social welfare and infrastructure). This means that without significant changes—improved GDP growth, increased taxes, significant controls on health care cost increases or cutbacks in other government programs—the Canadian health care system will collapse.
One way to reduce the impact of increasing health care costs on provincial/territorial budgets would be to improve GDP growth. Historically, economic productivity gains increased by 1.3 percent per year which, when combined with the growth in the working population, has resulted in a growth in real GDP of 2.7 percent per year. However, the working population will likely grow at only 0.4 percent per year in the
Summary of Findings 2012
2037
With Current CHT Formula
With Proposed
CHT Formula Provincial/Territorial Health Care Spending Using Historical Trends
$ billion 135.0 466.7
% of GDP 8.1% 18.9% Provincial/Territorial Health Care Spending Assuming Some Government Action (Appendix 4)
$ billion 135.0 315.2
% of GDP 8.1% 12.7% Health Care Expenditures as a % of Provincial/Territorial Own-Source Revenues, Assuming Some Government Action
55.1% 85.9%
Health Care Expenditures as a % of Total Revenues Available to Provinces/Territories 44.3% 65.4% 69.3%
Canada Health Transfer (CHT) Cash Transfer $ Billion 28.4 72.2 45.0
% of Provincial/Territorial Health Care Expenditures Funded by the CHT 21.0% 22.9% 14.3%

© 2013 Society of Actuaries and Canadian Institute of Actuaries, All Rights Reserved Stephane Levert Consulting Services Inc. Page 3
future, resulting in real GDP growth of 1.7 percent per year. A return to real GDP growth of 2.7 percent per year, which would require an increase in economic productivity gains from 1.3 percent to 2.3 percent per year, would bring the 2037 health care budgets closer to their current situation (53 percent of total available revenues, compared to 44 percent in 2012).
This report confirms that funding future health care expenditures will be challenging for provinces/territories. Should the CHT remain unchanged, the share of their total revenues directed to health care will increase from 44 percent in 2012 to 65 percent by 2037, most likely leading to either cutbacks in other program expenditures or tax increases. Proposed changes to the allocation of the CHT will further increase that proportion from 65 percent to 69 percent by 2037, making the situation even more challenging. It is hoped that policymakers will consider the results of this research in developing funding strategies while maintaining high quality standards in the Canadian health care system. Such strategies will undoubtedly need to include initiatives to contain the cost of delivering health care and economic stimulus to increase provincial/territorial revenues. This is necessary to ensure the survival of the Canadian health care system.

© 2013 Society of Actuaries and Canadian Institute of Actuaries, All Rights Reserved Stephane Levert Consulting Services Inc.
Page 4
Chapter 1—Introduction The Canadian health care system is governed by the Canada Health Act of 1984, setting the standards associated to insured health care services—namely physician and hospital services—which provinces/territories must satisfy to receive federal funding. These standards are comprehensiveness, universality, accessibility, portability and public administration.
The cost of the Canadian health care system has been increasing steadily, health care expenditures of provinces/territories having increased at an annual real rate of 3.9 percent from 1997 to 2012—on top of inflation. The private sector (including out-of-pocket payments from Canadians), which funds about 30 percent of the total health care expenditures, has seen them increasing at an annual real rate of 4.6 percent—on top of inflation—over the same period of time. In aggregate, the Canadian health care system consumes resources equal to 12.4 percent of GDP, or 5.4 percent when only considering physician and hospital services.
As of 2011, provincial health spending in Ontario and Quebec currently consumes more than 50% of total revenues. […] Projections of the most recent ten-year trend show that in Saskatchewan, Alberta, British Columbia, and New Brunswick government health spending is on pace to consume 50% of revenues by 2017. In Manitoba and Prince Edward Island, health spending will reach 50% of total available revenues by 2028.[1] Excluding federal transfers, health spending consumes 87.7% of total available provincial own-source revenue in Nova Scotia, 74.2% in New Brunswick, 71.9% in Quebec, 65.5% in Prince Edward Island, 63.1% in Ontario, 62.8% in Manitoba, 60.3% in Newfoundland & Labrador, 55.2% in Saskatchewan, 54.6% in British Columbia, and 48.0% in Alberta.2
Federal funding support to provinces/territories is through the Canada Health Transfer (CHT). In 2011, the federal government announced a review of the calculation formula of CHT cash transfers. Starting with fiscal year 2017-2018, in addition to allocating CHT cash transfers to provinces/territories on an equal-per-capita basis, total CHT cash transfers will cease to grow at a fixed annual nominal rate of 6 percent, as is currently the case, and will instead track the growth of the gross domestic product (GDP), subject to a minimum increase of 3 percent.
The Conference of Premiers has united against the unilateral move from the federal government. The Parliamentary Budget Officer (PBO) has also analyzed the proposed changes in the CHT calculation formula, suggesting it would create undue pressure on provinces/territories in balancing their budgets.
[…] PBO projects that the share of federal CHT cash payments in provincial-territorial health spending will decrease substantially from 20.4 per cent in 2010-11 to average 18.6 per cent over 2011-12 to 2035-36; then 13.8 per cent over the following 25 years; and, 11.9 per cent over the remainder of the projection horizon. This would ultimately bring the level of federal cash support to historical lows observed under the 1996-97 to 2001-02 period of CHST (Canada Health and Social Transfer) funding.3
1 Skinner and Rovere made an editorial decision not to show figures for Newfoundland & Labrador and Nova Scotia as their total available revenues grew over the past 10 years at the same rate or faster than government health expenditures.
2 Skinner, Brett J., and Mark Rovere. 2011. Canada’s Medicare Bubble: Is Government Health Spending Sustainable without User-based Funding? Studies in Health Care Policy. Fraser Institute. 3 Matier, Chris. 2012. Reviewing the Canada Health Transfer: Implications for Federal and Provincial-Territorial Fiscal Sustainability. Ottawa: Office of the Parliamentary Budget Officer.

© 2013 Society of Actuaries and Canadian Institute of Actuaries, All Rights Reserved Stephane Levert Consulting Services Inc. Page 5
The objective of this report is to evaluate the future costs of the Canadian health care system, to evaluate and analyze the implications of the proposed changes to the CHT calculation formula, and to assess the sustainability of the Canadian health care system over a 25-year horizon.
Several research, studies, papers and articles have attempted to forecast and discuss the future cost of the Canadian health care system, some of them adopting a macroeconomic approach. The distinguishing feature of this report is the adoption of a dem ographic approach to the question and the application of actuarial techniques. The clear advantage of such approach is to directly capture the increasing health care costs associated with the aging of the population.
This report is structured as follows:
• Chapter 2 is mostly educational in nature and presents a brief description of the Canadian health care system.
• Chapter 3 i s intended to evaluate the current cost of the Canadian health care system and t o define the metrics that will be projected in assessing the impacts of the proposed changes to the CHT on the financial position of provinces/territories.
• Chapter 4 presents the demographic model used to project future health care expenditures. Consideration is given to issues related to the supply of physicians. It also describes the economic model developed for this report.
• Chapters 5 t o 10 discuss the current costs of the following types of health care expenditures, develop a set of projection assumptions associated with these health care expenditures, and project them for the next 25 years:
o Chapter 5—physician expenditures o Chapter 6—hospital expenditures o Chapter 7—other institutions expenditures o Chapter 8—other professionals expenditures o Chapter 9—drug expenditures o Chapter 10—other health spending.
• Chapter 11 combines the projections for each type of health care expenditures and compares them to the revenues available to provinces/territories. The proposed changes to the CHT are described and their implications discussed from the perspective of the Canada Health Act of 1984 as well as from a broader perspective.
• Chapter 12 presents the impact of projected health care expenditures on other payers: the federal government, municipal governments, social security funds and the private sector (including out-of-pocket payments from Canadians).
• Chapter 13 summarizes the main conclusions of this report. Finally, appendices are included, allowing the reader to refer to more detailed information and to gain additional insight and background about the discussions presented in this report.

© 2013 Society of Actuaries and Canadian Institute of Actuaries, All Rights Reserved Stephane Levert Consulting Services Inc.
Page 6
Chapter 2—Description of the Canadian Health Care System This chapter briefly describes the Canadian health care system4
. It is not meant to be exhaustive and comprehensive, but merely a way to introduce the reader to the Canadian environment prior to analyzing its cost. Differences and subtleties exist across the different provincial/territorial health care programs that may not be addressed here.
Introduction Health care in Canada is mainly delivered through a publicly funded Medicare system, which is mostly free at the point of use and has most services provided by private entities. It is governed by the provisions of the Canada Health Act of 1984, which gives the federal government the levers to assure the quality of care through national standards. The Canadian health care system is described in this chapter by looking at (1) the government’s involvement, (2) the scope of health care coverage, (3) how health care is delivered, and (4) how it is funded.
Government Involvement In Canada, health care delivery is considered a provincial jurisdiction, and provinces/territories effectively directly administer most of the health care system. Still, the federal government sets national standards by providing funding support—the Canada Health Transfer (CHT)—to provinces/territories for health care expenditures. 5 International data shows that, in 2010, about 71 percent of Canadian health care expenditures were paid from public sources, effectively placing it below most OECD countries.6
The largest provincial/territorial health program is, by far, Medicare, which in fact consists of two programs: (1) Hospital Insurance, which started in 1958, 7 and with all provinces/territories having programs in place by 1961; and (2) Medical Insurance, which started in 1968, 8
4 Appendix 6 contains a brief description of the U.S. health care system and outlines some differences between the U.S. and Canadian health care systems.
and with all provinces/territories having programs in place by 1972. The Canada Health Act of 1984 established criteria that must be complied with for provinces/territories to receive federal grants:
5 The Constitution Act of 1867 (formerly known as the British North America Act of 1867) did not give anyone explicit responsibility for health care, as it was then a minor concern. The act gave responsibility for regulating hospitals to the provinces, who then claimed that their general responsibility for local and private matters encompassed health care. The federal government felt that the health of the population fell under the “peace, order, and good government” part of its responsibilities. Eventually, the Judicial Committee of the Privy Council decided that the administration and delivery of health care would be a provincial jurisdiction and that the federal government would also have the responsibility of protecting the health and well-being of the population. 6 OECD Health Data 2012. 7 With the adoption of the Hospital Insurance and Diagnostic Services Act of 1957, it must be noted that some provinces had taken some earlier initiatives, notably Saskatchewan in 1946 and Alberta in 1950. 8 With the adoption of the Medical Care Act of 1966.

© 2013 Society of Actuaries and Canadian Institute of Actuaries, All Rights Reserved Stephane Levert Consulting Services Inc. Page 7
• Comprehensiveness: All medically required hospital and physician services must be covered under the plan; • Universality: All legal residents of a province or territory must be entitled to the insured health services
provided for by the plan on uniform terms and conditions; • Accessibility: Reasonable access by residents to hospital and physician services must not be impeded by
charges made to them; • Portability: The plan may not impose a waiting period in excess of 3 months for new residents and coverage
must be maintained when a resident moves or travels within Canada or is temporarily out of the country; • Public administration: The plan must be administered and operated on a non-profit basis by a public
authority.9
There is cause for debate over the comprehensiveness criterion regarding the scope of what should be included as “insured health services” under the Canada Health Act of 1984. Historically, the definition of insured health services has been largely restricted to care delivered in hospitals or by physicians. However, since the 1950s and the 1960s, care has moved beyond the scope of the Canada Health Act of 1984, from hospitals to home and community. The Canadian federal government also directly administers health care for groups such as the military and inmates of federal prisons. They also provide some level of health care to the Royal Canadian Mounted Police (RCMP) and to veterans.10
The largest group that the federal government is directly responsible for is First Nations, as Native people are a federal responsibility and are guaranteed complete coverage of their health care needs.
Scope of Coverage The Canadian Medicare system is actually a collection of separate public health insurance programs—10 provincial, three territorial and one federal—that are very similar in the scope of their coverage. They include coverage for physician care, surgery and hospitalization. 11 Some services are, however, not covered or their coverage is limited. For instance, dental care is only covered for children up to age 10 in some provinces,12
and vision care is only covered in some provinces and most often only for children under a certain age.
Under the Canada Health Act of 1984, outpatient prescription drugs are not required to be covered,13
9 W.F. Bluhm, 2007.
but some provinces have drug programs that provide coverage for certain populations, such as seniors, low-income families, those on social assistance, or those with certain medical conditions. Quebec has a universal drug insurance program that guarantees access to prescription drug coverage to all residents, either through employer-provided private group plans or from a publ ic-sponsored insurance program. Some other provinces cover the costs of prescription drugs exceeding a certain level of a family’s income.
10 These groups, however, mostly use the public system. 11 Refer to Appendix 1 f or a m ore detailed description of what is generally covered under Canadian Medicare programs. 12 Section 9 of the Canada Health Act of 1984 states that all provincial/territorial health insurance programs must cover “all insured health services provided by hospitals, medical practitioners or dentists.” Still, by virtue of Section 2 of the act, insured services is defined so as to be limited to hospital and physician services, as before the adoption of the Canada Health Act of 1984. This means that surgical dental services are only covered if provided in a hospital. 13 Drugs and medications administered in a health care facility on an inpatient basis must, however, be covered by the provincial/territorial health insurance programs.

© 2013 Society of Actuaries and Canadian Institute of Actuaries, All Rights Reserved Stephane Levert Consulting Services Inc. Page 8
Finally, the private insurance industry agreed, starting in 2013, to pool the costs of expensive recurrent drug claims reimbursed by private fully insured benefit plans.
Health Care Delivery System In Canada, hospital care is delivered by publicly funded hospitals that are independent institutions incorporated separately from the provincial governments but that are required by law to operate within their budget.
Health ministries have delegated the daily administration and management of these services to smaller public bodies generically called regional health authorities (RHAs). […] RHAs are not responsible for managing prescription drug plans or physician plans, two areas that continue to be administered centrally by all provincial and territorial ministries. At the same time, the federal government also has significant responsibilities for health infrastructure in Canada, including health data collection, health research through the Canadian Institute of Health Research and drug regulation through Health Canada, the Patented Medicine Prices Review Board and the Patent Act. In addition, the federal government has responsibility for First Nations and Inuit peoples’ health.14
Even though they are not forced to contract with their provincial/territorial health insurance program, most physicians actually do. This obliges them to provide services within the framework of the provincial/territorial program on an exclusive basis. Those opting not to contract with the public program are free to practice medicine on a private basis. However, private insurance of hospital and medical services provided outside the public program is prohibited if such services would have otherwise been covered under the provincial/territorial program.15
Family physicians in Canada are chosen by individuals. A patient wishing or needing to see a specialist must be r eferred by a general practitioner. Most physicians receive a f ee per visit, at rates negotiated between the provinces/territories and the medical associations. Each province/territory regulates its medical profession through a self-governing College of Physicians and Surgeons, which is responsible for licensing physicians, setting practice standards, and investigating and disciplining its members.
Health Care Funding In Canada, private insurance does not play a dominant role in the overall health care system. About 30 percent of the cost of health care is assumed by the non-public sector, including the private sector (insurance companies and private employee benefit plans) and out-of-pocket payments from Canadians. This mostly goes toward services not covered or only partially covered by Medicare, such as prescription drugs, complementary medical services, dental care and vision care. About three-quarters of Canadians 14 CIHI, 2011b. 15 In June 2005, the Supreme Court of Canada ruled in Chaoulli v. Quebec (Attorney General) that Quebec’s prohibition of private health insurance for medically necessary services violated the Quebec Charter of Human Rights and Freedoms, potentially opening the door to much more private sector participation in the health care system. To date, this has not resulted in any significant development of a private medical care insurance market since further legislation by Quebec limited this market to eye, hip and knee surgery, in compliance with the Supreme Court ruling.

© 2013 Society of Actuaries and Canadian Institute of Actuaries, All Rights Reserved Stephane Levert Consulting Services Inc. Page 9
have some form of supplementary private health insurance, most of them through their employers. In 2012, the federal, provincial and territorial governments funded 68 percent of Canadians’ health care costs.16
This covered most hospital and physician expenditures, with patients generally receiving services free of charge.
In general, health care expenditures are paid by provinces/territories using funds from their general revenues. Only British Columbia directly imposes a fixed monthly premium to citizens,17 which is waived or reduced for those on low income. Ontario and Quebec also impose some kind of premium, sometimes referred to as a tax or contribution, which is based on income. General revenues available to provinces/territories to fund the costs of health care include payroll18
and income taxes, any income or tariffs not allocated to other programs, and federal transfers.
The CHT19 is a block transfer with funds used by provinces/territories for the purpose of “maintaining the national criteria” for publicly provided health care in Canada (as set out in the Canada Health Act of 1984).20 The CHT is made up of a c ash transfer and a tax transfer.21,22 Annual cash levels are set in legislation up t o fiscal year 2013-2014 as a result of the September 2004 Health Accord between the federal government and the provinces/territories, 23
growing by 6 percent annually as a r esult of the automatic escalator. While the CHT is allocated on an equal per capita basis, the CHT cash component is not because it takes into account the value of provincial/territorial tax points.
In order for the federal government to effectively enforce the standards set out in the Canada Health Act of 1984, the CHT is reduced dollar-for-dollar for any extra-billing charges or other fees that patients must pay. Initially, the federal government’s contribution to Medicare represented 50 percent of publicly covered health care costs. This share has reduced significantly over time as a r esult of health care expenditures outpacing federal transfers to provinces/territories. In 2012, the federal government assumes a share of about 21 percent of publicly covered health care costs (close to 35 percent when only considering hospital and physician expenditures).
16 CIHI, 2012b. 17 Until 2008, Alberta was also imposing premiums for the Alberta Health Care Insurance Plan (AHCIP). They have now been eliminated. 18 A payroll-based tax is levied in Newfoundland & Labrador, Quebec, Ontario, Manitoba, the Northwest Territories and Nunavut. 19 The CHT was made independent from the Canada Health and Social Transfer (CHST) program on April 1, 2004 to allow for greater accountability and t ransparency for federal health funding. From 1996 to 2004, federal grants for Medicare were combined with all other social transfer payments under the CHST. 20 In addition, Yukon, the Northwest Territories and Nunavut receive federal cash transfers through the Territorial Formula Financing, which is an unconditional transfer from the federal government to give territorial residents access to a r ange of public services—including health care—comparable to those offered by provincial governments, at comparable levels of taxation. 21 A tax transfer occurs when the federal government agrees to lower its tax rate so that provinces and territories can raise theirs by the same amount. 22 In fiscal year 2008-2009, CHT cash transfer payments from the federal government to provinces and territories were $22.6 billion, and tax point transfers were worth $13.9 billion (Canadian Department of Finance). 23 The CHT cash transfer will reach $29 billion in 2012 to 2013 and over $30 billion in 2013 to 2014. CHT tax transfers amount to $14.7 billion in 2012 to 2013 and will continue to grow in line with the economy (Canadian Department of Finance).

© 2013 Society of Actuaries and Canadian Institute of Actuaries, All Rights Reserved Stephane Levert Consulting Services Inc.
Page 10
Chapter 3—Current Cost of the Canadian Health Care System Discussing and making projections about the future cost of the Canadian health care system requires an understanding of the different types of health care expenditures and sources of funds for which reliable information is available. Avoiding confusion in using the conclusions of this report justifies using sources of information that are objective, independent and generally accepted in the Canadian environment and that are also referred to by other research, studies, papers and articles. This chapter first presents and discusses the current cost of the Canadian health care system for each type of use of funds and for each payer. It then defines the measurement items that will be used when assessing the sustainability of the system and the impacts of the proposed changes to the CHT on the financial position of provinces/territories.
Comment on Data Health care expenditures may be classified in a variety of ways. This report uses the Canadian Institute for Health Information’s (CIHI’s) NHEX Database as the starting point for the forecasts. This is justified by the fact that CIHI’s data is widely recognized as being both reliable and objective and is most often used by other researchers interested with health care public policy issues. Also, it allows for a greater and easier breakdown of expenditures components. Still, the reader must keep in mind CIHI’s own warning:
[Statistics Canada’s Financial Management System (FMS)’s] public-sector health spending estimates are lower than those reported by CIHI because different classification methods are applied and a narrower definition of health expenditures is used in the FMS.24
Even though the Canada Health Transfer (CHT) is managed on the basis of fiscal years ending on March 31 of each year, this report looks at health expenditures on a calendar-year basis. This is justified by the fact that the NHEX Database provides more details on a calendar-year basis than on a fiscal-year basis. In Chapter 11, CHT payments are converted from a fiscal-year basis to a calendar-year basis using rules consistent with CIHI’s methodology. The starting point for projections is calendar year 2012. It must be noted that CIHI’s figures for 2012 are estimates, which are taken as is so as to initiate discussions on solid ground that is widely recognized. Health expenditures funded by provinces/territories are available by age and gender for some types of expenditures. These are, however, only available up to the year 2010. They are then projected to 2012 in a way that ensures that the resulting total health expenditures, by type of expenditures, match CIHI’s estimates. They are also used in some instances as a b asis for projecting health care expenditures funded by other public and private sectors and directly by Canadians.
24 CIHI, 2011c.

© 2013 Society of Actuaries and Canadian Institute of Actuaries, All Rights Reserved Stephane Levert Consulting Services Inc. Page 11
Current Cost of the Canadian Health Care System Health care expenditures are broken down using a two-dimension matrix, based on types of expenditures and payers.25
Figure 3.1 shows how total health care expenditures are distributed amongst the various types, for all payers combined. Excluding expenditures related to capital, public health, administration, health research and other health spending, it shows that hospital and physician expenditures use about 54 percent of total health care expenditures. Thus, about 46 percent of total health care expenditures—close to one-half—are used for services that were not originally covered by the Canada Health Act of 1984.
Figure 3.2 shows how total health expenditures are distributed by payers. They include the public sector and the private sector, the latter including payments made by insurance companies 26
• The provincial and territorial government sector includes health care expenditures of provinces/territories, including what is financially supported by the CHT.
or employer-sponsored benefit plans, and out-of-pocket payments by Canadians. The public sector is also broken down into the following segments:
• The federal direct sector includes health care expenditures of the federal government—excluding the CHT—typically for special groups, such as the First Nations,27
• The municipal government sector includes health care expenditures of municipalities for institutional services, public health and dental services in some provinces. Fund transfers from provinces/territories are not counted here, but rather stay under the provincial and territorial government sector.
the military, the RCMP and veterans, as well as direct expenditures for research and health promotion.
• Finally, the social security funds sector includes health care expenditures of workers’ compensation boards, plus the premium paid by participants to the Quebec Drug Insurance Fund.28
25 What is included under each type of health care expenditures is defined in Chapters 5 to 10. 26 Including not-for-profit companies and including the administrative costs, out-of-pocket health care expenditures, plus any other private health-related expenditure such as private capital expenditures and private research. 27 First Nations is the largest group that the federal government is directly responsible for, as Native people are a federal responsibility and are guaranteed complete coverage of their health care needs. 28 The excess of drug expenditures paid out of the Quebec Drug Insurance Fund over the premium contributed is funded with Quebec’s general revenues and is included in the respective provincial government health care expenditures sector.
Figure 3.1: Distribution of Health Care Expenditures, 2012, by Use of Funds
29%
14% 11%
11%
16%
5% 5%
3% 2% 4% Hospitals
Physicians
Other institutions
Other professionals
Drugs
Capital
Public health
Administration
Health research
Other health spending Source: CIHI, 2012b.

© 2013 Society of Actuaries and Canadian Institute of Actuaries, All Rights Reserved Stephane Levert Consulting Services Inc. Page 12
Figure 3.2 shows that provinces/territories are funding 65 percent of the total health care expenditures and the private sector 30 percent (including out-of-pocket payments by Canadians), leaving 5 percent to the remaining public-sector participants.
International Comparison Table 3.1 compares the health care expenditures in Canada to selected OECD countries, showing what is funded by public and private sources (including out-of-pocket payments by Canadians) on a per capita basis. Total per capita health care expenditures are significantly (46 percent) lower in Canada than in the United States. However, Canada still ranks as the fifth most expensive country on a per capita basis. As a percentage of GDP, the United States stands out again as having an expensive health care system, while Canada also ranks in the second quartile of the most expensive countries.
Table 3.1: Comparison of Canadian Health Care Expenditures with Selected OECD Countries, 2010 ($US)
Country
Public Health Care
Expenditures
Private and Out-of-Pocket Health
Care Expenditures
Total Health Care Expenditures
Public Share of Total Health
Care Expenditures Per
capita % of GDP
Per capita
% of GDP
Per capita
% of GDP
Austria 3,349 8.4% 1,046 2.6% 4,395 11.0% 76% Belgium 3,000 7.9% 969 2.6% 3,969 10.5% 76% Canada 3,158 8.1% 1,287 3.3% 4,445 11.4% 71% Chile 579 3.9% 623 4.1% 1,202 8.0% 48% Czech Republic 1,578 6.3% 306 1.2% 1,884 7.5% 84% Denmark 3,800 9.4% 664 1.7% 4,464 11.1% 85% Estonia 1,020 5.0% 274 1.3% 1,294 6.3% 79% Finland 2,422 6.6% 829 2.3% 3,251 8.9% 75% France 3,061 8.9% 913 2.7% 3,974 11.6% 77% Germany 3,331 8.9% 1,007 2.7% 4,338 11.6% 77% Hungary 1,037 5.1% 564 2.7% 1,601 7.8% 65% Iceland 2,662 7.5% 647 1.8% 3,309 9.3% 80% Ireland 2,585 6.4% 1,133 2.8% 3,718 9.2% 70% Italy 2,359 7.4% 605 1.9% 2,964 9.3% 80% Korea 1,185 4.1% 850 3.0% 2,035 7.1% 58% Mexico 433 2.9% 483 3.3% 916 6.2% 47% New Zealand 2,515 8.4% 507 1.7% 3,022 10.1% 83% Norway 4,607 8.0% 781 1.4% 5,388 9.4% 86% Poland 995 5.0% 394 2.0% 1,389 7.0% 72% Slovak Republic 1,351 5.8% 744 3.2% 2,095 9.0% 64% Slovenia 1,768 6.6% 660 2.4% 2,428 9.0% 73% Sweden 3,046 7.8% 712 1.8% 3,758 9.6% 81% Switzerland 3,437 7.4% 1,833 4.0% 5,270 11.4% 65% United Kingdom 2,857 8.0% 576 1.6% 3,433 9.6% 83% United States 3,967 8.5% 4,266 9.1% 8,233 17.6% 48% Source: OECD Health Data 2012.
Figure 3.2: Distribution of Health Care Expenditures, 2012, by Payer
65%
3% 0%
1% 30%
Provincial and territorial governments Federal direct Municipal governments Social security funds Private sector
Source: CIHI, 2012b.

© 2013 Society of Actuaries and Canadian Institute of Actuaries, All Rights Reserved Stephane Levert Consulting Services Inc. Page 13
Measurement Items to Project With the Canada Health Transfer being meant to support provinces/territories in funding the principles of the Canada Health Act of 1984, a strict view on total health care expenditures is limited to hospital and physician services (those falling under the act) in isolation from other types of expenditures. The current costs of such health care services are summarized in Table 3.2. Provinces/territories are funding close to the entire cost, with support from the federal government through the CHT, and with 65 percent of the funds going to hospitals and 35 percent to physicians. This is referred to as the Canada Health Act perspective in Chapter 11. Then, and i n order to recognize the interests of other stakeholders, a broad view on total health care expenditures also forecasts health care expenditures not required by the Canada Health Act which may be funded by provinces/territories or other parties (municipal governments, social security funds and the private sector, including out-of-pocket payments). The current cost of these health care services is summarized in Table 3.3.
Table 3.3: Health Care Expenditures, Broad Perspective, 2012 (millions of dollars)
Provincial/ Territorial
Governments
Federal Direct
Municipal Governments
Social Security Funds
Private Sector
and Out-of-Pocket Payments
Total % of GDP
Physician Expenditures 29,015.0 224.8 0.0 316.5 400.4 29,956.7 1.8% Hospital Expenditures 53,924.8 326.0 36.2 370.9 5,864.9 60,522.7 3.6% Other Institutions 15,913.9 124.2 0.0 13.2 6,397.0 22,448.2 1.3% Other Professionals 1,102.5 346.2 0.8 343.9 20,482.3 22,275.7 1.3% Drugs 10,677.1 597.0 0.0 1,005.7 20,695.6 33,025.5 2.0% Other Health Spending 24,318.4 4,495.4 842.7 592.4 8,939.2 39,188.1 2.3%
Total 134,951.7 6,113.5 879.7 2,692.5 62,779.4 207,416.9 12.4% 65.1% 2.9% 0.4% 1.3% 30.3% 100.0%
Source: CIHI, 2012b. For the definition of “Other Institutions” see Chapter 7; “Other Professionals” Chapter 8 and “Other Health Spending” Chapter 10.
Table 3.2: Health Care Expenditures, Canada Health Act Perspective (strict), 2012 (millions of dollars)
Provincial/ Territorial
Governments
Federal Direct Total % of
GDP
Physician Expenditures 29,015.0 224.8 29,239.8 1.7% Hospital Expenditures 53,924.8 326.0 54,250.7 3.2%
Total 82,939.8 550.8 83,490.6 5.0% 99.3% 0.7% 100.0%
Source: CIHI, 2012b.

© 2013 Society of Actuaries and Canadian Institute of Actuaries, All Rights Reserved Stephane Levert Consulting Services Inc.
Page 14
Chapter 4—Economic and Demographic Models This report is distinguished from other similar work by adopting an actuarial approach to the task of forecasting the future costs of the Canadian health care system: instead of projecting health care expenditures using macroeconomic techniques, they are modeled using assumptions about the expected demographic profile. Likewise, the ability of the Canadian economy to absorb the expected costs of the health care system is assessed using an economic model that also relies on demographic projections. This chapter briefly introduces the demographic model used in this research, the reader being invited to refer to Appendix 2 for a more detailed discussion. Then, consideration is given to issues in relation to the supply of physicians. Finally, the economic model is presented, with the reader invited to refer to Appendix 3 for more details.
Demographic Model The starting point is the Canadian demographic profile as published by Statistics Canada and taken from the 2011 census. Then, population forecasts published by Statistics Canada are analyzed and used, with this report referring to their medium-growth scenario as our base scenario. Projections are based on
assumptions about fertility, mortality, international immigration, emigration and inter-provincial migration. Population projections using different demographic scenarios are displayed in Figure 4.1. Under the base scenario, the Canadian population is expected to grow from 33.9 million in 2012 to 42.8 million in 2037, a 0.9 percent annual growth rate. This is consistent with other research, including Drummond.29 By contrast, the growth rate would be equal to 0.6 percent under the low-growth scenario, and 1.3 percent under the high-growth scenario. Ontario, Alberta and British Columbia are expected to grow faster than the national average, with Quebec growing at a slower pace and the Atlantic provinces only marginally growing (except for Prince Edward Island).30
29 Drummond, Don, and Derek Burleton. 2010. Charting a Path to Sustainable Healthcare in Ontario: 10 Proposals to Restrain Cost Growth Without Compromising Quality of Care. TD Economics, May 27. 30 Refer to Table A2.10 in Appendix 2 to see the expected growth rates by province and territory under the three demographic scenarios.
Figure 4.1: Projected Population, Total Canada, 2011 to 2037 (in thousands)
33,000
35,000
37,000
39,000
41,000
43,000
45,000
47,000
49,000
Low-growth scenario
High-growth scenario
Base scenario
Source: Statistics Canada, CANSIM Tables 051-0001 and 052-0005, OSFI, 2010, and calculations by the author.

© 2013 Society of Actuaries and Canadian Institute of Actuaries, All Rights Reserved Stephane Levert Consulting Services Inc. Page 15
Sensitivity of the results of this report was tested. For instance, this research found that the low-growth scenario would result in health care expenditures of provinces/territories to be 6.1 percent lower in 25 years.
Supply of Physicians Considerations A significant cost escalator of the Canadian health care system relates to the supply of physicians. Firstly, physicians impact the cost of the Canadian health care system as a direct result of the dollars spent for their services. Secondly, “[they play a] role in generating other costs in the system, such as ordering laboratory tests, diagnostic procedures, medications and admitting patients to health care facilities.”31
There are instances where governments have used—and may still be using—controls over the supply of physicians as a health care cost containment tool. Meanwhile, interest groups claim that there is a shortage of medical practitioners in Canada.
This report considers staffing issues, taking a neutral and objective position. Our finding is that the supply of physicians needs to increase by at least 46 percent over the next 25 years just to keep up w ith increased demand resulting from the aging of the population.
Economic Model Future health care expenditures are compared to the ability of the Canadian economy and, more specifically, to the financial position of provinces/territories, to assess the sustainability of the Canadian health care system and to evaluate the eventual implications of the proposed changes to the Canada Health Transfer (CHT). The metric used by this report is the gross domestic product (GDP), expressed in constant 2012 dollars. A detailed presentation of the economic model developed in this research is found in Appendix 3. Briefly, real GDP is projected using an expected working population growth pattern consistent with that used in the projection of health care expenditures, and an assumed productivity gain factor of 1.31 percent (consistent with the average over the past 25 years), on average for Canada. The resulting real GDP forecast is shown on Table 4.1. Under the base scenario, real GDP is expected to grow at an annual rate of 1.6 percent in aggregate from 2012 t o 2037 (it would grow at annual rates of 1.3 percent and 1.9 percent, respectively, if using the low-growth or high-growth demographic scenarios). This falls short of the 2.7 percent historical real growth rate observed from 1981 to 2008. This is explained by demographic factors, the working population expected to grow at an annual rate of 0.4 percent over the next 25 years, whereas it has historically grown at an annual rate of 1.4 percent. This implies that achieving future economic growth similar to past
31 Conference Board of Canada. 2004. Understanding Health Care Cost Drivers and Escalators.
Table 4.1: GDP Projections, Total Canada, 2012 to 2037 (millions of constant 2012 dollars)
Year Low-
Growth Scenario
Base Scenario
High-Growth
Scenario 2012 1,675,443 1,676,310 1,677,115 2013 1,705,412 1,709,366 1,713,320 2014 1,735,000 1,742,226 1,749,461 2015 1,763,929 1,774,686 1,785,415 2016 1,791,761 1,806,251 1,820,676 2017 1,817,938 1,836,296 1,854,761 2018 1,841,954 1,864,421 1,887,066 2019 1,863,903 1,890,781 1,917,958 2020 1,885,009 1,916,258 1,948,268 2021 1,905,557 1,941,629 1,978,470 2022 1,925,094 1,966,228 2,008,371 2023 1,944,495 1,990,965 2,038,488 2024 1,964,528 2,016,412 2,069,843 2025 1,983,762 2,041,459 2,100,908 2026 2,003,394 2,066,947 2,132,792 2027 2,024,157 2,093,944 2,166,351 2028 2,044,647 2,121,088 2,200,502 2029 2,066,667 2,149,748 2,236,434 2030 2,089,958 2,181,737 2,276,986 2031 2,116,654 2,218,183 2,323,136 2032 2,145,711 2,258,035 2,374,077 2033 2,175,427 2,299,566 2,428,357 2034 2,205,052 2,342,380 2,484,968 2035 2,234,881 2,385,857 2,542,984 2036 2,265,378 2,430,366 2,602,593 2037 2,296,554 2,476,011 2,663,987 Source: Statistics Canada, CANSIM Tables 051-0001 and 384-0002 and calculations by the author.

© 2013 Society of Actuaries and Canadian Institute of Actuaries, All Rights Reserved Stephane Levert Consulting Services Inc. Page 16
experience would require future productivity gains to be about 1 percent higher, at a level of 2.3 percent instead of the historical average of 1.31 percent. Should action take place resulting in such result, then total health care expenditures of provinces/territories will be equal to 55.6 percent of their total revenues, as opposed to 70.6 percent under the base scenario. Likewise, it will use 4.0 percent less economic resources (GDP) than under the base scenario.

© 2013 Society of Actuaries and Canadian Institute of Actuaries, All Rights Reserved Stephane Levert Consulting Services Inc.
Page 17
Chapter 5—Projection of Physician Expenditures Physician expenditures are the second-largest use of health care funds in Canada, representing 14 percent of all health care expenditures, for all payers combined, and 22 percent of the health care expenditures of provinces/territories. This chapter first looks at the current structure of physician expenditures, before projecting them for the next 25 years. Physician supply considerations are then discussed.
Introduction Physician expenditures consist mainly in payments made to physicians and s pecialists by the provincial/territorial health insurance programs.32
These may be in relation to services rendered in private clinics or in hospitals. Remuneration associated to physicians who are on the payrolls of hospitals or other public-sector health agencies is not included in this category.
Current Costs Table 5.1 shows physician expenditures by payer and by province/territory. It s hows that provinces/territories are responsible for close to 97 percent of all physician expenditures, leaving a mere 2 percent to other public sectors. The private sector (including out-of-pocket payments by Canadians) assumes slightly more than 1 percent of costs, essentially as a result of some patients electing to use physicians who are not enrolled in the public health insurance programs.
Table 5.1: Total Physician Expenditures, 2012, by Payer
Province/Territory
Provincial/Territorial Government Sector
Private Sector and Out-of-Pocket Payments Total
Total (millions of $)
Per capita ($)
Total (millions of $)
Per capita ($)
Total (millions of $)
Per capita ($)
% of GDP
Newfoundland & Labrador 451.8 887 1.9 4 461.9 907 2.0% Prince Edward Island 103.3 706 0.4 2 104.9 717 2.0% Nova Scotia 741.1 783 10.2 11 764.7 808 2.2% New Brunswick 590.3 781 3.7 5 607.2 803 2.1% Quebec 5,643.6 702 148.4 18 5,834.2 726 1.7% Ontario 12,089.7 894 71.0 5 12,325.5 911 1.8% Manitoba 1,030.2 816 11.0 9 1,077.2 853 2.0% Saskatchewan 907.9 849 0.0 0 938.0 877 1.9% Alberta 3,518.6 913 79.2 21 3,733.7 969 1.4% British Columbia 3,807.4 819 74.5 16 3,975.8 856 1.9% Yukon 29.9 854 0.0 0 30.6 873 1.4% Northwest Territories 50.8 1,152 0.0 0 52.0 1,179 1.4% Nunavut 50.4 1,496 0.0 0 51.2 1,518 3.4% Total Canada 29,015.0 832 400.4 11 29,956.7 859 1.8% Prov./Terr. Governments 29,015.0 832 Federal Direct 224.8 6
Social Security Funds 316.5 9
Total 29,556.3 848 400.4 11 29,956.7 859 1.8% Source: CIHI, 2012b.
32 CIHI, 2012b. Physician expenditures are defined so as to “include primarily professional fees paid by provincial/territorial medical care insurance plans to physicians in private practice. Fees for services rendered in hospitals are included when paid directly to physicians by the plans. Also included are other forms of professional income (salaries, sessional, capitation).”

© 2013 Society of Actuaries and Canadian Institute of Actuaries, All Rights Reserved Stephane Levert Consulting Services Inc. Page 18
It is noteworthy that $29.2 billion of physician expenditures (98 percent of the total physician expenditures) fall under the scope of the Canada Health Act of 1984,33
which the Canada Health Transfer (CHT) is designed to support. Also, they account for 35 percent of the total health care expenditures falling under the scope of the Canada Health Act of 1984.
Figure 5.1 shows that total physician expenditures have increased at an annual real rate of 4.5 percent—on top of inflation—over the past 15 years (from $15.4 billion of constant 2012 dollars in 1997 to $30.0 billion in 2012). Meanwhile, per capita physician expenditures have increased at a real rate of 3.5 percent.
Per capita physician expenditures of provinces/territories follow the pattern shown on Figure 5.2 by age and gender. Actual data for the year 2010 is published by the Canadian Institute for Health Information (CIHI). It is then projected to 2012 using the demographic model presented in Chapter 4 by ensuring that the total resulting physician expenditures match the estimate shown on Table 5.1. After consuming significant physician resources in their early years, an individual’s usage drops to the lowest level of his lifetime—between ages 5 and 14 for females and 5 and 29 for males—before climbing gradually. Women appear to be using more physician resources than males during their working lives—especially during their child-bearing years—with costs being 160 percent higher at ages 30 to 34 and 28 percent higher at ages 50 to 54. Men use more physician resources in the later years, with costs being 15 percent higher at ages 75 to 79 and 18 percent higher at ages 85 to 89.
Projections The actual physician expenditures from 1996 to 2010 are analyzed to identify components of growth.34
33 Equal to the sum of $29.0 billion paid by provinces/territories and $0.2 billion paid directly by the federal government.
Table 5.2 shows that aging and population growth appear to have a consistent effect across
34 Isolating components of real growth follow the following methodology: Step 1. Calculate the rate of growth in the actual per capita expenditures from 1996 to 2010 for each age and
gender cell, on a constant dollar basis. This gives the rate in increases—on top of inflation—in the price of health care services provided for each age/gender cell.
Step 2. Then, the resulting real rate of increase for each age/gender cell is applied to the actual total expenditures in 1996. This gives the total expenditures that would result from “real price inflation” assuming no change in the demographic mix.
Step 3. Finally, the result from Step 2 is subtracted from the total actual health care expenditures in 2010. This gives the expenditure increase associated with the effect of aging and population growth.
Figure 5.1: Historical Physician Expenditures, 1997 to 2012 (millions of constant 2012 dollars)
0
5,000
10,000
15,000
20,000
25,000
30,000
35,000 19
97
1998
19
99
2000
20
01
2002
20
03
2004
20
05
2006
20
07
2008
20
09
2010
20
11
2012
Other sectors
Provincial and territorial governments
Figure 5.2: Per Capita Physician Expenditures of Provinces/Territories, 2012
$0
$500
$1,000
$1,500
$2,000
$2,500
$3,000
<1
1-4
5-9
10-1
4 15
-19
20-2
4 25
-29
30-3
4 35
-39
40-4
4 45
-49
50-5
4 55
-59
60-6
4 65
-69
70-7
4 75
-79
80-8
4 85
-89
90+
Female Male
Source: CIHI, 2012b and calculations by the author.

© 2013 Society of Actuaries and Canadian Institute of Actuaries, All Rights Reserved Stephane Levert Consulting Services Inc. Page 19
provinces/territories, typically staying in the 0.6 to 1.9 percent range with the exception of Alberta (due to significant positive inter-provincial migration resulting from developments in the oil and gas sector). Real price inflation in physician expenditures, on an age/gender-neutral basis, has averaged 3 percent. It is composed of: (1) increases in fee-for-service prices, and (2) trends in the utilization of physician services by the population—mostly variations in the supply of physicians on a per capita basis—except because of aging and population growth. Labour costs are a significant driver of health-sector inflation. The most notable areas of inflation have been the cost of physician services and the differential between wages in the
health and social assistance sector. […] The relative increases in fees and payments for physician services will be an important issue for health system decision-makers to monitor in the future […].35
Using the observed historical trends in physician remuneration (that is, assuming that per capita expenditures will grow at an annual real rate of 3.0 percent—on top of inflation—over the entire projection period) would result in total physician expenditures of provinces/territories growing at an annual rate of 4.5 percent, from $29.0 billion (1.7 percent of GDP) in 2012 to 88.4 billion of constant 2012 dollars (3.6 percent of GDP) in 2037.36
The share of physician expenditures of provinces/territories would grow at an annual real rate of 4.6 percent. Such assumption assumes that historical trends will continue in the future, with no action taken to contain costs. This report considers this scenario as extreme since it is very unlikely that governments will let those expenditures sky-rocket in such a way as they will then simply become unaffordable. Therefore, this report assumes that some unspecified public action will be taken, resulting in future expenditure increases to eventually converge closer to general inflation.
Consequently, the projection model used in this report assumes that the real per capita physician expenditures will grow at an annual rate of 2.5 percent per year for the first five years, and then at a decreasing rate (reflecting action taken to reduce the growth rate) until reaching 1.0 percent in 2037, on top of general inflation and in addition to the combined effects of aging and population growth. With the assumed government action to limit the increase in physicians remuneration, total projected physician expenditures for all payers are equal to 67.1 billion of constant 2012 dollars in 2037 (down from 88.4 billion assuming no government action—a savings of 24 percent). Table 5.3 summarizes key findings from the projection of physician expenditures of provinces/territories and the sensitivities of the assumptions used.
35 CIHI, 2011b. 36 The methodology adopted by this research consists in applying real per capita physician expenditures of provinces/territories to the projected demography to arrive at total real physician expenditures. This technique captures the combined effects of population growth and aging. It also reflects an implicit assumption that the actual supply of physicians follows the increasing needs of an aging population.
Table 5.2: Components of Physician Expenditures Growth, 1996 to 2010, by Province and Territory (constant 2012 dollar basis)
Province Aging and Population
Growth
Real Price
Inflation
Total Real
Growth Newfoundland & Labrador 0.6% 5.7% 6.3% Prince Edward Island 0.6% 5.9% 6.5% Nova Scotia 1.0% 4.5% 5.5% New Brunswick 0.8% 4.6% 5.4% Quebec 1.5% 2.6% 4.0% Ontario 1.9% 2.6% 4.6% Manitoba 1.1% 4.7% 5.8% Saskatchewan 0.6% 5.2% 5.8% Alberta 2.9% 4.9% 7.8% British Columbia 1.9% 1.5% 3.4% Canada 1.8% 3.0% 4.8% Source: CIHI, 2012b and calculations by the author.

© 2013 Society of Actuaries and Canadian Institute of Actuaries, All Rights Reserved Stephane Levert Consulting Services Inc. Page 20
Table 5.3: Summary of Projections of Physician Expenditures of Provinces/Territories
Physician Expenditures of Provinces/Territories (millions of constant 2012 dollars, where applicable)
Expenditures Growth
Annual Increase Due to Aging and Population
Growth
Annual Increase Due to Real Cost
Total Annual Increase
Total Physician Expenditures of
Provinces/Territories
as a % of GDP
Historical Pattern from 1996 to 2010 1.8% 3.0% 4.8% 2012 : 29,015 1.7% Projection Using Historical Real Cost Growth 1.6% 3.0% 4.6% 2037 : 88,404 3.6% Projection Using Base Scenario 1.5% 1.9% 3.4% 2037 : 67,076 2.7% Projection Assumption Under Base Scenario Trend of 2.5% for five years, dropping to 1.0% after 25 years
Sensitivity Testing
Projection Assumptions Tested
Annual Increase Due to Aging and Population
Growth
Annual Increase Due to Real Cost
Total Annual Increase
Total Physician Expenditures of
Provinces/Territories
as a % of GDP
Demographic Model Optimistic: Low-Growth 1.3% 1.9% 3.1% 2037 : 62,661 2.7% Pessimistic: High-Growth 1.8% 1.9% 3.7% 2037 : 71,630 2.7% Physician Cost Optimistic: -1.0% 1.5% 0.9% 2.4% 2037 : 52,415 2.1% Pessimistic: +1.0% 1.6% 2.9% 4.4% 2037 : 85,631 3.5%
Table 5.4 shows the projected physician expenditures of provinces/territories from 2012 to 2037 under the base scenario. They grow at an average rate of 3.4 percent per year, on top of general inflation—1.9 percent due to price increases and 1.5 percent due to aging and population growth. This research shows that the combined effects of aging and population growth vary by province/territory, from 0.9 percent in Newfoundland & Labrador and Yukon to 1.8 percent in Alberta and British Columbia, with a national average of 1.5 percent, as displayed in Figure 5.3. By contrast, Drummond uses a c ombined trend factor of 2.0 percent in Ontario for aging and population growth, 37
compared to 1.5 percent for physician services in this report.
37 Drummond, Don, and Derek Burleton. 2010. Charting a Path to Sustainable Healthcare in Ontario: 10 Proposals to Restrain Cost Growth Without Compromising Quality of Care. TD Economics, May 27.
Figure 5.3: Components of Projected Physician Expenditure Growth, 2012 to 2036, Base Scenario (constant 2012 dollar basis)
0.0% 0.5% 1.0% 1.5% 2.0% 2.5% 3.0% 3.5% 4.0%
New
foun
dlan
d &
Lab
rado
r P
rince
Edw
ard
Isla
nd
Nov
a S
cotia
N
ew B
runs
wic
k Q
uebe
c O
ntar
io
Man
itoba
S
aska
tche
wan
A
lber
ta
Brit
ish
Col
umbi
a Yu
kon
Nor
thw
est T
errit
orie
s N
unav
ut
Can
ada
Aging and Population Growth Real Cost Increase
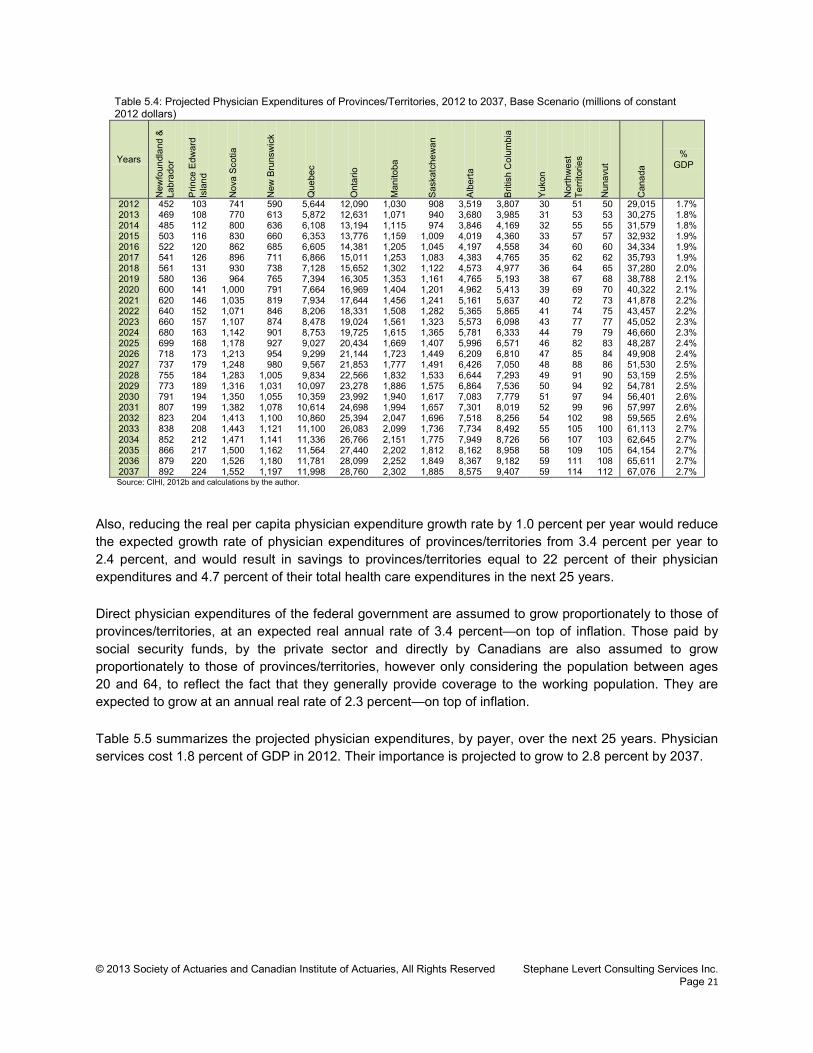
© 2013 Society of Actuaries and Canadian Institute of Actuaries, All Rights Reserved Stephane Levert Consulting Services Inc. Page 21
Table 5.4: Projected Physician Expenditures of Provinces/Territories, 2012 to 2037, Base Scenario (millions of constant 2012 dollars)
Years N
ewfo
undl
and
&
Labr
ador
Prin
ce E
dwar
d Is
land
Nov
a S
cotia
New
Bru
nsw
ick
Que
bec
Ont
ario
Man
itoba
Sas
katc
hew
an
Alb
erta
Brit
ish
Col
umbi
a
Yuk
on
Nor
thw
est
Terri
torie
s
Nun
avut
Can
ada
% GDP
2012 452 103 741 590 5,644 12,090 1,030 908 3,519 3,807 30 51 50 29,015 1.7% 2013 469 108 770 613 5,872 12,631 1,071 940 3,680 3,985 31 53 53 30,275 1.8% 2014 485 112 800 636 6,108 13,194 1,115 974 3,846 4,169 32 55 55 31,579 1.8% 2015 503 116 830 660 6,353 13,776 1,159 1,009 4,019 4,360 33 57 57 32,932 1.9% 2016 522 120 862 685 6,605 14,381 1,205 1,045 4,197 4,558 34 60 60 34,334 1.9% 2017 541 126 896 711 6,866 15,011 1,253 1,083 4,383 4,765 35 62 62 35,793 1.9% 2018 561 131 930 738 7,128 15,652 1,302 1,122 4,573 4,977 36 64 65 37,280 2.0% 2019 580 136 964 765 7,394 16,305 1,353 1,161 4,765 5,193 38 67 68 38,788 2.1% 2020 600 141 1,000 791 7,664 16,969 1,404 1,201 4,962 5,413 39 69 70 40,322 2.1% 2021 620 146 1,035 819 7,934 17,644 1,456 1,241 5,161 5,637 40 72 73 41,878 2.2% 2022 640 152 1,071 846 8,206 18,331 1,508 1,282 5,365 5,865 41 74 75 43,457 2.2% 2023 660 157 1,107 874 8,478 19,024 1,561 1,323 5,573 6,098 43 77 77 45,052 2.3% 2024 680 163 1,142 901 8,753 19,725 1,615 1,365 5,781 6,333 44 79 79 46,660 2.3% 2025 699 168 1,178 927 9,027 20,434 1,669 1,407 5,996 6,571 46 82 83 48,287 2.4% 2026 718 173 1,213 954 9,299 21,144 1,723 1,449 6,209 6,810 47 85 84 49,908 2.4% 2027 737 179 1,248 980 9,567 21,853 1,777 1,491 6,426 7,050 48 88 86 51,530 2.5% 2028 755 184 1,283 1,005 9,834 22,566 1,832 1,533 6,644 7,293 49 91 90 53,159 2.5% 2029 773 189 1,316 1,031 10,097 23,278 1,886 1,575 6,864 7,536 50 94 92 54,781 2.5% 2030 791 194 1,350 1,055 10,359 23,992 1,940 1,617 7,083 7,779 51 97 94 56,401 2.6% 2031 807 199 1,382 1,078 10,614 24,698 1,994 1,657 7,301 8,019 52 99 96 57,997 2.6% 2032 823 204 1,413 1,100 10,860 25,394 2,047 1,696 7,518 8,256 54 102 98 59,565 2.6% 2033 838 208 1,443 1,121 11,100 26,083 2,099 1,736 7,734 8,492 55 105 100 61,113 2.7% 2034 852 212 1,471 1,141 11,336 26,766 2,151 1,775 7,949 8,726 56 107 103 62,645 2.7% 2035 866 217 1,500 1,162 11,564 27,440 2,202 1,812 8,162 8,958 58 109 105 64,154 2.7% 2036 879 220 1,526 1,180 11,781 28,099 2,252 1,849 8,367 9,182 59 111 108 65,611 2.7% 2037 892 224 1,552 1,197 11,998 28,760 2,302 1,885 8,575 9,407 59 114 112 67,076 2.7% Source: CIHI, 2012b and calculations by the author.
Also, reducing the real per capita physician expenditure growth rate by 1.0 percent per year would reduce the expected growth rate of physician expenditures of provinces/territories from 3.4 percent per year to 2.4 percent, and would result in savings to provinces/territories equal to 22 percent of their physician expenditures and 4.7 percent of their total health care expenditures in the next 25 years. Direct physician expenditures of the federal government are assumed to grow proportionately to those of provinces/territories, at an expected real annual rate of 3.4 percent—on top of inflation. Those paid by social security funds, by the private sector and directly by Canadians are also assumed to grow proportionately to those of provinces/territories, however only considering the population between ages 20 and 64, to reflect the fact that they generally provide coverage to the working population. They are expected to grow at an annual real rate of 2.3 percent—on top of inflation. Table 5.5 summarizes the projected physician expenditures, by payer, over the next 25 years. Physician services cost 1.8 percent of GDP in 2012. Their importance is projected to grow to 2.8 percent by 2037.

© 2013 Society of Actuaries and Canadian Institute of Actuaries, All Rights Reserved Stephane Levert Consulting Services Inc. Page 22
Table 5.5: Projected Physician Expenditures, 2012 to 2037, by Payer, Base Scenario (millions of constant 2012 dollars)
Years Provincial/ Territorial
Governments
Federal Government
Municipal Governments
Social Security Funds
Total Public Sector
Private Sector and
Out-of-Pocket
Payments
Total % of GDP
2012 29,015 225 0 316 29,556 400 29,957 1.8% 2013 30,275 235 0 328 30,837 414 31,251 1.8% 2014 31,579 245 0 339 32,163 428 32,592 1.9% 2015 32,932 255 0 351 33,539 443 33,981 1.9% 2016 34,334 266 0 363 34,963 457 35,421 2.0% 2017 35,793 277 0 375 36,445 472 36,917 2.0% 2018 37,280 289 0 386 37,955 485 38,441 2.1% 2019 38,788 301 0 397 39,486 498 39,984 2.1% 2020 40,322 312 0 407 41,042 511 41,552 2.2% 2021 41,878 324 0 418 42,620 523 43,143 2.2% 2022 43,457 337 0 427 44,221 534 44,755 2.3% 2023 45,052 349 0 437 45,838 545 46,383 2.3% 2024 46,660 362 0 446 47,468 556 48,024 2.4% 2025 48,287 374 0 455 49,116 566 49,682 2.4% 2026 49,908 387 0 463 50,758 576 51,333 2.5% 2027 51,530 399 0 471 52,400 585 52,985 2.5% 2028 53,159 412 0 478 54,049 594 54,643 2.6% 2029 54,781 424 0 486 55,691 603 56,294 2.6% 2030 56,401 437 0 494 57,331 614 57,945 2.7% 2031 57,997 449 0 503 58,949 625 59,574 2.7% 2032 59,565 462 0 513 60,539 637 61,177 2.7% 2033 61,113 473 0 523 62,110 650 62,759 2.7% 2034 62,645 485 0 533 63,664 662 64,326 2.7% 2035 64,154 497 0 543 65,195 675 65,869 2.8% 2036 65,611 508 0 553 66,673 687 67,360 2.8% 2037 67,076 520 0 563 68,159 699 68,858 2.8%
Supply of Physicians Considerations Tables 5.6 and 5.7 show the total number of physicians and per capita number of physicians in Canada in 2010,38 as well as comparative per capita metrics for other industrialized countries.39
Canada ranks as the seventh lowest (out of 34) among the OECD countries in terms of per capita number of physicians, and the lowest among the G7 countries.
38 CIHI, 2011d. 39 OECD Health Data, 2012.
Table 5.7: Supply of Physicians, 2010, by Province and Territory, 2010
Total per
100,000 Newfoundland & Labrador 1,152 226 Prince Edward Island 236 164 Nova Scotia 2,126 225 New Brunswick 1,546 205 Quebec 17,797 224 Ontario 25,044 189 Manitoba 2,311 186 Saskatchewan 1,778 169 Alberta 7,882 211 British Columbia 9,708 213 Yukon 72 210 Northwest Territories 34 78 Nunavut 13 39 Canada 69,699 203 Source: CIHI, 2011d
Table 5.6: Comparison of Supply of Physicians in Canada and the OECD, 2012
per 1,000
Canada 2.03 United States 2.44 Other G7 Countries: - France 3.27 - Germany 3.73 - Italy 3.68 - Japan 2.23 - United Kingdom 2.71 G7 Average 2.87 OECD Average 3.10 Source: CIHI, 2011d and OECD Health Data 2012.

© 2013 Society of Actuaries and Canadian Institute of Actuaries, All Rights Reserved Stephane Levert Consulting Services Inc. Page 23
Now, applying the adopted demographic model to the current age/gender per capita physician expenditures curve implies that the supply of physicians will increase by about 46 percent on average in Canada over the 25-year projection period as shown on Table 5.8. Ontario, Alberta and British Columbia will need to increase their supply of physicians by at least 50 percent just to keep up with demand for services as a result of aging and population growth—not to fill any perceived gap—while the requirement for the Atlantic provinces, Quebec and Saskatchewan will be more modest. It is interesting to note that the 46 percent implied increase in the supply of physicians in Canada over the 25-year projection period is pretty close to the current gap of 41 percent between the per capita supply of physicians in Canada and the average of the G7 countries. Care must however be used as no definite conclusion can be reached from this simple fact. The current gap between Canada and the average of the G7 countries may result from structural differences in the delivery of health care, which has no impact on the outcomes and from different demographics. Also, it would not be s urprising to see the G7 countries changing their way of delivering health care in the next 25 years.
Table 5.8: Implied Cumulative Increase in Supply of Physicians, 2012 to 2037, by Province and Territory, Base Scenario
Newfoundland & Labrador 24% Prince Edward Island 37% Nova Scotia 32% New Brunswick 28% Quebec 34% Ontario 50% Manitoba 41% Saskatchewan 31% Alberta 53% British Columbia 56% Yukon 24% Northwest Territories 41% Nunavut 39% Canada 46%

© 2013 Society of Actuaries and Canadian Institute of Actuaries, All Rights Reserved Stephane Levert Consulting Services Inc.
Page 24
Chapter 6—Projection of Hospital Expenditures Hospital services are at the center, with physician services, of the Canada Health Act of 1984. They are the largest expenditures component, accounting for 29 percent of all health care expenditures from all sources of funds, and 40 percent of health care expenditures of provinces/territories. This chapter first looks at the current structure of hospital expenditures, before projecting them into the future.
Introduction Hospital expenditures are the cost of treating patients in institutions recognized as hospitals on an inpatient or outpatient basis. 40 Treatments typically consist of diagnostic and therapeutic services provided to patients under continued medical care. Expenditures include salaries paid to nurses and physicians and other professionals who are on the payrolls of hospitals,41
the cost of drugs and medical supplies used during a period of hospitalization, plus the administrative costs of the hospitals.
Current Costs Table 6.1 shows hospital expenditures by payer and by province/territory. It shows that provinces/territories are responsible for 89 percent of all hospital expenditures, leaving virtually nothing to other public sectors. The private sector (including out-of-pocket payments by Canadians) assumes less than 10 percent of expenditures, essentially paying the cost of semi-private and private rooms. It is worth noting that $54.3 billion of hospital expenditures 42
(90 percent of the total hospital expenditures) fall under the scope of the Canada Health Act of 1984. They also account for 65 percent of the health care expenditures falling under the scope of the act.
40 CIHI, 2011c. Hospitals are defined as: “Institutions where patients are accommodated on the basis of medical need and are provided with continuing medical and supporting diagnostic and therapeutic services. Hospitals are licensed or approved as hospitals by a provincial/territorial government, or are operated by the government of Canada, and include those providing acute care, extended and chronic care, rehabilitation and convalescent care, as well as nursing stations or outpost hospitals.” This definition includes psychiatric hospitals. 41 This means that all payments made to physicians by the provincial/territorial health insurance program are not counted here but rather considered as physician expenditures and discussed in Chapter 5. 42 Equal to the sum of $53.9 billion paid by provinces/territories and $0.3 billion paid directly by the federal government.

© 2013 Society of Actuaries and Canadian Institute of Actuaries, All Rights Reserved Stephane Levert Consulting Services Inc. Page 25
Table 6.1: Total Hospital Expenditures, 2012, by Payer
Province/Territory
Provincial/Territorial Government Sector
Private Sector and Out-of-Pocket Payments Total
Total (millions
of $)
Per capita ($)
Total (millions of
$)
Per capita ($)
Total (millions of
$)
Per capita ($)
% of GDP
Newfoundland & Labrador 1,266.7 2,487 66.9 131 1,349.9 2,651 5.9% Prince Edward Island 263.9 1,803 9.3 63 277.3 1,894 5.4% Nova Scotia 1,615.6 1,708 228.7 242 1,895.5 2,004 5.4% New Brunswick 1,444.2 1,910 117.1 155 1,600.9 2,117 5.5% Quebec 10,996.9 1,368 470.2 58 11,575.0 1,440 3.4% Ontario 18,314.2 1,354 3,375.8 250 21,936.2 1,621 3.3% Manitoba 2,306.7 1,828 222.8 176 2,549.1 2,020 4.7% Saskatchewan 1,868.8 1,747 117.1 109 2,025.3 1,893 4.0% Alberta 8,344.4 2,166 742.3 193 9,196.3 2,387 3.5% British Columbia 7,136.6 1,536 484.4 104 7,717.9 1,661 3.7% Yukon 70.9 2,023 4.5 128 76.3 2,177 3.4% Northwest Territories 150.1 3,406 21.8 496 172.7 3,920 4.5% Nunavut 145.7 4,321 4.0 118 150.2 4,453 9.9% Total Canada 53,924.8 1,546 5,864.9 168 60,522.7 1,736 3.6% Prov./Terr. Governments 53,924.8 1,546 Federal Direct 326.0 9
Municipal Governments 36.2 1
Social Security Funds 370.9 11
Total 54,657.8 1,567 5,864.9 168 60,522.7 1,736 3.6% Source: CIHI, 2012b.
Figure 6.1 shows that the hospital expenditures have increased at an annual real rate of 4.0 percent over the past 15 years—on top of inflation—from $34.7 billion of constant 2012 dollars in 1997 to $60.5 billion in 2012. Meanwhile, per capita hospital expenditures have increased at a real rate of 2.9 percent over the same period of time. Table 6.2 shows the distribution of hospital expenditures by type of expense. Quebec and Nunavut are excluded as drug expenses are not currently identifiable for Quebec and data from Nunavut is not available. It shows that compensation is the largest expense component for hospitals, ranging from 60 percent to 75 percent. Drugs account for only 3.5 percent of total expenses on average.
Table 6.2: Distribution of Hospital Expenses by Broad Financial Group, Fiscal Year 2009-2010, by Province/Territory
Province/Territory Compen-sation Drugs Supplies Equip-
ment
Building and
Grounds
Out-Sourcing Total
Newfoundland & Labrador 70.8% 3.1% 15.4% 3.8% 3.4% 3.6% 100.0% Prince Edward Island 73.2% 3.1% 19.4% 1.7% 0.9% 1.7% 100.0% Nova Scotia 70.8% 2.7% 17.5% 5.1% 2.8% 1.3% 100.0% New Brunswick 70.5% 3.8% 16.2% 4.7% 2.6% 2.2% 100.0% Ontario 66.1% 3.8% 19.2% 5.8% 3.1% 2.1% 100.0% Manitoba 65.4% 2.2% 14.7% 4.1% 2.5% 11.1% 100.0% Saskatchewan 74.9% 2.3% 15.4% 3.8% 2.4% 1.2% 100.0% Alberta 71.4% 3.6% 12.7% 5.0% 3.3% 4.1% 100.0% British Columbia 69.0% 3.9% 14.0% 5.4% 4.2% 3.5% 100.0% Yukon 60.1% 2.4% 18.6% 3.6% 8.5% 6.8% 100.0% Northwest Territories 66.4% 2.7% 23.9% 1.5% 2.8% 2.6% 100.0% Total Canada 68.1% 3.5% 16.8% 5.3% 3.2% 3.1% 100.0% Source: CIHI, CMDB 2012
Figure 6.1: Historical Hospital Expenditures, 1997 to 2012 (millions of constant 2012 dollars)
0
10,000
20,000
30,000
40,000
50,000
60,000
70,000
1997
19
98
1999
20
00
2001
20
02
2003
20
04
2005
20
06
2007
20
08
2009
20
10
2011
20
12
Other sectors Federal direct Provincial and territorial governments
Source: CIHI, 2012b.

© 2013 Society of Actuaries and Canadian Institute of Actuaries, All Rights Reserved Stephane Levert Consulting Services Inc. Page 26
Per capita hospital expenditures of provinces/ territories follow the pattern shown on Figure 6.2 by age and gender. Actual data for the year 2010 is published by CIHI. It is then projected to 2012 using the demographic model presented in Chapter 4 by ensuring that the total resulting hospital expenditures match the estimate shown on Table 6.1. Except for newborns, hospital expenditures are quite stable until ages 50 to 54, when they start to climb. Costs for males rise more rapidly than for females (costs are 21 percent higher at ages 50 to 54 for males, 35 percent at ages 65 to 69, 26 percent at ages 75 to 79, and 18 percent at ages 85 to 89). Females cost more than males between ages 20 and 44, in their child-bearing years. Interestingly, newborns cost almost as much as those aged 80 to 84.
Projections The actual hospital expenditures from 1996 to 2010 are analyzed to identify components of growth. Table 6.3 shows that aging and population growth have a consistent effect across provinces/territories, typically staying in the 0.8 to 2.2 percent range, with the exception of Alberta whose population growth was higher
than average as a result of developments in the oil and gas sector. Real price inflation in hospital expenditures on an age/gender-neutral basis has averaged 1.7 percent, with Saskatchewan experiencing increases as high as 4.9 percent and Quebec being in the lower end of the range at 0.3 percent. It is composed of: (1) increases in compensation, (2) real changes in the price of supplies and in the cost of managing the facilities, and (3) trends in the utilization of hospital services by the population, including the supply of physicians and regulated nurses, 43
except because of aging and population growth.
Using the observed historical trends in hospital costs (that is, assuming that per capita expenditures will grow at an annual real rate of 1.7 percent—on top of inflation—over the entire projection period) would result in total hospital expenditures of provinces/territories growing at an annual real rate of 3.9 percent from $53.9 billion (3.2 percent of GDP) in 2012 to 139.8 billion of constant 2012 dollars (5.6 percent of GDP) in 2037. Instead, this report uses projection assumptions that are built from the different types of hospital expenses but that produce similar overall results. Therefore, the projection model used in this report combines the following trend factors, net of inflation:
43 It must be noted that physician fees are not allocated to hospital expenditures. Still, the supply of physicians is a factor to consider as literature suggests that they have significant control over the offering of care and procedures such as diagnostic tests, surgeries, etc.
Figure 6.2: Per Capita Hospital Expenditures of Provinces/Territories, 2012
$0
$2,000
$4,000
$6,000
$8,000
$10,000
$12,000
$14,000
<1
1-4
5-9
10-1
4 15
-19
20-2
4 25
-29
30-3
4 35
-39
40-4
4 45
-49
50-5
4 55
-59
60-6
4 65
-69
70-7
4 75
-79
80-8
4 85
-89
90+
Female Male
Source: CIHI, 2011c.
Table 6.3: Components of Hospital Expenditures Growth, 1996 to 2010, by Province and Territory (constant 2012 dollar basis)
Province Aging and Population
Growth
Real Price
Inflation
Total Real
Growth Newfoundland & Labrador 1.0% 4.1% 5.1% Prince Edward Island 1.4% 2.2% 3.6% Nova Scotia 1.3% 3.1% 4.4% New Brunswick 1.5% 2.9% 4.4% Quebec 2.0% 0.3% 2.4% Ontario 2.2% 1.1% 3.2% Manitoba 1.3% 2.8% 4.1% Saskatchewan 0.8% 4.9% 5.6% Alberta 3.3% 4.4% 7.7% British Columbia 2.2% 1.5% 3.7% Canada 2.2% 1.7% 3.8% Source: CIHI, 2012b and calculations by the author.

© 2013 Society of Actuaries and Canadian Institute of Actuaries, All Rights Reserved Stephane Levert Consulting Services Inc. Page 27
• 1.0 percent for compensation for the first five years, then converging to 0.5 percent after 25 years • 5.0 percent for drugs for the first five years, then converging to 3.0 percent after 25 years44
• 0.0 percent for supplies, equipment, buildings and grounds.
The weights applied to each component are: 70 percent for compensation, 15 percent for supplies, 5 percent for equipment, buildings and grounds, 5 percent for drugs, and 5 percent for outsourcing.45
They are consistent with the findings shown in Table 6.2.
On top of that, an additional trend is factored in to capture the effect of innovation and the introduction of new technologies and treatments. It is assumed to be equal to 1.0 percent of total hospital expenditures for the first 5 years, then converging to 0.5 percent after 25 years (counted as part of real cost increases in Figure 6.3). This is consistent with a s tudy of the U.S. Congressional Budget Office that estimates innovation to contribute to between 38 percent and 65 percent of total increases in per capita health care costs. 46 In fact, new technologies—including imaging, surgical advances and g enetic advances—are estimated to account for as much as 27 percent to 48 percent of the real growth in per capita health care expenditures in the United States over the period from 1960 to 2007.47 The C.D. Howe Institute estimates that the “residual” technology factor is equivalent to a 1.1 percent growth rate of real per capita health care spending (over 1996 to 2009 period).48 However, Drummond uses a higher assumption (2.0 percent) for what he refers to as “increase in intensity,” which is described as “being down from 3% over the past decade when 1% reflected catch-up after the cutbacks of the 1990s.”49
All combined, this produces an average real trend of 1.8 percent, net of the effect of aging and population growth. This is consistent with observed historical trends. Table 6.4 summarizes key findings from the projection of hospital expenditures of provinces/territories and the sensitivities of the assumptions used.
44 Using projection assumptions for drugs administered in hospitals that differ from those used to project drug expenditures is appropriate as drugs administered in hospitals are usually for chronic conditions for which innovative—and expensive—drug therapies are likely to be introduced in the future. 45 As no specific information is available about what is covered by hospital outsourcing, this research projects these expenditures assuming that they are similar to other hospital costs. More specifically, the model actually projects expenditures related to compensation, drugs supplies, equipment, buildings and ground separately and then divides the total projected expenditures by 0.95. 46 U.S. Congressional Budget Office, Technological Change and the Growth of Health Care Spending (Washington, D.C.: CBO, 2008). 47 Smith, Newhouse and Freeland, 2009. 48 Dodge, David A., and Richard Dion. 2011, Chronic Healthcare Spending Disease: A Macro Diagnosis and Prognosis, C.D. Howe Institute Commentary, The Health Papers, No. 327. 49 Drummond, Don, and Derek Burleton. 2010. Charting a Path to Sustainable Healthcare in Ontario: 10 Proposals to Restrain Cost Growth Without Compromising Quality of Care. TD Economics, May 27.

© 2013 Society of Actuaries and Canadian Institute of Actuaries, All Rights Reserved Stephane Levert Consulting Services Inc. Page 28
Table 6.4: Summary of Projections of Hospital Expenditures of Provinces/Territories
Hospital Expenditures of Provinces/Territories (millions of constant 2012 dollars, where applicable)
Expenditures Growth
Annual Increase Due to Aging and Population
Growth
Annual Increase Due to Real Cost
Total Annual Increase
Total Hospital Expenditures of
Provinces/Territories
as a % of GDP
Historical Pattern from 1996 to 2010 2.2% 1.7% 3.8% 2012 : 53,925 3.2% Projection Using Historical Real Cost Growth 2.2% 1.7% 3.9% 2037 : 139,774 5.6% Projection Using Base Scenario 2.2% 1.8% 3.9% 2037 : 141,631 5.7%
Projection Assumption Under Base Scenario
70% compensation—trend of 1.0% for five years, dropping to 0.5% after 25 years 25% supplies, equipment, buildings and grounds—no trend
5% drugs—trend of 3% for 25 years Innovation—trend of 1.0% for five years, dropping to 0.5% after 25 years
Sensitivity Testing
Projection Assumptions Tested
Annual Increase Due to Aging and Population
Growth
Annual Increase Due to Real Cost
Total Annual Increase
Total Hospital Expenditures of
Provinces/Territories
as a % of GDP
Demographic Model Optimistic: Low-Growth 1.9% 1.8% 3.7% 2037 : 133,033 5.8% Pessimistic: High-Growth 2.4% 1.8% 4.2% 2037 : 150,392 5.6% Compensation Costs Optimistic: -1.0% 2.2% 1.2% 3.4% 2037 : 123,765 5.0% Pessimistic: +1.0% 2.2% 2.5% 4.7% 2037 : 169,643 6.9% Drugs Costs Optimistic: -1.0% 2,2% 1.6% 3.8% 2037 : 137,564 5.6% Pessimistic: +1.0% 2.2% 1.9% 4.1% 2037 : 146,752 5.9% Supplies, Equipment, Buildings & Grounds Costs
Pessimistic: +1.0% 2.2% 1.9% 4.1% 2037 : 148,012 6.0% Innovation Optimistic: -1.0% 2,2% 1.0% 3.1% 2037 : 116,342 4.7% Pessimistic: +1.0% 2.2% 2.8% 5.0% 2037 : 181,280 7.3%
Table 6.5 shows projected hospital expenditures of provinces/territories from 2012 to 2037. Table 6.5: Projected Hospital Expenditures by Provinces/Territories, 2012 to 2037, Base Scenario (millions of constant 2012 dollars)
Years
New
foun
dlan
d &
La
brad
or
Prin
ce E
dwar
d Is
land
Nov
a S
cotia
New
Bru
nsw
ick
Que
bec
Ont
ario
Man
itoba
Sas
katc
hew
an
Alb
erta
Brit
ish
Col
umbi
a
Yuk
on
Nor
thw
est
Terri
torie
s
Nun
avut
Can
ada
% of GDP
2012 1,267 264 1,616 1,444 10,997 18,314 2,307 1,869 8,344 7,137 71 150 146 53,925 3.2% 2013 1,316 278 1,680 1,504 11,455 19,139 2,396 1,928 8,740 7,462 73 159 161 56,292 3.3% 2014 1,365 289 1,744 1,565 11,937 19,998 2,487 1,993 9,146 7,798 76 168 166 58,732 3.4% 2015 1,417 302 1,809 1,625 12,445 20,888 2,580 2,059 9,571 8,148 80 175 174 61,275 3.5% 2016 1,475 315 1,880 1,690 12,982 21,819 2,680 2,127 10,015 8,513 82 186 182 63,948 3.5% 2017 1,534 332 1,957 1,760 13,552 22,803 2,784 2,199 10,482 8,899 87 193 190 66,772 3.6% 2018 1,598 347 2,036 1,835 14,133 23,818 2,890 2,275 10,966 9,299 92 203 200 69,692 3.7% 2019 1,660 361 2,116 1,907 14,735 24,857 3,002 2,350 11,461 9,708 95 214 210 72,675 3.8% 2020 1,725 379 2,200 1,980 15,350 25,927 3,115 2,431 11,978 10,129 98 223 218 75,752 4.0% 2021 1,795 393 2,285 2,062 15,979 27,032 3,235 2,510 12,510 10,566 105 234 228 78,932 4.1% 2022 1,865 408 2,376 2,145 16,623 28,193 3,358 2,597 13,069 11,026 107 249 237 82,254 4.2% 2023 1,934 427 2,468 2,232 17,275 29,383 3,487 2,684 13,652 11,502 111 259 250 85,664 4.3% 2024 2,008 443 2,559 2,317 17,958 30,600 3,620 2,777 14,244 11,990 117 271 258 89,162 4.4% 2025 2,080 462 2,653 2,406 18,657 31,849 3,756 2,870 14,866 12,491 124 280 274 92,766 4.5% 2026 2,155 481 2,746 2,496 19,370 33,127 3,894 2,966 15,499 13,006 129 298 279 96,445 4.7% 2027 2,225 498 2,845 2,590 20,090 34,452 4,041 3,064 16,164 13,541 131 317 287 100,246 4.8% 2028 2,299 518 2,944 2,686 20,834 35,816 4,193 3,166 16,853 14,093 137 334 316 104,190 4.9% 2029 2,376 537 3,041 2,780 21,589 37,194 4,345 3,270 17,561 14,658 141 345 324 108,163 5.0% 2030 2,453 555 3,142 2,876 22,364 38,605 4,498 3,377 18,282 15,232 147 364 334 112,227 5.1% 2031 2,524 575 3,242 2,971 23,128 40,029 4,658 3,483 19,022 15,810 150 382 344 116,317 5.2% 2032 2,597 596 3,343 3,071 23,884 41,485 4,826 3,588 19,784 16,403 156 398 355 120,485 5.3% 2033 2,663 618 3,444 3,165 24,634 42,961 4,987 3,702 20,571 17,010 157 414 367 124,692 5.4% 2034 2,732 637 3,540 3,262 25,373 44,450 5,157 3,814 21,363 17,620 167 426 377 128,916 5.5% 2035 2,801 659 3,639 3,358 26,091 45,956 5,325 3,928 22,166 18,236 174 443 389 133,164 5.6% 2036 2,866 678 3,733 3,450 26,769 47,456 5,496 4,038 22,962 18,842 175 453 409 137,328 5.7% 2037 2,934 697 3,831 3,545 27,467 49,002 5,671 4,153 23,790 19,465 176 464 436 141,631 5.7% Source: CIHI, 2012b and calculations by the author.

© 2013 Society of Actuaries and Canadian Institute of Actuaries, All Rights Reserved Stephane Levert Consulting Services Inc. Page 29
Figure 6.3 shows that hospital expenditures are expected to grow at an average rate of 3.9 percent per year on a constant 2012 dollar basis—1.8 percent due to price increases and 2.2 percent due to aging and population growth. The combined effects of aging and population growth vary by province/territory, from 1.5 percent in Saskatchewan to 2.5 percent in Alberta and even 2.7 percent in Nunavut and 2.9 percent in the Northwest Territories, with a national average of 2.2 percent. By contrast, Drummond uses a combined trend factor of 2.0 percent in Ontario for aging and population growth, 50
compared to 2.2 percent for hospital services in this report.
Sensitivity of provinces/territories to changes in the hospital expenditures projection assumptions was tested. Here is a selection of key findings:
• Containing the growth of the compensation component by 1.0 percent per year over the next 25 years would reduce the expected growth rate of hospital expenditures of provinces/territories from 3.9 percent per year to 3.4 percent, and would result in savings to provinces/territories equal to 13 percent of their hospital expenditures and 6 percent of their total health care expenditures in 2037.
• Containing the increase in costs relative to innovation by 1.0 percent per year would have a material effect to provinces/territories, actually limiting the rate of growth of their hospital expenditures to 3.1 percent (instead of 3.9 percent under the base scenario) and resulting in savings equal to 18 percent of their hospital expenditures, 8 percent of their total health care expenditures, and 6 percent of their total available revenues in 2037.
Direct hospital expenditures of the federal government are assumed to grow proportionately to those of provinces/territories, at an expected real annual rate of 3.9 percent. Those paid by municipal governments, by social security funds, by the private sector and by Canadians are also assumed to grow proportionately to those of provinces/territories, however only considering the population between ages 20 and 64, in order to reflect the fact that most of the hospital expenditures they are responsible for are associated with the working population. They are expected to grow at real rates ranging from 2.2 percent to 2.3 percent. Table 6.6 summarizes the projected hospital expenditures, by payer, over the next 25 years. Hospital services were using resources equal to 3.6 percent of GDP in 2012. Their economic importance is projected to grow by almost 75 percent, growing to 6.2 percent of GDP, by 2037.
50 Drummond, Don, and Derek Burleton. 2010. Charting a Path to Sustainable Healthcare in Ontario: 10 Proposals to Restrain Cost Growth Without Compromising Quality of Care. TD Economics, May 27.
Figure 6.3: Components of Hospital Expenditure Growth Rates, 2012 to 2037, Base Scenario
0.0% 0.5% 1.0% 1.5% 2.0% 2.5% 3.0% 3.5% 4.0% 4.5% 5.0%
New
foun
dlan
d &
Lab
rado
r P
rince
Edw
ard
Isla
nd
Nov
a S
cotia
N
ew B
runs
wic
k Q
uebe
c O
ntar
io
Man
itoba
S
aska
tche
wan
A
lber
ta
Brit
ish
Col
umbi
a Yu
kon
Nor
thw
est T
errit
orie
s N
unav
ut
Can
ada
Aging and Population Growth Real Cost Increase
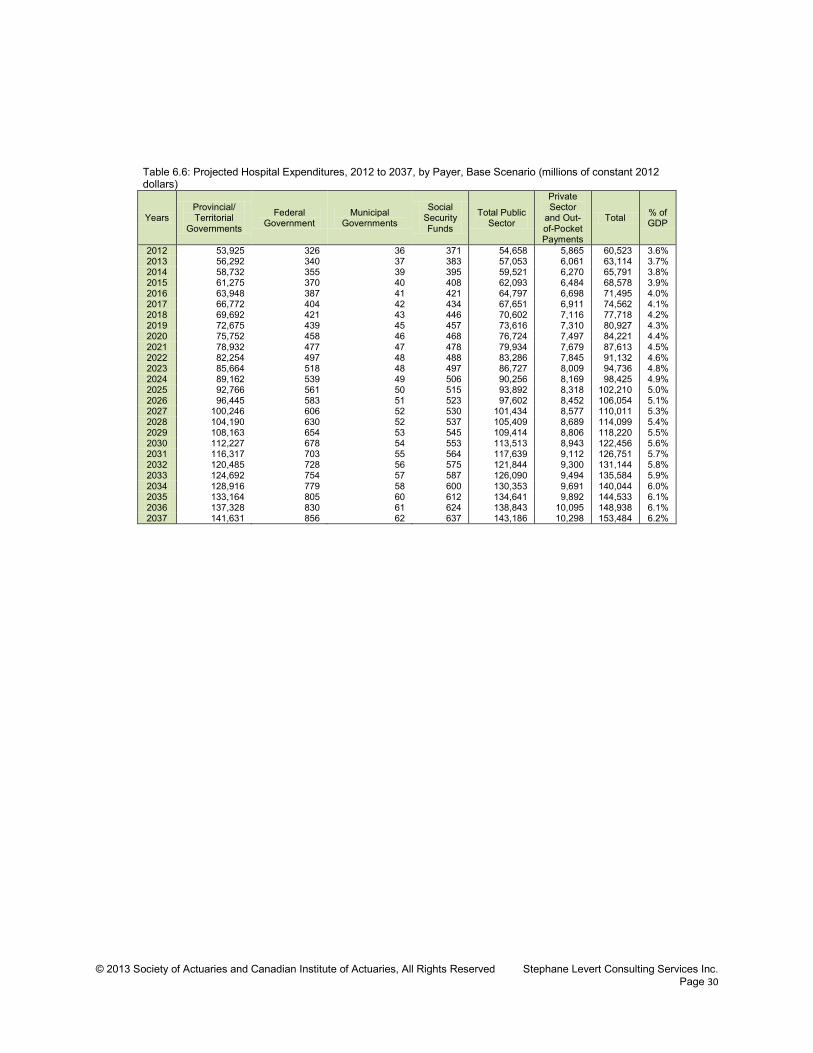
© 2013 Society of Actuaries and Canadian Institute of Actuaries, All Rights Reserved Stephane Levert Consulting Services Inc. Page 30
Table 6.6: Projected Hospital Expenditures, 2012 to 2037, by Payer, Base Scenario (millions of constant 2012 dollars)
Years Provincial/ Territorial
Governments
Federal Government
Municipal Governments
Social Security Funds
Total Public Sector
Private Sector
and Out-of-Pocket Payments
Total % of GDP
2012 53,925 326 36 371 54,658 5,865 60,523 3.6% 2013 56,292 340 37 383 57,053 6,061 63,114 3.7% 2014 58,732 355 39 395 59,521 6,270 65,791 3.8% 2015 61,275 370 40 408 62,093 6,484 68,578 3.9% 2016 63,948 387 41 421 64,797 6,698 71,495 4.0% 2017 66,772 404 42 434 67,651 6,911 74,562 4.1% 2018 69,692 421 43 446 70,602 7,116 77,718 4.2% 2019 72,675 439 45 457 73,616 7,310 80,927 4.3% 2020 75,752 458 46 468 76,724 7,497 84,221 4.4% 2021 78,932 477 47 478 79,934 7,679 87,613 4.5% 2022 82,254 497 48 488 83,286 7,845 91,132 4.6% 2023 85,664 518 48 497 86,727 8,009 94,736 4.8% 2024 89,162 539 49 506 90,256 8,169 98,425 4.9% 2025 92,766 561 50 515 93,892 8,318 102,210 5.0% 2026 96,445 583 51 523 97,602 8,452 106,054 5.1% 2027 100,246 606 52 530 101,434 8,577 110,011 5.3% 2028 104,190 630 52 537 105,409 8,689 114,099 5.4% 2029 108,163 654 53 545 109,414 8,806 118,220 5.5% 2030 112,227 678 54 553 113,513 8,943 122,456 5.6% 2031 116,317 703 55 564 117,639 9,112 126,751 5.7% 2032 120,485 728 56 575 121,844 9,300 131,144 5.8% 2033 124,692 754 57 587 126,090 9,494 135,584 5.9% 2034 128,916 779 58 600 130,353 9,691 140,044 6.0% 2035 133,164 805 60 612 134,641 9,892 144,533 6.1% 2036 137,328 830 61 624 138,843 10,095 148,938 6.1% 2037 141,631 856 62 637 143,186 10,298 153,484 6.2%

© 2013 Society of Actuaries and Canadian Institute of Actuaries, All Rights Reserved Stephane Levert Consulting Services Inc.
Page 31
Chapter 7—Projection of “Other Institutions Expenditures” Institutions other than hospitals represent an increasing type of expenditures for both the public and private sectors, including out-of-pocket payments by Canadians. Demand for their services may further increase in the future as a result of aging and possible shifts in the organization of the Canadian health care system. This chapter first looks at the current structure of “other institutions expenditures” before projecting them in the future.
Introduction “Other institutions” include, among other facilities, registered nursing facilities for the aged, the chronically ill or disabled, or to treat alcohol and drug problems.51
These expenditures are not, strictly speaking, covered by the Canada Health Act of 1984. It must be realized, nevertheless, that these are costs that governments assume more and m ore, especially in the context of an agi ng population. Most provinces/territories apply strict income tests to have access to long-term care facilities or ask for income-based contributions from patients.
Current Costs Table 7.1: Total “Other Institutions Expenditures,” 2012, by Payer
Province/Territory
Provincial/Territorial Government Sector
Private Sector and Out-of-Pocket
Payments Total
Total (millions
of $)
Per capita
($)
Total (millions
of $)
Per capita
($)
Total (millions
of $)
Per capita
($)
% of GDP
Newfoundland & Labrador 378.9 744 87.0 171 468.0 919 2.0% Prince Edward Island 79.2 541 47.0 321 127.4 870 2.5% Nova Scotia 640.3 677 152.0 161 802.6 848 2.3% New Brunswick 405.9 537 140.6 186 550.3 728 1.9% Quebec 4,138.4 515 1,885.5 234 6,070.7 755 1.8% Ontario 6,013.0 444 2,548.0 188 8,603.5 636 1.3% Manitoba 763.0 605 218.2 173 983.2 779 1.8% Saskatchewan 710.6 664 188.5 176 899.7 841 1.8% Alberta 1,565.0 406 352.2 91 1,926.1 500 0.7% British Columbia 1,123.6 242 738.1 159 1,880.4 405 0.9% Yukon 29.5 841 31.3 893 61.1 1,743 2.7% Northwest Territories 27.2 618 7.2 164 34.4 781 0.9% Nunavut 39.4 1,168 1.4 42 40.8 1,210 2.7% Total Canada 15,913.9 456 6,397.0 183 22,448.2 644 1.3% Prov./Terr. Governments 15,913.9 456 Federal Direct 124.2 4
Social Security Funds 13.2 0
Total 16,051.2 460 6,397.0 183 22,448.2 644 1.3% Source: CIHI, 2012b.
51 CIHI, 2011c. “[Other institutions] include residential care types of facilities (for the chronically ill or disabled, who reside at the institution more or less permanently) and which are approved, funded or licensed by provincial or territorial departments of health and/or social services. Residential care facilities include homes for the aged (including nursing homes), facilities for persons with physical disabilities, developmental delays, psychiatric disabilities and alcohol and drug problems, and facilities for emotionally disturbed children. Facilities solely of a custodial or domiciliary nature and facilities for transients or delinquents are excluded.”

© 2013 Society of Actuaries and Canadian Institute of Actuaries, All Rights Reserved Stephane Levert Consulting Services Inc. Page 32
Table 7.1 shows “other institutions expenditures” by payer and by province/territory. It shows that provinces/ territories are responsible for close to 71 percent of all “other institutions expenditures” and the private sector (including direct payments by Canadians) close to 29 percent, leaving virtually nothing to other public sectors. Figure 7.1 shows that the “other institutions expenditures” have increased at an annual real rate of 4.4 percent—on top of inflation—over the past 15 years, from 10.1 billion of constant 2012 dollars in 1997 to $22.4 billion in 2012. Meanwhile, per capita expenditures have increased at an annual real rate of 3.4 percent over the same period of time. It is interesting to note that historical growth patterns for “other institutions expenditures” were similar, whether funded by provinces/territories, by the private sector or by out-of-pocket payments. Per capita “other institutions expenditures” of provinces/ territories follow the pattern displayed on Figure 7.2 by age and gender. Actual data for the year 2010 is published by CIHI. It is then projected to 2012 using the demographic model presented in Chapter 4 b y ensuring that the total resulting “other institutions expenditures” match the estimate shown on Table 7.1. The graph shows that “other institutions expenditures” are important for the elderly and that females consume significantly more of such services than males, probably due to the fact that they are more likely to survive their husband and, as a consequence, eventually lack adequate support at home to maintain their autonomy.
Projections The actual “other institutions expenditures” from 1996 to 2010 are analyzed to identify components of growth. Table 7.2 shows that real price inflation in “other institutions expenditures,” on an age-/gender-neutral basis, has averaged 4.1 percent—on top of inflation—with wide variations between provinces/territories. Such variations may indicate that the organization of “other institutions” has evolved significantly during the observation period and in different manners by province/territory.
Figure 7.1: Historical “Other Institutions Expenditures,” 1997 to 2012 (millions of constant 2012 dollars)
0
5,000
10,000
15,000
20,000
25,000
1997
19
98
1999
20
00
2001
20
02
2003
20
04
2005
20
06
2007
20
08
2009
20
10
2011
20
12
Other sectors Private sector Provincial and territorial governments
Source: CIHI, 2012b.
Figure 7.2: Per Capita “Other Institutions Expenditures” of Provinces/Territories, 2012
$0
$2,000
$4,000
$6,000
$8,000
$10,000
$12,000
$14,000
<1
5-9
15-1
9
25-2
9
35-3
9
45-4
9
55-5
9
65-6
9
75-7
9
85-8
9 Female Male
Source: CIHI, 2011c.
Table 7.2: Components of “Other Institutions Expenditures” Growth, 1996 to 2010, by Province and Territory (constant 2012 dollar basis)
Province Aging and Population
Growth
Real Price
Inflation
Total Real
Growth Newfoundland & Labrador -0.1% 4.2% 4.3% Prince Edward Island -0.4% 4.8% 4.4% Nova Scotia 0.6% 8.0% 8.5% New Brunswick 0.7% 4.9% 5.6% Quebec 1.8% 7.5% 9.3% Ontario 1.7% 4.1% 5.8% Manitoba 0.2% 4.0% 4.2% Saskatchewan -0.5% 5.4% 4.9% Alberta 1.9% 3.0% 5.0% British Columbia 1.4% -2.9% -1.5% Canada 1.4% 4.1% 5.5%

© 2013 Society of Actuaries and Canadian Institute of Actuaries, All Rights Reserved Stephane Levert Consulting Services Inc. Page 33
Using the observed historical trends in “other institutions expenditures” (that is, assuming that per capita expenditures will grow at an annual real rate of 4.1 percent—on top of inflation—over the entire projection period) would result in total “other institutions expenditures” of provinces/territories growing at an annual rate of 7.5 percent from $15.9 billion (1.0 percent of GDP) in 2012 to 97.5 billion of constant 2012 dollars (3.9 percent of GDP) in 2037. Instead, this report uses projection assumptions that recognize the expense components of “other institutions expenditures” and that are consistent with the projection assumptions used to project hospital expenditures. Consequently, it uses a combination of the following trend factors, net of inflation:
• 1.0 percent for compensation for the first five years, then converging to 0.5 percent after 25 years • 0.0 percent for other costs.
It is further assumed that 75 percent of current “other institutions expenditures” are in relation to compensation. The effect of aging and population growth is applied on top of these trend factors. This results in an implied real annual rate of increase of 3.9 percent—on top of inflation—which is consistent with observed historical trends. Real per capita “other institutions expenditures” of provinces/territories are applied to the projected demography to arrive at total real “other institutions expenditures.” Table 7.3 summarizes key findings from the projection of “other institutions expenditures” of provinces/territories and the sensitivities of the assumptions used.
Table 7.3: Summary of Projections of “Other Institutions Expenditures” of Provinces/Territories
“Other Institutions Expenditures” of Provinces/Territories (millions of constant 2012 dollars, where applicable)
Expenditures Growth
Annual Increase Due to Aging and Population
Growth
Annual Increase Due to Real Cost
Total Annual Increase
Total “Other Institutions
Expenditures” of Provinces/Territories
as a % of GDP
Historical Pattern from 1996 to 2010 1.4% 4.1% 5.5% 2012 : 15,914 1.0% Projection Using Historical Real Cost Growth 3.4% 4.1% 7.5% 2037 : 97,546 3.9% Projection Using Base Scenario 3.3% 0.6% 3.9% 2037 : 41,603 1.7%
Projection Assumption Under Base Scenario 75% compensation—trend of 1.0% for five years, dropping to 0.5% after 25 years 25% others—no trend
Sensitivity Testing
Projection Assumptions Tested
Annual Increase Due to Aging and Population
Growth
Annual Increase Due to Real Cost
Total Annual Increase
Total “Other Institutions
Expenditures” of Provinces/Territories
as a % of GDP
Demographic Model Optimistic: Low-Growth 3.0% 0.6% 3.6% 2037 : 38,931 1.7% Pessimistic: High-Growth 3.6% 0.6% 4.2% 2037 : 44,276 1.7% Compensation Costs Optimistic: -1.0% 3.3% 0.0% 3.3% 2037 : 35,722 1.4% Pessimistic: +1.0% 3.3% 1.4% 4.8% 2037 : 50,822 2.1% Other Costs Pessimistic: +1.0% 3.3% 0.8% 4.2% 2037 : 44,051 1.8%
Table 7.4 shows “other institutions expenditures” of provinces/territories. They will grow, on average, at an annual rate of 3.9 percent—on top of inflation—0.6 percent due to price increases and 3.3 percent due to aging and population growth.

© 2013 Society of Actuaries and Canadian Institute of Actuaries, All Rights Reserved Stephane Levert Consulting Services Inc. Page 34
Table 7.4: Projected “Other Institutions Expenditures” of Provinces/Territories, 2012 to 2037, Base Scenario (millions of constant 2012 dollars)
Years N
ewfo
undl
and
&
Labr
ador
Prin
ce E
dwar
d Is
land
Nov
a S
cotia
New
Bru
nsw
ick
Que
bec
Ont
ario
Man
itoba
Sas
katc
hew
an
Alb
erta
Brit
ish
Col
umbi
a
Yuk
on
Nor
thw
est
Terri
torie
s
Nun
avut
Can
ada
% of GDP
2012 379 79 640 406 4,138 6,013 763 711 1,565 1,124 30 27 39 15,914 1.0% 2013 392 84 660 420 4,292 6,238 783 724 1,632 1,164 30 29 46 16,496 1.0% 2014 404 86 676 433 4,445 6,460 801 740 1,698 1,204 31 38 48 17,064 1.0% 2015 416 90 691 443 4,603 6,689 818 754 1,769 1,246 38 40 50 17,647 1.0% 2016 434 92 714 457 4,767 6,928 838 767 1,842 1,289 38 42 52 18,260 1.0% 2017 451 98 736 471 4,936 7,166 858 780 1,919 1,332 41 43 54 18,886 1.0% 2018 470 102 760 487 5,098 7,412 877 797 1,995 1,378 43 47 57 19,524 1.1% 2019 486 105 787 502 5,264 7,653 897 810 2,075 1,424 44 55 59 20,159 1.1% 2020 506 111 812 517 5,433 7,906 918 827 2,158 1,471 44 57 60 20,820 1.1% 2021 529 114 840 537 5,615 8,179 941 841 2,246 1,524 49 59 62 21,537 1.1% 2022 552 118 876 557 5,802 8,484 966 861 2,342 1,581 51 65 64 22,320 1.1% 2023 578 123 911 580 5,999 8,803 994 881 2,444 1,642 52 67 77 23,152 1.2% 2024 607 127 946 601 6,222 9,137 1,024 903 2,549 1,706 55 70 78 24,026 1.2% 2025 635 132 984 626 6,462 9,486 1,054 926 2,664 1,773 69 72 85 24,967 1.2% 2026 667 138 1,025 652 6,729 9,869 1,088 954 2,787 1,849 73 84 84 25,998 1.3% 2027 699 143 1,074 681 7,016 10,312 1,128 983 2,925 1,932 73 95 86 27,146 1.3% 2028 735 149 1,125 712 7,322 10,788 1,173 1,017 3,074 2,021 77 101 93 28,387 1.4% 2029 777 156 1,173 743 7,641 11,266 1,216 1,052 3,227 2,114 79 103 94 29,643 1.4% 2030 817 162 1,225 775 7,976 11,756 1,259 1,089 3,384 2,208 84 115 95 30,945 1.4% 2031 861 168 1,278 806 8,319 12,274 1,306 1,127 3,552 2,305 85 132 97 32,313 1.5% 2032 905 178 1,339 846 8,674 12,891 1,365 1,173 3,745 2,421 96 144 101 33,878 1.5% 2033 946 187 1,399 882 9,019 13,504 1,419 1,222 3,945 2,536 96 156 104 35,415 1.6% 2034 991 194 1,454 919 9,374 14,105 1,475 1,272 4,142 2,651 108 157 103 36,948 1.6% 2035 1,031 201 1,511 955 9,720 14,714 1,533 1,324 4,343 2,767 121 171 117 38,508 1.6% 2036 1,073 209 1,564 990 10,058 15,320 1,591 1,376 4,545 2,880 121 173 121 40,020 1.7% 2037 1,117 217 1,621 1,027 10,410 15,953 1,651 1,431 4,757 2,997 121 175 126 41,603 1.7% Source: CIHI, 2012b and calculations by the author.
Direct “other institutions expenditures” of the federal government and by social security funds are assumed to grow proportionately to those of provinces/territories. They are expected to grow at a real rate of 3.9 percent. As no reliable information is available about per capita “other institutions expenditures” paid by the private sector and by out-of-pocket payments, this research assumes no difference in such cost according to age and gender. They are expected to grow at a real rate of 1.0 percent, resulting from the growth of the working population and real price increases. Table 7.5 summarizes the projected “other institutions expenditures,” by payer, over the next 25 years. Expenditures associated with institutions other than hospitals were equal to 1.3 percent of GDP in 2012. Their economic importance is projected to grow to 2.0 percent of GDP by 2037.

© 2013 Society of Actuaries and Canadian Institute of Actuaries, All Rights Reserved Stephane Levert Consulting Services Inc. Page 35
Table 7.5: Projected “Other Institutions Expenditures,” 2012 to 2037, by Payer, Base Scenario (millions of constant 2012 dollars)
Years Provincial/ Territorial
Governments
Federal Government
Municipal Governments
Social Security Funds
Total Public Sector
Private Sector
and Out-of-Pocket Payments
Total % of GDP
2012 15,914 124 0 13 16,051 6,397 22,448 1.3% 2013 16,496 129 0 14 16,638 6,494 23,132 1.4% 2014 17,064 133 0 14 17,211 6,589 23,800 1.4% 2015 17,747 138 0 15 17,799 6,682 24,481 1.4% 2016 18,260 142 0 15 18,418 6,771 25,188 1.4% 2017 18,886 147 0 16 19,049 6,853 25,903 1.4% 2018 19,524 152 0 16 19,693 6,927 26,620 1.4% 2019 20,159 157 0 17 20,333 6,992 27,325 1.4% 2020 20,820 162 0 17 21,000 7,052 28,051 1.5% 2021 21,537 168 0 18 21,723 7,109 28,832 1.5% 2022 22,320 174 0 18 22,512 7,162 29,674 1.5% 2023 23,152 181 0 19 23,352 7,213 30,565 1.5% 2024 24,026 187 0 20 24,233 7,265 31,498 1.6% 2025 24,967 195 0 21 25,183 7,313 32,495 1.6% 2026 25,998 203 0 22 26,223 7,361 33,584 1.6% 2027 27,146 212 0 22 27,380 7,413 34,793 1.7% 2028 28,387 221 0 23 28,632 7,463 36,095 1.7% 2029 29,643 231 0 25 29,898 7,515 37,413 1.7% 2030 30,945 241 0 26 31,212 7,576 38,788 1.8% 2031 32,313 252 0 27 32,592 7,651 40,243 1.8% 2032 33,878 264 0 28 34,171 7,736 41,906 1.9% 2033 35,415 276 0 29 35,720 7,823 43,543 1.9% 2034 36,948 288 0 31 37,267 7,912 45,179 1.9% 2035 38,508 300 0 32 38,840 8,001 46,841 2.0% 2036 40,020 312 0 33 40,366 8,089 48,455 2.0% 2037 41,603 325 0 34 41,962 8,178 50,140 2.0%

© 2013 Society of Actuaries and Canadian Institute of Actuaries, All Rights Reserved Stephane Levert Consulting Services Inc.
Page 36
Chapter 8—Projection of “Other Professionals Expenditures” Expenditures associated to health care practitioners other than physicians, regulated nurses (however including private-duty nurses) and pharmacists represented 11 percent of total health care expenditures in 2012. They are mostly assumed by the private sector and by out-of-pocket payments. This chapter first looks at the current structure of “other professionals expenditures,” before projecting them in the future. Introduction “Other professionals” include all health care practitioners in a private practice, such as dentists, denturists, chiropractors, optometrist, massage therapists, osteopaths, physiotherapists, podiatrists, psychologists, private duty nurses and naturopaths, hence excluding physicians and s pecialists, and pharmacists.52
These expenditures were not intended to be considered as insured health services under the Canada Health Act of 1984.
Current Costs Table 8.1 shows “other professionals expenditures”53
by payer and by province/territory. It shows that the private sector and Canadian citizens (through out-of-pocket payments) are responsible for 92 percent of all “other professionals expenditures,” with the provinces/territories assuming close to 5 percent of them and leaving the federal government and social security funds paying for the remainder.
Table 8.1: Total “Other Professionals Expenditures,” 2012, by Payer
Province/Territory
Provincial/Territorial Government Sector
Private Sector and Out-of-Pocket
Payments Total
Total (millions
of $)
Per capita
($)
Total (millions
of $)
Per capita
($)
Total (millions
of $)
Per capita
($)
% of GDP
Newfoundland & Labrador 11.6 23 203.1 399 225.1 442 1.0% Prince Edward Island 2.5 17 65.1 445 69.4 474 1.3% Nova Scotia 13.2 14 576.6 610 621.4 657 1.7% New Brunswick 6.7 9 416.4 551 436.2 577 1.5% Quebec 203.4 25 4,269.6 531 4,593.5 571 1.4% Ontario 404.4 30 7,716.4 570 8,303.8 614 1.2% Manitoba 28.7 23 680.8 539 759.7 602 1.4% Saskatchewan 25.8 24 554.6 518 647.9 606 1.3% Alberta 235.2 61 2,729.5 708 3,037.9 789 1.2% British Columbia 162.8 35 3,233.1 696 3,509.2 755 1.7% Yukon 2.4 68 15.3 438 23.6 673 1.1% Northwest Territories 2.4 54 14.8 335 28.8 655 0.7% Nunavut 3.5 104 6.9 205 19.2 569 1.3% Total Canada 1,102.5 32 20,482.3 587 22,275.7 639 1.3% Prov./Terr. Governments 1,102.5 32 Federal Direct 346.2 10
Municipal Governments 0.8 0
Social Security Funds 343.9 10
Total 1,793.4 51 20,482.3 587 22,275.7 639 1.3% Source: CIHI, 2012b.
52 CIHI, 2011c. Fees paid to pharmacists outside of hospitals are not counted under “other professionals expenditures” but under drug expenditures (Chapter 9). 53 Expenditures associated with oral surgical procedures performed in a hospital are not counted here but rather with hospital expenditures.

© 2013 Society of Actuaries and Canadian Institute of Actuaries, All Rights Reserved Stephane Levert Consulting Services Inc. Page 37
Table 8.2 isolates the “other professionals expenditures” related to dental care and vision care.54,55
Figure 8.1 shows that the “other professionals expenditures” have increased at an annual real rate of 3.6 percent—on top of inflation—over the past 15 years, from 12.2 billion of constant 2012 dollars in 1997 to $22.3 billion in 2012. However, the share of total “other professionals expenditures” that provinces/territories are responsible for has only increased at an annual real rate of 0.9 percent over the same period of time due to the de-listing of some services by “other professionals,” from 1.0 billion of constant 2012 dollars in 1997 to $1.1 billion in 2012 (meaning that the “other professionals expenditures” of the private sector (including out-of-pocket payments by Canadians) have increased at an annual real rate of 3.8 percent—on top of inflation). Meanwhile, per capita expenditures have increased at an annual real rate of 2.6 percent (-0.1 percent for the share assumed by provinces/territories, and 2.8 percent for the share assumed by the private sector, including direct payments by Canadians).
Per capita “other professionals expenditures” of provinces/territories follow the pattern shown on Figure 8.2 by age and gender. Actual data for the year 2010 is published by CIHI. It is then projected to 2012 using the demographic model presented in Chapter 4 by ensuring that the total resulting “other professionals expenditures” match the estimate shown on Table 8.1. It is important to note that Figure 8.2 only reflects expenditures of provinces/territories. These are most certainly different than for the private
54 CIHI, 2011c. Dental services expenditures are defined as “expenditures for professional fees of dentists (includes dental assistants and hygienists) and denturists, as well as the cost of dental prostheses, including false teeth, and laboratory charges for crowns and other dental appliance,” and vision care expenditures are defined as “expenditures for the professional services of optometrists and dispensing opticians, as well as expenditures for eyeglasses and contact lenses.” 55 Breakdown of dental care by provinces is a pro forma calculation by the author based on total dental care expenditures for 2012 and the provincial/territorial distribution for 2010.
Table 8.2: Total “Other Professionals Expenditures” by Type of Expenditures, 2012 (millions of dollars)
Type of Expenditures Public Sector
Private Sector Total
Dental Care Newfoundland & Labrador 10 89 99 Prince Edward Island 3 35 39 Nova Scotia 16 274 290 New Brunswick 11 257 268 Quebec 178 2,164 2,342 Ontario 82 5,820 5,902 Manitoba 46 360 407 Saskatchewan 50 276 326 Alberta 169 1,616 1,785 British Columbia 138 2,088 2,226 Yukon 5 10 15 Northwest Territories 9 11 20 Nunavut 13 3 16 Total Canada 732 13,004 13,736 Vision Care 350 4,510 4,860 Other 711 2,969 3,680 Total 1,793 20,482 22,276 Source: CCPA, 2011, CIHI, 2012b and calculations by the author.
Figure 8.1: Historical “Other Professionals Expenditures,” 1997 to 2012 (millions of constant 2012 dollars)
0
5,000
10,000
15,000
20,000
25,000
1997
19
98
1999
20
00
2001
20
02
2003
20
04
2005
20
06
2007
20
08
2009
20
10
2011
20
12
Other sectors Private sector Provincial and territorial governments
Source: CIHI, 2012b.
Figure 8.2: Per Capita “Other Professionals Expenditures” of Provinces/Territories, 2012
$0
$50
$100
$150
$200
$250
<1
1-4
5-9
10-1
4 15
-19
20-2
4 25
-29
30-3
4 35
-39
40-4
4 45
-49
50-5
4 55
-59
60-6
4 65
-69
70-7
4 75
-79
80-8
4 85
-89
90+
Female Male
Source: CIHI, 2012b.

© 2013 Society of Actuaries and Canadian Institute of Actuaries, All Rights Reserved Stephane Levert Consulting Services Inc. Page 38
sector (including out-of-pocket payments by Canadians), because of the concentration of the public sector in dental care, the fact that its clientele consists mostly of children, the elderly and those on social assistance, while the private sector mostly caters to employer-sponsored group benefit plans covering working Canadians.
Projections By contrast with other types of health care expenditures, analyzing historical per capita expenditures trying to isolate the real price inflation is not as useful for “other professionals expenditures.” This is explained by the fact that per capita expenditures are only available for those that are funded by provinces/territories, which only account for less than 5 percent of total “other professionals expenditures.” It is therefore not as easy to project future “other professionals expenditures” assuming the historical trends continue into the future. It is felt that remuneration trends for dentists may track those of other physicians and specialists, while the remuneration of other health practitioners may not increase as quickly. In addition, it is assumed that the growth in their respective remuneration will decrease after a certain period of time (here five years) to reflect another assumption that public policy will work to make them converge closer to general inflation. Therefore, the projection model used in this report combines the following trend factors, net of inflation:
• 2.0 percent for dental care for the first five years, then decreasing to 1.0 percent after 25 years • 1.0 percent for vision care for the first five years, then decreasing to 0.5 percent after 25 years • 1.0 percent for other types of care for the first five years, then decreasing to 0.5 percent after 25
years. For “other professionals expenditures” of provinces/territories, the weights applied to each type of care are: 40 percent for dental care, 20 percent for vision care, and 40 percent for other types of care. This produces an average real annual trend of 1.1 percent, net of the effect of aging and population growth. Real per capita “other professionals expenditures” of provinces/territories are applied to the projected demography to arrive at total real “other professionals expenditures.” Table 8.3 summarizes key findings from the projection of “other professionals expenditures” of provinces/territories and the sensitivities of the assumptions used.

© 2013 Society of Actuaries and Canadian Institute of Actuaries, All Rights Reserved Stephane Levert Consulting Services Inc. Page 39
Table 8.3: Summary of Projections of “Other Professionals Expenditures” of Provinces/Territories “Other Professionals Expenditures” of Provinces/Territories
(millions of constant 2012 dollars, where applicable)
Expenditures Growth
Annual Increase Due to Aging and Population
Growth
Annual Increase Due to Real Cost
Total Annual Increase
Total “Other professionals
expenditures” of Provinces/Territories
as a % of GDP
Historical Pattern from 1996 to 2010 - - 0.1% 2012 : 1,103 0.1% Projection Using Historical Real Cost Growth - - 0.1% 2037 : 1,131 0.1% Projection Using Base Scenario 1.7% 1.1% 2.9% 2037 : 2,241 0.1%
Projection Assumption Under Base Scenario 40% dental—trend of 2.0% for five years, dropping to 1.0% after 25 years 20% vision—trend of 1.0% for five years, dropping to 0.5% after 25 years 40% other—trend of 1.0% for five years, dropping to 0.5% after 25 years
Sensitivity Testing
Projection Assumptions Tested
Annual Increase Due to Aging and Population
Growth
Annual Increase Due to Real Cost
Total Annual Increase
Total “Other Professionals
Expenditures” of Provinces/Territories
as a % of GDP
Demographic Model Optimistic: Low-Growth 1.4% 1.1% 2.5% 2037 : 2,046 0.1% Pessimistic: High-Growth 2.1% 1.1% 3.2% 2037 : 2,445 0.1% Dental Care Costs Optimistic: -1.0% 1.7% 0.7% 2.4% 2037 : 2,017 0.1% Pessimistic: 1.0% 1.8% 1.6% 3.4% 2037 : 2,526 0.1% Vision Care Costs Optimistic: -1.0% 1.7% 1.0% 2.7% 2037 : 2,169 0.1% Pessimistic: +1.0% 1.8% 1.3% 3.1% 2037 : 2,355 0.1% Other Care Costs Optimistic: -1.0% 1.7% 0.9% 2.6% 2037 : 2,097 0.1% Pessimistic: +1.0% 1.8% 1.5% 3.3% 2037 : 2,469 0.1%
Table 8.4 shows projected “other professionals expenditures” of provinces/territories from 2012 to 2037. They are expected to grow at an annual rate of 2.9 percent on a constant 2012 dollar basis—1.1 percent due to price increases and 1.7 percent due to aging and population growth.
Table 8.4: Projected “Other Professionals Expenditures” of Provinces/Territories, 2012 to 2037, base scenario (millions of constant 2012 dollars)
Years
New
foun
dlan
d &
La
brad
or
Prin
ce E
dwar
d Is
land
Nov
a S
cotia
New
Bru
nsw
ick
Que
bec
Ont
ario
Man
itoba
Sas
katc
hew
an
Alb
erta
Brit
ish
Col
umbi
a
Yuk
on
Nor
thw
est
Terri
torie
s
Nun
avut
Can
ada
% of GDP
2012 12 2 13 7 203 404 29 26 235 163 2 2 4 1,103 0.1% 2013 12 3 14 7 209 421 29 26 242 168 2 3 4 1,139 0.1% 2014 12 3 14 7 216 437 30 27 249 173 3 3 4 1,176 0.1% 2015 12 3 14 7 222 454 31 27 256 178 3 3 4 1,214 0.1% 2016 12 3 15 7 228 472 32 28 264 183 3 3 4 1,254 0.1% 2017 12 3 15 8 234 491 32 28 272 189 3 3 4 1,294 0.1% 2018 12 3 15 8 240 510 33 29 280 195 3 3 4 1,336 0.1% 2019 12 3 16 8 245 529 34 30 289 201 3 3 4 1,378 0.1% 2020 12 3 16 8 251 550 35 30 297 206 3 3 4 1,420 0.1% 2021 13 3 16 8 256 571 36 31 306 212 3 4 5 1,464 0.1% 2022 13 3 17 9 261 594 37 31 314 218 4 4 5 1,510 0.1% 2023 13 3 17 9 266 617 38 32 323 224 4 4 5 1,555 0.1% 2024 13 4 18 9 272 641 39 33 331 230 4 4 5 1,601 0.1% 2025 13 4 18 9 277 665 40 33 340 236 4 4 5 1,648 0.1% 2026 13 4 18 10 282 691 41 34 348 242 4 4 5 1,696 0.1% 2027 13 4 19 10 287 719 41 34 356 248 4 5 5 1,745 0.1% 2028 13 4 19 10 291 749 42 35 364 254 4 5 5 1,795 0.1% 2029 13 4 19 10 296 778 43 35 371 259 4 5 6 1,844 0.1% 2030 13 4 19 11 300 808 44 35 378 265 5 5 6 1,894 0.1% 2031 13 4 20 11 304 838 45 36 385 270 5 5 6 1,942 0.1% 2032 13 4 20 11 308 870 46 36 392 276 5 5 6 1,993 0.1% 2033 14 5 20 11 312 903 46 37 399 281 5 5 6 2,043 0.1% 2034 14 5 20 12 315 935 47 37 405 286 5 5 6 2,092 0.1% 2035 14 5 20 12 319 967 48 37 412 292 5 5 6 2,142 0.1% 2036 14 5 20 12 322 1,000 49 38 418 297 5 5 6 2,191 0.1% 2037 14 5 21 12 325 1,034 49 38 424 302 5 6 6 2,241 0.1% Source: CIHI, 2012b and calculations by the author.

© 2013 Society of Actuaries and Canadian Institute of Actuaries, All Rights Reserved Stephane Levert Consulting Services Inc. Page 40
Direct “other professionals expenditures” of the federal and municipal governments are assumed to grow proportionately to those of provinces/territories. They are expected to grow at a real rate of 2.9 percent. As the only reliable per capita “other professionals expenditures” information available is in relation to what is paid by provinces/territories (hence mostly for seniors and t he poor), this research prefers assuming no differences in per capita “other professionals expenditures” by age and gender for the working population. In addition, the weights applied to each type of care are also changed to: 65 percent for dental care, 20 percent for vision care, and 15 percent for other types of care (as supported by figures on Table 8.2). Consequently, “other professionals expenditures” paid by social security funds, by the private sector and by Canadians (through out-of-pocket payments) are expected to grow at real rates ranging from 1.7 percent to 1.8 percent. Table 8.5 summarizes the projected “other professionals expenditures,” by payer, over the next 25 years. Their weight on the Canadian economy will almost remain unchanged, forecasted to represent 1.4 percent of GDP in 2037, compared to 1.3 percent in 2012.
Table 8.5: Projected “Other Professionals Expenditures,” 2012 to 2037, by Payer, Base Scenario (millions of constant 2012 dollars)
Years Provincial/ Territorial
Governments
Federal Government
Municipal Governments
Social Security Funds
Total Public Sector
Private Sector
and Out-of-Pocket Payments
Total % of GDP
2012 1,103 346 1 344 1,793 20,482 22,276 1.3% 2013 1,139 357 1 352 1,849 21,001 22,851 1.3% 2014 1,176 369 1 361 1,906 21,525 23,431 1.3% 2015 1,214 381 1 369 1,966 22,049 24,014 1.4% 2016 1,254 394 1 378 2,026 22,567 24,593 1.4% 2017 1,294 406 1 386 2,088 23,073 25,161 1.4% 2018 1,336 419 1 394 2,150 23,551 25,701 1.4% 2019 1,378 433 1 401 2,212 24,001 26,213 1.4% 2020 1,420 446 1 408 2,275 24,436 26,711 1.4% 2021 1,464 460 1 414 2,340 24,862 27,201 1.4% 2022 1,510 474 1 421 2,406 25,272 27,678 1.4% 2023 1,555 488 1 427 2,472 25,675 28,148 1.4% 2024 1,601 503 1 434 2,539 26,081 28,620 1.4% 2025 1,648 518 1 440 2,607 26,472 29,079 1.4% 2026 1,696 533 1 446 2,676 26,858 29,534 1.4% 2027 1,745 548 1 452 2,746 27,253 29,999 1.4% 2028 1,795 564 1 458 2,818 27,637 30,456 1.4% 2029 1,844 579 1 465 2,890 28,030 30,920 1.4% 2030 1,894 595 1 472 2,961 28,458 31,419 1.4% 2031 1,942 610 1 479 3,033 28,931 31,963 1.4% 2032 1,993 626 1 487 3,107 29,435 32,542 1.4% 2033 2,043 641 1 496 3,181 29,949 33,130 1.4% 2034 2,092 657 2 504 3,255 30,464 33,718 1.4% 2035 2,142 673 2 512 3,328 30,974 34,302 1.4% 2036 2,191 688 2 520 3,401 31,482 34,883 1.4% 2037 2,241 704 2 529 3,476 31,990 35,465 1.4%

© 2013 Society of Actuaries and Canadian Institute of Actuaries, All Rights Reserved Stephane Levert Consulting Services Inc.
Page 41
Chapter 9—Projection of Drug Expenditures Drug therapies play an increasing role in the delivery of health care in Canada, with the associated expenditures having grown significantly in the past years. This chapter first looks at the current structure of drug expenditures, before projecting them in the future.
Introduction Drugs are typically classified as prescribed drugs or non-prescribed drugs.56 Expenditures include what is paid out of a public or private insurance plan as well as out-of-pocket payments by Canadians and also include over-the-counter drugs and personal health supplies. 57
It is important to note that drugs dispensed in hospitals are accounted for as hospital expenditures and discussed in Chapter 6.
From a strict point of view, drug expenditures (for drugs taken outside a hospital) are not considered as insured health services in the context of the Canada Health Act of 1984. Still, they are becoming increasingly important from a public policy perspective as a result of shifts in medical practice toward less invasive procedures, shorter hospital stays and increased use of drug therapies (particularly taken outside the hospital, often at home).
Table 9.1: Total Drug Expenditures, 2012, by Payer
Current Costs
Table 9.1 shows drug expenditures by payer and by province/ territory. It shows that the private sector and Canadian citizens, through out-of-pocket payments, are responsible for 63 percent of drug expenditures, with provinces/territories assuming 32 percent.
Provinces/territories provide drug insurance coverage as follows:
56 CIHI, 2011c. Drug expenditures “include expenditures on prescribed drugs and non-prescribed products purchased in retail stores. Estimates represent the final costs to consumers including dispending fees, markups and appropriate taxes.” 57 CIHI, 2011c. Personal health supplies “include items used primarily to promote or maintain health, for example, oral hygiene products, diagnostic items such as diabetic test strips and medical items such as incontinence products.”
Province/Territory
Provincial/Territorial Government Sector
Private Sector and Out-of-Pocket
Payments Total
Total (millions
of $)
Per capita
($)
Total (millions
of $)
Per capita
($)
Total (millions
of $)
Per capita
($)
% of GDP
Newfoundland & Labrador 157.0 308 384.0 754 554.5 1,089 2.4% Prince Edward Island 36.4 249 97.8 668 137.6 940 2.7% Nova Scotia 320.0 338 740.3 783 1,097.5 1,160 3.1% New Brunswick 195.7 259 617.6 817 839.8 1,110 2.9% Quebec 2,521.2 314 5,077.5 631 8,547.6 1,063 2.5% Ontario 4,560.2 337 8,126.3 601 12,926.0 955 1.9% Manitoba 308.5 244 710.1 563 1,103.3 874 2.0% Saskatchewan 318.7 298 559.5 523 958.8 896 1.9% Alberta 1,274.2 331 2,005.0 520 3,363.2 873 1.3% British Columbia 969.8 209 2,336.1 503 3,418.0 736 1.6% Yukon 7.3 208 13.9 397 26.1 744 1.2% Northwest Territories 5.5 124 15.5 351 30.9 702 0.8% Nunavut 2.6 76 12.1 358 22.2 657 1.4% Total Canada 10,677.1 306 20,695.6 593 33,025.5 947 2.0% Prov./Terr. Governments 10,677.1 306 Federal Direct 597.0 17
Social Security Funds 1,055.7 30
Total 12,329.9 354 20,695.6 593 33,025.5 947 2.0% Source: CIHI, 2012b.

© 2013 Society of Actuaries and Canadian Institute of Actuaries, All Rights Reserved Stephane Levert Consulting Services Inc. Page 42
• Newfoundland & Labrador—has a pharmacare program for seniors, those on welfare and those with chronic conditions, with an income-based deductible. Some coverage is also available to others, again based on income.
• Prince Edward Island—has a phar macare program for seniors and f or those with a c hronic condition. No coverage is available to others.
• Nova Scotia—has a voluntary pharmacare program for seniors and families, with income-based premiums. Residents with certain chronic conditions also have pharmacare coverage.
• New Brunswick—provides pharmacare coverage to low-income seniors. Other seniors may enroll into a voluntary program for a premium. At the time of drafting this report, there was no coverage available to other residents; however, something is said to be in preparation.
• Quebec—all residents with no access to a private drug plan must enroll into a universal public pharmacare program funded with income-based premiums.58
• Ontario—has a pharmacare program for seniors with an income-based deductible. A catastrophic income-tested program is also available. The following quote from the C.D. Howe Institute illustrates the Ontario Drug Benefit program (ODB):
Ontarians aged 65 and over qualify for coverage of prescription drugs under the ODB. Residents can also qualify for ODB coverage if they reside in long-term or special care homes, if they receive support from Ontario Works or Ontario Disability, if they receive professional home services or qualify for the Trillium Drug Program 59 […] The ODB manages a list of covered drugs—a formulary—and considers exceptional requests case-by-case. There are co-payments and deductibles in the program: single income seniors aged 65+ with annual income of $16,018 or more and couples with income of $24,175 currently pay an annual deductible of $100 and pay up to $6.11 towards a dispensing fee; people with income below these levels pay $2.00 for each prescription filled. […] 69% of ODB beneficiaries in 2007 were seniors.60,61
• Manitoba—has a pharmacare program with an income-based deductible that can be reimbursed by a private plan.
• Saskatchewan—has an income-based pharmacare program for seniors, a pharmacare program covering some prescription drugs for children under 15 for free, and a pharmacare program with an income-based deductible that can be reimbursed by a private plan.
• Alberta—has a pharmacare program for seniors. Others may voluntarily enroll into the premium-funded Alberta Blue Cross Non-Group Coverage when they have no access to private coverage.
• British Columbia—has a pharmacare program with income-based deductibles which can be reimbursed by private plans.
• Yukon, the Northwest Territories and Nunavut—have pharmacare programs for seniors, as second payer, and for those with a c hronic condition (income-base deductible in Yukon). No coverage is available to others.
58 It must be noted that the Quebec Drug Insurance Fund is broken down in two parts for the purpose of this report: (1) an amount corresponding to the contributions of enrollees (akin to insurance premium) is counted under the social security funds sector, and (2) the balance, essentially being funded by the general revenues of the province, is counted under the provincial government sector. 59 The Trillium Drug Program is a program for Ontario residents, not based on age, who face relatively onerous prescription drug costs relative to net household income. 60 Trillium beneficiaries make up about 6 percent; the remaining 25 percent of beneficiaries qualify either through social assistance or are residents of special care homes (Ontario Ministry of Health and Long-Term Care 2009). 61 Busby, C., and W.B.P. Robson, C.D. Howe Institute. 2011. A Social Insurance Model for Pharmacare: Ontario’s Options for a More Sustainable Cost-Effective Drug Program.

© 2013 Society of Actuaries and Canadian Institute of Actuaries, All Rights Reserved Stephane Levert Consulting Services Inc. Page 43
As shown on Table 9.2, more than 74 percent of drug expenditures from the private sector (including out-of-pocket payments by Canadians) are in relation to prescribed drugs, the remainder being split between over-the-counter drugs and personal health supplies. In addition, private benefit plans 62
are reimbursing approximately two-thirds of the cost of prescribed drugs.
It must be noted that purchases of non-prescribed drugs by Canadians result in the federal government collecting goods & services taxes (GST). This corresponds to revenues of approximately $0.2 billion in 2012.63
Some may argue that this amount could be removed from the health care costs that the federal government claims to be assuming. For the sake of simplicity, the impact of GST or other tax revenues on the financial burden of different payers of health care services is ignored by this report; it must be noted, however, that the amounts of GST and other taxes paid when purchasing OTC drugs and personal health supplies are included in the expenditures figures.
Figure 9.1 shows that the drug expenditures have increased at an annual real rate of 5.1 percent—on top of inflation—over the past 15 years (the share assumed by provinces/territories, however, increased at a real rate of 6.3 percent and that assumed by the private sector and by
Canadians at a real rate of 4.5 percent). Meanwhile, per capita expenditures have increased at a real rate of 4.0 percent (5.2 percent for the share assumed by provinces/territories and 3.4 percent for the share assumed by the private sector, including out-of-pocket payments by Canadians). The fact that total and per capita drug expenditures increased more rapidly for provinces/territories than for the private sector (including out-of-pocket payments by Canadians) is due to aging as governments are covering older people—the fastest growing section of the population. Per capita drug expenditures of provinces/territories follow the pattern shown on Figure 9.2 by age and gender. Actual data for the year 2010 is published by CIHI. It is then projected to 2012 using the demographic model
62 This includes reimbursements from private insurers (under individual and group insurance policies) and from all employee benefit plans (whether self-insured, ASO or fully insured). 63 Some provinces are also collecting sales tax revenues as well as premium tax and/or HST/PST. However, the figures are difficult to assess as there are not enough provincial breakdowns available.
Table 9.2: Private Drug Expenditures by Type of Drug Expenditures, 2009 to 2012 (millions of constant 2012 dollars)
2009 2010 2011 2012 Reimbursements from Benefit Plans 9,295 9,717
n/a n/a
Out-of-Pocket Expenditures 4,593 4,740 n/a n/a Subtotal Prescribed Drugs 13,888 14,457 14,963 15,404 Over-the-Counter Drugs 2,889 2,779 n/a n/a Personal Health Supplies 2,086 2,178 n/a n/a Subtotal Non-Prescribed Drugs 4,975 4,957 5,127 5,292 Total private drug expenditures 18,863 19,414 20,090 20,696 Source: CIHI, 2011a, CIHI, 2012b.
Figure 9.1: Historical Drug Expenditures, 1997 to 2012 (millions of constant 2012 dollars)
0
5,000
10,000
15,000
20,000
25,000
30,000
35,000
1997
19
98
1999
20
00
2001
20
02
2003
20
04
2005
20
06
2007
20
08
2009
20
10
2011
20
12
Other sectors Private sector Provincial and territorial governments
Source: CIHI, 2012b.
Figure 9.2: Per Capita Drug Expenditures of Provinces/Territories, 2012
$0 $200 $400 $600 $800
$1,000 $1,200 $1,400 $1,600 $1,800 $2,000
<1
1-4
5-9
10-1
4 15
-19
20-2
4 25
-29
30-3
4 35
-39
40-4
4 45
-49
50-5
4 55
-59
60-6
4 65
-69
70-7
4 75
-79
80-8
4 85
-89
90+
Female Male
Source: CIHI, 2012b.

© 2013 Society of Actuaries and Canadian Institute of Actuaries, All Rights Reserved Stephane Levert Consulting Services Inc. Page 44
presented in Chapter 4 by ensuring that the total resulting drug expenditures match the estimate shown on Table 9.1. Drug expenditures by the provinces/territories increase smoothly from young ages to age 65.64
They then climb sharply, being multiplied by a factor of at least 4 by age 85, before starting to decline. This decline at older ages may be related to the fact that elders on drug therapy are possibly either hospitalized or institutionalized, with the costs related to their drug therapy being accounted for in these respective categories (discussed in Chapters 6 and 7).
Projections The actual drug expenditures of provinces/territories from 1996 t o 2010 are analyzed to identify components of growth. The combined effect of aging and population growth averages 2.9 percent per year. Real price inflation in drugs, on an age-/gender-neutral basis, has averaged 4.3 percent per year—
on top of inflation—with Saskatchewan experiencing increases as high as 9.2 percent and British Columbia being in the lower end of the range at 2.0 percent. Real price inflation is composed of: (1) increases in market prices, (2) changes in drugs mixes, (3) trends in utilization of drug therapies (except because of aging and po pulation growth), and (4) introduction of new drugs. Fixing an assumption for the future increase in drug expenditures is challenging. On one hand, expecting an increase in the volume and intensity of drug
therapies is not unreasonable, which will bring people out of hospitals into their homes. As a result, drug expenditures may go up faster, with a corresponding offset in some hospital costs. Meanwhile, some very expensive drugs are coming on the market that can have a significant impact on their own even though they may only target a tiny portion of the population. On the other hand, arguments are made that some factors may come into play to contain the increases in drug expenditures:
[…] The many upward pressures on pharmacare costs are likely to abate in future years as large patents expire, more generic drugs come to market, […] and recent policy reforms to save costs take effect.65
[…] The generic share of the Canadian prescription drug market is expected to increase in the coming years as patents of many blockbuster medicines expire. […] This suggests that there is potential for significant savings due to new generic competition, particularly in the coming three to five years.66
Using the observed historical trends in drug expenditures (that is, assuming that real prices will grow at an annual rate of 4.3 percent—on top of inflation—over the entire projection period) would result in total
64 It is important for the reader to remember that this observation only applies to the population eligible for government-sponsored drug plans and effectively spreads their costs to the entire population. It must be realized that a sizable portion of the population is not benefiting from these plans. The behavior of members of a private group benefit plan is likely different. 65 Busby, C., and W.B.P. Robson, C.D. Howe Institute. 2011. A Social Insurance Model for Pharmacare: Ontario’s Options for a More Sustainable Cost-Effective Drug Program. 66 CIHI, 2011b.
Table 9.3: Components of Drug Expenditures Growth, 1996 to 2010, by Province and Territory (constant 2012 dollar basis)
Province Aging and Population
Growth
Real Price
Inflation
Total Real
Growth Newfoundland & Labrador - - - Prince Edward Island - - - Nova Scotia 1.5% 6.7% 8.2% New Brunswick 1.4% 6.4% 7.8% Quebec 2.4% 4.6% 7.0% Ontario 2.6% 3.9% 6.5% Manitoba - - - Saskatchewan 0.8% 9.2% 9.9% Alberta 3.5% 5.7% 9.1% British Columbia 2.2% 2.0% 4.3% Canada 2.9% 4.3% 7.2% Source: CIHI, 2012b and calculations by the author.

© 2013 Society of Actuaries and Canadian Institute of Actuaries, All Rights Reserved Stephane Levert Consulting Services Inc. Page 45
drug expenditures growing at an annual real rate of 5.2 percent, from $33.0 billion (2.0 percent of GDP) in 2012 to $117.0 billion (4.7 percent of GDP) in 2037. The share of drug expenditures of provinces/territories would grow at an annual real rate of 5.9 percent. Such an assumption assumes that historical trends will continue in the future, with no action taken to contain costs. Instead, this research assumes that action will be taken to contain costs, resulting in future expenditures increases to eventually converge closer to general inflation. Consequently, the projection model assumes that the real per capita drug expenditures will increase at an annual rate of 3 percent. Real per capita drug expenditures of provinces/territories are applied to the projected demography to arrive at total real drug expenditures. They are expected to grow at an annual rate of 4.6 percent on a constant 2012 dollar basis—3.0 percent due to price increases and 1.6 percent due to aging and population growth. Table 9.4 summarizes key findings from the projection of drug expenditures of provinces/territories and the sensitivities of the assumptions used.
Table 9.4: Summary of Projections of Drug Expenditures of Provinces/Territories
Drug Expenditures of Provinces/Territories (millions of constant 2012 dollars, where applicable)
Expenditures Growth
Annual Increase Due to Aging and Population
Growth
Annual Increase Due to Real Cost
Total Annual Increase
Total Drug Expenditures of
Provinces/Territories
as a % of GDP
Historical Pattern from 1996 to 2010 2.9% 4.3% 7.2% 2012 : 10,677 0.6% Projection Using Historical Real Cost Growth 1.6% 4.3% 5.9% 2037 : 44,904 1.8% Projection Using Base Scenario 1.6% 3.0% 4.6% 2037 : 32,818 1.3% Projection Assumption Under Base Scenario Trend of 3% for 25 years
Sensitivity Testing
Projection Assumptions Tested
Annual Increase Due to Aging and Population
Growth
Annual Increase Due to Real Cost
Total Annual Increase
Total Drug Expenditures of
Provinces/Territories
as a % of GDP
Demographic Model Optimistic: Low-Growth 1.4% 3.0% 4.4% 2037 : 31,066 1.4% Pessimistic: High-Growth 1.8% 3.0% 4.8% 2037 : 34.596 1.3% Drug Costs Optimistic: -1.0% 1.6% 2.0% 3.6% 2037 : 25,715 1.0% Pessimistic: +1.0% 1.6% 4.0% 5.6% 2037 : 41,784 1.7%
Table 9.5 shows projected drug expenditures of provinces/territories from 2012 t o 2037. Direct drug expenditures of the federal government and by social security funds are assumed to grow proportionately to those of provinces/territories. They are expected to grow at a real rate of 4.6 percent. The per capita drug expenditures curve from provinces/territories, where the clientele consists mainly of the poor and the elderly, is most certainly different than that of the private sector (including out-of-pocket payments by Canadians), covering the working population. Therefore, it is not a reliable basis for projecting private drug expenditures (including out-of-pocket payments). No other reliable information being available, they are instead projected assuming that they grow at an annual real rate of 3 percent in addition to the effect of growth of the working population. In consequence, the private sector (including out-of-pocket payments by Canadians) drug expenditures are expected to grow at a r eal rate of 3.4 percent.

© 2013 Society of Actuaries and Canadian Institute of Actuaries, All Rights Reserved Stephane Levert Consulting Services Inc. Page 46
Table 9.5: Projected Drug Expenditures of Provinces/Territories, 2012 to 2037, Base Scenario (millions of constant 2012 dollars)
Years N
ewfo
undl
and
&
Labr
ador
Prin
ce E
dwar
d Is
land
Nov
a S
cotia
New
Bru
nsw
ick
Que
bec
Ont
ario
Man
itoba
Sas
katc
hew
an
Alb
erta
Brit
ish
Col
umbi
a
Yuk
on
Nor
thw
est
Terri
torie
s
Nun
avut
Can
ada
% GDP
2012 157 36 320 196 2,521 4,560 309 319 1,274 970 7 5 3 10,677 0.6% 2013 164 38 335 205 2,639 4,806 322 332 1,344 1,017 8 6 3 11,217 0.7% 2014 170 40 351 214 2,762 5,060 335 346 1,416 1,066 8 6 3 11,777 0.7% 2015 177 42 367 224 2,890 5,325 350 361 1,492 1,117 8 6 3 12,362 0.7% 2016 185 45 383 234 3,021 5,604 364 376 1,571 1,170 9 7 3 12,972 0.7% 2017 192 47 400 245 3,156 5,895 379 392 1,654 1,226 9 7 3 13,606 0.7% 2018 200 49 418 257 3,297 6,202 395 409 1,741 1,284 9 7 4 14,273 0.8% 2019 208 51 436 269 3,445 6,528 411 427 1,833 1,344 10 8 4 14,973 0.8% 2020 216 54 455 281 3,599 6,873 429 446 1,930 1,406 10 8 4 15,711 0.8% 2021 224 56 475 295 3,756 7,234 447 466 2,030 1,472 11 8 4 16,478 0.8% 2022 232 59 496 309 3,919 7,614 465 487 2,134 1,540 11 8 4 17,279 0.9% 2023 241 62 517 324 4,086 8,011 484 508 2,242 1,610 11 9 5 18,111 0.9% 2024 250 64 539 339 4,258 8,428 504 530 2,354 1,684 12 9 5 18,977 0.9% 2025 258 67 562 354 4,435 8,871 525 553 2,471 1,762 12 9 5 19,886 1.0% 2026 267 70 586 370 4,615 9,335 546 577 2,590 1,841 13 10 5 20,825 1.0% 2027 276 73 610 386 4,795 9,812 568 602 2,712 1,923 13 10 5 21,787 1.0% 2028 285 77 635 403 4,979 10,317 592 627 2,838 2,009 14 11 6 22,790 1.1% 2029 294 80 660 420 5,167 10,839 615 653 2,968 2,097 14 11 6 23,825 1.1% 2030 304 83 686 437 5,360 11,376 640 679 3,100 2,190 14 11 6 24,888 1.1% 2031 313 87 711 454 5,553 11,910 666 706 3,234 2,286 15 12 7 25,951 1.2% 2032 323 90 735 471 5,743 12,438 693 732 3,368 2,384 15 12 7 27,010 1.2% 2033 332 94 759 487 5,935 12,980 720 759 3,505 2,486 16 12 7 28,094 1.2% 2034 341 97 784 504 6,134 13,543 749 787 3,648 2,592 16 13 7 29,215 1.2% 2035 351 100 810 523 6,339 14,124 778 815 3,796 2,701 17 13 8 30,377 1.3% 2036 361 104 837 540 6,551 14,721 809 845 3,948 2,813 18 14 8 31,569 1.3% 2037 372 108 864 559 6,772 15,347 841 876 4,108 2,930 18 15 8 32,818 1.3% Source: CIHI, 2012b and calculations by the author.
Table 9.6 summarizes the projected drug expenditures, by payer, over the next 25 years. Drugs were using economic resources equivalent to 2.0 percent of GDP in 2012. Their importance is projected to grow to 3.5 percent by 2037.
Table 9.6: Projected Drug Expenditures, 2012 to 2037, by Payer, Base Scenario (millions of constant 2012 dollars)
Years Provincial/ Territorial
Governments
Federal Government
Municipal Governments
Social Security Funds
Total Public Sector
Private Sector
and Out-of-Pocket Payments
Total % of GDP
2012 10,677 597 0 1,056 12,330 20,696 33,025 2.0% 2013 11,217 627 0 1,109 12,953 21,478 34,430 2.0% 2014 11,777 659 0 1,164 13,600 22,278 35,878 2.1% 2015 12,362 691 0 1,222 14,276 23,096 37,372 2.1% 2016 12,972 725 0 1,283 14,980 23,923 38,903 2.2% 2017 13,606 761 0 1,345 15,713 24,754 40,467 2.2% 2018 14,273 798 0 1,411 16,482 25,581 42,063 2.3% 2019 14,973 837 0 1,481 17,291 26,405 43,695 2.3% 2020 15,711 879 0 1,554 18,143 27,238 45,382 2.4% 2021 16,478 921 0 1,629 19,029 28,092 47,121 2.4% 2022 17,279 966 0 1,709 19,954 28,956 48,910 2.5% 2023 18,111 1,013 0 1,791 20,914 29,844 50,758 2.5% 2024 18,977 1,061 0 1,876 21,915 30,765 52,680 2.6% 2025 19,886 1,112 0 1,966 22,964 31,704 54,668 2.7% 2026 20,825 1,164 0 2,059 24,048 32,674 56,723 2.7% 2027 21,787 1,218 0 2,154 25,159 33,694 58,853 2.8% 2028 22,790 1,274 0 2,253 26,317 34,741 61,059 2.9% 2029 23,825 1,332 0 2,356 27,513 35,842 63,355 2.9% 2030 24,888 1,392 0 2,461 28,740 37,025 65,765 3.0% 2031 25,951 1,451 0 2,566 29,969 38,319 68,287 3.1% 2032 27,010 1,510 0 2,671 31,191 39,708 70,899 3.1% 2033 28,094 1,571 0 2,778 32,443 41,168 73,611 3.2% 2034 29,215 1,634 0 2,889 33,737 42,691 76,429 3.3% 2035 30,377 1,699 0 3,004 35,079 44,271 79,350 3.3% 2036 31,569 1,765 0 3,121 36,455 45,912 82,368 3.4% 2037 32,818 1,835 0 3,245 37,898 47,621 85,519 3.5%

© 2013 Society of Actuaries and Canadian Institute of Actuaries, All Rights Reserved Stephane Levert Consulting Services Inc.
Page 47
Chapter 10—Projection of “Other Health Spending” This chapter is interested with the health care expenditures in relation to capital expenditures, health research, public health, the administration of health insurance plans and other expenditures. It first looks at the current structure of “other health spending” before projecting its components in the future.
Introduction “Other health spending” includes the following categories:
• Capital expenditures on hospitals and facilities, equipment, etc.67
• Public health expenditures such as food and drug safety, health promotion, disease control programs, etc.
68
• Administration costs of health insurance programs and operating costs of health agencies
69
• Health research
70
• Home care, which only includes the health professional component (such as support for bathing, eating, etc.), not the home support component (such as support for preparing meals, doing the lawn, etc.)
• Medical transportation • Medical devices, appliances and prostheses.
These expenditures are not meant to be covered under the Canada Health Act of 1984.
67 CIHI, 2011c. Capital expenditures “include expenditures on construction, machinery, equipment and some software of hospitals, clinics, first-aid stations and residential care facilities. It is based on full-cost or cash-basis accounting principles.” 68 CIHI, 2011c. Public health expenditures by governments and government agencies “include expenditures for items such as food and drug safety, health inspections, health promotion activities, community mental health programs, public health nursing, measures to prevent the spread of communicable disease and occupational health to promote and enhance health and safety at the workplace in public-sector agencies.” 69 CIHI, 2011c. Administration expenditures are defined as: “expenditures related to the cost of providing health insurance programs by the government and private health insurance companies and all costs for the infrastructure to operate health departments. The administrative costs of operating hospitals, drug programs, long-term care programs and other non-insured health services are not included under the category of administration, but rather are included under the category of service, for example, hospitals, other institutions and drugs.” 70 CIHI, 2011c. Health research expenditures are defined as: “expenditures for research activities designed to further knowledge of the determinants of health, health status or methods of providing health care, evaluation of health care delivery or of public health programs. The category does not include research carried out by hospitals or drug companies in the course of product development. These amounts would be included with either the hospital or drug category.”

© 2013 Society of Actuaries and Canadian Institute of Actuaries, All Rights Reserved Stephane Levert Consulting Services Inc. Page 48
Current Costs Table 10.1 shows “other health spending” by payer and by province/territory. It shows that the public sector is responsible for 77 percent of “other health spending,” with provinces/territories assuming close to 80 percent of that amount.
Table 10.1: Total “Other Health Spending,” 2012, by Payer
Province/Territory
Provincial/Territorial Government Sector
Private Sector and Out-of-Pocket
Payments Total
Total (millions
of $)
Per capita
($)
Total (millions
of $)
Per capita
($)
Total (millions
of $)
Per capita
($)
% of GDP
Newfoundland & Labrador 377.0 740 101.8 200 534.6 1,050 2.3% Prince Edward Island 137.1 937 25.2 172 210.8 1,440 4.1% Nova Scotia 588.1 622 215.8 228 963.9 1,019 2.7% New Brunswick 452.1 598 172.7 228 743.7 983 2.6% Quebec 4,746.2 590 1,635.6 203 7,355.2 915 2.2% Ontario 9,031.1 668 3,679.6 272 15,041.7 1,112 2.2% Manitoba 1,020.5 809 304.3 241 1,753.5 1,389 3.2% Saskatchewan 960.2 898 215.9 202 1,463.5 1,368 2.9% Alberta 2,809.8 729 1,248.7 324 4,763.3 1,236 1.8% British Columbia 3,942.9 849 1,326.6 286 5,984.3 1,288 2.9% Yukon 65.7 1,873 4.9 141 94.9 2,706 4.2% Northwest Territories 64.0 1,453 4.5 103 115.3 2,616 3.0% Nunavut 123.8 3,670 3.4 101 163.3 4,843 10.7% Total Canada 24,318.4 697 8,939.2 256 39,188.1 1,124 2.3% Prov./Terr. Governments 24,318.4 697 Federal Direct 4,495.4 129
Municipal Governments 842.7 24
Social Security Funds 592.4 17
Total 30,248.9 867 8,939.2 256 39,188.1 1,124 2.3% Source: CIHI, 2012b.
Table 10.2 summarizes how public and private spending, including direct payments by Canadians, is distributed by category of “other health spending.”
Figure 10.1 shows that “other health spending” has increased at an ann ual real rate of 5.6 percent—on top of inflation—over the past 15 years (the share assumed by provinces/territories, however, increased at a real rate of 5.7 percent). Meanwhile, per capita expenditures have increased at a real rate of 4.5 percent (4.6 percent for the share assumed by provinces/territories).
Projections “Other health spending” cannot be projected similarly to other expenditures as per capita numbers are not available and would have little meaning anyway. Each category of “other health spending” is projected
Table 10.2: “Other Health Spending” by Type of Expenditures, 2012 (millions of dollars)
Type of Expenditures
Public Sector Private Sector Total Provincial/
Territorial Gov'ts
Other Public Sector
Total
Capital 7,101 369 7,470 2,131 9,601 Public Health 8,855 2,178 11,033 0 11,033 Administration 1,637 959 2,595 3,839 6,434 Health Research n/a n/a 1,890 1,381 3,272 Other n/a n/a 7,260 1,588 8,848 Total 24,318 5,930 30,249 8,939 39,188 Source: CIHI, 2012b.
Figure 10.1: Historical “Other Health Spending,” 1997 to 2012 (millions of constant 2012 dollars)
0
10,000
20,000
30,000
40,000
50,000
1997
19
98
1999
20
00
2001
20
02
2003
20
04
2005
20
06
2007
20
08
2009
20
10
2011
20
12
Other sectors Private sector Federal direct Provincial and territorial governments
Source: CIHI, 2012b.

© 2013 Society of Actuaries and Canadian Institute of Actuaries, All Rights Reserved Stephane Levert Consulting Services Inc. Page 49
separately, not all of them being influenced by demographic factors. Using the observed trends in “other health spending” (that is, assuming that they grow at an annual real rate of 5.6 percent—on top of inflation—over the entire projection period) would result in total “other health spending” of provinces/territories growing from $24.3 billion (1.5 percent of GDP) in 2012 to 95.0 billion of constant 2012 dollars (3.8 percent of GDP) in 2037. Assumptions used in the model are:
• Capital—Real capital expenditures grow with the growth of the population. • Public health—Expenses are assumed to remain fixed on a constant 2012 dollar basis (meaning
that they will actually be rising at the rate of inflation). • Administration—Expenses are assumed to remain fixed on a constant 2012 dollar basis. • Health research—Real expenses are assumed to grow with the real GDP. • Other—Real other expenditures, which include home care, 71
are assumed to grow with the growth of the population, plus 1.0 percent for the first five years, and then at a decreasing rate reaching 0.5 percent by 2037, to reflect the expectations that provinces/territories will increase their efforts to provide care outside hospitals, putting more emphasis on home care.
Table 10.3 summarizes key findings from the projection of “other health spending” of provinces/territories and the sensitivities of the assumptions used.
Table 10.3: Summary of Projections of “Other Health Spending” of Provinces/Territories
“Other Health Spending” of Provinces/Territories (millions of constant 2012 dollars, where applicable)
Expenditures Growth
Annual Increase Due to Aging and Population
Growth
Annual Increase Due to Real Cost
Total Annual Increase
Total “Other Health Spending” of
Provinces/Territories
as a % of GDP
Historical Pattern from 1996 to 2010 - 5.6% 5.6% 2012 : 24,318 1.5% Projection Using Historical Real Cost Growth - 5.6% 5.6% 2037 : 94,957 3.8% Projection Using Base Scenario - 0.8% 0.8% 2037 : 29,812 1.2%
Projection Assumption Under Base Scenario
Capital—trend with population growth Public health—no trend
Administration—no trend Health research—trend with real GDP growth
Other—trend with population growth plus 1.0% for five yrs, dropping to 0.5% after 25 yrs Sensitivity Testing
Projection Assumption Tested
Annual Increase Due to Aging and Population
Growth
Annual Increase Due to Real Cost
Total Annual Increase
Total “Other Health Spending” of
Provinces/Territories
as a % of GDP
Demographic Model Optimistic: Low-Growth - 0.6% 0.6% 2037 : 28,205 1.2% Pessimistic: High-Growth - 1.0% 1.0% 2037 : 31,508 1.2%
Table 10.4 summarizes the projected “other health spending” of provinces/territories from 2012 to 2037 under the base scenario. They are expected to grow at a real rate of 0.8 percent.
71 Technically, it would be justified to make home care expenditures vary by age. However, no per capita age-/gender-dependent data is available for “other health spending.” Therefore, the author has no choice but to resort to a more simple projection assumption.

© 2013 Society of Actuaries and Canadian Institute of Actuaries, All Rights Reserved Stephane Levert Consulting Services Inc. Page 50
Table 10.4: Projected “Other Health Spending” of Provinces/Territories, 2012 to 2037, Base Scenario (millions of constant 2012 dollars)
Years N
ewfo
undl
and
&
Labr
ador
Prin
ce E
dwar
d Is
land
Nov
a S
cotia
New
Bru
nsw
ick
Que
bec
Ont
ario
Man
itoba
Sas
katc
hew
an
Alb
erta
Brit
ish
Col
umbi
a
Yuk
on
Nor
thw
est
Terri
torie
s
Nun
avut
Can
ada
% of GDP
2012 377 137 588 452 4,746 9,031 1,020 960 2,810 3,943 66 64 124 24,318 1.5% 2013 378 138 591 455 4,780 9,123 1,029 967 2,839 3,987 66 64 125 24,543 1.4% 2014 379 139 595 457 4,815 9,215 1,039 973 2,868 4,031 66 65 125 24,767 1.4% 2015 381 140 598 459 4,849 9,308 1,048 979 2,897 4,076 67 65 127 24,994 1.4% 2016 382 142 602 462 4,882 9,401 1,057 986 2,925 4,121 67 66 128 25,220 1.4% 2017 383 143 605 464 4,916 9,495 1,066 992 2,954 4,165 67 66 129 25,446 1.4% 2018 385 144 608 467 4,948 9,587 1,075 999 2,983 4,209 68 67 131 25,671 1.4% 2019 386 145 611 469 4,980 9,679 1,084 1,005 3,010 4,253 78 67 132 25,892 1.4% 2020 388 146 615 471 5,011 9,771 1,093 1,011 3,038 4,297 68 67 133 26,111 1.4% 2021 389 147 618 474 5,043 9,864 1,103 1,018 3,066 4,341 69 68 134 26,333 1.4% 2022 390 148 621 476 5,073 9,957 1,112 1,024 3,093 4,386 69 68 135 26,553 1.4% 2023 392 150 624 478 5,103 10,049 1,121 1,030 3,120 4,430 70 69 136 26,773 1.3% 2024 393 151 627 480 5,134 10,143 1,130 1,037 3,147 4,474 70 69 137 26,992 1.3% 2025 394 152 631 482 5,163 10,235 1,139 1,043 3,175 4,518 70 70 139 27,211 1.3% 2026 395 153 633 485 5,192 10,328 1,148 1,049 3,201 4,563 71 70 139 27,428 1.3% 2027 396 154 636 487 5,221 10,420 1,157 1,056 3,228 4,607 71 71 139 27,644 1.3% 2028 398 155 639 489 5,250 10,512 1,167 1,062 3,255 4,651 72 71 141 27,861 1.3% 2029 399 156 642 491 5,278 10,603 1,176 1,068 3,282 4,696 72 72 142 28,075 1.3% 2030 400 157 645 492 5,306 10,695 1,185 1,075 3,309 4,740 72 72 143 28,291 1.3% 2031 401 158 648 494 5,334 10,787 1,194 1,081 3,336 4,785 73 73 144 28,508 1.3% 2032 402 159 651 496 5,362 10,881 1,204 1,088 3,363 4,829 73 73 144 28,726 1.3% 2033 403 160 653 498 5,390 10,974 1,213 1,095 3,390 4,874 74 74 145 28,943 1.3% 2034 404 161 656 500 5,418 11,066 1,223 1,101 3,417 4,919 74 74 147 29,161 1.2% 2035 406 162 659 502 5,445 11,159 1,232 1,108 3,444 4,963 75 75 148 29,378 1.2% 2036 407 163 662 504 5,472 11,251 1,242 1,115 3,471 5,007 75 75 149 29,593 1.2% 2037 408 164 665 506 5,500 11,345 1,252 1,122 3,498 5,052 75 76 151 29,812 1.2% Source: CIHI, 2012b and calculations by the author.
Table 10.5 summarizes the projected “other health spending,” by payer, over the next 25 years. “Other health spending” is the only type of health care expenditures whose weight on the Canadian economy is expected to lighten, the associated expenditures expected to decrease from 2.3 percent of GDP in 2012 to 2.0 percent in 2037.
Table 10.5: Projected “Other Health Spending,” 2012 to 2037, by Payer, Base Scenario (millions of constant 2012 dollars)
Years Provincial/ Territorial
Governments
Federal Government
Municipal Governments
Social Security Funds
Total Public Sector
Private Sector
and Out-of-Pocket Payments
Total % of GDP
2012 24,318 4,495 843 592 30,249 8,939 39,188 2.3% 2013 24,543 4,537 851 598 30,529 9,026 39,555 2.3% 2014 24,767 4,579 859 603 30,809 9,114 39,922 2.3% 2015 24,994 4,622 866 609 31,091 9,201 40,292 2.3% 2016 25,220 4,665 874 615 31,374 9,288 40,662 2.3% 2017 25,446 4,707 882 620 31,656 9,373 41,029 2.2% 2018 25,671 4,750 890 626 31,937 9,457 41,394 2.2% 2019 25,892 4,792 898 631 32,214 9,540 41,753 2.2% 2020 26,111 4,835 906 637 32,490 9,621 42,111 2.2% 2021 26,333 4,878 915 643 32,769 9,703 42,471 2.2% 2022 26,553 4,922 923 649 33,046 9,784 42,830 2.2% 2023 26,773 4,966 931 654 33,324 9,865 43,189 2.2% 2024 26,992 5,011 939 660 33,602 9,946 43,548 2.2% 2025 27,211 5,056 948 666 33,881 10,027 43,907 2.2% 2026 27,428 5,101 956 672 34,157 10,107 44,264 2.1% 2027 27,644 5,147 965 678 34,434 10,189 44,623 2.1% 2028 27,861 5,194 974 684 34,713 10,270 44,982 2.1% 2029 28,075 5,241 983 691 34,989 10,351 45,341 2.1% 2030 28,291 5,289 992 697 35,269 10,435 45,704 2.1% 2031 28,508 5,339 1,001 704 35,552 10,522 46,074 2.1% 2032 28,726 5,390 1,010 710 35,837 10,611 46,448 2.1% 2033 28,943 5,441 1,020 717 36,121 10,701 46,822 2.0% 2034 29,161 5,494 1,030 724 36,409 10,791 47,200 2.0% 2035 29,378 5,547 1,040 731 36,695 10,882 47,577 2.0% 2036 29,593 5,600 1,050 738 36,981 10,972 47,953 2.0% 2037 29,812 5,644 1,058 744 37,258 11,065 48,322 2.0%

© 2013 Society of Actuaries and Canadian Institute of Actuaries, All Rights Reserved Stephane Levert Consulting Services Inc.
Page 51
Chapter 11—Public Accounts and the Canada Health Transfer After having described the Canadian health care system, after having reviewed its current cost by types of expenditures, after having set projection assumptions, and after having projected health care expenditures from 2012 to 2037, this chapter discusses the implication of future health care expenditures on the financial position of provinces/territories. Then, the Canada Health Transfer (CHT) is described, including the calculation formula that currently prevails and the new calculation formula proposed by the federal government. Any implication on t he financial position of provinces/territories is assessed as well as that of the federal government, from a broad perspective as well as from the narrower perspective of the Canada Health Act of 1984.
Introduction Historically, health care expenditures of provinces/territories have grown at an annual real rate of 4.2 percent, on top of inflation—1.0 percent from aging and population growth and 3.2 percent from real price increases. Assuming such trend continues in the future would result in total health care expenditures of provinces/territories growing at an annual real rate of 5.1 percent—on top of inflation—from $135.0 billion (8.2 percent of GDP) in 2012 to 466.7 billion of constant 2012 dollars (19.2 percent of GDP) in 2037. Instead, this report assumes that unspecified public policies will be implemented to limit future health care cost increases (effectively resulting in total health care expenditures being more than 30 percent lower in 2037 than if no action is taken). The assumptions adopted result in an expected growth rate in provincial/territorial health care expenditures equal to 3.5 percent on top of inflation. This is shown in Table 11.1.
Table 11.1: Summary of Projections of Total Health Care Expenditures of Provinces/Territories
Total Health Care Expenditures of Provinces/Territories (millions of constant 2012 dollars, where applicable)
Expenditures Growth
Annual Increase Due to Aging and Population
Growth
Annual Increase Due to Real Cost
Total Annual Increase
Total Health Care Expenditures of
Provinces/Territories
as a % of GDP
Historical Pattern from 1996 to 2010 1.0% 3.2% 4.2% 2012 : 134,952 8.2% Projection Using Historical Real Cost Growth 1.9% 3.2% 5.1% 2037 : 466,716 19.2% Projection Using Base Scenario 1.9% 1.6% 3.5% 2037 : 315,182 12.7%
Figure 11.1 summarizes the projected health care expenditures of provinces/territories. Under our model (which assumes government action to reduce the real rate of growth), they are expected to grow from $135.0 billion in 2012 to $315.2 billion in 2037, on a constant 2012 dollar basis. That’s an annualized real increase of 3.5 percent—on top of inflation. Looking by type of expenditures, physician expenditures are expected to grow at an annual real rate of 3.4 percent over the next 25 years, hospital expenditures at an annual real rate of 3.9 percent, “other institutions expenditures” at an annual real rate of 3.9 percent, “other professionals expenditures” at an annual real rate of 2.9 percent, drug expenditures at an annual real rate of 4.6 percent, and “other health spending” at an annual real rate of 0.8 percent.

© 2013 Society of Actuaries and Canadian Institute of Actuaries, All Rights Reserved Stephane Levert Consulting Services Inc. Page 52
In addition, Figure 11.1 shows the evolution of the cash component of the CHT. It shows that, using the current calculation formula, it is expected to grow from $28.4 billion in 2012 to $72.2 billion in 2037, a real annual increase of 4.0 percent. Then, Figure 11.2 shows how projected total health care expenditures of provinces/ territories, on a constant 2012 dollar basis, are expected to compare to real GDP for selected projection years and for each province/territory. On average for Canada, they are expected to increase significantly, from 8.2 percent of GDP in 2012 to 12.7 percent in 2037. There will be provincial/territorial differences, with the Atlantic provinces having to devote a larger share of their economy to health care, mostly as a result of a demographic slowdown that is projected to affect the level of economic production and which also puts more pressure on the health care system as the population ages.
Implications on Public Accounts The impact of increasing health care expenditures will create issues for provinces/territories in balancing their budgets. Assessing these impacts requires an estimation for future available revenues, for future program expenditures—other than health care—as well as for the debt charges. These will all be affected by fiscal and social policies, and their projection is beyond the scope of this research. Instead, this report compares future health care expenditures to expected future revenues available to provinces/territories, broken down in two categories:
• Own-source revenues—These mainly consist of personal and corporate income taxes, sales taxes, plus all tariffs and pa yroll taxes. It is assumed, for the purpose of this report, that own-source revenues increase at the same rate as GDP. An implicit assumption is that all tax rates will remain unchanged for the next 25 years and/or public policies will be adopted to keep the growth of own-source revenues in line with that of the economy (either through cutbacks in social programs or tax rate increases if the growth of own-source revenues falls short of GDP growth, and vice versa).
Figure 11.2: Total Health Care Expenditures of Provinces/Territories, Selected Years (as a % of GDP)
0.0%
5.0%
10.0%
15.0%
20.0%
25.0%
2012e 2037f
Figure 11.1: Distribution of Total Health Care Expenditures of Provinces/Territories, 2007 to 2037, Base Scenario (millions of constant 2012 dollars)
0
50,000
100,000
150,000
200,000
250,000
300,000
350,000
Hospitals Physicians
Other institutions Other professionals
Drugs Other health spending
CHT cash transfers - current formula

© 2013 Society of Actuaries and Canadian Institute of Actuaries, All Rights Reserved Stephane Levert Consulting Services Inc. Page 53
• Federal cash transfers—These consist of the CHT, the Canada Social Transfer, the Equalization Program plus any other cash transfer from the federal government to provinces/territories. The CHT is projected according to the method described in the next section of this chapter. All other federal cash transfers are projected to grow at a rate equal to that of the GDP.72
Figure 11.3 shows how total revenues available to provinces/territories are expected to compare to total health care expenditures of the provinces/territories, based on the current calculation formula of the CHT cash transfer. It shows that, while real health care expenditures are expected to grow at an annual rate of 3.5 percent—on top of inflation—total available revenues, on a constant 2012 dollar basis, are expected to increase at an annual rate of 1.9 percent (1.5 percent growth in own-source revenues and 2.1 percent growth in federal cash transfers).
Figure 11.4 demonstrates that health care expenditures will consume a material portion of provincial/territorial own-source revenues, increasing their dependence on federal transfers. It is interesting to note, as shown in Figure 11.5, that the share of total available revenues (including own-source revenues and federal cash transfers) needed to fund health care expenditures will be higher in 2037 in provinces such as Ontario and Alberta than in a province such as Newfoundland & Labrador.
72 In fact, some federal cash transfers will not grow in the same manner as the economy, at least for some provinces or territories. For example, it is reasonable to assume that Equalization payments will increase in favor of provinces and territories whose economies grow at a s lower pace than the national average. Still, this report uses the assumption that all federal cash transfers—except the CHT—grow at a rate equal to that of the GDP. This makes the projections easier to make and interpret. Also, the reader is reminded that the focus of this research is on the CHT, with discussions about other federal cash transfers being out of scope.
Figure 11.3: Total Health Care Expenditures of Provinces/Territories Compared to Total Available Revenues, 2007 to 2037, Base Scenario (millions of constant 2012 dollars)
0 50,000
100,000 150,000 200,000 250,000 300,000 350,000 400,000 450,000 500,000
Own-source revenues Federal cash transfers Healthcare expenditures
Figure 11.5: Total Health Care Expenditures of Provinces/Territories, Selected Years, Base Scenario (as a % of Total Available Revenues) with Current CHT Formula
0.0% 10.0% 20.0% 30.0% 40.0% 50.0% 60.0% 70.0% 80.0%
2012e 2037f
Figure 11.4: Total Health Care Expenditures of Provinces/Territories, Selected Years, Base Scenario (as a % of Total Own-Source Revenues)
0.0% 20.0% 40.0% 60.0% 80.0%
100.0% 120.0% 140.0%
2012e 2037f

© 2013 Society of Actuaries and Canadian Institute of Actuaries, All Rights Reserved Stephane Levert Consulting Services Inc. Page 54
Figure 11.6 shows that total health care expenditures would be expected to use about 65 percent of the revenues available to provinces/ territories in 2037 (assuming continuation of the current CHT formula). That’s up f rom 44 percent in 2012. They will, however, consume close to the totality (86 percent) of their own-source revenues. This means that the resources available to provinces/territories to fund other program expenditures and to pay debt charges will be significantly reduced. A corollary is that other public and social programs will have to be downsized and/or taxes and tariffs will have to be increased. There are several financial and societal implications to this. In terms of the capacity of the
Canadian economy to sustain the cost of health care services paid for by provinces/territories, it must be noted that it will be using close to 13 percent of economic resources in 2037, up from less than 8 percent in 2012.
Canada Health Transfer The federal government supports provinces/territories with the funding of health care expenditures using the CHT. Currently, it includes tax points and cash transfers.
• CHT tax points are the result of the federal government significantly decreasing its income tax rates in the late 1970s, allowing provinces/territories to use that tax space. The tax points that are appropriated to the CHT are impacted by the evolution of the tax base (personal and corporate income) and are expected to grow in line with the economy.
• Total CHT cash transfers were initially set at fixed amounts for fiscal years 2004-2005 and 2005-2006 73
73 In this research, CHT cash transfers are converted from a fiscal-year basis to a calendar-year basis using rules that are consistent with those adopted by CIHI for their NHEX Database.
in accordance with the prescription of the Federal-Provincial Fiscal Arrangements Act. They are then increasing at a nominal annual rate of 6 percent until fiscal year 2013-2014. Total CHT cash transfers are allocated to each province/territory in a way that results in each province/territory receiving a t otal CHT entitlement (tax point plus cash transfer) proportionate to its population (in other words, each province/territory is entitled to equal-
Figure 11.6: Total Health Care Expenditures of Provinces/Territories vs. Real GDP, Own-Source Revenues and Total Available Revenues, 2007 to 2037, Base Scenario with Current CHT Formula
8.2% 12.7%
55.1%
85.9%
44.3%
65.4%
0.0% 10.0% 20.0% 30.0% 40.0% 50.0% 60.0% 70.0% 80.0% 90.0%
100.0%
% of Real GDP % of Own-source revenues % of Total available revenues
Figure 11.7: Share of Total Health Care Expenditures of Provinces/Territories Funded by the CHT, Selected Years, by Province and Territory, Base Scenario, Current Calculation Formula
0.0%
5.0%
10.0%
15.0%
20.0%
25.0%
30.0%
2012e 2037f

© 2013 Society of Actuaries and Canadian Institute of Actuaries, All Rights Reserved Stephane Levert Consulting Services Inc. Page 55
per-capita total CHT, which usually translates in different CHT cash transfers by province/territory).74
Using the current CHT calculation formula, the federal cash transfers associated with the CHT will be funding 22.9 percent, on average, of total health care expenditures of provinces/territories in 2037, at a slightly higher level than in 2012 (21.0 percent). Figure 11.7 shows the variation by province/territory. Now, two significant changes are proposed on Dec. 19, 2011 to the CHT formula, effective April 1, 2014:
• Firstly, CHT cash transfers will be allocated differently by province/territory. They are currently allocated on the basis of equal-per-capita total CHT entitlement (including tax points and cash transfers). Starting with fiscal year 2014-2015, they will be allocated on the basis of equal-per-capita CHT cash transfers. The federal government has committed to this measure in its Budget 2007. It is expected to benefit the most to Alberta and to be the most detrimental to Newfoundland & Labrador.
• Secondly, starting with fiscal year 2017-2018, the aggregate CHT cash transfer envelope will be increasing at an annual rate equal to a three-year moving average of the GDP growth. There is a f urther guarantee that total cash transfers will increase by at least 3 percent every year.
As discussed earlier, using the current calculation formula, 75
74 In reality, another cash transfer, referred to as “associated equalization,” is made to arrive at such result. For the purpose of this research, any reference to the CHT cash transfer is assumed to include the “associated equalization” payment. In addition, it is also including the often-called Health Reform Transfer, which was introduced in fiscal year 2004-2005 to support provinces with the funding of initiatives in relation to primary care, home care and catastrophic drug coverage, and which amounted to 24 percent of the total CHT cash transfers in fiscal year 2008- 2009.
the CHT cash transfer would be expected to grow from $28.4 billion in 2012 to $72.2 billion in 2037, a real increase of 4.0 percent. With the proposed change, it would grow to $45.0 billion, a real increase of 2.1 percent. Table 11.2 shows the monetary impact of the proposed changes in the CHT calculation formula for each province/territory. The provinces of Prince Edward Island, Nova Scotia, Quebec and British Columbia will suffer a r eduction of more than 6 percent in their total available revenues. The impact for New Brunswick, Ontario and Manitoba will be slightly less pronounced—however still substantial—and even less severe
75 For sake of simplicity, the “current CHT calculation formula” refers to the formula that prevails for fiscal year 2011-2012. This report assumes that it would continue to apply for the next 25 years. However, it is important to realize that there has been no formal commitment from the federal government to continue its application past fiscal year 2016-2017.
Table 11.2: Reduction in CHT Cash Transfers Resulting from the Proposed Changes to the Calculation Formula, 2013 to 2037, Base Scenario
millions of constant
2012 dollars
% of Total available revenues
Newfoundland & Labrador 341 3.0% Prince Edward Island 135 6.1% Nova Scotia 759 6.2% New Brunswick 611 5.6% Quebec 6,721 6.7% Ontario 10,537 5.9% Manitoba 1,120 5.3% Saskatchewan 711 4.0% Alberta 1,821 3.1% British Columbia 4,315 6.9% Yukon 41 2.7% Northwest Territories 53 2.5% Nunavut 42 1.8% Canada 27,208 5.6%
Figure 11.8: Share of Total Health Care Expenditures of Provinces/Territories Funded by the CHT, Selected Years, by Province and Territory, Base Scenario, New Proposed Calculation Formula
0.0%
5.0%
10.0%
15.0%
20.0%
25.0%
30.0%
2012e 2037f

© 2013 Society of Actuaries and Canadian Institute of Actuaries, All Rights Reserved Stephane Levert Consulting Services Inc. Page 56
for Newfoundland & Labrador, Saskatchewan, Alberta and the three territories. The province that will end up in the best position is Alberta, who can expect virtually no change to the cumulative CHT cash transfers it will be receiving over the entire 25-year projection period as it will see its CHT cash transfer increase substantially in 2016. Using the proposed calculation formula, federal cash transfers associated with the CHT will be funding 14.3 percent, on average (22.9 percent using the current calculation formula), of total health care expenditures of provinces/territories in 2037, down from 21.1 percent in 2012. Figure 11.8 shows the variation by province/ territory. It is obvious that the proposed CHT calculation formula will have a significant effect on the ability of provinces/territories to continue supporting the health care system. In fact, and as shown in Figure 11.9, they will have to find new sources of funding corresponding to 8.6 percent of total health care expenditures by 2037 (equal to the difference between 22.9 percent of total health care expenditures of provinces/territories that would be supported by the CHT under the current calculation formula in 2037, and 14.3 percent under the proposed calculation formula). Similarly, Figure 11.11 shows that total health care expenditures of provinces/territories will be equal to 69.3 percent of their total available revenues under the proposed CHT calculation formula. That’s up from 65.4 percent under the current calculation formula, meaning that the extra funding gap due to the change in the CHT formula will be equal to 3.9 percent of their total available revenues.
Figure 11.9: Comparison of Share of Total Health Care Expenditures of Provinces/Territories Funded by the CHT under the Current and the Proposed Calculation Formulas, 2007 to 2037, Base Scenario
21.0% 22.9%
21.1%
14.3%
0.0%
5.0%
10.0%
15.0%
20.0%
25.0%
Curent CHT Calculation Formula
Proposed CHT Calculation Formula
Figure 11.10: Total Health Care Expenditures of Provinces/Territories, Selected Years, Base Scenario (as a % of total available revenues) with Proposed CHT Formula
0.0% 10.0% 20.0% 30.0% 40.0% 50.0% 60.0% 70.0% 80.0% 90.0%
2012e 2037f
Figure 11.11: Total Health Care Expenditures of Provinces/Territories vs. Real GDP, Own-Source Revenues and Total Available Revenues, 2007 to 2037, Base Scenario with Proposed CHT Formula
8.2% 12.7%
55.1%
85.9%
44.3%
69.3%
0.0% 10.0% 20.0% 30.0% 40.0% 50.0% 60.0% 70.0% 80.0% 90.0%
100.0%
% of Real GDP % of Own-source revenues % of Total available revenues

© 2013 Society of Actuaries and Canadian Institute of Actuaries, All Rights Reserved Stephane Levert Consulting Services Inc. Page 57
Canada Health Act Perspective In order to make this research as objective as possible, in order to properly reflect the financial responsibilities that the federal government is already assuming, and in order to counter critics that the conclusions of this report present provinces/territories as “victims” of the proposed changes to the CHT, the issue needs to be considered from a different point of view: that of the Canada Health Act of 1984. This alternative perspective essentially draws from the findings so far in this report, with two slight modifications:
• In recognition of the fact that the federal commitment to support provinces/territories was initially limited to hospital and physician services, any expenditures associated to “other institutions,” “other professionals,” drugs and “other health spending” is removed. The federal government could argue that such expenditures are the result of social programs introduced by provinces/territories—and which fall under their respective jurisdictions—that it is not to be held accountable for.
• Direct expenditures by the federal government related to hospital and physician services are added to its financial contribution to the Canadian health care system.
It can then be shown that projected hospital and physician expenditures of the federal government and of provinces/territories are expected to grow from $83.4 billion in 2012 to 208.7 billion of constant 2012 dollars in 2037—an annualized real increase of 4.0 percent, on top of inflation. In addition, this research demonstrates that, using the current CHT calculation formula, the total contribution of the federal government to health care would be expected to grow from $29.0 billion in 2012 to 73.6 billion of constant 2012 dollars in 2037—a real increase of 4.0 percent. With the proposed changes to the CHT calculation formula, the growth by 2037 would be expected to be limited to 46.4 billion of constant 2012 dollars—a real increase of 2.1 percent—significantly reducing its share of expenditures. Using the current CHT calculation formula, the contribution of the federal government to the Canadian health care system will equal 35.2 percent, on average, of total hospital and physician expenditures of the federal government and of provinces/territories in 2037, up from 34.8 percent in 2012. By contrast, using the proposed CHT calculation formula, the contribution of the federal government to the Canadian health care system would equal 22.2 percent, on av erage, of total hospital and physician expenditures of the federal government and of provinces/territories in 2037, down from 34.8 percent in 2012.
Figure 11.12: Comparison of Share of Total Health Care Expenditures of Provinces/Territories Funded by the CHT under the Current and the Proposed Calculation Formula, Canada Health Act Perspective, 2007 to 2037, Base Scenario
34.8% 35.2%
22.2%
20.0%
22.0%
24.0%
26.0%
28.0%
30.0%
32.0%
34.0%
36.0%
38.0%
2007
20
09
2011
20
13f
2015
f 20
17f
2019
f 20
21f
2023
f 20
25f
2027
f 20
29f
2031
f 20
33f
2035
f 20
37f
Current CHT calculation formula
Proposed CHT calculation formula

© 2013 Society of Actuaries and Canadian Institute of Actuaries, All Rights Reserved Stephane Levert Consulting Services Inc. Page 58
Again, even when adopting the narrower Canada Health Act perspective, this research demonstrates that the proposed CHT calculation formula would have a s ignificant impact on the ability of provinces/territories to support the Canadian health care system. As shown in Figure 11.12, by 2037, they will have to find new sources of funding corresponding to 13.0 percent of total hospital and physician expenditures.

© 2013 Society of Actuaries and Canadian Institute of Actuaries, All Rights Reserved Stephane Levert Consulting Services Inc.
Page 59
Chapter 12—Impact on Private and Other Public Sectors The previous chapter presented the effect of projected health care expenditures on the financial position of provinces/territories, addressing the prime objective of this report. This chapter now recognizes that other parties will be impacted as well by the projections presented in this report.
Introduction Table 12.1 shows the distribution of health care expenditures by type of service for each payer76
in 2012. These numbers were mostly discussed in Chapter 3 and in Chapters 5 to 10.
Table 12.1: Total Health Care Expenditures, 2012, by Use of Funds and by Payer (millions of dollars)
Type of Health Care Services
Provincial/ Territorial
Governments
Federal Government
Municipal Governments
Social Security Funds
Total Public Sector
Private Sector and
Out-of-Pocket
Payments
Total
Physicians 29,153 225 0 316 29,556 400 29,957 Hospitals 53,925 326 36 371 54,658 5,865 60,523 Other Institutions 15,914 124 0 13 16,051 6,397 22,448 Other Professionals 1,103 346 1 344 1,793 20,482 22,276 Drugs 10,677 597 0 1,056 12,330 20,696 33,025 Other Health Spending 24,318 4,495 843 592 30,249 8,939 39,188 Total 134,952 6,114 880 2,693 144,637 62,779 207,417
76 Please refer to Chapter 3 for the definition of each payer.

© 2013 Society of Actuaries and Canadian Institute of Actuaries, All Rights Reserved Stephane Levert Consulting Services Inc. Page 60
Federal Government Table 12.2 shows the projected direct health care expenditures, by type of service, of the federal government, from 2012 to 2037. In aggregate, they will grow at a real annual rate of 1.9 percent, as opposed to 3.5 percent for provinces/territories. This is explained by their larger relative exposure to “other health spending” as opposed to physician and hospital expenditures. In absence of policies to control health care costs, total direct health care expenditures of the federal government would be growing at an annualized real rate of 5.4 percent.
Table 12.1: Projected Direct Health Care Expenditures of the Federal Government, 2012 to 2037, by Use of Funds, Base Scenario (millions of constant 2012 dollars)
Years Physicians Hospitals Other Institutions
Other Professionals Drugs
Other Health
Spending Total as a %
of GDP
2012 225 326 124 346 597 4,495 6,114 0.4% 2013 235 340 129 357 627 4,537 6,225 0.4% 2014 245 355 133 369 659 4,579 6,340 0.4% 2015 255 370 138 381 691 4,622 6,458 0.4% 2016 266 387 142 394 725 4,665 6,579 0.4% 2017 277 404 147 406 761 4,707 6,703 0.4% 2018 289 421 152 419 798 4,750 6,830 0.4% 2019 301 439 157 433 837 4,792 6,959 0.4% 2020 312 458 162 446 879 4,835 7,092 0.4% 2021 324 477 168 460 921 4,878 7,229 0.4% 2022 337 497 174 474 966 4,922 7,370 0.4% 2023 349 518 181 488 1,013 4,966 7,515 0.4% 2024 362 539 187 503 1,061 5,011 7,662 0.4% 2025 374 561 195 518 1,112 5,056 7,815 0.4% 2026 387 583 203 533 1,164 5,101 7,971 0.4% 2027 399 606 212 548 1,218 5,147 8,130 0.4% 2028 412 630 221 564 1,274 5,194 8,295 0.4% 2029 424 654 231 579 1,332 5,241 8,462 0.4% 2030 437 678 241 595 1,392 5,289 8,632 0.4% 2031 449 703 252 610 1,451 5,339 8,804 0.4% 2032 462 728 264 626 1,510 5,390 8,980 0.4% 2033 473 754 276 641 1,571 5,441 9,157 0.4% 2034 485 779 288 657 1,634 5,494 9,337 0.4% 2035 497 805 300 673 1,699 5,547 9,520 0.4% 2036 508 830 312 688 1,765 5,600 9,704 0.4% 2037 520 856 325 704 1,835 5,644 9,883 0.4%
Growth Rate 3.4% 3.9% 3.9% 2.9% 4.6% 0.9% 1.9%

© 2013 Society of Actuaries and Canadian Institute of Actuaries, All Rights Reserved Stephane Levert Consulting Services Inc. Page 61
Municipal Governments Table 12.3 shows the projected health care expenditures of municipal governments, by type of service, from 2012 to 2037. They will grow at an aggregate real annual rate of 1.0 percent. This is explained by the fact that they are not assuming any expenditure for drugs and physician services, and their expenditures for hospital services are limited.
Table 12.3: Projected Health Care Expenditures of Municipal Governments, 2012 to 2037, by Use of Funds, Base Scenario (millions of constant 2012 dollars)
Years Physicians Hospitals Other Institutions
Other Professionals Drugs
Other Health
Spending Total as a % of
GDP
2012 0 36 0 1 0 843 880 0.1% 2013 0 37 0 1 0 851 889 0.1% 2014 0 39 0 1 0 859 898 0.1% 2015 0 40 0 1 0 866 907 0.1% 2016 0 41 0 1 0 874 916 0.1% 2017 0 42 0 1 0 882 926 0.1% 2018 0 43 0 1 0 890 935 0.1% 2019 0 45 0 1 0 898 944 0.0% 2020 0 46 0 1 0 906 953 0.0% 2021 0 47 0 1 0 915 962 0.0% 2022 0 48 0 1 0 923 971 0.0% 2023 0 48 0 1 0 931 981 0.0% 2024 0 49 0 1 0 939 990 0.0% 2025 0 50 0 1 0 948 999 0.0% 2026 0 51 0 1 0 956 1,008 0.0% 2027 0 52 0 1 0 965 1,018 0.0% 2028 0 52 0 1 0 974 1,027 0.0% 2029 0 53 0 1 0 983 1,037 0.0% 2030 0 54 0 1 0 992 1,047 0.0% 2031 0 55 0 1 0 1,001 1,057 0.0% 2032 0 56 0 1 0 1,010 1,068 0.0% 2033 0 57 0 1 0 1,020 1,079 0.0% 2034 0 58 0 2 0 1,030 1,090 0.0% 2035 0 60 0 2 0 1,040 1,101 0.0% 2036 0 61 0 2 0 1,050 1,112 0.0% 2037 0 62 0 2 0 1,058 1,122 0.0%
Growth Rate - 2.2% - 2.9% - 0.9% 1.0%

© 2013 Society of Actuaries and Canadian Institute of Actuaries, All Rights Reserved Stephane Levert Consulting Services Inc. Page 62
Social Security Funds Table 12.4 shows the projected health care expenditures of social security funds, by type of service, from 2012 to 2037. They will grow at a real annual rate of 3.1 percent, somewhat comparable to provinces/territories, however profiting from the fact that their clientele is mostly the working population, which is expected to be in better health and which is definitely younger. In absence of policies to control health care costs, total health care expenditures of social security funds would be growing at an annualized real rate of 4.8 percent.
Table 12.4: Projected Health Care Expenditures of Social Security Funds, 2012 to 2037, by Use of Funds, Base Scenario (millions of constant 2012 dollars)
Years Physicians Hospitals Other Institutions
Other Professionals Drugs
Other Health
Spending Total as a % of
GDP
2012 316 371 13 344 1,056 592 2,693 0.2% 2013 328 383 14 352 1,109 598 2,783 0.2% 2014 339 395 14 361 1,164 603 2,877 0.2% 2015 351 408 15 369 1,222 609 2,975 0.2% 2016 363 421 15 378 1,283 615 3,074 0.2% 2017 375 434 16 386 1,345 620 3,175 0.2% 2018 386 446 16 394 1,411 626 3,279 0.2% 2019 397 457 17 401 1,481 631 3,383 0.2% 2020 407 468 17 408 1,554 637 3,491 0.2% 2021 418 478 18 414 1,629 643 3,600 0.2% 2022 427 488 18 421 1,709 649 3,712 0.2% 2023 437 497 19 427 1,791 654 3,825 0.2% 2024 446 506 20 434 1,876 660 3,942 0.2% 2025 455 515 21 440 1,966 666 4,063 0.2% 2026 463 523 22 446 2,059 672 4,184 0.2% 2027 471 530 22 452 2,154 678 4,308 0.2% 2028 478 537 23 458 2,253 684 4,435 0.2% 2029 486 545 25 465 2,356 691 4,566 0.2% 2030 494 553 26 472 2,461 697 4,702 0.2% 2031 503 564 27 479 2,566 704 4,842 0.2% 2032 513 575 28 487 2,671 710 4,985 0.2% 2033 523 587 29 496 2,778 717 5,130 0.2% 2034 533 600 31 504 2,889 724 5,280 0.2% 2035 543 612 32 512 3,004 731 5,434 0.2% 2036 553 624 33 520 3,121 738 5,590 0.2% 2037 563 637 34 529 3,245 744 5,751 0.2%
Growth Rate 2.3% 2.2% 3.9% 1.7% 4.6% 0.9% 3.1%

© 2013 Society of Actuaries and Canadian Institute of Actuaries, All Rights Reserved Stephane Levert Consulting Services Inc. Page 63
Private Sector (including out-of-pocket payments) Table 12.5 shows the projected health care expenditures of the private sector (including out-of-pocket payments by Canadians), by type of service, from 2012 to 2037. The expenditures will grow at a real rate of 2.3 percent, profiting from the private sector’s little relative exposure to physician and hospital services, which allows it to absorb cost increases associated with drugs. In absence of policies to control health care costs, total health care expenditures of the private sector (including out-of-pocket payments by Canadians) would be growing at an annualized real rate of 3.7 percent.
Table 12.5: Projected Health Care Expenditures of the Private Sector (including out-of-pocket payments), 2012 to 2037, by Use of Funds, Base Scenario (millions of constant 2012 dollars)
Years Physicians Hospitals Other Institutions
Other Professionals Drugs
Other Health
Spending Total as a % of
GDP
2012 400 5,865 6,397 20,482 20,696 8,939 62,779 3.7% 2013 414 6,061 6,494 21,001 21,478 9,026 64,475 3.8% 2014 426 6,270 6,589 21,525 22,278 9,114 66,204 3.8% 2015 443 6,484 6,682 22,049 23,096 9,201 67,954 3.8% 2016 457 6,698 6,771 22,567 23,923 9,288 69,704 3.9% 2017 472 6,911 6,853 23,073 24,754 9,373 71,437 3.9% 2018 485 7,116 6,927 23,551 25,581 9,457 73,118 3.9% 2019 498 7,310 6,992 24,001 26,405 9,540 74,746 4.0% 2020 511 7,497 7,052 24,436 27,238 9,621 76,355 4.0% 2021 523 7,679 7,109 24,862 28,092 9,703 77,967 4.0% 2022 534 7,845 7,162 25,272 28,956 9,784 79,554 4.0% 2023 545 8,009 7,213 25,675 29,844 9,865 81,151 4.1% 2024 556 8,169 7,265 26,081 30,765 9,946 82,782 4.1% 2025 566 8,318 7,313 26,472 31,704 10,027 84,399 4.1% 2026 576 8,452 7,361 26,858 32,674 10,107 86,028 4.2% 2027 585 8,577 7,413 27,253 33,694 10,189 87,711 4.2% 2028 594 8,689 7,463 27,637 34,741 10,270 89,395 4.2% 2029 603 8,806 7,515 28,030 35,842 10,351 91,148 4.2% 2030 614 8,943 7,576 28,458 37,025 10,435 93,051 4.3% 2031 625 9,112 7,651 28,931 38,319 10,522 95,160 4.3% 2032 637 9,300 7,736 29,435 39.708 10,611 97,427 4.3% 2033 650 9,494 7,823 29,949 41,168 10,701 99,784 4.3% 2034 662 9,691 7,912 30,464 42,691 10,791 102,212 4.4% 2035 675 9,892 8,001 30,974 44,271 10,882 104,693 4.4% 2036 687 10,095 8,089 31,482 45,912 10,972 107,238 4.4% 2037 699 10,298 8,178 31,990 47,621 11,065 109,851 4.4%
Growth Rate 2.3% 2.3% 1.0% 1.8% 3.4% 0.9% 2.3%
Consideration was given to the possibility of limiting, to some extent, projected hospital expenditures paid by the private sector and by Canadians (through out-of-pocket payments). In fact, they mainly consist of costs charged by hospitals for board and room in semi-private or private rooms, which are in some instances covered by group benefit plans. An argument can be made that increases of these charges could be limited to general inflation, not being as much impacted by the cost of therapies, except in respect of the length of stay. However, a counter-argument can be made that it is not unreasonable to assume that hospitals will make these charges increase at a faster pace than general inflation. Moreover, by adopting a broader view of hospital expenditures, irrespective of the payer, it must be realized that the expense of one s ector is the revenue of another. This means that capping the increase in hospital expenditures supported by the private sector and by out-of-pocket payments would require increasing the hospital expenditures that the provinces/territories are responsible for. Therefore, for sake of simplicity, this report assumes that the costs charged by hospitals to users for board and room will follow the actual increase in the costs of operating the hospitals.

© 2013 Society of Actuaries and Canadian Institute of Actuaries, All Rights Reserved Stephane Levert Consulting Services Inc.
Page 64
Chapter 13—Conclusion Canada ranks as the fifth most expensive country of the OECD in terms of per capita health care expenditures, dedicating resources equal to 11.4 percent of GDP to health care. About 44 percent of such expenditures are directed to hospitals and physicians, and provinces/territories are funding 65 percent of total health care expenditures. When adopting a strict view on total health care expenditures (perspective of the Canada Health Act of 1984, which limits insured health services to physician and hospital services), almost the totality (92 percent) of health care expenditures are actually paid by provinces/territories using, among other sources of funds, the Canada Health Transfer (CHT). Provinces/territories are currently devoting 44 percent of their total available revenues to health care, ranging from about 20 percent in the territories to 46 percent in Ontario and Nova Scotia and 47 percent in Alberta. Table 13.1 summarizes current provincial/territorial health care expenditures.
Table 13.1: Summary of Current Health Care Expenditures by Provinces/Territories, 2012
Province/Territory
(millions of dollars) as a % of
Physicians Hospitals Other Institu-tions
Other Profes-sionals
Drugs Other Health
Spending Total GDP
Own-Source
Revenues
Total Available Revenues
Newfoundland & Labrador 452 1,267 379 12 157 377 2,643 11.5% 39% 35% Prince Edward Island 103 263 79 3 36 137 622 12.0% 68% 44% Nova Scotia 741 1,616 640 13 320 588 3,918 11.0% 69% 46% New Brunswick 590 1,444 406 7 196 452 3,095 10.7% 62% 41% Quebec 5,644 10,997 4,138 203 2,521 4,746 28,250 8.4% 55% 41% Ontario 12,090 18,314 6,013 404 4,560 9,031 50,413 7.5% 56% 46% Manitoba 1,030 2,307 763 29 309 1,021 5,458 10.1% 56% 42% Saskatchewan 908 1,869 711 26 319 960 4,792 9.6% 49% 44% Alberta 3,519 8,344 1,565 235 1,274 2,810 17,747 6.7% 52% 47% British Columbia 3,807 7,137 1,124 163 970 3,943 17,143 8.2% 49% 42% Yukon 30 71 30 2 7 66 206 9.2% 68% 19% Northwest Territories 51 150 27 2 6 64 300 7.8% 96% 21% Nunavut 50 146 39 4 3 124 365 23.8% 278% 26% Total 29,015 53,925 15,914 1,103 10,677 24,318 134,952 8.1% 54% 44%
In this report, future health care expenditures are projected from 2012 t o 2037 using a demographic model developed by Statistics Canada. Under the base scenario, the Canadian population is expected to grow at an annual rate of 0.9 percent. Then, an economic model is built to project GDP growth using the demographic model, resulting in expected real GDP growth of 1.6 percent per year when assuming productivity gains of 1.3 percent. Projections are first made assuming that observed historical trends in real price increases from 1996 to 2010 will continue in the future. Total health care expenditures of provinces/territories would then grow at an annual real rate of 5.1 percent—on top of inflation—over the next 25 years, to be equal to 19.2 percent of GDP and using all of the financial resources available to provinces/territories. Clearly, such scenario is not viable. Instead of simply relying on historical trends, this report makes an explicit assumption that public policies will be implemented to limit future health care price increases. Under our base scenario, provincial/territorial health care expenditures would be growing at an annual real rate of 3.5 percent—on top of inflation—and would be more than 30 percent lower in 2037 than if no action had taken place. This is shown on Table 13.2.
Looking at the types of expenditures, health care expenditures of provinces/territories are expected to grow as shown in Figure 13.1.

© 2013 Society of Actuaries and Canadian Institute of Actuaries, All Rights Reserved Stephane Levert Consulting Services Inc. Page 65
Table 13.2: Summary of Projected Health Care Expenditures by Provinces/Territories, 2012 to 2037 (millions of constant 2012 dollars)
Current
Projected Using
Historical Trend
Projected Under Base
Scenario
2012 2037 2037 Physician Expenditures 29,015 88,404 67,076 Hospital Expenditures 53,925 139,774 141,631 Other Institutions Expenditures 15,914 97,546 41,603 Other Professionals Expenditures 1,103 1,131 2,241 Drug Expenditures 10,677 44,904 32,818 Other Health Spending 24,318 94,957 48,322 Total Health Care Expenditures 134,952 466,716 315,182 as a % of GDP 8.2% 18.9% 12.7% as a % of Own-Source Revenues 54% 127% 86% as a % of Total Available Revenues
… Using Current CHT Formula 44% 97% 65%
… Using New CHT Formula - 103% 69% Real Rate of Growth - 5.1% 3.5%
Also, as a consequence of population aging, this report suggests that the supply of physicians will need to increase by at least 46 percent over the next 25 years just to keep up with demand for health care services. Sensitivity tests have identified the assumptions that provinces/territories are the most sensitive to. Table 13.3 presents a summary. It shows that the health care projection assumptions that provinces/territories are the most sensitive to are demographic growth, physician costs, hospital compensation, hospital innovation and economic productivity.
Table 13.3: Summary of Some Health Care Projection Sensitivity Tests
Assumptions Tested Optimistic/ Pessimistic
Provincial/Territorial Health Care Spending in 2037 millions of $ Rate of growth % of GDP
Base Scenario - 315,182 3.5% 12.7%
Demographics Scenario Low-growth 296,090 3.2% 12.0% High-growth 334,847 3.7% 13.5%
Physician Costs -1.0% 300,521 3.3% 12.1% +1.0% 333,737 3.7% 13.5%
Hospital Compensation -1.0% 297,316 3.2% 12.0% +1.0% 343,194 3.8% 13.9%
Hospital Innovation -1.0% 289,893 3.1% 11.7% +1.0% 354,831 3.9% 14.3%
Economic Productivity -1.0% 314,731 3.4% 16.6% +1.0% 315,753 3.5% 9.8%
While health care expenditures are expected to grow at an annual rate of 3.5 percent on a constant dollar basis, over the next 25 years, total revenues available to provinces/territories will grow at an annual rate of 1.9 percent assuming that the current CHT formula remains unchanged. Health care expenditures are then expected to consume about 65 percent of revenues available to provinces/territories in 2037, representing 86 percent of their own-source revenues. This means that the resources available to provinces/territories to fund other program expenditures and to pay debt charges will be significantly reduced. Looking at the extremes, Alberta will be dedicating more than 76 percent of its total available revenues to health care in 2037. With the current calculation formula, federal cash transfers associated with the CHT will be funding 22.9 percent of total health care expenditures of provinces/territories in 2037, slightly up from 21.0 percent in 2012, with CHT cash transfers expected to grow at a real annual rate of 4.0 percent for the next 25 years. With the proposed changes to the calculation formula, they will grow at a real annual rate of 2.1 percent and will be funding only a much lower 14.3 percent of health care expenditures by 2037. New sources of funds equal to 8.6 percent of total health care expenditures will need to be found by provinces/territories
Figure 13.1: Expected Growth Rates of Health Care Expenditures of Provinces/Territories, 2012 to 2037, by Use of Funds, Base Scenario
3.4% 3.9% 3.9%
2.9%
4.6%
0.8%
3.5%
0.0% 0.5% 1.0% 1.5% 2.0% 2.5% 3.0% 3.5% 4.0% 4.5% 5.0%

© 2013 Society of Actuaries and Canadian Institute of Actuaries, All Rights Reserved Stephane Levert Consulting Services Inc. Page 66
to support the impacts of the proposed changes to the CHT calculation formula. Prince Edward Island, Nova Scotia, Quebec and British Columbia will be the most penalized by the proposed changes. It is then expected, with the proposed CHT formula, that health care will consume more than 69 percent of total revenues available to provinces/territories in 2037 in all provinces but Newfoundland & Labrador, Manitoba and Saskatchewan. Excluding federal cash transfers, health care expenditures will exceed own-source revenues in Prince Edward Island, Nova Scotia and in the territories. This research shows that projected real GDP will not grow at the same pace as observed historically. This is due to demographic factors, with the working population not growing as fast as in the past. Still, enacting policies to boost economic productivity gains to 2.3 percent, up 1.0 percent from the assumption under the base scenario, could permit similar economic growth in the future. This would actually lead to the total revenues available to provinces/territories to grow at an annual rate of 2.7 percent over the next 25 years and using the current CHT calculation formula (up from 1.9 percent under the base scenario). Health care expenditures would then consume about 53 percent of their revenues in 2037 (up from 44 percent in 2012), representing 67 percent of their own-source revenues (up from 54 percent in 2012). That is better than under the base scenario; however increases in health care expenditures would still be a significant hit for provinces/territories to absorb. Also, assuming such economic growth implies that the CHT cash transfers would grow at an annual rate of 2.9 percent under the proposed calculation formula, with the Canada Health Transfer then funding 17.3 percent (down from 21.0 percent in 2012) of health care expenditures of provinces/territories by 2037. This report focuses mostly on the funding of the Canadian health care system. As a side-note, Drummond recently developed an argument that Canadians should expect better value for each health care dollar spent, suggesting that the issues are not limited to costs and funding of health care, and that quality and effectiveness of care also present challenges. He makes a pr ognosis that the future of the Canadian health care system, unless changed, is troubling. Possible remedies include “greater emphasis on health promotion, system reorganization to make [it] patient-centric and more responsive to growing chronic care needs, and payment methods to hospitals and physicians that incent quality care, efficiency and greater use of information.” 77
Meanwhile, it is very possible that forces will work to effectively control the rising costs of health care. For instance, the C.D. Howe Institute judges that “[…] three factors: i) better price incentives and bottom-up accountability measures leading to more cost-effective treatments and practices; ii) a slower rate of increase in new procedures and drugs; or iii) faster creation and diffusion of cost-reducing technology—could result in a major reduction in the rate of growth of costs, provided that very significant efforts are deployed.”
78
Public policymakers would be well advised to put more emphasis on programs to control risk factors associated with chronic diseases as a way to contain future increases in physician and hospital expenditures.
In conclusion, this report demonstrates that, in absence of some government action, the Canadian health care system may not be sustainable. Such federal and provincial/territorial government initiatives should aim at limiting future increases in health care costs, at improving economic productivity and at finding new or additional sources of funds to support the principles of the Canada Health Act of 1984.
77 Drummond, Don, C.D. Howe Institute. 2011. Therapy or Surgery? A Prescription for Canada’s Health System. 78 Dodge, David A., and Richard Dion. 2011, Chronic Healthcare Spending Disease: A Macro Diagnosis and Prognosis, C.D. Howe Institute Commentary, The Health Papers, No. 327.

© 2013 Society of Actuaries and Canadian Institute of Actuaries, All Rights Reserved Stephane Levert Consulting Services Inc.
Page 67
References
• Bluhm, W.F., et al. 2007. Group Insurance. Actex Publications, 5th Edition.
• Busby, C., and W.B.P. Robson. 2011, A Social Insurance Model for Pharmacare: Ontario’s Options for a More Sustainable Cost-Effective Drug Program. C.D. Howe Institute.
• Canadian Centre for Policy Alternatives (CCPA). 2011. Putting Our Money Where Our Mouth Is: The Future of Dental Care in Canada.
• Canadian Department of Finance.
• Canadian Institute for Health Information (CIHI). 2011a. Drug Expenditures in Canada, 1985 to 2010.
• Canadian Institute for Health Information (CIHI). 2011b. Health Care Cost Drivers: The Facts.
• Canadian Institute for Health Information (CIHI). 2011c. National Health Expenditures Trends, 1975–
2011.
• Canadian Institute for Health Information (CIHI). 2011d. National Physician Database, 2009–2010.
• Canadian Institute for Health Information (CIHI). 2012a. Canadian Hospital Reporting Project 2012.
• Canadian Institute for Health Information (CIHI). 2012b. National Health Expenditures Trends, 1975–2012.
• Dodge, D.A., and R. Dion. 2011. Chronic Healthcare Spending Disease: A Macro Diagnosis and
Prognosis. C.D. Howe Institute.
• Matier, Chris. 2012. Reviewing the Canada Health Transfer: Implications for Federal and Provincial-Territorial Fiscal Sustainability. Ottawa: Office of the Parliamentary Budget Officer.
• Office of the Superintendent of Financial Institutions Canada, Office of the Chief Actuary (OSFI).
2010. 25th Actuarial Report on the Canada Pension Plan as at 31 December 2009.
• Organization for Economic Co-Operation and Development (OECD). 2012. Health Data 2012.
• Régie des Rentes du Québec (QPP). 2010. Actuarial Report on the Quebec Pension Plan as at 31 December 2009.
• Smith, S.D., J.P. Newhouse and M.S. Freeland, 2009. Income, insurance and Technology: Why does
health spending outpace economic growth? Health Affairs 25, no. 2 (September-October).
• Statistics Canada. 2010. Population Projections for Canada, Provinces and Territories, 2009 to 2036.

© 2013 Society of Actuaries and Canadian Institute of Actuaries, All Rights Reserved Stephane Levert Consulting Services Inc. Page 68
• Statistics Canada. 2012. 2011 Census.
• Towers Watson. 2010. Public Health Care Insurance in Canada: A Comparison of Provincial and
Territorial Programs.
• U.S. Census Bureau.
• U.S. Congressional Budget Office. 2008. Technological Change and the Growth of Health Care Spending.
• U.S. Congressional Budget Office. 2009. An Analysis of Health Insurance Premiums Under the Patient Protection And Affordable Care Act.
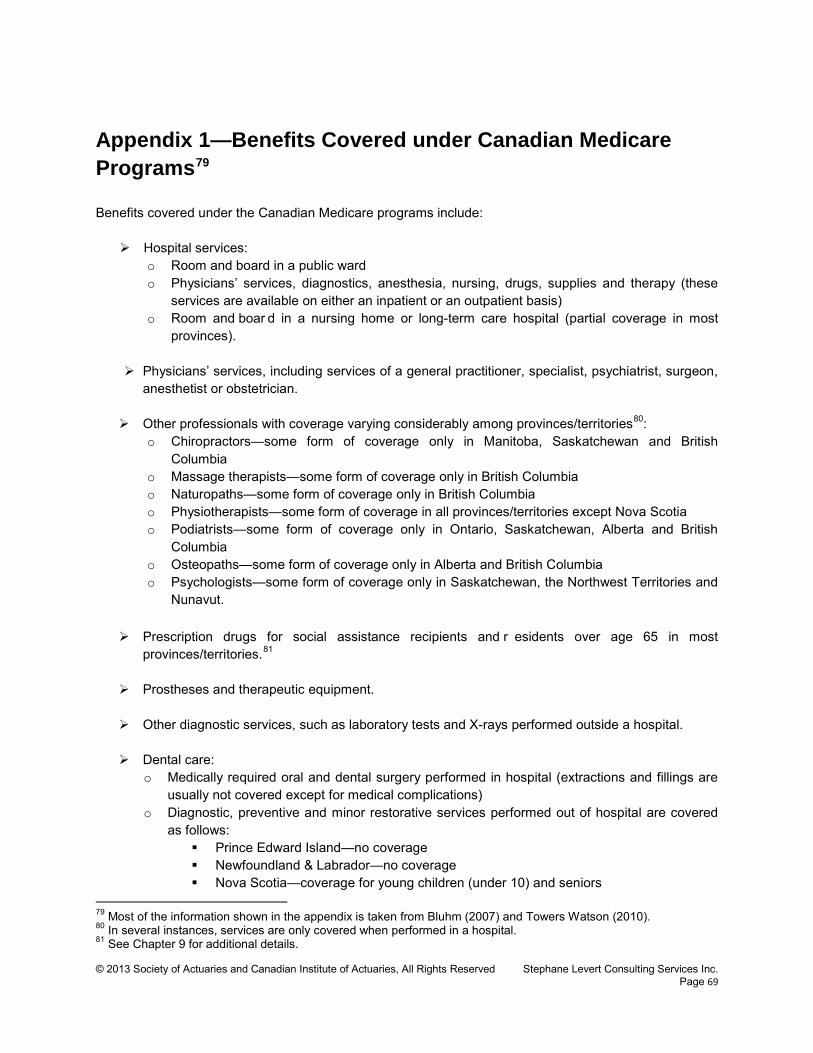
© 2013 Society of Actuaries and Canadian Institute of Actuaries, All Rights Reserved Stephane Levert Consulting Services Inc.
Page 69
Appendix 1—Benefits Covered under Canadian Medicare Programs79
Benefits covered under the Canadian Medicare programs include:
Hospital services: o Room and board in a public ward o Physicians’ services, diagnostics, anesthesia, nursing, drugs, supplies and therapy (these
services are available on either an inpatient or an outpatient basis) o Room and boar d in a nursing home or long-term care hospital (partial coverage in most
provinces).
Physicians’ services, including services of a general practitioner, specialist, psychiatrist, surgeon, anesthetist or obstetrician.
Other professionals with coverage varying considerably among provinces/territories80
o Chiropractors—some form of coverage only in Manitoba, Saskatchewan and British Columbia
:
o Massage therapists—some form of coverage only in British Columbia o Naturopaths—some form of coverage only in British Columbia o Physiotherapists—some form of coverage in all provinces/territories except Nova Scotia o Podiatrists—some form of coverage only in Ontario, Saskatchewan, Alberta and British
Columbia o Osteopaths—some form of coverage only in Alberta and British Columbia o Psychologists—some form of coverage only in Saskatchewan, the Northwest Territories and
Nunavut. Prescription drugs for social assistance recipients and r esidents over age 65 in most
provinces/territories.81
Prostheses and therapeutic equipment. Other diagnostic services, such as laboratory tests and X-rays performed outside a hospital.
Dental care:
o Medically required oral and dental surgery performed in hospital (extractions and fillings are usually not covered except for medical complications)
o Diagnostic, preventive and minor restorative services performed out of hospital are covered as follows:
Prince Edward Island—no coverage Newfoundland & Labrador—no coverage Nova Scotia—coverage for young children (under 10) and seniors
79 Most of the information shown in the appendix is taken from Bluhm (2007) and Towers Watson (2010). 80 In several instances, services are only covered when performed in a hospital. 81 See Chapter 9 for additional details.

© 2013 Society of Actuaries and Canadian Institute of Actuaries, All Rights Reserved Stephane Levert Consulting Services Inc. Page 70
New Brunswick—no coverage Quebec—coverage for children and seniors Ontario—coverage for children and seniors Manitoba—coverage for children and seniors Saskatchewan—coverage for children, seniors and those on welfare Alberta—coverage for children and seniors British Columbia—coverage for children and seniors Yukon—coverage for seniors Northwest Territories—coverage for seniors Nunavut—coverage for seniors.
Out-of-province coverage:
o Hospital and medical expenses incurred in other provinces are usually paid according to the amount payable in the province where the person is treated.
o Hospital expenses incurred out of Canada are reimbursed only in part (on a per diem basis); medical expenses out of Canada are reimbursed up to the amount that would have been paid for the same treatments in the province of residence.

© 2013 Society of Actuaries and Canadian Institute of Actuaries, All Rights Reserved Stephane Levert Consulting Services Inc.
Page 71
Appendix 2—Demographic Projection Model
2011 Population This report paper relies on population data as published by Statistics Canada. It is based on the recently released 2011 census.82
Table A2.1 and Figure A2.1 show how the population was distributed in 2011 by province/territory, and by age and gender.
82 Some adjustments were necessary since the 2011 census report did not provide breakdowns for all age bands at the time of using the data. Such adjustments are based on preliminary postcensal estimates, which are themselves based on the 2006 census.
Table A2.1: Population Geographic Distribution, 2011 (in thousands) Province/Territory Males Females Total Distribution Newfoundland & Labrador 251 264 515 1.5% Prince Edward Island 68 73 140 0.4% Nova Scotia 446 476 922 2.8% New Brunswick 366 385 751 2.2% Quebec 3,876 4,027 7,903 23.6% Ontario 6,263 6,589 12,852 38.4% Manitoba 595 614 1,208 3.6% Saskatchewan 512 522 1,033 3.1% Alberta 1,828 1,817 3,645 10.9% British Columbia 2,157 2,243 4,400 13.1% Yukon 17 17 34 0.1% Northwest Territories 21 20 41 0.1% Nunavut 16 16 32 0.1% Canada 16,414 17,063 33,477 100.0% Source: Statistics Canada, 2011 Census.
Figure A2.1: Population Geographic Distribution, 2011
Newfoundland & Labrador,
2%
Prince Edward
Island, 0% Nova Scotia, 3%
New Brunswick,
2%
Quebec, 24%
Ontario, 38%
Manitoba, 4%
Saskatchewan, 3%
Alberta, 11%
British Columbia,
13%
Yukon, 0% Northwest Territories,
0%
Nunavut, 0%
Source: Statistics Canada, 2011 Census.

© 2013 Society of Actuaries and Canadian Institute of Actuaries, All Rights Reserved Stephane Levert Consulting Services Inc. Page 72
Table A2.2 shows how the population is distributed by age and gender, and by province/territory.
Table A2.2: Population Distribution by Age and Gender, 2011, by Province/Territory (in thousands)
New
foun
dlan
d &
La
brad
or
Prin
ce E
dwar
d Is
land
Nov
a S
cotia
New
Bru
nsw
ick
Que
bec
Ont
ario
Man
itoba
Sas
katc
hew
an
Alb
erta
Brit
ish
Col
umbi
a
Yuk
on
Nor
thw
est
Terri
torie
s
Nun
avut
Can
ada
Females <1 2 1 4 4 43 69 8 7 25 21 0 0 0 184 1-4 10 3 17 14 172 275 30 27 94 86 1 1 2 732 5-9 12 4 22 18 196 347 36 31 107 107 1 1 2 884
10-14 13 4 24 20 205 372 38 32 108 116 1 1 2 936 15-19 14 5 27 20 237 403 41 34 113 125 1 2 1 1,024 20-24 15 5 30 24 248 437 42 36 130 146 1 2 1 1,117 25-29 15 4 27 21 247 421 40 35 144 147 1 2 1 1,106 30-34 15 4 27 22 264 411 38 33 134 139 1 2 1 1,091 35-39 17 4 30 25 250 446 39 31 130 146 1 1 1 1,122 40-44 20 5 32 26 258 469 39 31 126 161 1 2 1 1,171 45-49 22 6 39 32 315 544 46 38 141 182 2 2 1 1,368 50-54 22 6 40 32 325 508 45 39 137 181 1 2 1 1,338 55-59 22 5 37 31 296 448 40 35 115 167 1 1 1 1,198 60-64 20 5 34 28 260 393 35 29 91 148 1 1 0 1,045 65-69 15 4 26 21 216 311 27 23 67 113 1 0 0 823 70-74 10 3 18 14 149 216 19 16 46 78 0 0 0 570 75-79 8 2 15 12 131 194 17 16 41 66 0 0 0 505 80-84 6 2 12 10 107 158 15 14 33 55 0 0 0 411 85-89 4 1 8 7 68 106 11 10 21 37 0 0 0 272 90+ 2 1 6 4 40 60 7 7 13 24 0 0 0 165
Subtotal 264 73 476 385 4,027 6,589 614 522 1,817 2,243 17 20 16 17,063 Males
<1 2 1 5 4 45 72 8 7 26 22 0 0 0 193 1-4 10 3 18 15 181 289 31 28 100 91 1 1 2 769 5-9 13 4 23 19 204 365 38 32 112 112 1 1 2 926
10-14 14 4 26 21 214 392 41 33 113 122 1 1 2 984 15-19 15 5 28 22 243 420 42 35 116 130 1 2 2 1,061 20-24 16 5 32 24 254 456 44 39 138 154 1 2 2 1,164 25-29 14 4 26 21 248 406 39 36 148 146 1 2 1 1,092 30-34 14 3 24 21 263 377 37 33 137 132 1 2 1 1,045 35-39 16 4 27 23 253 410 38 30 134 136 1 2 1 1,076 40-44 18 5 29 25 258 443 38 30 128 151 1 1 1 1,130 45-49 21 6 37 30 318 524 44 37 143 174 1 2 1 1,339 50-54 21 5 37 31 314 486 45 38 139 168 2 2 1 1,289 55-59 21 5 34 29 288 423 40 35 118 159 1 1 1 1,156 60-64 19 5 32 27 248 366 33 28 91 141 1 1 0 994 65-69 14 4 24 20 195 282 25 22 63 107 1 0 0 757 70-74 10 2 17 14 135 195 17 15 44 74 0 0 0 524 75-79 7 2 12 10 102 160 14 13 35 60 0 0 0 416 80-84 4 1 8 7 69 115 10 10 25 43 0 0 0 293 85-89 2 1 4 4 33 58 6 6 12 22 0 0 0 147 90+ 1 0 2 2 13 23 3 3 5 10 0 0 0 61
Subtotal 251 68 446 366 3,876 6,263 595 512 1,828 2,157 17 21 16 16,414 Total 515 140 922 751 7,903 12,852 1,208 1,033 3,645 4,400 34 41 32 33,477
Source: Statistics Canada, Census 2011
Population Projection Methodology This report makes projections about future health care expenditures over the next 25 years. This requires population data to be projected from 2013 to 2037. Projections published by Statistics Canada are used,83
83 In fact, Statistics Canada publishes projections up to the year 2036. These are then extrapolated linearly by the author to the year 2037.
which are presented under three scenarios:

© 2013 Society of Actuaries and Canadian Institute of Actuaries, All Rights Reserved Stephane Levert Consulting Services Inc. Page 73
• Low-growth scenario • Medium-growth scenario84
• High-growth scenario.
This report defines the medium-growth scenario as the base scenario, with the low-growth and high-growth scenarios used to test the sensitivity of health care cost projections to the demographic assumptions. The projections are based on assumptions about fertility, mortality, international immigration, emigration and inter-provincial migration.
Fertility—Assumptions are set by Statistics Canada for each province/territory based on their own specific variations. In aggregate, the fertility assumption for the medium-growth scenario is set at 1.7 children per woman, and the mean age at childbearing is set at 30.17 years. These assumptions are fixed for the next 25 years. Under the low-growth scenario, the fertility rate gradually declines to 1.5 children per woman by 2014 and remains fixed until 2036, with the mean age at childbearing increasing to 30.77 years over the same period of time. Under the high-growth scenario, the fertility rate increases to 1.9 children per woman, and the mean age at childbearing increases to 30.37 years. Table A2.3 shows ultimate fertility assumptions, by the year 2036.
By comparison, the fertility assumption used by the Canada Pension Plan (CPP) is 1.66 children per woman in 2007, decreasing to 1.65 children per woman in 2015 and remaining fixed thereafter.85 This is slightly lower than the base scenario. The Quebec Pension Plan (QPP), on its part, assumes a fertility rate of 1.73 children per woman in 2010, decreasing to an ultimate level of 1.65 children per woman in 2018. 86
Again, this is lower than what is assumed by Statistics Canada, as shown in Table A2.4, which compares the number of births projected by the CPP, the QPP and by Statistics Canada.
Mortality—In setting the assumption for mortality rates, Statistics Canada uses a parametric model (Li-Lee) based on observed changes in mortality rates, by province/territory, over the
84 Statistics Canada also presents four variations to the medium-growth scenario, bringing the total of scenarios considered to six. The variations are in relation to inter-provincial migration. 85 OSFI, 2010. 86 QPP, 2010.
Table A2.3: Projected Fertility Rates, 2036, by Province and Territory
Province/Territory Low-
Growth Scenario
Base Scenario
High-Growth
Scenario Newfoundland and Labrador 1.28 1.46 1.65 Prince Edward Island 1.46 1.66 1.86 Nova Scotia 1.33 1.51 1.69 New Brunswick 1.34 1.53 1.73 Quebec 1.52 1.72 1.92 Ontario 1.44 1.63 1.81 Manitoba 1.73 1.98 2.23 Saskatchewan 1.78 2.03 2.30 Alberta 1.70 1.93 2.17 British Columbia 1.39 1.57 1.74 Yukon 1.41 1.61 1.80 Northwest Territories 1.87 2.14 2.41 Nunavut 2.53 2.93 3.35 Total Canada 1.50 1.70 1.90 Source: Statistics Canada, 2010.
Table A2.4: Comparison of Projected Number of Births, Selected Years (in thousands)
Selected Years
Canada without Quebec (CPP)
Quebec Only
(QPP)
Total Canada (CPP+QPP)
Base Scenario
2012 307 89 396 400 2013 310 89 399 405 2014 313 89 402 409 2015 315 89 404 413 2020 320 86 406 427 2025 315 82 397 429 2030 311 79 390 425 2035 n/a 81 n/a 433 2040 332 84 416 455
Source: Statistics Canada, 2010, OSFI, 2010 and QPP, 2010.

© 2013 Society of Actuaries and Canadian Institute of Actuaries, All Rights Reserved Stephane Levert Consulting Services Inc. Page 74
period from 1981 to 2006, capturing the recent trends in the improvement of Canadian mortality and, also, the narrowing of the gap between life expectancies for males and females. The low-growth and high-growth scenarios are derived using the 1 percent confidence intervals of the ARIMA model used to project a parameter of the Li-Lee model.
Comparing Statistics Canada’s mortality assumptions to those used by the CPP and the QPP is not as straightforward as for the fertility assumption. It is easier to compare the resulting number of projected deaths, as shown in Table A2.5. The base scenario appears to be projecting a larger population at the end of the horizon. International migration—The assumed number of immigrants is set by Statistics Canada at a total fixed number of 240,000 for the years 2011 and 2012 under the low-growth scenario, of 252,500 under the base scenario, and of 265,000 under the high-growth scenario. These are
taken directly from the low and high assumptions of the 2009 Immigration Plan of Citizenship and Immigration Canada. For the years 2013 to 2036, population is assumed to grow as a result of immigration at a rate of 6.0 per thousand under the low-growth scenario, at 7.5 per thousand under the base scenario, and at 9.0 per thousand under the high-growth scenario. Then, the resulting total number of immigrants is allocated to each province/territory and by age and gender based on the actual observation for the years 2006 to 2008. Table A2.6 shows the number of projected immigrants for the
year 2036.
Emigration—Of lesser importance than fertility, mortality and immigration, Statistics Canada sets an assumption for emigration, broken down into three components:
• Emigrants—The number of people leaving Canada, as a percentage of the total population, is
fixed, for the entire projection period, at a level equal to the average observed emigration rate from 1992 to 2008.
• Returning emigrants—The number of people returning to Canada after having left is equal to 44.5 percent of the number of emigrants, corresponding to the average observation from 1992 to 2008.
• Persons temporarily abroad—The number of Canadians being temporarily abroad is fixed, for the entire projection period, at 21,180 persons.
For all three components of emigration, the projections are allocated by province/territory and by age and gender according to the observed actual distribution from 2006 t o 2008. The same assumption is used for the low-growth, the base, and the high-growth scenarios.
Table A2.5: Comparison of Projected Number of Deaths, Selected Years (in thousands)
Selected Years
Canada without Quebec (CPP)
Quebec Only
(QPP)
Total Canada
(CPP+QPP)
Base Scenario
2012 191 61 252 251 2013 194 62 256 255 2014 197 63 260 259 2015 201 64 265 263 2020 219 70 289 282 2025 242 76 318 304 2030 272 85 357 332 2035 n/a 95 n/a 368 2040 346 105 451 407
Source: Statistics Canada, 2010, OSFI, 2010 and QPP, 2010.
Table A2.6: Projected number of immigrants, 2036, by province and territory and by demographic scenario (in thousands)
Province/Territory Low-
Growth Scenario
Base Scenario
High-Growth
Scenario Newfoundland and Labrador 0.4 0.5 0.7 Prince Edward Island 0.7 1.0 1.3 Nova Scotia 2.1 2.8 3.6 New Brunswick 1.3 1.7 2.2 Quebec 39.3 52.9 68.3 Ontario 121.5 166.3 217.7 Manitoba 9.6 13.2 17.4 Saskatchewan 2.8 3.8 4.8 Alberta 22.3 30.2 39.2 British Columbia 44.5 60.8 79.6 Yukon 0.1 0.1 0.1 Northwest Territories 0.1 0.1 0.2 Nunavut 0.0 0.0 0.0 Total Canada 244.8 333.6 435.1 Source: Statistics Canada, 2010.

© 2013 Society of Actuaries and Canadian Institute of Actuaries, All Rights Reserved Stephane Levert Consulting Services Inc. Page 75
Inter-provincial migration—Several variations have been observed over the past 30 years in the movement of persons between provinces/territories. With that in mind, Statistics Canada developed four scenarios (this report uses internal migration scenario 1):
• Internal migration scenario 1—Inter-provincial migration follows the historical trends from 1981 to
2008. This reflects broad long-term patterns in Canada. This scenario exhibits movements favorable to Western Canada and to Ontario, and less favorable to Eastern Canada and Quebec.
• Internal migration scenario 2—Inter-provincial migration follows the historical trends from 1988 to 1996. This scenario is favorable to British Colombia, due t o the continuing expansion of Asian emerging economies and the reduced weight of the manufacturing industry, resulting in the province suffering less than other provinces/territories from economic difficulties.
• Internal migration scenario 3—Inter-provincial migration follows the historical trends from 2001 to 2006. This reflects the recent expansion of Alberta’s oil and gas sector. This period also proved favorable to Quebec.
• Internal migration scenario 4—Inter-provincial migration follows the historical trends from 2006 to 2008. This reflects more recent shifts in internal migration, notably for Saskatchewan and Newfoundland & Labrador, where it increased significantly, and for Ontario, where it declined significantly as a result of difficulties in the automotive sector.
For comparison purposes, the net migration assumption (i.e., the excess of immigration over emigration) used for the CPP is 0.58 percent of the population. On its part, the QPP assumes net migration of 31,500 persons throughout the projection period. Table A2.7 compares the resulting projected net migration under the CPP and QPP and as projected under the base scenario. Again, consistent with the fertility and mortality assumptions, Statistics Canada is projecting the population in a way that makes it relatively larger at the end of the horizon.
2013 to 2037 Population Projections The assumptions about fertility, mortality, international immigration, emigration and inter-provincial migration are combined by Statistics Canada to develop projections from 2010 to 2036, using 2009 postcensal population estimates.87
87 At the time of using the data, Statistics Canada hadn’t updated their population forecasts after publishing results of the 2011 census. Therefore, this report resorts to work from Statistics Canada based on 2009 postcensal population estimates.
For the purpose of this report paper, projections from 2013 to 2036 are adjusted based on a comparison of the then-projected 2011 population to the 2011 census population. This effectively forces the demographic projection model to use the year 2011 as a reference, assuming that any variance will be evenly distributed by province/territory and by age-gender cells. Population projection for the year 2037 is an extrapolation from the year 2036.
Table A2.7: Comparison of net migration, selected years (in thousands)
Selected Years
Canada without Quebec (CPP)
Quebec Only
(QPP)
Total Canada
(CPP+QPP)
Base Scenario
2012 165 32 197 205 2013 162 32 194 215 2014 163 32 195 218 2015 164 32 196 221 2020 181 32 213 236 2025 195 32 227 250 2030 202 32 234 264 2035 n/a 32 n/a 278 2040 213 32 245 291
Source: Statistics Canada, 2010, OSFI, 2010 and QPP, 2010.

© 2013 Society of Actuaries and Canadian Institute of Actuaries, All Rights Reserved Stephane Levert Consulting Services Inc. Page 76
Table A2.8 shows the population projections, for Canada, from 2011 to 2037. The last column of the table shows the projected population numbers assumed by the CPP for selected years, sitting somewhere between the low-growth and the base scenarios. Now, projections vary significantly by province/territory. Table A2.9 shows the projected population by province/ territory under the base scenario.
Table A2.9: Projected Population, 2011 to 2037, by Province/Territory, Base Scenario (in thousands)
Year
New
foun
dlan
d &
La
brad
or
Prin
ce E
dwar
d Is
land
Nov
a S
cotia
New
Bru
nsw
ick
Que
bec
Ont
ario
Man
itoba
Sas
katc
hew
an
Alb
erta
Brit
ish
Col
umbi
a
Yuk
on
Nor
thw
est
Terri
torie
s
Nun
avut
Can
ada
2011 515 140 922 751 7,903 12,852 1,208 1,033 3,645 4,400 34 41 32 33,477 2012 515 141 926 754 7,967 13,019 1,221 1,040 3,694 4,468 34 42 32 33,854 2013 515 143 931 758 8,031 13,188 1,233 1,046 3,744 4,537 35 42 33 34,237 2014 515 144 936 761 8,093 13,358 1,246 1,052 3,794 4,607 35 43 33 34,617 2015 515 145 940 764 8,155 13,526 1,259 1,059 3,843 4,676 35 43 34 34,995 2016 516 147 945 767 8,215 13,694 1,272 1,066 3,892 4,745 35 43 34 35,371 2017 516 148 950 770 8,275 13,862 1,285 1,072 3,940 4,813 35 44 34 35,744 2018 517 150 954 774 8,334 14,028 1,298 1,079 3,988 4,881 35 44 35 36,116 2019 517 151 959 777 8,391 14,194 1,311 1,086 4,035 4,948 35 44 35 36,482 2020 517 152 964 779 8,447 14,360 1,324 1,093 4,081 5,015 35 44 35 36,847 2021 518 153 968 782 8,503 14,528 1,337 1,099 4,127 5,083 36 45 36 37,215 2022 518 154 973 786 8,558 14,697 1,350 1,106 4,173 5,151 36 45 36 37,583 2023 519 156 977 789 8,612 14,865 1,363 1,113 4,219 5,218 36 45 36 37,948 2024 519 157 982 791 8,665 15,033 1,376 1,119 4,263 5,286 36 46 36 38,311 2025 520 159 986 794 8,717 15,201 1,389 1,126 4,308 5,354 36 46 37 38,674 2026 520 160 990 797 8,768 15,369 1,402 1,133 4,352 5,422 37 46 37 39,031 2027 520 161 995 799 8,817 15,535 1,415 1,139 4,396 5,489 37 47 37 39,386 2028 520 162 999 801 8,865 15,702 1,428 1,146 4,439 5,556 37 47 37 39,740 2029 520 163 1,002 804 8,911 15,867 1,441 1,152 4,482 5,623 37 47 38 40,087 2030 521 164 1,006 806 8,956 16,030 1,453 1,158 4,525 5,689 37 48 38 40,432 2031 520 165 1,010 808 9,000 16,193 1,466 1,165 4,567 5,755 38 48 38 40,773 2032 520 167 1,013 810 9,043 16,355 1,479 1,171 4,609 5,820 38 49 38 41,111 2033 520 168 1,016 812 9,084 16,515 1,491 1,178 4,650 5,885 38 49 38 41,444 2034 520 169 1,019 813 9,126 16,675 1,504 1,184 4,692 5,950 39 49 39 41,778 2035 520 170 1,023 816 9,166 16,833 1,517 1,191 4,735 6,016 39 49 39 42,111 2036 520 170 1,026 817 9,205 16,991 1,530 1,197 4,775 6,080 39 50 39 42,439 2037 520 171 1,029 818 9,248 17,154 1,543 1,204 4,818 6,146 39 50 40 42,780 Source: Statistics Canada, CANSIM Tables 051-0001 and 052-0005, and calculations by the author.
Table A2.8: Projected Population, Total Canada, 2011 to 2037, by Demographic Scenario (in thousands)
Year Low-
Growth Scenario
Base Scenario
High-Growth
Scenario CPP
2011 33,477 33,477 33,477 2012 33,803 33,854 33,899 34,773 2013 34,088 34,237 34,378 35,107 2014 34,359 34,617 34,866 35,435 2015 34,624 34,995 35,357 35,763 2016 34,886 35,371 35,850 2017 35,141 35,744 36,344 2018 35,389 36,116 36,841 2019 35,629 36,482 37,338 2020 35,867 36,847 37,837 37,393 2021 36,103 37,215 38,341 2022 36,333 37,583 38,848 2023 36,560 37,948 39,357 2024 36,782 38,311 39,869 2025 37,000 38,674 40,382 39,004 2026 37,212 39,031 40,895 2027 37,417 39,386 41,408 2028 37,614 39,740 41,924 2029 37,807 40,087 42,439 2030 37,991 40,432 42,956 40,462 2031 38,171 40,773 43,472 2032 38,342 41,111 43,989 2033 38,508 41,444 44,510 2034 38,667 41,778 45,032 2035 38,819 42,111 45,560 2036 38,967 42,439 46,091 2037 39,124 42,780 46,639 41,669 Source: Statistics Canada, CANSIM Tables 051-0001 and 052-0005, OSFI, 2010, and calculations by the author.

© 2013 Society of Actuaries and Canadian Institute of Actuaries, All Rights Reserved Stephane Levert Consulting Services Inc. Page 77
Tables A2.10 and A2.11 show the annual population growth rate over the projection period by province/territory for the entire population, as well as for the working population. Under the base scenario, the total Canadian population will grow at a rate of 0.9 percent per year, with Ontario, Alberta and British Columbia all growing faster than the national average, Quebec growing at a mere 0.6 percent per year, and the Atlantic provinces—except Prince Edward Island—growing at a near-zero rate. Meanwhile, the working population will only grow at a rate of 0.4 percent per year, with the Atlantic provinces likely to see their workforce decline over the next 25 years.
Table A2.10: Population Growth Rate, 2012 to 2037, by Province and Territory, by Demographic Scenario
Province/Territory Low-
Growth Scenario
Base Scenario
High-Growth
Scenario Newfoundland & Labrador -0.2% 0.0% 0.3% Prince Edward Island 0.4% 0.8% 1.1% Nova Scotia 0.2% 0.4% 0.7% New Brunswick 0.1% 0.3% 0.6% Quebec 0.3% 0.6% 0.9% Ontario 0.7% 1.1% 1.5% Manitoba 0.6% 0.9% 1.3% Saskatchewan 0.3% 0.6% 0.9% Alberta 0.7% 1.1% 1.4% British Columbia 0.9% 1.3% 1.7% Yukon 0.3% 0.5% 0.8% Northwest Territories 0.4% 0.7% 1.0% Nunavut 0.4% 0.8% 1.1% Canada 0.6% 0.9% 1.3% Source: Statistics Canada, CANSIM Tables 051-0001 and 052-0005, OSFI, 2010, and calculations by the author.
Table A2.11: Working Population Growth Rate, 2012 to 2037, by Province and Territory, by Demographic Scenario
Province/Territory Low-
Growth Scenario
Base Scenario
High-Growth
Scenario Newfoundland & Labrador -1.0% -0.8% -0.7% Prince Edward Island -0.1% 0.1% 0.4% Nova Scotia -0.5% -0.3% -0.1% New Brunswick -0.6% -0.4% -0.2% Quebec -0.2% 0.0% 0.3% Ontario 0.3% 0.6% 0.9% Manitoba 0.2% 0.5% 0.8% Saskatchewan -0.1% 0.1% 0.3% Alberta 0.2% 0.5% 0.7% British Columbia 0.4% 0.8% 1.1% Yukon -0.3% -0.1% 0.2% Northwest Territories -0.3% 0.0% 0.2% Nunavut 0.1% 0.4% 0.6% Canada 0.1% 0.4% 0.7% Source: Statistics Canada, CANSIM Tables 051-0001 and 052-0005, OSFI, 2010, and calculations by the author.

© 2013 Society of Actuaries and Canadian Institute of Actuaries, All Rights Reserved Stephane Levert Consulting Services Inc.
Page 78
Appendix 3—Economic Projections
Introduction This appendix presents the projection basis used in this report to forecast economic growth, which certainly influences the future cost of health care services—either as a result of price inflation or in terms of the ability of the economy to consume health care services—and also provides a basis for their funding from both public and private sources. The key economic indicator referred to in this report is the gross domestic product (GDP), which is defined as the value of goods and services produced by the Canadian working population. Projections are developed on that basis, allowing the use of projected population growth (developed in Chapter 4) and assumptions about expected productivity gains. GDP growth is then defined as:
1)1()1(1 11 −+×+×=−=∆ ++tt
t
t
t
tt PG
WPWP
GDPGDPGDP π ,
where:
• tGDP is the gross domestic product at time t
• tWP is the working population at time t, defined as the number of people between ages 20 and
64
• tπ is the general price inflation factor at time t
• tPG is the productivity gain factor at time t.
Here, the productivity gain factor tPG combines the effects of (1) variations in the proportion of the
population between ages 20 a nd 64 actually participating in some economic activity, (2) capital expenditures and the introduction of new technologies reducing the cost of production and/or producing higher levels of output, (3) changes in the level of total compensation to the working population, on a constant 2012 dollar basis, including any direct and indirect taxes and aggregate changes in the tax burdens, and (4) variations in the actual productivity of people participating in the economy. Using this model, GDP projections are made for each province/territory using specific and r easonable assumptions.
Real GDP Growth Parameters Referring to the formula discussed above for tGDP∆ real GDP growth, t
RGDP∆ , can be def ined as
follows:

© 2013 Society of Actuaries and Canadian Institute of Actuaries, All Rights Reserved Stephane Levert Consulting Services Inc. Page 79
1)1(1
1 −+×=+
∆=∆ +
tt
t
t
tt
R PGWP
WPGDPGDPπ
This means that forecasting real GDP growth only requires setting assumptions about future demographic growth projections—which were developed in Chapter 4—and productivity gain. An assumption about
general inflation is still required, though, as discussed later in this appendix, since the Canada Health Transfer is currently growing at a nominal annual rate of 6 percent. Table A3.1 shows the growth in the average working population over the next 25 years, by province/territory, using different demographic scenarios. It shows that Newfoundland & Labrador, Nova Scotia and New Brunswick will suffer significant decreases of their working population base under all scenarios, whereas Ontario, Manitoba, Alberta, British Columbia and Nunavut will see theirs growing. The other provinces/territories will see their working population growing under some demographic scenarios, and decreasing under others. In addition to the direct effect of demography on the projected actual
health care expenditures, this will have varying effects, for provinces/territories, on their future ability to generate funds through taxes, etc., and thus to financially support their respective health care systems. In aggregate, Canada will see its working population growing over the next 25 years, at a rate of 0.4 percent under the base scenario, compared to 0.9 percent for the entire population.
Next, an assumption about productivity gain needs to be set, used in conjunction with population growth factors in the real GDP growth model proposed in this report. It is based on a review of historical real GDP growth, the idea being to remove the working population growth component from the actual real GDP growth to arrive at the productivity gain factor.
Figure A3.1 shows the historical real GDP growth rates from 1981 to 2008, and the historical working population growth rates over the same period, by province/territory. Finally, Table A3.2 shows the resulting historical productivity gain by province/territory, from 1981 t o 2008, using the real GDP growth model. For the purpose of forecasting how the Canadian
Table A3.1: Projected Working Population Growth Rates, 2012 to 2037, by Province and Territory and by Demographic Scenario
Province/Territory Low-
Growth Scenario
Base Scenario
High-Growth
Scenario Newfoundland & Labrador -1.0% -0.8% -0.7% Prince Edward Island -0.1% 0.1% 0.4% Nova Scotia -0.5% -0.3% -0.1% New Brunswick -0.6% -0.4% -0.2% Quebec -0.2% 0.0% 0.3% Ontario 0.3% 0.6% 0.9% Manitoba 0.2% 0.5% 0.8% Saskatchewan -0.1% 0.1% 0.3% Alberta 0.2% 0.5% 0.7% British Columbia 0.4% 0.8% 1.1% Yukon -0.3% -0.1% 0.2% Northwest Territories -0.3% 0.0% 0.2% Nunavut 0.1% 0.4% 0.6% Canada 0.1% 0.4% 0.7% Source: Statistics Canada, CANSIM Tables 051-0001 and 052-0005, and calculations by the author.
Figure A3.1: Historical Real GDP and Working Population Growth Rates, 1981 to 2008, by Province and Territory
0.00% 0.50% 1.00% 1.50% 2.00% 2.50% 3.00% 3.50% 4.00% 4.50%
New
foun
dlan
d …
Prin
ce E
dwar
d …
Nov
a S
cotia
N
ew B
runs
wic
k Q
uebe
c O
ntar
io
Man
itoba
S
aska
tche
wan
A
lber
ta
Brit
ish
Col
umbi
a Yu
kon
Nor
thw
est …
N
unav
ut
Can
ada
Historical real GDP growth rates
Historical working population growth rates Table A3.2: Productivity Gain, 1981 to 2008, by Province and Territory
Province/Territory Real GDP
Growth
Working Population
Growth
Producti-vity Gain
Newfoundland & Labrador 2.79% 0.30% 2.49% Prince Edward Island 2.56% 0.99% 1.55% Nova Scotia 2.28% 0.78% 1.50% New Brunswick 2.50% 0.71% 1.78% Quebec 2.06% 0.80% 1.25% Ontario 2.80% 1.65% 1.13% Manitoba 2.07% 0.83% 1.23% Saskatchewan 2.14% 0.46% 1.68% Alberta 3.07% 1.98% 1.07% British Columbia 2.52% 1.88% 0.63% Yukon 3.25% 1.60% 1.62% Northwest Territories 4.12% 2.28% 1.81% Nunavut n/a n/a n/a Canada 2.68% 1.35% 1.31% Source: Statistics Canada, CANSIM Tables 051-0001 and 384-0002 and calculations by the author.

© 2013 Society of Actuaries and Canadian Institute of Actuaries, All Rights Reserved Stephane Levert Consulting Services Inc. Page 80
economy grows over the next 25 years, this report assumes productivity gains that vary by province/territory, with an aggregate average of 1.31 percent per year for Canada. This corresponds to the observation from 1981 to 2008 and is consistent with assumptions adopted by other researchers.88
Real GDP Growth Forecast Tables A3.3, A3.4 and A3.5 show the resulting real GDP forecasts for the next 25 years, under the base scenario and also under the low-growth and high-growth demographic scenarios, and the resulting economic growth rates by province/territory. Projected real GDP is expected to grow at an annual rate of 1.6 percent from 2012 t o 2037. This falls short of the 2.7 percent historical real growth rate observed from 1981 to 2008. Such gap is mainly explained by demographic factors, the working population being expected to grow at an annual rate of 0.4 percent over the next 25 years, whereas it has historically grown at an annual rate of 1.4 percent. This implies that achieving future economic growth similar to past experience would require the future productivity gains to be about 1 percent higher, at a level of 2.3 percent, instead of the assumed 1.31 percent.
88 For example, Busby and Robson (2011) refer to productivity for the population aged 18 to 64 growing at historical rates of 1.5 percent.
Table A3.4: Projected GDP, 2012 to 2037, Total Canada, by Demographic Scenario (in millions of constant 2012 dollars)
Year Low-
Growth Scenario
Base Scenario
High-Growth
Scenario 2012 1,675,443 1,676,310 1,677,115 2013 1,705,412 1,709,366 1,713,320 2014 1,735,000 1,742,226 1,749,461 2015 1,763,929 1,774,686 1,785,415 2016 1,791,761 1,806,251 1,820,676 2017 1,817,938 1,836,296 1,854,761 2018 1,841,954 1,864,421 1,887,066 2019 1,863,903 1,890,781 1,917,958 2020 1,885,009 1,916,258 1,948,268 2021 1,905,557 1,941,629 1,978,470 2022 1,925,094 1,966,228 2,008,371 2023 1,944,495 1,990,965 2,038,488 2024 1,964,528 2,016,412 2,069,843 2025 1,983,762 2,041,459 2,100,908 2026 2,003,394 2,066,947 2,132,792 2027 2,024,157 2,093,944 2,166,351 2028 2,044,647 2,121,088 2,200,502 2029 2,066,667 2,149,748 2,236,434 2030 2,089,958 2,181,737 2,276,986 2031 2,116,654 2,218,183 2,323,136 2032 2,145,711 2,258,035 2,374,077 2033 2,175,427 2,299,566 2,428,357 2034 2,205,052 2,342,380 2,484,968 2035 2,234,881 2,385,857 2,542,984 2036 2,265,378 2,430,366 2,602,593 2037 2,296,554 2,476,011 2,663,987 Source: Statistics Canada, CANSIM Tables 051-0001 and 384-0002 and calculations by the author.
Table A3.3: Projected Real GDP Growth Rates, 2012 to 2037, by Province and Territory, by Demographic Scenario
Province/Territory Low-
Growth Scenario
Base Scenario
High-Growth
Scenario Newfoundland & Labrador 1.5% 1.7% 1.8% Prince Edward Island 1.4% 1.7% 2.0% Nova Scotia 1.0% 1.2% 1.4% New Brunswick 1.2% 1.4% 1.6% Quebec 1.0% 1.3% 1.5% Ontario 1.4% 1.7% 2.1% Manitoba 1.4% 1.8% 2.1% Saskatchewan 1.6% 1.8% 2.0% Alberta 1.3% 1.6% 1.8% British Columbia 1.0% 1.4% 1.7% Yukon 1.3% 1.5% 1.9% Northwest Territories 1.5% 1.8% 2.0% Nunavut 1.9% 2.2% 2.4% Canada 1.3% 1.6% 1.9%
Source: Statistics Canada, CANSIM Tables 051-0001 and 384-0002 and calculations by the author.

© 2013 Society of Actuaries and Canadian Institute of Actuaries, All Rights Reserved Stephane Levert Consulting Services Inc. Page 81
Table A3.5: Projected Real GDP, 2012 to 2037, by Province/Territory, Base Scenario (millions of constant 2012 dollars)
Years
New
foun
dlan
d &
La
brad
or
Prin
ce E
dwar
d Is
land
Nov
a S
cotia
New
Bru
nsw
ick
Que
bec
Ont
ario
Man
itoba
Sas
katc
hew
an
Alb
erta
Brit
ish
Col
umbi
a
Yuk
on
Nor
thw
est
Terri
torie
s
Nun
avut
Can
ada
2012 23,047 5,184 35,602 29,042 336,650 668,631 54,020 50,015 234,042 208,503 2,246 3,858 1,533 1,676,310 2013 23,451 5,295 36,122 29,521 342,205 683,469 55,118 51,091 269,176 212,197 2,292 3,915 1,578 1,709,366 2014 23,831 5,395 36,662 30,008 347,481 698,454 56,293 52,096 274,310 215,835 2,299 4,027 1,598 1,742,226 2015 24,208 5,491 37,204 30,457 352,640 713,455 57,422 53,147 279,337 219,323 2,336 4,057 1,672 1,774,686 2016 24,621 5,595 37,716 30,926 357,457 728,092 58,503 54,149 284,227 222,761 2,374 4,174 1,720 1,806,251 2017 24,974 5,708 38,228 31,349 362,051 742,181 59,549 55,109 288,815 226,028 2,402 4,205 1,761 1,836,296 2018 25,355 5,815 38,675 31,770 366,119 755,572 60,535 56,015 293,104 229,035 2,430 4,267 1,793 1,864,421 2019 25,722 5,899 39,074 32,175 369,688 768,339 61,482 56,836 297,082 231,872 2,459 4,374 1,844 1,890,781 2020 26,091 5,991 39,475 35,542 373,089 780,852 62,427 57,604 300,903 234,601 2,487 4,391 1,868 1,916,258 2021 26,472 6,077 39,860 32,905 376,516 793,211 63,355 58,429 304,604 237,303 2,516 4,502 1,942 1,941,629 2022 26,847 6,151 40,220 33,263 379,699 805,339 64,264 59,228 308,290 239,970 2,546 4,520 1,956 1,966,228 2023 27,271 6,246 40,524 33,631 382,817 817,471 65,178 60,066 312,033 242,623 2,587 4,601 1,982 1,990,965 2024 27,651 6,329 40,880 34,017 386,102 829,901 66,121 60,886 315,916 245,399 2,617 4,651 2,007 2,016,412 2025 28,023 6,420 41,244 34,367 389,410 841,954 67,027 61,756 319,787 248,109 2,611 4,752 2,064 2,041,459 2026 28,437 6,505 41,565 34,743 392,980 853,943 67,954 62,648 323,777 250,897 2,666 4,804 2,097 2,066,947 2027 28,865 6,591 41,925 35,128 397,147 866,079 68,962 63,626 328,157 253,827 2,721 4,873 2,106 2,093,944 2028 29,307 6,671 42,308 35,517 401,415 877,985 70,045 64,650 332,656 256,707 2,791 4,943 2,156 2,121,088 2029 29,743 6,760 42,702 35,958 406,118 890,316 71,170 65,733 337,511 259,746 2,798 5,051 2,206 2,149,748 2030 30,226 6,865 43,191 36,387 411,145 904,121 72,375 66,976 342,962 263,352 2,830 5,124 2,246 2,181,737 2031 30,715 7,003 43,797 36,931 417,154 919,709 73,770 68,385 349,005 267,375 2,889 5,216 2,298 2,218,183 2032 31,303 7,128 44,452 37,544 423,913 936,782 75,279 69,901 355,402 271,712 2,976 5,368 2,340 2,258,035 2033 31,902 7,255 45,157 38,211 431,159 954,611 76,878 71,483 361,949 276,148 3,025 5,445 2,407 2,299,566 2034 32,572 7,417 45,949 38,900 438,645 972,985 78,459 73,133 368,650 280,572 3,115 5,583 2,463 2,342,380 2035 33,307 7,591 46,711 39,628 446,276 991,746 80,058 74,794 375,344 285,075 3,180 5,704 2,507 2,385,857 2036 34,045 7,726 47,487 40,332 454,139 1,011,032 81,721 76,515 382,028 289,706 3,231 5,889 2,579 2,430,366 2037 34,803 7,865 48,284 41,055 462,232 1,030,776 83,427 78,286 388,873 294,443 3,286 6,088 2,656 2,476,011
General Inflation Projecting future health care expenditures and economic output in real terms removes the need to set an assumption about expected general inflation. Still, the fact that, under the current Canada Health Transfer calculation formula, federal cash transfers grow at a nominal annual rate of 6 percent until fiscal year 2016-2017 means that the impact of the proposed changes to the Canada Health Transfer may somewhat be influenced by fluctuations in general inflation. Therefore, this report assumes that the general inflation factor will be equal to 2.0 percent, under the base scenario. This is in line with the target of the Bank of Canada and is consistent with the assumption used by Drummond.89
89 Drummond, Don, and Derek Burleton, 2010. Charting a Path to Sustainable Healthcare in Ontario: 10 Proposals To Restrain Cost Growth Without Compromising Quality Of Care. TD Economics, May 27.

© 2013 Society of Actuaries and Canadian Institute of Actuaries, All Rights Reserved Stephane Levert Consulting Services Inc.
Page 82
Appendix 4—Projections Using Different Scenarios
Health Care Expenditures of Provinces/Territories (millions of constant 2012 dollars, where applicable)
HISTORICAL PATTERN FROM 1996 TO 2010
Type of Expenditures
Annual Increase Due to… Actual Health Care
Expenditures of Provinces/Territories Projection Assumptions
Aging and Population
Growth
Real Cost
Total 2012 as a %
of GDP
Physicians 1.8% 3.0% 4.8% 29,015 1.7% n/a Hospitals 2.2% 1.7% 3.8% 53,925 3.2% n/a Other Institutions 1.4% 4.1% 5.5% 15,914 1.0% n/a Other Professionals - - 0.1% 1,103 0.1% n/a Drugs 2.9% 4.3% 7.2% 10,677 0.6% n/a Other Health Spending - - 5.6% 24,318 1.5% n/a Total 134,952 8.2%
PROJECTION USING HISTORICAL REAL COST GROWTH
Type of Expenditures
Annual Increase Due to… Actual Health Care
Expenditures of Provinces/Territories Projection Assumptions
Aging and Population
Growth
Real Cost
Total 2037 as a %
of GDP
Physicians 1.6% 3.0% 4.6% 88,404 3.6% Trend of 3.0% Hospitals 2.2% 1.7% 3.9% 139,774 5.6% Trend of 1.7% Other Institutions 3.4% 4.1% 7.5% 97,546 3.9% Trend of 4.1% Other Professionals - - 0.1% 1,131 0.1% Trend of 0.1% Drugs 1.6% 4.3% 5.9% 44,904 1.8% Trend of 4.3% Other Health Spending - - 5.6% 94,957 3.8% Trend of 5.6% Total 5.1% 466,716 18.9%
PROJECTION USING BASE SCENARIO
Type of Expenditures
Annual Increase Due to… Actual Health Care
Expenditures of Provinces/Territories Projection Assumptions
Aging and Population Growth
Real Cost
Total 2037 as a %
of GDP
Physicians 1.5% 1.9% 3.4% 67,076 2.7% Trend of 2.5% for five years, dropping to 1.0% after 25 years
Hospitals 2.2% 1.8% 3.9% 141,631 5.7%
70% compensation—trend of 1.0% for five years dropping to 0.5% after 25 years; 25% supplies, equipment, buildings and grounds—no trend; 5% drugs—trend of 3% for 25 years; Innovation—trend of 1.0% for five years dropping to 0.5% after 25 years
Other Institutions 3.3% 0.6% 3.9% 41,603 1.7% 75% compensation—trend of 1.0% for five years dropping to 0.5% after 25 years; 25% others—no trend
Other Professionals 1.7% 1.1% 2.9% 2,241 0.1%
40% dental—trend of 2.0% for five years dropping to 1.0% after 25 years; 20% vision—trend of 1.0% for five years dropping to 0.5% after 25 years; 40% others—trend of 1.0% for five years dropping to 0.5% after 25 years
Drugs 1.6% 3.0% 4.6% 32,818 1.3% Trend of 3.0% for 25 years
Other Health Spending - - 0.8% 48,322 1.2%
Capital—trend with population growth; Public health—no trend; Administration—no trend; Health research—trend with real GDP growth Other—trend with population growth plus 1.0% for five years dropping to 0.5% after 25 years
Total 315,182 12.7%

© 2013 Society of Actuaries and Canadian Institute of Actuaries, All Rights Reserved Stephane Levert Consulting Services Inc.
Page 83
Appendix 5—Provincial/Territorial Public Accounts
Introduction Chapter 11 discusses the sustainability of the Canadian health care system in aggregate. This appendix presents selected results for each province/territory. All figures assume that the proposed changes to the Canada Health Transfer calculations formula will be implemented.
Newfoundland & Labrador Table A5.1: Summary of Projections, Base Scenario, 2012 to 2037, Newfoundland & Labrador
Years
(millions of constant 2012 dollars) Health Care Expenditures as a % of Provincial
Health Care Expenditures
Own-Source
Revenues
Federal Cash
Transfers
Total Revenues GPD
Own-Source
Revenues
Total Revenues GPD
2012 2,643 6,773 785 7,558 23,047 39.0% 35.0% 11.5% 2013 2,730 6,892 680 7,572 23,451 39.6% 36.1% 11.6% 2014 2,816 7,003 656 7,659 23,831 40.2% 36.8% 11.8% 2015 2,906 7,114 656 7,770 24,208 40.9% 37.4% 12.0% 2016 3,011 7,236 669 7,904 24,621 41.6% 38.1% 12.2% 2017 3,114 7,339 675 8,014 24,974 42.4% 38.9% 12.5% 2018 3,227 7,451 681 8,132 25,355 43.3% 39.7% 12.7% 2019 3,333 7,559 687 8,246 25,722 44.1% 40.4% 13.0% 2020 3,447 7,668 693 8,360 26,091 45.0% 41.2% 13.2% 2021 3,570 7,780 698 8,478 26,472 45.9% 42.1% 13.5% 2022 3,692 7,890 703 8,593 26,847 46.8% 43.0% 13.8% 2023 3,818 8,014 708 8,722 27,271 47.6% 43.8% 14.0% 2024 3,950 8,126 713 8,839 27,651 48.6% 44.7% 14.3% 2025 4,080 8,235 718 8,953 28,023 49.5% 45.6% 14.6% 2026 4,216 8,357 723 9,080 28,437 50.4% 46.4% 14.8% 2027 4,347 8,483 728 9,210 28,865 51.2% 47.2% 15.1% 2028 4,486 8,613 733 9,346 29,307 52.1% 48.0% 15.3% 2029 4,633 8,741 738 9,479 29,743 53.0% 48.9% 15.6% 2030 4,778 8,883 744 9,627 30,226 53.8% 49.6% 15.8% 2031 4,919 9,026 751 9,777 30,715 54.5% 50.3% 16.0% 2032 5,063 9,199 758 9,957 31,303 55.0% 50.8% 16.2% 2033 5,195 9,375 767 10,142 31,902 55.4% 51.2% 16.3% 2034 5,334 9,572 776 10,349 32,572 55.7% 51.5% 16.4% 2035 5,469 9,788 787 10,575 33,307 55.9% 51.7% 16.4% 2036 5,600 10,005 798 10,803 34,045 56.0% 51.8% 16.4% 2037 5,736 10,228 802 11,030 34,803 56.1% 52.0% 16.5%
Growth Rate 3.1% 1.7% 0.1% 1.5% 1.7%
Figure A5.1: Projected Total Health Care Expenditures vs. Total Available Revenues, 2007 to 2037 (millions of constant 2012 dollars)—Newfoundland & Labrador
0
2,000
4,000
6,000
8,000
10,000
12,000
2007
20
08
2009
20
10
2011
20
12
2013
f 20
14f
2015
f 20
16f
2017
f 20
18f
2019
f 20
20f
2021
f 20
22f
2023
f 20
24f
2025
f 20
26f
2027
f 20
28f
2029
f 20
30f
2031
f 20
32f
2033
f 20
34f
2035
f 20
36f
2037
f
Own-source revenues Federal cash transfers Healthcare expenditures

© 2013 Society of Actuaries and Canadian Institute of Actuaries, All Rights Reserved Stephane Levert Consulting Services Inc. Page 84
Prince Edward Island
Figure A5.2: Projected Total Health Care Expenditures vs. Total Available Revenues, 2007 to 2037 (millions of constant 2012 dollars)—Prince Edward Island
Table A5.2: Summary of Projections, Base Scenario, 2012 to 2037, Prince Edward Island
Years (millions of constant 2012 dollars)
Health Care Expenditures as a % of
Provincial Health Care Expenditures
Own-Source
Revenues
Federal Cash
Transfers
Total Revenues GPD
Own-Source
Revenues
Total Revenues GPD
2012 622 910 509 1,419 5,184 68.4% 43.9% 12.0% 2013 649 929 534 1,463 5,295 69.8% 44.4% 12.3% 2014 669 947 522 1,469 5,395 70.7% 45.6% 12.4% 2015 694 964 520 1,484 5,491 72.0% 46.7% 12.6% 2016 716 982 525 1,507 5,595 72.9% 47.5% 12.8% 2017 749 1,001 528 1,529 5,708 74.8% 49.0% 13.1% 2018 776 1,020 537 1,558 5,815 76.1% 49.8% 13.3% 2019 801 1,035 545 1,581 5,899 77.3% 50.7% 13.6% 2020 835 1,051 553 1,605 5,991 79.4% 52.0% 13.9% 2021 859 1,066 561 1,628 6,077 80.6% 52.8% 14.1% 2022 888 1,079 568 1,647 6,151 82.3% 53.9% 14.4% 2023 922 1,096 576 1,672 6,246 84.1% 55.2% 14.8% 2024 952 1,111 584 1,694 6,329 85.7% 56.2% 15.0% 2025 985 1,127 591 1,718 6,420 87.4% 57.3% 15.3% 2026 1,019 1,141 599 1,741 6,505 89.3% 58.6% 15.7% 2027 1,050 1,157 607 1,763 6,591 90.8% 59.6% 15.9% 2028 1,086 1,171 614 1,784 6,671 92.8% 60.9% 16.3% 2029 1,122 1,186 621 1,808 6,760 94.6% 62.1% 16.6% 2030 1,156 1,205 631 1,835 6,865 96.0% 63.0% 16.8% 2031 1,191 1,229 642 1,871 7,003 96.9% 63.7% 17.0% 2032 1,231 1,251 653 1,903 7,128 98.5% 64.7% 17.3% 2033 1,272 1,273 664 1,937 7,255 99.9% 65.7% 17.5% 2034 1,306 1,301 677 1,979 7,417 100.3% 66.0% 17.6% 2035 1,345 1,332 692 2,024 7,591 100.9% 66.4% 17.7% 2036 1,379 1,356 704 2,060 7,726 101.7% 66.9% 17.8% 2037 1,414 1,380 714 2,094 7,865 102.5% 67.5% 18.0%
Growth Rate 3.3% 1.7% 1.4% 1.6% 1.7%
0
500
1,000
1,500
2,000
2,500
Own-source revenues Federal cash transfers Healthcare expenditures

© 2013 Society of Actuaries and Canadian Institute of Actuaries, All Rights Reserved Stephane Levert Consulting Services Inc. Page 85
Nova Scotia
Figure A5.3: Projected Total Health Care Expenditures vs. Total Available Revenues, 2007 to 2037 (millions of constant 2012 dollars)—Nova Scotia
Table A5.3: Summary of Projections, Base Scenario, 2012 to 2037, Nova Scotia
Years
(millions of constant 2012 dollars) Health Care Expenditures as a % of Provincial
Health Care Expenditures
Own-Source
Revenues
Federal Cash
Transfers
Total Revenues GPD
Own-Source
Revenues
Total Revenues GPD
2012 3,918 5,717 2,827 8,545 35,602 68.5% 45.9% 11.0% 2013 4,050 5,801 2,967 8,768 36,122 69.8% 46.2% 11.2% 2014 4,178 5,888 2,912 8,799 36,662 71.0% 47.5% 11.4% 2015 4,309 5,975 2,905 8,879 37,204 72.1% 48.5% 11.6% 2016 4,456 6,057 2,921 8,978 37,716 73.6% 49.6% 11.8% 2017 4,610 6,139 2,924 9,063 38,228 75.1% 50.9% 12.1% 2018 4,768 6,211 2,959 9,169 38,675 76.8% 52.0% 12.3% 2019 4,930 6,275 2,990 9,264 39,074 78.6% 53.2% 12.6% 2020 5,098 6,339 3,020 9,359 39,475 80.4% 54.5% 12.9% 2021 5,270 6,401 3,049 9,450 39,860 82.3% 55.8% 13.2% 2022 5,458 6,459 3,076 9,535 40,220 84.5% 57.2% 13.6% 2023 5,644 6,508 3,100 9,608 40,524 86.7% 58.7% 13.9% 2024 5,830 6,565 3,126 9,691 40,880 88.8% 60.2% 14.3% 2025 6,025 6,623 3,152 9,776 41,244 91.0% 61.6% 14.6% 2026 6,222 6,675 3,177 9,852 41,565 93.2% 63.2% 15.0% 2027 6,432 6,733 3,203 9,936 41,925 95.5% 64.7% 15.3% 2028 6,645 6,794 3,231 10,026 42,308 97.8% 66.3% 15.7% 2029 6,850 6,857 3,260 10,117 42,702 99.9% 67.7% 16.0% 2030 7,067 6,936 3,294 10,230 43,191 101.9% 69.1% 16.4% 2031 7,281 7,033 3,335 10,369 43,797 103.5% 70.2% 16.6% 2032 7,500 7,139 3,380 10,519 44,452 105.1% 71.3% 16.9% 2033 7,717 7,252 3,429 10,681 45,157 106.4% 72.3% 17.1% 2034 7,926 7,379 3,484 10,863 45,949 107.4% 73.0% 17.3% 2035 8,139 7,501 3,538 11,040 46,711 108.5% 73.7% 17.4% 2036 8,342 7,626 3,594 11,220 47,487 109.4% 74.4% 17.6% 2037 8,553 7,754 3,636 11,390 48,284 110.3% 75.1% 17.7%
Growth Rate 3.2% 1.2% 1.0% 1.2% 1.2%
0
2,000
4,000
6,000
8,000
10,000
12,000
Own-source revenues Federal cash transfers Healthcare expenditures

© 2013 Society of Actuaries and Canadian Institute of Actuaries, All Rights Reserved Stephane Levert Consulting Services Inc. Page 86
New Brunswick
Figure A5.4: Projected Total Health Care Expenditures vs. Total Available Revenues, 2007 to 2037 (millions of constant 2012 dollars)—New Brunswick
Table A5.4: Summary of Projections, Base Scenario, 2012 to 2037, New Brunswick
Years
(millions of constant 2012 dollars) Health Care Expenditures as a % of Provincial
Health Care Expenditures
Own-Source
Revenues
Federal Cash
Transfers
Total Revenues GPD
Own-Source
Revenues
Total Revenues GPD
2012 3,095 4,976 2,509 7,485 29,042 62.2% 41.3% 10.7% 2013 3,203 5,058 2,612 7,670 29,521 63.3% 41.8% 10.9% 2014 3,313 5,142 2,554 7,696 30,008 64.4% 43.0% 11.0% 2015 3,419 5,219 2,544 7,763 30,457 65.5% 44.1% 11.2% 2016 3,537 5,299 2,558 7,857 30,926 66.7% 45.0% 11.4% 2017 3,659 5,372 2,559 7,931 31,349 68.1% 46.1% 11.7% 2018 3,792 5,444 2,592 8,036 31,770 69.7% 47.2% 11.9% 2019 3,920 5,513 2,623 8,136 32,175 71.1% 48.2% 12.2% 2020 4,049 5,576 2,651 8,227 32,542 72.6% 49.2% 12.4% 2021 4,194 5,638 2,679 8,317 32,905 74.4% 50.4% 12.7% 2022 4,342 5,700 2,705 8,405 33,263 76.2% 51.7% 13.1% 2023 4,497 5,763 2,732 8,495 33,631 78.0% 52.9% 13.4% 2024 4,647 5,829 2,760 8,589 34,017 79.7% 54.1% 13.7% 2025 4,805 5,889 2,786 8,674 34,367 81.6% 55.4% 14.0% 2026 4,966 5,953 2,813 8,766 34,743 83.4% 56.6% 14.3% 2027 5,134 6,019 2,840 8,860 35,128 85.3% 58.0% 14.6% 2028 5,305 6,086 2,868 8,954 35,517 87.2% 59.2% 14.9% 2029 5,474 6,161 2,899 9,061 35,958 88.8% 60.4% 15.2% 2030 5,646 6,235 2,930 9,165 36,387 90.6% 61.6% 15.5% 2031 5,815 6,328 2,969 9,297 36,931 91.9% 62.6% 15.7% 2032 5,995 6,433 3,012 9,445 37,544 93.2% 63.5% 16.0% 2033 6,165 6,548 3,059 9,607 38,211 94.2% 64.2% 16.1% 2034 6,339 6,665 3,109 9,774 38,900 95.1% 64.9% 16.3% 2035 6,512 6,790 3,162 9,952 39,628 95.9% 65.4% 16.4% 2036 6,676 6,911 3,214 10,125 40,332 96.6% 65.9% 16.6% 2037 6,847 7,035 3,255 10,289 41,055 97.3% 66.5% 16.7%
Growth Rate 3.2% 1.4% 1.0% 1.3% 1.4%
0
2,000
4,000
6,000
8,000
10,000
12,000
Own-source revenues Federal cash transfers Healthcare expenditures

© 2013 Society of Actuaries and Canadian Institute of Actuaries, All Rights Reserved Stephane Levert Consulting Services Inc. Page 87
Quebec
Figure A5.5: Projected Total Health Care Expenditures vs. Total Available Revenues, 2007 to 2037 (millions of constant 2012 dollars)—Quebec
Table A5.5: Summary of Projections, Base Scenario, 2012 to 2037, Quebec
Years (millions of constant 2012 dollars)
Health Care Expenditures as a % of
Provincial Health Care Expenditures
Own-Source
Revenues
Federal Cash
Transfers
Total Revenues GPD
Own-Source
Revenues
Total Revenues GPD
2012 28,250 51,002 17,431 68,433 336,650 55.4% 41.3% 8.4% 2013 29,247 51,844 18,209 70,053 342,205 56.4% 41.8% 8.5% 2014 30,282 52,643 17,903 70,546 347,481 57.5% 42.9% 8.7% 2015 31,362 53,425 17,938 71,363 352,640 58.7% 43.9% 8.9% 2016 32,487 54,155 18,143 72,297 357,457 60.0% 44.9% 9.1% 2017 33,661 54,851 18,227 73,077 362,051 61.4% 46.1% 9.3% 2018 34,845 55,467 18,455 73,922 366,119 62.8% 47.1% 9.5% 2019 36,063 56,008 18,663 74,671 369,688 64.4% 48.3% 9.8% 2020 37,307 56,523 18,858 75,381 373,089 66.0% 49.5% 10.0% 2021 38,583 57,042 19,046 76,088 376,516 67.6% 50.7% 10.2% 2022 39,885 57,524 19,222 76,747 379,699 69.3% 52.0% 10.5% 2023 41,208 57,997 19,393 77,390 382,817 71.1% 53.2% 10.8% 2024 42,595 58,494 19,567 78,061 386,102 72.8% 54.6% 11.0% 2025 44,021 58,995 19,741 78,736 389,410 74.6% 55.9% 11.3% 2026 45,486 59,536 19,922 79,458 392,980 76.4% 57.2% 11.6% 2027 46,976 60,168 20,120 80,288 397,147 78.1% 58.5% 11.8% 2028 48,510 60,814 20,322 81,136 401,415 79.8% 59.8% 12.1% 2029 50,069 61,527 20,539 82,066 406,118 81.4% 61.0% 12.3% 2030 51,665 62,288 20,769 83,058 411,145 82.9% 62.2% 12.6% 2031 53,252 63,199 21,035 84,233 417,154 84.3% 63.2% 12.8% 2032 54,831 64,223 21,333 85,556 423,913 85.4% 64.1% 12.9% 2033 56,390 65,321 21,659 86,979 431,159 86.3% 64.8% 13.1% 2034 57,950 66,455 22,004 88,458 438,645 87.2% 65.5% 13.2% 2035 59,478 67,611 22,361 89,972 446,276 88.0% 66.1% 13.3% 2036 60,953 68,802 22,729 91,531 454,139 88.6% 66.6% 13.4% 2037 62,471 70,028 22,972 93,000 462,232 89.2% 67.2% 13.5%
Growth Rate 3.2% 1.3% 1.1% 1.2% 1.3%
0
10,000
20,000
30,000
40,000
50,000
60,000
70,000
80,000
90,000
100,000
Own-source revenues Federal cash transfers Healthcare expenditures

© 2013 Society of Actuaries and Canadian Institute of Actuaries, All Rights Reserved Stephane Levert Consulting Services Inc. Page 88
Ontario
Figure A5.6: Projected Total Health Care Expenditures vs. Total Available Revenues, 2007 to 2037 (millions of constant 2012 dollars)—Ontario
Table A5.6: Summary of Projections, Base Scenario, 2012 to 2037, Ontario
Years (millions of constant 2012 dollars)
Health Care Expenditures as a % of
Provincial Health Care Expenditures
Own-Source
Revenues
Federal Cash
Transfers
Total Revenues GPD
Own-Source
Revenues
Total Revenues GPD
2012 50,413 90,346 19,085 109,430 668,631 55.8% 46.1% 7.5% 2013 52,358 92,351 19,234 111,584 683,469 56.7% 46.9% 7.7% 2014 54,364 94,376 19,900 114,275 698,454 57.6% 47.6% 7.8% 2015 56,441 96,402 20,459 116,862 713,455 58.5% 48.3% 7.9% 2016 58,605 98,380 20,969 119,349 728,092 59.6% 49.1% 8.0% 2017 60,861 100,284 21,288 121,572 742,181 60.7% 50.1% 8.2% 2018 63,182 102,093 21,688 123,782 755,572 61.9% 51.0% 8.4% 2019 65,551 103,818 22,072 125,891 768,339 63.1% 52.1% 8.5% 2020 67,997 105,509 22,443 127,952 780,852 64.4% 53.1% 8.7% 2021 70,524 107,179 22,801 129,980 793,211 65.8% 54.3% 8.9% 2022 73,172 108,818 23,151 131,968 805,339 67.2% 55.4% 9.1% 2023 75,888 110,457 23,497 133,954 817,471 68.7% 56.7% 9.3% 2024 78,674 112,137 23,845 135,982 829,901 70.2% 57.9% 9.5% 2025 81,540 113,765 24,190 137,955 841,954 71.7% 59.1% 9.7% 2026 84,494 115,385 24,536 139,921 853,943 73.2% 60.4% 9.9% 2027 87,568 117,025 24,887 141,912 866,079 74.8% 61.7% 10.1% 2028 90,747 118,634 25,240 143,874 877,985 76.5% 63.1% 10.3% 2029 93,959 120,300 25,603 145,903 890,316 78.1% 64.4% 10.6% 2030 97,232 122,165 25,992 148,157 904,121 79.6% 65.6% 10.8% 2031 100,537 124,272 26,414 150,686 919,709 80.9% 66.7% 10.9% 2032 103,959 126,578 26,876 153,454 936,782 82.1% 67.7% 11.1% 2033 107,404 128,988 27,373 156,361 954,611 83.3% 68.7% 11.3% 2034 110,864 131,470 27,901 159,371 972,985 84.3% 69.6% 11.4% 2035 114,361 134,005 28,449 162,454 991,746 85.3% 70.4% 11.5% 2036 117,847 136,611 29,013 165,624 1,011,032 86.3% 71.2% 11.7% 2037 121,441 139,279 29,341 168,620 1,030,776 87.2% 72.0% 11.8%
Growth Rate 3.6% 1.7% 1.7% 1.7% 1.7%
0
20,000
40,000
60,000
80,000
100,000
120,000
140,000
160,000
180,000
Own-source revenues Federal cash transfers Healthcare expenditures

© 2013 Society of Actuaries and Canadian Institute of Actuaries, All Rights Reserved Stephane Levert Consulting Services Inc. Page 89
Manitoba
Figure A5.7: Projected Total Health Care Expenditures vs. Total Available Revenues, 2007 to 2037 (millions of constant 2012 dollars)—Manitoba
Table A5.7: Summary of Projections, Base Scenario, 2012 to 2037, Manitoba
Years
(millions of constant 2012 dollars) Health Care Expenditures as a % of Provincial
Health Care Expenditures
Own-Source
Revenues
Federal Cash
Transfers
Total Revenues GPD
Own-Source
Revenues
Total Revenues GPD
2012 5,458 9,690 3,390 13,080 54,020 56.3% 41.7% 10.1% 2013 5,631 9,887 3,500 13,387 55,018 57.0% 42.1% 10.2% 2014 5,807 10,098 3,454 13,552 56,293 57.5% 42.8% 10.3% 2015 5,985 10,300 3,468 13,768 57,422 58.1% 43.5% 10.4% 2016 6,175 10,494 3,510 14,004 58,503 58.8% 44.1% 10.6% 2017 6,373 10,682 3,533 14,215 59,549 59.7% 44.8% 10.7% 2018 6,572 10,858 3,593 14,451 60,535 60.5% 45.5% 10.9% 2019 6,782 11,028 3,650 14,678 61,482 61.5% 46.2% 11.0% 2020 6,993 11,198 3,706 14,903 62,427 62.5% 46.9% 11.2% 2021 7,217 11,364 3,760 15,124 63,355 63.5% 47.7% 11.4% 2022 7,447 11,527 3,813 15,340 64,264 64.6% 48.5% 11.6% 2023 7,685 11,691 3,866 15,557 65,178 65.7% 49.4% 11.8% 2024 7,932 11,860 3,919 15,780 66,121 66.9% 50.3% 12.0% 2025 8,182 12,023 3,972 15,995 67,027 68.1% 51.2% 12.2% 2026 8,439 12,189 4,025 16,214 67,954 69.2% 52.0% 12.4% 2027 8,714 12,370 4,081 16,452 68,962 70.4% 53.0% 12.6% 2028 8,999 12,564 4,141 16,706 70,045 71.6% 53.9% 12.8% 2029 9,283 12,766 4,204 16,970 71,170 72.7% 54.7% 13.0% 2030 9,565 12,982 4,270 17,252 72,375 73.7% 55.4% 13.2% 2031 9,863 13,232 4,345 17,577 73,770 74.5% 56.1% 13.4% 2032 10,181 13,503 4,426 17,929 75,279 75.4% 56.8% 13.5% 2033 10,485 13,790 4,514 18,304 76,878 76.0% 57.3% 13.6% 2034 10,802 14,074 4,603 18,676 78,459 76.8% 57.8% 13.8% 2035 11,119 14,360 4,694 19,054 80,058 77.4% 58.4% 13.9% 2036 11,438 14,659 4,788 19,447 81,721 78.0% 58.8% 14.0% 2037 11,767 14,965 4,863 19,828 83,427 78.6% 59.3% 14.1%
Growth Rate 3.1% 1.8% 1.5% 1.7% 1.8%
0
5,000
10,000
15,000
20,000
25,000
Own-source revenues Federal cash transfers Healthcare expenditures

© 2013 Society of Actuaries and Canadian Institute of Actuaries, All Rights Reserved Stephane Levert Consulting Services Inc. Page 90
Saskatchewan
Figure A5.8: Projected Total Health Care Expenditures vs. Total Available Revenues, 2007 to 2037 (millions of constant 2012 dollars)—Saskatchewan
Table A5.8: Summary of Projections, Base Scenario, 2012 to 2037, Saskatchewan
Years
(millions of constant 2012 dollars) Health Care Expenditures as a % of Provincial
Health Care Expenditures
Own-Source
Revenues
Federal Cash
Transfers
Total Revenues GPD
Own-Source
Revenues
Total Revenues GPD
2012 4,792 9,705 1,282 10,987 50,015 49.4% 43.6% 9.6% 2013 4,917 9,914 1,306 11,220 51,091 49.6% 43.8% 9.6% 2014 5,053 10,109 1,326 11,435 52,096 50.0% 44.2% 9.7% 2015 5,190 10,313 1,354 11,667 53,147 50.3% 44.5% 9.8% 2016 5,330 10,508 1,387 11,895 54,149 50.7% 44.8% 9.8% 2017 5,475 10,694 1,405 12,099 55,109 51.2% 45.3% 9.9% 2018 5,631 10,870 1,425 12,295 56,015 51.8% 45.8% 10.1% 2019 5,782 11,029 1,444 12,473 56,836 52.4% 46.4% 10.2% 2020 5,947 11,178 1,461 12,639 57,604 53.2% 47.1% 10.3% 2021 6,108 11,338 1,478 12,816 58,429 53.9% 47.7% 10.5% 2022 6,282 11,493 1,494 12,987 59,228 54.7% 48.4% 10.6% 2023 6,459 11,656 1,510 13,165 60,066 55.4% 49.1% 10.8% 2024 6,645 11,815 1,526 13,340 60,886 56.2% 49.8% 10.9% 2025 6,833 11,984 1,542 13,525 61,756 57.0% 50.5% 11.1% 2026 7,029 12,157 1,558 13,715 62,648 57.8% 51.3% 11.2% 2027 7,229 12,346 1,575 13,922 63,626 58.6% 51.9% 11.4% 2028 7,439 12,545 1,593 14,138 64,650 59.3% 52.6% 11.5% 2029 7,653 12,755 1,611 14,367 65,733 60.0% 53.3% 11.6% 2030 7,871 12,996 1,632 14,628 66,976 60.6% 53.8% 11.8% 2031 8,090 13,270 1,654 14,924 68,385 61.0% 54.2% 11.8% 2032 8,313 13,564 1,679 15,243 69,901 61.3% 54.5% 11.9% 2033 8,550 13,871 1,706 15,577 71,483 61.6% 54.9% 12.0% 2034 8,786 14,191 1,736 15,927 73,133 61.9% 55.2% 12.0% 2035 9,025 14,514 1,766 16,280 74,794 62.2% 55.4% 12.1% 2036 9,261 14,848 1,798 16,646 76,515 62.4% 55.6% 12.1% 2037 9,505 15,191 1,814 17,005 78,286 62.6% 55.9% 12.1%
Growth Rate 2.8% 1.8% 1.4% 1.8% 1.8%
0
2,000
4,000
6,000
8,000
10,000
12,000
14,000
16,000
18,000
Own-source revenues Federal cash transfers Healthcare expenditures

© 2013 Society of Actuaries and Canadian Institute of Actuaries, All Rights Reserved Stephane Levert Consulting Services Inc. Page 91
Alberta
Figure A5.9: Projected Total Health Care Expenditures vs. Total Available Revenues, 2007 to 2037 (millions of constant 2012 dollars)—Alberta
Table A5.9: Summary of Projections, Base Scenario, 2012 to 2037, Alberta
Years (millions of constant 2012 dollars)
Health Care Expenditures as a % of
Provincial Health Care Expenditures
Own-Source
Revenues
Federal Cash
Transfers
Total Revenues GPD
Own-Source
Revenues
Total Revenues GPD
2012 17,747 34,408 3,628 38,036 264,042 51.6% 46.7% 6.7% 2013 18,477 35,077 3,643 38,720 269,176 52.7% 47.7% 6.9% 2014 19,222 35,746 4,495 40,241 274,310 53.8% 47.8% 7.0% 2015 20,003 36,401 4,873 41,274 279,337 55.0% 48.5% 7.2% 2016 20,815 37,038 5,015 42,053 284,227 56.2% 49.5% 7.3% 2017 21,663 37,636 5,102 42,738 288,815 57.6% 50.7% 7.5% 2018 22,538 38,195 5,195 43,391 293,104 59.0% 51.9% 7.7% 2019 23,433 38,714 5,284 43,997 297,082 60.5% 53.3% 7.9% 2020 24,363 39,211 5,368 44,579 300,903 62.1% 54.7% 8.1% 2021 25,319 39,694 5,448 45,141 304,604 63.8% 56.1% 8.3% 2022 26,318 40,174 5,525 45,699 308,290 65.5% 57.6% 8.5% 2023 27,355 40,662 5,602 46,263 312,033 67.3% 59.1% 8.8% 2024 28,407 41,168 5,678 46,846 315,916 69.0% 60.6% 9.0% 2025 29,511 41,672 5,753 47,426 319,787 70.8% 62.2% 9.2% 2026 30,634 42,192 5,830 48,022 323,777 72.6% 63.8% 9.5% 2027 31,811 42,763 5,909 48,672 328,157 74.4% 65.4% 9.7% 2028 33,027 43,349 5,990 49,339 332,656 76.2% 66.9% 9.9% 2029 34,273 43,982 6,073 50,055 337,511 77.9% 68.5% 10.2% 2030 35,536 44,692 6,163 50,855 342,962 79.5% 69.9% 10.4% 2031 36,831 45,480 6,259 51,738 349,005 81.0% 71.2% 10.6% 2032 38,169 46,313 6,362 52,676 355,402 82.4% 72.5% 10.7% 2033 39,544 47,167 6,475 53,641 361,949 83.8% 73.7% 10.9% 2034 40,925 48,040 6,595 54,635 368,650 85.2% 74.9% 11.1% 2035 42,322 48,912 6,720 55,632 375,344 86.5% 76.1% 11.3% 2036 43,711 49,783 6,848 56,631 382,028 87.8% 77.2% 11.4% 2037 45,153 50,675 6,908 57,583 388,873 89.1% 78.4% 11.6%
Growth Rate 3.8% 1.6% 2.6% 1.7% 1.6%
0
10,000
20,000
30,000
40,000
50,000
60,000
70,000
Own-source revenues Federal cash transfers Healthcare expenditures

© 2013 Society of Actuaries and Canadian Institute of Actuaries, All Rights Reserved Stephane Levert Consulting Services Inc. Page 92
British Columbia
Figure A5.10: Projected Total Health Care Expenditures vs. Total Available Revenues, 2007 to 2037 (millions of constant 2012 dollars)—British Columbia
Table A5.10: Summary of Projections, Base Scenario, 2012 to 2037, British Columbia
Years (millions of constant 2012 dollars)
Health Care Expenditures as a % of
Provincial Health Care Expenditures
Own-Source
Revenues
Federal Cash
Transfers
Total Revenues GPD
Own-Source
Revenues
Total Revenues GPD
2012 17,143 34,879 5,636 40,515 208,503 49.1% 42.3% 8.2% 2013 17,783 35,497 5,654 41,151 212,197 50.1% 43.2% 8.4% 2014 18,440 36,106 5,754 41,860 215,835 51.1% 44.1% 8.5% 2015 19,124 36,689 5,902 42,591 219,323 52.1% 44.9% 8.7% 2016 19,834 37,264 6,080 43,344 222,761 53.2% 45.8% 8.9% 2017 20,576 37,811 6,193 44,004 226,028 54.4% 46.8% 9.1% 2018 21,342 38,314 6,312 44,626 229,035 55.7% 47.8% 9.3% 2019 22,122 38,789 6,427 45,216 231,872 57.0% 48.9% 9.5% 2020 22,923 39,245 6,537 45,782 234,601 58.4% 50.1% 9.8% 2021 23,752 39,697 6,644 43,341 237,303 59.8% 51.3% 10.0% 2022 24,617 40,143 6,748 46,891 239,970 61.3% 52.5% 10.3% 2023 25,506 40,587 6,850 47,437 242,623 62.8% 53.8% 10.5% 2024 26,418 41,051 6,953 48,004 245,399 64.4% 55.0% 10.8% 2025 27,351 41,505 7,056 48,561 248,109 65.9% 56.3% 11.0% 2026 28,311 41,971 7,160 49,131 250,897 67.5% 57.6% 11.3% 2027 29,302 42,461 7,267 49,728 253,827 69.0% 58.9% 11.5% 2028 30,320 42,943 7,374 50,317 256,707 70.6% 60.3% 11.8% 2029 31,360 43,451 7,485 50,937 259,746 72.2% 61.6% 12.1% 2030 32,414 44,055 7,604 51,658 263,352 73.6% 62.7% 12.3% 2031 33,475 44,728 7,730 52,458 267,375 74.8% 63.8% 12.5% 2032 34,569 45,453 7,868 53,321 271,712 76.1% 64.8% 12.7% 2033 35,679 46,195 8,015 54,210 276,148 77.2% 65.8% 12.9% 2034 36,794 46,935 8,172 55,107 280,572 78.4% 66.8% 13.1% 2035 37,916 47,689 8,335 56,023 285,075 79.5% 67.7% 13.3% 2036 39,020 48,463 8,503 56,966 289,706 80.5% 68.5% 13.5% 2037 40,154 49,256 8,586 57,841 294,443 81.5% 69.4% 13.6%
Growth Rate 3.5% 1.4% 1.7% 1.4% 1.4%
0
10,000
20,000
30,000
40,000
50,000
60,000
70,000
Own-source revenues Federal cash transfers Healthcare expenditures

© 2013 Society of Actuaries and Canadian Institute of Actuaries, All Rights Reserved Stephane Levert Consulting Services Inc. Page 93
Yukon
Figure A5.11: Projected Total Health Care Expenditures vs. Total Available Revenues, 2007 to 2037 (millions of constant 2012 dollars)—Yukon
Table A5.11: Summary of Projections, Base Scenario, 2012 to 2037, Yukon
Years (millions of constant 2012 dollars)
Health Care Expenditures as a % of
Territorial Health Care Expenditures
Own-Source
Revenues
Federal Cash
Transfers
Total Revenues GPD
Own-Source
Revenues
Total Revenues GPD
2012 206 301 794 1,095 2,246 68.3% 18.8% 9.2% 2013 210 307 820 1,127 2,292 68.3% 18.6% 9.2% 2014 215 308 801 1,110 2,299 69.7% 19.4% 9.3% 2015 228 313 793 1,107 2,336 72.7% 20.6% 9.7% 2016 232 318 792 1,110 2,374 72.7% 20.9% 9.8% 2017 243 322 787 1,109 2,402 75.4% 21.9% 10.1% 2018 252 326 796 1,122 2,430 77.2% 22.4% 10.4% 2019 258 330 805 1,135 2,459 78.2% 22.7% 10.5% 2020 262 334 815 1,148 2,487 78.5% 22.8% 10.5% 2021 277 337 824 1,162 2,516 82.2% 23.9% 11.0% 2022 283 341 834 1,175 2,546 82.9% 24.1% 11.1% 2023 290 347 847 1,194 2,587 83.7% 24.3% 11.2% 2024 303 351 857 1,208 2,617 86.2% 25.1% 11.6% 2025 325 350 855 1,205 2,611 92.8% 27.0% 12.4% 2026 336 358 873 1,230 2,666 94.0% 27.3% 12.6% 2027 340 365 891 1,256 2,721 93.2% 27.1% 12.5% 2028 354 374 913 1,287 2,791 94.5% 27.5% 12.7% 2029 361 375 915 1,290 2,798 96.2% 28.0% 12.9% 2030 373 380 925 1,305 2,830 98.3% 28.6% 13.2% 2031 380 387 944 1,332 2,889 98.1% 28.5% 13.2% 2032 399 399 972 1,371 2,976 100.0% 29.1% 13.4% 2033 402 406 988 1,394 3,025 99.2% 28.9% 13.3% 2034 427 418 1,017 1,435 3,115 102.3% 29.8% 13.7% 2035 450 426 1,038 1,464 3,180 105.5% 30.7% 14.2% 2036 452 433 1,055 1,488 3,231 104.3% 30.4% 14.0% 2037 454 441 1,072 1,513 3,286 103.1% 30.0% 13.8%
Growth Rate 3.2% 1.5% 1.2% 1.3% 1.5%
0
200
400
600
800
1,000
1,200
1,400
1,600
Own-source revenues Federal cash transfers Healthcare expenditures

© 2013 Society of Actuaries and Canadian Institute of Actuaries, All Rights Reserved Stephane Levert Consulting Services Inc. Page 94
Northwest Territories
Figure A5.12: Projected Total Health Care Expenditures vs. Total Available Revenues, 2007 to 2037 (millions of constant 2012 dollars)—Northwest Territories
Table A5.12: Summary of Projections, Base Scenario, 2012 to 2037, Northwest Territories
Years (millions of constant 2012 dollars)
Health Care Expenditures as a % of
Territorial Health Care Expenditures
Own-Source
Revenues
Federal Cash
Transfers
Total Revenues GPD
Own-Source
Revenues
Total Revenues GPD
2012 300 313 1,097 1,410 3,858 95.9% 21.3% 7.8% 2013 314 317 1,129 1,447 3,915 98.8% 21.7% 8.0% 2014 335 326 1,124 1,450 4,027 102.5% 23.1% 8.3% 2015 347 329 1,114 1,442 4,057 105.5% 24.0% 8.6% 2016 363 338 1,118 1,457 4,174 107.3% 24.9% 8.7% 2017 374 341 1,112 1,453 4,205 109.7% 25.8% 8.9% 2018 390 346 1,128 1,474 4,267 112.9% 26.5% 9.2% 2019 414 355 1,156 1,510 4,374 116.8% 27.4% 9.5% 2020 427 356 1,161 1,517 4,391 120.0% 28.2% 9.7% 2021 444 365 1,189 1,554 4,502 121.5% 28.5% 9.9% 2022 469 366 1,194 1,561 4,520 128.0% 30.1% 10.4% 2023 485 373 1,215 1,588 4,601 129.9% 30.5% 10.5% 2024 503 377 1,229 1,606 4,651 133.3% 31.3% 10.8% 2025 517 385 1,255 1,640 4,752 134.2% 31.5% 10.9% 2026 551 389 1,268 1,658 4,804 141.6% 33.3% 11.5% 2027 586 395 1,286 1,681 4,873 148.3% 34.8% 12.0% 2028 613 401 1,305 1,706 4,943 152.9% 35.9% 12.4% 2029 629 409 1,333 1,742 5,051 153.7% 36.1% 12.5% 2030 664 415 1,352 1,767 5,124 159.9% 37.6% 13.0% 2031 703 423 1,376 1,799 5,216 166.2% 39.1% 13.5% 2032 734 435 1,415 1,850 5,368 168.8% 39.7% 13.7% 2033 766 441 1,436 1,877 5,445 173.6% 40.8% 14.1% 2034 782 453 1,472 1,924 5,583 172.8% 40.7% 14.0% 2035 817 462 1,503 1,965 5,704 176.7% 41.6% 14.3% 2036 832 477 1,551 2,028 5,889 174.4% 41.0% 14.1% 2037 849 493 1,602 2,095 6,088 172.0% 40.5% 13.9%
Growth Rate 4.2% 1.8% 1.5% 1.6% 1.8%
0
500
1,000
1,500
2,000
2,500
Own-source revenues Federal cash transfers Healthcare expenditures
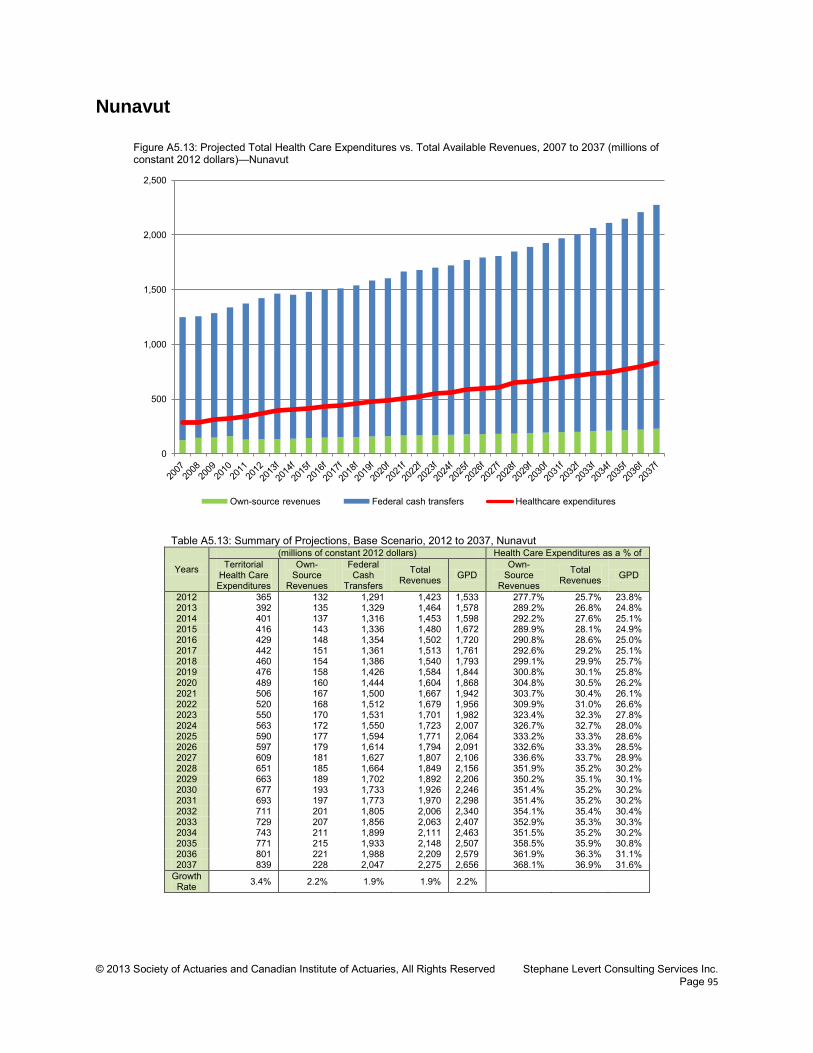
© 2013 Society of Actuaries and Canadian Institute of Actuaries, All Rights Reserved Stephane Levert Consulting Services Inc. Page 95
Nunavut
Figure A5.13: Projected Total Health Care Expenditures vs. Total Available Revenues, 2007 to 2037 (millions of constant 2012 dollars)—Nunavut
Table A5.13: Summary of Projections, Base Scenario, 2012 to 2037, Nunavut
Years
(millions of constant 2012 dollars) Health Care Expenditures as a % of Territorial
Health Care Expenditures
Own-Source
Revenues
Federal Cash
Transfers
Total Revenues GPD
Own-Source
Revenues
Total Revenues GPD
2012 365 132 1,291 1,423 1,533 277.7% 25.7% 23.8% 2013 392 135 1,329 1,464 1,578 289.2% 26.8% 24.8% 2014 401 137 1,316 1,453 1,598 292.2% 27.6% 25.1% 2015 416 143 1,336 1,480 1,672 289.9% 28.1% 24.9% 2016 429 148 1,354 1,502 1,720 290.8% 28.6% 25.0% 2017 442 151 1,361 1,513 1,761 292.6% 29.2% 25.1% 2018 460 154 1,386 1,540 1,793 299.1% 29.9% 25.7% 2019 476 158 1,426 1,584 1,844 300.8% 30.1% 25.8% 2020 489 160 1,444 1,604 1,868 304.8% 30.5% 26.2% 2021 506 167 1,500 1,667 1,942 303.7% 30.4% 26.1% 2022 520 168 1,512 1,679 1,956 309.9% 31.0% 26.6% 2023 550 170 1,531 1,701 1,982 323.4% 32.3% 27.8% 2024 563 172 1,550 1,723 2,007 326.7% 32.7% 28.0% 2025 590 177 1,594 1,771 2,064 333.2% 33.3% 28.6% 2026 597 179 1,614 1,794 2,091 332.6% 33.3% 28.5% 2027 609 181 1,627 1,807 2,106 336.6% 33.7% 28.9% 2028 651 185 1,664 1,849 2,156 351.9% 35.2% 30.2% 2029 663 189 1,702 1,892 2,206 350.2% 35.1% 30.1% 2030 677 193 1,733 1,926 2,246 351.4% 35.2% 30.2% 2031 693 197 1,773 1,970 2,298 351.4% 35.2% 30.2% 2032 711 201 1,805 2,006 2,340 354.1% 35.4% 30.4% 2033 729 207 1,856 2,063 2,407 352.9% 35.3% 30.3% 2034 743 211 1,899 2,111 2,463 351.5% 35.2% 30.2% 2035 771 215 1,933 2,148 2,507 358.5% 35.9% 30.8% 2036 801 221 1,988 2,209 2,579 361.9% 36.3% 31.1% 2037 839 228 2,047 2,275 2,656 368.1% 36.9% 31.6%
Growth Rate 3.4% 2.2% 1.9% 1.9% 2.2%
0
500
1,000
1,500
2,000
2,500
Own-source revenues Federal cash transfers Healthcare expenditures

© 2013 Society of Actuaries and Canadian Institute of Actuaries, All Rights Reserved Stephane Levert Consulting Services Inc. Page 96
Appendix 6—Description of the U.S. Health Care System This appendix briefly describes the U.S. health care system and identifies some differences and subtleties between the U.S. and Canadian health care systems. It is not meant to be ex haustive and comprehensive. More information on the Canadian health care system can be found in chapter 2.
Introduction Both Canada and the United States had similar health care systems before Canada reformed its own in the 1960s and 1970s. They now have a different mix of funding mechanisms, the major differences residing in how health insurance is provided. The U.S. health care system is described by looking at (1) the government’s involvement, (2) the scope of health care coverage, (3) how health care is delivered, and (4) how it is funded.
Government Involvement Governments of both nations are closely involved in health care. The main structural difference between the two is in relation to health insurance. In Canada, health care delivery is considered a provincial jurisdiction, and provinces/territories effectively directly administer most of the health care system with funding support from the federal government. In the United States, government programs directly cover 31 percent of the population, 90
including the elderly, disabled, children, veterans and s ome of the poor. Health programs sponsored by the U.S. government include:
• Federal Employees Health Benefits Program—manages a c ompetition network through which care is provided to civilian government employees and annuitants
• Indian Health Service—provides care to Native Americans from recognized tribes • Medicaid/State Health Insurance Assistance Program (SHIP)—generally covers low income
people in certain categories, including children, pregnant women and the disabled (administered by the states)
• Medicare—generally covers citizens and long-term residents who are 65 years and older and the disabled
• Military Health System91
• State Children’s Health Insurance Program (CHIP)—provides health insurance for low-income children who do not qualify for Medicaid (administered by the states)
—provides care to active duty and r etired U.S. Military personnel and their dependents
90 U.S. Census Bureau, 2010. 91 Including TRICARE, which provides civilian health benefits for military personnel, retirees and their dependents.

© 2013 Society of Actuaries and Canadian Institute of Actuaries, All Rights Reserved Stephane Levert Consulting Services Inc. Page 97
• Veterans Health Administration—provides care to veterans, their families and survivors through medical centers and clinics.
The United States used to be one of two member countries of the Organization for Economic Co-Operation and Development (OECD) lacking some form of universal health coverage after Mexico established a universal health care program in 2008, the other being Turkey.92
On March 23, 2010, the Patient Protection and Affordable Care Act (PPACA) became law, providing for major changes in health insurance to gradually take effect until 2018 and which effectively introduces the concept of universal health care coverage to the United States. On June 28, 2012, the U.S. Supreme Court upheld the constitutionality of most of PPACA.93
Briefly, the provisions of PPACA include:
• Making people earning up to 133 percent of the federal poverty limit (FPL)94
• Subsidizing insurance premiums for people earning up t o 400 percent of FPL to limit their maximum out-of-pocket premium to between 2 percent and 9.8 percent of family income
eligible for Medicaid
• Providing incentives for employers to provide group health care benefits • Prohibiting denial of coverage and denial of claims based on pre-existing conditions • Establishing health insurance exchanges • Prohibiting insurers from establishing annual spending caps • Supporting medical research.
In May 2011, Vermont became the first state to make health care in the state a “human right” and making the state responsible to provide a health care system that best meets the needs of its citizens.
Scope of Coverage The Canadian Medicare system is actually a collection of separate public health insurance programs that are very similar in the scope of their coverage including coverage for physician care, surgery and hospitalization. U.S. public health insurance programs generally cover inpatient hospital care for those eligible. In some instances, outpatient hospital care and medical services are also covered, as well as prescription drugs. Dental care for children may also be part of the coverage. The Emergency Medical Treatment and Active Labor Act (EMTALA) ensures public access to emergency services: emergency treatment cannot be withheld for lack of evidence of insurance coverage or other evidence of the ability to pay.95
92 An early step toward a universal health care system was made with the adoption of the Massachusetts 2006 Health Reform Statute, which (1) mandates all residents to purchase health insurance (unless they cannot afford it), (2) provides subsidized insurance plans so that nearly everyone can afford health insurance, and (3) provides a “Health Safety Net Fund” to pay for necessary treatments for those who cannot find affordable health insurance or who are not eligible. In July 2009, Connecticut introduced a plan called SustiNet, with the goal of achieving health care coverage of 98 percent of its residents by 2014.
93 National Federation of Independent Business v. Sebelius. 94 In 2016, the FPL is projected to be about $11,800 for a single person and about $24,000 for a family of four (U.S. Congressional Budget Office, 2009). 95 However, EMTALA does not remove the right of the hospital to seek payment for the cost of emergency health care provided. Also, the act does not provide access to non-emergency room care for patients who cannot afford to pay for health care, nor does it provide the benefit of preventive care and the continuity of a primary care physician.

© 2013 Society of Actuaries and Canadian Institute of Actuaries, All Rights Reserved Stephane Levert Consulting Services Inc. Page 98
Health Care Delivery System How health care is actually delivered is not materially different in Canada than in the United States, except for areas such as freedom of choice and whether the facilities are operated privately or publicly. In the United States, health care is provided by many separate legal entities that are largely owned and operated by the private sector, though federal, state, county and city governments also own certain facilities. Also, the Department of Defense operates field hospitals as well as permanent hospitals (the Military Health System) to provide military-funded health care to active military personnel. The Veterans Health Administration operates hospitals open only to veterans. Finally, the Indian Health Service operates facilities open only to Native Americans from recognized tribes. Extensive regulation applies to health care at both the federal and state levels, covering the licensing of health care providers at the state level and the testing and approval of pharmaceuticals and medical devices by the Food and Drug Administration. These regulations are designed to protect patients from ineffective health care. In addition, states regulate the private health insurance market, often requiring that health insurance companies cover certain procedures.96
Individuals with private or government health insurance are generally limited to medical facilities that accept the particular type of health insurance they are covered for. Visits to facilities outside the plan’s network are typically either not covered or else the patient must assume a larger share of the cost. Physicians and h ospitals are generally paid directly by patients or by insurance plans in return for services provided, generally on a fee-for-service basis.97
Health Care Funding As mentioned earlier, funding is one of the main differentiating factors of the U.S. and Canadian health care systems, especially in relation to health insurance. In Canada, generally health care expenditures are paid by provinces/territories using funds from their general revenues. Yet, about 30 percent of the cost of health care is assumed by the non-public sector, including the private sector (insurance companies and private employee benefit plans) and out-of-pocket payments from Canadians. This mostly goes toward services not covered or only partially covered by Medicare, such as prescription drugs, complementary medical services, dental care and vision care. In the United States, health insurance is now primarily provided by the public sector, with close to two-thirds of health care spending coming from programs such as Medicare, Medicaid, TRICARE, the Children’s Health Insurance Program and the Veterans Health Administration.
96 However, state mandates generally do not apply to the self-funded health care plans offered by larger employers, which are exempt from state laws under pre-emption clause of the Employee Retirement Income Security Act (ERISA). 97 Other insurance models exist under which compensation is not on a fee-for-service basis. Health maintenance organizations (HMOs) and capitation plans are examples of situations where physicians and/or facilities are paid a fixed fee to provide care regardless of its intensity.

© 2013 Society of Actuaries and Canadian Institute of Actuaries, All Rights Reserved Stephane Levert Consulting Services Inc. Page 99
About 84 percent of Americans had some form of health insurance in 2010, either through an employer (55 percent), a pr ivate individual plan (10 percent) or government programs (31 percent). 98
Workers covered under an employer-sponsored group plan are usually required to contribute part of the cost of the insurance, with the employer usually selecting the insurance company. Most covered workers also face additional payments when they use health care services, in the form of deductibles and copayments. Americans whose employers do not offer health insurance, as well as those who are self-employed or unemployed, must purchase it on their own. The introduction of PPACA encourages employers to provide coverage to workers and eases access to coverage for the poor and the unhealthy.
Sources of health care funds for government programs include payroll and income taxes. Private plans are funded with direct contributions from employees and employers as well as deductibles and copayments. Furthermore, governments indirectly contribute to the cost of private group plans through favorable tax treatment. Similarly, the government allows full tax shelter at the highest marginal rate to investors in health savings accounts (HSAs). Finally, PPACA brings new sources of funds, a variety of taxes, fees and cost-savings measures, such as new Medicare taxes for high-income brackets, taxes on indoor tanning, cuts to the Medicare Advantage program in favor of traditional Medicare, and fees on medical devices and pharmaceutical companies. There is also a tax penalty for citizens who do not purchase or enroll in a health insurance program (unless they are exempt due to low income or other reasons).
98 U.S. Census Bureau, 2010. There is some overlap in these figures.