4q 2020 aig financial results presentation
TRANSCRIPT

Fourth Quarter and Full Year 2020Financial Results Presentation
February 17, 2021

This document and the remarks made within this presentation may include, and officers and representatives of American International Group, Inc. (AIG) may from time to time make and discuss, projections, goals, assumptions and statements that may constitute “forward-looking statements” within the meaning of the Private Securities Litigation Reform Act of 1995. These projections, goals, assumptions and statements are not historical facts but instead represent only a belief regarding future events, many of which, by their nature, are inherently uncertain and outside AIG’s control. These projections, goals, assumptions and statements include statements preceded by, followed by or including words such as “will,” “believe,” “anticipate,” “expect,” “intend,” “plan,” “focused on achieving,” “view,” “target,” “goal” or “estimate.” These projections, goals, assumptions and statements may relate to future actions, prospective services or products, future performance or results of current and anticipated services or products, sales efforts, expenses, the outcome of contingencies such as legal proceedings, anticipated organizational, business or regulatory changes, the effect of catastrophes, such as the COVID-19 crisis, and macroeconomic events, anticipated dispositions, monetization and/or acquisitions of businesses or assets, or successful integration of acquired businesses, management succession and retention plans, exposure to risk, trends in operations and financial results. It is possible that AIG’s actual results and financial condition will differ, possibly materially, from the results and financial condition indicated in these projections, goals, assumptions and statements. Factors that could cause AIG’s actual results to differ, possibly materially, from those in the specific projections, goals, assumptions and statements include: the adverse impact of COVID-19, including with respect to AIG’s business, financial condition and results of operations; changes in market and industry conditions, including the significant global economic downturn, volatility in financial and capital markets, prolonged economic recovery and disruptions to AIG’s operations driven by COVID-19 and responses thereto, including new or changed governmental policy and regulatory actions; the occurrence of catastrophic events, both natural and man-made, including COVID-19, other pandemics, civil unrest and the effects of climate change; AIG’s ability to successfully dispose of, monetize and/or acquire businesses or assets or successfully integrate acquired businesses, including any separation of the Life and Retirement business from AIG and the impact any separation may have on AIG, its businesses, employees, contracts and customers; AIG’s ability to effectively execute on AIG 200 transformational programs designed to achieve underwriting excellence, modernization of AIG’s operating infrastructure, enhanced user and customer experiences and unification of AIG; the impact of potential information technology, cybersecurity or data security breaches, including as a result of cyber-attacks or security vulnerabilities, the likelihood of which may increase due to extended remote business operations as a result of COVID-19; disruptions in the availability of AIG’s electronic data systems or those of third parties; availability and affordability of reinsurance; the effectiveness of our risk management policies and procedures, including with respect to our business continuity and disaster recovery plans; nonperformance or defaults by counterparties, including Fortitude Reinsurance Company Ltd. (Fortitude Re); changes in judgments concerning potential cost-saving opportunities; concentrations in AIG’s investment portfolios; changes to the valuation of AIG’s investments; changes to our sources of or access to liquidity; actions by rating agencies with respect to our credit and financial strength ratings; changes in judgments or assumptions concerning insurance underwriting and insurance liabilities; the effectiveness of strategies to recruit and retain key personnel and to implement effective succession plans; the requirements, which may change from time to time, of the global regulatory framework to which AIG is subject; significant legal, regulatory or governmental proceedings; changes in judgments concerning the recognition of deferred tax assets and the impairment of goodwill; and such other factors discussed in Part II, Item 7. Management’s Discussion and Analysis of Financial Condition and Results of Operations (MD&A) and Part I, Item 1A. Risk Factors in AIG’s Annual Report on Form 10-K for the year ended December 31, 2020 (which will be filed with the Securities and Exchange Commission), Part I, Item 2. MD&A in AIG’s Quarterly Report on Form 10-Q for the quarterly period ended September 30, 2020, Part I, Item 2. MD&A in AIG’s Quarterly Report on Form 10-Q for the quarterly period ended June 30, 2020, Part I, Item 2. MD&A in AIG’s Quarterly Report on Form 10-Q for the quarterly period ended March 31, 2020, and Part II, Item 7. MD&A and Part I, Item 1A. Risk Factors in AIG’s Annual Report on Form 10-K for the year ended December 31, 2019.
On October 26, 2020, AIG announced its intention to separate the Life and Retirement business from AIG. This document and the remarks made within this presentation are not an offer to sell, or a solicitation of an offer to buy any securities.
AIG is not under any obligation (and expressly disclaims any obligation) to update or alter any projections, goals, assumptions or other statements, whether written or oral, that may be made from time to time, whether as a result of new information, future events or otherwise.
This document and the remarks made orally may also contain certain financial measures not calculated in accordance with generally accepted accounting principles (non-GAAP). The reconciliation of such measures to the most comparable GAAP measures in accordance with Regulation G is included in the earnings release and Fourth Quarter 2020 Financial Supplement available in the Investor Information section of AIG's corporate website, www.aig.com, as well as in the Appendix to this presentation.
Note: Amounts presented may not foot due to rounding.
Cautionary Statement Regarding Forward-Looking Information, Comment on Regulation G and Other Information
2

* Refers to financial measure not calculated in accordance with generally accepted accounting principles (Non-GAAP); definitions and abbreviations of Non-GAAP measures and reconciliations to their closest GAAP measures can be found in this presentation under the heading Glossary of Non-GAAP Financial Measures and Non-GAAP Reconciliations.
4Q20 and FY’20 APTI reflect continued improvement in General Insurance accident year, as adjusted*, underwriting profitability and strong Life and Retirement APTI
3
4Q20Financial Results
Adjusted after-tax income attributable to AIG common shareholders (AATI)* of $827M ($0.94 per diluted common share) and adjusted pre-tax income (APTI)* of $1.1B reflecting: − Improvement in the General Insurance accident year combined ratio (AYCR), as adjusted*, by 2.9 pts driven by North
America and International Commercial Lines and International Personal Insurance− Increased Life and Retirement APTI with strong net investment income (NII) driving improved APTI in Individual and
Group Retirement and Institutional Markets− Lower NII, APTI basis*, primarily driven by the sale of Fortitude Group Holdings LLC (Fortitude) on June 2, 2020;
Excluding the impact of Fortitude in 4Q19, NII, APTI basis*, increased $262M primarily reflecting higher private equity and hedge fund returns
Net loss attributable to AIG common shareholders of $60M ($0.07 per common share) reflects $1.2B of after-tax net realized capital losses, principally from the non-economic impact of the non-performance risk adjustment on the fair value of variable annuity embedded derivatives, net of hedges, and from losses on other derivatives and hedges
Return on Common Equity (ROCE) and Adjusted ROCE* were (0.4)% and 6.7%, respectively, for 4Q20, annualized Book value per common share was $76.46, an increase of 3.5% compared to September 30, 2020; Adjusted book value
per common share* was $57.01, an increase of 0.4% from September 30, 2020
FY’20Financial Results
AATI of $2.2B ($2.52 per diluted common share) and APTI of $3.0B reflecting:− Improvement in the General Insurance AYCR, as adjusted, by 1.9 pts driven by North America and International
Commercial Lines and International Personal Insurance− Life and Retirement APTI of $3.5B despite COVID-19 mortality and base spread compression, driven by strong equity
market performance and higher call and tender income− $2.4B of catastrophe losses, net of reinsurance, (CATs) in General Insurance including $1.3B of non-COVID-19 CATs
from windstorms and hailstorms, wildfires, civil unrest and other events, and $1.1B of COVID-19 CATs, primarily in Commercial Property, Validus Re, Contingency and Travel
− Lower FY’20 NII, APTI basis, primarily driven by the sale of Fortitude, lower fair value option (FVO) bond income, and yield compression on available for sale securities
Net loss attributable to AIG common shareholders of $6.0B ($6.88 per common share) primarily driven by a $6.7B after-tax loss from the sale and deconsolidation of Fortitude in 2Q20. The sale, for which AIG received $2.2B in consideration at closing, improved AIG’s risk profile and reduced exposure to long-tail runoff liabilities and related interest rate risk
ROCE and Adjusted ROCE were (9.4)% and 4.4%, respectively, for FY’20

* Refers to financial measure not calculated in accordance with generally accepted accounting principles (Non-GAAP); definitions and abbreviations of Non-GAAP measures and reconciliations to their closest GAAP measures can be found in this presentation under the heading Glossary of Non-GAAP Financial Measures and Non-GAAP Reconciliations.1) Hybrids and financial debt values include changes in foreign exchange.2) Includes AIG notes, bonds, loans and mortgages payable, AIG Life Holdings, Inc. (AIGLH) notes and bonds payable and junior subordinated debt, and Validus notes and bonds payable.3) December 31, 2020 AOCI is computed as GAAP AOCI of $13.5B excluding $4.7B of cumulative unrealized gains and losses related to Fortitude Re’s funds withheld assets; September 30, 2020 AOCI is computed as GAAP
AOCI of $11.0B excluding $4.4B of cumulative unrealized gains and losses related to Fortitude Re’s funds withheld assets.4) The inclusion of RBC measures is intended solely for the information of investors and is not intended for the purpose of ranking any insurance company or for use in connection with any marketing, advertising or promotional
activities. ACL is defined as Authorized Control Level and CAL is defined as Company Action Level. RBC ratio for Domestic Life and Retirement companies excludes holding company, AGC Life Insurance Company. 5) Preliminary range subject to change with completion of statutory closing process.6) As of the date of this presentation: S&P Outlook: CreditWatch Negative, with the exception of the Life Insurance Companies, which is CreditWatch Developing; Moody's Outlook: Stable, with the exception of AIG Sr. Debt, On
review for downgrade; Fitch Outlook: Stable, Non-Life Companies; Negative, Life Insurance Companies; Rating Watch Negative, AIG Sr. Debt; A.M. Best Outlook: Stable. For General Insurance companies FSR and Life and Retirement companies FSR, ratings only reflect those of the core insurance companies.
Financial flexibility remains robust with strong balance sheet and lower leverage; Total debt & preferred stock leverage of 28.4% reflects $708M debt repayment in December 2020; $1.5B senior notes redeemed in February 2021
$48.9 $49.1
$8.1 $7.9 $0.5 $0.5 $6.6 $8.9
$0.5 $0.8
$25.0 $24.4
$1.5 $1.6
September 30, 2020 December 31, 2020
Hybrids
Financial Debt
NCI
AOCI
Preferred Equity
Tax Attribute DTA
Adjusted S/E
Ratios: Sept. 30,2020
Dec. 31,2020
Hybrids / Total capital 1.7% 1.7%Financial debt / Total capital (incl. AOCI) 27.4% 26.2%Total Hybrids & Financial debt / Total capital 29.1% 27.9%Preferred stock / Total capital (incl. AOCI) 0.5% 0.5%Total debt and preferred stock / Total capital (incl. AOCI) 29.6% 28.4%
Total debt and preferred stock / Total capital (ex. AOCI)2* 32.0% 31.4%
Capital Structure ($B)
Year Life and RetirementCompanies
General Insurance Companies
2019 402% (CAL) 419% (ACL)
2020Estimated5 425% - 435% (CAL) 450% - 460% (ACL)
Risk Based Capital (RBC) Ratios4
Credit Ratings6
S&P Moody’s Fitch A.M. Best
AIG – Senior Debt BBB+ Baa1 BBB+ NR
General Insurance – FSR A+ A2 A A
Life and Retirement – FSR A+ A2 A+ A
1,2
$91.1 $93.2
Total Equity:$64.6
Total Equity:$67.2
3
Pending finalization of Statutory financials
4
1

Financial Detail
5
Fourth Quarter 2020

1) Other Operations is primarily comprised of corporate, our institutional asset management business and consolidation and eliminations.
Key Takeaways
General Insurance APTI increased by $31M primarily due to:
‒ 2.9 pt improvement in AYCR, as adjusted, and
‒ $214M increase in NII, APTI basis, reflecting higher alternative investment income;
‒ partially offset by $134M increase in CATs primarily due to higher non-COVID-19 CATs and the ongoing impact of COVID-19 CATs related to Travel, Contingency and Validus Reinsurance, Ltd., and
‒ 3.1 pt decrease in prior year development, net of reinsurance, (PYD) ratio reflecting unfavorable PYD in 4Q20 compared to favorable PYD in 4Q19; 4Q19 included favorable PYD from California wildfire subrogation recoverables
Life and Retirement APTI increased $169M reflecting higher NII driven by private equity returns, which are reported on a one quarter lag, and higher call and tender income due to favorable impacts from lower interest rates and tighter credit spreads as well as lower general operating expenses (GOE). The increase in APTI was partially offset by base spread compression and, in Life Insurance, impacts from COVID-19 mortality claims
Other Operations adjusted pre-tax loss (APTL) was $720M, including $292M of reductions from consolidation and eliminations, compared to APTL of $425M, including $134M of reductions from consolidation and eliminations, in the prior year quarter. The increase in APTL in consolidation and eliminations reflects the impact of consolidated investment entities. Before consolidation and eliminations, the increase in APTL was primarily due to lower NII associated with available for sale securities; the sale of Fortitude in 2Q20, which had APTI of $70M in 4Q19; and increased interest expense related to debt issuances in 2Q20
($M, except per common share amounts) 4Q19 4Q20 Variances
Adjusted pre-tax income (loss):
General Insurance $778 $809 $31
Life and Retirement 858 1,027 169
Other Operations1 (425) (720) (295)
Total adjusted pre-tax income $1,211 $1,116 ($95)
AATI attributable to AIG common shareholders $923 $827 ($96)
AATI per diluted share attributable to AIG common shareholders $1.03 $0.94 ($0.09)
Net income (loss) attributable to AIG common shareholders $922 ($60) ($982)
Consolidated adjusted ROCE 7.3% 6.7% (0.6) pts
General Insurance underwriting ratios: B / (W)
Loss ratio 65.6% 70.2% (4.6) pts
Less: impact on loss ratio
Catastrophe losses and reinstatement premiums (6.5%) (9.0%) (2.5) ptsPrior year development 2.2% (0.9%) (3.1) pts
Adjustments for ceded premium under reinsurance contracts and other 0.3% 0.0% (0.3) pts
Accident year loss ratio, as adjusted 61.6% 60.3% 1.3 pts
Expense ratio 34.2% 32.6% 1.6 pts
Accident year combined ratio, as adjusted 95.8% 92.9% 2.9 pts
Calendar year combined ratio 99.8% 102.8% (3.0) pts
APTI of $1.1B reflects continued improvement in Commercial Lines AYCR, as adjusted, strong Life and Retirement results reflecting higher NII, APTI basis
6

$2,662
$3,287
$46
$547
$2,063
$2,060
$553
$680
$855
$288
$110
$64
$293
$100
$452
$124
$145
$197
$32
$116
$79
$67
$34
$14
($285)
($209)
4Q20
4Q19
4Q20
4Q19
4Q20
4Q19
4Q20
4Q19Interest & dividends
Alternativeinvestments
All other
Consolidation andeliminations andother adjustments
Gross investment income (GII), APTI basis1*, decreased $186M reflecting the June 2020 sale of Fortitude; Excluding Fortitude from 4Q19, GII, APTI basis, increased $324M reflecting higher private equity and hedge fund returns
Invested Assets & Gross Investment Income, APTI Basis1
Gross Investment Income, APTI basis1 ($M)
4Q20 and 4Q19 Annualized Investment Yields
3.72%
4.70% 4.49%
2.91%
4.41%3.89%
GeneralInsurance
Life &Retirement
Consolidated AIG
4Q19 4Q20
4Q20 Invested Assets$B Fixed Maturities Alternatives All Other
GeneralInsurance $75.9 $5.3 $2.8
Life &Retirement $187.3 $3.9 $4.4
Other Operations1 $10.1 ($1.2) $7.4
Total AIG $273.3 $8.0 $14.6
$818
$1,039
$2,227
$2,435
$727
$188
$3,563
$3,377
8.90% 15.39% 13.26%
35.33% 31.60%
45.34%
GeneralInsurance
Life &Retirement
Consolidated AIG
Total Alternative Investments
3.92% 6.12%
46.54%
27.12%
Hedge Funds Private Equity
Consolidated AIG Hedge Funds & Private Equity
Fixed Maturities2 Alternative Investments3
4Q19
4Q20
4Q19
4Q20
4Q19
4Q20
4Q19
4Q20
* Refers to financial measure not calculated in accordance with generally accepted accounting principles (Non-GAAP); definitions and abbreviations of Non-GAAP measures and reconciliations to their closest GAAP measures can be found in this presentation under the heading Glossary of Non-GAAP Financial Measures and Non-GAAP Reconciliations.1) 4Q19 includes GII of $510M ($498M on a net basis) related to investment income on Fortitude assets. Excluding Fortitude, 4Q19 GII, APTI basis, is $3,053M and NII, APTI basis, is $2,964M.2) Interest and dividends include amounts related to commercial mortgage loan prepayments and call and tender income; Life and Retirement annualized yields include yield on collateral related to hedging program.3) Alternative investment income includes income on hedge funds, private equity funds and affordable housing partnerships.
7
4Q19 4Q20

AIG’s corporate debt investment portfolio is well diversified by industry sector; credit quality remains strong with limited ratings downgrades in 4Q20
Note: Amounts shown for segments are before consolidation and eliminations.1) Asset balances exclude Fortitude Re Funds Withheld Assets.2) Other Operations by industry sector breakout is not shown due to scale.
Fixed Maturity Securities by NAIC DesignationDecember 31, 2020 – $240.5B1
NAIC 161%
NAIC 231%
NAIC 3-68%
Fair value of total Fixed Maturity securities increased 2%
since September 30, 2020 $10.7
$27.4
$2.5 $1.9
$16.1
$1.6
$7.2
$3.8
$16.5
$2.8
$8.4
$1.4
$6.1
$1.5
$9.6
$0.9
$3.9
$3.4
$16.7
General Insurance Life andRetirement
Other Operations
Other
Basic materials
Energy
Capital goods
Consumer cyclical
Consumer noncyclical
Communications
Utilities
Financial institutions
Corporate Debt by Industry SectorDecember 31, 2020 – $142.0B1
$28.0
$111.9
8
2

4Q19 and 4Q20 noteworthy items
1) Computed using a U.S. statutory tax rate of 21%.2) Computed using weighted average diluted shares on an operating basis, which is provided on page 6 of the 4Q20 Financial Supplement.3) The annualized expected rate of return for 4Q19 and 4Q20 is 8% and 6% for alternative investments and 6% and 4% for FVO fixed maturity securities, respectively. 4) Alternative investment returns reflect General Insurance and Life and Retirement alternative investment income only and exclude Other Operations, which includes the
impact of consolidation and eliminations. On an AIG consolidated basis, better than expected alternative investment returns were $37M, pre-tax, in 4Q19 and $491M, pre-tax, in 4Q20.
4Q19 – Income / (Loss) 4Q20 – Income / (Loss)
($M, except per share amounts) Pre-tax After-tax1 EPS –diluted2 Pre-tax After-tax1 EPS –
diluted2
CATs excluding General Insurance COVID-19 CATs ($413) ($326) ($0.36) ($377) ($298) ($0.34)
General Insurance COVID-19 CATs - - - (178) (141) (0.16)
Favorable/(unfavorable) PYD 153 121 0.13 (49) (39) (0.04)
Investment performance:
Better than expected alternative investment returns3,4 59 47 0.05 613 484 0.56
Better than expected fair value changes on fixed maturity securities – other accounted under FVO3 29 23 0.03 41 32 0.04
Total noteworthy items – APTI basis ($172) ($136) ($0.15) $50 $40 $0.05
9
$824 $369
$1,637
$1,542
4Q19 4Q20
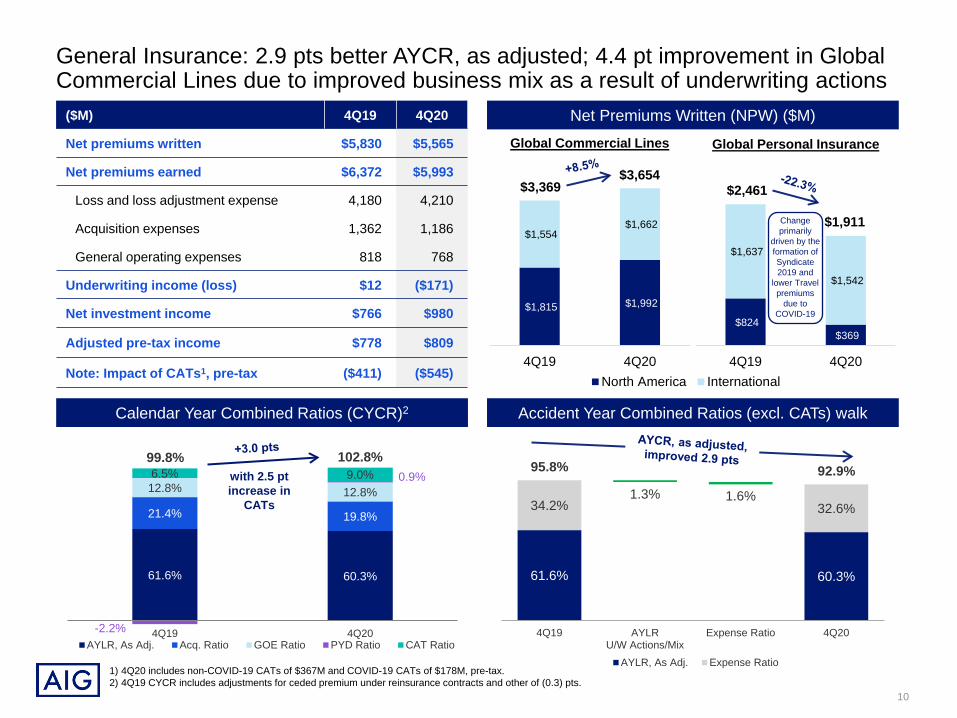
61.6% 60.3%
34.2% 32.6%
95.8% 92.9%1.3% 1.6%
4Q19 AYLRU/W Actions/Mix
Expense Ratio 4Q20
AYLR, As Adj. Expense Ratio
61.6% 60.3%
21.4% 19.8%
12.8% 12.8%
-2.2%
0.9%6.5% 9.0%
4Q19 4Q20AYLR, As Adj. Acq. Ratio GOE Ratio PYD Ratio CAT Ratio
1) 4Q20 includes non-COVID-19 CATs of $367M and COVID-19 CATs of $178M, pre-tax.2) 4Q19 CYCR includes adjustments for ceded premium under reinsurance contracts and other of (0.3) pts.
General Insurance: 2.9 pts better AYCR, as adjusted; 4.4 pt improvement in Global Commercial Lines due to improved business mix as a result of underwriting actions
Net Premiums Written (NPW) ($M)
Calendar Year Combined Ratios (CYCR)2 Accident Year Combined Ratios (excl. CATs) walk
99.8%
($M) 4Q19 4Q20
Net premiums written $5,830 $5,565
Net premiums earned $6,372 $5,993
Loss and loss adjustment expense 4,180 4,210
Acquisition expenses 1,362 1,186
General operating expenses 818 768
Underwriting income (loss) $12 ($171)
Net investment income $766 $980
Adjusted pre-tax income $778 $809
Note: Impact of CATs1, pre-tax ($411) ($545)
with 2.5 pt increase in
CATs
10
102.8%
Change primarily
driven by the formation of Syndicate 2019 and
lower Travel premiums
due to COVID-19
$1,815 $1,992
$1,554 $1,662
4Q19 4Q20
$3,369$3,654
$2,461
$1,911
North America International
Global Commercial Lines Global Personal Insurance

General Insurance: 4.0 pt improvement in North America Commercial Lines AYCR, as adjusted; Personal Insurance impacted by Travel and Syndicate 2019
Key Takeaways: North America (NA) Commercial Lines NPW grew 10% from the prior year quarter
reflecting strong rate momentum, improved retention and higher writings in AIG Re. NA Personal Insurance NPW decreased as a result of cessions pursuant to a series of quota share reinsurance agreements placed in 2Q20 to form Syndicate 2019 and the adverse impact of COVID-19 on the Travel business
NA Commercial Lines AYCR, as adjusted, improved 4.0 pts reflecting improved business mix and rate increases, as well as expense discipline
NA Personal Insurance AYCR, as adjusted, increased 10.4 pts due to impact on the loss ratio from the change in business mix driven by a series of quota share reinsurance agreements as described above and the adverse impact of COVID-19 on Travel. The GOE ratio was also impacted negatively by the reduction in net premiums earned, offset slightly by a lower acquisition ratio
CATs of $477M; $371M related to non-COVID-19 CATs and $106M related to COVID-19 CATs
Unfavorable PYD of $51M with $26M in Commercial Lines and $25M in Personal Insurance; PYD includes $52M of favorable amortization from the ADC
($M) 4Q19 4Q20
Net premiums written $2,639 $2,361
Commercial Lines 1,815 1,992
Personal Insurance 824 369
Net premiums earned $2,948 $2,603
Commercial Lines 2,141 2,289
Personal Insurance 807 314
Underwriting loss ($96) ($389)
Commercial Lines (188) (285)
Personal Insurance 92 (104)
Note: Impact of CATs, pre-tax ($313) ($477)
North America Combined Ratios1
66.9% 68.7%
19.1% 15.6%10.1% 10.4%
4Q19 4Q20CAT RatioCYCR PYD Ratio Acquisition Ratio AYLR, As adjustedGOE RatioAYCR, As adjusted
73.5% 70.5%
13.5% 14.0%10.6% 9.1%
4Q19 4Q20
49.3% 55.4%
34.0% 27.1%8.9% 20.1%
4Q19 4Q20
96.1%
103.2%10.4%
(2.6%)
94.7%
114.9%
18.0%
2.2%
Total
97.6%
108.8%8.7%
3.2%
93.6%
112.4%
17.4%
1.4%
Commercial Lines
92.2%
88.6%14.8%
(17.8%)102.6%
133.2%22.6%8.0%
Personal Insurance
AYLR, as adjusted,improved
3.0 pts
AYCR, as adjusted,improved
4.0 pts
111) 4Q19 CYCR includes adjustments for ceded premium under reinsurance contracts and other of (0.7) pts, (0.7) pts, and (0.6) pts in Total North America, North America
Commercial Lines, and North America Personal Insurance, respectively.
AYCR, as adjusted,improved
1.4 pts
Change primarily
driven by the formation of Syndicate 2019 and
lower Travel premiums due to COVID-19

General Insurance: Strong 3.9 pt improvement in International AYCR, as adjusted, due to improved business mix along with rate increases
Key Takeaways:
International Commercial Lines NPW grew 7% from the prior year quarter reflecting strong rate momentum and improving retention across most lines. International Personal Insurance NPW decreased due to the impact from COVID-19 on the Travel business
International Commercial Lines AYCR, as adjusted, improved 4.9 pts due to enhanced risk selection along with rate increases
International Personal Insurance AYCR, as adjusted, improved 2.9 pts reflecting lower claims frequency and changes in business mix
CATs of $68M; ($4M) CAT recovery related to non-COVID-19 CATs and $72M related to COVID-19 CATs
Favorable PYD of $6M driven by $21M favorable PYD in Commercial Lines offset by $15M unfavorable PYD in Personal Insurance
($M) 4Q19 4Q20Net premiums written $3,191 $3,204 Commercial Lines 1,554 1,662 Personal Insurance 1,637 1,542 Net premiums earned $3,424 $3,390 Commercial Lines 1,720 1,771 Personal Insurance 1,704 1,619 Underwriting income $108 $218 Commercial Lines 52 138 Personal Insurance 56 80 Note: Impact of CATs, pre-tax ($98) ($68)
57.1% 54.0%
23.3% 23.0%
15.2% 14.7%
4Q19 4Q20CAT RatioCYCR PYD Ratio Acquisition Ratio AYLR, As adjustedGOE RatioAYCR, As adjusted
95.6%
96.9%3.2%
(1.9%)
91.7%
93.6%
2.1%
(0.2%)
AYLR, as adjusted,improved
3.1 pts
AYCR, as adjusted,improved
3.9 pts
59.4% 55.9%
20.3% 19.4%
14.4% 13.9%
4Q19 4Q20
54.7% 51.8%
26.3% 26.9%
16.0% 15.4%
4Q19 4Q20
94.1%
96.9%3.0%
(0.2%)
89.2%
92.1%
4.0%
(1.1%)97.0%
96.8%3.3%
(3.5%)
94.1%
95.0%-
0.9%
Total Commercial Lines Personal Insurance
International Combined Ratios
AYLR, as adjusted,improved
3.5 pts
AYCR, as adjusted,improved
4.9 pts
AYLR, as adjusted,improved
2.9 pts
AYCR, as adjusted,improved
2.9 pts
12

$3,156 $2,758
$2,312 $2,199
$1,106 $1,156$551 $1,287
$7,125 $7,400
4Q19 4Q20Individual Retirement Group RetirementLife Insurance Institutional Markets
$500 $552
$209 $318 $67 $30 $82
$127 $858 $1,027
4Q19 4Q20Individual Retirement Group RetirementLife Insurance Institutional Markets
4Q19 4Q20 Variance
Return on adjusted segment common equity (Annualized)
14.6% 16.4% 1.8%
Noteworthy Items ($M) 4Q19 4Q20 Variance
Return on alternative investments 101$ 293$ 192$
Other yield enhancements 93$ 206$ 113$ Includes:
Fair value changes on Fixed Maturity Securities - Other accounted under FVO 16$ 19$ 3$
All other yield enhancements 77$ 187$ 110$
13
Life and Retirement: Strong increase in APTI compared to 4Q19 driven by higher NII and lower GOE, partially offset by base spread compression and COVID-19 mortality
Adjusted Pre-Tax Income (APTI) ($M)
Premiums and Deposits ($M)
Key Takeaways 4Q20 APTI reflects higher NII, APTI basis, driven by private equity
returns, which are reported on a one quarter lag, and favorable impacts from lower interest rates and tighter credit spreads resulting in higher call and tender income; and lower GOE. The increase in APTI was partially offset by base spread compression and, in Life Insurance, impacts from COVID-19 mortality claims
Favorable GOE reflects AIG 200 efficiencies and other cost savings as a result of COVID-19
Premiums and deposits rose 4% benefitting from strong GIC1
demand in Institutional Markets, while Individual and Group Retirement continue to recover from the broad industry sales channel disruptions resulting from COVID-19 and headwinds from low interest rates
Noteworthy Items ($M, unless noted)+4%
1) GIC is defined as Guaranteed Investment Contracts.

14
Life and Retirement: Individual and Group Retirement APTI up 10% and 52%, respectively, driven by strong equity markets and favorable impacts from lower interest rates and tighter credit spreads, partially offset by base spread compression
Individual Retirement*
Group Retirement
Base Net Investment Spreads Total Net Investment Spreads
Base Net Investment Spreads Total Net Investment Spreads
Premiums and Deposits ($M)
Net Flows ($M)
Assets Under Administration
($B)APTI ($M)
$2,758 ($878) $ 163.4 $552(-13% vs. 4Q19) (+5% vs. 4Q19) (+10% vs. 4Q19)
1.75%
2.89%
1.43%
2.55%
1.40%
2.59%
Fixed Annuities Variable and IndexAnnuities
4Q19 3Q20 4Q20
2.02%
3.31%
2.19%
3.28%
2.28%
3.44%
Fixed Annuities Variable and IndexAnnuities
4Q19 3Q20 4Q20
1.78%
1.55% 1.54%
4Q19 3Q20 4Q20
1.97% 2.18% 2.43%
4Q19 3Q20 4Q20
Premiums and Deposits ($M)
Net Flows ($M)
Assets Under Administration
($B)APTI ($M)
$2,199 ($153) $ 130.1 $318(-5% vs. 4Q19) (+10% vs. 4Q19) (+52% vs. 4Q19)
* Includes Retail Mutual Funds
4Q20 vs 4Q19 APTI results reflect
Favorable impacts from:
Equity markets resulting in higher fees and favorable alternatives, mainly from private equity returns
Lower interest rates and tighter credit spreads Total investment spreads
Unfavorable impacts from:
Base spread compression
Other Key Metrics
Favorable impacts from:
Net flows Assets under administration growth
Key Takeaways
Key Takeaways
4Q20 vs 4Q19 APTI results reflect
Favorable impacts from:
Equity markets resulting in higher fees, lower DAC amortization and favorable alternatives, mainly from private equity returns
Lower interest rates and tighter credit spreads Lower GOE Total investment spreads
Unfavorable impacts from:
Base spread compression
Other Key Metrics
Favorable impacts from
Net flows Assets under administration growth

$3.2 $3.6
$5.9 $8.2
$5.0
$5.1 $2.1
$2.2 $0.6
$0.1 $6.7
$8.1 $23.6
$27.3
4Q19 4Q20
15
Life and Retirement: Life Insurance APTI reflects COVID-19 mortality impact, offset in part by strong private equity returns and favorable impacts from lower interest rates and tighter credit spreads; Institutional Markets APTI reflects strong private equity returns and growth in reserves
Life Insurance
Institutional Markets
Definitions: GIC = Guaranteed Investment Contracts | SVW = Stable Value Wrap | COLI/BOLI = Corporate and Bank-owned life insurance | PRT = Pension Risk Transfer | PPVUL/PPVA = Private placement variable life and annuities
Premiums and Deposits ($M) GAAP Reserves ($B)
($M)
$104(-5% vs. 4Q19)
Domestic US 65%
International 35%
$1,156(+5% vs. 4Q19)
$30(-55% vs. 4Q19)
New Business Sales
Premiums and Deposits
APTI
($M)
APTI $127 (+55% vs. 4Q19)
$94 $64
$450 $369
$0 $6 $4
$1
$850
$551
$1,287
4Q19 4Q20
Key Takeaways
Key Takeaways
4Q20 vs 4Q19 APTI results reflectFavorable impacts from: Equity markets returns from favorable alternatives, mainly higher private
equity returns Lower interest rates and tighter credit spreads Lower GOEUnfavorable impacts from: Mortality, driven by COVID-19 Lower reinvestment ratesOther Key MetricsUnfavorable impacts from: New business sales impact on APTI
4Q20 vs 4Q19 APTI results reflect
Favorable impacts from:
Equity markets returns from favorable alternatives, mainly higher private equity returns
Higher base investment income, growth in reserves
Other Key Metrics
Favorable impacts from:
Growth in reserves, including 4Q20 GIC issuance

Other Operations: APTL increased principally due to higher consolidation and eliminations from consolidated investment entities, the sale of Fortitude in 2Q20, as well as higher interest expense from May 2020 bond issuance
Key Takeaways:
Fourth quarter APTL was $720M, including $292M of reductions from consolidation and eliminations, compared to APTL of $425M, including $134M of reductions from consolidation and eliminations, in the prior year quarter. The increase in consolidation and eliminations from 4Q19 reflects the impact of consolidated investment entities
Before consolidation and eliminations, the increase in APTL was primarily due to lower NII associated with available for sale securities; the sale of Fortitude in 2Q20, which had APTI of $70M in 4Q19; and increased interest expense related to debt issuances in 2Q20
($M) 4Q19 4Q20Corporate and Other ($301) ($519)
Asset Management 10 91
Adjusted pre-tax loss before consolidation and eliminations ($291) ($428)Consolidation and eliminations:
Consolidation and eliminations – Consolidated investment entities (126) (285)
Consolidation and eliminations – Other (8) (7)
Total Consolidation and eliminations (134) (292)
Adjusted pre-tax loss ($425) ($720)
16

Financial Detail
17
Full Year 2020

1) Other Operations is primarily comprised of corporate, our institutional asset management business and consolidation and eliminations.
Key Takeaways
General Insurance APTI decreased by $1.6B from FY’19 primarily due to:
‒ $1.2B increase in CATs including $1.1B of COVID-19 CATs,
‒ $0.5B decrease in NII, APTI basis, and
‒ 1.0 pt decrease in favorable PYD ratio reflecting lower favorable PYD in FY’20 compared to FY’19;
‒ partially offset by 1.9 pt improvement in AYCR, as adjusted
Life and Retirement APTI was nearly flat; results reflect the impact of COVID-19 mortality, base spread compression and lower FVO bond income, almost entirely offset by higher private equity returns and favorable impacts from lower interest rates and tighter credit spreads resulting in higher call and tender income
Other Operations APTL was $2.4B, including $0.5B of reductions from consolidation and eliminations, compared to $1.6B, including $0.3B of reductions from consolidation and eliminations, in the prior year quarter. The increase in consolidation and eliminations reflects the impact of consolidated investment entities. Before consolidation and eliminations, the increase in the pre-tax loss was primarily due to the sale of Fortitude in 2Q20, lower NII associated with available for sale securities (excluding Fortitude), and increased interest expense related to debt issuances in 2Q20
($M, except per common share amounts) FY’19 FY’20 VariancesAdjusted pre-tax income (loss):General Insurance $3,533 $1,901 ($1,632)
Life and Retirement 3,553 3,531 (22)
Other Operations1 (1,616) (2,429) (813)
Total adjusted pre-tax income $5,470 $3,003 ($2,467)AATI attributable to AIG common shareholders $4,078 $2,201 ($1,877)
AATI per diluted share attributable to AIG common shareholders $4.58 $2.52 ($2.06)
Net income (loss) attributable to AIG common shareholders $3,326 ($5,973) ($9,299)
Consolidated adjusted ROCE 8.3% 4.4% (3.9) ptsGeneral Insurance underwriting ratios: B / (W)Loss ratio 65.2% 71.0% (5.8) pts
Less: impact on loss ratioCatastrophe losses and reinstatement premiums (4.8%) (10.3%) (5.5) ptsPrior year development 1.1% 0.1% (1.0) pts
Adjustments for ceded premium under reinsurance contracts and other 0.1% 0.0% (0.1) pts
Accident year loss ratio, as adjusted 61.6% 60.8% 0.8 ptsExpense ratio 34.4% 33.3% 1.1 pts
Accident year combined ratio, as adjusted 96.0% 94.1% 1.9 ptsCalendar year combined ratio 99.6% 104.3% (4.7) pts
FY’20 APTI of $3.0B reflects higher CATs, including COVID-19, and lower NII than the prior year; General Insurance AYCR, as adjusted, improved 1.9 pts; Life and Retirement APTI nearly flat
18

$11,536
$12,926
$907
$1,959
$8,239
$8,125
$2,390
$2,842
$1,262
$1,363
$76
$251
$591
$415
$595
$697
$636
$1,011
$100
$386
$348
$518
$188
$107
($571)
($543)
Interest & dividends
Alternativeinvestments
All other
Consolidation andeliminations andother adjustments
GII, APTI basis1, decrease of $1.9B reflects the June 2020 Fortitude sale, lower FVO bond income, and yield compression on available for sale securities
Invested Assets & Gross Investment Income, APTI Basis1
Gross Investment Income, APTI basis1 ($M)
FY’20 and FY’19 Annualized Investment Yields
3.80%4.81% 4.50%
3.18%
4.49% 4.08%
GeneralInsurance
Life &Retirement
Consolidated AIG
FY'19 FY'20
FY'20 Invested Assets$B Fixed Maturities Alternatives All Other
GeneralInsurance $75.9 $5.3 $2.8
Life &Retirement $187.3 $3.9 $4.4
Other Operations1 $10.1 ($1.2) $7.4
Total AIG $273.3 $8.0 $14.6
$3,646
$3,173
$9,058
$9,178
$2,596
$1,083
$14,757
$12,863
11.82%
16.94% 15.65%
11.86%
18.62% 16.29%
GeneralInsurance
Life &Retirement
Consolidated AIG
Total Alternative Investments
14.04% 15.47% 14.14%
9.81%
Hedge Funds Private Equity
Consolidated AIG Hedge Funds & Private Equity
Fixed Maturities2 Alternative Investments3
FY'19
FY'20
FY'19
FY'20
FY'19
FY'20
FY'19
FY'20
1) FY’20 and FY'19 includes GII $521M ($499M on a net basis) and $2.0B ($1.9B on a net basis), respectively, related to investment income on Fortitude assets. Excluding Fortitude, FY’20 and FY’19 GII, APTI basis, is $12,342M and $12,806M, respectively, and NII, APTI basis, is $11,822M and $12,490M, respectively.
2) Interest and dividends include amounts related to commercial mortgage loan prepayments and call and tender income; Life and Retirement annualized yields include yield on collateral related to hedging program.
3) Alternative investment income includes income on hedge funds, private equity funds and affordable housing partnerships.19
FY'19 FY'20

FY’19 and FY’20 noteworthy items
1) Computed using a U.S. statutory tax rate of 21%.2) Computed using weighted average diluted shares on an operating basis, which is provided on page 6 of the 4Q20 Financial Supplement.3) The annualized expected rate of return for FY’19 and FY’20 is 8% and 6% for alternative investments and 6% and 4% for FVO fixed maturity securities, respectively.4) Alternative investment returns reflect General Insurance and Life and Retirement alternative investment income only and exclude Other Operations, which includes the
impact of consolidation and eliminations. On an AIG consolidated basis, better than expected alternative investment returns were $395M, pre-tax, in FY’19 and $460M, pre-tax, in FY’20.
FY’19 – Income / (Loss) FY’20 – Income / (Loss)
($M, except per share amounts) Pre-tax After-tax1 EPS –diluted2 Pre-tax After-tax1 EPS –
diluted2
CATs excluding General Insurance COVID-19 CATs ($1,273) ($1,006) ($1.13) ($1,358) ($1,073) ($1.23)
General Insurance COVID-19 CATs - - - (1,093) (863) (0.99)
Favorable/(unfavorable) PYD 294 232 0.26 74 58 0.07
Charge related to annual actuarial assumption update in Life and Retirement (173) (137) (0.15) (107) (85) (0.10)
Investment Performance:Better than expected alternative investment returns3,4 451 356 0.40 572 452 0.52
Better than expected fair value changes on Fixed Maturity Securities – Other accounted under FVO3 20 16 0.02 157 124 0.14
Total noteworthy items – APTI basis ($681) ($538) ($0.60) ($1,755) ($1,386) ($1.59)
20

AIG 200, a global, multi-year initiative to achieve transformational change and $1B of GOE savings; FY’20 exit run-rate savings of ~$400M, exceeding original GOE target of $300M by ~33%
General Insurance
1 The Standard Commercial Underwriting Platform will modernize global underwriting capabilities by simplifying processes and tools to create a contemporary data architecture
2 Transform Japan business into a next-generation digital insurance company with the ability to offer “anywhere, anytime, any device” experience
3 Improve decision-making in Private Client Group through modernizing legacy technology and moving to digitized workloads
Shared Services 4 Create AIG Global Operations, a multifunctional, fully integrated operating model with digitally enabled
end-to-end process and increased scope and scale
InformationTechnology
5 Transform IT operating model
6 Build a modern, scalable and secure technology foundation to improve operational stability and enable faster business technology deployment
Finance7 Transform Finance operating model
8 Modernize infrastructure through technology solutions and simplify finance and actuarial processes, while materially improving analytics capabilities
Procurement 9 Create a highly efficient global procurement and sourcing organization to leverage our purchasing power, maximize value, minimize risk, and support sustained profitable growth
Real Estate 10 Optimize portfolio to ensure it is cost effective, resilient and reflective of global footprint
AIG 200 Costs to Achieve and GOE Benefits2020
Estimate2020
ActualTargets
($M) 2021E 2022E Total CommentsInvestment / Costs to Achieve
Capitalized assets, not in APTI initially $100 ~$80 $200 $120 $400 Amortized / depreciated in GOE / APTI when IT or capital asset placed into service1
Restructuring and Other charges, offset by Gain on Sale, in Net Income $250 ~$150 $300 $450 $900
Modest impact to APTI; primarily related to professional, IT and other restructuring fees, offset by gain on sale on divested entities
Total investment $350 ~$230 $500 $570 $1,300
Run-rate net GOE savings, cumulative1 $300 ~$400 $650 $1,000Estimated exit run-rate savings will emerge over a period of time, beginning in 2020, as a result of actions taken in the AIG 200 program
Annual net benefit to APTI $150 ~$175 Estimated GOE benefit in 2020 as a result of actions taken in the AIG 200 program
1) Targets assume estimated amortization / depreciation related to the capitalized assets of ~$10M-$15M and ~$25M-$30M for 2021 and 2022, respectively. Targets assume that the unamortized balance will be expensed at ~$50M per year from 2023-2027 and the remainder will trail off in the periods thereafter.
21

61.6% 60.8%
34.4% 33.3%
96.0% 94.1%
0.8% 1.1%
FY19 AYLRU/W Actions/Mix
Expense Ratio FY20
AYLR, As Adj. Expense Ratio
61.6% 60.8%
21.8% 20.4%
12.6% 12.9%
-1.1% -0.1%
4.8% 10.3%
FY'19 FY'20AYLR, As Adj. Acq. Ratio GOE Ratio PYD Ratio CAT Ratio
1) FY'20 includes non-COVID-19 CATs of $1,335M and COVID-19 CATs of $1,093M, pre-tax.2) FY’19 CYCR includes adjustments for ceded premium under reinsurance contracts and other of (0.1) pts.
General Insurance: 1.9 pts better AYCR, as adjusted; 3.4 pt improvement in Global Commercial Lines due to improved business mix as a result of underwriting actions
Net Premiums Written ($M)
Calendar Year Combined Ratios2 Accident Year Combined Ratios (excl. CATs) walk
99.6%
($M) FY'19 FY'20
Net premiums written $25,092 $22,959
Net premiums earned $26,438 $23,662
Loss and loss adjustment expense 17,246 16,803
Acquisition expenses 5,774 4,821
General operating expenses 3,329 3,062
Underwriting income (loss) $89 ($1,024)
Net investment income $3,444 $2,925
Adjusted pre-tax income $3,533 $1,901
Note: Impact of CATs1, pre-tax ($1,257) ($2,428)
with 5.5 pt increase in
CATs
22
104.3%
$3,266 $1,149
$6,769
$6,301
FY'19 FY'20
Change primarily
driven by the formation of Syndicate 2019 and
lower Travel premiums
due to COVID-19
$8,224 $8,635
$6,833 $6,874
FY'19 FY'20
$15,057 $15,509 $10,035
$7,450
Global Commercial Lines Global Personal Insurance
North America International

General Insurance: Strong 2.8 pt improvement in North America Commercial AYCR, as adjusted; Personal Insurance impacted by Travel and Syndicate 2019
Key Takeaways:
NA Commercial Lines NPW grew 5% over the prior year reflecting strong rate momentum, improved retention and higher writings in AIG Re. NA Personal Insurance NPW decreased as a result of the impact from COVID-19 on the Travel business, and cessions pursuant to a series of quota share reinsurance agreements placed in the 2Q20 related to Syndicate 2019
NA Commercial Lines AYCR, as adjusted, improved 2.8 pts due to enhanced risk selection along with higher rate change, as well as a lower expense ratio due to changes in the business mix and expense discipline
NA Personal Insurance AYCR, as adjusted, increased 8.8 pts due to the impact on the loss ratio of COVID-19 on Travel and the change in business mix driven by a series of quota share reinsurance agreements as described above. The GOE ratio was also impacted by the reduction in net premiums earned
CATs of $1.7B; $1.0B related to non-COVID-19 CATs and $0.7B related to COVID-19 CATs
Favorable PYD of $157M with $239M favorable PYD in Commercial Lines and $82M in unfavorable PYD in Personal Insurance; PYD reflects $211M of favorable amortization from the ADC
($M) FY'19 FY'20Net premiums written $11,490 $9,784 Commercial Lines 8,224 8,635
Personal Insurance 3,266 1,149
Net premiums earned $12,136 $10,302 Commercial Lines 8,877 8,516
Personal Insurance 3,259 1,786
Underwriting loss ($365) ($1,301)Commercial Lines (364) (861)
Personal Insurance (1) (440)
Note: Impact of CATs, pre-tax ($827) ($1,737)
North America Combined Ratios1
67.5% 69.0%
19.8% 16.7%10.2% 11.3%
FY'19 FY'20CAT RatioCYCR PYD Ratio Acquisition Ratio AYLR, As adjustedGOE RatioAYCR, As adjusted
73.2% 70.9%
14.6% 14.3%10.5% 10.3%
FY'19 FY'20
52.0% 60.0%
33.8% 28.1%9.2% 15.7%
FY'19 FY'20
97.5%
103.1%6.8%
(1.0%)
97.0%
112.6%
16.7%
(1.2%)
Total
98.3%
104.1%6.3%
(0.3%)
95.5%
110.0%
16.7%
(2.2%)
Commercial Lines
95.0%
100.0%8.1%
(2.8%)103.8%
124.7%16.9%4.0%
Personal Insurance
AYLR, as adjusted,improved
2.3 pts
AYCR, as adjusted,improved
2.8 pts
231) FY'19 CYCR includes adjustments for ceded premium under reinsurance contracts and other of (0.2) pts, (0.2) pts, and (0.3) pts in Total North America, North America
Commercial Lines, and North America Personal Insurance, respectively.
AYCR, as adjusted,improved
0.5 pts
Change primarily
driven by the formation of Syndicate 2019 and
lower Travel premiums due to COVID-19

General Insurance: 3.0 pt improvement in International AYCR, as adjusted, due to improved risk selection, rate increases, and ongoing expense discipline
Key Takeaways:
International Commercial Lines NPW grew 1% and International Personal Insurance NPW decreased 7% largely from the adverse impact of COVID-19 on Travel, Accident & Health (A&H) and Personal Lines (Auto and Personal Property)
International Commercial Lines AYCR, as adjusted, improved 4.4 pts due to enhanced risk selection along with rate increases and ongoing expense discipline
International Personal Insurance AYCR, as adjusted, improved 1.3 pts reflecting lower claims frequency and changes in business mix
CATs of $691M; $301M related to non-COVID-19 CATs and $390M related to COVID-19 CATs
Unfavorable PYD of $81M with $112M unfavorable PYD in Commercial Lines and $31M in favorable PYD in Personal Insurance
($M) FY'19 FY'20Net premiums written $13,602 $13,175 Commercial Lines 6,833 6,874 Personal Insurance 6,769 6,301 Net premiums earned $14,302 $13,360 Commercial Lines 7,087 6,927 Personal Insurance 7,215 6,433 Underwriting income $454 $277 Commercial Lines 177 (27)Personal Insurance 277 304 Note: Impact of CATs, pre-tax ($430) ($691)
56.6% 54.5%
23.6% 23.2%
14.7% 14.2%
FY'19 FY'20CAT RatioCYCR PYD Ratio Acquisition Ratio AYLR, As adjustedGOE RatioAYCR, As adjusted
94.9%
96.9%3.2%
(1.1%)
91.9%
97.9%
5.3%
0.7%
AYLR, as adjusted,improved
2.1 pts
AYCR, as adjusted,improved
3.0 pts
59.9% 56.5%
20.3% 19.8%
14.3% 13.8%
FY'19 FY'20
53.3% 52.3%
26.8% 26.8%
15.1% 14.8%
FY'19 FY'20
94.5%
97.6%3.5%
(0.4%)
90.1%
100.4%
8.5%
1.8%95.2%
96.2%2.9%
(1.9%)
93.9%
95.3%1.8%
(0.4%)
Total Commercial Lines Personal Insurance
International Combined Ratios1
AYLR, as adjusted,improved
3.4 pts
AYCR, as adjusted,improved
4.4 pts
AYLR, as adjusted,improved
1.0 pts
AYCR, as adjusted,improved
1.3 pts
241) FY'19 CYCR includes adjustments for ceded premium under reinsurance contracts and other of (0.1) pts in Total International.
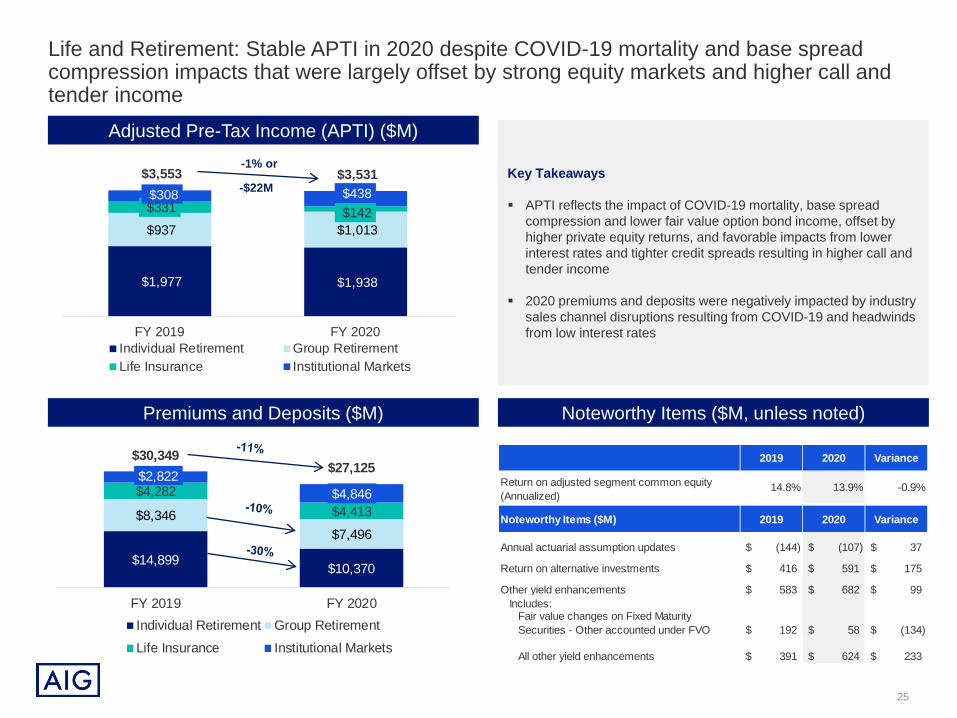
$14,899 $10,370
$8,346$7,496
$4,282$4,413
$2,822$4,846
$30,349$27,125
FY 2019 FY 2020Individual Retirement Group RetirementLife Insurance Institutional Markets
$1,977 $1,938
$937 $1,013 $331 $142 $308 $438
$3,553 $3,531
FY 2019 FY 2020Individual Retirement Group RetirementLife Insurance Institutional Markets
2019 2020 Variance
Return on adjusted segment common equity (Annualized)
14.8% 13.9% -0.9%
Noteworthy Items ($M) 2019 2020 Variance
Annual actuarial assumption updates (144)$ (107)$ 37$
Return on alternative investments 416$ 591$ 175$
Other yield enhancements 583$ 682$ 99$ Includes:
Fair value changes on Fixed Maturity Securities - Other accounted under FVO 192$ 58$ (134)$
All other yield enhancements 391$ 624$ 233$
25
Life and Retirement: Stable APTI in 2020 despite COVID-19 mortality and base spread compression impacts that were largely offset by strong equity markets and higher call and tender income
Adjusted Pre-Tax Income (APTI) ($M)
Premiums and Deposits ($M)
Key Takeaways
APTI reflects the impact of COVID-19 mortality, base spread compression and lower fair value option bond income, offset by higher private equity returns, and favorable impacts from lower interest rates and tighter credit spreads resulting in higher call and tender income
2020 premiums and deposits were negatively impacted by industry sales channel disruptions resulting from COVID-19 and headwinds from low interest rates
Noteworthy Items ($M, unless noted)
-1% or
-$22M

26
Life and Retirement: Individual and Group Retirement APTI reflect strong equity markets, offset largely by base spread compression and lower income from FVO bonds
Individual Retirement*
Group Retirement
Base Net Investment Spreads Total Net Investment Spreads
Base Net Investment Spreads Total Net Investment Spreads
Premiums and Deposits ($M)
Net Flows ($M)
Assets Under Administration
($B)APTI ($M)
$10,370 ($4,728) $ 163.4 $1,938(-30% vs. FY19) (+5% vs. FY19) (-2% vs. FY19)
1.86%
3.05%
1.53%
2.63%
Fixed Annuities Variable and IndexAnnuities
FY19 FY20
Premiums and Deposits ($M)
Net Flows ($M)
Assets Under Administration
($B)APTI ($M)
$7,496 ($1,940) $ 130.1 $1,013(-10% vs. FY19) (+10% vs. FY19) (+8% vs. FY19)
1.81%
1.61%
FY19 FY20
2.16%
2.09%
FY19 FY20
2.16%
3.58%
2.00%
3.04%
Fixed Annuities Variable and IndexAnnuities
FY19 FY20
* Includes Retail Mutual Funds
Key Takeaways
Key Takeaways
FY20 vs FY19 APTI results reflect
Favorable impacts from: Equity markets resulting in higher fees and favorable alternatives, mainly from
private equity returns Lower GOEUnfavorable impacts from: Lower FVO assets, offset in part by favorable impact from lower interest rates
and tighter credit spreads Unfavorable impact from annual actuarial assumption update Base spread compression Total investment spreadsOther Key Metrics
Favorable impacts from: Assets under administration growth
Unfavorable impacts from: Net flows
FY20 vs FY19 APTI results reflect
Favorable impacts from: Equity markets resulting in higher fees, lower DAC amortization and favorable
alternatives, mainly from private equity returns Favorable impact from annual actuarial assumption update
Unfavorable impacts from:
Lower FVO assets, offset in part by favorable impact from lower interest rates and tighter credit spreads
Base spread compression Total investment spreads
Other Key Metrics
Favorable impacts from: Net flows Assets under administration growth

$3.2 $3.6
$5.9 $8.2
$5.0
$5.1 $2.1
$2.2 $0.6
$0.1 $6.7
$8.1 $23.6
$27.3
FY19 FY20
27
Life and Retirement: Life Insurance 2020 APTI declined driven by higher mortality due to COVID-19, offset in part by strong equity markets; Institutional Markets APTI reflects strong private equity returns and growth in reserves
Life Insurance
Institutional Markets
Definitions: GIC = Guaranteed Investment Contracts | SVW = Stable Value Wrap | COLI/BOLI = Corporate and Bank-owned life insurance | PRT = Pension Risk Transfer | PPVUL/PPVA = Private placement variable life and annuities
Premiums and Deposits ($M) GAAP Reserves ($B)
($M)
APTI $438 (+42% vs. FY19)
$323 $329
$1,665 $2,320
$64
$71
$53
$2 $717
$2,124
$2,822
$4,846
FY19 FY20
($M)
$455(-9% vs. FY19)
Domestic US 59%
International 41%
$4,413(+3% vs. FY19)
$142(-57% vs. FY19)
New Business Sales
Premiums and Deposits
APTI
Key Takeaways
Key Takeaways
FY20 APTI vs FY19 results reflectFavorable impacts from: Equity markets resulting in favorable alternatives, mainly from private
equity returns Lower GOEUnfavorable impacts from: Lower FVO assets, offset in part by favorable impact from lower
interest rates and tighter credit spreads Unfavorable impact from annual actuarial assumption update Mortality, driven by COVID-19 Lower reinvestment ratesOther Key MetricsUnfavorable impacts from: New business sales impact on APTI
FY20 vs F19 APTI results reflect
Favorable impacts from:
Equity markets resulting in favorable alternatives, mainly from private equity returns
Higher base investment income, growth in reserves
Unfavorable impacts from:
Lower FVO assets, offset in part by favorable impact from lower interest rates and tighter credit spreads
Other Key Metrics
Favorable impacts from:
Growth in reserves

$3.3 $0.8 $1.2
$1.7
$1.5
$2.5 $1.5 $0.5 $0.1
$4.8
$3.3 $2.7
$2.3
2017 2018 2019 2020
Tax Sharing Payments Dividends Loan repayments
480%389% 402%
2017 2018 2019 2020E
28
Life and Retirement: Balance sheet, capital generation and liquidity remained strong in 2020
Post-Fortitude sale, relatively limited net exposure to legacy blocks of business; no Long-Term Care exposure and limited pre-financial crisis Variable Annuities guarantees
Disciplined pricing approach across a diverse set of products
~91% investment grade corporate debt investment portfolio, as of December 31, 2020, positioned well to navigate stress scenarios
Estimated YE20 statutory capital levels improved from YE19 and remain above the target capital range, with modest impacts from investment downgrades and credit losses
Dividends and Tax Sharing Payments ($B)1Strong Balance Sheet Fundamentals
Fleet RBC2
1) Includes US Life Companies. 2020 dividends reflect the impact of lower dividends from certain subsidiaries due to $615M of proceeds from the sale of the majority interests in Fortitude Group Holdings LLC in June 2020 (Majority Interest Fortitude Sale) being retained at AIG rather than contributed to the Life and Retirement business, and a corresponding amount being retained by the Life and Retirement business rather than dividend up to AIG. Proceeds of $0.1B contributed to certain Life and Retirement subsidiaries as a result of the Majority Interest Fortitude Sale are excluded from the FY2020 results above.
2) FY’20 RBC ratio is a preliminary range and subject to change with completion of statutory closing process. The RBC drop in 2018 due to tax reform and NYDFS additional cash flow testing requirements.
Estimated RBC range
425% - 435%
On October 26, 2020, AIG announced its intention to separate its Life and Retirement business from AIG. No decisions have yet been made regarding the structure of the initial disposition of up to a 19.9% interest in the Life and Retirement business. In addition, any separation transaction will be subject to the satisfaction of various conditions and approvals, including approval by the AIG Board of Directors, receipt of insurance and other required regulatory approvals, and satisfaction of any applicable requirements of the Securities and Exchange Commission. No assurance can be given regarding the form that a separation transaction may take or the specific terms or timing thereof, or that a separation will in fact occur

Other Operations: APTL increased principally due to the sale of Fortitude in 2Q20, lower NII associated with available for sale securities (excluding Fortitude), the impact of consolidated investment entities on consolidation and eliminations, as well as higher interest expense from May 2020 bond issuance
Key Takeaways:
Other Operations APTL was $2.4B, including $0.5B of reductions from consolidation and eliminations, compared to $1.6B, including $0.3B of reductions from consolidation and eliminations, in the prior year quarter. The increase in consolidation and eliminations reflects the impact of consolidated investment entities
Before consolidation and eliminations, the increase in APTL was primarily due to the sale of Fortitude in 2Q20, lower NII associated with available for sale securities (excluding Fortitude), and increased interest expense related to debt issuances in 2Q20
29
($M) FY’19 FY’20
Corporate and Other ($1,378) ($2,041)
Asset Management 66 78
Adjusted pre-tax loss before consolidation and eliminations ($1,312) ($1,963)Consolidation and eliminations:
Consolidation and eliminations – Consolidated investment entities (327) (457)
Consolidation and eliminations – Other 23 (9)
Total Consolidation and eliminations (304) (466)
Adjusted pre-tax loss ($1,616) ($2,429)

Glossary of Non-GAAP Financial Measures and Non-GAAP Reconciliations
30

31
Glossary of Non-GAAP Financial MeasuresThroughout this presentation, we present our financial condition and results of operations in the way we believe will be most meaningful and representative of our business results. Some of the measurements we use are “Non-GAAP financial measures” under Securities and Exchange Commission rules and regulations. GAAP is the acronym for generally accepted accounting principles in the United States. The non-GAAP financial measures we present may not be comparable to similarly-named measures reported by other companies. The reconciliations of such measures to the most comparable GAAP measures in accordance with Regulation G are included within the relevant tables or in the Fourth Quarter 2020 Financial Supplement available in the Investor Information section of AIG’s website, www.aig.com.
We may use certain non-GAAP operating performance measures as forward-looking financial targets or projections. These financial targets or projections are provided based on management’s estimates. The most directly comparable GAAP financial targets or projections would be heavily dependent upon results that are beyond management’s control and the outcome of these items could be significantly different than management’s estimates. Therefore, we do not provide quantitative reconciliations for these financial targets or projections as we cannot predict with accuracy future actual events (e.g., catastrophe losses) and impacts from changes in macro-economic market conditions, including the interest rate environment (e.g. net reserve discount change and returns on alternative investments).
We use the following operating performance measures because we believe they enhance the understanding of the underlying profitability of continuing operations and trends of our business segments. We believe they also allow for more meaningful comparisons with our insurance competitors. When we use these measures, reconciliations to the most comparable GAAP measure are provided on a consolidated basis.
Adjusted Pre-tax Income (APTI) is derived by excluding the items set forth below from income from continuing operations before income tax. This definition is consistent across our segments. These items generally fall into one or more of the following broad categories: legacy matters having no relevance to our current businesses or operating performance; adjustments to enhance transparency to the underlying economics of transactions; and measures that we believe to be common to the industry. APTI is a GAAP measure for our segments. Excluded items include the following:
Adjusted After-tax Income attributable to AIG Common Shareholders (AATI) is derived by excluding the tax effected adjusted pre-tax income (APTI) adjustments described above, dividends on preferred stock, and the following tax items from net income attributable to AIG:
– deferred income tax valuation allowance releases and charges; – changes in uncertain tax positions and other tax items related to legacy matters having no relevance to our current businesses or operating performance; and– net tax charge related to the enactment of the Tax Cuts and Jobs Act (Tax Act);and by excluding the net realized capital gains (losses) and other charges from noncontrolling interests.
Glossary of Non-GAAP
• changes in fair value of securities used to hedge guaranteed living benefits;• changes in benefit reserves and deferred policy acquisition costs (DAC), value of
business acquired (VOBA), and sales inducement assets (SIA) related to net realized capital gains and losses;
• changes in the fair value of equity securities;• net investment income on Fortitude Re funds withheld assets post deconsolidation of
Fortitude Re;• following deconsolidation of Fortitude Re, net realized capital gains and losses on
Fortitude Re funds withheld assets held by AIG in support of Fortitude Re’sreinsurance obligations to AIG (Fortitude Re funds withheld assets);
• loss (gain) on extinguishment of debt;• all net realized capital gains and losses except earned income (periodic settlements
and changes in settlement accruals) on derivative instruments used for non-qualifying (economic) hedging or for asset replication. Earned income on such economic hedges is reclassified from net realized capital gains and losses to specific APTI line items based on the economic risk being hedged (e.g. net investment income and interest credited to policyholder account balances);
• income or loss from discontinued operations;• net loss reserve discount benefit (charge);• pension expense related to a one-time lump sum payment to former employees;• income and loss from divested businesses;• non-operating litigation reserves and settlements;• restructuring and other costs related to initiatives designed to reduce operating
expenses, improve efficiency and simplify our organization;• the portion of favorable or unfavorable prior year reserve development for which
we have ceded the risk under retroactive reinsurance agreements and related changes in amortization of the deferred gain;
• integration and transaction costs associated with acquiring or divesting businesses;
• losses from the impairment of goodwill; and• non-recurring costs associated with the implementation of non-ordinary course
legal or regulatory changes or changes to accounting principles.

32
Glossary of Non-GAAP Financial Measures Book Value per Common Share, Excluding Accumulated Other Comprehensive Income (AOCI) adjusted for the cumulative unrealized gains and losses related to
Fortitude Re’s Funds Withheld Assets and Deferred Tax Assets (DTA) (Adjusted Book Value per Common Share) is used to show the amount of our net worth on a per-common share basis after eliminating items that can fluctuate significantly from period to period including changes in fair value of AIG’s available for sale securities portfolio, foreign currency translation adjustments and U.S. tax attribute deferred tax assets. This measure also eliminates the asymmetrical impact resulting from changes in fair value of our available for sale securities portfolio wherein there is largely no offsetting impact for certain related insurance liabilities. In addition, we adjust for the cumulative unrealized gains and losses related to Fortitude Re’s Funds Withheld Assets since these fair value movements are economically transferred to Fortitude Re. We exclude deferred tax assets representing U.S. tax attributes related to net operating loss carryforwards and foreign tax credits as they have not yet been utilized. Amounts for interim periods are estimates based on projections of full-year attribute utilization. As net operating loss carryforwards and foreign tax credits are utilized, the portion of the DTA utilized is included in these book value per common share metrics. Adjusted Book Value per Common Share is derived by dividing Total AIG common shareholders’ equity, excluding AOCI adjusted for the cumulative unrealized gains and losses related to Fortitude Re’s Funds Withheld Assets, and DTA (Adjusted Common Shareholders’ Equity), by total common shares outstanding. Book Value per Common Share, Excluding Goodwill, Value of Business Acquired (VOBA), Value of Distribution Channel Acquired (VODA), Other Intangible Assets,
AOCI adjusted for the cumulative unrealized gains and losses related to Fortitude Re’s Funds Withheld Assets, and Deferred Tax Assets (DTA) (Adjusted Tangible Book Value per Common Share) is used to provide more accurate measure of the realizable value of shareholder on a per-common share basis. Adjusted Tangible Book Value per Common Share is derived by dividing Total AIG common shareholders’ equity, excluding intangible assets, AOCI adjusted for the cumulative unrealized gains and losses related to Fortitude Re’s Funds Withheld Assets, and DTA (Adjusted Tangible Common Shareholders’ Equity), by total common shares outstanding. AIG Return on Common Equity (ROCE) – Adjusted After-tax Income Excluding AOCI adjusted for the cumulative unrealized gains and losses related to Fortitude Re’s
Funds Withheld Assets and DTA (Adjusted Return on Common Equity) is used to show the rate of return on common shareholders’ equity. We believe this measure is useful to investors because it eliminates items that can fluctuate significantly from period to period, including changes in fair value of our available for sale securities portfolio, foreign currency translation adjustments and U.S. tax attribute deferred tax assets. This measure also eliminates the asymmetrical impact resulting from changes in fair value of our available for sale securities portfolio wherein there is largely no offsetting impact for certain related insurance liabilities. In addition, we adjust for the cumulative unrealized gains and losses related to Fortitude Re’s Funds Withheld Assets since these fair value movements are economically transferred to Fortitude Re. We exclude deferred tax assets representing U.S. tax attributes related to net operating loss carryforwards and foreign tax credits as they have not yet been utilized. Amounts for interim periods are estimates based on projections of full-year attribute utilization. As net operating loss carryforwards and foreign tax credits are utilized, the portion of the DTA utilized is included in Adjusted Return on Common Equity. Adjusted Return on Common Equity is derived by dividing actual or annualized adjusted after-tax income attributable to AIG common shareholders by average Adjusted Common Shareholders’ Equity. General Insurance and Life and Retirement Adjusted Segment Common Equity is based on segment equity adjusted for the attribution of debt and preferred stock (Segment
Common Equity) and is consistent with AIG’s Adjusted Common Shareholders’ Equity definition. General Insurance and Life and Retirement Return on Adjusted Segment Common Equity – Adjusted After-tax Income (Return on Adjusted Segment Common Equity)
is used to show the rate of return on Adjusted Segment Common Equity. Return on Adjusted Segment Common Equity is derived by dividing actual or annualized Adjusted After-tax Income by Average Adjusted Segment Common Equity. Adjusted After-tax Income Attributable to General Insurance and Life and Retirement is derived by subtracting attributed interest expense, income tax expense and
attributed dividends on preferred stock from APTI. Attributed debt and the related interest expense and dividends on preferred stock are calculated based on our internal allocation model. Tax expense or benefit is calculated based on an internal attribution methodology that considers among other things the taxing jurisdiction in which the segments conduct business, as well as the deductibility of expenses in those jurisdictions.
Glossary of Non-GAAP

33
Glossary of Non-GAAP Financial Measures Adjusted Revenues exclude Net realized capital gains (losses), income from non-operating litigation settlements (included in Other income for GAAP purposes) and changes in
fair value of securities used to hedge guaranteed living benefits (included in Net investment income for GAAP purposes). Adjusted revenues is a GAAP measure for our segments.
Ratios: We, along with most property and casualty insurance companies, use the loss ratio, the expense ratio and the combined ratio as measures of underwriting performance. These ratios are relative measurements that describe, for every $100 of net premiums earned, the amount of losses and loss adjustment expenses (which for General Insurance excludes net loss reserve discount), and the amount of other underwriting expenses that would be incurred. A combined ratio of less than 100 indicates underwriting income and a combined ratio of over 100 indicates an underwriting loss. Our ratios are calculated using the relevant segment information calculated under GAAP, and thus may not be comparable to similar ratios calculated for regulatory reporting purposes. The underwriting environment varies across countries and products, as does the degree of litigation activity, all of which affect such ratios. In addition, investment returns, local taxes, cost of capital, regulation, product type and competition can have an effect on pricing and consequently on profitability as reflected in underwriting income and associated ratios.
Accident year loss and combined ratios, as adjusted: both the accident year loss and combined ratios, as adjusted, exclude catastrophe losses and related reinstatement premiums, prior year development, net of premium adjustments, and the impact of reserve discounting. Natural catastrophe losses are generally weather or seismic events having a net impact on AIG in excess of $10 million each and man-made catastrophe losses, such as terrorism and civil disorders that exceed the $10 million threshold. We believe that as adjusted ratios are meaningful measures of our underwriting results on an ongoing basis as they exclude catastrophes and the impact of reserve discounting which are outside of management’s control. We also exclude prior year development to provide transparency related to current accident year results.
Underwriting ratios are computed as follows:
a) Loss ratio = Loss and loss adjustment expenses incurred ÷ Net premiums earned (NPE)
b) Acquisition ratio = Total acquisition expenses ÷ NPE
c) General operating expense ratio = General operating expenses ÷ NPE
d) Expense ratio = Acquisition ratio + General operating expense ratio
e) Combined ratio = Loss ratio + Expense ratio
f) Catastrophe losses (CATs) and reinstatement premiums = [Loss and loss adjustment expenses incurred – (CATs)] ÷ [NPE +/(-) CYRIPs] – Loss ratio
g) Accident year loss ratio, as adjusted (AYLR) = [Loss and loss adjustment expenses incurred – CATs – PYD] ÷ [NPE +/(-) Reinstatement premiums related to catastrophes (CYRIPs) +/(-) RIPs related to prior year catastrophes (PYRIPs) + (Additional) returned premium related to PYD on loss sensitive business ((AP)RP) + Adjustment for ceded premiums under reinsurance contracts related to prior accident years]
h) Accident year combined ratio, as adjusted = AYLR + Expense ratio
i) Prior year development net of (additional) return premium related to PYD on loss sensitive business = [Loss and loss adjustment expenses incurred – CATs – PYD] ÷[NPE +/(-) CYRIPs +/(-) PYRIPs + (AP)RP] – Loss ratio – CAT ratio
Premiums and deposits: includes direct and assumed amounts received and earned on traditional life insurance policies, group benefit policies and life-contingent payout annuities, as well as deposits received on universal life, investment-type annuity contracts, Federal Home Loan Bank (FHLB) funding agreements and mutual funds.
Results from discontinued operations are excluded from all of these measures.
Glossary of Non-GAAP

34
Non-GAAP ReconciliationsAdjusted Pre-tax and After-tax Income - Consolidated
Twelve Months Ended(in millions) Quarterly December 31,
4Q19 4Q20 2019 2020Pre-tax income (loss) from continuing operations $ 1,036 $ (558) $ 5,287 $ (7,293)Adjustments to arrive at Adjusted pre-tax income (loss)
Changes in fair value of securities used to hedge guaranteed living benefits (11) (17) (194) (41)Changes in benefit reserves and DAC, VOBA and SIA related to
net realized capital gains (losses) (95) (217) (56) (12)Changes in the fair value of equity securities (152) (216) (158) (200)Loss (gain) on extinguishment of debt 19 (3) 32 12Net investment income on Fortitude Re funds withheld assets (a) - (479) - (1,053) 1Net realized capital (gains) losses on Fortitude Re funds withheld assets (a) - (335) - (463) 1Net realized capital (gains) losses on Fortitude Re funds withheld
embedded derivative (a) - 1,152 - 2,645Net realized capital (gains) losses (b) 313 1,472 (456) 97(Income) loss from divested businesses 71 (127) 75 8,525Non-operating litigation reserves and settlements (8) (16) (2) (21)Favorable prior year development and related amortization
changes ceded under retroactive reinsurance agreements (56) (150) (267) (221)Net loss reserve discount charge 35 475 955 516Integration and transaction costs associated with acquiring or divesting
businesses 8 5 24 12Restructuring and other costs 44 111 218 435Non-recurring costs related to regulatory or accounting changes 7 19 12 65Adjusted pre-tax income $ 1,211 $ 1,116 $ 5,470 $ 3,003
(a) Represents activity subsequent to the deconsolidation of Fortitude Re on June 2, 2020.
(b) Includes all net realized capital gains and losses except earned income (periodic settlements and changes in settlement accruals) on derivative instruments used for non-qualifying (economic) hedging or for asset replication and net realized gains and losses on Fortitude Re funds withheld assets.

35
Non-GAAP ReconciliationsAdjusted Pre-tax and After-tax Income - Consolidated
(a) Includes the tax audit resolution related to the IRS audit settlement for tax years 1991-2006 and the write-down of net operating loss deferred tax assets in certain foreign jurisdictions, which is offset by valuation allowance release.(b) Twelve months ended December 31, 2020 includes valuation allowance established against a portion of foreign tax credit carryforwards of AIG’s U.S. federal consolidated income tax group, as well as net valuation allowance release in certain foreign jurisdictions for the three- and twelve-months ended December 31, 2020.(c) Represents activity subsequent to the deconsolidation of Fortitude Re on June 2, 2020.(d) Includes all net realized capital gains and losses except earned income (periodic settlements and changes in settlement accruals) on derivative instruments used for non-qualifying (economic) hedging or for asset replication and net realized gains and losses on Fortitude Re funds withheld assets.(e) Includes the impact of non-U.S. tax rates which differ from the applicable U.S. statutory tax rate and tax-only adjustments.(f) Prior to June 2, 2020, noncontrolling interests was primarily due to the 19.9 percent investment in Fortitude by an affiliate of The Carlyle Group L.P. (Carlyle), which occurred in the fourth quarter of 2018. Carlyle was allocated 19.9 percent of Fortitude Holdings’ standalone financial results through the June 2, 2020 closing date of the Majority Interest Fortitude Sale. Fortitude Holdings’ results were mostly eliminated in AIG’s consolidated income from continuing operations given that its results arose from intercompany transactions. Noncontrolling interests was calculated based on the standalone financial results of Fortitude Holdings. The most significant component of Fortitude Holdings’ standalone results was the change in fair value of the embedded derivatives which changes with movements in interest rates and credit spreads, and which was recorded in net realized capital gains and losses of Fortitude Holdings. In accordance with AIG's adjusted after-tax income definition, realized capital gains and losses are excluded from noncontrolling interests. Subsequent to the Majority Interest Fortitude Sale, AIG owns 3.5 percent of Fortitude Holdings and no longer consolidates Fortitude Holdings in its financial statements as of such date. The minority interest in Fortitude Holdings is carried at cost within AIG’s Other invested assets, which was $100 million as of December 31, 2020.(g) Because we reported a net loss attributable to AIG common shareholders for the three months ended December 31, 2020, all common stock equivalents are anti-dilutive and are therefore excluded from the calculation of diluted shares and diluted per share amounts.
Twelve Months Ended(in millions) Quarterly December 31,
4Q19 4Q20 2019 2020After-tax net income (loss), including noncontrolling interests $ 869 $ (16) $ 4,169 $ (5,829)Noncontrolling interests (income) loss 60 (37) (821) (115)Net income (loss) attributable to AIG $ 929 $ (53) $ 3,348 $ (5,944)
Dividends on preferred stock 7 7 22 29Net income (loss) attributable to AIG common shareholders $ 922 $ (60) $ 3,326 $ (5,973)Adjustments to arrive at Adjusted after-tax income (loss) (amounts net of
tax, at U.S. statutory tax rate for each respective period, except where noted):
Changes in uncertain tax positions and other tax adjustments (a) 7 (336) 30 (132)Deferred income tax valuation allowance (releases) charges (b) (3) (157) (43) (65)Changes in fair value of securities used to hedge guaranteed living benefits (9) (13) (154) (32)Changes in benefit reserves and DAC, VOBA and SIA related to
net realized capital gains (losses) (75) (171) (44) (9)Changes in the fair value of equity securities (120) (171) (125) (158)Loss (gain) on extinguishment of debt 15 (2) 25 10Net investment income on Fortitude Re funds withheld assets(c) - (378) - (832) 1Net realized capital (gains) losses on Fortitude Re funds withheld assets(c) - (264) - (365)Net realized capital (gains) losses on Fortitude Re funds withheld embedded
derivative (c) - 910 - 2,090Net realized capital (gains) losses (d)(e) 258 1,141 (357) 75(Income) loss from discontinued operations and divested businesses (e) 14 (21) 18 6,911Non-operating litigation reserves and settlements (7) (13) (2) (17)Favorable prior year development and related amortization
changes ceded under retroactive reinsurance agreements (45) (119) (211) (175)Net loss reserve discount charge 28 375 754 407Integration and transaction costs associated with acquiring or divesting
businesses 6 4 19 9Restructuring and other costs 35 88 172 344Non-recurring costs related to regulatory or accounting changes 6 15 10 51Noncontrolling interests primarily related to net realized capital gains
(losses) of Fortitude Holdings' standalone results (f) (109) (1) 660 62Adjusted after-tax income attributable to AIG common shareholders $ 923 $ 827 $ 4,078 $ 2,201Weighted average diluted shares outstanding (g) 896.4 868.4 889.5 869.3Income (loss) per common share attributable to AIG common shareholders (diluted) (g) $ 1.03 $ (0.07) $ 3.74 $ (6.88)Adjusted after-tax income per common share attributable to AIG common shareholders (diluted) 1.03 0.94 4.58 2.52

36
Non-GAAP Reconciliations Book Value Per Common Share
(in millions, except per common share data) As of December 31, September 30,Book Value Per Common Share 2019 2020 2020Total AIG shareholders' equity $ 65,675 $ 66,362 $ 64,108Less: Preferred equity 485 485 485Total AIG common shareholders' equity (a) 65,190 65,877 63,623Less: Accumulated other comprehensive income (AOCI) 4,982 13,511 10,978Add: Cumulative unrealized gains and losses related to
Fortitude Re’s Funds Withheld Assets - 4,657 4,392Less: Deferred tax assets (DTA)* 8,977 7,907 8,123Total adjusted common shareholders' equity (b) $ 51,231 $ 49,116 $ 48,914Total common shares outstanding (c) 870.0 861.6 861.4Book value per common share (a÷c) $ 74.93 $ 76.46 $ 73.86Adjusted book value per common share (b÷c) 58.89 57.01 56.78
* Represents deferred tax assets only related to U.S. net operating loss and foreign tax credit carryforwards on a U.S. GAAP basis and excludes other balance sheet deferred tax assets and liabilities.
Tangible Book Value Per Common Share Total AIG common shareholders' equity (a) $ 65,190 $ 65,877 $ 63,623Less Intangible Assets:
Goodwill 4,038 4,074 4,026Value of business acquired 317 126 122Value of distribution channel acquired 536 497 507Other intangibles 333 319 322Total intangibles assets 5,224 5,016 4,977
Less: Accumulated other comprehensive income (AOCI) 4,982 13,511 10,978Add: Cumulative unrealized gains and losses related to
Fortitude Re’s Funds Withheld Assets - 4,657 4,392Less: Deferred tax assets (DTA)* 8,977 7,907 8,123Total adjusted tangible common shareholders' equity (d) $ 46,007 $ 44,100 $ 43,937Total common shares outstanding (c) 870.0 861.6 861.4Adjusted tangible book value per common share (d÷c) $ 52.88 $ 51.18 $ 51.01

37
Non-GAAP Reconciliations Return on Common Equity
(in millions) Quarterly December 31,Return On Common Equity Computations 4Q19 4Q20 2019 2020Actual or Annualized net income (loss) attributable to AIG
common shareholders (a) $ 3,688 $ (240) $ 3,326 $ (5,973)Actual or Annualized adjusted after-tax income attributable to
AIG common shareholders (b) $ 3,692 $ 3,308 $ 4,078 $ 2,201Average AIG Common Shareholders' equity (c) $ 65,154 $ 64,750 $ 62,205 $ 63,225Less: Average AOCI 5,299 12,245 3,261 7,529Add: Average cumulative unrealized gains and losses related to
Fortitude Re’s Funds Withheld Assets - 4,525 - 2,653Less: Average DTA* 9,185 8,015 9,605 8,437Average adjusted common shareholders' equity (d) $ 50,670 $ 49,015 $ 49,339 $ 49,912ROCE (a÷c) 5.7% (0.4%) 5.3% (9.4%)Adjusted return on common equity (b÷d) 7.3% 6.7% 8.3% 4.4%
* Represents deferred tax assets only related to U.S. net operating loss and foreign tax credit carryforwards on a U.S. GAAP basis and excludes other balance sheet deferred tax assets and liabilities.
General Insurance(in millions) Quarterly
4Q19 4Q20Adjusted pre-tax income $ 778 $ 809
Interest expense on attributed financial debt 149 144Adjusted pre-tax income including
attributed interest expense 629 665Income tax expense 165 182
Adjusted after-tax income $ 464 $ 483Dividends declared on preferred stock 3 3
Adjusted after-tax income attributable to common shareholders (a) $ 461 $ 480
Ending adjusted segment common equity 25,623 25,540Average adjusted segment common equity (b) 25,697 25,582Return on adjusted segment common equity (a÷b) 7.2 % 7.5 %
Life and Retirement Twelve Months Ended(in millions) Quarterly December 31,
4Q19 4Q20 2019 2020Adjusted pre-tax income $ 858 $ 1,027 $ 3,553 $ 3,531
Interest expense on attributed financial debt 66 67 258 275Adjusted pre-tax income including attributed interest expense 792 960 3,295 3,256
Income tax expense 159 186 653 642Adjusted after-tax income $ 633 $ 774 $ 2,642 $ 2,614
Dividends declared on preferred stock 2 2 6 8Adjusted after-tax income attributable to common
shareholders (a) $ 631 $ 772 $ 2,636 $ 2,606
Ending adjusted segment common equity $ 17,494 $ 18,436 $ 17,494 $ 18,436Average adjusted segment common equity (b) 17,344 18,786 17,784 18,737Return on adjusted segment common equity (a÷b) 14.6 % 16.4 % 14.8 % 13.9 %

38
Non-GAAP ReconciliationsAccident Year Loss Ratio, as adjusted, and Accident Year Combined Ratio, as adjusted
General Insurance - North AmericaTwelve Months
EndedQuarterly December 31,
4Q19 4Q20 2019 2020Loss ratio 74.0 88.9 73.1 84.6Catastrophe losses and reinstatement premiums (10.4) (18.0) (6.8) (16.7)Prior year development 2.6 (2.2) 1.0 1.2Adjustments for ceded premium under
reinsurance contracts and other 0.7 - 0.2 (0.1)Accident year loss ratio, as adjusted 66.9 68.7 67.5 69.0
Acquisition ratio 19.1 15.6 19.8 16.7General operating expense ratio 10.1 10.4 10.2 11.3
Expense ratio 29.2 26.0 30.0 28.0
Combined ratio 103.2 114.9 103.1 112.6Accident year combined ratio, as adjusted 96.1 94.7 97.5 97.0
General InsuranceTwelve Months
EndedQuarterly December 31,
4Q19 4Q20 2019 2020Loss ratio 65.6 70.2 65.2 71.0Catastrophe losses and reinstatement premiums (6.5) (9.0) (4.8) (10.3)Prior year development 2.2 (0.9) 1.1 0.1Adjustments for ceded premium under reinsurance contracts and other 0.3 - 0.1 -
Accident year loss ratio, as adjusted 61.6 60.3 61.6 60.8Acquisition ratio 21.4 19.8 21.8 20.4General operating expense ratio 12.8 12.8 12.6 12.9
Expense ratio 34.2 32.6 34.4 33.3
Combined ratio 99.8 102.8 99.6 104.3Accident year combined ratio, as adjusted 95.8 92.9 96.0 94.1
General Insurance - North America -Twelve Months
EndedPersonal Insurance Quarterly December 31,
4Q19 4Q20 2019 2020Loss ratio 45.7 86.0 57.0 80.9Catastrophe losses and reinstatement premiums (14.8) (22.6) (8.1) (16.9)Prior year development 17.8 (8.0) 2.8 (4.0)Adjustments for ceded premium under reinsurance contract 0.6 - 0.3 -
Accident year loss ratio, as adjusted 49.3 55.4 52.0 60.0
Acquisition ratio 34.0 27.1 33.8 28.1General operating expense ratio 8.9 20.1 9.2 15.7
Expense ratio 42.9 47.2 43.0 43.8
Combined ratio 88.6 133.2 100.0 124.7Accident year combined ratio, as adjusted 92.2 102.6 95.0 103.8
General Insurance - North America -Twelve Months
EndedCommercial Lines Quarterly December 31,
4Q19 4Q20 2019 2020Loss ratio 84.7 89.3 79.0 85.4Catastrophe losses and reinstatement premiums (8.7) (17.4) (6.3) (16.7)Prior year development (3.2) (1.4) 0.3 2.2Adjustments for ceded premium under
reinsurance contracts and other 0.7 - 0.2 -Accident year loss ratio, as adjusted 73.5 70.5 73.2 70.9
Acquisition ratio 13.5 14.0 14.6 14.3General operating expense ratio 10.6 9.1 10.5 10.3
Expense ratio 24.1 23.1 25.1 24.6
Combined ratio 108.8 112.4 104.1 110.0Accident year combined ratio, as adjusted 97.6 93.6 98.3 95.5

39
Non-GAAP ReconciliationsAccident Year Loss Ratio, as adjusted, and Accident Year Combined Ratio, as adjusted
General Insurance - International -Twelve Months
EndedCommercial Lines Quarterly December 31,
4Q19 4Q20 2019 2020Loss ratio 62.2 58.8 63.0 66.8Catastrophe losses and reinstatement premiums (3.0) (4.0) (3.5) (8.5)Prior year development 0.2 1.1 0.4 (1.8)
Accident year loss ratio, as adjusted 59.4 55.9 59.9 56.5
Acquisition ratio 20.3 19.4 20.3 19.8General operating expense ratio 14.4 13.9 14.3 13.8
Expense ratio 34.7 33.3 34.6 33.6
Combined ratio 96.9 92.1 97.6 100.4Accident year combined ratio, as adjusted 94.1 89.2 94.5 90.1
General Insurance - InternationalTwelve Months
EndedQuarterly December 31,
4Q19 4Q20 2019 2020Loss ratio 58.4 55.9 58.6 60.5Catastrophe losses and reinstatement premiums (3.2) (2.1) (3.2) (5.3)Prior year development 1.9 0.2 1.1 (0.7)Adjustment for ceded premium under reinsurance contract - - 0.1 -
Accident year loss ratio, as adjusted 57.1 54.0 56.6 54.5
Acquisition ratio 23.3 23.0 23.6 23.2General operating expense ratio 15.2 14.7 14.7 14.2
Expense ratio 38.5 37.7 38.3 37.4
Combined ratio 96.9 93.6 96.9 97.9Accident year combined ratio, as adjusted 95.6 91.7 94.9 91.9
General Insurance - International -Twelve Months
EndedPersonal Insurance Quarterly December 31,
4Q19 4Q20 2019 2020Loss ratio 54.5 52.7 54.3 53.7Catastrophe losses and reinstatement premiums (3.3) - (2.9) (1.8)Prior year development 3.5 (0.9) 1.9 0.4
Accident year loss ratio, as adjusted 54.7 51.8 53.3 52.3
Acquisition ratio 26.3 26.9 26.8 26.8General operating expense ratio 16.0 15.4 15.1 14.8
Expense ratio 42.3 42.3 41.9 41.6
Combined ratio 96.8 95.0 96.2 95.3Accident year combined ratio, as adjusted 97.0 94.1 95.2 93.9
General Insurance - Global Commercial Lines
Twelve Months Ended
Quarterly December 31,4Q19 4Q20 2019 2020
Loss ratio 74.7 76.0 71.9 77.1Catastrophe losses and reinstatement premiums (6.2) (11.6) (5.0) (13.1)Prior year development (1.7) (0.3) 0.3 0.5Adjustments for ceded premium under reinsurance contracts and other 0.4 - 0.1 -
Accident year loss ratio, as adjusted 67.2 64.1 67.3 64.5
Acquisition ratio 16.6 16.4 17.1 16.8General operating expense ratio 12.3 11.2 12.2 11.9
Expense ratio 28.9 27.6 29.3 28.7
Combined ratio 103.6 103.6 101.2 105.8Accident year combined ratio, as adjusted 96.1 91.7 96.6 93.2

40
Non-GAAP ReconciliationsNet Premiums Written – Change in Constant Dollar
Twelve Months EndedQuarterly December 31,
(in millions) 4Q19 4Q20 2019 2020 Net investment income per Consolidated Statements of Operations $ 3,587 $ 3,957 $ 14,619 $ 13,631
Changes in fair value of securities used to hedge guaranteed living benefits (16) (14) (229) (56)Changes in the fair value of equity securities (152) (216) (158) (200)Net investment income on Fortitude Re funds withheld assets - (479) - (1,053)Net realized capital gains (losses) related to economic hedges and other 43 (22) 158 (1)
Total Net investment income - APTI Basis $ 3,462 $ 3,226 $ 14,390 $ 12,321Add: Investment expenses 144 129 525 541Add: Consolidation and eliminations 166 307 385 572
AIG investment income, APTI basis $ 3,772 $ 3,662 $ 15,300 $ 13,434Consolidation and eliminations (166) (307) (385) (572)Net realized capital (gains) losses related to economic hedges and other (43) 22 (158) 1
Gross investment income, APTI basis $ 3,563 $ 3,377 $ 14,757 $ 12,863Less: Impact of Fortitude Re prior to deconsolidation (510) - (1,951) (521)
Gross investment income, APTI basis, excluding the impact of Fortitude Re for all periods, including periods prior to deconsolidation $ 3,053 $ 3,377 $ 12,806 $ 12,342
Total Net investment income - APTI Basis $ 3,462 $ 3,226 $ 14,390 $ 12,321Less: Impact of Fortitude Re prior to deconsolidation (498) - (1,900) (499)
Total Net investment income - APTI Basis, excluding the impact ofFortitude Re for all periods, including periods prior to deconsolidation $ 2,964 $ 3,226 $ 12,490 $ 11,822
Reconciliation of Net Investment Income
Global - International -General Insurance Commercial Lines Commercial LinesForeign exchange effect on worldwide premiums: 4Q20 4Q20
Change in net premiums writtenIncrease (decrease) in original currency 7 % 5 % Foreign exchange effect 1 2Increase (decrease) as reported in U.S. dollars 8 % 7 %

41
Non-GAAP ReconciliationsPremiums
(in millions) Twelve Months EndedQuarterly December 31,
Individual Retirement: 4Q19 4Q20 2019 2020Premiums $ 39 $ 37 $ 104 $ 151Deposits 3,121 2,720 14,804 10,228Other (4) 1 (9) (9)Premiums and deposits $ 3,156 $ 2,758 $ 14,899 $ 10,370Individual Retirement (Fixed Annuities):Premiums $ 39 $ 38 $ 107 $ 154Deposits 725 522 5,212 2,414Other (10) (1) (39) (33)Premiums and deposits $ 754 $ 559 $ 5,280 $ 2,535Individual Retirement (Variable Annuities):Premiums $ - $ (1) $ (3) $ (3)
1
Deposits 839 931 2,852 2,982Other 6 2 30 24
1
Premiums and deposits $ 845 $ 932 $ 2,879 $ 3,003Individual Retirement (Index Annuities):Premiums $ - $ - $ - $ -
1
Deposits 1,362 1,128 5,466 4,096Other - - - -
1
Premiums and deposits $ 1,362 $ 1,128 $ 5,466 $ 4,096Individual Retirement (Retail Mutual Funds):Premiums $ - $ - $ - $ -
1
Deposits 195 139 1,274 736Other - - - -
1
Premiums and deposits $ 195 $ 139 $ 1,274 $ 736Group Retirement:Premiums $ 2 $ 5 $ 16 $ 19Deposits 2,310 2,194 8,330 7,477Other - - - -
1
Premiums and deposits $ 2,312 $ 2,199 $ 8,346 $ 7,496Life Insurance:Premiums $ 450 $ 491 $ 1,805 $ 1,915Deposits 438 430 1,667 1,648Other 218 235 810 850Premiums and deposits $ 1,106 $ 1,156 $ 4,282 $ 4,413Institutional Markets:Premiums $ 503 $ 417 $ 1,864 $ 2,539Deposits 42 864 931 2,281Other 6 6 27 26Premiums and deposits $ 551 $ 1,287 $ 2,822 $ 4,846Total Life and Retirement:Premiums $ 994 $ 950 $ 3,789 $ 4,624Deposits 5,911 6,208 25,732 21,634Other 220 242 828 867Premiums and deposits $ 7,125 $ 7,400 $ 30,349 $ 27,125