4700 ieee sensors journal, vol. 15, no. 8, august...
TRANSCRIPT

4700 IEEE SENSORS JOURNAL, VOL. 15, NO. 8, AUGUST 2015
Study on Effect of [OH-] Linkages on Physical,Electrical, and Gas Sensing Properties
of ZnO NanoparticlesShweta Jagtap and Kaustubh Priolkar
Abstract— This paper reports the growth mechanism of sol–gelderived nanocrystalline ZnO powder. The influence of pH valueon the particle size and its properties are studied using X-raydiffraction, UV, Fourier transform infrared spectroscopy,photoluminescence (PL), and impedance spectroscopy.UV analysis reveals an increase in bandgap due to decrease inparticle size. The strong UV emission along with some defectsites is also observed from PL spectra. The presence of Zn-OHlinkages are observed in the case of ZnO with lower pH values(pH 7, 8, and 9) which are responsible for lower sensitivitytoward volatile organic compounds. However, higher pH values(pH 10 and 11) have absence of Zn-OH linkage, which improvesthe gas sensing performance.
Index Terms— ZnO, nanoparticles, pH, sensor response, VOCs.
I. INTRODUCTION
SEMICONDUCTING oxides with many novel propertiesfrom electrical, chemical, optical, magnetic are funda-
mental to the development of smart and functional materials,devices and systems. ZnO is one of the n type semiconductormaterials having a wide band gap of 3.37eV and large excitonbinding energy of 60 meV at room temperature. In ZnO,zinc coordination is an indicator of covalent bonding, howeverthe ZnO bond also possess a very strong ionic charactertherefore, ZnO is useful in many applications such as solarcell, gas sensor, piezoelectric devices, and acoustic [1]–[3].Soft chemistry routes in particular sol gel procedure havemany advantages such as ability to achieve superior puritymaterial, compositional homogeneity of the products atmoderate temperatures. Although aqueous sol-gel approacheswere highly successful in the synthesis of bulk metal oxides,some major limitations are brought forward when it comesto the preparation of their nanoscale counterparts. Thecomplexity arises mainly due to the high reactivity of themetal oxide precursor and double role of water as ligand andsolvent [4]–[6]. Non aqueous sol gel processes in organicsolvents are able to overcome some of the limitations ofaqueous systems. Organic compounds are not only the
Manuscript received March 12, 2015; revised April 8, 2015; acceptedApril 8, 2015. Date of publication April 27, 2015; date of current ver-sion June 23, 2015. This work was supported by the University GrantsCommission D. S. Kothari Post-Doctoral Fellowship. The associate editorcoordinating the review of this paper and approving it for publication wasProf. Michael J. Schöning.
The authors are with the Department of Physics, Goa University,Panaji 403001, India (e-mail: [email protected]; [email protected]).
Color versions of one or more of the figures in this paper are availableonline at http://ieeexplore.ieee.org.
Digital Object Identifier 10.1109/JSEN.2015.2426681
oxygen supplying agent for metal oxides but also stronglyinfluence the particle size, shape, surface and assemblyproperties. The slow reaction rates that cause moderatereactivity, in combination with the stabilizing effect of theorganic species lead to the formation of highly crystallineproducts that are often characterized by uniform particlemorphologies and particle size in the range of just fewnanometers. The oxygen, for nanoparticle formation isprovided by the solvents (ethers, alcohols, aldehydes etc)or by organic constituents of precursors. Although pH ofa solution is one of the most easily measurable andcontrollable parameters, its influence on morphology andstructure has not been studied extensively. From the availableliterature, we envisage that pH variation of precursor solutionaffects the morphology of the nanostructures significantly [7].Rizwan et al. [8] found variation from plate-like to flower-likemorphology on increasing pH from 6 to12; they concludedthat lower pH was suitable for obtaining 2D structurewhere as higher pH values can result in rod like structure.Meng et al. [9], [10] has also reported SnO2-graphenenanocomposite for ppb level benzene detection andZnO flower like hierarchical structures for VOCs. Thetheoretical investigations on the growth of nanocrystals tellsthat the growth mechanism could be either controlled bydiffusion of the particles, i.e., Ostwald ripening, or controlledby the reaction at the surface or by both parameters, even inthe absence of capping agents. Several investigations in theliterature report the growth of ZnO nanocrystals carried outin the presence of capping agents. In these cases, the growthwould be a product of several complex processes, interactionswith the capping agents, which is necessary to control thesize and size distribution of the ZnO nanocrystals.
Further ZnO has been traditionally employed as a gas sensorby making use of the change in resistivity on the exposure tothe relevant gases or vapours. It is well known that the gassensing mechanism is based on the reaction between the testgas molecules and adsorbed oxygen species on the surfaceof metal oxide. The amount of adsorbed oxygen is stronglydependent on morphology and structure, surface area and grainsize of the sensing material. Thus many research groups aretrying to develop novel methods for the synthesis of zincoxide having different morphologies for potential applicationin gas sensing [7], [11]. In this paper we have demonstrated asimple nanoparticle synthesis route without using any specialcapping agent. The effect of changing pH of the solution on
1530-437X © 2015 IEEE. Personal use is permitted, but republication/redistribution requires IEEE permission.See http://www.ieee.org/publications_standards/publications/rights/index.html for more information.

JAGTAP AND PRIOLKAR: STUDY ON EFFECT OF [OH-] LINKAGES ON PHYSICAL, ELECTRICAL, AND GAS SENSING PROPERTIES 4701
particle size is studied. It is observed that this variation isdue to the presence/absence of Zn-OH linkage. Further theeffect of OH linkages is studied for the sensitivity towards gassensing. To our information, as on today, no research grouphas reported this OH linkages effect in case of VOCs.
II. EXPERIMENTAL
The ZnO sols were prepared by dissolving Zinc Acetatedihydrate (CH3COO)2 Zn.2H2O, (SD Fine-chem. Ltd) inmethanol at room temperature. A clear solution of 0.2 M wasobtained by continuous stirring of the prepared solution atroom temperature for 60 min. The solution was found to bestable and transparent with no precipitate. ZnO powders wereprepared by varying the pH value of the solution from 7 to 11.The pH value of the solution was adjusted to the desiredvalue using sodium hydroxide (0.1N NaOH, Qualigens)solution. The solution was kept for 48 hrs, to complete thegelation and hydrolysis process. During this period of time,white ZnO precipitates slowly crystallize and settle down atthe bottom of the flask. The white precipitate was filtered andwashed with excess methanol to remove the starting materialand dried at 120 °C [2]. The pellets of identical dimensions(0.95 cm diameter and 0.15 cm thickness) were made byusing Hydraulic press and then were used for measurements.Prepared ZnO powders were characterized by X-raydiffraction (XRD) collected using RIGAKU diffractometerwith Cu Kα radiations in the range 2� = 20 to 80°. Fouriertransform infrared spectroscopy (FTIR) spectra were recordedwith a SHIMADZU FTIR-8900 spectrometer in the rangeof 350-4000 cm−1. The spectral absorption was determinedusing UV visible spectrometer (Model: 2401PC, Make:Shimadzu) in the wavelength ranging from 200 nm to 800 nm.For transmission electron microscopy (TEM) studies,JEOL Transmission Electron Microscope-1200EX (120KV)was employed and images were recorded. The photolu-minescence (PL) spectra were measured by using AgilentCary eclipse spectrofluorometer. Impedance measurementswere made using Wayne Kerr Precision componentanalyzer (6440B). Measurements were carried out at roomtemperature to extract the electrical properties of the preparedZnO pellets in the frequency range of 20 Hz to 3 MHz.
III. RESULTS AND DISCUSSION
A. XRD Analysis
The XRD pattern of prepared powder samples with variablepH values are shown in figure 1. The XRD analysis of allthe powder samples depicts the wurtzite hexagonal structure(JCPDS data no. 36-1451). In case of pH 7, 8 and 9 powdersamples, peak broadening can be seen as compared to thesamples with higher pH. Additionally, for pH 7, 8 and 9powder samples, the XRD pattern shows the presenceof Zn(OH)2 phases (JCPDS data no. 74-0094). It is also notedthat the degree of crystallinity increases with increasing the pHof the solution. The particle size for all powders was calculatedfrom the FWHM in XRD pattern using Scherrer’s formula.Lattice parameters for all samples are also calculated and givenin table 1.
Fig. 1. XRD of ZnO powders.
TABLE I
DATA OF PARTICLE SIZE AND LATTICE PARAMETERS
Fig. 2. UV-visible absorption spectra for ZnO nanoparticles with variable pH.
B. UV-Visible Absorption
The optical absorption measurement is an initial stepto observe the nanoparticle behavior. Figure 2 gives theroom temperature absorption spectra of ZnO nanoparticlesprepared using different pH values. The excitonic peak for allZnO nanoparticles prepared with different pH are found to beblue shifted with respect to their bulk. This can be due to theconfinement effects. The absorption exhibits a blue shift from3.37 to 3.47 eV as the size of ZnO nanocrystalline decreasesfrom 31 to 14 nm.

4702 IEEE SENSORS JOURNAL, VOL. 15, NO. 8, AUGUST 2015
Fig. 3. Variation of band gap with particle size of ZnO powder.
Fig. 4. FTIR of the ZnO powders with variable pH.
The variation in the band gap of nanoparticles can be alsoevaluated from the effective mass model expression as,
Eg∗ ∼= Ebulkg + h2π2
2er2
(1
me+ 1
mh
)− 1.8e2
4ππε0r(1)
Where Ebulkg is the bulk energy gap, r is the crystallite radius,
me is the effective mass of the electrons, mh is the effectivemass of the holes, ε is the relative permittivity, ε0 is thepermittivity of free space, h is the plank’s constant, e isthe charge of the electron. For ZnO, Ebulk
g = 3.35eV,me = 0.24m0, mh = 0.45m0, where m0 is the free electronmass. Figure 3 shows a plot of the band gap variation withvariation in the size of the ZnO nanoparticles. The solidcurve shows the theoretical results of Eq. (1) for theoreticalcalculations; the values of ‘r’ have been taken from theXRD data. It is noticed that the band gap measured fromabsorption spectra closely coincides with the theoreticalresults.
C. Fourier Transform Infrared Spectroscopy
Figure 4 shows FTIR analysis of the ZnO powders in therange of 350 to 4000 cm−1 at room temperature. It is seen
Fig. 5. PL spectra of ZnO nanoparticles with different pH values.
from the figure that presence of strong stretching mode ofZn-O at 450 cm−1 was also noted for all samples. Along withstretching mode, for lower pH values i.e. pH 7, pH8 and pH 9,two bands at 1560 and 1393 cm−1 correspondingto C=O and C-H stretching vibrations are observed. Thesebands are the characteristic of acetate group complexes tozinc species [12]. This impurity is due to the unreacted acetateat lower pH. Also a small peak appearing at 1335 cm−1
could be due to stretching of CO bond of alcohols [13].In addition to that spectra showed a strong band at 3400 cm−1,which is attributed to OH stretching mode [14]. Even thoughall the samples were prepared in identical conditions, sampleswith lower pH showed presence of OH ions. It is possiblethat presence of OH ions has its roots in preparation process.As these samples were prepared using Zn acetate andNaOH as starting chemicals, some of the OH ions presentin starting materials could be linked to the Zn ions inthe surface layers on ZnO particle. It can also be seenthat the stretching mode progressively disappears withincrease in pH and is nearly absent for powders preparedusing solution of pH 10 and 11. Concomitantly, the ZnOstretching mode at 450 cm−1 sharpens lending weight tohypothesis that pH ions are indeed bonded to Zn ions in thesurface layers of ZnO nanoparticles. It may be mentionedhere that all IR spectra were recorded under identicalconditions.
D. Photoluminescence
The room temperature PL spectra for ZnO powders withdifferent pH values are shown in figure 5. The excitationwavelength used here is 255nm. The strong UV emissionfor all samples are observed at wavelength of 359-370nm.The other defect bands are also observed for all the samples.It is known that different types of defects are responsible forgreen, yellow, and orange-red emissions [15]. It is well knownthat, the UV emission was attributed to the near band edgeemission of the wide band gap ZnO, which is responsiblefor the excitonic recombination. It has been alreadydemonstrated that, the green band emission corresponds to
JAGTAP AND PRIOLKAR: STUDY ON EFFECT OF [OH-] LINKAGES ON PHYSICAL, ELECTRICAL, AND GAS SENSING PROPERTIES 4703
the crystal defects such as vacancies, interstitial sites in ZnO.These green emissions originated from the recombination ofthe holes with the electrons occupying the singly ionizedoxygen vacancies. The mechanism of the green emission hasbeen suggested to be mainly due to the concentration of freeelectrons and the existence of various point defects. The deep-level emission, i.e. green PL, of ZnO is usually ascribedto structural defects and impurities [15]. The emission bandfound at 420 nm is attributed to the interstitial oxygen [14].Blue emissions at 465 nm and 488 nm is due to the intrinsicdefects i.e. O and Zn vacancies or interstitials and theircomplexes [17]. In addition to this, samples with pH 7, 8 and 9shows considerable emission at 590 nm. This emission isdue to the presence of OH ions at the surface [18]. Minoremission at 698 nm is also noted for all the samples,which is attributed due to the presence of excess ofoxygen [19].
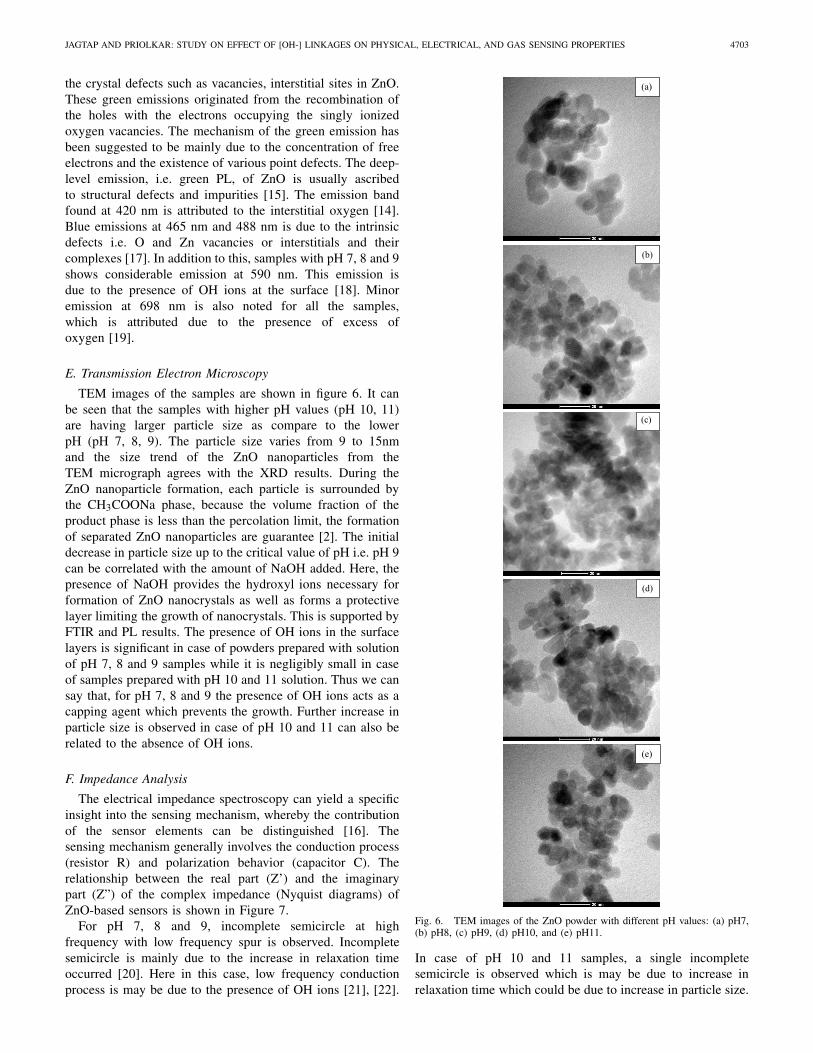
E. Transmission Electron Microscopy
TEM images of the samples are shown in figure 6. It canbe seen that the samples with higher pH values (pH 10, 11)are having larger particle size as compare to the lowerpH (pH 7, 8, 9). The particle size varies from 9 to 15nmand the size trend of the ZnO nanoparticles from theTEM micrograph agrees with the XRD results. During theZnO nanoparticle formation, each particle is surrounded bythe CH3COONa phase, because the volume fraction of theproduct phase is less than the percolation limit, the formationof separated ZnO nanoparticles are guarantee [2]. The initialdecrease in particle size up to the critical value of pH i.e. pH 9can be correlated with the amount of NaOH added. Here, thepresence of NaOH provides the hydroxyl ions necessary forformation of ZnO nanocrystals as well as forms a protectivelayer limiting the growth of nanocrystals. This is supported byFTIR and PL results. The presence of OH ions in the surfacelayers is significant in case of powders prepared with solutionof pH 7, 8 and 9 samples while it is negligibly small in caseof samples prepared with pH 10 and 11 solution. Thus we cansay that, for pH 7, 8 and 9 the presence of OH ions acts as acapping agent which prevents the growth. Further increase inparticle size is observed in case of pH 10 and 11 can also berelated to the absence of OH ions.
F. Impedance Analysis
The electrical impedance spectroscopy can yield a specificinsight into the sensing mechanism, whereby the contributionof the sensor elements can be distinguished [16]. Thesensing mechanism generally involves the conduction process(resistor R) and polarization behavior (capacitor C). Therelationship between the real part (Z’) and the imaginarypart (Z”) of the complex impedance (Nyquist diagrams) ofZnO-based sensors is shown in Figure 7.
For pH 7, 8 and 9, incomplete semicircle at highfrequency with low frequency spur is observed. Incompletesemicircle is mainly due to the increase in relaxation timeoccurred [20]. Here in this case, low frequency conductionprocess is may be due to the presence of OH ions [21], [22].
Fig. 6. TEM images of the ZnO powder with different pH values: (a) pH7,(b) pH8, (c) pH9, (d) pH10, and (e) pH11.
In case of pH 10 and 11 samples, a single incompletesemicircle is observed which is may be due to increase inrelaxation time which could be due to increase in particle size.

4704 IEEE SENSORS JOURNAL, VOL. 15, NO. 8, AUGUST 2015
Fig. 7. Nyquist plots (Z” versus Z’) for the ZnO powder with differentpH values.
As no low frequency spur is observed (no OH ions presence),the process is dominated by charge transfer resistance fromthe nanoparticle interior and only high frequency capacitive
Fig. 8. Hypothetical microstructure model for ZnO.
Fig. 9. Equivalent circuit for ZnO.
behavior is observed. It is also seen from the figure thatdiameter of semicircle is also varied for variable pH values.Depressed semicircles indicate increase in conductivity ofZnO pellets.
Here in this case, the overall conduction is mainly related to:intergranular contact, bulk conductivity and electrode contactas seen from the figure 8. The intergranular contacts areconsisting of space charge layer depleted of electrons isusually more resistive than the bulk. The total conductance isthen determined by the percolation path through the low resis-tance of the bulk grains in series with the high resistanceof intergranular contact [23]. Electrons must overcome theintergranular contact barrier in order to cross from grain toanother for conduction. The capacitive contribution of theelectrode contact (EC) originates from the capacitancebetween the electrode and the conducting core, surroundedby a less conducting ZnO shell. Hence as seen from thefigure 9, the equivalent circuit is consists of RB, RgbCgband RCCC. Where, RB representing the bulk contribution, aparallel (RgbCgb) represents the element for the intergranularcontact, and a parallel (RCCC) element denotes the electrodecontact.
G. Gas Sensing Properties
Sensors fabricated from powder synthesized at differentpH values were exposed to 200 ppm of methanol, ethanol andpropanol at different temperatures. The comparative responseof VOCs for all the sensors with different pH values is shownin Figure 10. Gas sensor response (Rs) is defined as theratio of resistance of a sample (at an operating temperature)in air to its resistance in exposed test gas and is given asRs = (Rair/Rgas) [24]. Study revealed that optimum operatingtemperature of all the ZnO sensors is found to be at 250 °C.The fabricated sensors showed maximum response at 250 °C,and it was noted that further increased in temperature is

JAGTAP AND PRIOLKAR: STUDY ON EFFECT OF [OH-] LINKAGES ON PHYSICAL, ELECTRICAL, AND GAS SENSING PROPERTIES 4705
Fig. 10. Sensing response of ZnO with different pH values for VOCs.
responsible for decrease in Rs. It is evident from figure thatsensing response was substantially higher for samples preparedat higher pH. The sensitivity order is as follows, pH7 < pH8 <pH9 < pH10 < pH11. It is also observed that the variation ofsensing response magnitude for three alcohols in the followingorder: propanol>ethanol>methanol.
The lower sensitivity for lower pH values can be correlatedto the presence of OH ions. As sensitivity depends on thesurface area of the nanoparticles, the surface to volume ratio
of nanoparticles plays a major role in adsorption process ofgases on the surface of ZnO pellet. More the surface areaavailable greater is the adsorption of on ZnO pellet surfacehence higher the sensitivity. Since the samples prepared underlower pH conditions have smaller particle size, they naturallyhave higher surface to volume ratio and therefore should haveexhibited higher sensitivity towards gas sensing. However thisis not true for our case. For pH 7, 8 and 9 samples, eventhough they smaller particle size they shows less sensitivitytowards VOCs. This is due to the fact that, these samplesshows presence of OH linkages i.e. presence of Zn(OH)2 phasein the diffraction patterns and presence of O-H stretching andbending modes in IR spectra. These OH ions are attached tothe Zn ions present in the surface layers of nanoparticles. ThisZn-OH linkages prevents adsorption of gases on the surface ofnanoparticles thereby lowering the sensitivity of these samples.However, samples prepared at higher pH (pH 10 and 11)Zn(OH)2 phase is absent. Hence more pure ZnO is availablewhen exposed to the formed gas in the chamber. It is observedthat highest sensitivity is obtained in case of samples preparedwith pH 11 solution. Similarly as seen from the PL spectra,ZnO sample with pH 11 shows considerable blue emissionat 465 nm as compared to other samples. This emissionis attributed to oxygen vacancies. During the conductionprocess, the intrinsic oxygen vacancies are extracted from theconduction band and are trapped at the surface leading to anelectron depleted surface region called as space charge layer.It is unlikely that a change in <1% the surface coverage causesa factor of 100 change in the total resistance. Therefore, thesurface barrier at intergraular contact plays an important role inachieving high sensitivity in this case. Therefore these samplesin spite of having larger particle sizes show higher sensitivitytowards VOCs.
H. Response and Recovery Time
As the sample with pH 11 is showing highest sensitivitytowards propanol, the sensing response and recoveryat 200 ppm with time at the operating temperature of 250 °Cwas measured. The response and recovery time were found tobe 4 s and 10 s, respectively.
I. Repeatability and Reproducibility Tests
The repeatability and reproducibility test were carried outfor all the samples. It is found that for cycle to cycle variationof prepared samples showed the uncertainty of ±3% inresistance and ±3% in sensor response and uncertainty ofabout ±5% in resistance with ±2% in sensor response in caseof sample to sample variation.
The sensing is a complex phenomenon which occurs on thesurface of the metal oxide semiconductor. However, the sur-face reactivity of particles is known to rapidly increase with theincrease in surface-to-bulk ratio because the strong curvatureof the particle surface generates a large density of defects,which are the most reactive surface sites. The sensor responseis quantitatively determined by number of active sites on thesurface of gas sensors. When ZnO nanostructured sensors areexposed to air, oxygen molecules adsorb on the surface of the

4706 IEEE SENSORS JOURNAL, VOL. 15, NO. 8, AUGUST 2015
materials to form O2−, O−, O2− ions by capturing electrons
from the conduction band. Thus the ZnO sensors show a highresistance in air. The surface of the ZnO material undergoesthe following reactions [24],
O2(gas) ↔ O2(ads)
O2(ads) + e− ↔ O2−(ads)
O2−(ads) + e− ↔ 2O−(ads)
O−(ads) + e− ↔ O2−(ads)
For ZnO, the O2− species dominates at temperature
below 150 °C, and above this temperature O− speciesdominate [24]. At grain boundaries, adsorbed oxygen formsa potential barrier, which prevents carrier from moving freely.The electrical resistance is attributed to this potential barrier.In the presence of reducing gases, reducing gases reactswith the highly reactive chemisorbed oxygen and hence thesurface density of negatively charged oxygen decreases andthe bound electrons are made free leading to the reduction ofthe barrier height in the grain boundary. The reduced barrierheight decreases the sensor resistance. In presence of air,oxygen is ionosorbed on the ZnO surface and ionosorbedspecies acts as electron acceptor due to their relative energeticposition with respect to the fermi level. Depending upon thetemperature, oxygen is ionosorbed on the surface as O2
−(for lower temperature i.e. below 150 °C) and O− ionsfrom 150 to 400 °C. The electrons required for this processoriginates from the donor sites. The second reasonable expla-nation could be because O atoms to form O− get an electronicrelease energy (electron affinity: −141 kJ/mol), O− and thenget an O2− need to absorb energy electrons (electron affinity:780 kJ/mol). Lower temperatures favor the formation of theformer, high temperatures favor the formation of the latter.Furthermore, according to the molecular orbital theory, O2 ismore stable than the O2
− and O22−. O2
− and O22− are
easier to decompose at high temperatures than at lowtemperatures.
When metal oxide based sensors are exposed to reducingagents at moderate temperature, the target gas reacts withthe adsorbed oxygen and as a result captured electrons goback to the conduction band. This eventually increases theconductivity of metal oxide based sensors [10]. The reactioncan be described as follows:
R + O−(ads) → RO + e−The possible explanations for gas sensing is explain on thebasis of complete oxidation of these alcohols and in theprocess consuming 9, 6 and 3 O− (ads) by propanol, ethanoland methanol, respectively. Here the phenomenon can bestudied considering ethanol for example and shownin figure 11.
The target gas (ethanol) may undergo different reactions,and then can take two routes of decomposition reaction,i.e. Dehydration and dehydrogenation:
C2H5OH → C2H4 + H2O (acidic oxide)
2C2H5OH → 2CH3CHO + H2 (basic oxide)
Fig. 11. Band diagram of ZnO for ethanol sensing.
These primary products thus formed are consecutivelyoxidized to CO, CO2 and H2O.
C2H4 + 3O22−(ads) → 2CO2 + 2H2O + 6e −
2CH3CHO(ads) + 5O22−(ads) → 4CO2 + 4H2O + 10e−
IV. CONCLUSION
Structural and optical properties of synthesizedZnO nanoparticles with variable pH values have beenstudied. It is noted that, presence of OH ions are responsiblefor smaller particle size. The presence of Zn-OH linkagesobserved in case of ZnO nanoparticles with lower pH values(pH 7, 8 and 9) are responsible for lower sensitivitytowards volatile organic compounds (VOCs). However higherpH values (pH 10 and 11) with absence of Zn-OH linkageimproves the gas sensing performance. The repeatability andreproducibility measurements show that the prepared sensorcan be used as a VOCs gas sensor.
ACKNOWLEDGMENTS
The authors also like to thank the Department of Physics,University of Pune for TEM characterization.
REFERENCES
[1] N. Singh, P. Pandey, and F. Z. Haque, “Effect of heat and time-periodon the growth of ZnO nanorods by sol–gel technique,” Opt.-Int. J. LightElectron Opt., vol. 123, no. 15, pp. 1340–1342, 2012.
[2] S. Rani, P. Suri, P. K. Shishodia, and R. M. Mehra, “Synthesis ofnanocrystalline ZnO powder via sol–gel route for dye-sensitized solarcells,” Solar Energy Mater. Solar Cells, vol. 92, no. 12, pp. 1639–1645,2008.
[3] Z. Chen, X. X. Li, G. Du, N. Chen, and A. Y. M. Suen, “A sol–gelmethod for preparing ZnO quantum dots with strong blue emission,”J. Lumin., vol. 131, no. 10, pp. 2072–2077, 2011.
[4] H.-W. Ryu et al., “ZnO sol–gel derived porous film for CO gas sensing,”Sens. Actuators B, Chem., vol. 96, no. 3, pp. 717–722, 2003.
[5] G. S. Devi, V. B. Subrahmanyam, S. C. Gadkari, and S. K. Gupta,“NH3 gas sensing properties of nanocrystalline ZnO based thick films,”Anal. Chim. Acta, vol. 568, nos. 1–2, pp. 41–46, 2006.
[6] M. Dutta, S. Mridha, and D. Basak, “Effect of sol concentration on theproperties of ZnO thin films prepared by sol–gel technique,” Appl. Surf.Sci., vol. 254, no. 9, pp. 2743–2747, 2008.

JAGTAP AND PRIOLKAR: STUDY ON EFFECT OF [OH-] LINKAGES ON PHYSICAL, ELECTRICAL, AND GAS SENSING PROPERTIES 4707
[7] O. Singh, M. P. Singh, N. Kohli, and R. C. Singh, “Effect of pH onthe morphology and gas sensing properties of ZnO nanostructures,”Sens. Actuators B, Chem., vols. 166–167, pp. 438–443, May 2012.
[8] R. Wahab, S. G. Ansari, Y. S. Kim, M. Song, and H.-S. Shin, “The roleof pH variation on the growth of zinc oxide nanostructures,” Appl. Surf.Sci., vol. 255, no. 9, pp. 4891–4896, 2009.
[9] F.-L. Meng et al., “Parts per billion-level detection of benzene usingSnO2/graphene nanocomposite composed of sub-6 nm SnO2 nanopar-ticles,” Anal. Chim. Acta, vol. 736, pp. 100–107, Jul. 2012.
[10] F. Meng et al., “Flower-like hierarchical structures consisting of poroussingle-crystalline ZnO nanosheets and their gas sensing properties tovolatile organic compounds (VOCs),” J. Alloys Compounds, vol. 626,pp. 124–130, Mar. 2015.
[11] M. Yin, M. Liu, and S. Liu, “Development of an alcohol sensor basedon ZnO nanorods synthesized using a scalable solvothermal method,”Sens. Actuators B, Chem., vol. 185, pp. 735–742, Aug. 2013.
[12] N. F. Hamedani and F. Farzaneh, “Synthesis of ZnO nanocrystals withhexagonal (Wurtzite) structure in water using microwave irradiation,”J. Sci., Islamic Republic Iran, vol. 17, no. 3, pp. 231–234, 2006.
[13] G. Xiong, U. Pal, and J. G. Serrano, “Correlations among size, defects,and photoluminescence in ZnO nanoparticles,” J. Appl. Phys., vol. 101,no. 2, pp. 024317–024321, 2007.
[14] M. M. Ba-Abbad, A. A. H. Kadhum, A. B. Mohamad, M. S. Takriff,and K. Sopian, “The effect of process parameters on the size ofZnO nanoparticles synthesized via the sol–gel technique,” J. AlloysCompounds, vol. 550, pp. 63–70, Feb. 2013.
[15] A. B. Djurišic et al., “Defect emissions in ZnO nanostructures,”Nanotechnology, vol. 18, no. 9, 2007, Art. ID 095702.
[16] Z. G. Wang, X. T. Zu, S. Z. Yang, and L. M. Wang, “Blue luminescencefrom carbon modified ZnO nanoparticles,” J. Mater. Sci., vol. 41, no. 12,pp. 3729–3733, 2006.
[17] L. Dai, X. L. Chen, W. J. Wang, T. Zhou, and B. Q. Hu, “Growthand luminescence characterization of large-scale zinc oxide nanowires,”J. Phys, Condens. Matter, vol. 15, no. 13, pp. 2221–2226, 2003.
[18] K. H. Tam et al., “Defects in ZnO nanorods prepared by a hydrothermalmethod,” J. Phys. Chem. B, vol. 110, no. 42, pp. 20865–20871, 2006.
[19] P.-T. Hsieh, Y.-C. Chen, C.-M. Wang, Y.-Z. Tsai, and C.-C. Hu,“Structural and photoluminescence characteristics of ZnO films byroom temperature sputtering and rapid thermal annealing process,”Appl. Phys. A, vol. 84, no. 3, pp. 345–349, 2006.
[20] T. P. Hülser, H. Wiggers, F. E. Kruis, and A. Lorke, “Nanostructured gassensors and electrical characterization of deposited SnO2 nanoparticlesin ambient gas atmosphere,” Sens. Actuators B, Chem., vol. 109, no. 1,pp. 13–18, 2005.
[21] Y.-M. Lee, C.-M. Huang, H.-W. Chen, and H.-W. Yang, “Lowtemperature solution-processed ZnO nanorod arrays with applica-tion to liquid ethanol sensors,” Sens. Actuators A, Phys., vol. 189,pp. 307–312, Jan. 2013.
[22] E. Barsoukov and R. Macdonald, Eds., Impedance Spectroscopy: Theory,Experiment, and Applications. New York, NY, USA: Wiley, 2005.
[23] J. Lee, J.-H. Hwang, J. J. Mashek, T. O. Mason, A. E. Miller, andR. W. Siegel, “Impedance spectroscopy of grain boundaries in nanophaseZnO,” J. Mater. Res., vol. 10, no. 9, pp. 2295–2300, 1995.
[24] T. T. Trinh et al., “Improving the ethanol sensing of ZnO nano-particlethin films—The correlation between the grain size and the sensingmechanism,” Sens. Actuators B, Chem., vol. 152, no. 1, pp. 73–81,Feb. 2011.
Shweta Jagtap received the M.Sc. and Ph.D. degrees in electronic sciencefrom Pune University, Pune, India, in 2006 and 2010, respectively. Sheis currently a Post-Doctoral Fellow with the Department of Physics,Goa University, Goa. Her research interests include the synthesis andcharacterization of nanomaterials and their applications in thick- andthin-film sensors.
Kaustubh Priolkar received the Ph.D. degree in physics from GoaUniversity, in 1997. He joined Goa University, in 1999, where he is currentlya Professor with the Department of Physics. His current area of interest isstructure and physical property correlation in complex materials using X-rayabsorption spectroscopy and neutron scattering.