45.pdf · in this study, using both secondary ... mumbai) and shri ajit b. jain (joint managing...
TRANSCRIPT


������������� ���������������� ��� � ��
������� ��� ������ �� ������� ����� ��� ������� ���� ���� ��������
EFFICIENCY OF IRRIGATION:A CASE OF DRIP IRRIGATION
������������ ������������� ��� !� ���"�� ����� �������#������������ � ��� ����������������� �
!��$������ ��%������ ��� !� &��������� ����������� �'���������� ���� �� ���� ������������������������
��" ���������
���
()� ��!�������*+��,A. NARAYANAMOORTHY
ii
��������
��� ������������������������� ��� � �������������� ������ ����� ��������������� ��������� ���� �������� ����!����� � "� #$%� %%$�� &���� �� ���'
AuthorA. Narayanamoorthy
Professor & DirectorCentre for Rural Development,Alagappa University,Karrikutti - 630 003, Tamil Nadu.
���� ������� ���� -�������.�+�� +����� ��� !� �����/+�� �������!� ���.����� ����� 0'1� !��$������ �'���� �������� ����(� ��2�������!� �0�3� 0'The usual disclaimer about the responsibility of the National Bank for Agricultureand Rural Development as to the facts cited and views expressed in the paper isimplied.
!��$������ ��%������ ��� !� &��������� ����������� �'���1� ������������ ������������� ��� !� ���"�� ����� �������#�1� ��� ����� �� ��2���1� ‘����’� �4��#�1� ����5$� � �����241� ‘2���’� ������1� ����)��5)� � �81211� ��6����"������ ����5�������/��1� ��6�� 7��*���81� ��" ��� - 400 0511� 9�!�� :���������+�Published by the National Bank for Agriculture & Rural Development, Department ofEconomic Analysis & Research, 4th Floor, 'C' Wing, Plot No. C-24, G-Block,PB No. 8121, Bandra Kurla Complex, Bandra (East), Mumbai - 400 051.
������$���� ������!������ :����1� �����$�1� ��" ���� - 400 001� 9�!�� ��"��6+�� ;Printed at Karnatak Orion Press, Fort, Mumbai - 400 001.

iii
PREFACE
Though the area under irrigation has increased significantly sinceindependence, the share of irrigated area to gross cropped area inIndian agriculture is only about 40 percent as of today. One of themain reasons for the limited expansion of irrigation is the predo-minant use of flood method of irrigation. The efficiency of water useunder flood method of irrigation is extremely low mainly due to hugelosses through the evaporation and distribution. Considering the fastdecline of available water potential and growing needs for irrigationwater, various measures have been introduced to increase theefficiency of water use under flood method of irrigation. However,these measures could not bring any substantial improvement in theexisting water use efficiency. Drip method of irrigation introducedsomewhat recently in Indian agriculture proved to be an effectivemethod in increasing the efficiency of water use. Drip method ofirrigation supplies water directly at the root zone of the cropsthrough a network of pipes and therefore, it substantially reducesthe evaporation and distribution losses of water. Apart from watersaving, drip method of irrigation also significantly increasesproductivity of crops and that too with reduced cost of cultivation.Although drip method of irrigation has been commercially practicedsince mid-eighties in India, not many comprehensive studies areavailable focusing on the impact of it on various parameters ofcrops. In this study, using both secondary and field level data, anattempt is made to investigate the coverage of drip method ofirrigation and its impact on cost of cultivation, production andproductivity of different crops, water saving and water use efficiencyas well as economic viability of drip investment in differentcrops. An attempt is also made to estimate the total potentialarea for drip method of irrigation and water saving for the countryas a whole.
The results of the study show that water saving and water useefficiency of different crops cultivated under drip method of irrigationis significantly higher when compared with those under flood methodof irrigation. Productivity as well as profit of different crops is alsofound to be higher with the crops cultivated under drip method ofirrigation. This new irrigation technology also helps to save consi-derable amount of electrical energy used for lifting water from wells.Benefit-cost ratios with different discount rates indicate that dripinvestment in sugarcane, banana and grapes cultivation remainseconomically viable even without subsidy. The findings as well as the

iv
policy recommendations of the study are expected to be useful forpromoting the drip method of irrigation in India.
This paper is the outcome my research on drip irrigation that Ihave been undertaking since 1995, when I first carried out a fielddata based study on Evaluation of Drip Irrigation System inMaharashtra for the Ministry of Agriculture, Government of India,New Delhi. At the outset, I would like thank the Department ofEconomic Analysis and Research, National Bank for Agriculture andRural Development (NABARD), Mumbai for extending an invitation towrite this paper. Over the last ten years, I have had opportunities todiscuss with various scholars about the issues pertaining to dripirrigation at different time points, which helped to refine my know-ledge on this subject. Particularly, I would like to express my grati-tude to the following scholars/administrators: Prof. R.S. Deshpande(Head, Agricultural Development and Rural Transformation Unit,Institute for Social and Economic Change, Bangalore), Prof. V.S.Chitre (former Director, Gokhale Institute of Politics and Economics,Pune and currently Director, Indian School of Political Economy,Pune), Prof. R. Maria Saleth (Senior Institutional Economist,International Water Management Institute, Colombo, Sri Lanka), Prof.B.D. Dhawan (former Professor, Institute of Economic Growth, Delhi),Dr. M.A. Chitale (former Secretary, Ministry of Water Resources,Government of India, New Delhi and former Secretary General,International Commission on Irrigation and Drainage, New Delhi),Shri V.M. Ranade (former Secretary of Irrigation, Government ofMaharashtra, Mumbai), Prof. C. Ramasamy (Vice-Chancellor, TamilNadu Agricultural University, Coimbatore, Tamil Nadu), Prof. K.Palanisami (Director, Water Technology Centre, Tamil Nadu Agricul-tural University, Coimbatore, Tamil Nadu), Prof. Tushaar Shah,(Theme Leader, Sustainable Groundwater Management, InternationalWater Management Institute, V.V. Nagar, Gujarat, India), Dr. N.A.Mujumdar (Editor, Indian Journal of Agricultural Economics,Mumbai) and Shri Ajit B. Jain (Joint Managing Director, JainIrrigation Systems Limited, Jalgaon, Maharashtra).
I have also benefited from many officials from the office of theCommissionerate of Agriculture, Government of Maharashtra, Pune,while carrying out the studies on drip method of irrigation over theyears in Maharashtra. I express my sincere thanks to all thoseofficials who have helped in my research endeavour.
Thanks are also due to Shri Bipin K Deokar, Shri Mukund NDeshpande and Shri Mahendra H Bhalerao for processing and

v
analysing the data using computer and Shri S.S. Dete, Shri V.B.Lokare and Shri V.G. Kasbe for collecting data from the field atdifferent time points. However, none of the individuals and insti-tutions mentioned above are responsible for errors remaining in thestudy report.
Profess & Director A. NarayanamoorthyCentre for Rural DevelopmentAlagappa UniversityKarrikuti - 630 003Tamil Nadu

vi
TABLE OF CONTENTS
Page No.
Preface iii - v
List of Abbrevations vii - viii
List of Tables ix - xi
Executive Summary xiii - xx
Chapter 1 Introduction 1-11
Chapter 2 Need for Drip Method of Irrigation 13-26
Chapter 3 Development of Drip Irrigation in India 27-46
Chapter 4 Water and Electricity Saving 47-58
Chapter 5 Cost of Cultivation and Productivity Gains 59-68
Chapter 6 Benefit-Cost Analysis 69-81
Chapter 7 Potential and Prospects for Drip Irrigation in India 83-88
Chapter 8 Major Findings and Policy Recommendations 89-102
References 103-110
vii
Abbreviations
AFC – Agricultural Finance Corporation
BCR – Benefit-Cost Ratio
CACP – Commission for Agricultural Costs and Prices
CBIP – Central Board of Irrigation and Power
CGWB – Central Groundwater Board
CMIE – Centre for Monitoring Indian Economy
CI – Cropping Intensity
CM – Centimeter
CWC – Central Water Commission
DMI – Drip Method of Irrigation
DSI – Deccan Sugar Institute
FMI – Flood Method of Irrigation
FAI – Fertiliser Association of India
GCA – Gross Cropped Area
GWA – Groundwater Area
GIA – Gross Irrigated Area
GOI – Government of India
GOM – Government of Maharashtra
HP – Horse Power
ICID – International Commission on Irrigation and Drainage
INCID – Indian National Committee on Irrigation and Drainage
IWMI – International Water Management Institute
JISL – Jain Irrigation Systems Limited
MI – Minor Irrigation
MMI – Major and Medium Irrigation
MOWR – Ministry of Water Resources
NABARD – National Bank for Agriculture and Rural Development
NAT – New Agricultural Technology

viii
NCPA – National Committee on the Use of Plastics inAgriculture
NCPAH – National Committee on Plasticulture Applications inHorticulture
NHB – National Horticulture Board
NPW – Net Present Worth
NIA – Net Irrigated Area
PFDC – Precision Farming Developing Centre
PIM – Participatory Irrigation Management
TFMI – Task Force on Micro Irrigation
VSI – Vasantdada Sugar Institute
WEM – Water Extraction Machinery
WUE – Water Use Efficiency
ix
List of Tables
Table PageNo. No.
2.1 Magnitude and Composition of Investment through 14Plan Periods in Irrigation and Flood Control Sectors
2.2 Irrigation Efficiencies under Different Methods of 15of Irrigation
2.3 Irrigation Potential and Utilization in India : 16Up to 1999-2000
2.4 Statewise Position of Irrigation Potential Crated and 16Utilised upto the Ninth Plan
2.5 Statewise Groundwater Potential and Development 17
2.6 Development of Irrigation Potential (cumulative) 18through Plan periods
2.7 Compound Growth-Rate of Area, Production and 22Yield of Principle Crops in India(Base: TE 1981-82=100)
2.8 Comparative Advantages of Drip Irrigation over 25Flood Irrigation
3.1 Statewise Area under Drip Method of Irrigation 31
3.2 Crop-wise Area under Drip Method of Irrigation 32in India : 1997-98
3.3 Scheme-wise Area under Drip Method of Irrigation: 331997-98
3.4 Division-wise Area under Drip Irrigation, its 35Proportion and Growth Rate: Central and StateSchemes : 1999-2000
3.5 Division-wise Area under Drip Irrigation and Total 37Subsidy Distributed Upto 1999-2000
3.6 Crop-wise Share of Drip Area in Maharashtra upto 391999-2000

x
3.7 Division-wise share of Drip Area in Maharashtra 40Up to 1999-2000
3.8 Districtwise Factors Determining Drip Irrigated Area 43in Maharashtra : 1998-99
3.9 Results of Linear Regression: Factors Determining 45Area under Drip Irrigation
4.1 Water Saving through Drip Method of Irrigation – 48Experimental Results
4.2 Results of Studies on Micro-irrigation by PFDCs 49
4.3 Pattern of Water Use in Drip and Flood Irrigated 51Crops
4.4 Water Consumption by Drip and Non-Drip 53Irrigated Crops
4.5 Water Use Efficiency in Drip and Non-Drip 54Irrigated Crops
4.6 Estimates of Electricity Consumption by Drip and 57Non-Drip Irrigated Crops
4.7 Estimates of Electricity Use Efficiency in Drip and 57Non-Drip Irrigated Crops
5.1 Productivity Gains through Drip Method of Irrigation– 60Experimental Results
5.2 Yield and Water Use Efficiency under Drip and 61Flood Method of Irrigation
5.3 Cost of Cultivation incurred by the Adopters and 65the Non-Adopters of Drip Method of Irrigation
5.4 Productivity of Crops under Drip and Flood Irrigated 67Condition
5.5 Expenditure Incurred to Produce one Quintal of 68Output under Drip and Non-Drip Irrigated Condition
6.1 Benefit-Cost Ratio of Different Drip Irrigated Crops 70
Table PageNo. No.

xi
Table PageNo. No.
6.2 Cost-Benefit of Different Crops under DMI and FMI 71
6.2A Cost-Benefit of Different Crops under DMI and FMI 72
6.3 AFC District Level Estimates of Benefit-Cost Ratio 73
6.4 Capital Cost, Production Cost, Gross Income, 78Subsidy among Drip and non-Drip Irrigated Crops
6.5 Net Present Worth and Benefit Cost Ratio for Drip 79Irrigated Sugarcane under With and WithoutSubsidy Condition
6.6 Net Present Worth and Benefit Cost Ratio for Drip 80Irrigated Grapes and Banana under With andWithout Subsidy Condition
7.1 Crops Grown under Drip Method of Irrigation 84
7.2 Drip Irrigation Potential and Capital Requirement- 85India
7.3 Estimate of Potential Water Saving and Additional 88Irrigated Area by Drip Irrigation: India
8.1 Summary Results of Drip Method of Irrigation: Field 93Survey
xiii
EXECUTIVE SUMMARY
1. Recognising the fast decline of irrigation water potential andgrowing demand for water from different sectors, a number ofdemand curtailing strategies have been introduced since the lateseventies to increase the water use efficiency especially in the use ofsurface irrigation water. However, the net impact of these strategiesin increasing the water use efficiency is not very impressive as oftoday. One of the technical means introduced recently in Indianagriculture to improve the water use efficiency is drip method ofirrigation (DMI). Unlike flood method of irrigation (FMI), under dripmethod, water is directly supplied to the root zone of the cropsthrough a network of pipes using drippers/emitters. The directsupply of water through the pipe network reduces the substantialamount of water losses that take place usually under surfacemethod of irrigation. As a result, the water use efficiency increasesupto 100 percent in a properly designed and managed drip irrigationsystem. Drip method of irrigation also helps to reduce the over-exploitation of groundwater that partly occurs because of inefficientuse of water under surface method of irrigation. This new method ofirrigation also increases the productivity of crops and reduces thecost of cultivation especially in labour-intensive operations.Environmental problems associated with the surface method ofirrigation namely water logging and salinity are also completelyabsent under drip method of irrigation.
2. Though drip method of irrigation can be efficiently used forvarious crops in water scarce countries like India, the coverage ofarea under DMI is very limited as of today. While studies have beencarried out to find out the reasons for the slow growth of DMI aswell as its impact on various parameters, most of the studiesavailable in the Indian context are either based on experimental dataor individual farmer case studies. Since the farm level situation istotally different from that of the experimental station, one requires adetailed study using data from properly designed survey for makingany firm conclusion about its water use efficiency. The other issue ofdrip irrigation is related to its economic viability, as farmers areoften reluctant to adopt this technology fearing that the technologymay not be economically viable. Keeping in view the limitations ofthe existing studies, in this study, an attempt is made to study theimpact of drip method of irrigation on different parameters as wellas its potential and prospects in India using both secondary(experimental) and field level data.
xiv
3. Due to various promotional schemes introduced by the Govern-ment of India and States like Maharashtra, the area under dripmethod of irrigation has increased from 1500 ha in 1985-86 to70589 ha in 1991-92 and further to 4.50 lakh hectares at the endof March 2003. Though drip method of irrigation has been inoperation over the last two decades, it is essentially considered as ascheme of government. As of 1997-98, area under DMI other thangovernment schemes (without subsidy) accounted for only about 18percent of India’s total drip irrigated area.
4. Over the last ten years, significant growth has been achieved inarea under drip method of irrigation in absolute term in manyStates. However, drip irrigated area constitutes a very meagrepercentage in relation to gross irrigated area in all the States inIndia. During 2000-01, the share of drip-irrigated area to grossirrigated area was just 0.48 percent and about 1.09 percent inrelation to total groundwater irrigated area of the country.
5. State-wise area under drip method of irrigation pertaining tothree time points namely 1991-92, 1997-98 and 2000-01 shows asubstantial improvement in the adoption of this new irrigationtechnology across the States. However, the development of dripmethod of irrigation is not uniform across different states. In allthree time points, Maharashtra State alone accounted for nearly 50percent of the India’s total drip irrigated area followed by Karnataka,Tamil Nadu and Andhra Pradesh. There are many reasons for therapid development of drip irrigation in Maharashtra. First, Stategovernment is very keen in promoting drip irrigation on a large scaleby providing subsidy, technical and extension services to thefarmers. Maharashtra government has been providing subsidy since1986-87 onwards through State schemes. Second, area underirrigation from both surface and groundwater is quite low and hence,many farmers have adopted drip method of irrigation to avoid waterscarcity largely in divisions like Nashik, Pune, etc. Third, owing tocontinuous depletion of groundwater, farmers were not able tocultivate wide spaced and more lucrative crops like grapes, banana,pomegranate, orange, mango, etc. using surface method of irrigationin many regions. As a result, farmers had to adopt drip irrigation asthese crops are most suitable for drip method of irrigation.Importantly, the farmers who adopted drip irrigation initially forcertain crops have realised the importance of drip irrigation inincreasing the water saving and productivity of crops. This hasfurther induced many farmers to adopt drip method in some of theregions in Maharashtra.

xv
6. Water saving and improved water use efficiency are the twoimportant advantages of drip method of irrigation. According to theexperimental data from different research stations located in India,water saving due to drip method of irrigation varies from 12 to 84percent over the conventional method of irrigation in vegetable crops.In fruit crops, water saving varies 45 to 81 percent. In sugarcane,which is a water-intensive crop, water saving is estimated to be over65 percent due to drip method of irrigation.
7. The results of field level data pertaining to three crops namelysugarcane, banana and grapes are somewhat different from theexperimental results. The pattern of water use for crops is totallydifferent between the two methods of irrigation. The drip adoptershave applied more number of irrigation per hectare when comparedto the non-drip adopters in all the three crops considered for theanalysis. However, hours required per irrigation to irrigate perhectare of sugarcane, grapes and banana are significantly less forthe drip adopters as compared to the non-drip adopters.
8. Water consumption (in quantity) per hectare is much less underdrip method of irrigation as compared to flood method of irrigationin all the three crops. Water saving in sugarcane due to drip methodof irrigation is about 44 percent, while the same is estimated to beabout 37 percent in grapes and 29 percent in the case of banana.
9. Additional area can also be brought under irrigation from thesaving of water realised through the adoption of drip method ofirrigation. The additional irrigated area possible from the saving ofwater is estimated to be 0.80 (1.98 acres) in sugarcane, 0.60 ha(1.48 acres) in grapes and 0.41 ha (1.01 acres) in banana.
10. Water use efficiency (i.e., water consumed to produce one unitof crop output) is also significantly higher in drip-irrigated cropswhen compared to the same crops cultivated under non-dripirrigated condition. Sugarcane cultivated under drip method ofirrigation consumes only 1.28 horse power (HP) hours of water toproduce one quintal of sugarcane as against 2.83 HP hours of waterunder flood method of irrigation, i.e., about 1.55 HP hours ofadditional water is consumed to produce one quintal of sugarcaneunder flood method of irrigation. Banana crop under DMI consumesonly 11.60 HP hours of water to produce one quintal of output asagainst the use of 21.14 HP hours of water under non-drip irrigatedcondition. In grapes, each quintal of output involves the use of just13.60 HP hours of water under DMI as compared to the use of25.84 HP hours of water under non-drip irrigated condition.

xvi
11. Saving in electrical energy use (used for lifting water from wells)is one of the important advantages of drip method of irrigation.While the researchers have not estimated the saving of electricityusing experimental data, we have estimated electricity consumptionusing the field level data for both the drip and the non-drip irrigatedcrops. Consumption of electricity per hectare is quite low for drip-irrigated crops when compared to the same crops cultivated withflood method of irrigation. Farmers cultivating sugarcane under dripmethod of irrigation could save about 1059 kwh of electricity perhectare as compared to those farmers cultivating the same cropunder flood method of irrigation. Similarly, while the farmerscultivating grapes could save about 1476 kwh/ha due to DMI, thesame is estimated to be about 2434 kwh/ha in banana over thefarmers who have cultivated these crops under FMI.
12. Efficiency in electricity use, which is measured in terms ofrequirement of electricity to produce one unit of output, is alsosignificantly less under drip method of irrigation in all three cropsconsidered for the analysis. On an average, sugarcane cultivatorsunder drip method of irrigation used about 0.958 kwh to produceone quintal of sugarcane as against the non-drip crop consumptionof 2.121 kwh. While grapes cultivators under DMI have used about10.21 kwh to produce one quintal of output, the non-drip adoptershave used about 19.37 kwh. Similar trend is observed in bananacrop as well.
13. Electricity saving from drip method of irrigation also helps thefarmers to reduce electricity bill to be paid. Our estimate based onthe current average cost of electricity supply in Maharashtra(Rs. 3.26/kwh) shows that, on an average, about Rs. 3454/ha canbe saved on electricity bill alone by cultivating sugarcane crop underdrip method of irrigation. Similarly, farmers cultivating grapes andbanana under DMI can also save Rs. 4811 and Rs. 7934/ha respec-tively on account of electricity.
14. Besides water and electricity saving, reduction in cost ofcultivation and improvement in productivity are the two otheradvantages of drip method of irrigation. Since the cost of cultivationdetails for different crops cultivated under DMI are not availablefrom experimental data, the study utilised only the field level datapertaining to three above-mentioned crops. Cost of cultivation (costA
2) per hectare of the adopters is found to be relatively less when
compared to the non-adopters of drip irrigation in all three crops.The cost saving in sugarcane crop due to DMI is nearly 14 percent
xvii
(in absolute term Rs. 6550/ha). Farmers who cultivated grapes andbanana under DMI have incurred relatively lower cost of cultivation.In case of banana, drip irrigation reduces the total cost of cultivationby about Rs. 1300/ha (2.47 percent) as compared to the farmerswho cultivated the same crop under flood method of irrigation. Incase of grapes, cost saving due to DMI is found to be Rs. 13408/ha(about 9 percent). Though the reduction in cost of cultivation interms of percentage is relatively less, cost saving is found to be veryhigh in operations like irrigation, weeding and interculture, furrowsand bunding and fertilisers.
15. Productivity of crops cultivated under drip method of irrigationis significantly higher than the same crops cultivated under floodmethod of irrigation. Experimental data show that productivityincrease due to DMI is over 40 percent in vegetable crops such asbottle gourd, potato, onion, tomato and chillies. Productivity increasedue to DMI is noticed over 70 percent in many fruit crops. Insugarcane, the productivity gain is estimated to be over 33 percent.Similar kind of productivity gains is also noticed in different cropscultivated under experimental condition.
16. Similar to experimental results, considerable amount of produc-tivity gain is also noted from the analysis of farm level data. Theproductivity difference in absolute term between the adopters andthe non-adopters of drip method of irrigation comes to nearly 259quintals per hectare for sugarcane, i. e., productivity of sugarcanecultivated under drip method of irrigation is higher by about 23percent. In case of grapes, the productivity difference between DMIand FMI irrigated crops comes to about 19 percent (about 39quintals) and the same comes to 29 percent (about 153 quintals) incase of banana crop. In spite of incurring higher cost on yieldincreasing inputs, productivity of crops cultivated under FMI issignificantly lower than that of DMI. There are three main reasonsfor higher yield in drip-irrigated crops. First, because of lessmoisture stress, the growth of crop was good which ultimatelyhelped to increase the productivity of crops. Second, unlike surfacemethod of irrigation, drip does not encourage any growth of weedespecially in the non-crop zone. Weeds consume considerableamount of yield increasing inputs and reduce the yield of crops insurface method of irrigation. Third, unlike surface method ofirrigation, fertiliser losses occurring through evaporation and leachingthrough water are less under drip method of irrigation as it supplieswater only for crop and not for the land.

xviii
17. Cost efficiency (i.e., cost incurred to produce one unit of output)is also found to be significantly higher for the drip adopters whencompared to the non-drip adopters in all three crops. The non-dripadopters have incurred nearly three rupees over the adopters of dripmethod of irrigation to produce every quintal of sugarcane. Ingrapes, the non-adopters have incurred over Rs. 171 per quintal ofoutput over the adopters. In banana, the non-adopters have incurrednearly Rs. 30 to produce one quintal of output over the counterpart.This higher cost efficiency is possible mainly because of significantincrease in productivity of crops due to drip method of irrigation.
18. The undiscounted profit per hectare (gross income minus costA
2) of the drip adopters is significantly higher than that of the non-
drip adopters in all three crops analysed utilising field level data.Profit of the adopters in sugarcane is Rs. 27424/ha higher than thatof the non-drip adopters. In grapes, the profit level of the dripadopters is Rs. 50187/ha higher than that of the non-adopters andfor banana, the same is about Rs. 32400/ha. The study also notedthat the huge profit from drip irrigation is not because of priceeffect, but only due to the yield effect in all three crops.
19. The capital cost required for installing drip investment fordifferent crops has been increasing over the years due to increase inthe cost of materials used for manufacturing drip system. Thecapital cost of drip system largely depends upon the type of crop(narrow or wide spaced crops), spacing followed for cultivating crops,proximity to water source (distance between the field and source ofwater) and the materials used for the system. Wide spaced cropsgenerally require less capital when compared to the crops withnarrow space, as the latter crops would require more laterals anddrippers per hectare. Data available in INCID (1994) shows that therequirement of capital cost is much higher for banana (Rs. 33765/ha) as compared to the same required for mango (Rs. 11053/ha),which is a wide spaced crop.
20. Field level data pertaining to sugarcane, banana and grapesalso shows variation in the requirement of capital cost needed fordrip irrigation system. While the capital cost without subsidy comesto Rs. 52811/ha for sugarcane, the same comes to Rs. 32721/ha forgrapes and Rs. 33595/ha for banana. The average capital subsidycomes to Rs. 19263/ha for sugarcane, Rs. 11359/ha for grapes andRs. 12620/ha for banana. As a proportion of the total capital cost ofdrip set, subsidy amount accounts for about 35 to 37 percent,which is within a limit of provision made by the Government ofMaharashtra.
xix
21. As regards Benefit-Cost (B-C) ratio, the results available fromINCID (1994) show that investment in drip method of irrigation iseconomically viable, even if it is estimated without taking intoaccount subsidy given to farmers. The B-C ratio estimated excludingwater saving varies from 1.31 in sugarcane to 13.35 in grapes. TheB-C ratio increases significantly further, when it is estimated afterincluding water saving. Sivanappan (1995) also estimated B-C ratiofor different crops cultivated under DMI using data pertaining to theyear 1993. It also indicates that the investment in drip irrigation iseconomically viable, as B-C ratio estimated for different crop comesto more than one. While the B-C ratio for pomegranate is estimatedto be 5.16, the same is estimated to be 1.83 for cotton, which is aless-water intensive as well as a narrow spaced crop. However, itwas not clear whether the B-C ratio available from the studies ofINCID and Sivanappan is estimated using discounted cash flowtechnique.
22. The economic viability of drip investment is also studied usingdiscounted cash flow technique under with and without subsidyconditions, using field level data pertaining to three crops. Differentdiscount rates considered for analysis are 10, 12 and 15 percent.The estimated results show that the Net Present Worth (NPW) of theinvestment with subsidy is marginally higher than that under ‘nosubsidy’ option in all three crops. The year-wise calculation of NPWalso shows that drip adopters can realise the whole capital cost ofdrip-set from the profit of the very first year itself.
23. Under different discount rates, the benefit-cost ratio (BCR) iscomputed to know whether the drip investment for three crops iseconomically viable or otherwise. The benefit-cost ratio is muchhigher than one under different discount rates even without subsidy.While the B-C ratio in sugarcane varies from 1.909 to 2.095 underwithout subsidy condition, the same varies from 2.098 to 2.289under with subsidy condition. In case of banana, the B-C ratio variesfrom 2.228 to 2.253 under without subsidy condition and 2.343 to2.361 under with subsidy condition. Similarly, in grapes, the B-Cratio without subsidy varies from 1.767 to 1.778 and from 1.795 to1.802 with subsidy. The higher BCR under subsidy conditionsuggests the positive role that subsidy plays in improving theeconomic viability of drip method of irrigation.
24. India has enormous potential for drip method of irrigation. Ourattempt made in this study to estimate the potential and prospectsfor drip method of irrigation shows that while “core potential”
xx
(suitable crops that are cultivated under irrigated and non-irrigatedconditions) comes to 51.42 mha, the “net potential” (suitable cropsthat are cultivated only under irrigated conditions) comes to 21.27mha for the country as a whole. The requirement for capital toutilise the “core” and “net potential” areas is estimated to be aboutRs. 183508 crore and Rs. 76434 crore respectively. That is, therequirement of capital per hectare comes to about Rs. 35688 for “netpotential” and Rs. 35935 for “core potential”. By utilising the “netpotential” area of DMI, an amount of about 11.271 million-hectaremeter of water can be saved. The additional irrigated area possiblefrom the saving of water is estimated to be 11.22 mha under FMI orabout 24.12 mha under DMI.
1
Chapter 1
Introduction
1.1 An Overview
It has been corroborated by various studies carried out acrossdifferent countries including India that irrigation plays a paramountrole in increasing the use of yield increasing inputs and enhancingcropping intensity as well as productivity of crops (Dhawan, 1988;Vaidyanathan, et al., 1994). Apart from benefiting the farmers,irrigation development also helps to increase the employmentopportunities and wage rate of the agricultural landless labourers,both of which are essential to reduce the poverty among the landlesslabour households (Saleth, 2004; Narayanamoorthy, 2001a; Bhattaraiand Narayanamoorthy, 2003; Narayanamoorthy and Deshpande,2003). However, water is becoming increasingly scarce worldwide dueto various reasons (Rosegrant, et al., 2002). With the fast decline ofirrigation water potential and continued expansion of population andeconomic activity in most of the countries located in arid and semi-arid regions, the problems of water scarcity is expected to beaggravated further (see, Biswas, 1993 and 2001; Rosegrant, 1997;Rosegrant, et al., 2002). Macro-level estimate carried out by theInternational Water Management Institute (IWMI), Colombo, indicatesthat one-third of the world population would face absolute waterscarcity by the year 2025 (Seckler, et al., 1998; Seckler, et al.,1999). As per this estimate, the worst affected areas would be thesemi-arid regions of Asia, the Middle-East and Sub-Saharan Africa,all of which are already having heavy concentration of populationliving below poverty line.
Despite having the largest irrigated area in the world, India toohas started facing sever water scarcity in different regions. Owing tovarious reasons the demand for water for different purposes hasbeen continuously increasing in India, but the potential wateravailable for future use has been declining at a faster rate (Saleth,1996). The agricultural sector (irrigation), which currently consumesover 80 percent of the available water in India, continues to be themajor water-consuming sector due to the intensification of agricul-ture (see, Saleth, 1996; MOWR, 1999, Iyer, 2003). Though India hasthe largest irrigated area in the world, the coverage of irrigation isonly about 38 percent of the gross cropped area as of today. One ofthe main reasons for the low coverage of irrigation is poor water use

2
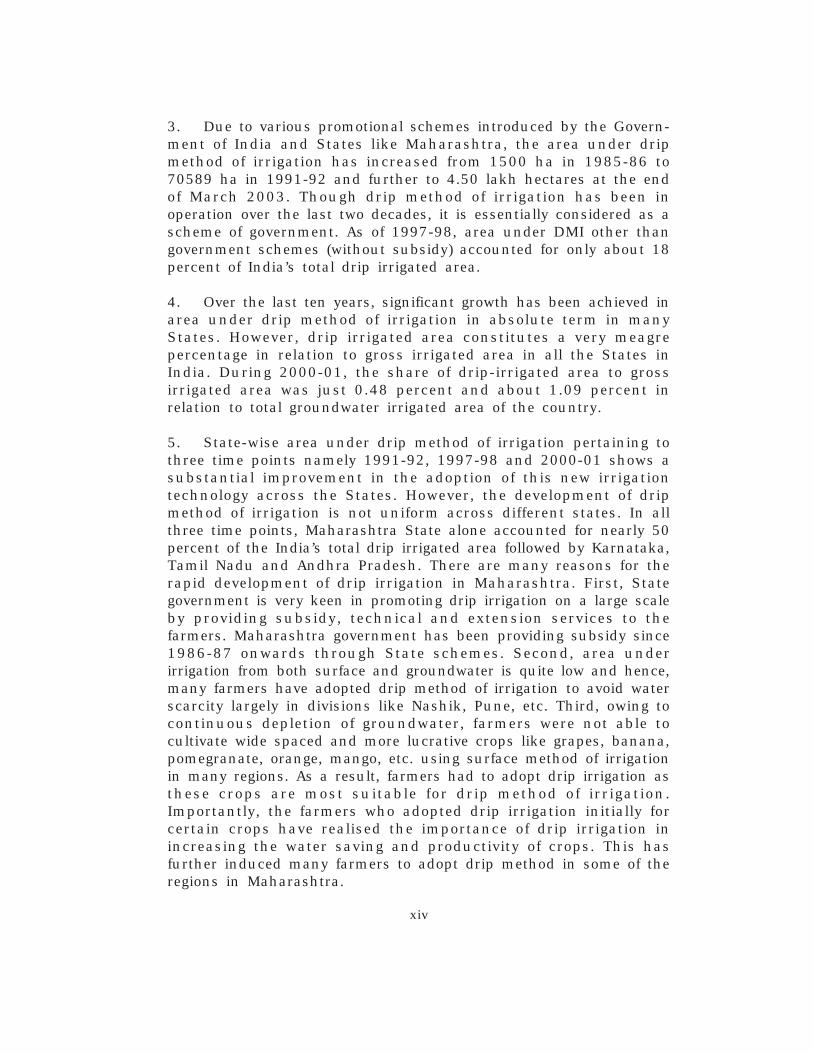
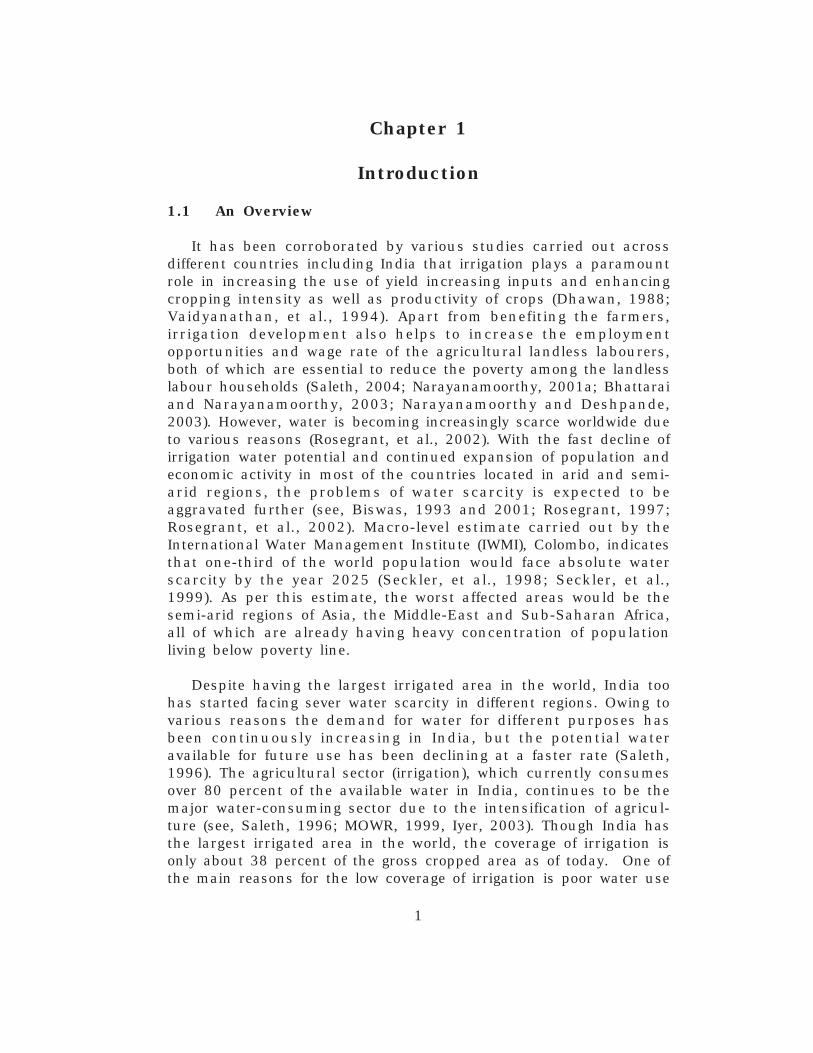
efficiency under the flood (conventional) method of irrigation, whichis predominantly practised in Indian agriculture. Available estimatesindicate that water use efficiency under flood method of irrigation isonly about 35 to 40 percent (Rosegrant, 1997). Considering thewater availability for future use and the increasing demand for waterfrom different sectors, a number of demand and supply managementstrategies have been introduced in India to augment the supply aswell as to control the demand for water. One of the demand mana-gement strategies introduced recently to control water consumptionin Indian agriculture is drip method of irrigation (DMI). Unlike floodmethod of irrigation, drip method supplies water directly to the rootzone of the crop through a network of pipes with the help ofemitters (see, Figure 1.1). Since it supplies water directly to the crop,instead of land, as followed in the flood method of irrigation, thewater losses occurring through evaporation and distribution arecompletely absent (INCID, 1994, Narayanamoorthy, 1995; 1997;Dhawan, 2002). The on-farm irrigation efficiency of properly designedand managed drip irrigation system is estimated to be about 90percent, while the same is only about 35 to 40 percent for surfacemethod of irrigation (INCID, 1994).
The development of drip method of irrigation has a long history.While the basic experiments has started way back in Germany in1860s, an important breakthrough was achieved in Germany during1920 when perforated pipe drip irrigation was introduced (INCID,
Figure 1.1 : Typical Drip Irrigation System

3
1994). Experiments carried out in the desert areas of Neger andArava in Israel during early 1960s showed a spectacular results.The drip system with pipes began to be sold outside Israel oncommercial basis in 1969. By the mid-1970s, farmers belonging tocountries like Australia, Israel, Mexico, New Zealand and SouthAfrica started using this new method of irrigation in crop cultivation(Postal, 1999). As per the worldwide survey carried out by the ICID,area under drip method of irrigation has increased from just 40hectares (ha) in 1960 to about 54,600 ha in 1975 and further toabout 1.78 million hectares in 1991 (INCID, 1994). According to arecent estimate, the global area under drip method of irrigation haslikely expanded by 75 percent since 1991, which would be approxi-mately 2.8 million hectares (Postal et al., 2001). While drip methodof irrigation is currently practiced over 35 countries, the UnitedStates of America alone accounts for over 35 percent of the world'stotal drip irrigated areas (see, Dhawan, 2002). Surprisingly, incountries like Israel, Austria and Germany, all the irrigated areas arebrought under micro-irrigation technology, due to its comparativeadvantages over FMI. Whereas micro-irrigation accounts for over 21percent of the USA's total irrigated area, it accounts just 1.6 percentof India's total irrigated area. The significant growth of drip methodof irrigation is attributable to higher crops productivity and wateruse efficiency including reduction in cost of cultivation. Studiescarried out in countries like Israel, Jordan, USA and India haveshown that drip method of irrigation increases crop productivity by20-90 percent and reduces water use by 30-70 percent for differentcrops (Narayanamoorthy, 1997; Postal, 2001).
In India, though indigenous methods such as perforated earthen-ware pipes, perforated bamboo pipes, etc., were in practice for a longtime, the modern drip system was introduced only during the earlyseventies at the Agricultural Universities and other ResearchInstitutes. However, an appreciable improvement in the adoption ofDMI has taken place only from the eighties, mainly because ofvarious promotional programmes introduced by the Central and Stategovernments. The area under DMI has increased from a mere 1500ha in 1985 to 70,859 ha in 1991-92 and further to 5,00,000 ha asof March 2003 (INCID, 1994; GOI, 2004). India has enormous poten-tial for DMI. INCID (1994) report, which presents an overview aboutthe development of drip irrigation in India, indicates that about 80crops, both narrow and widely spaced crops, can be grown underDMI. Although DMI is considered to be highly suitable for widespaced and high value commercial crops, it is also being used forcultivating oilseeds, pulses, cotton and even for wheat crop (INCID,

4
1994). Importantly, research suggests that DMI is not only suitablefor those areas that are presently under cultivation but it can alsobe operated efficiently in undulating terrain, rolling topography, hillyareas, barren land and areas which have shallow soils (Sivanappan,1994).
Drip irrigation technology is introduced primarily to increase thewater use efficiency in agriculture. However, it also delivers manyother economic and social benefits to the society. Reduction in waterconsumption due to drip method of irrigation over the surfacemethod of irrigation varies from 30 to 70 percent for different crops(INCID, 1994, Narayanamoorthy, 1997; Postal, 2001). According todata available from research stations, productivity gain due to dripmethod of irrigation is estimated to be in the range of 20 to 90percent for different crops (see, INCID, 1994). While increasing theproductivity of crops significantly, it also reduces the cost of cultiva-tion substantially especially in labour-intensive operations. Thereduction in water consumption in drip method of irrigation alsoreduces the energy use (electricity) that is required to lift the waterfrom irrigation wells (see, Narayanamoorthy, 1995, 2001).
Over the last ten years or so, a few studies have been carriedout focusing on the impact of drip method of irrigation on variousparameters in different crops. Studies, by and large, have focusedmainly on the impact of drip method of irrigation on water savingincluding water use efficiency, productivity of crops and cost ofcultivation. While some have studied the impact of DMI on electricitysaving, others have studied its economic viability in different crops,using both experimental and field survey data. Let us briefly discussabout the results that are emerging out from various studies.Results of experimental data reported in INCID (1994) show thatwater saving in DMI over the method of FMI varies from 12 to 84percent in different vegetable crops. In the case of fruit crops, thelowest water saving was found to be 45 percent (pomegranate),whereas the highest water saving is estimated to be 81 percent inthe case of lemon. Water saving was also found to be 65 percent insugarcane and about 60 percent in the case of coconut. As in thecase of INCID results, various studies reported in CBIP (1998 and2001) also indicate similar level of water saving in different crops.Similar to experimental data, studies carried out using field leveldata in Maharashtra also show that the water saving due to DMI isabout 29 percent in banana, 37 percent in grapes and about 44percent in sugarcane (Narayanamoorthy, 1996; 1997 and 2001).

5
Apart from water saving, which is the principal benefit of dripmethod of irrigation, it also helps to increase the productivity ofcrops mainly by reducing moisture stress for crops (see, Figure 1.2).Studies carried out based on experimental data suggest that theproductivity of crops cultivated under DMI can be increased by 40 to50 percent over the crops cultivated under FMI, especially in cropslike bottle gourd, sweet potato, potato, tomato and chillies. Signi-ficant improvement in productivity of papaya (77 percent), banana(52 percent), grapes (23 percent), mosambi (50 percent) andpomegranate (98 percent) has also been reported by INCID (1994)and Sivanappan (1994).
Similar to vegetables and fruit crops, quite a few studies areavailable focusing on sugarcane crop, which is an important water-intensive crop. Most of the available studies in this respect havebeen carried out using the data supplied by the experimentalresearch stations. Through the analysis of experimental data, studieshave found a substantial water saving and productivity gains due todrip method of irrigation in sugarcane cultivation (Batta and Singh,1998; Dash, 1998; Deshmukh, et al., 1998; Dhonde and Banger,1998; Hapase, et al., 1992; Parikh et al., 1993; Sankpal, et al.,1998). Single cane weight, cane girth, cane length, number of inter-nodes, leaf length and leaf breadth were also found to be higherwith sugarcane cultivated under drip method of irrigation whencompared to the same cultivated under flood method of irrigation(Venugopal and Rajkumar, 1998). Because of less moisture stressunder DMI, the recovery rate of sugarcane cultivated under DMI wasfound to be higher when compared to the crop cultivated using FMI(Sankpal, et al., 1998; Dhonde and Banger, 1998; Banger, 1998).
6
Importantly, a study carried out on heavy soils and sub-humidclimatic conditions of South Gujarat region suggests that a largescale adoption of drip method of irrigation in sugarcane in SouthGujarat area can help to solve the problem of water logging andsecondary salinization, which are increasing in this region (Parikh, etal., 1993).
Though DMI increases the crop productivity and savessubstantial amount of water, it requires relatively larger fixedinvestment to install the system in the field. Therefore, some studieshave attempted to find out whether the investment in drip irrigationis economically viable or not in different crops. While some haveestimated benefit-cost ratio including water saving as well asexcluding water saving (INCID, 1994), others have estimated benefit-cost ratio and net present worth under with and without subsidycondition (Narayanamoorthy, 1996; 1997; 2001 and 2004). Thebenefit-cost ratios provided for different crops in INCID (1994)indicate that investment in drip irrigation is economically viable,even after excluding water saving from the calculation. The estimatedbenefit-cost ratio comes to 13.35 in crops like grapes and 1.41 inthe case of coconut. However, it is not clear whether the B-C ratiospresented in INCID (1994) are estimated using discounted cash flowtechnique or not. Unlike INCID estimates, using discounted cashflow technique and that too utilising field survey data covering threecrops namely grapes, banana and sugarcane, Narayanamoorthy(1997, 2001 and 2004) estimated B-C ratio and net present worth.The results of these studies suggest that the investment in dripmethod of irrigation is economically viable even without subsidy.Obviously, the B-C ratio and NPW improves further when subsidyamount is taken for calculation.
However, in spite of having many economic advantages over themethod of flood irrigation, the coverage of area under drip method ofirrigation is not appreciable in India except for a few states as oftoday. Among the various reasons for the slow progress of adoptionof this new technology, its capital-intensive nature seems to be oneof the main deterrent factors. Drip irrigation technology requiresfixed investment that varies from Rs. 20,000 to Rs. 55,000 perhectare depending upon the nature of crops (wide or narrow spaced)and the material to be used for the system. Since the Indian farmershave been getting water for low cost from the public irrigationsystem and also from well irrigation (because of the introduction offlat-rate electricity tariff), there is less incentive to them to adopt thiscapital-intensive technology unless it is necessary. Moreover, since it
7
involves fixed investment farmers, often ask questions like what willbe the water saving and productivity gains? Is investment on dripirrigation economically viable? What will be the pay back period ofthe drip investment? These issues are raised because of the followingtwo reasons. First, the awareness of the farmers about thistechnology is very low due to poor extension service. Second, most ofthe studies available on drip irrigation in India is based on experi-mental data collected from different regions, which generally do notpresent the field level position (see, Verma and Rao, 1998; INCID,1994; Dhawan, 2002). Some of the studies have shown that theresults derived from research station data are substantially differentfrom that of survey data (see, Narayanamoorthy, 2001). In theabsence of reliable field studies, it is difficult to judge the actualeconomic viability of drip method of irrigation. It is in this context,an attempt is made in this paper to bring out the impact of dripmethod of irrigation on different economic parameters includingeconomic viability using both secondary (experimental data) and fieldlevel data/information.
1.2 Objectives
1. To highlight the need for drip method of irrigation in Indianagriculture.
2. To study the coverage of drip method of irrigation across differentstates in India.
3. To analyse the impact of drip irrigation on water use pattern andwater use efficiency in different crops.
4. To estimate the electricity saving due to drip method of irrigationin different crops.
5. To find out the economic viability of drip investment under withand without subsidy condition using different discount rates.
6. To estimate the macro potential area available for drip method ofirrigation and the potential gains from the same for India as awhole.
7. To suggest policies to increase the widespread adoption of dripirrigation technology in India.

8
1.3 Data and Method
Drip method of irrigation is a new method of irrigation introducedrelatively recently in Indian agriculture. Though significantdevelopment has taken place in the adoption of drip method ofirrigation since early 1990s, not many studies are available based onfield survey data on different crops. Most of the available studies areeither based on experimental data or on the experience of one or fewfarmers adopting DMI. Therefore, the present study utilises both thesecondary and primary level information on drip method of irrigation.The secondary information have been mainly collected from sourcessuch as Drip Irrigation in India (published by the INCID, 1994),Evaluation of Drip Irrigation System (published by AFC,1998), theReport of the Task Force on Micro Irrigation (published by the Ministryof Agriculture, Government of India, 2004) and from the Commis-sionerate of Agriculture, Government of Maharashtra, Pune. Inaddition to this, information also collected from various publishedand unpublished sources wherever necessary.
The field level data pertaining to three crops namely sugarcane,banana and grapes have been taken from the author's own studycarried out in Maharashtra (Narayanamoorthy, 1996, 1997 andNarayanamoorthy, 2001). In order to study the impact of DMI ondifferent parameters in sugarcane cultivation, the study area and thesample selection has been selected using the following procedure.Since the adoption of drip irrigation technology is not uniform acrossthe districts of Maharashtra, two important districts from the statewhere drip irrigation is being extensively used for cultivatingsugarcane have been selected with the help of secondary datacollected from Drip Irrigation Cell, Commissionerate of Agriculture,Government of Maharashtra, Pune. District-wise data on drip-irrigated area pertaining to the year 1998-99 was used for selectingtwo important districts. The two selected districts as per this methodare Pune and Ahmednagar. In 1998-99, Pune (23.30 percent) andAhmednagar (19.43 percent) together have accounted for 42.73percent (398.29 ha) of total area under drip irrigated sugarcane inMaharashtra. Similar to the method followed for selecting thedistricts, two important blocks, one from each district, where areaunder drip irrigated sugarcane is higher, have been selected usingthe information supplied by the respective Agricultural Officer of therespective district. The two blocks selected in this method areBaramati from Pune district and Shrirampur from Ahmednagardistrict.
9
As regards selection of farmers, in each district, 50 farmersconsisting of 25 adopters and 25 non-adopters have been selected.Thus, a total of 100 sample farmers, 50 drip adopters and 50 non-drip adopters have been selected from the two selected districts toconduct detailed field survey. In Maharashtra, farmers who arehaving own well (groundwater) are only using drip method ofirrigation. Therefore, only those farmers who cultivate sugarcaneusing groundwater source of irrigation under both drip and floodirrigated condition are considered for this study. This is followedspecifically to avoid the differential impact of source of irrigation onproductivity of sugarcane. Since the state has structured scheme forpromoting drip irrigation, the list of name of drip adopters pertainingto the year 1998-99 have been used for selecting the drip adopters.While the drip adopters were selected on the basis of randomsampling method, the farmers who cultivate sugarcane using floodmethod of irrigation (groundwater as source) nearest to the field ofdrip adopters have been selected purposively as non-drip adopters.This is followed specifically to reduce the differences in soil qualityand other agro-economic factors between the two categories offarmers. The field level information from the sample farmers whohave cultivated sugarcane has been collected pertaining to the year1998-99.
In the case of grapes and banana crops, the sample for the studyis designed as follows. First, based on the secondary data collectedfrom the drip irrigation cell, Commissionerate of Agriculture, Govern-ment of Maharashtra, Pune, two districts with a relatively moreextensive use of DMI were selected. The two districts selected are:Nashik and Jalgaon. Notably, these districts are dominant in termsof the area under DMI (about 27 per cent of the state total DMIarea in 1994-95) since the introduction of the state scheme in 1986-87. Second, since the economic impact of drip irrigation varies bycrop, two dominant crops in terms of the area under DMI - onefrom each sample district - were selected. Based on the crop andblock-wise distribution of the area under DMI as obtained from theAgricultural Officers of the respective districts, two crops, i.e.,banana for Jalgaon district and grapes for Nashik district wereselected. Third, having identified the crops, two blocks - Niphad fromNashik district and Raver from Jalgaon district - with an extensivecultivation of these sample crops were selected for a detailed fieldsurvey. And, finally, with the help of the adopters' list available for1992-93, 50 farmers consisting of 25 adopters and 25 non-adoptersof DMI were selected for each district. While the adopters wereselected using random sampling procedure, non-adopters were

10
selected rather purposively. Thus, it is this sample of 100 farmersfor whom the relevant data on the economics of DMI were collectedduring the year 1993-94 that forms the basis for the field levelevaluation of DMI.
As underlined in the objectives, the impact of drip method ofirrigation on parameters such as water use pattern including watersaving, productivity of crops, electricity saving, etc., have beenstudied by comparing the same with the flood method of irrigation.How far the results of experimental data are different from the samederived from sample survey data is an issue in drip method ofirrigation. This issue has been studied by comparing the experi-mental data with the field level data, especially in parameters suchas productivity and water saving. One of the important issuespertaining to drip method of irrigation is whether or not the dripinvestment is economically viable. This question arises because DMIinvolves relatively large fixed investment. The past studies on thissubject have conducted benefit-cost analysis without propermethodology, either relied on one or few farmers adopting DMI orestimated output-input ratio without considering life period of dripset, opportunity cost, depreciation factor, subsidy, etc. Therefore, inorder to evaluate the economic viability of drip investment in threespecific crops namely grapes, banana and sugarcane, we havecomputed the net present worth (NPW) and benefit cost ratio (BCR)by utilising the discounted cash flow technique1. Though dripmethod of irrigation has been followed in Indian agriculture sinceearly 1980s, there seem to be no reliable information about the totalpotential area that is available for drip method of irrigation as wellas the gross benefits that is possible from the drip method of irriga-tion for India as a whole. An attempt has been made to estimate thepotential area for drip method of irrigation and benefits from thesame using available secondary level information.
1.4 Organisation of the Study
The study has eight chapters including introductory chapter.The need for the drip method of irrigation is highlighted usingmainly secondary information in chapter two. A detailed discussionon the development of drip irrigation across different States in Indiaas well as its coverage in different crops is presented in chapterthree. Since Maharashtra State accounts for nearly 50 percent of
1. The methodology and assumptions used for estimating the net present worth andthe benefit-cost ratio are explained in detail in chapter six, where the subject ofeconomic viability of drip investment is discussed elaborately.

11
India's drip irrigated area, an overview about its development hasalso been presented in the same third chapter. An analysis focusingon water saving and electricity saving due to drip method of irrigationis presented in chapter four. The impact of drip method of irrigationon cost of cultivation and productivity of different crops has beenanalysed using both experimental and field level data in chapter five.While chapter six presents a detailed analysis about the economicviability of drip investment under with and without subsidy conditionusing different discount rates, an estimate on the macro potentialarea for the drip method of irrigation including potential watersaving for India as whole is presented in chapter seven. The last andfinal chapter provides summary of the study as well as policyrecommendations for expanding the adoption of drip method ofirrigation in India.

13
Chapter 2
Need for Drip Method of Irrigation
2.1 Introduction
The main objective of this chapter is to highlight the need forwidespread adoption of drip method of irrigation in the context ofIndian agriculture. As mentioned earlier, the discussion presented inthis chapter is mainly based on secondary level information collectedfrom different sources. Besides water saving and productivity gains,there are many justifiable reasons for promoting drip method ofirrigation in countries like India, where available potential of waterfor irrigation has been declining at a faster rate. Broadly, we haveidentified six major reasons for adopting drip method of irrigation,which are associated with (a) water availability and management; (b)capital cost of irrigation; (c) production and productivity of crops; (d)electricity consumption; (e) environmental reasons and (f) extensionof area under cultivation. Let us now discuss each of the reasons indetail.
2.2 Water Availability and Management
Considering the importance of irrigation in agricultural growth,prime attention has been given for the development of irrigationsince independence in India. Up to 2001-02, about Rs. 1360.65billion (in current prices) have been spent exclusively for thedevelopment of irrigation by the government sector alone (see, Table2.1). As a result of this, area under irrigation has increased from26.61 mha in 1950-51 to 86.67 mha in 1996-97, an increase of2.60 percent per annum. Despite substantial increase of area underirrigation, the share of irrigated area to gross cropped area is onlyabout 40 percent as of today. One of the main reasons for thelimited expansion of area under irrigation is the predominant use offlood method of irrigation for cultivating crops, where water useefficiency is very low due to various reasons.
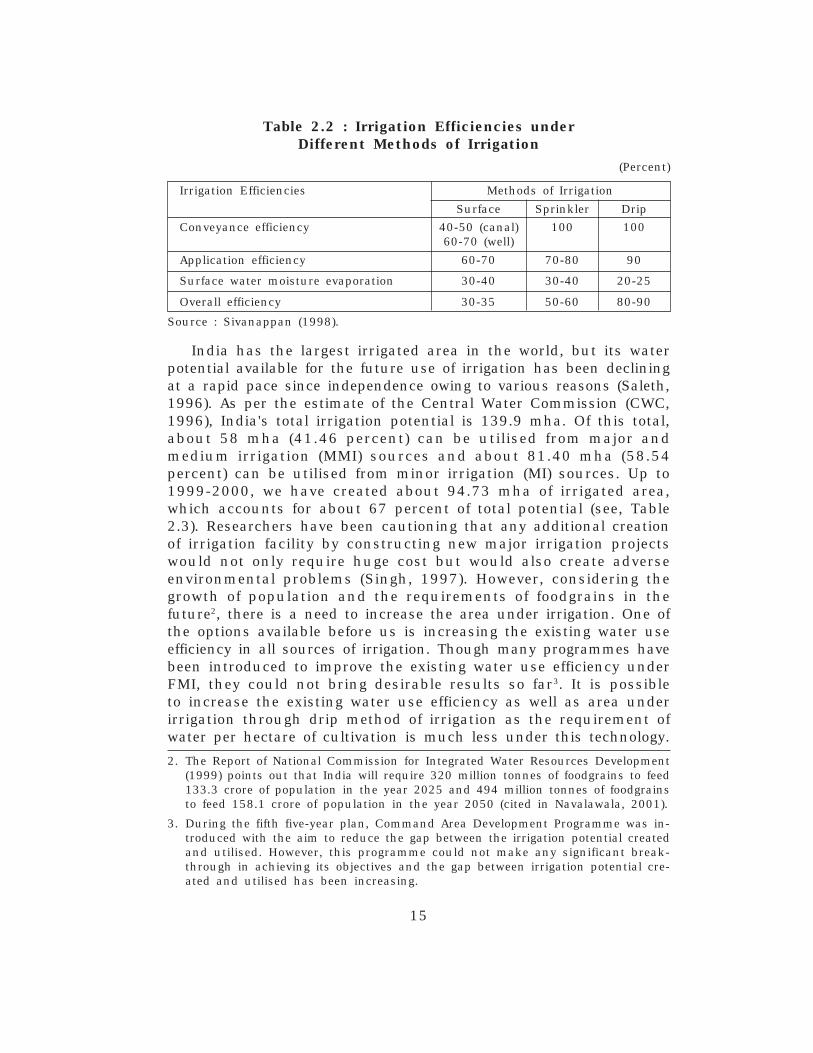
In India, the water use efficiency under flood method of irrigationis estimated to be only around 40 percent mainly due to huge lossesthrough evaporation, conveyance and distribution (Sivanappan, 1994;Rosegrant, 1997; Rosegrant and Meinzen-Dick, 1996). Unlike FMI,water use efficiency can be achieved over 90 percent in DMI (see,Table 2.2). Since water is supplied directly to the root zone of thecrops using pipe network under DMI, the evaporation and distribution

14
losses are completely absent under this method. Though FMI hasbeen followed predominantly all over the world for cultivating crops,it is no longer desirable for countries like India mainly due tolimited availability of water resources and growing demand for waterfor irrigation and other purposes. Therefore, for achieving sustainableagricultural development, it is essential to increase the existing wateruse efficiency for which drip method of irrigation can be one of theviable options (Narayanamoorthy, 1997b).
Table 2.1 : Magnitude and Composition of Investment throughPlan Periods in Irrigation and Flood Control Sectors
(Rs. Crore)
Plan Minor Irrigation
MMI Public Institu- Total C.A.D. Flood Totaltional Control
First 376.24 65.62 Neg.(1951-56)
Second 380.00 142.23 19.35 161.58 — 48.06 589.64(1956-61)
Third 576.00 327.73 115.37 443.10 — 82.09 1101.19(1961-66)
Annual 429.81 326.19 234.74 560.93 — 41.96 1032.70(1966-69)
Fourth 1242.30 512.28 661.06 1173.34 — 162.04 2577.68(1969-74)
Fifth 2516.18 630.83 778.76 1409.58 — 298.61 4224.38(1974-78)
Annual 2078.58 501.50 480.40 981.90 362.96 329.96 3753.40(1978-80)
Sixth 7368.83 1979.26 1437.56 3416.82 743.05 786.85 12315.55(1980-85)
Seventh 11107.29 3118.35 3060.95 6179.30 1447.50 941.58 19675.67(1985-90)
Annual 5459.15 1680.48 1349.59 3030.07 619.45 460.64 9569.31(1990-92)
Eighth 21071.87 6408.36 5331.00 11739.36 2145.92 1691.68 36648.83(1992-97)
Ninth Plan 48259.08 8615.07 2659.00 11274.07 1519.17 2629.23 63681.55(1997-02)*
Total 100865.33 24307.90 16127.78 40435.67 6838.05 7485.91 155624.97
Note : * - anticipated: MMI - Major and Medium Irrigation; CAD - Command Area Development
Source : GOI (2002), Tenth Five Year Plan: 2002-2007, Vol. II, Planning Commission,
Government of India, New Delhi.
15
Table 2.2 : Irrigation Efficiencies underDifferent Methods of Irrigation
(Percent)
Irrigation Efficiencies Methods of Irrigation
Surface Sprinkler Drip
Conveyance efficiency 40-50 (canal) 100 10060-70 (well)
Application efficiency 60-70 70-80 90
Surface water moisture evaporation 30-40 30-40 20-25
Overall efficiency 30-35 50-60 80-90
Source : Sivanappan (1998).
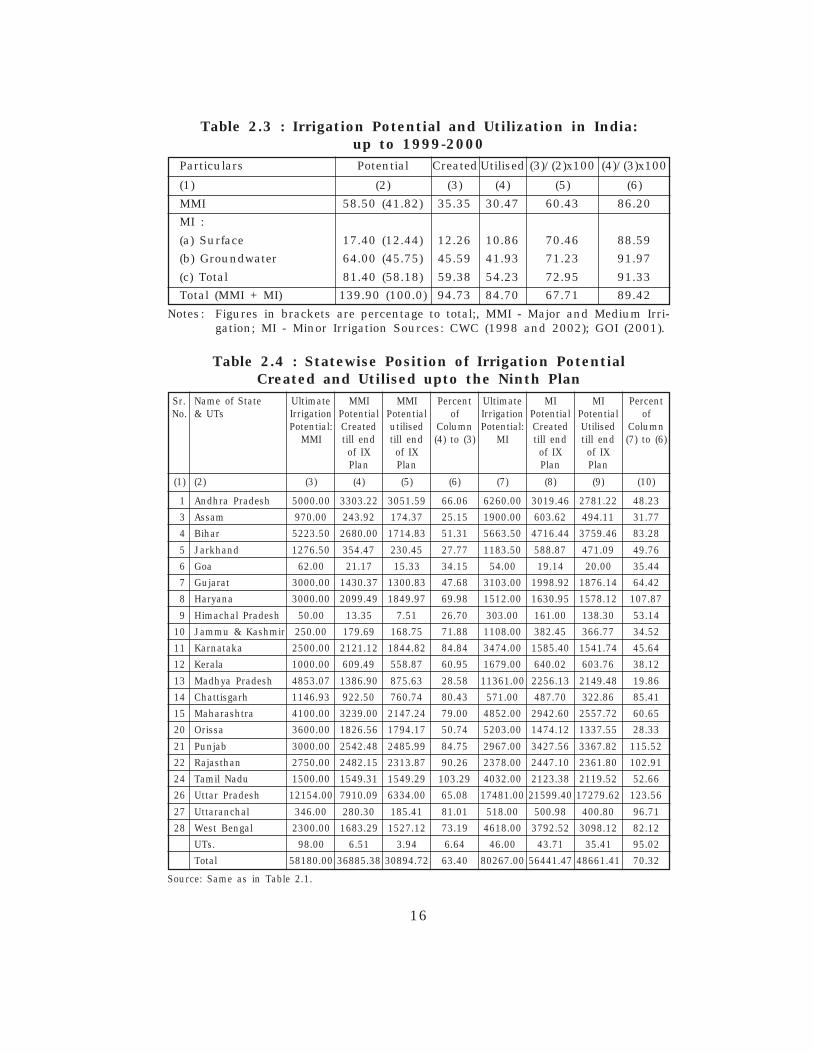
India has the largest irrigated area in the world, but its waterpotential available for the future use of irrigation has been decliningat a rapid pace since independence owing to various reasons (Saleth,1996). As per the estimate of the Central Water Commission (CWC,1996), India's total irrigation potential is 139.9 mha. Of this total,about 58 mha (41.46 percent) can be utilised from major andmedium irrigation (MMI) sources and about 81.40 mha (58.54percent) can be utilised from minor irrigation (MI) sources. Up to1999-2000, we have created about 94.73 mha of irrigated area,which accounts for about 67 percent of total potential (see, Table2.3). Researchers have been cautioning that any additional creationof irrigation facility by constructing new major irrigation projectswould not only require huge cost but would also create adverseenvironmental problems (Singh, 1997). However, considering thegrowth of population and the requirements of foodgrains in thefuture2, there is a need to increase the area under irrigation. One ofthe options available before us is increasing the existing water useefficiency in all sources of irrigation. Though many programmes havebeen introduced to improve the existing water use efficiency underFMI, they could not bring desirable results so far3. It is possibleto increase the existing water use efficiency as well as area underirrigation through drip method of irrigation as the requirement ofwater per hectare of cultivation is much less under this technology.
2. The Report of National Commission for Integrated Water Resources Development(1999) points out that India will require 320 million tonnes of foodgrains to feed133.3 crore of population in the year 2025 and 494 million tonnes of foodgrainsto feed 158.1 crore of population in the year 2050 (cited in Navalawala, 2001).
3. During the fifth five-year plan, Command Area Development Programme was in-troduced with the aim to reduce the gap between the irrigation potential createdand utilised. However, this programme could not make any significant break-through in achieving its objectives and the gap between irrigation potential cre-ated and utilised has been increasing.
16
Table 2.3 : Irrigation Potential and Utilization in India:up to 1999-2000
Particulars Potential Created Utilised (3)/(2)x100 (4)/(3)x100
(1) (2) (3) (4) (5) (6)
MMI 58.50 (41.82) 35.35 30.47 60.43 86.20
MI :
(a) Surface 17.40 (12.44) 12.26 10.86 70.46 88.59
(b) Groundwater 64.00 (45.75) 45.59 41.93 71.23 91.97
(c) Total 81.40 (58.18) 59.38 54.23 72.95 91.33
Total (MMI + MI) 139.90 (100.0) 94.73 84.70 67.71 89.42
Notes : Figures in brackets are percentage to total;, MMI - Major and Medium Irri-gation; MI - Minor Irrigation Sources: CWC (1998 and 2002); GOI (2001).
Table 2.4 : Statewise Position of Irrigation PotentialCreated and Utilised upto the Ninth Plan
Sr. Name of State Ultimate MMI MMI Percent Ultimate MI MI PercentNo. & UTs Irrigation Potential Potential of Irrigation Potential Potential of
Potential: Created utilised Column Potential: Created Utilised ColumnMMI till end till end (4) to (3) MI till end till end (7) to (6)
of IX of IX of IX of IXPlan Plan Plan Plan
(1) (2) (3) (4) (5) (6) (7) (8) (9) (10)
1 Andhra Pradesh 5000.00 3303.22 3051.59 66.06 6260.00 3019.46 2781.22 48.23
3 Assam 970.00 243.92 174.37 25.15 1900.00 603.62 494.11 31.77
4 Bihar 5223.50 2680.00 1714.83 51.31 5663.50 4716.44 3759.46 83.28
5 Jarkhand 1276.50 354.47 230.45 27.77 1183.50 588.87 471.09 49.76
6 Goa 62.00 21.17 15.33 34.15 54.00 19.14 20.00 35.44
7 Gujarat 3000.00 1430.37 1300.83 47.68 3103.00 1998.92 1876.14 64.42
8 Haryana 3000.00 2099.49 1849.97 69.98 1512.00 1630.95 1578.12 107.87
9 Himachal Pradesh 50.00 13.35 7.51 26.70 303.00 161.00 138.30 53.14
10 Jammu & Kashmir 250.00 179.69 168.75 71.88 1108.00 382.45 366.77 34.52
11 Karnataka 2500.00 2121.12 1844.82 84.84 3474.00 1585.40 1541.74 45.64
12 Kerala 1000.00 609.49 558.87 60.95 1679.00 640.02 603.76 38.12
13 Madhya Pradesh 4853.07 1386.90 875.63 28.58 11361.00 2256.13 2149.48 19.86
14 Chattisgarh 1146.93 922.50 760.74 80.43 571.00 487.70 322.86 85.41
15 Maharashtra 4100.00 3239.00 2147.24 79.00 4852.00 2942.60 2557.72 60.65
20 Orissa 3600.00 1826.56 1794.17 50.74 5203.00 1474.12 1337.55 28.33
21 Punjab 3000.00 2542.48 2485.99 84.75 2967.00 3427.56 3367.82 115.52
22 Rajasthan 2750.00 2482.15 2313.87 90.26 2378.00 2447.10 2361.80 102.91
24 Tamil Nadu 1500.00 1549.31 1549.29 103.29 4032.00 2123.38 2119.52 52.66
26 Uttar Pradesh 12154.00 7910.09 6334.00 65.08 17481.00 21599.40 17279.62 123.56
27 Uttaranchal 346.00 280.30 185.41 81.01 518.00 500.98 400.80 96.71
28 West Bengal 2300.00 1683.29 1527.12 73.19 4618.00 3792.52 3098.12 82.12
UTs. 98.00 6.51 3.94 6.64 46.00 43.71 35.41 95.02
Total 58180.00 36885.38 30894.72 63.40 80267.00 56441.47 48661.41 70.32
Source: Same as in Table 2.1.

17
The irrigation potential available for future use has also beendeclining in many states. In fact, the condition is precarious inagriculturally advanced states like Punjab, Haryana and Tamil Nadu(see, Table 2.4). The irrigation potential created to the total potential ofMMI up to the ninth plan ranges from 69 to 103 percent in states likeHaryana, Punjab and Tamil Nadu. Similarly, the irrigation potentialcreated to the total potential of MI also varies from about 53 percentto 123 percent in states like Haryana, Punjab, Rajasthan, Gujarat,Maharashtra, Tamil Nadu and Uttar Pradesh (see, Narayanamoorthy,2002). Further exploitation of water through MMI and MI sourcesfrom these states certainly would create adverse environmentalproblems. Therefore, cultivating crops with the present method ofirrigation, i.e., flood method of irrigation, is no longer desirable.Besides solving the problem of over-exploitation of water, the dripmethod of irrigation helps to increase the area under irrigation bysaving substantial amount of water (Narayanamoorthy, 1997).
Table 2.5 : Statewise Groundwater Potential and Development
(cubic km/year)
Sr. States Total Provision Available Net Balance Level ofNo. Repleni- for Do- Ground- Draft Ground- Ground
shable mestic, water water waterGround- Indus- Resour- Potential Develop-
water trial & ces for available mentReserve other Irrigation for Exp- (percent)
Uses loitation
(1) (2) (3) (4) (5) (6) (7) (8)
1. Andhra Pradesh 35.29 5.29 30.00 7.09 22.91 23.642. Assam 24.72 3.71 21.01 0.94 20.07 4.483. Bihar 33.52 5.03 28.49 5.47 23.03 19.194. Gujarat 20.38 3.06 17.32 7.17 10.15 41.455. Haryana 8.53 1.28 7.25 6.08 1.17 83.886. Himachal Pradesh 0.37 0.07 0.29 0.05 0.24 18.107. Jammu & Kashmir 4.43 0.66 3.76 0.05 3.71 1.338. Karnataka 16.19 2.43 13.76 4.30 9.46 31.269. Kerala 7.90 1.31 6.59 1.01 5.58 15.2810. Madhya Pradesh 50.89 7.63 43.26 7.13 36.12 16.4911. Maharashtra 37.87 12.40 25.47 7.74 17.73 30.3912. Orissa 20.00 3.00 17.00 1.43 15.57 8.4213. Punjab 18.66 1.87 16.79 15.76 1.03 93.8214. Rajasthan 12.71 1.99 10.71 5.42 5.29 50.6315. Tamil Nadu 26.39 3.96 22.43 13.56 8.87 60.4416. Uttar Pradesh 83.82 12.57 71.25 26.84 44.41 37.6717. West Bengal 23.09 3.46 19.63 4.75 14.88 24.18
All States 431.48 70.74 360.74 115.01 245.73 31.88All UTs. 0.41 0.19 0.21 0.17 0.06 76.19All India 431.89 70.93 360.96 115.17 245.79 31.92
Note : Total may not tally due to rounding off figures. Source: CWC (1998).
18
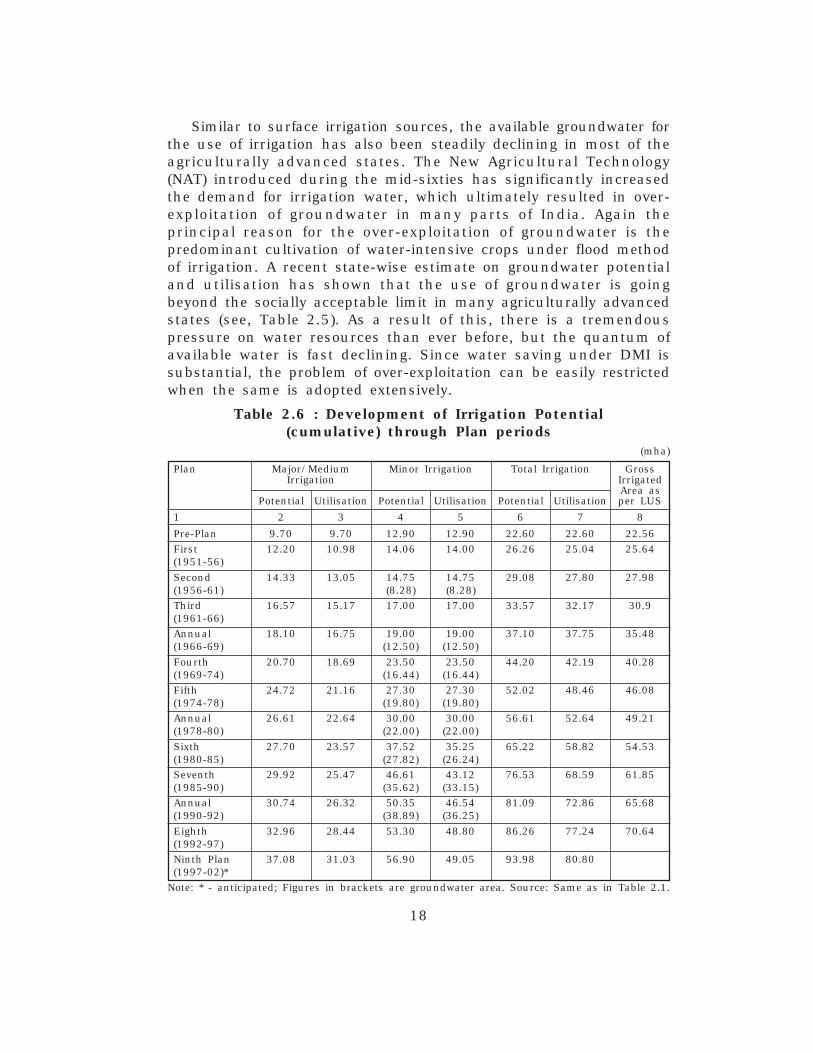
Similar to surface irrigation sources, the available groundwater forthe use of irrigation has also been steadily declining in most of theagriculturally advanced states. The New Agricultural Technology(NAT) introduced during the mid-sixties has significantly increasedthe demand for irrigation water, which ultimately resulted in over-exploitation of groundwater in many parts of India. Again theprincipal reason for the over-exploitation of groundwater is thepredominant cultivation of water-intensive crops under flood methodof irrigation. A recent state-wise estimate on groundwater potentialand utilisation has shown that the use of groundwater is goingbeyond the socially acceptable limit in many agriculturally advancedstates (see, Table 2.5). As a result of this, there is a tremendouspressure on water resources than ever before, but the quantum ofavailable water is fast declining. Since water saving under DMI issubstantial, the problem of over-exploitation can be easily restrictedwhen the same is adopted extensively.
Table 2.6 : Development of Irrigation Potential(cumulative) through Plan periods
(mha)
Plan Major/Medium Minor Irrigation Total Irrigation GrossIrrigation Irrigated
Area asPotential Utilisation Potential Utilisation Potential Utilisation per LUS
1 2 3 4 5 6 7 8
Pre-Plan 9.70 9.70 12.90 12.90 22.60 22.60 22.56First 12.20 10.98 14.06 14.00 26.26 25.04 25.64(1951-56)
Second 14.33 13.05 14.75 14.75 29.08 27.80 27.98(1956-61) (8.28) (8.28)Third 16.57 15.17 17.00 17.00 33.57 32.17 30.9(1961-66)Annual 18.10 16.75 19.00 19.00 37.10 37.75 35.48(1966-69) (12.50) (12.50)
Fourth 20.70 18.69 23.50 23.50 44.20 42.19 40.28(1969-74) (16.44) (16.44)Fifth 24.72 21.16 27.30 27.30 52.02 48.46 46.08(1974-78) (19.80) (19.80)Annual 26.61 22.64 30.00 30.00 56.61 52.64 49.21(1978-80) (22.00) (22.00)
Sixth 27.70 23.57 37.52 35.25 65.22 58.82 54.53(1980-85) (27.82) (26.24)Seventh 29.92 25.47 46.61 43.12 76.53 68.59 61.85(1985-90) (35.62) (33.15)Annual 30.74 26.32 50.35 46.54 81.09 72.86 65.68(1990-92) (38.89) (36.25)
Eighth 32.96 28.44 53.30 48.80 86.26 77.24 70.64(1992-97)Ninth Plan 37.08 31.03 56.90 49.05 93.98 80.80(1997-02)*
Note: * - anticipated; Figures in brackets are groundwater area. Source: Same as in Table 2.1.

19
2.3 Capital Cost of Irrigation
As mentioned earlier, a massive investment has been madeexclusively for the irrigation development in India by the publicsector alone. As a result of massive investment on irrigation, thetotal area under irrigation has increased from 22.61 mha in the pre-plan period (1950-51) to 86.26 mha in 2001-02 (see, 2.6). Thoughthe massive investment on irrigation was justified by many expertsin view of the nature of the Indian economy, capital cost required tocreate one hectare of irrigation has increased substantially, especiallyafter the fifth five-year plan. For instance, the requirement ofinvestment (in current prices) for creating one hectare of irrigation inMMI sector was only Rs. 1513 in first five-year plan, but the sameincreased to over Rs. 2,37,729 in 2001-02 (Narayanamoorthy, 1995;Narayanamoorthy and Kalamkar, 2004).4 One of the main reasonsattributed for the huge increase in the requirement of investment perhectare is that the new irrigation projects are more capital intensive,as most of the easily available potential has already been exploited(Vaidyanathan, 1999; Gulati, et al., 1994).5 Besides involving higherfinancial investment, the major irrigation projects are also capable ofcreating many social and environmental problems (Singh, 1997;Rosegrant, 1997).6 Though drip method of irrigation is a capital-intensive technology, its capital requirement per hectare is relativelyless when compared to the same required for MMI projects. Inaddition to this, the operation and maintenance costs of MMIprojects have also been increasing due to various reasons (Gulati, etal., 1994). Though drip irrigation cannot be a substitute for MMIprojects, the cost related problems that are associated with the largeirrigation projects, could be reduced to some extent by adopting dripmethod of irrigation at a large scale.
Apart from the issues associated with capital cost, the financialperformance of the irrigation sector in India is also not in goodcondition. According to Vaidyanathan Committee Report on Pricing ofIrrigation Water (GOI, 1992), the revenue collected from MMI projects
4. See, Gulati, et al., (1994) for more details regarding the cost and financial as-pects of Indian irrigation.
5. The cost of irrigation per hectare in real term has also substantially increasedover the years. The reasons for increasing real capital cost of new irrigationprojects in different countries are discussed in Rosegrant (1997).
6. It is reported by studies that though the benefits from Sardar Sarovar Dam(SSD) are large, the environmental and human costs of construction of dam arealso estimated to be large. Some estimates indicate that SSD would flood about37,000 hectares of forest and farmland (Rosegrant, 1997).
20
is not even enough to meet the operation and maintenance cost ofthe irrigation system. While the revenue was covering about 25percent of the operation and maintenance cost in 1977-78, the samedeclined to a meagre 9 percent by 1986-87. Recent data (1998-99)also show that the percentage of recovery of working expensesthrough gross receipts in irrigation and multipurpose river valleyprojects is only 6.30 percent (CWC, 1998 and 2002). This poorfinancial performance of irrigation sector has been observed even inStates like Maharashtra, where not only the water rates are revisedperiodically but water rates for different crops are also very highcompared to other States (Deshpande and Narayanamoorthy, 2001;Narayanamoorthy and Kalamkar, 2004). The main reason behind thepoor financial recovery is the continuous increase of operation andmaintenance expenditures of irrigation projects. Even after spendinghuge amount of money for system maintenance, the water useefficiency is very less in most of the canal command areas (see,Vaidyanathan, 1999; GOI, 1994)). The Command Area DevelopmentProgramme, which was introduced mainly to increase the efficiencyof water use in the command area and to bridge the prevailing gapbetween potential created and utilised in MMI projects, could notsucceed in its objectives. This has brought tremendous pressure onthe investment in irrigation and a large part of this investment doesnot even yield the minimum expected return today. Though dripmethod of irrigation cannot be an alternative to the mega projects, alarge-scale adoption of drip-irrigated technology can partially solvethe problems associated with cost recovery.
2.4 Production and Productivity
Although the introduction of new agricultural technology hashelped to increase production of foodgrains impressively from about72 million tonnes in 1965-66 to over 211 million tonnes in 2001-02,the achievement in production of non-foodgrain commodities such asoilseeds, vegetables, fruits, etc, is not very impressive (Kumar andMathur, 1996).7 Despite various efforts made by the policy makers,production (supply) of non-foodgrains is much less when comparedto the domestic requirements (demand) as estimated by a recentstudy (Kumar and Mathur, 1996). This has forced the government toimport these commodities from other countries to meet the domesticrequirements. Since most of the non-foodgrain crops mentioned
7. Even in cereals production the position is not very comfortable. Recent estimatesrelating to future demand and supply of cereals show that India will have cerealdeficits of 36 to 64 million tonnes per year by 2020. A detailed account onIndia's cereal supply and demand is available in Bhalla, et al., (1999).

21
above are cultivated predominantly under rain-fed condition wheremoisture stress is common, production of these commodities couldnot be increased to the desired level. Unlike FMI, the cropscultivated under DMI do not face any moisture stress as water issupplied on a continuous basis at a required level. The yieldincreasing inputs (fertilisers, etc.,) applied for crops cultivated underflood method of irrigation also do not fully reach the crops due toleaching and other reasons. As fertilisers (liquid) can be suppliedthrough water (which is called fertigation), the loss of fertilisers byway of leaching and evaporation is very less and hence high-levelinput use efficiency is possible under DMI. Since both moisture leveland input use efficiency are maintained at a higher level under dripmethod of irrigation, productivity of crops cultivated under dripmethod of irrigation is significantly higher than the crops cultivatedunder FMI.
Further, the production of foodgrains and other agriculturalcommodities have to be increased keeping in view the growth ofpopulation. Already, the growth in foodgrains productivity was verylow during the nineties (1.52 percent per annum) when compared tothe growth of eighties (2.74 percent per annum) (see, Table 2.7).Our experience indicates that production of foodgrains also goesdown sharply whenever fluctuations occur in rainfall. In order toavoid this problem, new areas with irrigation facility need to bebrought under cultivation. As mentioned earlier, creating irrigationfacilities through MMI projects would cost more for the exchequerand also take long gestation period. With the available irrigationpotential, the area under irrigation can be expanded further if dripmethod of irrigation is followed, as it requires less water whencompared to flood method of irrigation8.
2.5 Energy Saving
Due to rapid development of groundwater irrigation in Indianagriculture, the requirement of electricity for agriculture (used forirrigation pumpsets) has increased significantly since the introductionof green revolution. For instance, between 1965-66 and 1995-96,while the total (all sectors) consumption of electricity has increasedat a rate of 8.12 percent per annum, the same increased at a rateof 13.56 percent per annum in agricultural sector (Narayanamoorthy,1999). In absolute term, consumption of electricity in agricultural
8. According to an estimate of the World Bank, with a 10 percent increase in theexisting water use efficiency, India could add 7-8 mha of irrigated area withoututilising additional water resources (World Bank, 1998).
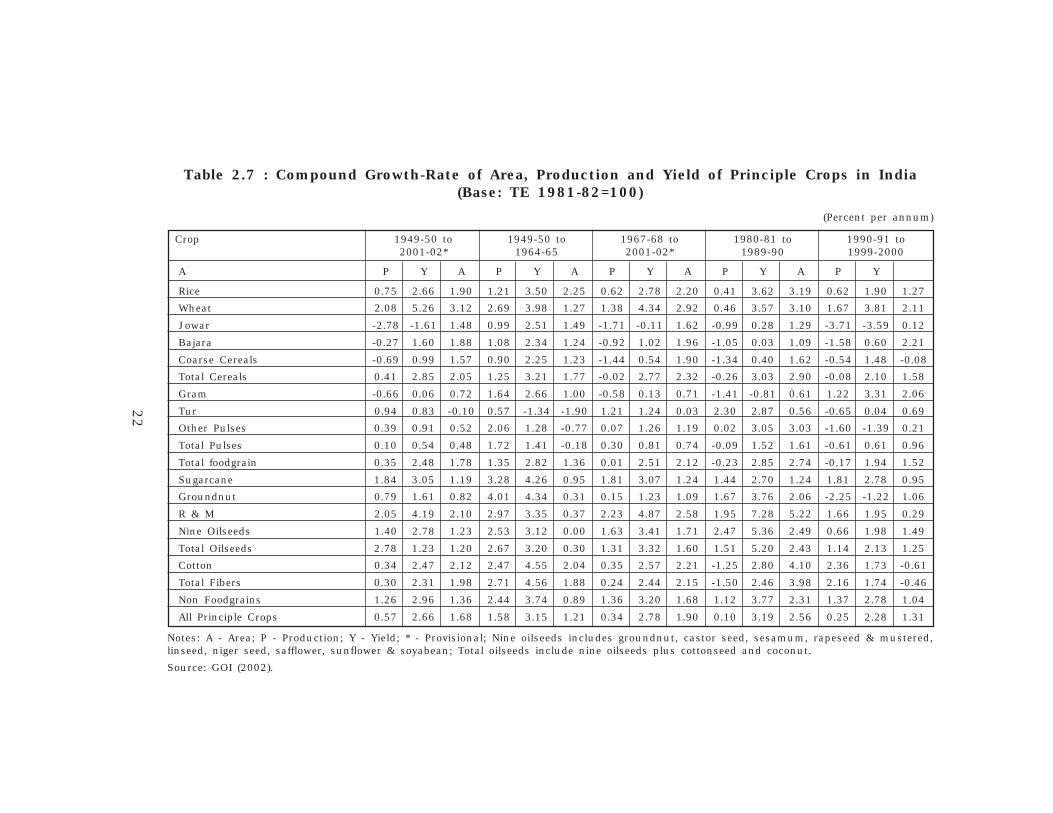
22
Table 2.7 : Compound Growth-Rate of Area, Production and Yield of Principle Crops in India(Base: TE 1981-82=100)
(Percent per annum)
Crop 1949-50 to 1949-50 to 1967-68 to 1980-81 to 1990-91 to2001-02* 1964-65 2001-02* 1989-90 1999-2000
A P Y A P Y A P Y A P Y A P Y
Rice 0.75 2.66 1.90 1.21 3.50 2.25 0.62 2.78 2.20 0.41 3.62 3.19 0.62 1.90 1.27
Wheat 2.08 5.26 3.12 2.69 3.98 1.27 1.38 4.34 2.92 0.46 3.57 3.10 1.67 3.81 2.11
Jowar -2.78 -1.61 1.48 0.99 2.51 1.49 -1.71 -0.11 1.62 -0.99 0.28 1.29 -3.71 -3.59 0.12
Bajara -0.27 1.60 1.88 1.08 2.34 1.24 -0.92 1.02 1.96 -1.05 0.03 1.09 -1.58 0.60 2.21
Coarse Cereals -0.69 0.99 1.57 0.90 2.25 1.23 -1.44 0.54 1.90 -1.34 0.40 1.62 -0.54 1.48 -0.08
Total Cereals 0.41 2.85 2.05 1.25 3.21 1.77 -0.02 2.77 2.32 -0.26 3.03 2.90 -0.08 2.10 1.58
Gram -0.66 0.06 0.72 1.64 2.66 1.00 -0.58 0.13 0.71 -1.41 -0.81 0.61 1.22 3.31 2.06
Tur 0.94 0.83 -0.10 0.57 -1.34 -1.90 1.21 1.24 0.03 2.30 2.87 0.56 -0.65 0.04 0.69
Other Pulses 0.39 0.91 0.52 2.06 1.28 -0.77 0.07 1.26 1.19 0.02 3.05 3.03 -1.60 -1.39 0.21
Total Pulses 0.10 0.54 0.48 1.72 1.41 -0.18 0.30 0.81 0.74 -0.09 1.52 1.61 -0.61 0.61 0.96
Total foodgrain 0.35 2.48 1.78 1.35 2.82 1.36 0.01 2.51 2.12 -0.23 2.85 2.74 -0.17 1.94 1.52
Sugarcane 1.84 3.05 1.19 3.28 4.26 0.95 1.81 3.07 1.24 1.44 2.70 1.24 1.81 2.78 0.95
Groundnut 0.79 1.61 0.82 4.01 4.34 0.31 0.15 1.23 1.09 1.67 3.76 2.06 -2.25 -1.22 1.06
R & M 2.05 4.19 2.10 2.97 3.35 0.37 2.23 4.87 2.58 1.95 7.28 5.22 1.66 1.95 0.29
Nine Oilseeds 1.40 2.78 1.23 2.53 3.12 0.00 1.63 3.41 1.71 2.47 5.36 2.49 0.66 1.98 1.49
Total Oilseeds 2.78 1.23 1.20 2.67 3.20 0.30 1.31 3.32 1.60 1.51 5.20 2.43 1.14 2.13 1.25
Cotton 0.34 2.47 2.12 2.47 4.55 2.04 0.35 2.57 2.21 -1.25 2.80 4.10 2.36 1.73 -0.61
Total Fibers 0.30 2.31 1.98 2.71 4.56 1.88 0.24 2.44 2.15 -1.50 2.46 3.98 2.16 1.74 -0.46
Non Foodgrains 1.26 2.96 1.36 2.44 3.74 0.89 1.36 3.20 1.68 1.12 3.77 2.31 1.37 2.78 1.04
All Principle Crops 0.57 2.66 1.68 1.58 3.15 1.21 0.34 2.78 1.90 0.10 3.19 2.56 0.25 2.28 1.31
Notes: A - Area; P - Production; Y - Yield; * - Provisional; Nine oilseeds includes groundnut, castor seed, sesamum, rapeseed & mustered,linseed, niger seed, safflower, sunflower & soyabean; Total oilseeds include nine oilseeds plus cottonseed and coconut.
Source: GOI (2002).

23
sector has increased from 1,982 million kwh in 1965-66 to 91,277million kwh in 1997-98. No doubt that the contribu-tion of ground-water irrigation to the total production and producti-vity of crops inIndian agriculture is substantial (Moench, 1994; Shah, 1993; Shahand Roy, 2004). However, the researchers have been arguing thatboth water and electricity are used most inefficiently in many partsof groundwater regions because of cheaper pricing policy (either freeof cost or under flat-rate tariff system) that is followed foragricultural purpose (Vaidyanathan, 1999; 1997). Although it isdifficult to conclude that the cheaper tariff has redu-ced theefficiency of water use in agriculture (Moench and Kumar, 1997;Narayanamoorthy, 1997), it has certainly affected the financialposition of the State Electricity Boards (SEBs). One of the mainreasons for the huge increase of electricity consumption inagriculture is the predominant use of flood method of irrigation thattoo for water-intensive crops like sugarcane, banana, etc. Since watersaving from DMI is substantial, a large-scale adoption of dripmethod of irrigation would help in reducing the subsidy amountgiven to agricultural sector on account of electricity. A field levelstudy carried out in this context in Maharashtra estimated thatelectricity saving due to DMI was about 2430 kwh/ha for bananaand 1470 kwh/ha for grapes (Narayanamoorthy, 1996a).
2.6 Environmental Reasons
In recent years, the environmental problems associated withirrigation have been increasing at a rapid pace in Indian agriculture(Chopra, 1996). Most of the environmental problems occur mainlybecause of the predominant practice of the flood method of irrigation.The conventional method of irrigation not only leads to inefficientuse of irrigation water due to enormous losses in evapora-tion anddistribution, but also results in over-use of water which ultimatelybrings many negative externalities in agriculture. While the over-useof irrigation water causes damage to soils in the form of waterlogging and soil salinity on the one side, it also reduces the yield ofcrops on the other side (Chopra, 1996). Groundwater irriga-tion alsohas its own share of problems although the magnitude is differentfrom MMI system. With the fast increase of density of wells, the rateof exploitation of groundwater has been increasing at a rapid pace.As a result of over-exploitation of water, problems like sea waterintrusion, progressive lowering of water table, increase in fluoridelevel in groundwater, etc., have been reported in different parts ofthe country (Vaidyanathan, 1994).

24
According to an estimate of Central Water Commission (1996),about 141 mha out of 329 mha of geographical area is subject towater and wind erosion. In addition to this, about 34 mha is affec-ted by land degradation problems like water logging, alkaline andacidic soil, salinity, ravines and gullies, shifting cultivation, riverineand torrents etc. Only about 47 percent of the total geogra-phicalarea can be considered as unaffected land resources. The majorcauses for land degradation are water logging and salinity andestimates indicate over 40 percent of the land area is affected bysuch problems (CWC, 1996). Out of 8.5 mha of the land affected bywater logging in the country, nearly 2.46 mha is estimated to becaused by the inadequate drainage system in the command areas.Similarly, out of 5.5 mha of the land affected by salinity, as muchas 3.06 mha comprises of the area affected due to irrigation relatedproblems (CWC, 1996). Maximum problems of water logging isreported to be concentrated in the States of Bihar, Uttar Pradesh,Andhra Pradesh, Haryana and Punjab which account for nearlythree-fourth of the total area affected in the irrigation commands inthe country (CWC, 1996). According to various studies, the mainreason for water logging is the over-use of irrigation and negligenceof drainage part of the irrigation system (Vaidyanathan, 1994).
A study carried out in Gujarat (coastal areas of Saurashtraregion) showed how adversely the over-exploitation of groundwaterhas affected the land resources. Tube-wells development in theseareas shifted the crop pattern from food crops to sugarcane to alarger extent. As a result of this, the water table in this region fellby 3-10 meters over a period of seven or eight years. In 1970,majority of the farmers in this area suffered reduced crop yields andfound well water brackish; some farmers continued to irrigate withthe saline water thereby ruining their top soils. In fact, theunfettered exploitation of groundwater in this region impound largelyirreparable damage on land resources and affected a large number offamilies (Shah, 1993). The main reason for all these problems ispredominant use of flood method of irrigation where controllability ofirrigation water is very less. Drip method of irrigation would help toreduce the environmental problems associated with flood method ofirrigation to a larger extent, as the management of irrigation is mucheasier under DMI. Moreover, since water is supplied at the root zoneof the crop at a required quantity with required interval, waterlogging is completely absent under DMI.

25
2.7 Area under Cultivation to be Expanded
Considering the growth of population in India as well as require-ment of various agricultural commodities, it is necessary to bringnew area under cultivation. The net sown area of the country isalmost constant for the last 30 years, as all the productive landshave already been brought under cultivation.9 Most of the unutilizedareas are available in the form of undulating terrain and hilly areas,
Table 2.8 : Comparative Advantages of Drip Irrigationover Flood Irrigation
Variables Drip Method Flood Method
1. Water saving 40-100 percent Less owing to evaporationlosses
2. Irrigation efficiency 80-90 percent 30-50 percent
3. Input cost Less especially in labour, Comparatively higherfertilizers, pesticides andtilling
4. Weed problem Reduced significantly Very High
5. Suitable water Even saline water can be Only normal water can beused used
6. Diseases and pest Relatively less High/moderateproblems
7. Water logging Nil About 8.5 mha is underwater logging in India
8. Water control Easily manageable Difficult to manage
9. Evaporation and Very low Very Hightransportation losses
10. Labour requirement Relatively low High
11. Efficiency of fertiliser Very high and constant Heavy losses owing touse supply leaching and evaporation
12. B-C ratio Excluding water saving: In the range of 1.8-3.91.3-13.3 including watersaving: 2.8-30.0
13. Capital cost/ha Rs. 15000-40000 varies with Rs. 70000 for MMI projectsspace and crops during 7th Plan
14. Product quality Relatively better Normal
15. Increase in yield About 20-100 percent higher Yield is less compared tovis-à-vis flood method drip irrigation
Source : Narayanamoorthy, (1997a).
9. The net sown area of the country, between 1970-71 and 1996-97, has increasedabout 2.55 mha with a compound growth rate of only 0.07 percent per annum(GOI, 2000). Virtually all the easily possible productive lands have already beenbrought under cultivation.

26
which are not suitable for crop cultivation under flood method ofirrigation. However, unlike flood method of irrigation, drip method ofirrigation can be operated in all types of areas: undulating terrain,rolling topography, hilly areas, shallow soils, saline water areas aswell as water scarce areas. As per the land use data of 1996-97,about 56.25 mha of area was available in the form of fallow,cultivable waste, barren land, etc. Large part of this area can bebrought under drip method of irrigation and handed over to the poorand landless labourers under participatory irrigation management(PIM). This would not only help to increase the area under irrigationwith less investment, but would also reduce the level of poverty thatprevails in rural India in a sustained manner.
In addition to the reasons discussed above, drip method ofirrigation also helps to improve the quality of produce, efficiency infertiliser application, reduces weed growth, saves labour costs, etc(see, Table 2.8). On the whole, it is clear from the above that it ispossible to reduce the problems associated with demand-supplyposition of water, cost of irrigation, financial position of irrigationsector, environment, etc., by adopting drip method of irrigation at alarge scale.

27
Chapter 3
Development of Drip Irrigation in India
3.1 Introduction
Though drip method of irrigation is relatively a new method ofirrigation introduced in Indian agriculture, substantial developmenthas taken place in the adoption of this new irrigation technologyover the last fifteen years. In this section, besides discussing thedevelopment of drip irrigation across different States as well asacross different crops, we also present the efforts made by thegovernment (including some State governments) for promoting dripmethod of irrigation in Indian agriculture. Since the adoption of dripmethod of irrigation is relatively well developed in Maharashtra State,a detailed account about its development over the years has alsobeen presented at the end of this chapter10.
3.2 Promotional Activities on Drip Irrigation in India
Drip method of irrigation was introduced in India during theearly seventies at the Agricultural Universities and other ResearchInstitutions. The scientists at the Tamil Nadu Agricultural University(TNAU), Coimbatore, who are considered to be the pioneers in dripirrigation research in India, have conducted large-scale demonstra-tion in the farmers' field for various crops, which received encourag-ing response from the farmers (INCID, 1994). However, the adoptionof drip method of irrigation was very slow till mid-eighties mainlybecause of lack of promotional activities from the State and Centralgovernments.
The formation of the National Committee on the Use of Plasticsin Agriculture (NCPA) by the Ministry of Petroleum, Chemicals andFertilisers, Government of India, during 1981 under the Chairman-ship of Dr. G.V.K. Rao is termed as the first milestone for thedevelopment of micro-irrigation in India (GOI, 2004). With theestablishment of 17 different Plasticulture Development Centres
10. Similar to Maharashtra State, Andhra Pradesh has also introduced a State levelscheme to promote micro irrigation, which is known as Andhra Pradesh MicroIrrigation Project (APMIP). This project was introduced during November 2003and is aiming to cover 2.50 lakh hectares during the next three years. Due tonon-availability of data about its progress, we could not include any detailsabout the development APMIP in this report.

28
(PDCs) across different agro-climatic regions in the country, theNCPA has played a crucial role in the technological development ofmicro-irrigation in India.11 Besides recommending policy measures tothe government, the NCPA also played an important role in promotingdrip method of irrigation through conducting seminar focusing onmicro-irrigation (GOI, 2004).
Apart from the government efforts, some research institutes andprivate drip set manufactures have also been playing an importantrole in promoting drip method of irrigation in India. For instance,The Report of Task Force on Micro Irrigation rightly mentions "JainIrrigation Systems Ltd., Jalgaon has been playing a pioneering rolesince its inception in 1989 for promoting micro irrigation" (GOI,2004, p. 124). The establishment of the Jain Irrigation SystemsLimited in 1988-89 marked a watershed in the spread of thistechnology. Their approach was unique, committed, scientific andpersistent. A "Systems approach" from concept to commissioning wasadopted by them. Learning from the mistakes and the short comingsof the past, this new company undertook extensive surveys in themarket, interacted with scores of customers who had installed dripirrigation systems in their field, critically evaluated its ills and tooksystematic and determined steps to remove these ills. The concept infact was pioneered in the country by the Jain Irrigation, Jalgaon. Adecade ago, the company established 600 acres agro related Research& Development Farm at Jalgaon, where experiments on variousaspects related to agronomy, irrigation, water management, water-shed and waste land development are conducted on regular basis.Farmers can see for themselves on this farm the advantages ofadopting modern and innovative technologies and put these conceptsinto practice on their farmlands (see, AFC, 1998; GOI, 2004).
3.3 Schemes for Drip Irrigation
Since drip irrigation is a new technology and a capital-intensiveventure, government operates schemes for drip irrigation withsubsidy. In states like Maharashtra, both the Central and Stategovernments are operating schemes for promoting drip method ofirrigation. Central scheme was started during 1982-83 (during theSixth Plan) by the Ministry of Water Resources (Minor irrigationDivision), Government of India. Through this scheme, the Governmentof India provided a subsidy of 50 percent to the farmers with the11. NCPA was latter renamed as the National Committee on Plasticulture Applica-
tions in Horticulture (NCPAH) due to the prominent role plasticulture plays inthe productivity of horticultural crops.
29
matching contribution from the State governments for installation ofmicro-irrigation devices. Of the total amount of subsidy, 75 percentwas allocated for small and marginal farmers and the balance of 25percent for other group of farmers. Government of Maharashtra hasmade pioneering efforts for the successful adoption of drip irrigationsystem and to make cost effective by providing subsidies to smalland marginal farmers to the extent of Rs. 2282.35 lakh during theperiod from 1986-93 (INCID, 1994).
Central scheme of drip irrigation was also introduced during theSeventh Plan with the following modifications :
(a) The non-conventional energy devices like solar pumps andwindmills were excluded from this subsidy scheme, as thesame were included in the other schemes operated by theDepartment of Non-Conventional Sources of Energy.
(b) The subsidy was limited to the small and marginal farmersonly, excluding other farmers from the scope of the scheme.
(c) The percentage of subsidy eligible under the scheme was atpar with the on-going Integrated Rural DevelopmentProgramme.
(d) Farmers growing horticultural crops like grapes, papaya,arecanut and coconut were also eligible for subsidy.
(e) SC and ST farmers belonging to small and marginal categoriesof the size of land holding and co-operative communityschemes of small and marginal farmers were provided with 50percent subsidy under the scheme.
However, the Central scheme of drip irrigation did not get goodresponse during the Seventh Plan since the subsidy was limited tosmall and marginal farmers only and due to capital paucity thisgroup could not afford the drip systems even at the subsided rate.After knowing the ground realities, many new measures wereincorporated under the new scheme introduced during the eighthplan. Under the new schemes, the subsidy amount is limited toeither 50 percent of the cost or Rs. 15000/ha whichever is lower.The government of India has contributed the entire 50 percent ofsubsidy upto the financial year 1994-95 and thereafter the Stategovernments have to contribute 10 percent towards subsidy for theyears 1995-96 and 1996-97, which will add upto 50 percent withCentre's contribution for 40 percent. However, a beneficiary can availsubsidy for a maximum area of one hectare only.
30
The subsidy scheme has undergone lot of changes over the years.As of 1999-2000, the Government of India provided assistance ofdrip installation for horticultural crops at 90 percent of the cost ofthe system or Rs. 25000 per hectare, whichever is less for small andmarginal, SC/ST and women farmers and 70 percent of the totalcost or Rs. 25000 per hectare, whichever is less for other category offarmers. Assistance was also provided for drip demonstration atRs. 22500 or 75 percent of the system cost per hectare whichever isless (GOI, 2004).
Government of Maharashtra has also been providing subsidyunder State schemes since 1986-87. It varies from 30 to 50 percentof the capital cost or Rs. 12250 to 20500/ha depending upon thelandholding size and community of the farmers. The Government ofMaharashtra announced in 1992 that subsidy would be given for allfarmers irrespective of their landholding. That is, currently both theschemes (Central and State sponsored schemes) supply 50 percent ofthe capital cost as subsidy for all types of farmers in Maharashtra.
3.4 Coverage of Drip Irrigation in India
Drip method of irrigation was initially introduced in the earlyseventies by the agricultural universities and other researchinstitutions in India with the aim to increase the water use efficiencyin crop cultivation. The development of drip irrigation was very slow inthe initial years and significant development has been achievedespecially since 1990s. Due to various promotional schemesintroduced by the Government of India and states like Maharashtra,area under drip method of irrigation has increased from 1500 ha in1985 to 70589 ha in 1991-92 and further to 246000 ha in 1997-98(INCID, 1994; AFC, 1998). According to the latest information, thearea under DMI estimated to have been increased to about 4.50 lakhhectares, which includes about 3.50 lakh hectares covered under theGovernment of India Schemes (GOI, 2004, p. 130). This estimate isbased on the information available from GOI depart-ments, whichhave been operating subsidy schemes for promoting drip method ofirrigation. However, as mentioned in the Report of the Task Force onMicroirrigation, a large number of institutions, commercialorganisations, universities, large public/private sector companies,NGOs, etc., have taken up drip irrigation in the country for theirfarms/crops, which do not get reflected in the data avai-lable withGOI departments. Therefore, approximately, another 1,00,000 hectaresare covered under drip systems by these organisations, whereby thetotal area under drip irrigation systems in the country would be about5,00,000 hectares as of March 2003 (GOI, 2004, pp. 130-131).

31
Table 3.1 : Statewise Area under Drip Method of Irrigation
State Area ('000 ha) Percent to Total Area
1991-92 1997-98 2000-01 1991-92 1997-98 2000-01
Maharashtra 32.92 122.995a 160.28 44.64 50.00 53.16
Karnataka 11.41 40.800b 66.30 16.17 16.58 18.03
Tamil Nadu 5.36 34.100 55.90 7.59 13.86 15.20
Andhra Pradesh 11.59 26.300 36.30 16.41 10.70 9.88
Gujarat 3.56 7.000 7.60 5.05 2.85 2.07
Kerala 3.04 4.865 5.50 4.30 1.98 1.50
Orissa 0.04 2.696 1.90 0.06 1.10 0.52
Haryana 0.012 1.900 2.02 0.17 0.77 0.55
Rajasthan 0.30 1.600 6.00 0.43 0.65 1.63
Uttar Pradesh 10.11 1.500 2.50 0.16 0.61 0.68
Punjab 0.02 1.100 1.80 0.03 0.45 0.49
Other States 2.127 1.150 5.40 3.00 0.47 1.47
Total 70.59 246.006 367.70 100.00 100.00 100.00
Notes : a - includes state subsidy scheme area of 58498 ha.b - includes area under central and state schemes for development of oil
palm and sugarcane.Sources : AFC (1998) and GOI (2004).
Despite having enormous potential and prospects, the develop-mentof drip irrigation does not match the expectations in most of the states.Table 3.1 presents state-wise area under drip method of irrigation forthree time points: 1991-92, 1997-98 and 2000-01. It is evident fromthe table that drip irrigated area has increased substantially between1991-92 and 2000-01 in all the states of India. In all three-timepoints, Maharashtra state alone accounted for nearly 50 percent ofIndia's total drip irrigated area followed by Karnataka, Tamil Nadu andAndhra Pradesh.13 Over the last ten years, significant growth has been13. There are many reasons for the rapid development of drip irrigation in Maha-
rashtra. First, state government is very keen in promoting drip irrigation on alarge scale by providing subsidy, technical and extension services to the farmers.Maharashtra government has been providing subsidy since 1986-87 onwardsthrough state schemes. Second, area under irrigation from both surface andgroundwater is quite low and hence, many farmers have adopted drip method ofirrigation to avoid water scarcity largely in divisions like Nashik, Pune, etc. Third,owing to continuous depletion of groundwater, farmers were not able to cultivatewide spaced and more lucrative crops like grapes, banana, pomegranate, orange,mango, etc. by using surface method of irrigation in many regions. As a result,farmers had to adopt drip irrigation as these crops are most suitable for dripmethod of irrigation. Importantly, the farmers who adopted drip irrigation initiallyfor certain crops have realised the importance of drip irrigation in increasing thewater saving and productivity of crops. This has further induced many farmers toadopt drip method in some of the regions in Maharashtra.

32
achieved in area under drip method of irrigation in absolute term inmany states. However, drip irrigated area constitutes a very meagrepercentage in relation to gross irrigated area in all the states in India.For instance, during 2000-01, the share of drip-irrigated area to grossirrigated area was just 0.48 percent and about 1.09 percent in relationto total ground-water irrigated area of the country.
3.5 Crop-wise Coverage of Drip Method of Irrigation
As mentioned earlier, although over 80 crops are suitable for dripmethod of irrigation, only a few crops have been dominating in thetotal area under drip irrigation so far. As of 1997-98, crops likecoconut, grapes, banana, citrus, mango and pomegranate togetherhave accounted for nearly 67 percent of total drip irrigated area (see,Table 3.2). In all these crops, states like Maharashtra, AndhraPradesh, Tamil Nadu and Karnataka account for a major share ofthe area. More importantly, out of 26,460 ha of banana's total area,Maharashtra state alone accounted for as much as 93 percent at theend of 1997-98. It clearly suggests that despite having severe waterscarcity in different regions in the country, the adoption of dripmethod of irrigation is very much concentrated only in a few States.If we really want to avoid aggravating supply-demand gap inirrigation water in the future, it is essential to bring more water-intensive crops under drip method of irrigation.
Table 3.2 : Crop-wise Area under Drip Method of Irrigationin India: 1997-98
Crop's Name Area Leading StatesCoconut 48360 Karnataka (24.00, Tamil Nadu (21.20)
(19.66)Grapes 29630 Maharashtra (24.10), Andhra Pradesh (2.20),
(12.04) Karnataka (3.00)Banana 26460 Maharashtra (24.50)
(10.76)Citrus 22210 Maharashtra (15.00), Andhra Pradesh (4.80)
(9.03)Mango 21860 Andhra Pradesh (9.22), Maharashtra (5.00),
(8.89) Karnataka (2.30), Tamil Nadu (4.00), Gujarat (1.20)Pomegranate 15250 Maharashtra (11.40), Karnataka (2.00)
(6.20)Other crops 82236
(33.43)Total all crops 246006
(100.00)
Note : Total will not tally as we have not included all the crops here.Figures in brackets are percentage to total area.
Source : AFC (1998).
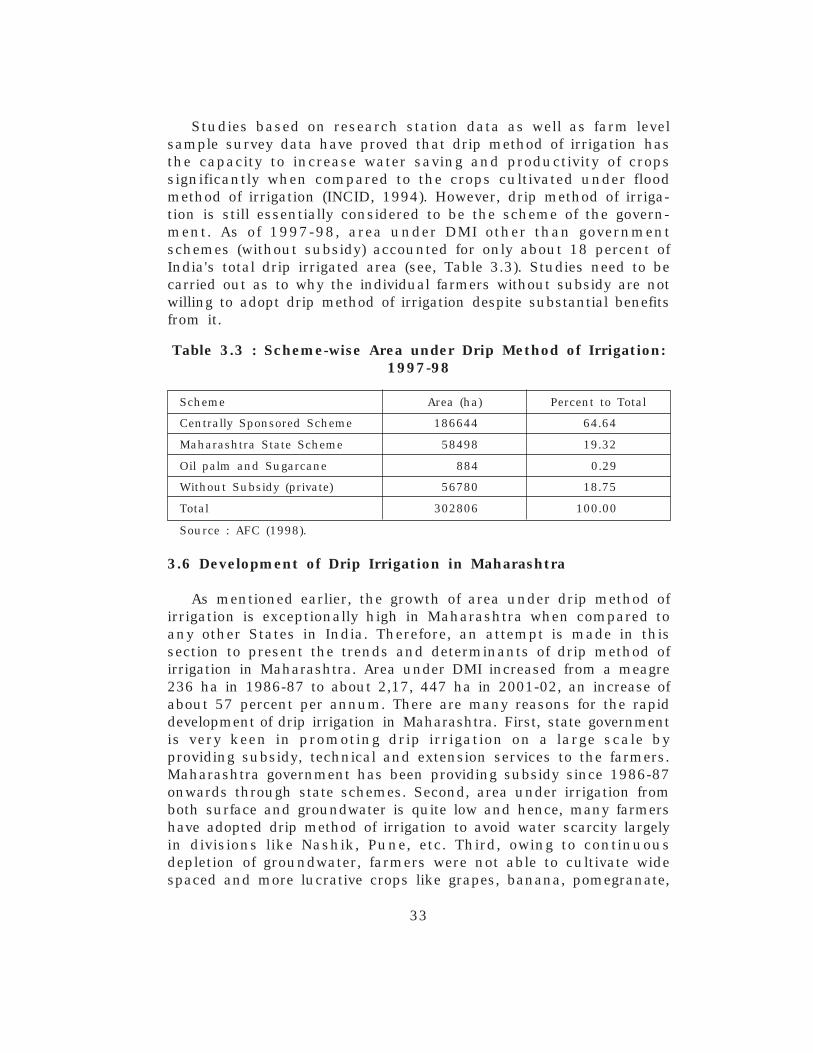
33
Studies based on research station data as well as farm levelsample survey data have proved that drip method of irrigation hasthe capacity to increase water saving and productivity of cropssignificantly when compared to the crops cultivated under floodmethod of irrigation (INCID, 1994). However, drip method of irriga-tion is still essentially considered to be the scheme of the govern-ment. As of 1997-98, area under DMI other than governmentschemes (without subsidy) accounted for only about 18 percent ofIndia's total drip irrigated area (see, Table 3.3). Studies need to becarried out as to why the individual farmers without subsidy are notwilling to adopt drip method of irrigation despite substantial benefitsfrom it.
Table 3.3 : Scheme-wise Area under Drip Method of Irrigation:1997-98
Scheme Area (ha) Percent to Total
Centrally Sponsored Scheme 186644 64.64
Maharashtra State Scheme 58498 19.32
Oil palm and Sugarcane 884 0.29
Without Subsidy (private) 56780 18.75
Total 302806 100.00
Source : AFC (1998).
3.6 Development of Drip Irrigation in Maharashtra
As mentioned earlier, the growth of area under drip method ofirrigation is exceptionally high in Maharashtra when compared toany other States in India. Therefore, an attempt is made in thissection to present the trends and determinants of drip method ofirrigation in Maharashtra. Area under DMI increased from a meagre236 ha in 1986-87 to about 2,17, 447 ha in 2001-02, an increase ofabout 57 percent per annum. There are many reasons for the rapiddevelopment of drip irrigation in Maharashtra. First, state governmentis very keen in promoting drip irrigation on a large scale byproviding subsidy, technical and extension services to the farmers.Maharashtra government has been providing subsidy since 1986-87onwards through state schemes. Second, area under irrigation fromboth surface and groundwater is quite low and hence, many farmershave adopted drip method of irrigation to avoid water scarcity largelyin divisions like Nashik, Pune, etc. Third, owing to continuousdepletion of groundwater, farmers were not able to cultivate widespaced and more lucrative crops like grapes, banana, pomegranate,

34
orange, mango, etc. by using surface method of irrigation in manyregions. As a result, farmers had to adopt drip irrigation as thesecrops are most suitable for drip method of irrigation. Importantly,the farmers who adopted drip irrigation initially for certain cropshave realised the importance of drip irrigation in increasing thewater saving and productivity of crops. This has further inducedmany farmers to adopt drip method of irrigation in some of theregions in Maharashtra.
Although drip irrigated area has been consistently increasing inMaharashtra, its development is not the same across differentdistricts of the state. Development of drip irrigation is determined byfactors like availability of surface water sources, groundwaterdevelopment, cropping pattern, economic conditions of the farmers,rainfall, area under commercial and wide spaced crops, types offarmers, structure of farming (commercial and subsistence)availability of extension services and policy of the government. Thesedetermining factors widely vary across regions. In order tounderstand the region-wise development of drip irrigated area inMaharashtra, analysis has been done across the regions from 1986-87 to 1999-2000. Table 3.4 presents region-wise area under dripirrigation, its growth rate for different points of time. It is clear fromthe table that drip irrigated area in Maharashtra has consistentlyincreased from about 237 ha in 1986-87 to 160281 ha in 1999-2000, an increase of about 65 percent per annum. Though areaunder DMI has increased appreciably in almost all the regions,growth rate of drip irrigated area is not uniform across the divisions.Between 1990-91 and 1999-2000, while the rate of growth of areaunder DMI is higher than the state's average in divisions likeNashik, Pune and Kolhapur, it is relatively lower than the state'saverage in other divisions. There are two main reasons for the rapidincrease of drip irrigated area in divisions like Nashik, Pune andKolhapur. First, crops that are most suitable for drip irrigation arebeing extensively cultivated in these regions by using groundwater.Second, these divisions are particularly facing water scarcity problemdue to depletion of groundwater. Since both area under groundwaterand wide spaced crops are less in divisions like Konkan and Nagpur,growth of drip-irrigated area is not impressive in these two divisions.Although there are variations in the development of drip area acrossthe divisions, the overall development is very impressive in almost allthe regions in 1999-2000 when compared to the position of 1990-91.
In order to understand the division-wise relative changes of dripirrigated area, we have computed division-wise share to total area

35
Table 3.4 : Division-wise Area under Drip Irrigation, its Proportion and Growth Rate:Central and State Schemes : 1999-2000
Division Total Drip Area (ha) Compound Growth Rate (%) Districtwise Share of Areaat the end of
1986- 1990- 1994- 1999- A B C D 1986- 1990- 1994- 1999-87 91 95 00 87 91 95 00
Konkan Division 5 760 1865 5965 252.89 25.17 26.18 25.73 2.07 4.68 3.10 3.72
Nashik Division 26 3944 17227 56792 251.61 44.57 26.94 34.50 10.91 24.29 28.65 35.43
Pune Division 89 3302 13550 35289 146.53 42.33 21.10 30.11 37.80 20.34 22.54 22.02
Kolhapur Division 47 1403 5932 14814 133.75 43.39 20.09 29.94 19.87 8.64 9.86 9.24
Aurangabad Division 7 1714 5855 11054 291.47 35.94 13.55 23.01 3.09 10.56 9.74 6.90
Latur Division 21 1908 6713 14038 210.59 36.96 15.90 24.83 8.67 11.75 11.16 8.76
Amravati Division 21 2590 6556 16656 234.05 26.13 20.50 22.97 8.79 15.95 10.90 10.39
Nagpur Division 21 617 1955 5673 133.39 33.41 23.75 27.95 8.79 3.80 3.25 3.54
Total Maharashtra 237 16238 60130 160281 187.85 38.72 21.66 28.97 100.00 100.00 100.00 100.00
Notes : A - Growth rate 1990-91 over 1986-87;B - Growth rate 1994-95 over 1990-91;C - Growth rate 1999-2000 over 1994-95; D-Growth rate 1999-2000 over 1990-91.
Source : Government of Maharashtra, Commissionerate of Agriculture, Pune.
36
under drip irrigation for different points of time. The share of driparea has significantly changed during the period between 1990-91 to1999-2000 in majority of the divisions. The share of Nashik divisionhas consistently increased, while the share of Latur and Nagpurdivisions has consistently declined during this period. For instance,the share of Nashik division has increased from about 24 percent in1990-91 to about 35 percent in 1999-2000, while the same hasdeclined from about 11 percent to about 8 percent in Latur divisionduring the same period. Though the increase of area in absoluteterm is very significant in Pune division, its share has not increasedvery much between 1990-91 and 1999-2000. The shares of the otherdivisions in the total area under drip irrigation are not consistent.The main point emerges from here is that despite significant increaseof area under DMI in almost all the districts in Maharashtra, thedomination of Nashik and Pune divisions in the total area has beencontinuing.
Since DMI is relatively a new irrigation technology, both state andcentral governments have been operating separate schemes topromote drip method of irrigation. Maharashtra is one among thefew states where both schemes are currently under operation.State scheme in the state has been in operation from 1986-87, whilecentral scheme started functioning from 1990-91. Out of the totaldrip area of 60129 ha at the end of 1994-95, state scheme accountedfor about 75 percent of the total area.14 State scheme occupies morearea in all the districts when compared to Central schemes.15 It isalso observed wherever the area coverage under state scheme ishigher, there area under central scheme is also higher. In otherwords, there is a positive association between area under State andCentral scheme in all the districts. For example, Nashik divisionaccounted for about 26 percent of area in the total of State scheme,while the same division accounted for about 35 percent in the totalarea of Central scheme. Similarly, Pune division accounted for about21 percent in Central scheme and 22 percent in State scheme.There are two reasons why State scheme accounts for higher sharein all the districts. First, State scheme was started during 1986-87,whereas the central scheme was implemented only in 1990-91.Second, State scheme provides subsidy even for sugarcane, whereas
14. Area under DMI separately for State and Central Schemes is not readily avail-able for our use after 1994-95. However, to understand the magnitude of thesetwo schemes, we have analysed it using the available data.
15. State scheme area refers to the area under drip irrigation by the farmers ben-efited from state scheme, whereas central scheme refers to the area under dripirrigation benefited from central scheme.

37
central scheme does not provide subsidy for sugarcane. One of themain differences that we have noted between Central and Statescheme is that the complete demonstration area of drip irrigationcomes under the Central scheme.
Attempt is also made to find out the number of farmers whohave adopted drip irrigation and the amount of money distributed inthe form of subsidy together for State and Central schemes for eachdivision (see, Table 3.5). Altogether up to March 2000, a total of
Table 3.5 : Division-wise Area under Drip Irrigation andTotal Subsidy Distributed Upto 1999-2000
Division Total Total No. of Subsidy/ AverageArea Subsidy Farmers ha. Area/(ha) (Rs. Lakh) Farmer
Konkan Division 5965.48 640.28 3358 10733 1.78
Nashik Division 56792.25 9470.92 64877 16676 0.88
Pune Division 35289.31 5437.63 41104 15409 0.86
Kolhapur Division 14813.82 2570.56 23436 17352 0.63
Aurangabad Division 11053.6 1498.45 10208 13556 1.08
Latur Division 14037.78 2270.47 12861 16174 1.09
Amravati Division 16656.05 2273.93 13658 13652 1.22
Nagpur Division 5673 775.06 4294 13662 1.32
Total Maharashtra 160281.29 24937.3 173796 15558 0.92
Source : Government of Maharashtra, Commissionerate of Agriculture, Pune.
173796 drip sets have been installed, for which an amount ofRs. 24937.3 lakh have been distributed as subsidy through Centraland State schemes. There is a positive relationship between areaunder drip method of irrigation and the number of sets installedacross districts. However, there is a wide variation in the averagearea under DMI per farmer across the divisions. Though the totalarea under DMI is very high in divisions like Nashik and Pune, theaverage area per farmer is very less (only around 0.86 ha) in thesetwo divisions. On the other hand, the average area per set is veryhigh in divisions like Konkan and Nagpur, despite a very low level ofarea under DMI. This is possibly due to difference in crop patternthat are brought under DMI. Data also shows that in both Konkanand Amravati divisions, farmers have used DMI mainly for mangoand citrus group of crops. Since mango and citrus (mainly orange)gardens are relatively larger than others, the average area per farmer

38
is larger in these divisions when compared to other divisions. Unlikethis, the crop composition of both Pune and Nashik division is mixed,where considerable amount of area of narrow spaced crops(vegetables, etc) are also cultivated under DMI. Therefore, the averagearea per farmer is relatively less in these divisions. Owing toconsiderable variation in crop composition across the divisions, theaverage per hectare subsidy also varies greatly from Rs.10733/ha inKonkan division to Rs.17352/ha in Kolhapur division.
3.7 Crop-wise Area under Drip Irrigation in Maharashtra
Like general cropping pattern, crops cultivated under DMI alsovary across the divisions in Maharashtra. More than 26 crops arebeing cultivated using drip irrigation in the state as of March 2000.The important crops are banana, grapes, sugarcane, citrus group ofcrops and pomegranate. These five crops together have accounted forabout 120335 ha which accounts for about 75 percent of the totalarea (160281 ha) under drip irrigation in Maharashtra. The crop-wiseshare of total area under DMI presented in Table 3.6 clearly showsthat distribution of crop varies widely across divisions. In the totalarea under drip irrigation in Maharashtra, banana accounts for morethan one fifth of the area (22.38 percent) followed by grapes (18.15percent), sugarcane (12.68 percent), citrus group of crops (11.59percent) and pomegranate (10.27 percent). However, this is not thesame for all the districts/divisions. Crops like mango, coconut andchiku accounted for over 66 percent of Konkan division's total areaunder drip irrigation, while crops like banana (47.48 percent) andgrapes (29.73 percent) accounted for more than three fourth of thetotal drip irrigated area in Nashik division. Sugarcane (23.73percent), pomegranate (22.79 percent) and grapes (14.27 percent)together have accounted for over 60 percent of drip irrigated area ofPune division. This clearly shows that crop composition varies withthe existing crop pattern and the ecological conditions of eachdivision/district.
Similar to crop-wise distribution, division-wise share of dripirrigated area for each crop is computed to understand how aparticular crop concentrates across the divisions. Table 3.7 showsdivision-wise share of area of each crop cultivated using DMI. Whilecrops like banana and grapes are mainly concentrated in Nashikdivision, sugarcane is concentrated in Pune and Kolhapur division -these two divisions together have accounted for about 60 percent oftotal sugarcane area. Citrus group of crops are concentrated inAmravati division (43.42 percent), whereas Nashik and Pune divisionstogether have accounted for about 81 percent of the total area of

39
Table 3.6 : Crop-wise Share of Drip Area in Maharashtra upto 1999-2000
Division Banana Grape S'cane CGC PGN Mango Ber VEG Chicku Papaya Guava C.nut Others Total
Konkan 6.50 0.00 0.00 0.58 0.03 34.17 0.00 9.27 15.47 1.11 0.20 16.55 16.12 100.00Division
Nashik 47.48 29.73 3.90 1.55 9.37 0.50 0.33 0.70 0.28 0.39 0.31 0.01 5.43 100.00Division
Pune Division 4.19 14.27 23.73 4.73 22.79 3.11 6.98 5.27 3.43 0.84 2.14 0.31 8.21 100.00
Kolhapur 2.04 33.77 26.79 1.43 11.38 5.88 2.26 3.10 1.93 0.83 0.71 1.31 8.57 100.00Division
Aurangabad 10.56 5.07 14.21 30.34 4.22 8.24 2.56 2.07 3.59 2.05 1.63 0.41 15.05 100.00Division
Latur Division 22.80 9.62 22.22 12.12 4.16 5.53 2.72 2.14 2.27 3.73 1.17 1.04 10.51 100.00
Amravati 11.56 1.57 4.46 48.43 2.10 2.90 1.63 2.60 1.50 2.45 1.47 0.05 19.26 100.00Division
Nagpur 7.86 0.02 5.89 46.92 0.24 10.72 1.22 2.54 1.40 3.74 1.23 0.15 18.06 100.00Division
Total 22.38 18.15 12.68 11.59 10.27 4.41 2.49 2.73 2.26 1.30 1.06 0.94 9.72 100.00Maharashtra
Notes : CGC-Citrus Group Crops; PGN-Pomegranate; VEG-Vegetables; C.nut-CoconutSource : Government of Maharashtra, Commissionerate of Agriculture, Pune.

40
Table 3.7 : Division-wise share of Drip Area in Maharashtra Up to 1999-2000
Division Banana Grape S'cane CGC PGN Mango Ber VEG Chicku Papaya Guava C.nut Others
Konkan Division 1.08 0.00 0.00 0.19 0.01 28.82 0.00 12.63 25.47 3.17 0.71 65.57 6.17
Nashik Division 75.17 58.03 10.89 4.73 32.32 4.04 4.72 9.12 4.40 10.79 10.30 0.56 19.80
Pune Division 4.12 17.30 41.20 8.99 48.84 15.54 61.72 42.48 33.44 14.23 44.20 7.20 18.59
Kolhapur Division 0.84 17.19 19.53 1.14 10.24 12.32 8.37 10.50 7.88 5.94 6.17 12.85 8.14
Aurangabad Divi. 3.25 1.93 7.73 18.05 2.83 12.88 7.09 5.22 10.94 10.90 10.56 3.03 10.68
Latur Division 8.92 4.64 15.35 9.15 3.54 10.98 9.55 6.85 8.78 25.15 9.61 9.68 9.46
Amravati Division 5.37 0.90 3.66 43.42 2.13 6.83 6.81 9.91 6.90 19.63 14.36 0.53 20.58
Nagpur Division 1.24 0.00 1.64 14.33 0.08 8.60 1.74 3.29 2.20 10.19 4.10 0.57 6.57
Total Maharashtra 100.00 100.00 100.00 100.00 100.00 100.00 100.00 100.00 100.00 100.00 100.00 100.00 100.00
Notes and Source: Same as in Table 3.6.
41
pomegranate. About 65 percent of coconut area is concentrated onlyin Konkan division.
This wide variation in distribution of crops' area indicates the factthat the adoption of DMI across the districts/divisions variesdepending upon the climatic and other ecological factors. Althoughthere is a wide variation in distribution of crops across the divisions,Pune division occupies an important place in almost all the majorcrops that are cultivated under DMI in Maharashtra. It seems thatPune's climatic factors and cropping pattern are most suitable forthe adoption of drip irrigation. In the following section, an attempt ismade to find out the factors which determine the adoption of dripmethod of irrigation in Maharashtra.
3.8 Factors Determining Development of Drip Area
It is understood from the earlier section that the development ofdrip irrigated area is not uniform across the divisions/districts inMaharashtra. Area under drip irrigation has increased quiteimpressively in some divisions/districts, while in other districts it isquite low. In order to understand the factors which influence thedevelopment of drip irrigation, we have made detailed analysis acrossthe districts by taking into account the factors like rainfall, areaunder groundwater, area under surface irrigation, irrigation intensity,cropping intensity, area under non-foodgrain crops and fertilisersuse. We understand from some of the earlier studies (e.g., Shresthaand Gopalakrishnan, 1993; Narayanamoorthy, 1996a) that the above-mentioned factors either directly or indirectly influence the diffusionof drip method of irrigation.
Let us understand theoretically how these factors can influencethe development of drip irrigation before going to study the empiricalrelationship of these factors. As drip method of irrigation is mainlyused for water saving or to avoid water scarcity, farmers hesitate toadopt drip irrigation in the area where rainfall is in abundance.Therefore, development of drip irrigation is expected to be low in theregions where good rainfall is received. Availability of groundwater isone of the important factors for the development of drip irrigationsince DMI is most suitable for groundwater based irrigation.Adoption of drip irrigation is expected to be large in the areas wherefarmers face groundwater scarcity or depletion of groundwater, whileDMI adoption is expected to be slow in the area with good ground-water potential. Crop pattern of a particular district/region alsoinfluences the adoption of drip irrigation. The existing drip irrigationtechnology is not suitable for foodgrain crops like paddy, wheat, etc.
42
Hence, the development of drip irrigation will be slow in the regionswhere area under foodgrain crop is large. The rate of adoption ofdrip irrigation is expected to be more in the area where wide spacedcrops like grapes, banana, mango, pomegranate, etc., are beingcultivated extensively using surface method of irrigation. Availabilityof surface water sources like canal and tank can also influence theadoption of drip irrigation to some extent. If farmers come to knowthat the surface irrigation is assured and also available for futureuse, farmers may not be willing to adopt drip method of irrigation asit is considered to be a capital-intensive technology.
In order to understand the factors, which influence the develop-ment of drip irrigation, we have attempted two kinds of analyses.They are (1) simple percentage analysis (comparing share of eachindependent variable with drip irrigated area of different districts anddivisions), and (2) correlation and regression analysis. We are awarevery well that since the adoption of drip irrigation is still in thetake-off stage in the state, the analysis attempted here would notgive any strong results. However, our endeavour here is to under-stand the sign of development through this analysis.
The factors, which are expected to influence the development ofdrip irrigation, are presented in Table 3.8. It is clear from the tablethat there is a negative association between rainfall and dripirrigated area. The level of rainfall in divisions like Konkan, Nagpurand Kolhapur is good and therefore, the development of dripirrigated area is very less in these divisions. This is obvious thatwhen rainfall of a region is good, farmers need not go for capital-intensive methods like drip irrigation as indicated already. Secondimportant result of the analysis is the positive relationship betweengroundwater area and drip-irrigated area. Percentage of groundwaterarea to total irrigated area is much higher in divisions like Nashik,Pune and Latur when compared to state's average. As result ofhigher percentage of groundwater, the share of area under dripirrigation of these divisions is quite high as compared to other divi-sions. Another important reason for using drip irrigation extensivelyin divisions like Pune and Nashik is depletion of groundwater.Owing to drastic depletion of groundwater, many farmers have facedwater problem in divisions like Pune and Nashik especially tocultivate high remunerative crops under surface method of irrigation.This has forced many farmers to adopt drip method of irrigation forcrops like grapes and banana extensively. It is also observed thatarea under drip irrigation is higher where the consumption offertiliser per ha is higher. This implies that the adoption of dripirrigation is higher in the agriculturally developed regions.
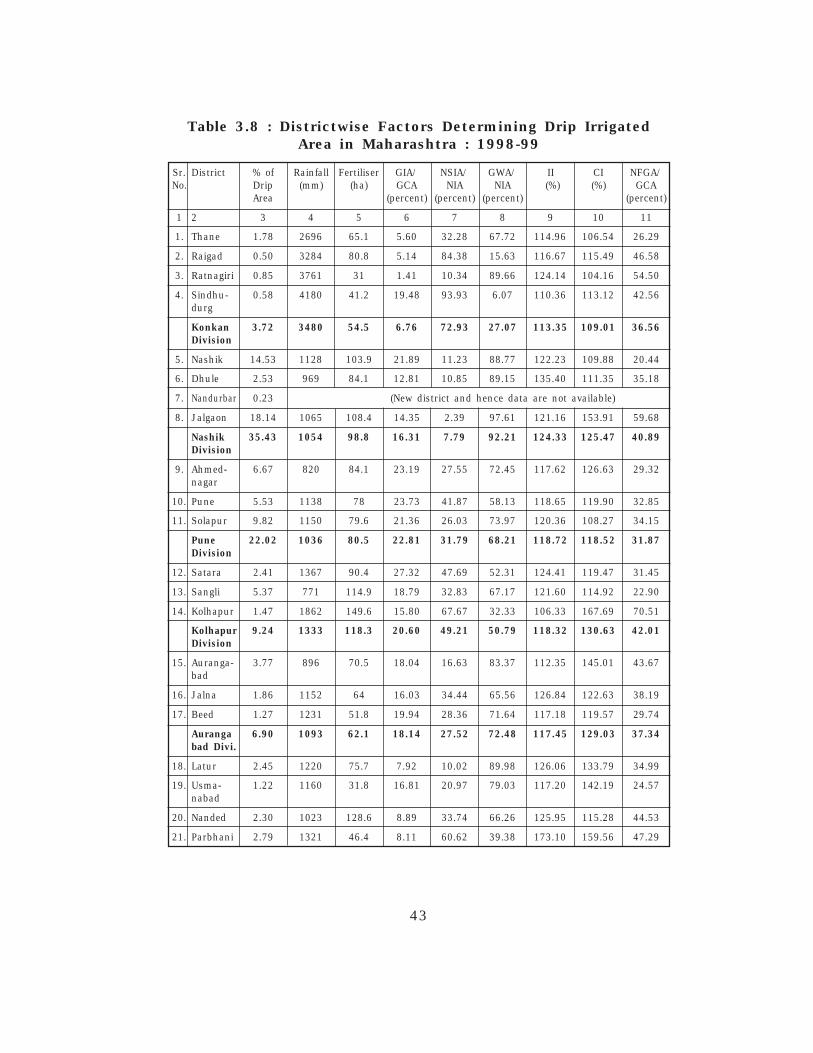
43
Table 3.8 : Districtwise Factors Determining Drip IrrigatedArea in Maharashtra : 1998-99
Sr. District % of Rainfall Fertiliser GIA/ NSIA/ GWA/ II CI NFGA/No. Drip (mm) (ha) GCA NIA NIA (%) (%) GCA
Area (percent) (percent) (percent) (percent)
1 2 3 4 5 6 7 8 9 10 11
1. Thane 1.78 2696 65.1 5.60 32.28 67.72 114.96 106.54 26.29
2. Raigad 0.50 3284 80.8 5.14 84.38 15.63 116.67 115.49 46.58
3. Ratnagiri 0.85 3761 31 1.41 10.34 89.66 124.14 104.16 54.50
4. Sindhu- 0.58 4180 41.2 19.48 93.93 6.07 110.36 113.12 42.56durg
Konkan 3.72 3480 54.5 6.76 72.93 27.07 113.35 109.01 36.56Division
5. Nashik 14.53 1128 103.9 21.89 11.23 88.77 122.23 109.88 20.44
6. Dhule 2.53 969 84.1 12.81 10.85 89.15 135.40 111.35 35.18
7. Nandurbar 0.23 (New district and hence data are not available)
8. Jalgaon 18.14 1065 108.4 14.35 2.39 97.61 121.16 153.91 59.68
Nashik 35.43 1054 98.8 16.31 7.79 92.21 124.33 125.47 40.89Division
9. Ahmed- 6.67 820 84.1 23.19 27.55 72.45 117.62 126.63 29.32nagar
10. Pune 5.53 1138 78 23.73 41.87 58.13 118.65 119.90 32.85
11. Solapur 9.82 1150 79.6 21.36 26.03 73.97 120.36 108.27 34.15
Pune 22.02 1036 80.5 22.81 31.79 68.21 118.72 118.52 31.87Division
12. Satara 2.41 1367 90.4 27.32 47.69 52.31 124.41 119.47 31.45
13. Sangli 5.37 771 114.9 18.79 32.83 67.17 121.60 114.92 22.90
14. Kolhapur 1.47 1862 149.6 15.80 67.67 32.33 106.33 167.69 70.51
Kolhapur 9.24 1333 118.3 20.60 49.21 50.79 118.32 130.63 42.01Division
15. Auranga- 3.77 896 70.5 18.04 16.63 83.37 112.35 145.01 43.67bad
16. Jalna 1.86 1152 64 16.03 34.44 65.56 126.84 122.63 38.19
17. Beed 1.27 1231 51.8 19.94 28.36 71.64 117.18 119.57 29.74
Auranga 6.90 1093 62.1 18.14 27.52 72.48 117.45 129.03 37.34bad Divi.
18. Latur 2.45 1220 75.7 7.92 10.02 89.98 126.06 133.79 34.99
19. Usma- 1.22 1160 31.8 16.81 20.97 79.03 117.20 142.19 24.57nabad
20. Nanded 2.30 1023 128.6 8.89 33.74 66.26 125.95 115.28 44.53
21. Parbhani 2.79 1321 46.4 8.11 60.62 39.38 173.10 159.56 47.29

44
1 2 3 4 5 6 7 8 9 10 11
Latur 8.76 1181 70.6 10.00 31.02 68.98 133.45 138.60 39.61Division
22. Buldhana 2.11 1104 69.8 5.68 3.47 96.53 127.73 121.69 45.43
23. Akola 1.70 1034 65 2.87 16.52 83.48 137.05 130.71 49.70
24. Washim 0.10 (New district and hence data are not available)
25. Amravati 4.57 974 43.9 6.09 4.96 95.04 134.48 136.20 65.22
26. Yavatmal 1.92 844 56.7 4.54 26.64 73.36 153.98 115.33 59.45
Amravati 10.39 951 58.8 4.74 11.09 88.91 137.20 125.83 55.28Division
27. Wardha 1.26 980 77.6 7.73 10.14 89.86 144.44 105.59 61.89
28. Nagpur 1.64 1036 64.4 15.93 44.33 55.67 138.88 108.07 54.93
29. Bhandara 0.42 1347 80.3 50.24 88.27 11.73 115.48 118.01 4.96
30. Chand- 0.18 1242 52.3 19.60 90.58 9.42 111.98 121.43 36.96rapur
31. Gadchiroli 0.04 1413 77.3 26.18 95.25 4.75 109.07 107.89 1.97
Nagpur 3.54 1204 70.3 23.07 78.55 21.45 119.20 112.66 36.96Division
Total 100.00 76.5 15.24 38.57 61.43 121.59 124.94 40.82Mahara-shtra
Notes: GWA/NIA-Percentage of Groundwater Area to Net Irrigated Area; SIA/NIA-Percentage of SurfaceIrrigated Area to Net Irrigated Area;GIA/GCA-Percentage of Gross Irrigated Area to Gross Cropped Area; II-Irrigation Intensity (in percent); CI-Cropping Intensity (in percent); NFGA/GCA - Percentage of Non-Foodgrains Area to GCA; Except irrigation, all other data are related to 1998-99; Irrigated area is relatedto 1994-95.
Source : Computed from Government of Maharashtra (2000).
In order to understand the nature of statistical relationship witharea under drip irrigation across the districts, correlations arecomputed for the above-mentioned variables (see, Table 3.9). As wenoted earlier from simple percentage analysis, the associationbetween area under groundwater and area under drip irrigation ispositive and significant. This means that drip area is more whereverthe percentage of groundwater area to net irrigated area (GWA/NIA)is higher. Similar to groundwater, consumption of fertilisers per hais also positively and significantly associated with area under dripirrigation, implying that the adoption of DMI is higher in theagriculturally advanced districts of Maharashtra. As expected, theassociation is negative (not significant) between rainfall and dripirrigated area. Other than these three variables, the correlation valueis very weak with other variables. Against our expectation the valueof correlation with percentage of non-foodgrains area to grosscropped area (NFCA/GCA) turned out to be very weak.

45
Table 3.9 : Results of Linear Regression: Factors DeterminingArea under Drip Irrigation
Sr. Variable Dependent Variable: Area Correla-No. under Drip Irrigation tion
ValueConstant Slope R
2Adjus-ted R
2
1. Rainfall (mm) 8756.51 -2.23 0.09 0.05 -0.29(3.67)a (-1.58)d
2. Fertiliser Consumption (ha) -1259.12 90.56 0.14 0.11 0.37b
(-0.36) (2.07)b
3. Percentage of GWA to NIA -767.21 99.67 0.19 0.16 0.44a
(-0.28) (2.53)a
4. Percentage of SIA to NIA 9199.71 -99.67 0.19 0.16 -0.44a
(4.97)a (-2.53)a
5. Percentage of GIA to GCA 4539.99 63.06 0.01 -0.03 0.09(1.94)c (0.49)
6. Irrigation Intensity 7368.70 -14.88 0.001 -0.04 -0.03(GIA/NIA) (in %) (0.65) (-0.17)
7. Cropping Intensity -3471.50 72.86 0.03 -0.003 0.18(GCA/NSA) (in %) (-0.37) (0.96)
8. Percentage of Area under 4972.43 13.52 0.001 -0.04 0.03Non-Foodgrain Crops (1.49)d (0.17)(NFGA/GCA)
Notes : a, b, c and d are significant level at 1, 5, 10 and 20 percent respectively.Figures in brackets are 't' values.Source : Computed using data compiled from Government of Maharashtra (2000).
With a view to understand the strength of each variable ininfluencing the area under drip method of irrigation, we have alsocomputed simple linear regressions for the variables that areconsidered to be important in influencing the adoption of dripirrigation. Among the eight linear regression models, the co-efficientsof three variables, namely, rainfall, percentage of groundwater areato net irrigated area (GWA/NIA) and consumption of fertiliser per hapoint to a significant value (see, Table 3.9). The negative co-efficientsof rainfall implies that one unit increase in rainfall would reduceabout 1.35 unit of drip irrigated area. This is not surprising resultbecause when rainfall of a particular district or region is higher,farmers hesitate to adopt drip method of irrigation for cropcultivation. The coefficient of percentage of groundwater area (GWA/NIA) implies that one unit increase in area under groundwater

46
irrigation will increase nearly 100 ha of area under drip irrigation.Similarly, the coefficient of fertilisers consumption implies that anunit increase of fertilisers consumption would increase over 90 unitof drip area in Maharashtra. Altogether, it is clear from thestatistical analysis that the percentage of groundwater area is theimportant variable which influence the growth of drip irrigated areato a greater extent in Maharashtra.
On the whole, it is clear from the above that area under dripirrigation is substantially higher in Maharashtra when compared toany other state in India. As per the data of 2000-01 it ranks thefirst place in India, occupying nearly 53 percent of India's total dripirrigated area. While the area under DMI increased from 1500 ha in1985-86 to about 5 lakh hectares in March 2003 at the all Indialevel, it has consistently increased from about 236 ha in 1986-87 toabout 160.28 thousand hectares ha in 2000-01 in Maharashtra.Districts that come under the divisions of Nashik and Pune continueto dominate in the total area under drip irrigation since thebeginning of the schemes. The main crops that are cultivated underDMI in the State are banana, grapes, sugarcane, citrus group ofcrops and pomegranate. The district-wise analysis seems to indicatethat the severe water scarcity especially in groundwater source alongwith favourable cropping pattern and policy environment (promotionalschemes) could be the some of the main factors responsible for thesignificant growth in drip irrigated area in Maharashtra.
47
Chapter 4
Water and Electricity Saving
4.1 Introduction
Considering the fast decline of potential water resources and theconstraints on energy use, it has become essential to adopt resource-conserving technologies. This would also help in sustaining theprocess of agricultural development in the long run. It has beenproved by some earlier studies that drip method of irrigation helps tosave water and improves water use efficiency (INCID, 1994). Whilereducing water consumption, it also reduces substantial amount ofelectricity required for irrigation purpose, by reducing working hoursof irrigation pumpsets (Narayanamoorthy, 1996a). As mentionedearlier, quite a few studies have analysed the water use patternunder DMI. However, not many studies have attempted to estimatethe saving in electricity due to DMI, either using farm level data orexperimental research data. Our attempt in this chapter is toanalyse the pattern of water use, water conservation and electricitysaving due to drip method of irrigation. Both the experimental andfield level data have been used to analyse the impact of DMI onwater saving and electricity saving. This chapter has been broadlydivided into three sections. While the first section deals with thewater use pattern using experimental data, the second sectionanalyses the impact of DMI on water saving using farm level data inthe context of three crops namely sugarcane, grapes and banana.The third section analyses the impact of DMI on electricity use inthe context of three crops. This is attempted keeping in view thedifficulties in measurement. It is not an easy task to undertake anattempt to estimate resource conservation in field conditions wherethe measurements are not only inadequate but at time erroneous.
4.2 Water Saving - Experimental Data
As mentioned earlier, DMI not only helps to reduce the consump-tion of water (by reducing evaporation and distribution losses) butalso increases the productivity of crops. Considering the importanceof drip method of irrigation in the sustainable use of irrigation water,efforts are being made to propagate the adoption of DMI from 1970onwards in India (INCID, 1994). Special subsidy schemes wereintroduced during the eighties by the central and state governmentsfor promoting this technology since DMI is considered to be a

48
relatively capital-intensive technology. Though studies using field leveldata are rarely available focusing water use efficiency and watersaving of DMI, many research stations situated in different parts ofthe country have evaluated the water saving capacity of DMI fordifferent crops. We have presented the water requirements, saving ofwater and water use efficiency under DMI and FMI for differentcrops in Table 4.1 based on the data from experimental stations.
Table 4.1 : Water Saving through Drip Method of Irrigation -Experimental Results
Crop's Name Water Consumption Water Water Use(mm/ha) Saving Efficiency$
overFMI DMI FMI (%) FMI DMI
Vegetables:
Ash gourd 840 740 12 77.49 61.51Bottle gourd 840 740 12 22.09 13.26
Brinjal 900 420 53 32.14 13.13Beet root 857 177 79 187.53 36.20Sweet potato 631 252 61 148.82 42.78Potato 200 200 Nil 8.49 5.81Lady's finger 535 86 84 53.50 7.60Onion 602 451 25 64.73 36.97
Radish 464 108 77 441.90 90.76Tomato 498 107 79 80.58 12.06Chillies 1097 417 62 259.34 68.47Ridge gourd 420 172 59 24.52 8.60Cabbage 660 267 60 33.71 13.35Cauliflower 389 255 34 46.67 22.00
Fruit Crops:
Papaya 2285 734 68 175.77 31.91Banana 1760 970 45 30.61 11.09Grapes 532 278 48 20.15 8.55Lemon 42 8 81 22.34 3.17Watermelon 800 800 Nil 27.15 9.07
Mosambi 1660 640 61 16.60 4.27Pomegranate 1440 785 45 26.18 7.20Other Crops:
Sugarcane 2150 940 65 16.79 5.53Cotton 856 302 60 329.23 92.64Coconut — — 60 — —
Groundnut 500 300 40 292.40 105.63
Notes : $ - water consumption (mm) per quintal of yield.Sources : INCID (1994) and NCPA (1990).
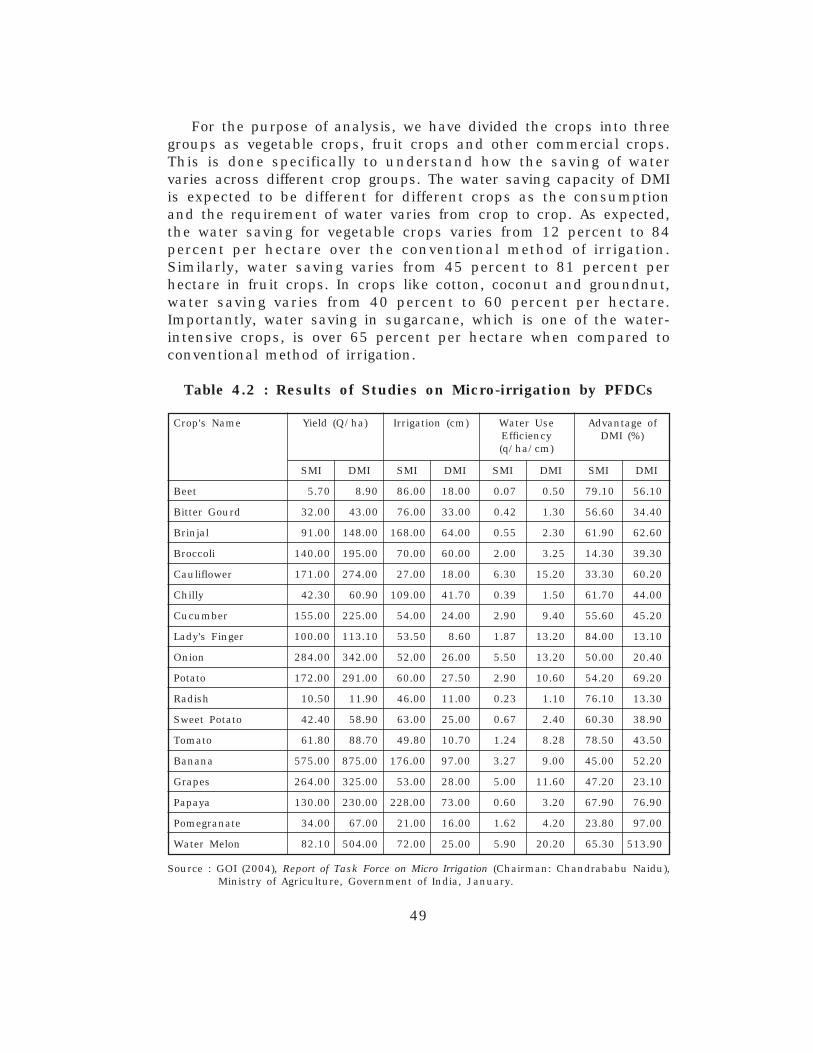
49
For the purpose of analysis, we have divided the crops into threegroups as vegetable crops, fruit crops and other commercial crops.This is done specifically to understand how the saving of watervaries across different crop groups. The water saving capacity of DMIis expected to be different for different crops as the consumptionand the requirement of water varies from crop to crop. As expected,the water saving for vegetable crops varies from 12 percent to 84percent per hectare over the conventional method of irrigation.Similarly, water saving varies from 45 percent to 81 percent perhectare in fruit crops. In crops like cotton, coconut and groundnut,water saving varies from 40 percent to 60 percent per hectare.Importantly, water saving in sugarcane, which is one of the water-intensive crops, is over 65 percent per hectare when compared toconventional method of irrigation.
Table 4.2 : Results of Studies on Micro-irrigation by PFDCs
Crop's Name Yield (Q/ha) Irrigation (cm) Water Use Advantage ofEfficiency DMI (%)(q/ha/cm)
SMI DMI SMI DMI SMI DMI SMI DMI
Beet 5.70 8.90 86.00 18.00 0.07 0.50 79.10 56.10
Bitter Gourd 32.00 43.00 76.00 33.00 0.42 1.30 56.60 34.40
Brinjal 91.00 148.00 168.00 64.00 0.55 2.30 61.90 62.60
Broccoli 140.00 195.00 70.00 60.00 2.00 3.25 14.30 39.30
Cauliflower 171.00 274.00 27.00 18.00 6.30 15.20 33.30 60.20
Chilly 42.30 60.90 109.00 41.70 0.39 1.50 61.70 44.00
Cucumber 155.00 225.00 54.00 24.00 2.90 9.40 55.60 45.20
Lady's Finger 100.00 113.10 53.50 8.60 1.87 13.20 84.00 13.10
Onion 284.00 342.00 52.00 26.00 5.50 13.20 50.00 20.40
Potato 172.00 291.00 60.00 27.50 2.90 10.60 54.20 69.20
Radish 10.50 11.90 46.00 11.00 0.23 1.10 76.10 13.30
Sweet Potato 42.40 58.90 63.00 25.00 0.67 2.40 60.30 38.90
Tomato 61.80 88.70 49.80 10.70 1.24 8.28 78.50 43.50
Banana 575.00 875.00 176.00 97.00 3.27 9.00 45.00 52.20
Grapes 264.00 325.00 53.00 28.00 5.00 11.60 47.20 23.10
Papaya 130.00 230.00 228.00 73.00 0.60 3.20 67.90 76.90
Pomegranate 34.00 67.00 21.00 16.00 1.62 4.20 23.80 97.00
Water Melon 82.10 504.00 72.00 25.00 5.90 20.20 65.30 513.90
Source : GOI (2004), Report of Task Force on Micro Irrigation (Chairman: Chandrababu Naidu),Ministry of Agriculture, Government of India, January.

50
Similar to the results available from INCID (1994) report, variousexperimental studies carried out by the Precision FarmingDevelopment Centre (PDCs) also clearly demonstrate that watersaving due to DMI is substantial over the method of surfaceirrigation in different crops (see, Table 4.2). There are three mainreasons for enormous water saving under drip method of irrigation.First, since water is supplied through a network of pipes, theevaporation and distribution losses of water are very minimum orcompletely absent under DMI. Second, unlike FMI, water is suppliedunder DMI at a required time and required level and thus, over-irrigation is totally avoided. Third, under the conventional method ofirrigation, water is supplied for the whole cropland, whereas DMIirrigates only the plants. Though the results of the experimental datadiscussed above clearly suggest that water saving due to DMI issubstantial, one cannot completely rely on these results because theenvironmental conditions that are prevailing under experimentalstations are totally different from the farmers' field. Therefore, in thefollowing section, we discuss the water saving including its efficiencyunder DMI using farm level data in the context of three cropsnamely sugarcane, banana and grapes.
4.3.0 Pattern of Water Use - Farm Level Data
Pattern of water use refers to number of irrigation used, hoursrequired to irrigate one hectare of land, etc. Water use pattern of thefarmers varies with the source of irrigation. In canal irrigated area, itis determined usually by the irrigation authorities. Similarly, in thetank irrigated area, pattern of water use is determined by theavailability of water and the rainfall condition of the region. Butfarmers themselves determine the water use in groundwater area, asthe farmers predominantly own the source. Government control onwater use is negligible in the groundwater-irrigated condition. Sincegroundwater is essentially a private activity, the pattern of water useis significantly different than the surface source of irrigation.Studies have shown that efficiency of water use is significantlyhigher under groundwater irrigation when compared with canal andtank irrigation (Shah, 1993; Dhawan, 1988).
Since water is supplied through a pipe network in drip method ofirrigation mainly using groundwater, the water supply can becontrolled easily. Therefore, pattern of water use under drip methodirrigation may not be the same with the farmers who use floodmethod of irrigation. Here, we have tried to analyse the pattern ofwater use between the adopters of drip irrigation and the non-
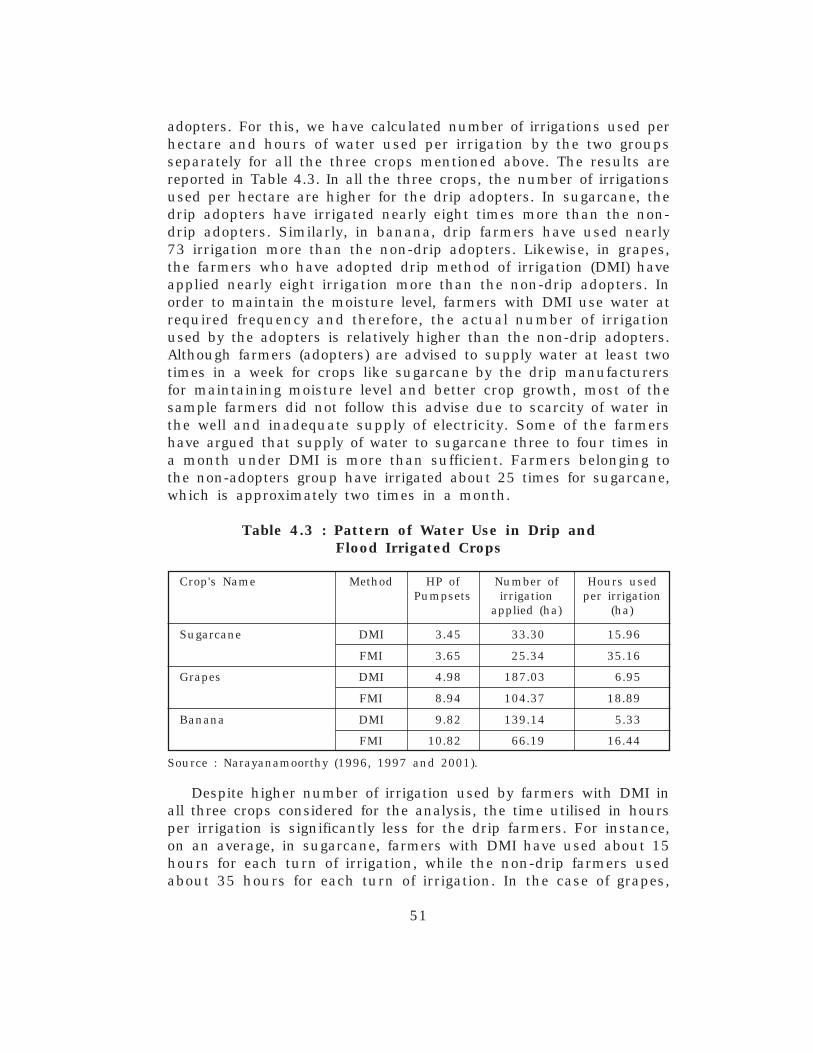
51
adopters. For this, we have calculated number of irrigations used perhectare and hours of water used per irrigation by the two groupsseparately for all the three crops mentioned above. The results arereported in Table 4.3. In all the three crops, the number of irrigationsused per hectare are higher for the drip adopters. In sugarcane, thedrip adopters have irrigated nearly eight times more than the non-drip adopters. Similarly, in banana, drip farmers have used nearly73 irrigation more than the non-drip adopters. Likewise, in grapes,the farmers who have adopted drip method of irrigation (DMI) haveapplied nearly eight irrigation more than the non-drip adopters. Inorder to maintain the moisture level, farmers with DMI use water atrequired frequency and therefore, the actual number of irrigationused by the adopters is relatively higher than the non-drip adopters.Although farmers (adopters) are advised to supply water at least twotimes in a week for crops like sugarcane by the drip manufacturersfor maintaining moisture level and better crop growth, most of thesample farmers did not follow this advise due to scarcity of water inthe well and inadequate supply of electricity. Some of the farmershave argued that supply of water to sugarcane three to four times ina month under DMI is more than sufficient. Farmers belonging tothe non-adopters group have irrigated about 25 times for sugarcane,which is approximately two times in a month.
Table 4.3 : Pattern of Water Use in Drip andFlood Irrigated Crops
Crop's Name Method HP of Number of Hours usedPumpsets irrigation per irrigation
applied (ha) (ha)
Sugarcane DMI 3.45 33.30 15.96
FMI 3.65 25.34 35.16
Grapes DMI 4.98 187.03 6.95
FMI 8.94 104.37 18.89
Banana DMI 9.82 139.14 5.33
FMI 10.82 66.19 16.44
Source : Narayanamoorthy (1996, 1997 and 2001).
Despite higher number of irrigation used by farmers with DMI inall three crops considered for the analysis, the time utilised in hoursper irrigation is significantly less for the drip farmers. For instance,on an average, in sugarcane, farmers with DMI have used about 15hours for each turn of irrigation, while the non-drip farmers usedabout 35 hours for each turn of irrigation. In the case of grapes,

52
farmers with DMI have used almost 12 less hours for each turn ofirrigation as compared to the non-drip counterpart. This is true inbanana crop as well. Since drip method of irrigation supplies wateronly at the root zone of the crop, time required per irrigation ismuch less. But in the case of surface method, farmers have tospend more time for each turn of irrigation, because it supplieswater not only for the crop zone but also the non-cropped zone.Importantly, uneven land surface and water conveying channels alsoconsume considerable quantity of water in surface method ofirrigation. Evaporation losses are also very high in open waterconveying channels that increases the requirement of time used inusing water. But these problems are meagre or completely absentunder drip method of irrigation as it supplies water through pipenetwork. Interestingly, in spite of higher amount of water supply foreach turn of irrigation under flood method of irrigation, farmerscould not avoid moisture stress faced by the crops. Owing tochanges in the pattern of water use between the two methods ofirrigation, the quantity of water consumed by crops under the twomethods of irrigation is expected to be varied substantially.
4.3.1 Quantity of Water Consumption
Water consumption per hectare for any crop is determined byfactors like horse power of the pumpset, water level of the well,capacity of the pump, size of delivery pipes, condition of the waterextraction machineries (WEMs), distance between place of watersource and field to be irrigated, quality of soil, terrain condition, etc.These factors vary considerably across farmers. Pumpsets withhigher horse power lift more water per unit of land compared to thepumpset which has lower horse power. Most of the studies based onresearch station data have measured water consumption in terms ofcentimeter (CM) in drip irrigation. But, in practice, measuring waterin terms of CM is not an easy task at field level as HP of thepumpsets and water level of the well changes considerably acrossthe farmers. Because of these difficulties, we have measured waterconsumption in terms of horse power (HP) hours of irrigation. HPhours of water is computed by multiplying HP of the pump-set withhours of water used.
Table 4.4 presents per hectare consumption of water in terms ofHP hours for drip and non-drip adopters for all three crops. It isclear from the table that the consumption of water by crops underdrip method of irrigation is significantly less than flood methodirrigation (FMI). While water saving in sugarcane comes to about 44
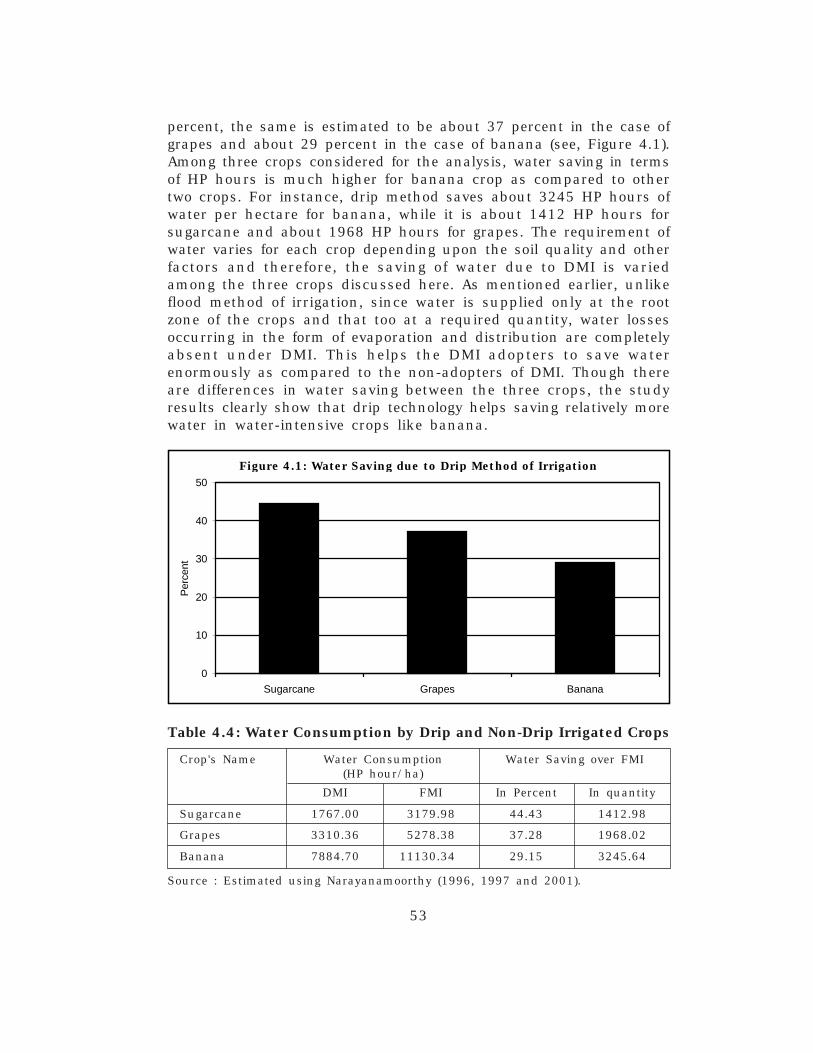
53
percent, the same is estimated to be about 37 percent in the case ofgrapes and about 29 percent in the case of banana (see, Figure 4.1).Among three crops considered for the analysis, water saving in termsof HP hours is much higher for banana crop as compared to othertwo crops. For instance, drip method saves about 3245 HP hours ofwater per hectare for banana, while it is about 1412 HP hours forsugarcane and about 1968 HP hours for grapes. The requirement ofwater varies for each crop depending upon the soil quality and otherfactors and therefore, the saving of water due to DMI is variedamong the three crops discussed here. As mentioned earlier, unlikeflood method of irrigation, since water is supplied only at the rootzone of the crops and that too at a required quantity, water lossesoccurring in the form of evaporation and distribution are completelyabsent under DMI. This helps the DMI adopters to save waterenormously as compared to the non-adopters of DMI. Though thereare differences in water saving between the three crops, the studyresults clearly show that drip technology helps saving relatively morewater in water-intensive crops like banana.
Table 4.4: Water Consumption by Drip and Non-Drip Irrigated Crops
Crop's Name Water Consumption Water Saving over FMI(HP hour/ha)
DMI FMI In Percent In quantity
Sugarcane 1767.00 3179.98 44.43 1412.98
Grapes 3310.36 5278.38 37.28 1968.02
Banana 7884.70 11130.34 29.15 3245.64
Source : Estimated using Narayanamoorthy (1996, 1997 and 2001).
Figure 4.1: Water Saving due to Drip Method of Irrigation
0
10
20
30
40
50
Sugarcane Grapes Banana
Per
cent

54
It is also possible to increase the area under irrigation from thesaving of water achieved due to the adoption of drip method ofirrigation. In order to understand this, we have estimated how muchof additional area can be brought under irrigation by saving water inall three crops. Our estimates show that with the saving of water(from one hectare), an additional area of about 0.80 ha can bebrought under irrigation by adopting drip method of irrigation insugarcane. Similarly, our estimate shows that an additional area of0.60 ha (1.48 acres) under grapes and 0.41 ha (1.01 acres) underbanana can be irrigated by adopting DMI. This reinforces the factthat DMI also significantly helps to bring additional area underirrigation through saving of water, besides providing various otherbenefits to the farmers.
4.3.2 Water Use Efficiency
While the consumption of water per unit of area is a goodindicator to measure the efficiency of water use in drip and non-dripcrops, water consumed to produce one unit of crop output is themost appropriate method to judge the efficiency of water consumptionin DMI and FMI. This is also the simplest way to understand theimportance of drip irrigation in increasing the efficiency of water use.As mentioned earlier, studies have proved that water use efficiency ishigher in drip-irrigated crops, but most of them are based onresearch station data. In order to study the water use efficiencyunder the two method of irrigation, we have calculated waterconsumption required producing one unit of output under drip andnon-drip irrigated condition. In order to arrive at per quintal waterrequirement, water consumption per hectare has been divided by theper hectare yield of crops.
Table 4.5: Water Use Efficiency in Drip andNon-Drip Irrigated Crops
Particulars Method Sugarcane Grapes Banana
Water consumption DMI 1767.00 3310.38 7884.70(HP hours/ha) FMI 3179.98 5278.38 11130.34Yield (quintal/ha) DMI 1383.60 243.25 679.54
FMI 1124.40 204.29 526.35Water Use Efficiency DMI 1.28 13.61 11.60
(HP hours/quintal) FMI 2.83 25.84 21.41
Source : Calculated from Narayanamoorthy (1996, 1997 and 2001).
55
Water utilised to produce one quintal of crop output for all thethree crops is given in Table 4.5. As reported by experimental databased studies, the results of field data also show that water useefficiency (WUE) is substantially higher for drip-irrigated crops ascompared to the same cultivated under flood method of irrigation.The analysis shows that sugarcane cultivated under drip method ofirrigation consumes only 1.28 HP hours of water to produce onequintal of output when compared to 2.83 HP hours of water forproducing the same quantity of output under non-drip irrigatedcondition, i.e., to produce one quintal of sugarcane under non-dripirrigated condition about 1.55 HP hours of additional water isconsumed. Similar to sugarcane crop, water required to produce onequintal of output in banana and grapes is also found to be substan-tially lower under DMI as compared to their counterpart. Under DMI,banana consumes only 11.60 HP hours of water to produce onequintal of banana output as against the use of 21.14 HP hours ofwater for the same quantity of yield under non-drip irrigatedcondition. In the case of grapes, each quintal of output involves theuse of just 13.60 HP hours of water under DMI as compared to theuse of 25.84 HP hours under non-drip irrigated condition. The factcomes out clearly from the analysis is that DMI not only reduces theper hectare consumption of water but also reduces the waterrequired to produce one unit of crop output substantially whencompared to flood method of irrigation.
Besides water saving, drip method of irrigation also helps to savesubstantial amount of electricity used for lifting water from wells.Water saving and electricity saving are highly interrelated under DMIand therefore, an analysis on electricity use under drip method ispresented in the following section.
4.4 Electricity Saving under Drip Method of Irrigation
It is a well-known fact that due to rapid energisation of pump-sets and widespread cultivation water intensive crops, consumptionof electricity by agricultural sector has increased many fold sinceindependence.16 In India, on an average, pumpset that is used to liftwater from wells consumes about 70 percent of electricity inagriculture (Sharma, 1994). Though the increased consumption ofelectricity indicates better growth of agriculture, many researchersargue that electricity is not used efficiently in agriculture due to
16. For more details regarding the trends and determinants of electricity consump-tion in Indian agriculture see, Narayanamoorthy (1999b).

56
various reasons. One among the options available for increasing theefficiency of electricity use in agriculture is drip method of irrigation.Preliminary level studies related to drip method of irrigation haveshown that this micro-irrigation technology is not only useful forreducing the consumption of water but also useful in energy saving.It is obvious that along with the number of working hours ofpumpset the consumption of electricity also reduces in drip methodof irrigation.
It is observed in the foregoing section that HP hours of waterused per hectare of crop under DMI are significantly less than FMI.Therefore, it follows simply that the consumption of electricity alsoreduces significantly under DMI. In order to know the impact of dripmethod of irrigation on electricity saving, we have estimatedelectricity consumption based on the hours of pumpset operation forboth the drip adopters and the non-drip adopters groups. Further,for estimating the quantum of electricity saved, we have assumedthat for every hour of operation of pump-set, 0.750 kwh of power isused per HP.17 Since all the farmers in both the groups have usedonly electrical pumpsets, we have simply multiplied HP hours ofwater with assumed power consumption of 0.75/kwh/HP to arrive atthe per hectare electricity consumption. The estimated consumptionof electricity (in kwh) presented in Table 4.6 clearly depicts thatfarmers using DMI utilised very less amount of electricity ascompared to FMI farmers in all three crops. Farmers who cultivatedsugarcane under DMI could save about 1059 kwh of electricity perhectare as compared to those farmers cultivated sugarcane underFMI. Similarly, while the farmers cultivating grapes could saveelectricity about 1476 khw/ha due to DMI, the saving of electricity isestimated to be about 2434 kwh/ha in banana over the farmers whocultivated the same crop under FMI with similar environment.The substantial amount of electricity saving due to DMI is not asurprising results, because any reduction in consumption ofwater would ultimately lead to reduction in consumption ofelectricity.
17. For more details in this regard, see Shah (1993), Groundwater Markets and Irri-gation Development: Political Economy and Practical Policy, Oxford UniversityPress, Delhi, pp. 92-112.

57
Table 4. 6 : Estimates of Electricity Consumption byDrip and Non-Drip Irrigated Crops
District Electricity Consumption Electricity Saving over FMI(Kwh/ha)
DMI FMI In Percent In quantity In money value (Rs)*(Kwh)
Sugarcane 1325.25 2384.99 44.43 1059.74 3454.75
Grapes 2482.77 3958.78 59.45 1476.01 4811.80Banana 5913.53 8347.75 41.16 2434.00 7934.80
Notes : * - Rs. 3.26/Kwh, which is the current (2003-04) average cost of electricitysupply in Maharashtra State, is assumed to estimate electricity savingin terms of money value.
Source : Estimated using Narayanamoorthy (1996, 1997 and 2001).
Farmers with drip irrigation operate less number of hours ofpumpsets and therefore, consumption of electricity is quite low.Since the saving of electricity through drip method of irrigation isvery high, it would help to reduce the total electricity bill to be paidby the farmers. In order to find out this, we have calculated themoney saved in the total electricity bill per hectare through energysaving. Since Maharashtra State Electricity Board supplies electricityon flat-rate (FR) basis for agriculture, it was not possible to get perkwh price of electricity. Therefore, we have assumed Rs. 3.26/kwh,which is the current average cost of electricity supply in Maharashtra,as a nominal rate to estimate the saving of electricity in monetaryterms. In accordance with this, on an average, about Rs.3454/hacan be saved on electricity bill alone by cultivating sugarcane underdrip method of irrigation. Similarly, farmers cultivating grapes andbanana under DMI can save about Rs. 4811and Rs. 7934 per hectarerespectively. This amply proves that the drip irrigation technologyhelps to reduce the cost of cultivation enormously by reducing thecost of electricity besides helping to save the precious inputs likeelectricity and water.
Table 4.7 : Estimates of Electricity Use Efficiency in Dripand Non-Drip Irrigated Crops
District Yield Electricity Use Electricity Use Effi-(quintal/ha) (Kwh/ha) ciency (Kwh/quintal)
DMI FMI DMI FMI DMI FMI
Sugarcane 1383.60 1124.40 13252.50 23849.90 0.96 2.12
Grapes 243.25 204.29 2482.77 3958.78 10.21 19.37
Banana 679.54 526.35 5913.53 8347.75 8.70 15.86Source: Estimated using Narayanamoorthy (1996, 1997 and 2001).

58
In order to explain electricity saving in a simplest way in dripmethod of irrigation, electricity consumed to produce one quintal ofcrop output is also worked out under both DMI and FMI conditions.As in water consumption, the energy used to produce one quintal ofcrop output is computed by dividing per hectare energy (electricity)consumption by yield of each crop per hectare. The estimate ofelectricity required to produce one unit of output under DMI andFMI conditions is presented in Table 4.7. As expected, electricityconsumed to produce one quintal of sugarcane is quite low for dripadopters in Maharashtra. For instance, on an average, sugarcanecultivators under DMI used about 0.968 kwh to produce one quintalof sugarcane, whereas the same is estimated to be about 2.121 kwhfor those who cultivated sugarcane under FMI. This means that forevery quintal of sugarcane production about 1.163 kwh of electricitycan be saved through drip method of irrigation. Electrical energyconsumed to produce one quintal of crop output is also found to below for drip adopters in banana and grapes as well. While grapescultivators under DMI used about 10.21 kwh to produce one quintalof grapes, the non-drip adopters have used about 19.37 kwh.Similar trend is observed in the case of banana crop as well.Obviously, higher productivity and relatively low amount of waterconsumption have reduced per quintal requirement of electricitysignificantly in drip irrigated crops.
On the whole, it is clear from both the experimental and fieldlevel data that water saving due to drip method of irrigation issubstantial in different crops. Because of substantial amount watersaving, electrical energy required for irrigation purpose is also foundto be very less in drip-irrigated crops as compared to the cropscultivated using surface/conventional method of irrigation. The othertwo important advantages of drip method of irrigation are gains incost of cultivation and productivity of crops. We present an analysisabout the impact of DMI on these two parameters in the followingchapter.

59
Chapter 5
Cost of Cultivation and Productivity Gains
5.1 Introduction
Apart from reducing water consumption and electricity consum-ption, drip method of irrigation also helps to reduce the cost ofcultivation and improve productivity of crops as compared to thesame crops cultivated under flood method of irrigation. Therefore, inthis chapter, we discuss about the impact of DMI on cost of cultiva-tion and productivity of crops using both the experimental and fieldlevel data. First, we discuss about the productivity enhancement indifferent crops due to DMI using experimental data and then westudy the impact of DMI on cost of cultivation and productivity ofcrops using field level data pertaining to three crops namelysugarcane, grapes and banana.
5.2 Productivity of Crops - Experimental Data
As mentioned earlier, quite a few studies have attempted to studythe impact of drip method of irrigation on productivity of crops,mainly using experimental data. INCID (1994) report presents theresults of various crops carried out at different locations in thecountry, which are presented in Table 5.1. The results of theexperimental station data show that the productivity of differentcrops is significantly higher under DMI when compared to FMI. Forinstance, productivity increase due to drip method of irrigation isnoticed over 40 percent in vegetable crops such as bottle gourd,potato, onion, tomato and chillies. Similarly, productivity increase dueto DMI is noticed over 70 percent in many fruit crops. Productivitydifference is also found to be over 33 percent in sugarcane cultivatedunder DMI over the same crop cultivated under FMI. Specificexperiments carried out at Punjabrao Krishi Vidyapeeth, Akola,(Maharashtra State) on vegetable crops such as cauliflower, tomatoand brinjal also suggest that productivity enhancement due to DMIis substantial (see, Table 5.2). Similar kinds of results have alsobeen noted at different experimental stations located in differentstates.18
18. The results of experiments carried out in different locations and in variouscrops are available in INCID (1994).
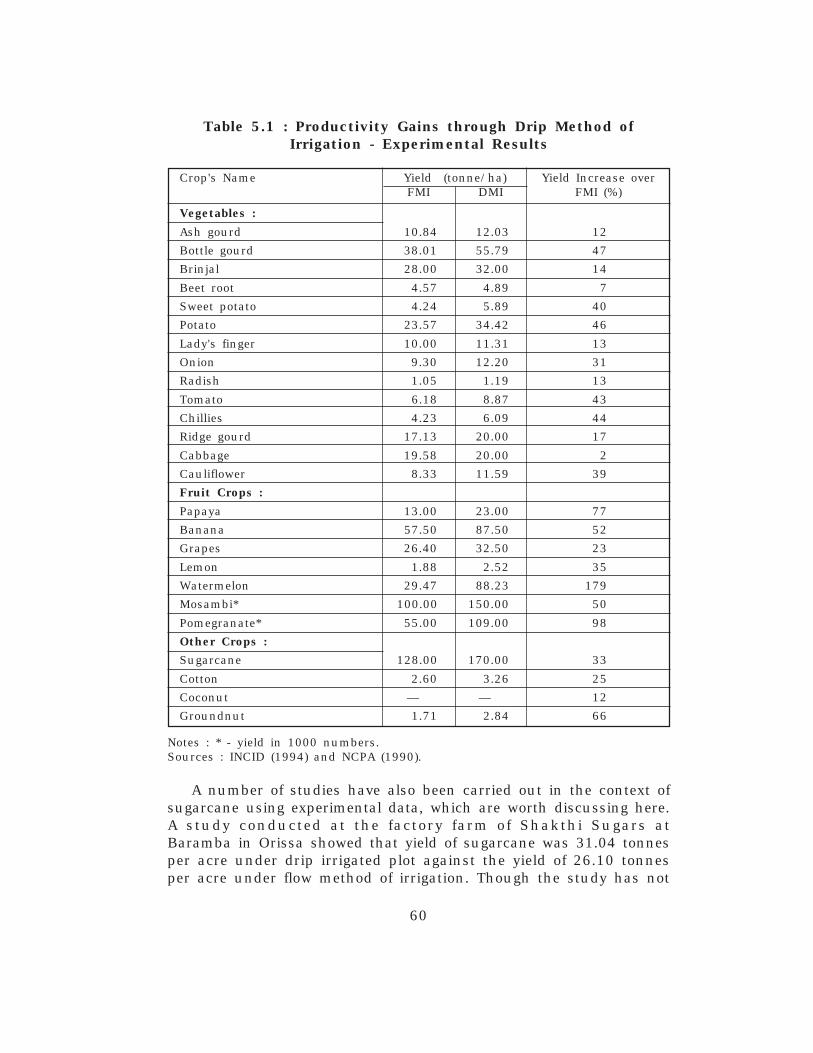
60
Table 5.1 : Productivity Gains through Drip Method ofIrrigation - Experimental Results
Crop's Name Yield (tonne/ha) Yield Increase overFMI DMI FMI (%)
Vegetables :
Ash gourd 10.84 12.03 12
Bottle gourd 38.01 55.79 47
Brinjal 28.00 32.00 14
Beet root 4.57 4.89 7
Sweet potato 4.24 5.89 40
Potato 23.57 34.42 46
Lady's finger 10.00 11.31 13
Onion 9.30 12.20 31
Radish 1.05 1.19 13
Tomato 6.18 8.87 43
Chillies 4.23 6.09 44
Ridge gourd 17.13 20.00 17
Cabbage 19.58 20.00 2
Cauliflower 8.33 11.59 39
Fruit Crops :
Papaya 13.00 23.00 77
Banana 57.50 87.50 52
Grapes 26.40 32.50 23
Lemon 1.88 2.52 35
Watermelon 29.47 88.23 179
Mosambi* 100.00 150.00 50
Pomegranate* 55.00 109.00 98
Other Crops :
Sugarcane 128.00 170.00 33
Cotton 2.60 3.26 25
Coconut — — 12
Groundnut 1.71 2.84 66
Notes : * - yield in 1000 numbers.Sources : INCID (1994) and NCPA (1990).
A number of studies have also been carried out in the context ofsugarcane using experimental data, which are worth discussing here.A study conducted at the factory farm of Shakthi Sugars atBaramba in Orissa showed that yield of sugarcane was 31.04 tonnesper acre under drip irrigated plot against the yield of 26.10 tonnesper acre under flow method of irrigation. Though the study has not

61
given any details about water use efficiency under drip irrigation,single cane weight, cane girth, cane length, number of internodes,leaf length and leaf breadth were found to be higher with sugarcanecultivated under drip method of irrigation when compared to floodmethod of irrigation (Venugopal and Rajkumar, 1998).
Table 5.2 : Yield and Water Use Efficiency under Dripand Flood Method of Irrigation
Crop Water applied Yield Water Yield Water use(cm) (quintal/ha) saving Incre- efficiency
(%) ase (%) (q/ha/cm)
FMI DMI FMI DMI
Cauliflower 38.88 25.50 83.33 115.93 34.41 39.12 2.14 4.55
Tomato 101.50 69.58 45.04 58.33 31.44 29.50 0.44 0.84
Brinjal 168.00 63.90 91.00 148.20 61.99 62.86 0.54 2.32
Source : INCID (1994).
Another study carried out by Sakthi Sugar at Athagarh, Cuttackdistrict, Orissa state found that yield of 40 tonnes per acre underDMI as against 28 tonnes per acre under FMI in sugarcane. TheBenefit-Cost Ratio (BCR) of sugarcane cultivated under DMI wasestimated to be 1.53 (Dash, 1998). In order to find out the responseof different varieties of sugarcane under drip method of irrigation, anexperimental study was conducted at the Central SugarcaneResearch Station, Padegaon in Maharashtra. This study found thatyield of sugarcane cultivated under DMI (111.99 tonnes/ha) washigher by 21 percent when compared to the same variety cultivatedunder FMI (92.43/tonnes/ha). While water use efficiency (yield in kgachieved per ha cm water) was estimated to be 999.91 for DMI, thesame was estimated to be only around 391 for FMI. Besides yieldincrease and water saving, recovery rate of sugarcane cultivatedunder DMI was also found to be higher when compared to the cropscultivated under FMI (Sankpal et al., 1998).
An experiment carried out on farmers field at Wadegaon inKukadi and Bhuinj in Krishna Commands in Maharashtra to testthe impact of drip irrigation on sugarcane during 1996-97 showedan increase of yield by 28.09 to 37.02 percent under DMI over theconventional method of irrigation under different trials of testing. Asmentioned by other studies due to the adoption of DMI, the recoveryrate of sugarcane also considerably increased over the method offlood irrigation (Dhonde and Banger, 1998).

62
In order to evaluate the impact of different drip irrigationtechniques on sugarcane cultivation, Vasantdada Sugar Institute (VSI)has initiated research studies along with four co-operative sugarfactories located in different agro-climatic zones in Maharashtra. Itcame out from the research that the increase of yield was in therange of 9.23 to 23.89 percent under sub-surfaced drip systems and8.89 to 25.35 percent under surfaced drip systems when comparedto the method of conventional irrigation. The study further indicatesthat the automatic drip irrigation is found to be effective in increasingyield and water saving as compared to manually controlled dripirrigation and conventional method of irrigation (Deshmukh, et al.,1998).
Using the data collected from four field trials in different agro-climatic condition in Maharashtra, a study was conducted to findout the impact of drip irrigation on sugarcane cultivation (Hapase,et.al., 1992). The main conclusions of the study were, (a) watersaving under DMI varied from 32 percent to 49 percent underdifferent trials over the method of FMI; (b) yield increase varied from22 percent to 30 percent under DMI over the method of floodirrigation, and (c) the benefit-cost ratio (BCR) of drip investmentvaried from 2.79 to 2.81 under different discount rates.
An observational trial conducted to find out the impact of dripirrigation (Typhoon) in sugarcane (variety COC 771) at EID ParryFarm, Nellikuppam, Tamil Nadu, indicates that the germination ofthe crop in Typhoon system was better by 11.5 percent over FMI.Besides water saving of about 17.7 percent, the weed population wasalso found to be very less under DMI when compared to FMI.However, the study has not mentioned anything about the yieldgains due to drip method of irrigation (Daniel, 1992).
Under the All India Coordinated Research Project on WaterManagement, an important study was conducted at three differentcentres, namely, Rahuri, Navsari and Bhavanisagar to find out theimpact of DMI on sugarcane cultivation. It was found that applicationof drip irrigation to sugarcane results in over 20 percent increase inyield besides a saving of 30 percent of irrigation water over themethod of flood irrigation. It was also found that the adoption ofDMI for sugarcane helped to gain an additional income of up toRs. 75245/ha over the flood method of irrigation. The benefit-costratio was also found to be significantly higher for the cropscultivated under DMI as compared to FMI (Batta and Singh, 1998).
63
In order to evaluate the economic feasibility of drip system forsugarcane, feasibility studies on drip method of irrigation wereconducted on heavy soils and sub-humid climatic conditions ofSouth Gujarat region for three years during 1989-90 to 1991-92 atSoil-Water Management Farm, Gujarat Agricultural University,Navsari. The study showed that the yield of sugarcane under dripsystem for all the irrigation regions was significantly higher thanunder furrow method of irrigation. Due to the adoption of DMI,productivity of sugarcane increased by about 30 to 48 percent overthe method of FMI under different drip treatment. The study alsosuggested an important point that a large scale adoption of dripmethod of irrigation in sugarcane in South Gujarat area can help tosolve the problem of water logging and secondary salinization whichare increasing in this regions (Parikh, et al., 1993).
It is clear from the above that the adoption of drip method ofirrigation in crop cultivation not only increases water saving andproductivity of crops but also reduces the cost of cultivation andweed problems. Importantly, DMI also helps to increase thegermination of seed (cane) and the recovery rate of sugarcane.Though drip method of irrigation is proved to be an effectivetechnology for increasing crop productivity, the results of researchstation based studies may not completely reflect the farm levelproblems associated with drip method of irrigation. Therefore, in thefollowing section, an attempt is made to analyse the impact of dripmethod of irrigation on cost of cultivation and productivity of cropsusing field level data pertaining to three crops.
5.3 Cost of Cultivation - Farm Level Data
Though the studies reported above suggest that DMI increasesthe productivity of crops, none of these studies seem to havecompared the productivity of crops with the cost of cultivation. Thisis one of the major limitations of the existing studies based onexperimental data. There is a possibility that productivity of cropsunder DMI may be higher due to higher use of yield increasinginputs. Therefore, in order to find out the real impact of DMI onproductivity of crops, one needs to compare the cost of cultivation ofcrops with the productivity of crops. Keeping this in view, we analysethe cost of cultivation and productivity of crops under DMI and FMIin the context of sugarcane, grapes and banana.
Studies carried out using experimental data in different cropsindicate that the DMI reduces the cost of cultivation, especially in

64
labour intensive operations like weeding, irrigation, ploughing, etc(see, INCID, 1994; Dhawan, 2002). When labour cost reduces, thetotal cost of cultivation also reduces because labour cost constitutesa considerable portion in the total cost of cultivation. Table 5.3shows the operation-wise cost of cultivation per hectare for threecrops for both the adopters and the non-adopters. Let us first studythe cost of cultivation in sugarcane crop. It is clear from the tablethat drip irrigation reduces the total cost of cultivation by aboutRs.6550/ha (nearly 13 percent) for the adopters as compared withthe non-adopters in sugarcane crop. Though the total cost saving interms of percentage is not very high in aggregate, it varies acrossdifferent operations. Among the different operations, cost saving isvery high in irrigation, furrows and bunding followed by seed andseed sowing. Saving under cost of cultivation is also found infertilisers (about 8 percent). This is because of the reason that someof the adopters have used liquid fertilisers and thus, the costincurred on fertilisers is relatively less. A few earlier studies havereported that drip method of irrigation also reduces the cost offertilisers enormously as it can be supplied along with water - liquidfertilisers. Some of the farmers have argued that even without usingliquid form of fertilisers, the same can be reduced by avoidingwastage under drip method of irrigation. Since water is suppliedthrough pipe network under drip method of irrigation, it does notrequire more labour.19 But, in the case of surface method ofirrigation, labour input is necessary to control water supply(changing course of water from one field to other) and to governleakage and seepage. In addition to saving in cost of labour, costincurred on account of electricity (for operating pump-set) is alsoless as drip requires less amount of water when compared to floodmethod of irrigation. Saving under cost of cultivation is noticed inploughing and preparatory operation by about 17 per cent. This isbecause of the fact that drip method of irrigation does not warrantmuch ploughing as it supplies water at the root zone of the crops.As indicated by earlier studies, the cost saving is also very high inweeding operation, which comes to about 12 percent over the costincurred by the farmers who cultivated sugarcane under FMI. Costsaving in weeding operation is high because it does not allow weedto come up in the non-crop space by not supplying water beyondthe root zone of the crop. It should, however, be noted that the costof cultivation varies with situational factors like soil quality,condition of the terrain, farmers' approach, etc.
19. INCID (1994) report mentions that one labour can easily attend to drip methodof irrigation up to 10 hectares, which is impossible under conventional methodof irrigation.
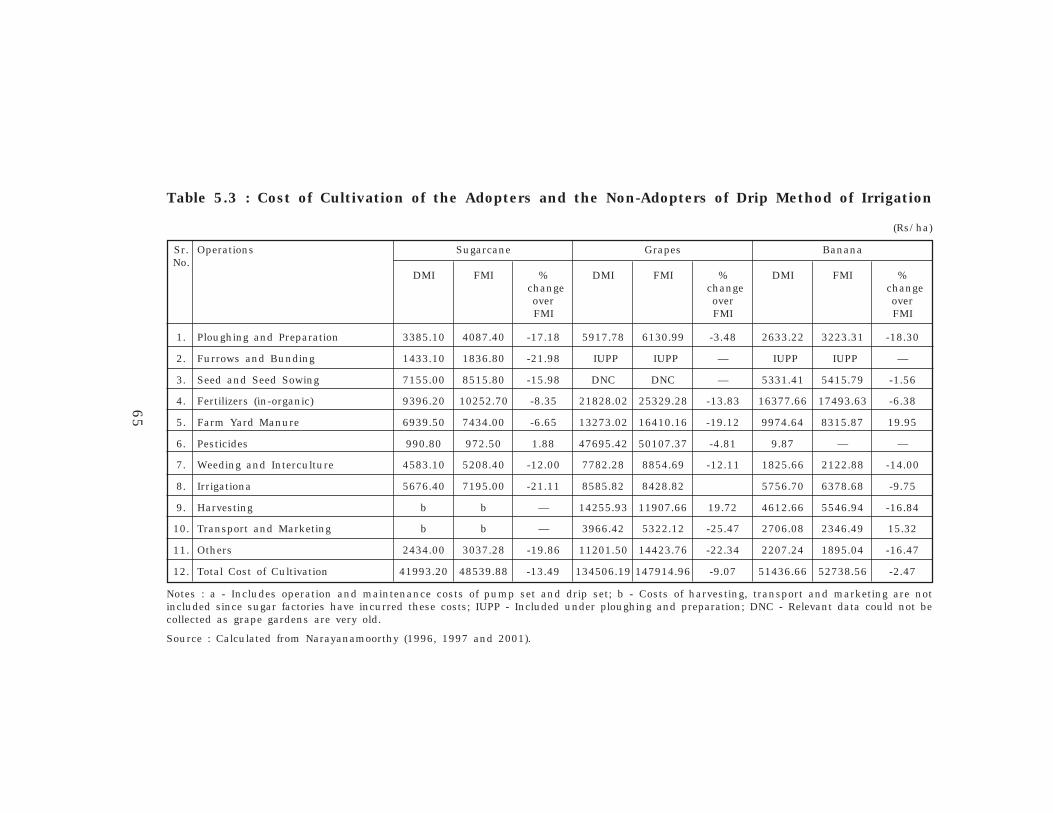
65
Table 5.3 : Cost of Cultivation of the Adopters and the Non-Adopters of Drip Method of Irrigation
(Rs/ha)
Sr. Operations Sugarcane Grapes BananaNo.
DMI FMI % DMI FMI % DMI FMI % change change change
over over overFMI FMI FMI
1. Ploughing and Preparation 3385.10 4087.40 -17.18 5917.78 6130.99 -3.48 2633.22 3223.31 -18.30
2. Furrows and Bunding 1433.10 1836.80 -21.98 IUPP IUPP — IUPP IUPP —
3. Seed and Seed Sowing 7155.00 8515.80 -15.98 DNC DNC — 5331.41 5415.79 -1.56
4. Fertilizers (in-organic) 9396.20 10252.70 -8.35 21828.02 25329.28 -13.83 16377.66 17493.63 -6.38
5. Farm Yard Manure 6939.50 7434.00 -6.65 13273.02 16410.16 -19.12 9974.64 8315.87 19.95
6. Pesticides 990.80 972.50 1.88 47695.42 50107.37 -4.81 9.87 — —
7. Weeding and Interculture 4583.10 5208.40 -12.00 7782.28 8854.69 -12.11 1825.66 2122.88 -14.00
8. Irrigationa 5676.40 7195.00 -21.11 8585.82 8428.82 5756.70 6378.68 -9.75
9. Harvesting b b — 14255.93 11907.66 19.72 4612.66 5546.94 -16.84
10. Transport and Marketing b b — 3966.42 5322.12 -25.47 2706.08 2346.49 15.32
11. Others 2434.00 3037.28 -19.86 11201.50 14423.76 -22.34 2207.24 1895.04 -16.47
12. Total Cost of Cultivation 41993.20 48539.88 -13.49 134506.19 147914.96 -9.07 51436.66 52738.56 -2.47
Notes : a - Includes operation and maintenance costs of pump set and drip set; b - Costs of harvesting, transport and marketing are notincluded since sugar factories have incurred these costs; IUPP - Included under ploughing and preparation; DNC - Relevant data could not becollected as grape gardens are very old.
Source : Calculated from Narayanamoorthy (1996, 1997 and 2001).
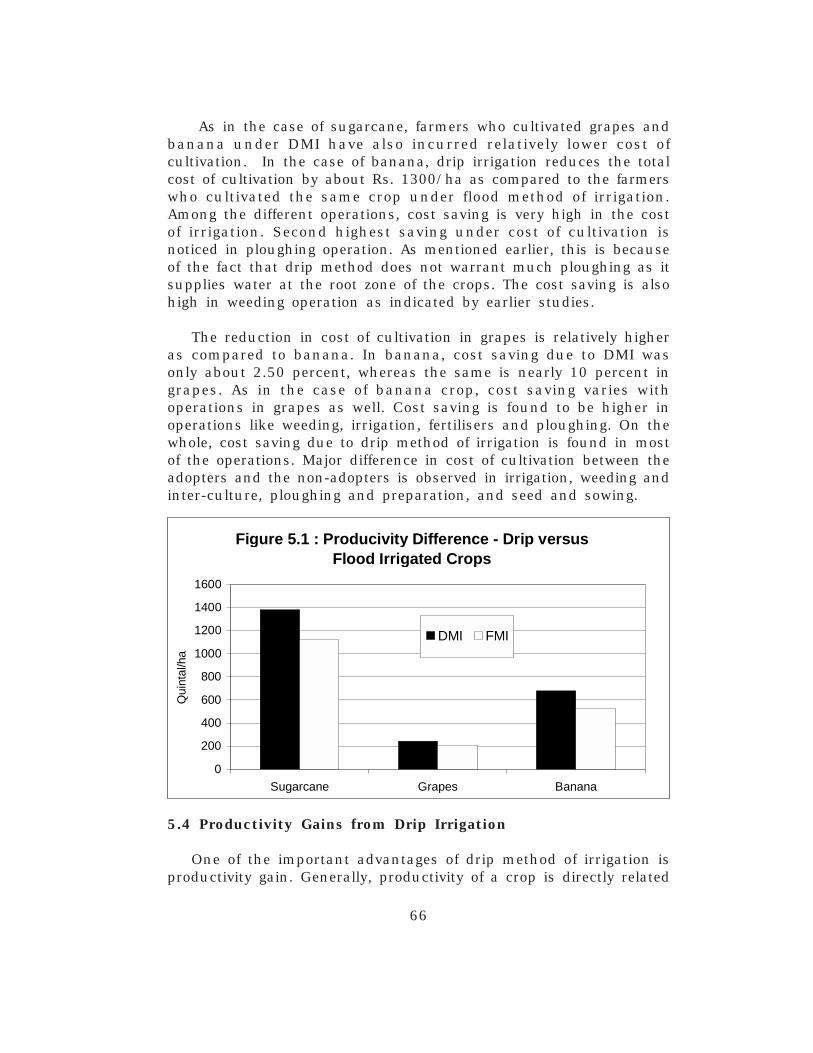
66
As in the case of sugarcane, farmers who cultivated grapes andbanana under DMI have also incurred relatively lower cost ofcultivation. In the case of banana, drip irrigation reduces the totalcost of cultivation by about Rs. 1300/ha as compared to the farmerswho cultivated the same crop under flood method of irrigation.Among the different operations, cost saving is very high in the costof irrigation. Second highest saving under cost of cultivation isnoticed in ploughing operation. As mentioned earlier, this is becauseof the fact that drip method does not warrant much ploughing as itsupplies water at the root zone of the crops. The cost saving is alsohigh in weeding operation as indicated by earlier studies.
The reduction in cost of cultivation in grapes is relatively higheras compared to banana. In banana, cost saving due to DMI wasonly about 2.50 percent, whereas the same is nearly 10 percent ingrapes. As in the case of banana crop, cost saving varies withoperations in grapes as well. Cost saving is found to be higher inoperations like weeding, irrigation, fertilisers and ploughing. On thewhole, cost saving due to drip method of irrigation is found in mostof the operations. Major difference in cost of cultivation between theadopters and the non-adopters is observed in irrigation, weeding andinter-culture, ploughing and preparation, and seed and sowing.
5.4 Productivity Gains from Drip Irrigation
One of the important advantages of drip method of irrigation isproductivity gain. Generally, productivity of a crop is directly related
Figure 5.1 : Producivity Difference - Drip versus Flood Irrigated Crops
0
200
400
600
800
1000
1200
1400
1600
Sugarcane Grapes Banana
Qui
ntal
/ha
DMI FMI
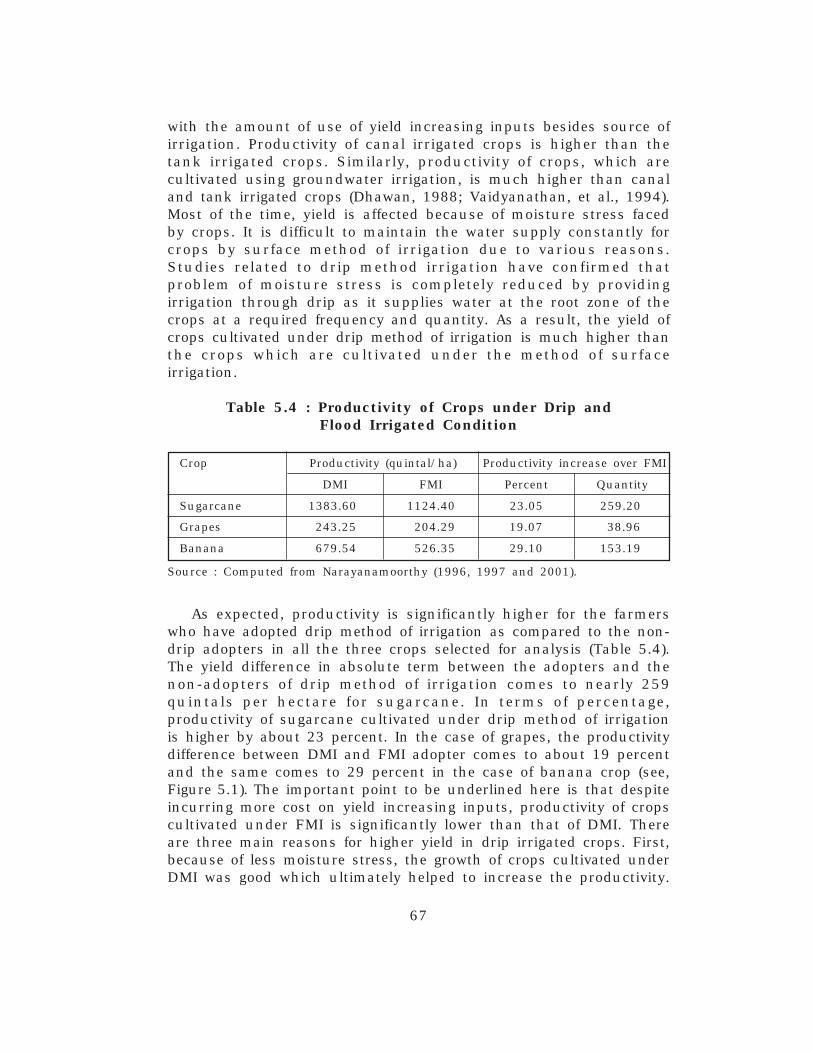
67
with the amount of use of yield increasing inputs besides source ofirrigation. Productivity of canal irrigated crops is higher than thetank irrigated crops. Similarly, productivity of crops, which arecultivated using groundwater irrigation, is much higher than canaland tank irrigated crops (Dhawan, 1988; Vaidyanathan, et al., 1994).Most of the time, yield is affected because of moisture stress facedby crops. It is difficult to maintain the water supply constantly forcrops by surface method of irrigation due to various reasons.Studies related to drip method irrigation have confirmed thatproblem of moisture stress is completely reduced by providingirrigation through drip as it supplies water at the root zone of thecrops at a required frequency and quantity. As a result, the yield ofcrops cultivated under drip method of irrigation is much higher thanthe crops which are cultivated under the method of surfaceirrigation.
Table 5.4 : Productivity of Crops under Drip andFlood Irrigated Condition
Crop Productivity (quintal/ha) Productivity increase over FMI
DMI FMI Percent Quantity
Sugarcane 1383.60 1124.40 23.05 259.20
Grapes 243.25 204.29 19.07 38.96
Banana 679.54 526.35 29.10 153.19
Source : Computed from Narayanamoorthy (1996, 1997 and 2001).
As expected, productivity is significantly higher for the farmerswho have adopted drip method of irrigation as compared to the non-drip adopters in all the three crops selected for analysis (Table 5.4).The yield difference in absolute term between the adopters and thenon-adopters of drip method of irrigation comes to nearly 259quintals per hectare for sugarcane. In terms of percentage,productivity of sugarcane cultivated under drip method of irrigationis higher by about 23 percent. In the case of grapes, the productivitydifference between DMI and FMI adopter comes to about 19 percentand the same comes to 29 percent in the case of banana crop (see,Figure 5.1). The important point to be underlined here is that despiteincurring more cost on yield increasing inputs, productivity of cropscultivated under FMI is significantly lower than that of DMI. Thereare three main reasons for higher yield in drip irrigated crops. First,because of less moisture stress, the growth of crops cultivated underDMI was good which ultimately helped to increase the productivity.

68
Second, unlike surface method of irrigation, drip does not encourageany growth of weed, especially in the non-crop zone. Weeds consumeconsiderable amount of yield increasing inputs and reduce the yieldof crops in surface method of irrigation. Third, unlike surfacemethod of irrigation, fertiliser losses occurring through evaporationand leaching through water are less under drip method of irrigationas it supplies water only for crop and not for the land. Though theexpenditures incurred by the non-adopters on different yieldincreasing inputs are more than the adopters in all three crops, thisdoes not coincide with increased yield of crops. Therefore, one canconclude that this productivity enhancement in all three crops isbecause of drip method of irrigation.
Table 5.5 : Expenditure Incurred to Produce one quintal ofOutput under Drip and Non-Drip Irrigated Condition
Particulars Sugarcane Grapes Banana
DMI FMI DMI FMI DMI FMI
Yield (quintal/ha) 1383.60 1124.40 243.25 204.29 679.54 526.35
Cost of cultivation 41993.20 48539.88 134506.19 147914.96 51436.66 52738.56(Rs/ha)
Cost of Production 30.35 43.17 552.95 724.04 70.69 100.19(Rs/quintal)
Source : Computed from Narayanamoorthy (1996, 1997 and 2001).
Besides increasing productivity of crops, DMI also increases thecost efficiency, i.e., it reduces the cost required to produce an unitof crop output. In order to understand the cost efficiency of drip andnon-drip irrigated crops, we have calculated expenditure incurred toproduce one quintal of output for both the adopters and the non-adopters. Per quintal cost is calculated by dividing the total cost ofcultivation with per hectare yield of three crops. It is evident fromTable 5.5 that the non-adopters spend nearly Rs.13 over theadopters to produce every quintal of sugarcane in Maharashtra.Likewise, in grapes, the non-adopters have incurred over Rs. 171 perquintal over the adopters and in banana, the non-adopters haveincurred nearly Rs. 30 to produce one quintal of output over thecounterpart. This clearly indicates that apart from increasing theproductivity of crops, drip method of irrigation also increases costefficiency substantially than the flood method of irrigation. On thewhole, the analysis carried out using both the experimental and fieldlevel data clearly suggests that drip method of irrigation increasesproductivity of crops that too with reduced cost of cultivation.

69
Chapter 6
Benefit-Cost Analysis
6.1 Introduction
It is clear from the preceding chapters that drip method ofirrigation reduces cost of cultivation, saves substantial amount ofwater and electricity and also enhances productivity of crops.Despite this, one of the important questions often asked about thedrip method of irrigation is whether or not drip investment iseconomically viable to farmers cultivating crops using this new watersaving technology. This question arises mainly because of tworeasons. First, drip method of irrigation requires relatively largeamount of fixed investment to install it in the field and therefore,everyone (from policy makers to farmers) wants to know its economicviability. Second, though DMI has been in use over the last onedecade in Indian agriculture, not many credible studies are availablefocusing on the economic viability of drip investment, especiallyusing data collected from farmers' field. In view of this, there is aneed to evaluate the economic viability of drip investment in drip-irrigated crops. In this chapter, therefore, an attempt is made toanalyse the economic viability of drip investment using bothsecondary and primary level information.
6.2 Benefit-Cost Estimates - Secondary Sources
Though quite a few studies have analysed the impact of dripmethod of irrigation on different parameters, not many studies haveattempted to look into the economic viability of drip investment evenby using experimental data. Some estimates on benefit-cost ratiosare available from three secondary sources namely INCID (1994);Sivanappan (1995) and AFC (1998). While it is not clear whether theestimates available in these three studies are carried out usingdiscounted cash flow technique, let us discuss the results of thesestudies before going into analyse the estimates made using fieldsurvey data.
The capital cost required for installing drip system for differentcrops has been increasing over the years due to increase in the costof materials used for manufacturing the drip system (GOI, 2004).The capital cost of drip system largely depends upon the type ofcrop (whether narrow or wide spaced crops), spacing followed for

70
cultivating crops, proximity to water source (distance between thefield and source of water) and the materials used for the system.Wide spaced crops generally require less capital when compared tothe crops having narrow space, as the latter would require morelaterals and drippers per hectare. INCID (1994) results reported inTable 6.1 clearly indicate that the requirement of capital cost ismuch higher for banana (Rs. 33765/ha) as compared to the samerequired for mango (Rs. 11053/ha), which is a wide spaced crop.
Table 6.1 : Benefit-Cost Ratio of Different Drip Irrigated Crops
Name of the Spacing Capital Cost Benefit-Cost RatioCrop (m x m) (Rs/ha)
Excluding IncludingWater Saving Water Saving
Coconut 7.62 x 7.62 11053 1.41 5.14
Grapes 3.04 x 3.04 19019 13.35 32.32
Grapes 2.44 x 2.44 23070 11.50 27.08
Banana 1.52 x 1.52 33765 1.52 3.02
Orange 4.57 x 4.57 19859 1.76 6.01
Pomegranate 3.04 x 3.04 19109 1.31 4.40
Mango 7.62 x 7.62 11053 1.35 8.02
Papaya 2.13 x 2.13 23465 1.54 4.01
Sugarcane Between biwall 1.86 31492 1.31 2.78
Vegetables Between biwall 1.86 31492 1.35 3.09
Source : Compiled from INCID, (1994).
As regards B-C ratio, the results available from INCID (1994)show that investment in drip method of irrigation is economicallyviable, even if it is estimated without taking into account subsidygiven to farmers. The B-C ratio estimated excluding water savingvaries from 1.31 in sugarcane to as high as 13.35 in grapes.Obviously, the B-C ratio increases significantly further, when it isestimated after including water saving. Various case studies reportedin INCID (1994) also indicate that investment in drip irrigation iseconomically viable for different crops (see, Tables 6.2 and 6.2A).Similar to INCID (1994), Sivanappan (1995) also estimated B-C ratiofor different crops cultivated under DMI using data pertaining to theyear 1993. It also suggests that the investment in drip irrigation iseconomically viable for different crops since the B-C ratio estimatedwas more than one. While the B-C ratio for pomegranate wasestimated to be 5.16, the same is estimated to be 1.83 for cotton,which is a less-water intensive as well as a narrow spaced crop.

71
Table 6.2 : Cost-Benefit of Different Crops under DMI and FMI
Sr. Particulars Banana Chilli Cucumber Grapes GroundnutNo
DMI FMI DMI FMI DMI FMI DMI FMI DMI FMI
1 Fixed Cost (Rs) 30000 Nil 32500 Nil 32500 Nil 32500 Nil 32000 Nil
a) Life (years) 5 Nil 6 Nil 10 Nil 10 Nil 5 Nil
b) Depreciation 6000 Nil 5417 Nil 3250 Nil 3250 Nil 6400 Nil
c) Interest 1800 Nil 1950 Nil 1950 Nil 1950 Nil 1920 Nil
d) Repairs and Maintenance 600 Nil 650 Nil 650 Nil 650 Nil 640 Nil
e) Total (b+c+d) 8400 Nil 8017 Nil 5850 Nil 5850 Nil 8960 Nil
2 Cost of Cultivation (Rs/ha) 34600 40000 8935 10600 9800 11300 51000 60000 6650 7450
3 Seasonal total Cost (1e+2) (Rs/ha 43000 40000 16952 10600 15650 11300 56850 60000 15610 7450
4 Water Used (mm.) 970 1760 290 780 363 600 278 532 580 900
5 Yield of Produce (q/ha) 875 575 29 20 255 180 325 264 32 16.75
6 Selling Price (Rs/q) 300 300 2000 2000 200 200 1500 1450 800 800
7 Income from produce (5 x 6) (Rs) 262500 172500 58000 40000 51000 36000 487500 322800 25600 13400
8 Net seasonal income (7-3) (Rs) 219500 132500 41048 29400 35350 24700 430650 322800 9990 5950
9 Additional area cultivated due to 0.80 Nil 1.50 Nil 0.65 Nil 0.90 Nil 0.50 Nilsaving of water (ha)
10 Additional expenditure due to Additional 34400 Nil 25428 Nil 10172.50 Nil 51165 Nil 7805 Nilarea (3 x 9)
11 Additional income due to additional area (7 x 9) 210000 Nil 87000 Nil 33150 Nil 438750 Nil 12800 Nil
12 Additional Net income (11-10) (Rs) 175600 Nil 61572 Nil 22977.50 Nil 387585 Nil 4995 Nil
13 Gross cost of production (3+10)(Rs) 77400 40000 42380 10600 25822.50 11300 108015 60000 23415 7450
14 Gross income (7+11) (Rs) 472500 172500 145000 40000 84150 36000 926250 382800 38400 13400
15 Gross benefit cost ratio (14/13) 6.10 4.31 3.42 3.77 3.26 3.19 8.58 6.38 1.64 1.80
16 Net extra income due to drip Irrigation system 262600 Nil 73220 Nil 58327.50 Nil 495435 Nil 9035 Nilover conventional (12+8 drip - 8 conventional)
17 Net Profit per mm of water used (8/4) 226.29 75.28 141.55 37.69 97.38 41.17 1549.10 606.77 17.22 6.61
18 Water use efficiency (5/4 x 100)kg/ha mm 90.21 32.67 10 2.56 70.25 30 116.91 49.62 5.52 1.86
Source : INCID (1994).
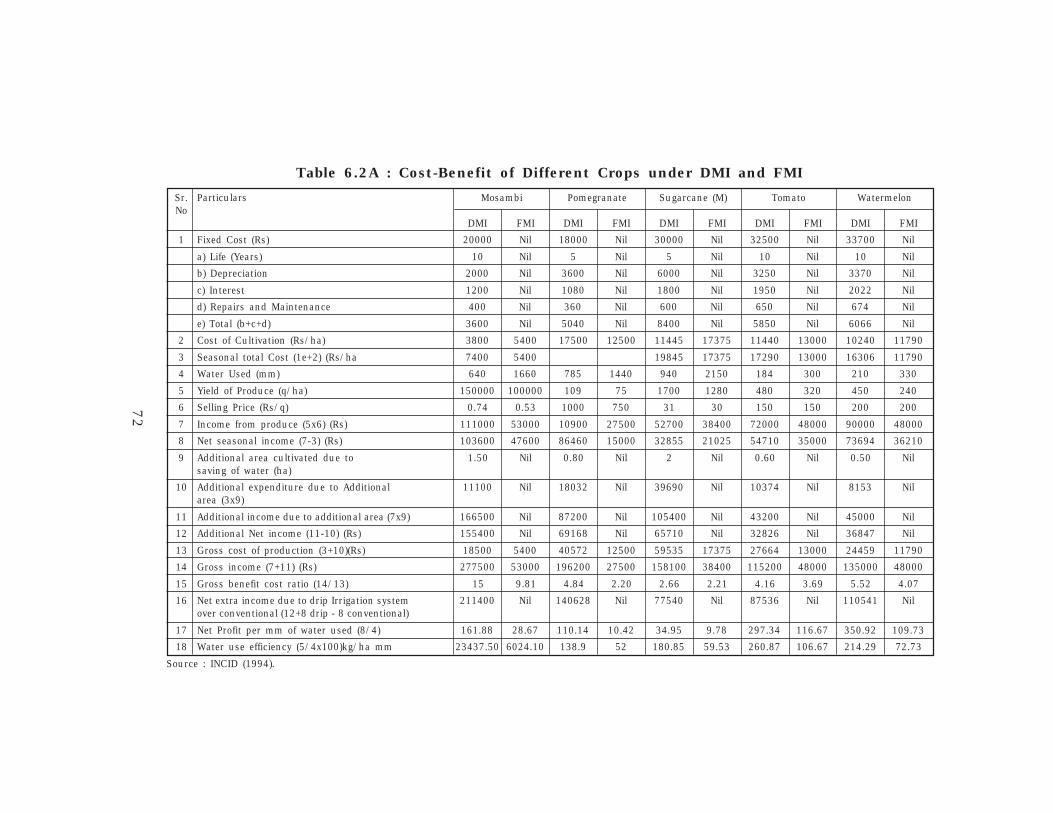
72
Table 6.2A : Cost-Benefit of Different Crops under DMI and FMI
Sr. Particulars Mosambi Pomegranate Sugarcane (M) Tomato WatermelonNo
DMI FMI DMI FMI DMI FMI DMI FMI DMI FMI
1 Fixed Cost (Rs) 20000 Nil 18000 Nil 30000 Nil 32500 Nil 33700 Nil
a) Life (Years) 10 Nil 5 Nil 5 Nil 10 Nil 10 Nil
b) Depreciation 2000 Nil 3600 Nil 6000 Nil 3250 Nil 3370 Nil
c) Interest 1200 Nil 1080 Nil 1800 Nil 1950 Nil 2022 Nil
d) Repairs and Maintenance 400 Nil 360 Nil 600 Nil 650 Nil 674 Nil
e) Total (b+c+d) 3600 Nil 5040 Nil 8400 Nil 5850 Nil 6066 Nil
2 Cost of Cultivation (Rs/ha) 3800 5400 17500 12500 11445 17375 11440 13000 10240 11790
3 Seasonal total Cost (1e+2) (Rs/ha 7400 5400 19845 17375 17290 13000 16306 11790
4 Water Used (mm) 640 1660 785 1440 940 2150 184 300 210 330
5 Yield of Produce (q/ha) 150000 100000 109 75 1700 1280 480 320 450 240
6 Selling Price (Rs/q) 0.74 0.53 1000 750 31 30 150 150 200 200
7 Income from produce (5x6) (Rs) 111000 53000 10900 27500 52700 38400 72000 48000 90000 48000
8 Net seasonal income (7-3) (Rs) 103600 47600 86460 15000 32855 21025 54710 35000 73694 36210
9 Additional area cultivated due to 1.50 Nil 0.80 Nil 2 Nil 0.60 Nil 0.50 Nilsaving of water (ha)
10 Additional expenditure due to Additional 11100 Nil 18032 Nil 39690 Nil 10374 Nil 8153 Nilarea (3x9)
11 Additional income due to additional area (7x9) 166500 Nil 87200 Nil 105400 Nil 43200 Nil 45000 Nil
12 Additional Net income (11-10) (Rs) 155400 Nil 69168 Nil 65710 Nil 32826 Nil 36847 Nil
13 Gross cost of production (3+10)(Rs) 18500 5400 40572 12500 59535 17375 27664 13000 24459 11790
14 Gross income (7+11) (Rs) 277500 53000 196200 27500 158100 38400 115200 48000 135000 48000
15 Gross benefit cost ratio (14/13) 15 9.81 4.84 2.20 2.66 2.21 4.16 3.69 5.52 4.07
16 Net extra income due to drip Irrigation system 211400 Nil 140628 Nil 77540 Nil 87536 Nil 110541 Nilover conventional (12+8 drip - 8 conventional)
17 Net Profit per mm of water used (8/4) 161.88 28.67 110.14 10.42 34.95 9.78 297.34 116.67 350.92 109.73
18 Water use efficiency (5/4x100)kg/ha mm 23437.50 6024.10 138.9 52 180.85 59.53 260.87 106.67 214.29 72.73
Source : INCID (1994).
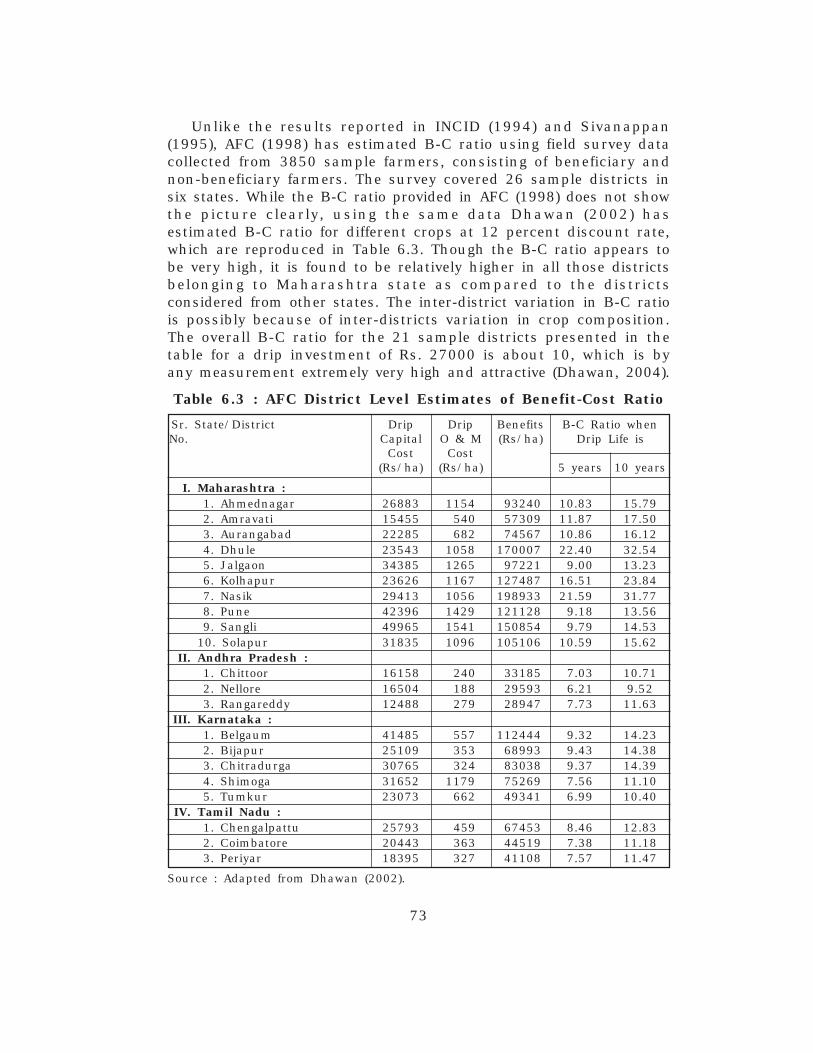
73
Unlike the results reported in INCID (1994) and Sivanappan(1995), AFC (1998) has estimated B-C ratio using field survey datacollected from 3850 sample farmers, consisting of beneficiary andnon-beneficiary farmers. The survey covered 26 sample districts insix states. While the B-C ratio provided in AFC (1998) does not showthe picture clearly, using the same data Dhawan (2002) hasestimated B-C ratio for different crops at 12 percent discount rate,which are reproduced in Table 6.3. Though the B-C ratio appears tobe very high, it is found to be relatively higher in all those districtsbelonging to Maharashtra state as compared to the districtsconsidered from other states. The inter-district variation in B-C ratiois possibly because of inter-districts variation in crop composition.The overall B-C ratio for the 21 sample districts presented in thetable for a drip investment of Rs. 27000 is about 10, which is byany measurement extremely very high and attractive (Dhawan, 2004).
Table 6.3 : AFC District Level Estimates of Benefit-Cost Ratio
Sr. State/District Drip Drip Benefits B-C Ratio whenNo. Capital O & M (Rs/ha) Drip Life is
Cost Cost(Rs/ha) (Rs/ha) 5 years 10 years
I. Maharashtra : 1. Ahmednagar 26883 1154 93240 10.83 15.79 2. Amravati 15455 540 57309 11.87 17.50 3. Aurangabad 22285 682 74567 10.86 16.12 4. Dhule 23543 1058 170007 22.40 32.54 5. Jalgaon 34385 1265 97221 9.00 13.23 6. Kolhapur 23626 1167 127487 16.51 23.84 7. Nasik 29413 1056 198933 21.59 31.77 8. Pune 42396 1429 121128 9.18 13.56 9. Sangli 49965 1541 150854 9.79 14.5310. Solapur 31835 1096 105106 10.59 15.62
II. Andhra Pradesh : 1. Chittoor 16158 240 33185 7.03 10.71 2. Nellore 16504 188 29593 6.21 9.52 3. Rangareddy 12488 279 28947 7.73 11.63
III. Karnataka : 1. Belgaum 41485 557 112444 9.32 14.23 2. Bijapur 25109 353 68993 9.43 14.38 3. Chitradurga 30765 324 83038 9.37 14.39 4. Shimoga 31652 1179 75269 7.56 11.10 5. Tumkur 23073 662 49341 6.99 10.40
IV. Tamil Nadu : 1. Chengalpattu 25793 459 67453 8.46 12.83 2. Coimbatore 20443 363 44519 7.38 11.18 3. Periyar 18395 327 41108 7.57 11.47
Source : Adapted from Dhawan (2002).

74
Though B-C ratio available from different sources suggests thatthe investment in drip irrigation is economically viable for farmers,one cannot completely rely on these results because of the followingreasons. First, the studies discussed above are not clearly mentionedhow the income stream is estimated during the entire life period ofdrip set in drip irrigated crops. Secondly, studies especially bySivanappan (1995) and INCID (1994) have not mentioned themethodology that is followed for estimating the B-C ratio for differentcrops. These estimates also appear to be output-input ratio, but notB-C ratio estimated using discounted cash flow technique. Third, thepast studies on this aspect have either carried out B-C analysiswithout proper methodology or relied on the experience of one or fewfarmers adopting DMI. Fourth, none of the above studies mentionedthe assumptions that are followed for estimating B-C ratio. In viewof the limitations of the available studies, there is a need toempirically evaluate the economic viability of DMI within a relativelymore systematic methodological framework.
6.3 The Approach on Benefit-Cost Analysis
As mentioned earlier, past studies (e.g. INCID, 1994; Sivanappan,1994; AFC, 1998) on the subject have either conducted benefit-costanalysis without a proper methodology or relied heavily on theexperience of one or few farmers adopting DMI. Therefore, there is aneed for a study to empirically evaluate the economic viability ofDMI within a relatively more systematic methodological framework.Specifically, we try to address (1) how the factors like fixed invest-ment influence economic viability on DMI and (2) how governmentsubsidies and farmers' time preference (i.e., the differential discountrates) influence the economic viability of DMI in three crops namelysugarcane, grapes and banana.
In order to evaluate the economic viability of drip investment inthe context of three crops, we have computed both the Net PresentWorth (NPW) and the Benefit-Cost Ratio (BCR) by utilising thediscounted cash flow technique. Since the NPW is the differencebetween the sum of the present value of benefits and that of costsfor a given life period of the drip set, it collates the total benefitswith the total costs covering items like capital and depreciation costsof the drip set. In terms of the NPW criterion, the investment ondrip set can be treated as economically viable if the present value ofbenefits is greater than the present value of costs. The BCR is alsorelated to NPW as it is obtained just by dividing the present worthof the benefit stream with that of the cost stream. Generally, if the

75
BCR is more than one, then, the investment on that project can beconsidered as economically viable. A BCR greater than one obviouslyimplies that the NPW of the benefit stream is higher than that of thecost stream (Gittinger, 1984). The NPW and BCR can be defined asfollows:
t=n Bi– CtNPW = � ———
t=1 (1+i)t
t=n BtBCR = � ———
t=1 (1+i)t—————t=n Ct� ———t=1 (1+i)t
Where, Bt = benefit in year tCt = cost in year tt = 1,2,3,…….nn = project life in yearsi = rate of interest (or the assumed opportunity cost of
the investment)
Since drip irrigation involves fixed capital, it is necessary to takeinto account the income stream for the whole life span of dripinvestment. However, since it is difficult to generate the cash flowsfor the entire life span of drip investment in the absence of observedtemporal information on benefits and costs, we need to make fewrealistic assumptions so as to estimate both the cash inflows andcash outflows for drip investment. These assumptions are :
1. The life period of the drip set is considered as five years forsugarcane and banana, but 10 years for grapes as followed bythe INCID study (1994) as well as the experience gathered fromthe field.
2. The cost of cultivation and income generated using drip methodof irrigation is assumed constant during the entire life period ofdrip set in all three crops.
3. Differential rates of discount (interest rates) are considered toundertake the sensitivity of investment to the change in capitalcost. These are assumed at 10, 12 and 15 percent as alternativesrepresenting various opportunity costs of capital.
76
4. The crop cultivation technology is assumed constant for all threecrops during the entire life period of drip set.
6.4 Capital Cost, Production Cost and Gross Income
As a backdrop to our benefit-cost analysis of DMI, we first brieflydiscuss about the gross cost of production, profit without discount,capital cost (without and with subsidy) and the amount of subsidyreceived by the farmers. Table 6.4 presents the details of production,gross income and other details for three crops namely sugarcane,grapes and banana. To complete the analysis of the relativeeconomics of DMI and FMI, we have calculated the relative profitlevels of three crops for the adopters and non-adopters of DMI.Profit of a crop is not only determined by its total quantity of outputbut also its quality. Prevailing market conditions also plays a crucialrole in determining the price of agricultural commodities. A goodquality product can fetch better price in the market. It has come outfrom the earlier studies that drip method of irrigation not only helpsin increasing the yield of the crops but also improves quality of theproduct and fetches higher price in the market (INCID, 1994;Sivanappan, 1994; Narayanamoorthy, 1997a, b).
Let us study how profit (undiscounted) varies between drip andnon-drip irrigated crops in our study. While calculating profit, thetotal cost was calculated by considering only the variable costs butnot the fixed cost components like interest rate and depreciation.20
To calculate per hectare profit, we subtract the total cost of cultiva-tion from the total income for the group of adopters and the non-adopters. The gross income (in rupees) is calculated by multiplyingtotal yield with price received by the farmers for their crop output. Itcan be seen from Table 6.4 that per hectare profit21 of the adoptersin sugarcane is Rs. 27424 higher than that of the non-adopters. Interms of percentage, profit of the drip adopters is higher by about74 percent over the profit of the non-drip farmers. This is notsurprising because on the one hand drip irrigation reduces the costof cultivation of sugarcane and on the other hand it increases theyield of sugarcane.
20. The cost of cultivation used in our analysis refers to cost A2, which includes all
actual expenses in cash and kind incurred in production by owner plus rentpaid for leased-in land. See, CACP (1998) for more details about different costconcepts.
21. This profit is calculated by deducting gross income from cost A2.

77
Some studies have indicated that since moisture stress is veryless for the crops cultivated under DMI, the quality of crop producecultivated under DMI is good which ultimately helps to fetch higherprice in the market. We could not test this in our study because allthe farmers have supplied sugarcane to sugar factories, where theprice is uniformly fixed for all the farmers. However, some of theadopters have argued that if recovery testing is done separately fordrip-irrigated sugarcane, the real impact of DMI on recovery rate ofsugarcane can be visibly seen.22 Therefore, under thesecircumstances, we can conclude that farmers adopting drip methodof irrigation earn more profit not because of price effect but onlybecause of yield effect.
Similar to sugarcane crop, the average profit among the dripadopters is significantly higher than that among the non-dripadopters in case of both grapes and banana. It can be seen fromTable 6.4 that for grapes, the profit level among drip adopters isRs. 50187/ha higher than that among non-adopters, whereas thesame is about Rs. 32400/ha for banana. While the profit differentialis substantial for drip irrigated crops, it cannot be taken as aconclusive indicator of the comparative advantages of the newirrigation technique as our profit calculation is based only thevariable cost but ignores fixed cost components like depreciation andinterest accrued on the fixed capital while calculating the net profit.The life period of drip-set is one of the important variables whichdetermine the per hectare profit. Moreover, since it is a capital-intensive technique, the huge initial investment needed for installingdrip systems remains the main deterrent for the widespread adoptionof DMI. To what extent this discouragement effect is real and to
22. A scientific study carried out jointly by Jain Irrigation Systems Limited (JISL),Jalgaon and Sakthi Sugars Limited (SSL), Sivagangai, in a farmer's field (ShriK.K.R. Tamilarasu of Chokkanathapuram village) at Sivagangai district, TamilNadu shows that the recovery rate of sugarcane cultivated under DMI (12.16percent) is about 0.35 percent points higher than that of flood irrigated sugar-cane (11.81 percent). The author is thankful to both JISL and SSL for sharingthe results of their scientific study. The other parameters of the scientific studyare presented below for the purpose of comparison:
DMI 33 9.87 2.79 3.26 2.01 53568 19.21 17.07 88.90 12.16 59.00 7.17FMI 30 8.17 2.67 2.41 1.61 45953 19.86 16.78 86.67 11.81 36.00 4.25
Notes : IN - internodal; NMC - net millable canes; CCS - commercial cane sugar.
Det
ails
No.
of
IN
IN L
engt
h(c
m)
Can
e gi
rth
(cm
)
Can
e le
ngt
h(m
)
IN c
an
ew
eigh
t (k
g)
NM
C/acr
e(n
um
ber
s)
Bri
xJu
ice)
%
Pol
(su
cros
e)% Pu
rity
%
Rec
over
y %
Yu
eld
(ton
ne/
acr
e)
CC
S(t
onn
e/acr
e)

78
what extent such effect can be counterbalanced by governmentsubsidy are some of the important policy issues requiring empiricalanswers.
Fixed capital is needed for installing drip method of irrigation.The magnitude of capital requirement varies with crop dependingupon certain factors as indicated earlier. Generally, wide spacedcrops require relatively low fixed investment and narrow spacedcrops need higher fixed investment. Besides the crop type, the size ofthe fixed capital requirement is also sensitive to the quality of thematerials used for the systems as well as the distance between thewater source (well) and the field (NABARD, 1989). Let us now evalu-ate the empirical pattern of capital cost of the drip system,production cost (cost of cultivation) of crops and the amount ofsubsidy received by the sample farmers. Table 6.4 presents thedetails of capital cost and subsidy for all three crops. As mentionedearlier, since DMI is a capital-intensive technology, governmentprovides nearly 50 percent of the capital cost as subsidy toencourage the adoption of drip irrigation in crop cultivation. Theaverage capital subsidy comes to Rs. 19263/ha for sugarcane,Rs. 11359/ha for grapes and Rs. 12620/ha for banana. As a propor-tion of the total capital cost of drip set, subsidy amount accounts forabout 35 to 37 percent among three crops, which is within a limit ofprovision made by the government. With this background, let usanalyse benefit-cost pattern of drip investment using discounted cashflow technique.
Table 6.4 : Capital Cost, Production Cost, Gross Income,Subsidy among Drip and non-Drip Irrigated Crops
Particulars Sugarcane Grapes Banana
DMI FMI DMI FMI DMI FMI
Cost of cultivation 41993.20 48539.88 134506.19 147914.96 51436.66 52738.56(Rs/ha)a
Gross income (Rs/ha) 106366.00 85488.20 247817.02 211037.97 134043.75 102934.73
Profit (Rs/ha)b 64372.80 36948.32 113310.83 63122.97 82607.09 50196.17(Farm business income)
Capital cost of drip set 52811.00 — 32721.00 — 33595.00 —(Rs/ha) (without subsidy)c
Capital cost of drip set 33547.56 — 20101.00 — 22236.00 —(Rs/ha)(with subsidy)c
Subsidy (Rs/ha) 19263.44 — 11359.00 — 12620.00 —
Notes : a - production cost (A2) includes the operation and maintenance cost of drip set andpump-set; b - This is the difference between gross value of production andproduction cost (A2) and c - it does not include pump-set cost.
Source : Calculated from Narayanamoorthy (1996, 1997 and 2001).
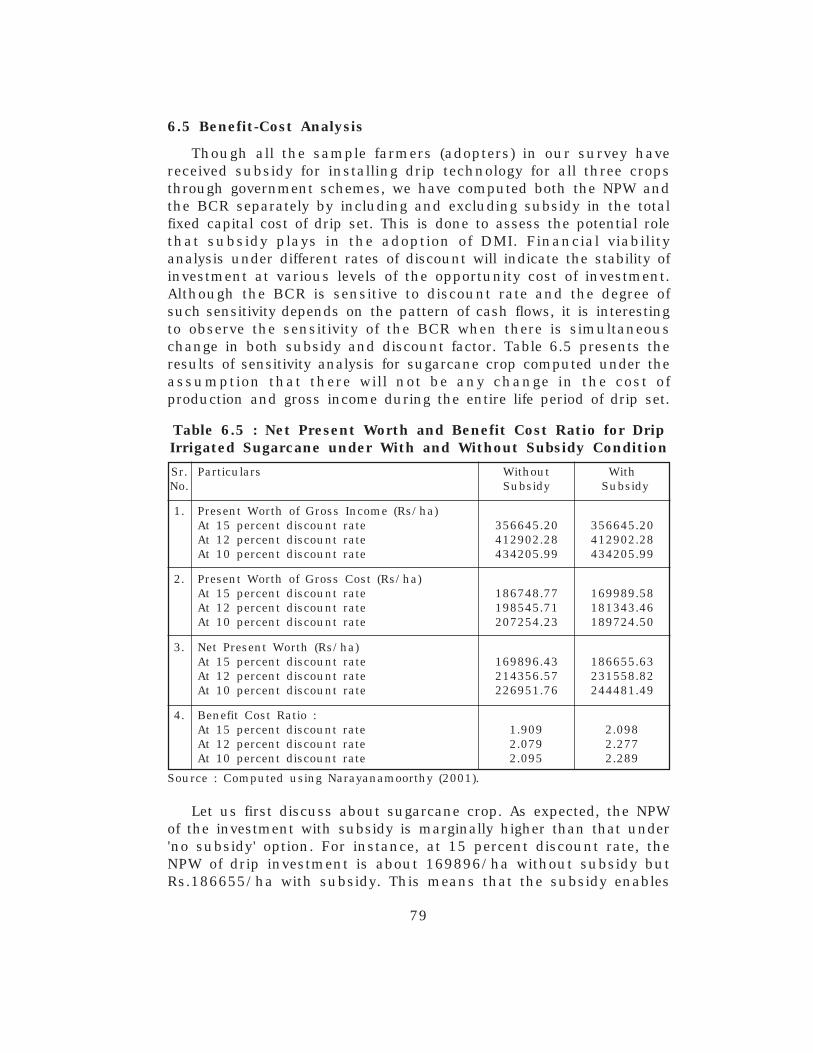
79
6.5 Benefit-Cost Analysis
Though all the sample farmers (adopters) in our survey havereceived subsidy for installing drip technology for all three cropsthrough government schemes, we have computed both the NPW andthe BCR separately by including and excluding subsidy in the totalfixed capital cost of drip set. This is done to assess the potential rolethat subsidy plays in the adoption of DMI. Financial viabilityanalysis under different rates of discount will indicate the stability ofinvestment at various levels of the opportunity cost of investment.Although the BCR is sensitive to discount rate and the degree ofsuch sensitivity depends on the pattern of cash flows, it is interestingto observe the sensitivity of the BCR when there is simultaneouschange in both subsidy and discount factor. Table 6.5 presents theresults of sensitivity analysis for sugarcane crop computed under theassumption that there will not be any change in the cost ofproduction and gross income during the entire life period of drip set.
Table 6.5 : Net Present Worth and Benefit Cost Ratio for DripIrrigated Sugarcane under With and Without Subsidy Condition
Sr. Particulars Without WithNo. Subsidy Subsidy
1. Present Worth of Gross Income (Rs/ha)At 15 percent discount rate 356645.20 356645.20At 12 percent discount rate 412902.28 412902.28At 10 percent discount rate 434205.99 434205.99
2. Present Worth of Gross Cost (Rs/ha)At 15 percent discount rate 186748.77 169989.58At 12 percent discount rate 198545.71 181343.46At 10 percent discount rate 207254.23 189724.50
3. Net Present Worth (Rs/ha)At 15 percent discount rate 169896.43 186655.63At 12 percent discount rate 214356.57 231558.82At 10 percent discount rate 226951.76 244481.49
4. Benefit Cost Ratio :At 15 percent discount rate 1.909 2.098At 12 percent discount rate 2.079 2.277At 10 percent discount rate 2.095 2.289
Source : Computed using Narayanamoorthy (2001).
Let us first discuss about sugarcane crop. As expected, the NPWof the investment with subsidy is marginally higher than that under'no subsidy' option. For instance, at 15 percent discount rate, theNPW of drip investment is about 169896/ha without subsidy butRs.186655/ha with subsidy. This means that the subsidy enables

80
the farmers to get an additional benefit of Rs. 16759/ha. It can alsobe observed that the difference between the NPW under 'withsubsidy' and 'no subsidy' scenarios is decreasing along with eachincrease in discount rate. For instance, the NPW under withoutsubsidy condition increased from Rs. 169896/ha. at 15 percentdiscount rate to Rs. 226951/ha. at 10 percent discount rate.Similarly, under subsidy condition, the NPW increased fromRs. 186655/ha at 15 percent discount rate to Rs. 244481/ha. at 10percent discount rate. Similar to this, under without subsidycondition, the BCR also increased marginally from 1.909 at 15percent discount rate to 2.095 at 10 percent discount rate. Thehigher BCR under subsidy condition suggests the positive role thatsubsidy plays in improving the economic viability of drip method ofirrigation in sugarcane.
Similar to sugarcane crop, the NPW and BCR are estimatedseparately for banana and grapes. Table 6.6 presents the results ofthe sensitivity analysis computed under the assumption that therewill not be any change in the cost of production and gross incomeduring the entire life period of drip set. As expected, the NPW of theinvestment with subsidy is marginally higher than that under `nosubsidy' option for both banana and grapes. For instance, at 15 percent discount rate, the NPW of drip investment for banana is aboutRs. 247753/ha without subsidy but Rs. 2,57,635/ha with subsidy.This means that the subsidy enables farmers to get an additional
Table 6.6 : Net Present Worth and Benefit Cost Ratio forDrip Irrigated Grapes and Banana under With and Without
Subsidy ConditionSr. Particulars Without Subsidy With SubsidyNo. Banana Grapes Banana Grapes
1. Present Worth of Gross Income (Rs/ha)At 15 percent discount rate 449449 1243794 449449 1243794At 12 percent discount rate 483228 1400166 483228 1400166At 10 percent discount rate 508026 1522588 508026 1522588
2. Present Worth of Gross Cost (Rs/ha)At 15 percent discount rate 201696 703553 191814 692574At 12 percent discount rate 215431 789179 205287 777909At 10 percent discount rate 225484 856148 215159 844677
3. Net Present Worth (Rs/ha)At 15 percent discount rate 247753 540241 257635 551220At 12 percent discount rate 267797 610987 277941 622257At 10 percent discount rate 282542 666440 292867 677911
4. Benefit Cost Ratio :At 15 percent discount rate 2.288 1.767 2.343 1.795At 12 percent discount rate 2.243 1.774 2.353 1.799At 10 percent discount rate 2.253 1.778 2.361 1.802
Source : Computed from Narayanamoorthy (1996 and 1997).
81
benefit of Rs. 9,882/ha. It can also be noted that the differencebetween the NPW under the two scenarios is decreasing along witheach increase in discount rate. The difference in NPW for the twoscenarios which is Rs. 10,325 for banana and Rs. 11,471 for grapesat 10 per cent discount rate declines to Rs. 9,882 and Rs. 10,979for Banana and Grapes respectively at 15 per cent discount rate.This differential behaviour of NPW across discount rates for the twocrops is attributable to the observed differences in cash flows andcultivation practices and the assumed difference in drip set life spanfor the two crops. As seen from the Table 6.6, the BCR withoutsubsidy for banana is about 2.253 at 10 per cent discount rateslides down to 2.228 at 15 per cent discount rate. For grapes, incontrast, the BCR declines only marginally as the rate of discountincreases. Although the same pattern of decline in BCR is observedacross discount rates even under the alternative scenario of cashflows with subsidy, the BCR is higher with subsidy than otherwise.This suggests the positive role that subsidy plays in improving theeconomic viability of DMI for our sample crops irrespective of thetime preference of the farmers.
Another policy wise important economic issue in the context ofDMI adoption is the number of years needed to recover fully thecapital costs involved in drip installation. Our year-wise computationof NPW for sugarcane, banana and grapes clearly shows thatfarmers can recover the entire capital cost of the drip set from theirnet profit in the very first year itself. This finding contradicts withthe general belief that the capital cost recovery for drip investmenttakes more time. More importantly, when farmers can recover thecapital costs within a year, the role of discount rate as a device tocapture the time preference of farmer seems to be of considerablylesser importance than one might think. However, in order to have amore definite answers to the economic and social viability of DMI,we need a social rather than the private cost-benefit evaluation beingattempted here. A comprehensive evaluation can be done byincorporating both the social benefits in the form of water saving,additional irrigation, lower soil degradation and retention of soilfertility as well as the social costs in terms of the negative food andfodder in the crop pattern shift and labour displacement. On thewhole, the BCR under different discount rates indicates that dripinvestment in three crops considered for detailed analysis remainseconomically viable even without subsidy.
83
Chapter 7
Potential and Prospects for Drip Irrigation in India
7.1 Introduction
It is clear from the foregoing chapters that drip method of irriga-tion has many advantages over the flood method of irrigation, whichis predominantly followed in most of the countries. Despite the factthat drip method of irrigation involves relatively larger fixed invest-ment, benefit-cost ratio estimated using farm level data clearlysuggests that the investment in drip irrigation is economically viableto farmers. Although the drip method of irrigation has proved to bea very useful method for sustainable use of irrigation water, notmany studies have attempted to estimate the total potential area fordrip method of irrigation as well as the total potential water savingthat can be realised by utilising the potential area for India as awhole.23 Besides helping to understand the overall potential of thecountry, this kind of estimate would be useful for making policydecision, fixing targets and allocation of funds for utilising thepotential. It is in this context, in the present chapter, we try toprovide answers to questions like : what would be the total potentialof the drip irrigated area and the required investment for utilisingthis potential? How much water can be saved by utilising thepotential area? How much additional irrigated area can be createdfrom the saving of water by adopting DMI?
7.2 Potential Area for Drip Method of Irrigation
India has enormous potential for drip method of irrigation.Potential area for DMI is also expected to increase faster due to fastdecline of irrigation potential. Various crops that are highly suitablefor drip method of irrigation are extensively cultivated in differentparts of India. Available information shows that about 80 crops, bothnarrow and wide spaced crops, can be grown under drip method ofirrigation in India (see, Table 7.1). Due to various measures taken bythe central and state governments along with the support of drip-setmanufactures, the area under DMI has increased phenomenally inrecent years. However, the achievement of area seems to be very lesscompared to the total potential area that exists in India.23. At the macro level, there are two estimates available on the potential area for
drip method of irrigation in India. While the NCPA (1990) estimated about 18.20mha as a potential area for DMI, the Task Force on Micro-Irrigation (GOI, 2004)estimated about 27 mha as a potential area for the country as a whole. How-ever, both the sources have not provided any explanation about the methodthat is followed for estimating the potential area.

84
Table 7.1 : Crops Grown under Drip Method of Irrigation
I. CEREALS 39. Mango1. Corn 40. Mosambi2. Sorghum 41. Naval Orange3. Wheat 42. Papaya
II. FLOWERS 43. Peach4. Chrysanthemum 44. Pear5. Camation 45. Pineapple6. Jasmine 46. Persimmon7. Rose 47. Plum8. (All) Ornamental Trees and Shrubs 48. Pomegranate
III. FODDERS 49. Strawberry9. Alfalfa 50. Tangelo10. Asparagus 51. Tangerine11. (All) Pastures 52. Valencia Orange
IV. FIBRES 53. Watermelon12. Cotton VIII. PLANTATION CROPS13. Sisal 54. Bamboo
V. NUTS 55. Cocoa14. Almond 56. Coffee15. Arecanut 57. Mulberry16. Cashew nut 58. Oil palm17. Coconut 59. Rubber18. Macadmaia 60. Sugarcane19. Walnut 61. Tamarind
VI. OILSEEDS 62. Tapioca20. Groundnut 63. Tea
VII. ORCHARDS 64. Teak21. Amla IX. SPICES22. Apple 65. Cardamom23. Apricot 66. Pepper24. Avocado X. VEGETABLES25. Banana 67. Beet Root26. Ber 68. Brinjal27. Betelvine 69. Bulbs28. Boysen Berry 70. Celery29. Cherry 71. Chilli30. Chikoo (Sapota) 72. Cucumber31. Citrus 73. Egg Plant32. Custard Apple 74. Lettuce33. Fig 75. Onion34. Grape (Table and Wine) 76. Peas35. Grape fruit 77. Potato36. Guava 78. Radish37. Lemon 79. Sweet Potato38. Lime 80. Tomato
Source: INCID (1994), Drip Irrigation in India, Indian National Committee onIrrigation and Drainage, New Delhi.

85
DMI is not only suitable for those areas that are presently undercultivation, but it can also be operated efficiently in undulatingterrain, rolling topography, hilly areas, barren lands and areas whichhave shallow soils (Sivanappan, 1994). Since most of the potentialareas are not under cultivation presently, we can broadly divide thetotal potential into two categories as "distant potential" and "corepotential" for the purpose of analysis. "Distant potential" refers to allthose areas that are suitable for drip method of irrigation, but maynot be under cultivation presently. Lands (area) that are fallingunder the categories of barren and unculturable lands, culturablewastelands and fallow lands can be treated as "distant potential" ofDMI. In India, as per the land utilisation data of 1994-95, about56.28 million hectares of lands are available in these categories.Unlike FMI, land-leveling and ploughing are not necessary forcultivating crops (especially horticultural crops) under DMI. Therefore,without incurring heavy expenditures on land reclamation activities,these areas can be brought under cultivation using drip method ofirrigation in a phased manner by a properly designed specialdevelopment programme.
Table 7.2 : Drip Irrigation Potential and CapitalRequirement - India
Crop's Name Potential Area Capital Requirement of(million hectares) (Rs/ha) Capital (Rs. Crore)Core* Net** For Core For Net
Potential Potential
Oilseeds (except groundnut) 18.09 5.17 40000a 72360 20680Sugarcane 4.23 4.23 31492b 13321 13321Vegetables 5.34 5.34 40000c 21360 21360Fruits 3.36 1.20 27543d 9254 3305Tea 0.45 — 25000e 1125 —Coffee 0.30 — 25000e 750 —Tobacco 0.48 — 40000f 1920 —Condiments and Spices 2.65 1.00 31492g 8345 3149Cotton 7.97 2.59 33750h 26899 8741Rubber 0.50 — 20000i 1000 —Groundnut 7.97 1.66 33750j 26899 5603Flowers 0.08 0.08 34367k 275 275Total 51.42 21.27 — 183508 76434
Notes : * - refers to both irrigated and unirrigated area; ** - refers to irrigated areaonly; a - cost of vegetable crop; b - space between biwall 1.86m; c - averagecost of tomato, chilli and brinjal; d - average cost of banana, grapes,papaya with the space 3m x 3m; e - cost of betelvine; f - cost of vegetablecrop; g - cost of sugarcane; h - spacing 1.3m x 1.3m; i - cost of coconut;j - cost of cotton; k - average cost of rose.
Sources : Estimated from FAI (1998); NHB (1998); GOI (1996); INCID (1994).

86
"Core potential" refers to all those areas and crops that are notonly suitable for DMI but under cultivation at present. The importantcrops that are suitable for DMI are sugarcane, vegetables, fruits, tea,coffee, tobacco, rubber, condiments and spices, groundnut and otheroilseed crops, flowers, cotton, etc. In India, these crops togetheraccounted for about 51.42 million hectares during the year 1994-95.However, it is not possible to bring all the areas of "core potential"under DMI immediately as over 58 percent of the "core potential"cropped area is under rain-fed cultivation. That is, out of the "corepotential" area of 51.42 mha, only about 21.27 mha of cropped areais cultivated under irrigated condition at present. Therefore, it isprudent to treat the irrigated-cropped area of about 21.17 mha asthe "net potential" area of DMI (Table 7.2).24
7.3 Capital Requirements for Utilising the Potential Area
After having understood the potential area, an attempt is alsomade to estimate the total capital cost that is required for utilisingthe potential area. As mentioned earlier, the requirement of capitalcost for DMI varies from crop to crop depending upon the nature ofcrops, requirement of water, slope of the land, space between theplants/crops and the quality of materials used for the system.Estimates provided in INCID (1994) report show that the per hectarecapital cost is relatively higher for narrow spaced crops (vegetablecrops, groundnut, sugarcane, etc) when compared to wide spacedcrops (fruit crops, coconut, etc). Since DMI supplies water at theroot zone of the crops and the number of plants per hectare arehigher in narrow spaced crops, the requirements of drip accessoriessuch as main pipes and sub-lets, laterals, drippers/emitters, valves,etc. are higher for narrow spaced crops.
There are some difficulties in estimating the total capital that isrequired for utilising the potential area for drip method of irrigation.First, the requirement of capital changes even for the same crop ifthe space followed for cultivating the crop changes. Second, therequirement of capital cost also changes depending upon thematerials (quality) used by the farmers. Third, the terrain conditionand slope of the land also determine the capital requirement of thesystem. In view of these, we have considered the maximum per
24. It is to be noted here that the "net" and "core" potential areas for drip methodof irrigation are expected to change depending upon the land use pattern, croppattern, irrigated area and the level of groundwater exploitation. Given the overexploitation of groundwater in different parts of the country, the estimated po-tential area for drip method of irrigation might increase in future.

87
hectare capital cost required for each crop/crop group in order toestimate the total requirement for capital. In order to arrive at thetotal requirement of capital, we have multiplied the area of each cropwith per hectare capital requirement of that crop. Table 7.2 presentsthe total requirement of capital separately for "core potential" and"net potential" area of DMI. According to our estimate, the totalrequirement for capital comes to about Rs. 1,83,508 crore forutilising the "core potential" area of 51.42 mha and about Rs. 76,434crore for utilising the "net potential" area of 21.27 mha. That is, therequirement for capital per hectare comes to about Rs. 35,688 for"net potential" and about Rs. 35,935 for "core potential". This isconsidered to be much less when compared to the investmentrequired to create one hectare of irrigation under major and mediumirrigation (MMI) sector in India in the recent years (Narayanamoorthy,1995; Gulati, Svendson & Chowdhury, 1994).25
7.4 Potential Water Saving by Drip Method of Irrigation
Having estimated the potential area and the total requirement ofcapital for utilising the potential, we have tried to estimate thepotential water saving and the additional irrigated area possible fromthe saving of water for the country as a whole. In estimating thepotential water saving, only the "net potential" (those suitable cropswhich are cultivated presently under irrigated condition) area of DMIis considered. Though we have tried to estimate total water savingfor each crop, it was not be possible mainly due to non-availabilityof precise estimates of actual water consumption for certain crops.Therefore, the total water saving is estimated for certain groups ofcrops as well as for some individual crops. In estimating the watersaving for crop groups, the average water consumption of certainimportant crops from the same crop groups is considered. The actualconsumption of water per hectare under FMI and DMI for differentcrops is compiled from the report of INCID (1994). Table 7.3presents the estimated total potential water saving and the additionalirrigated area possible from the saving of water for different crops/crop groups.
25. An estimate shows that the investment required (in current prices) to create onehectare of irrigation in major and medium irrigation sector was Rs. 237729 in2001-02 (CWC, 1998).
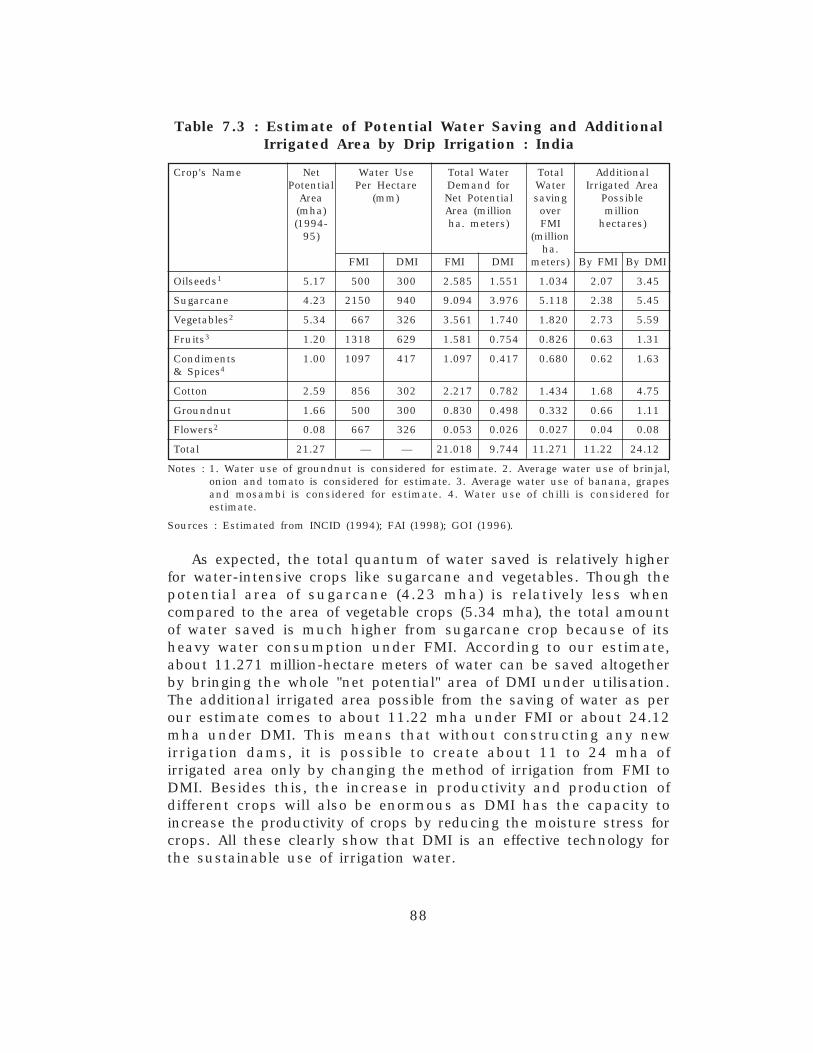
88
Table 7.3 : Estimate of Potential Water Saving and AdditionalIrrigated Area by Drip Irrigation : India
Crop's Name Net Water Use Total Water Total AdditionalPotential Per Hectare Demand for Water Irrigated Area
Area (mm) Net Potential saving Possible(mha) Area (million over million(1994- ha. meters) FMI hectares)
95) (millionha.
FMI DMI FMI DMI meters) By FMI By DMI
Oilseeds1 5.17 500 300 2.585 1.551 1.034 2.07 3.45
Sugarcane 4.23 2150 940 9.094 3.976 5.118 2.38 5.45
Vegetables2 5.34 667 326 3.561 1.740 1.820 2.73 5.59
Fruits3 1.20 1318 629 1.581 0.754 0.826 0.63 1.31
Condiments 1.00 1097 417 1.097 0.417 0.680 0.62 1.63& Spices4
Cotton 2.59 856 302 2.217 0.782 1.434 1.68 4.75
Groundnut 1.66 500 300 0.830 0.498 0.332 0.66 1.11
Flowers2 0.08 667 326 0.053 0.026 0.027 0.04 0.08
Total 21.27 — — 21.018 9.744 11.271 11.22 24.12
Notes : 1. Water use of groundnut is considered for estimate. 2. Average water use of brinjal,onion and tomato is considered for estimate. 3. Average water use of banana, grapesand mosambi is considered for estimate. 4. Water use of chilli is considered forestimate.
Sources : Estimated from INCID (1994); FAI (1998); GOI (1996).
As expected, the total quantum of water saved is relatively higherfor water-intensive crops like sugarcane and vegetables. Though thepotential area of sugarcane (4.23 mha) is relatively less whencompared to the area of vegetable crops (5.34 mha), the total amountof water saved is much higher from sugarcane crop because of itsheavy water consumption under FMI. According to our estimate,about 11.271 million-hectare meters of water can be saved altogetherby bringing the whole "net potential" area of DMI under utilisation.The additional irrigated area possible from the saving of water as perour estimate comes to about 11.22 mha under FMI or about 24.12mha under DMI. This means that without constructing any newirrigation dams, it is possible to create about 11 to 24 mha ofirrigated area only by changing the method of irrigation from FMI toDMI. Besides this, the increase in productivity and production ofdifferent crops will also be enormous as DMI has the capacity toincrease the productivity of crops by reducing the moisture stress forcrops. All these clearly show that DMI is an effective technology forthe sustainable use of irrigation water.

89
Chapter 8
Major Findings and Policy Recommendations
8.1 Introduction
Irrigation plays an important role in increasing the use of yieldincreasing inputs, cropping intensity and productivity of crops.However, owing to various reasons, not only the available water forirrigation purpose has been declining rapidly but the demand forirrigation water has been growing at a faster rate. In such scarcecondition, efficient use of irrigation water is an importance means toincrease the benefits of irrigation. It is understood that the floodmethod of irrigation widely practiced in India directly leads toinefficient use of water owing to enormous losses in evaporation anddistribution. Since efficient use of water is important for thesustainable agricultural development, different measures have beenintroduced to conserve water as well as to improve the efficiency inthe use of irrigation water. Unfortunately, the measures introducedfor increasing the water use efficiency could not bring any impressivechange so far.
Unlike flood method of irrigation, the water use efficiency isextremely high in drip method of irrigation. Since drip irrigationtechnology supplies water directly at the root zone of the cropsthrough a network of pipes, it substantially reduces the evaporation,conveyance and distribution losses of water and thus, the efficiencyof water use is very high. Available results in this regard show thatwater saving under drip method of irrigation ranges from 40 to 100percent (depending upon the crop) when compared to flood methodof irrigation. Results from research stations located in various part ofIndia have shown that drip irrigation increases crop yield significantlyand that too with reduced cost of cultivation when compared to floodmethod of irrigation. Some of the field level studies carried out inhorticultural crops do confirm that drip method of irrigation reducesthe cost of cultivation and significantly increases water use efficiencyas well as productivity. Besides water saving and productivity gains,drip irrigation has quite a number of other advantages.
Despite enormous advantages from drip method of irrigation, notmany comprehensive studies are available using field level datafocusing on different crops. Most of the available studies in thisrespect have been carried out using the data supplied by the
90
experimental research stations or relied on the experience of one orfew farmers adopting drip method of irrigation. It is obvious that theexperimental data may not completely reflect the farm level positionas the environmental conditions under which crops are grown aretotally different between the two situations. Keeping in view thelimitations of the studied based on experimental data, in this study,an attempt is made to investigate the impact of drip method ofirrigation on different parameters of crops using both experimentaland field level data.
8.2 Major Findings of the Study
1. Due to various promotional schemes introduced by theGovernment of India and States like Maharashtra, the areaunder drip method of irrigation has increased from 1500 ha in1985-86 to 70589 ha in 1991-92 and further to 4.50 lakhhectares at the end of March 2003. Though drip method ofirrigation has been in operation over the last two decades, it isessentially considered as a scheme of government. As of 1997-98, area under DMI other than government schemes (withoutsubsidy) accounted for only about 18 percent of India's totaldrip irrigated area.
2. Over the last ten years, a significant growth has been achievedin area under drip method of irrigation in absolute term inmany States. However, drip irrigated area constitutes a verymeagre percentage in relation to gross irrigated area in all thestates in India. During 2000-01, the share of drip-irrigated areato gross irrigated area was just 0.48 percent and about 1.09percent in relation to total groundwater irrigated area of thecountry.
3. State-wise area under drip method of irrigation pertaining tothree time points namely 1991-92, 1997-98 and 2000-01 showsa substantial improvement in the adoption of this new irrigationtechnology across the states. However, the development of dripmethod of irrigation is not uniform across different states. In allthe three time points, Maharashtra state alone accounted fornearly 50 percent of the India's total drip irrigated area followedby Karnataka, Tamil Nadu and Andhra Pradesh. There aremany reasons for the rapid development of drip irrigation inMaharashtra. First, state government is very keen in promotingdrip irrigation on a large scale by providing subsidy, technicaland extension services to the farmers. Maharashtra government

91
has been providing subsidy since 1986-87 onwards throughstate schemes. Second, area under irrigation from both surfaceand groundwater is quite low and hence, many farmers haveadopted drip method of irrigation to avoid water scarcity largelyin divisions like Nashik, Pune, etc. Third, owing to continuousdepletion of groundwater, farmers were not able to cultivatewide spaced and more lucrative crops like grapes, banana,pomegranate, orange, mango, etc., using surface method ofirrigation in many regions. As a result, farmers had to adoptdrip irrigation as these crops are most suitable for drip methodof irrigation. Importantly, the farmers who adopted drip irrigationinitially for certain crops have realised the importance of dripirrigation in increasing the water saving and productivity ofcrops. This has further induced many farmers to adopt dripmethod in some of the regions in Maharashtra.
4. Water saving and improved water use efficiency are the twoimportant advantages of drip method of irrigation. According tothe experimental data from different research stations located inIndia, water saving due to drip method of irrigation varies from12 to 84 percent over the conventional method of irrigation invegetable crops. In fruit crops, water saving varies from 45 to81 percent. In sugarcane, which is a water-intensive crop, watersaving is estimated to be over 65 percent due to drip method ofirrigation (summary results of the study are presented in Table8.1).
5. The results of field level data pertaining to three crops namelysugarcane, banana and grapes are somewhat different from theexperimental results. The pattern of water use for crops istotally different between the two methods of irrigation. The dripadopters have applied more number of irrigation per hectarewhen compared to the non-drip adopters in all the three cropsconsidered for the analysis. However, hours required perirrigation to irrigate per hectare of sugarcane, grapes andbanana are significantly less for the drip adopters as comparedto the non-drip adopters.
6. Water consumption (in quantity) per hectare is much less underdrip method of irrigation as compared to flood method ofirrigation in all the three crops. Water saving in sugarcane dueto drip method of irrigation is about 44 percent, while the sameis estimated to be about 37 percent in grapes and 29 percentin the case of banana.

92
7. Additional area can also be brought under irrigation from thesaving of water realised through the adoption of drip method ofirrigation. The additional irrigated area possible from the savingof water is estimated to be 0.80 (1.98 acres) in sugarcane, 0.60ha (1.48 acres) in grapes and 0.41 ha (1.01 acres) in banana.
8. Water use efficiency (i.e., water consumed to produce one unitof crop output) is also significantly higher in drip-irrigated cropswhen compared to the same crops cultivated under non-dripirrigated condition. Sugarcane cultivated under drip method ofirrigation consumes only 1.28 horse power (HP) hours of waterto produce one quintal of sugarcane as against 2.83 HP hoursof water under flood method of irrigation, i.e., about 1.55 HPhours of additional water is consumed to produce one quintalof sugarcane under flood method of irrigation. Banana cropunder DMI consumes only 11.60 HP hours of water to produceone quintal of output as against the use of 21.14 HP hours ofwater under non-drip irrigated condition. In grapes, eachquintal of output involves the use of just 13.60 HP hours ofwater under DMI as compared to the use of 25.84 HP hours ofwater under non-drip irrigated condition.
9. Saving in electrical energy use (for lifting water from wells) isone of the important advantages of drip method of irrigation.While the researchers have not estimated the saving ofelectricity using experimental data, we have estimated electricityconsumption using the field level data for both the drip and thenon-drip irrigated crops. Consumption of electricity per hectareis quite low for drip-irrigated crops when compared to the samecrops cultivated with flood method of irrigation. Farmerscultivating sugarcane under drip method of irrigation could saveabout 1059 kwh of electricity per hectare as compared to thosefarmers cultivating the same crop under flood method ofirrigation. Similarly, while the farmers cultivating grapes couldsave about 1476 kwh/ha due to DMI, the same is estimated tobe about 2434 kwh/ha in banana over the farmers who havecultivated these crops under FMI.
10. Efficiency in electricity use, which is measured in terms ofrequirement of electricity to produce one unit of output, is alsosignificantly less under drip method of irrigation in all threecrops considered for the analysis. On an average, sugarcanecultivators under drip method of irrigation used about 0.958kwh to produce one quintal of sugarcane as against the non-
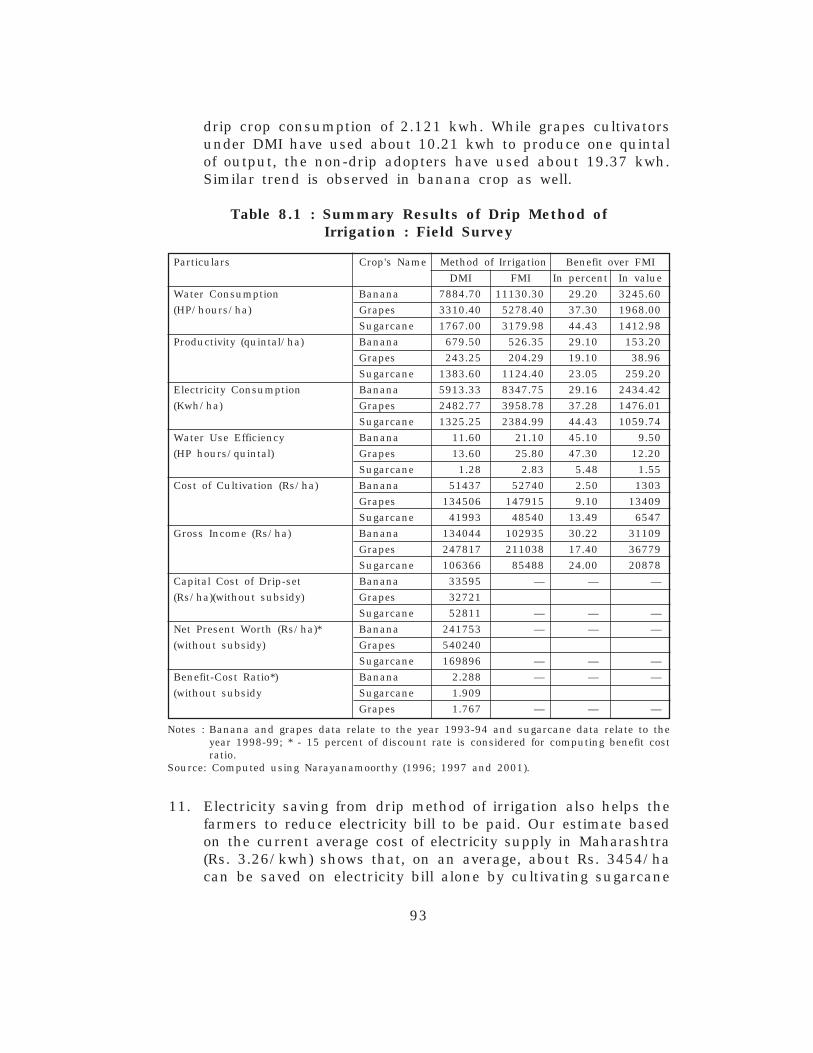
93
drip crop consumption of 2.121 kwh. While grapes cultivatorsunder DMI have used about 10.21 kwh to produce one quintalof output, the non-drip adopters have used about 19.37 kwh.Similar trend is observed in banana crop as well.
Table 8.1 : Summary Results of Drip Method ofIrrigation : Field Survey
Particulars Crop's Name Method of Irrigation Benefit over FMI
DMI FMI In percent In value
Water Consumption Banana 7884.70 11130.30 29.20 3245.60
(HP/hours/ha) Grapes 3310.40 5278.40 37.30 1968.00
Sugarcane 1767.00 3179.98 44.43 1412.98
Productivity (quintal/ha) Banana 679.50 526.35 29.10 153.20
Grapes 243.25 204.29 19.10 38.96
Sugarcane 1383.60 1124.40 23.05 259.20
Electricity Consumption Banana 5913.33 8347.75 29.16 2434.42
(Kwh/ha) Grapes 2482.77 3958.78 37.28 1476.01
Sugarcane 1325.25 2384.99 44.43 1059.74
Water Use Efficiency Banana 11.60 21.10 45.10 9.50
(HP hours/quintal) Grapes 13.60 25.80 47.30 12.20
Sugarcane 1.28 2.83 5.48 1.55
Cost of Cultivation (Rs/ha) Banana 51437 52740 2.50 1303
Grapes 134506 147915 9.10 13409
Sugarcane 41993 48540 13.49 6547
Gross Income (Rs/ha) Banana 134044 102935 30.22 31109
Grapes 247817 211038 17.40 36779
Sugarcane 106366 85488 24.00 20878
Capital Cost of Drip-set Banana 33595 — — —
(Rs/ha)(without subsidy) Grapes 32721
Sugarcane 52811 — — —
Net Present Worth (Rs/ha)* Banana 241753 — — —
(without subsidy) Grapes 540240
Sugarcane 169896 — — —
Benefit-Cost Ratio*) Banana 2.288 — — —
(without subsidy Sugarcane 1.909
Grapes 1.767 — — —
Notes : Banana and grapes data relate to the year 1993-94 and sugarcane data relate to theyear 1998-99; * - 15 percent of discount rate is considered for computing benefit costratio.
Source: Computed using Narayanamoorthy (1996; 1997 and 2001).
11. Electricity saving from drip method of irrigation also helps thefarmers to reduce electricity bill to be paid. Our estimate basedon the current average cost of electricity supply in Maharashtra(Rs. 3.26/kwh) shows that, on an average, about Rs. 3454/hacan be saved on electricity bill alone by cultivating sugarcane
94
crop under drip method of irrigation. Similarly, farmerscultivating grapes and banana under DMI can also saveRs. 4811 and Rs. 7934/ha respectively on account of electricitycost.
12. Besides water and electricity saving, reduction in cost ofcultivation and improvement in productivity are the two otheradvantages of drip method of irrigation. Since the cost ofcultivation details for different crops cultivated under DMI arenot available from experimental data, the study utilised only thefield level data pertaining to three above-mentioned crops.Cost of cultivation (cost A2) per hectare of the adopters is foundto be relatively less when compared to the non-adopters of dripirrigation in all three crops. The cost saving in sugarcane cropdue to DMI is nearly 14 percent (in absolute term Rs. 6550/ha). Farmers who cultivated grapes and banana under DMIhave incurred relatively lower cost of cultivation. In case ofbanana, drip irrigation reduces the total cost of cultivation byabout Rs. 1300/ha (2.47 percent) as compared to the farmerswho cultivated the same crop under flood method of irrigation.In case of grapes, cost saving due to DMI is found to be Rs.13408/ha (about 9 percent). Though the reduction in cost ofcultivation in terms of percentage is relatively less, cost savingis found to be very high in operations like irrigation, weedingand interculture, furrows and bunding and fertilisers.
13. Productivity of crops cultivated under drip method of irrigationis significantly higher than the same crops cultivated underflood method of irrigation. Experimental data show thatproductivity increase due to DMI is over 40 percent in vegetablecrops such as bottle gourd, potato, onion, tomato and chillies.Productivity increase due to DMI is noticed over 70 percent inmany fruit crops. In sugarcane, the productivity gain isestimated to be over 33 percent. Similar kind of productivitygains is also noticed in different crops cultivated underexperimental condition.
14. Similar to experimental results, considerable amount ofproductivity gain is also noted from the analysis of farm leveldata. The productivity difference in absolute term between theadopters and the non-adopters of drip method of irrigationcomes to nearly 259 quintals per hectare for sugarcane, i.e.,productivity of sugarcane cultivated under drip method ofirrigation is higher by about 23 percent. In case of grapes, the

95
productivity difference between DMI and FMI irrigated cropscomes to about 19 percent (about 39 quintals) and the samecomes to 29 percent (about 153 quintals) in case of bananacrop. In spite of incurring higher cost on yield increasinginputs, productivity of crops cultivated under FMI is significantlylower than that of DMI. There are three main reasons forhigher yield in drip-irrigated crops. First, because of lessmoisture stress, the growth of crop was good which ultimatelyhelped to increase the productivity of crops. Second, unlikesurface method of irrigation, drip does not encourage anygrowth of weed especially in the non-crop zone. Weeds consumeconsiderable amount of yield increasing inputs and reduce theyield of crops in surface method of irrigation. Third, unlikesurface method of irrigation, fertiliser losses occurring throughevaporation and leaching along with water are less under dripmethod of irrigation as it supplies water only for crop and notfor the land.
15. Cost efficiency (i.e., cost incurred to produce one unit of output)is also found to be significantly higher for the drip adopterswhen compared to the non-drip adopters in all three crops.The non-drip adopters have incurred nearly three rupees overthe adopters of drip method of irrigation to produce everyquintal of sugarcane. In grapes, the non-adopters have incurredover Rs. 171 per quintal of output over the adopters. In banana,the non-adopters have incurred nearly Rs. 30 to produce onequintal of output over the counterpart. This higher cost efficiencyis possible mainly because of significant increase in productivityof crops due to drip method of irrigation.
16. The undiscounted profit per hectare (gross income minus costA2) of the drip adopters is significantly higher than that of thenon-drip adopters in all three crops analysed utilising field leveldata. Profit of the adopters in sugarcane is Rs. 27424/hahigher than that of the non-drip adopters. In grapes, the profitlevel of the drip adopters is Rs. 50187/ha higher than that ofthe non-adopters and for banana, the same is aboutRs. 32400/ha. The study also noted that the huge profit fromdrip irrigation is not because of price effect, but only due to theyield effect in all the three crops.
17. The capital cost required for installing drip investment fordifferent crops has been increasing over the years due toincrease in the cost of materials used for manufacturing drip

96
system. The capital cost of drip system largely depends uponthe type of crop (narrow or wide spaced crops), spacing followedfor cultivating crops, proximity to water source (distancebetween the field and source of water) and the materials usedfor the system. Wide spaced crops generally require less capitalwhen compared to the crops with narrow space, as the lattercrops would require more laterals and drippers per hectare. Dataavailable in INCID (1994) report shows that the requirement ofcapital cost is much higher for banana (Rs. 33765/ha) ascompared to the same required for mango (Rs. 11053/ha),which is a wide spaced crop.
18. Field level data pertaining to sugarcane, banana and grapesalso shows a wide variation in the requirement of capital costneeded for drip irrigation system. While the capital cost withoutsubsidy comes to Rs. 52811/ha for sugarcane, the same comesto Rs. 32721/ha for grapes and Rs. 33595/ha for banana. Theaverage capital subsidy comes to Rs. 19263/ha for sugarcane,Rs. 11359/ha for grapes and Rs. 12620/ha for banana. As aproportion of the total capital cost of drip set, subsidy amountaccounts for about 35 to 37 percent, which is within a limit ofprovision made by the Government of Maharashtra.
19. As regards Benefit-Cost (B-C) ratio, the results available fromINCID (1994) show that investment in drip method of irrigationis economically viable, even if it is estimated without taking intoaccount subsidy given to farmers. The B-C ratio estimatedexcluding water saving varies from 1.31 in sugarcane to 13.35in grapes. The B-C ratio increases significantly further, when itis estimated after including water saving. Sivanappan (1995)also estimated B-C ratio for different crops cultivated underDMI using data pertaining to the year 1993. It also indicatesthat the investment in drip irrigation is economically viable, asB-C ratio estimated for different crops comes to more than one.While the B-C ratio for pomegranate is estimated to be 5.16,the same is estimated to be 1.83 for cotton, which is a less-water intensive as well as a narrow spaced crop. However, itwas not clear whether the B-C ratio available from the studiesof INCID and Sivanappan is estimated using discounted cashflow technique.
20. The economic viability of drip investment is also studied usingdiscounted cash flow technique under with and without subsidyconditions, using field level data pertaining to three crops.
97
Different discount rates considered for analysis are 10, 12 and15 percent. The estimated results show that the Net PresentWorth (NPW) of the investment with subsidy is marginallyhigher than that under 'no subsidy' option in all three crops.The year-wise calculation of NPW also shows that drip adopterscan realise the whole capital cost of drip-set from the profit ofthe very first year itself.
21. Under different discount rates, the benefit-cost ratio (BCR) iscomputed to know whether the drip investment for three cropsis economically viable or otherwise. The estimated benefit-costratio is much higher than one under different discount rateseven without subsidy. While the B-C ratio in sugarcane variesfrom 1.909 to 2.095 under without subsidy condition, the samevaries from 2.098 to 2.289 under with subsidy condition. Incase of banana, the B-C ratio varies from 2.228 to 2.253 underwithout subsidy condition and 2.343 to 2.361 under withsubsidy condition. Similarly, in grapes, the B-C ratio withoutsubsidy varies from 1.767 to 1.778 and from 1.795 to 1.802with subsidy. The higher BCR under subsidy condition suggeststhe positive role that subsidy plays in improving the economicviability of drip method of irrigation.
22. India has enormous potential for drip method of irrigation. Ourattempt made in this study to estimate the potential andprospects for drip method of irrigation shows that while "corepotential" (suitable crops that are cultivated under irrigated andnon-irrigated conditions) comes to 51.42 mha, the "netpotential" (suitable crops that are cultivated only under irrigatedconditions) comes to 21.27 mha for the country as a whole.The requirement for capital to utilise the "core" and "netpotential" areas is estimated to be about Rs. 183508 crore andRs. 76434 crore respectively. That is, the requirement of capitalper hectare comes to about Rs. 35688 for "net potential" andRs. 35935 for "core potential". By utilising the "net potential"area of DMI, an amount of about 11.271 million-hectare meterof water can be saved. The additional irrigated area possiblefrom the saving of water is estimated to be 11.22 mha underFMI or about 24.12 mha under DMI.
8.3 Policy Recommendations
The findings of the study clearly demonstrate that micro irrigationhas a macro future in India. Drip method of irrigation reduces cost

98
of cultivation, weed problems, soil erosion and increases water useefficiency as well as electricity use efficiency, besides performing asan useful devise in reducing the over-exploitation of groundwater.However, despite providing substantial amount of subsidy, the spreadand coverage of drip irrigation in India is not very encouraging as oftoday due to various reasons. We have listed below some policyrecommendations, which may be useful for expanding the adoptionof drip method of irrigation in India.
1. It is understood from our field study that capital cost requiredto install drip irrigation is relatively high. Because of thisreason, considerable percentage of farmers have expressed thatthey are unable to adopt this technology for low value crops.If drip system is made available with low cost, area under dripirrigation can be increased at a faster rate. Therefore, measurescan primarily be taken to reduce the fixed cost of drip irrigationby promoting research and development activities. By recognizingdrip industry as an infrastructure industry as well asannouncing tax holiday for specific time periods to all those dripset industries which produce genuine drip materials, thecompetition can be increased that will ultimately bring downthe cost of the system. Some companies have come out withlow cost drip irrigation system which can be adopted even bythe farmers having less than one acre of land. Studies need tobe carried out to find out the feasibility of low cost dripmaterials including its environment feasibility using field leveldata.
2. The centrally sponsored scheme of drip irrigation does notprovide subsidy for sugarcane crop. The logic behind this is notclearly known. Since it is an important and also a heavy water-consuming crop, this restriction should be removed to increasethe drip irrigated area at a faster rate. This would alsoultimately help to reduce the water crisis faced by variousStates to some extent.
3. The rate of subsidy provided through government schemes isfixed uniformly for both water-intensive as well as less water-intensive crops. This needs to be restructured. Special subsidyprogramme may be introduced for water-intensive crops likesugarcane, banana, vegetables, etc. Differential subsidy ratescan be fixed based on the types of crops and the rate ofconsumption of water. Uniform level of subsidy schemescurrently followed for water-scarce and water-abundant areas
99
need to be changed and higher subsidy should be provided forthose regions where the scarcity of water is acute.
4. Though there was no delay in sanctioning subsidy, MaharashtraState's experience indicates that farmers have to wait at leastsix months to receive the amount of subsidy from the concerneddepartment. This increases farmers' debt burden as majority ofthe farmers use bank loan for installing drip system in theirfield. In order to encourage the adoption of drip technology,adequate arrangements should be made to distribute theamount of subsidy within one or two months.
5. Sugar industries always try to increase the area undersugarcane to increase their capacity utilisation in almost all theStates in India. They are least bothered about the method ofcultivation of sugarcane. Since sugar industries have closecontact with sugarcane cultivators, some kind of target may befixed for each sugar industry to bring cultivation of sugarcaneunder drip method of irrigation. Apart from saving of water, thiswould also help to achieve cultivation of sugarcane in sustain-able manner. Despite irrigation water shortage in many States,not only does the area under sugarcane continue to grow at arelatively faster rate, but it is cultivated predominantly underflood method of irrigation. This puts additional pressure onwater resources. In order to avoid huge demand-supply gap inirrigation water in future, concerted policies should be formu-lated to bring all possible areas of sugarcane under dripmethod of irrigation.
6. Farmers have inadequate knowledge regarding the usefulness ofliquid fertilisers. Though a few farmers in our field study haveused liquid fertilisers along with water, most of the farmers areafraid to use liquid fertilisers through drip pipe network. Theyfeel using liquid fertilisers through water may lead to systemclogging. This fear of the farmers should be removed byintroducing regular and frequent demonstration. Importance ofliquid fertilisers in increasing input efficiency and reducing thecost of cultivation should be clearly demonstrated to the farmersby the extension officials.
7. Inadequate information about the operation, maintenance andusefulness of drip irrigation is one of the main reasons for itsuneven spread across regions in India. Farmers still do nothave full knowledge regarding the usefulness of drip irrigation.
100
Even the adopters do not know fully how much of subsidy isavailable per hectare for different crops. Owing to poor exposure,farmers are reluctant to invest such huge money on dripirrigation. In fact, many farmers do not know the fact that dripirrigation can also be used efficiently and economically for cropslike sugarcane, cotton, vegetables, etc. Giving wide publicity andstrengthening the existing extension services can remove theseproblems. The extension network currently operated mainly bygovernment agencies does not seem to be making significantimpact on the adoption of this technology. Therefore, there is aneed to revamp the whole extension network by involving thedrip set manufactures in order to increase the quality ofextension service.
8. Drip sets manufacturers should be asked to involve intensivelyin promoting drip irrigation by introducing frequent demonst-ration at farmers' field. Since the use of drip method of irrigationis still in the take-off stage in India, active role of drip manu-facturers' is essential in promoting drip irrigation as well asdeveloping confidence among the farmers about the usefulnessof this new technology.
9. For a speedy growth of drip irrigation, a special package schemecan be introduced where priority can be given in providingbank loan for digging wells and electricity connection (pump-set)for those farmers who are ready to adopt drip method ofirrigation for cultivating any crop.
10. Groundwater is the only source of water being used for dripmethod of irrigation in India. Unlike other countries, water fromsurface sources (dams, reservoirs, etc) is not used for dripmethod of irrigation. Since water use efficiency under surfacesources is very low owing to heavy losses through conveyanceand distribution, farmers should be encouraged to use waterfrom surface sources for drip method of irrigation. This can bedone by allocating certain proportion of water from eachirrigation projects only for the use of micro irrigation.
11. One of the important reasons for the low spread of this techno-logy even in the water-scarce area is the availability of highlysubsidized canal water as well as electricity for irrigationpumpsets. Appropriate pricing policies on these two inputs mayencourage the farmers to adopt this technology.
101
12. Though drip irrigation has been in use in different States sincemid-eighties, Statewise potential area is not estimated as oftoday. Therefore, it is essential to prepare State-wise and crop-wise potential area for DMI. A detailed estimate on State-wisepotential would be useful to fix the target to be achieved andalso for formulating schemes for promoting drip method ofirrigation.
13. Except in Maharashtra and Andhra Pradesh, no other state hasseparate state sponsored schemes for promoting drip irrigationas of today. All other states have been operating schemes mainlywith the support of Central government (which is known ascentrally sponsored schemes), which started in 1990-91.Considering the water shortage, it is essential to have separateState sponsored schemes in each state by following theexperience of Maharashtra state.
8.4 Concluding Remarks
There is a feeling among some quarter of policy makers andresearchers that the adoption of drip method of irrigation cannot beincreased without providing subsidy because of its capital-intensivenature. It is true that drip irrigation is a capital-intensive technology,but it does not mean that its adoption of cannot be increasedwithout subsidy. Subsidy can be a necessary condition forencouraging the adoption of drip method of irrigation but cannot bea sufficient condition for sustaining the growth of it, as many otherfactors determine the adoption of the same. Studies carried outusing field level data from Maharashtra on three crops clearly showthat the investment on drip irrigation is economically viable evenwithout government subsidy. The estimated benefit-cost (BC) ratiovaries from 1.73 to 2.23 among the three crops under withoutsubsidy condition. Even though subsidy is not needed to enhancethe economic viability of the drip system, it is still needed to enhancethe incentive for the widespread adoption of DMI particularly amongthe resource poor farmers (marginal and small categories). Subsidycan be phased out eventually once the new irrigation technologycovered an adequate enough to expand subsequently through thedemonstration effect.
The most important task standing before the policy makers is tofind out the ways and means to convince the farmers about theeconomic and social feasibility of drip method of irrigation. Since itinvolves relatively higher amount of investment, farmers often ask

102
the questions such as what will be the payback period? Whetherinvestment will be viable? How much will be the water saving? andWhat will be the productivity gains? It appears that these questionsarise mainly because of poor exposure about the social andeconomic advantages of drip technology. Therefore, efforts are neededto convince the farmers through quality extension network, as India'shighly successful green revolution was also the result of extensioninnovations as much as technology. As the available water forirrigation purpose has been declining drastically, we need to actquickly in adopting water saving technologies otherwise we may endwith severe water scarcity before the year of 2020, as indicated bymacro-level estimates.

103
References
AERT and DSI (1988), Techno-Economic Feasibility Study of Drip Irrigation withSpecial Reference to Sugarcane, Agri-Energy Round Table (AERT), India andDeccan Sugar Institute (DSI), Pune.
AFC (1998), Evaluation of Drip Irrigation System, Agricultural Finance Corporation(AFC) Limited, Mumbai, October.
Agarwal, Bina (1983), Mechanisation in Indian Agriculture: An Analytical Study basedon the Punjab, Allied Publishers, New Delhi.
Alagh, Y.K. (1988), “Pesticides in Indian Agriculture”, Economic and Political Weekly,September 17, pp. 1959-1964.
Alstorm, Styrbjorn (1980), Fundamentals of Weed Management in Hot ClimatePeasant Agriculture, Crop Science, Department of Crop Production Science,Swedish University of Agricultural Sciences, Uppasala, Sweden.
Batta, R.K. and S.R. Singh (1998), “Adoption of Drip Irrigation in Sugarcane inIndia”, in Varma and Rao (Eds.), pp. VII 27 – VII 45.
Bhalla, G.S.; Peter Hazell and John Kerr (1999), Prospects for India’s Cereal Supplyand Demand to 2020, Food, Agriculture and the Environment DiscussionPaper 29, International Food Policy Research Institute, Washington D.C.,U.S.A., November.
Bhalla, G.S. and Gurmail Singh (2001), Indian Agriculture: Four Decades ofDevelopment, Sage Publications Private Limited, New Delhi.
Bhattarai, M and A. Narayanamoorthy (2003), “Impact of Irrigation on Rural Povertyin India: An Aggregate Panel-Data Analysis”, Water Policy, Vol. 5, Nos.5-6,pp. 443-458.
Biswas, A.K (1993), “Water for Sustainable Development in the Twenty-FirstCentury: A Global Perspective”, in Biswas, A.K.; M. Jellali and G. Stout(Eds.), Water for Sustainable Development in the 21st Century, WaterResources Management Series: 1, Oxford University Press, Delhi.
Biswas, A.K. (2001), “Water Policies in Developing World”, Water ResourcesDevelopment, Vol. 17, No. 4, pp. 489-499.
Central Board of Irrigation and Power (CBIP) (1993), Proceedings: Workshop onSprinkler and Drip Irrigation Systems, New Delhi.
Chaudhary, T.N. (1995), “INDIA”, in Asian Productivity Organisation, AgriculturalWater Management Technology in Asia and the Pacific, Asian ProductivityOrganisation, Tokyo, pp. 162-164.
Chaudhri, D.P. (1979), Education, Innovation and Agricultural Development: A Study ofNorth India (1961-72), Vikas Publisher, New Delhi.
Chopra, Kanchan (1996), “The Magnitude of Degraded Land: Issues and Analysis ofTechnological and Institution Solutions”, Indian Journal of AgriculturalEconomics, Vol.51, Nos.1 and 2, January-June, pp.238-248.
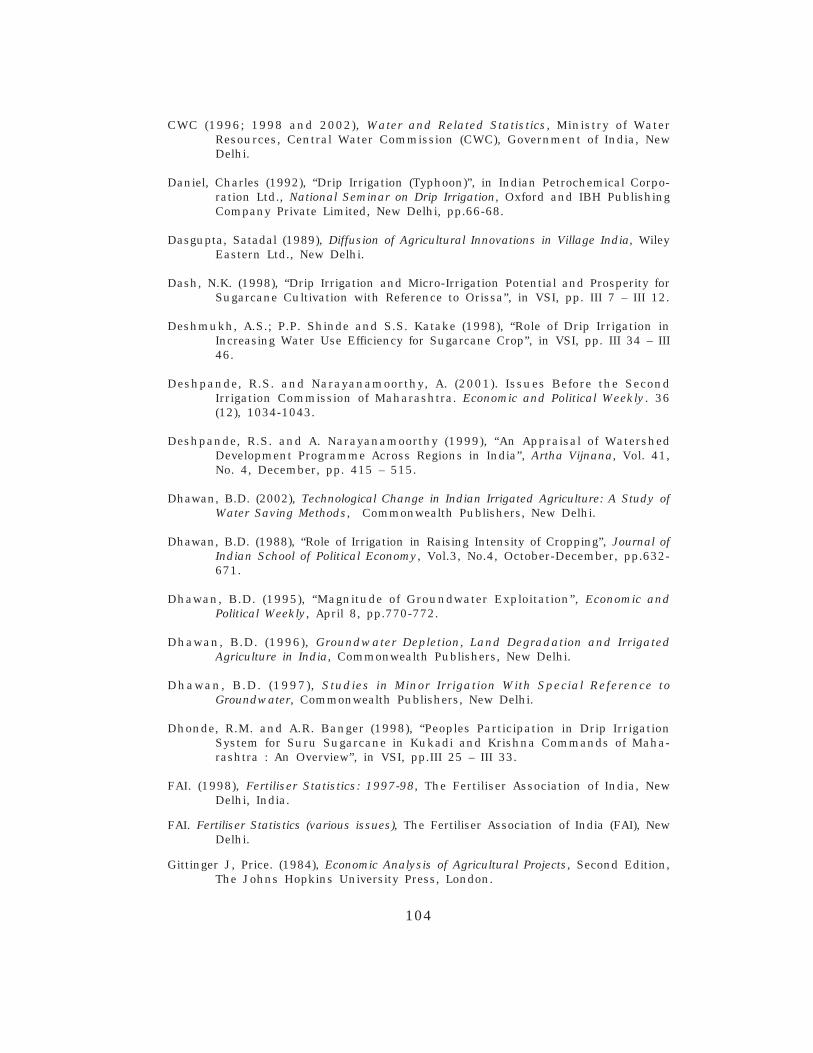
104
CWC (1996; 1998 and 2002), Water and Related Statistics, Ministry of WaterResources, Central Water Commission (CWC), Government of India, NewDelhi.
Daniel, Charles (1992), “Drip Irrigation (Typhoon)”, in Indian Petrochemical Corpo-ration Ltd., National Seminar on Drip Irrigation, Oxford and IBH PublishingCompany Private Limited, New Delhi, pp.66-68.
Dasgupta, Satadal (1989), Diffusion of Agricultural Innovations in Village India, WileyEastern Ltd., New Delhi.
Dash, N.K. (1998), “Drip Irrigation and Micro-Irrigation Potential and Prosperity forSugarcane Cultivation with Reference to Orissa”, in VSI, pp. III 7 – III 12.
Deshmukh, A.S.; P.P. Shinde and S.S. Katake (1998), “Role of Drip Irrigation inIncreasing Water Use Efficiency for Sugarcane Crop”, in VSI, pp. III 34 – III46.
Deshpande, R.S. and Narayanamoorthy, A. (2001). Issues Before the SecondIrrigation Commission of Maharashtra. Economic and Political Weekly. 36(12), 1034-1043.
Deshpande, R.S. and A. Narayanamoorthy (1999), “An Appraisal of WatershedDevelopment Programme Across Regions in India”, Artha Vijnana, Vol. 41,No. 4, December, pp. 415 – 515.
Dhawan, B.D. (2002), Technological Change in Indian Irrigated Agriculture: A Study ofWater Saving Methods, Commonwealth Publishers, New Delhi.
Dhawan, B.D. (1988), “Role of Irrigation in Raising Intensity of Cropping”, Journal ofIndian School of Political Economy, Vol.3, No.4, October-December, pp.632-671.
Dhawan, B.D. (1995), “Magnitude of Groundwater Exploitation”, Economic andPolitical Weekly, April 8, pp.770-772.
Dhawan, B.D. (1996), Groundwater Depletion, Land Degradation and IrrigatedAgriculture in India, Commonwealth Publishers, New Delhi.
Dhawan, B.D. (1997), Studies in Minor Irrigation With Special Reference toGroundwater, Commonwealth Publishers, New Delhi.
Dhonde, R.M. and A.R. Banger (1998), “Peoples Participation in Drip IrrigationSystem for Suru Sugarcane in Kukadi and Krishna Commands of Maha-rashtra : An Overview”, in VSI, pp.III 25 – III 33.
FAI. (1998), Fertiliser Statistics: 1997-98, The Fertiliser Association of India, NewDelhi, India.
FAI. Fertiliser Statistics (various issues), The Fertiliser Association of India (FAI), NewDelhi.
Gittinger J, Price. (1984), Economic Analysis of Agricultural Projects, Second Edition,The Johns Hopkins University Press, London.

105
GOI. (1996), Indian Agricultural Statistics, New Delhi, Ministry of Agriculture,Government of India, India.
GOI. (1992), Report of the Committee on Pricing of Irrigation Water, (Chairman: A.Vaidyanathan). Planning Commission, New Delhi, September.
GOI. (1994), Report of Task Force on Microirrigation, (Chairman: N. ChandrababuNaidu), Ministry of Agriculture, Government of India, January.
GOI. (2000), Agricultural Statistics at a Glance: 2000, Directorate of Economics andStatistics, Ministry of Agriculture, New Delhi.
GOI. (various years), Area, Production of Principal Crops in India, Directorate ofEconomics and Statistics, Ministry of Agriculture, New Delhi.
GOI. (various years), Indian Agricultural Statistics, Directorate of Economics andStatistics, Ministry of Agriculture, New Delhi.
GOM. (various years), District-wise Agriculture Statistical Information of Maharashtra,Commissionerate of Agriculture, Government of Maharashtra, Pune.
GOM. (2003), Economic Survey of Maharashtra: 2002-03, Planning Department,Government of Maharashtra, Mumbai.
Gulati, Ashok; Mark Svendson and Nandini Roy Chowdhury (1994), “Major andMedium Irrigation Schemes: Towards Better Financial Performance”,Economic and Political Weekly, Vol.29, No.26, pp. A72 – A79.
Hapase, D.G.; A.S. Deshmukh and P.P. Shinde (1993), “Micro-Irrigation inSugarcane Agriculture”, in CBIP, pp. 86-89.
Holsambre, D.G.; B.M. Sahni and P.S. Bhalage (1998), “Developing Interface ofPressurised Irrigation in Canal Command in Maharashtra”, in Varma, C.V.J.and A.R.G. Rao (Eds.), pp. VII 46 – VII 64.
INCID. (1994), Drip Irrigation in India, Indian National Committee on Irrigation andDrainage, New Delhi.
Iyer, Ramasamy, R. (2003), Water: Perspectives, Issues, Concerns, Sage Publications,New Delhi.
Kulkarni, S.Y. (1987), “Sprinkler and Drip Irrigation System”, Sinchan, No.3,October, pp.56-61.
Kumar, P and V.C. Mathur (1996), “Agriculture in Future: Demand-SupplyPerspective for the Ninth Five-Year Plan”, Economic and Political Weekly, Vol.31, No. 29, September 28, pp. A131-A139.
Magar, S.S. et al., (1988), “Importance of Drip Irrigation”, Sinchan, No.2, July,pp.61-62.
Menon K, Amernath (1995), “Micro Irrigation: Profits in the Pipeline”, India Today,May 15, p.20.
106
Moench, Marcus (1994), Groundwater Policy: Issues and Alternatives in South Asia,National Heritage Institute, San Francisco, U.S.A.
Moench, Marcus and Dinesh Kumar (1997), “Distinction Between Efficiency andSustainability”, in Anil Agarwal (ed.), The Challenge of the Balance:Environmental Economics in India, Centre for Science and Environment, NewDelhi, pp.305-309.
Moench, Marcus, (1992), “Drawing Down the Buffer: Science and Politics ofGroundwater Management in India”, Economic and Political Weekly, Vol.27,No.13, March 28, pp. A7 – A14.
MOWR (1999), Report of the Working Group on Water Availability for Use, NationalCommission for Integrated Water Resources Development Plan, Ministry ofWater Resources, Government of India, New Delhi.
NABARD. (1989), Sprinkler Irrigation in Semi-Arid Areas of Rajasthan: An Ex-PostEvaluation Study, Evaluation Study Series, No.36, National Bank forAgriculture and Rural Development, Bombay.
Nadkarni, M.V. (1996), “Agriculture and Environment”, in M.S. Rathore (ed.),Environment and Development, Ravat Publishers, Jaipur, pp. 45-57.
Nagaraj, N and M.G. Chandrakanth (1995), “Low Yielding Irrigation Wells inPeninsular India: An Economic Analysis”, Indian Journal of AgriculturalEconomics, Vol.50, No.1, January-March, pp.47-58.
Narayanamoorthy, A and S. S. Kalamkar (2004), Agricultural Policy in Maharashtra:A Policy Matrix, Agro-Economic Research Centre, Gokhale Institute of Politicsand Economics, Pune, May.
Narayanamoorthy, A and R. S. Deshpande (2003), “Irrigation Development andAgricultural Wages: An Analysis Across States”, Economic and PoliticalWeekly, Vol. 38, No. 35, August 30, pp. 3716-3722.
Narayanamoorthy, A. & R. S. Deshpande (1997), Economics of Drip Irrigation: AComparative Study of Maharashtra and Tamil Nadu, Mimeograph Series No.47, Agro-Economic Research Centre, Gokhale Institute of Politics andEconomics, Pune, India.
Narayanamoorthy, A. (1992), “Impact of Tractors and Weedicides on Yield andEmployment in Sugarcane Cultivation, Journal of Rural Development, Vol.11,No.3, May, pp. 351-362.
Narayanamoorthy, A. (1995), “Electric Pumpset and Groundwater Management:Macro and Micro Evidence”, The Asian Economic Review, Vol.37, No.1, April,pp. 87-110.
Narayanamoorthy, A. (1995c), “Status of Indian Irrigation”, Man and Development,Vol.17, No.4, December, pp.49-56.
Narayanamoorthy, A. (1996), Evaluation of Drip Irrigation System in Maharashtra,Mimeograph Series No. 42, Agro-Economic Research Centre, GokhaleInstitute of Politics and Economics, Pune, Maharashtra.
107
Narayanamoorthy, A. (1996a), “Micro-Irrigation”, Kisan World, Vol.23, No.1, January,pp. 51-53.
Narayanamoorthy, A. (1996b), “Electric Pumpset and Groundwater Management:Macro and Micro Evidence of India”, Water Resources Journal, No. ST/ESCAP/SER.C/189, June, pp.24-33.
Narayanamoorthy, A. (1996c), “Impact of Drip Irrigation on Consumption of Waterand Electricity”, The Asian Economic Review, Vol.38, No.3, December,pp.350-364.
Narayanamoorthy, A. (1996d), “Bore-Well Water Market and Farmers’ Participation:A Study of South India”, Energy Management, Vol. 20, No.3, July-Septem-ber, pp. 23-30.
Narayanamoorthy, A. (1997), “Economic Viability of Drip Irrigation: An EmpiricalAnalysis from Maharashtra”, Indian Journal of Agricultural Economics, Vol.52,No.4, October-December, pp.728-739.
Narayanamoorthy, A. (1997a), “Drip Irrigation: A Viable Option for Future IrrigationDevelopment”, Productivity, Vol.38, No.3, October-December, pp. 504-511.
Narayanamoorthy, A. (1997b), “Beneficial Impact of Drip Irrigation: A Study Basedon Western India”, Water Resource Journal, No.ST/ESCAP/SER.C/195,December, pp. 17-25.
Narayanamoorthy, A. (1999), “Drip Irrigation for Sustainable Agriculture”, Producti-vity, Vol.39, No.4, January-March, pp. 672-680.
Narayanamoorthy, A. (1999a), “Changing Scenario of Electricity Consumption inIndian Agriculture”, Productivity, Vol. 40, No.1, April-June, pp. 128-138.
Narayanamoorthy, A. (2000), “Farmers’ Education and Productivity of Crops: A NewApproach”, Indian Journal of Agricultural Economics, Vol.55, No.3, July-September, pp.511-520.
Narayanamoorthy, A. (2001), Impact of Drip Irrigation on Sugarcane Cultivation inMaharashtra, Agro-Economic Research Centre, Gokhale Institute of Politicsand Economics, Pune, June.
Narayanamoorthy, A. (2001a), “Irrigation and Rural Poverty Nexus” A StatewiseAnalysis”, Indian Journal of Agricultural Economics, Vol.56, No.1, January-March, pp.40-56.
Narayanamoorthy, A. (2002), “Indian Irrigation: Five Decades of Development”, WaterResources Journal, No. 212, June, pp. 1-29.
Narayanamoorthy, A. (2003), “Averting Water Crisis by Drip Method of Irrigation: AStudy of Two Water-Intensive Crops”, Indian Journal of AgriculturalEconomics, Vol. 58, No. 3, July-September, pp. 427-437.
Narayanamoorthy, A. (2004), “Drip Irrigation in India: Can it Solve Water Scarcity?”,Water Policy, Vol. 6, No. 2 pp. 117-130.
108
Narayanamoorthy, A. (2004a), “Impact Assessment of Drip Irrigation in India: TheCase of Sugarcane”, Development Policy Review, Vol. 22, No. 4, pp. 443-462.
Narayanamoorthy, A. and R.S. Deshpande (1998), “Micro-Irrigation for SustainableAgriculture”, The Hindu, Madras, January 8, p. 28.
Navalawala, B. N. (2001), “World Commission on Dams: Biased?”, Economic andPolitical Weekly, Vol.36, No.12, March 24, pp. 1008-1010.
NCPA (1987), Proceedings of the National Seminar on Use of Plastics in Agriculture,Organised jointly by the Directorate of Extension (Ministry of Agriculture)and the National Committee on the Use of Plastics in Agriculture (Ministryof Industry), Government of India, New Delhi, February 6.
NCPA (1990), Status, Potential and Approach for Adoption of Drip and SprinklerIrrigation Systems, National Committee on the Use of Plastics in Agriculture,Pune, India.
NHB (1998), Indian Horticulture Data Base, National Horticultural Board, Ministry ofAgriculture, Government of India, New Delhi, India:
Padhye, A.H. (1989), “Micro and Sprinkler Irrigation in India”, Proceedings of theInternational Congress on the Use of Plastics in Agriculture, New Delhi.
Parikh, M.M.; P.J. Shrivastava; N.G. Savani and S. Raman (1993), “Feasibility Studyof Drip in Sugarcane”, in CBIP, pp.124-127.
Patil, B.P. (1988), “Crop Response to Sprinkler and Drip Irrigation with SpecialReference to Konkan Area”, Sinchan, No.2, July, pp.58-60.
Postal, S., Polak, P., Gonzales, F., & Keller, J. (2001), “Drip Irrigation for SmallFarmers: A New Initiative to Alleviate Hunger and Poverty”, WaterInternational, Vol. 26, No. 1.
Postal, S. (1999), Pillar of Sand: Can the Irrigation Miracle Last?, W.W. Norton andCompany, New York.
Puranik, R.P. et al., (1992), “Constraints and Problems as perceived by non-adoptersand adopters of Drip Irrigation System”, Agricultural Situation in India, Vol.XLVII, No, 1, April, pp. 33-34.
Rao, C.H.H. (1999), Sustainable Development of Agriculture, paper presented at thePlenary Session III of the First Biennial Conference of the Indian Society ofEcological Economics, Institute for Social and Economic Change, 20-22,December, Bangalore, India.
Rath, N. and A.K. Mitra (1989), “Economics of Irrigation in Water-Scarce Region: AStudy of Maharashtra”, Artha Vijnana, Vol.31, No.1, March, pp. 1-129.
Raut, Rajesh and Kamal Kachotia (1998), “Sugarcane Cultivation Under ‘Fan-Jet’Micro-Irrigation System – A Case Study”, in Varma C.V.J. and A.R.G. Rao(Eds.), pp. VII 4 – VII 7.

109
Rosegrant, W. Mark (1997), Water Resources in the Twenty-First Century: Challengesand Implications for Action, Food and Agriculture, and the EnvironmentDiscussion Paper 20, International Food Policy Research Institute,Washington D.C., U.S.A., March.
Rosegrant W.M.; Ximing Cai and Sarah A. Cline (2002), World Water and Food to2020: Dealing with Scarcity, International Food Policy Research Institute,Washington, D.C., USA and International Water Management Institute,Colombo, Sri Lanka.
Rosegrant, W. Mark and Ruth S. Meinzen-Dick (1996), “Water Resources in theAsia-Pacific Region: Managing Scarcity”, Asian-Pacific Economic Literature,Vol.10, No.2, November, pp. 32-53.
Saleth, R. Maria. (1996), Water Institutions in India: Economics, Law and Policy,Commonwealth Publishers, New Delhi.
Sankpal, V.Y.; N.J. Danawale; K.K. Khade and D.S. Bhoite (1998), “Response ofSugarcane Varieties to Drip Irrigation During Suru Season”, in VSI, pp. III13-III 24.
Seckler, D; U. Amarasinghe; D. Molden; R. de Silva and R. Barker (1998), WorldWater Demand and Supply, 1990 to 2025: Scenarios and Issues, ResearchReport 19, International Water Management Institute, Colombo, Sri Lanka.
Seckler, D; R. Barker and U. A. Amarasinghe (1999), “Water Scarcity in Twenty-First Century”, International Journal of Water Resources Development, Vol.15,Nos. 1-2, pp. 29-42.
Shah, Tushaar (1993), Groundwater Markets and Irrigation Development: PoliticalEconomy and Practical Policy, Oxford University Press, Delhi.
Sharma, Anil, (1994), “Electricity for Minor Irrigation”, Seminar, No. 418, June, pp.21-24.
Shinde P.P.; A.S. Deshmukh and S.B. Jadhav (1998), “Fertigation Studies underDrip Irrigation in Sugarcane Agriculture”, in VSI, pp. III 47 – III 58.
Shreshta, R.B. and C. Gopalakrishnan (1993), “Adoption and Diffusion of DripIrrigation Technology: An Econometric Analysis”, Economic Development andCultural Change, Vol.41, No.2, January, pp.407-418.
Singh, H.P; S.P. Kaushish; A. Kumar; T.S. Murthy and J.C. Samuel (eds.) (2001),Microirrigation, Central Board of Irrigation and Power, New Delhi.
Singh, Satyajit (1997), Taming the Waters: The Political Economy of Large Dams inIndia, Oxford University Press, Delhi.
Sivanappan, R.K. (1993), “Micro-Irrigation – Macro Future”, in CBIP, pp. 46-49.
Sivanappan, R.K. (1994), “Micro irrigation Macro future”, Kisan World, Vol.21 (3),March, pp. 12-15.
Sivanappan, R.K. (1994a), “Prospects of Micro Irrigation in India”, Irrigation andDrainage System, Vol. 8, No. 1 pp. 49-58.

110
Sivanappan, R.K. (1994b), “Micro Irrigation Macro Future”, Kisan World, Vol.21,No.3, March, pp,12-15.
Sivanappan, R.K. (1994c), “Micro Irrigation is the answer to bring more area underplough”, Business Line, Madras 18, October.
Sivanappan, R. K. (1995), “Present Status and Future of Micro Irrigation in India”,in ASAE, Micro Irrigation for a Changing World: Conserving Resources,Preserving Environment, Proceedings of the Fifth International MicroIrrigation Congress, held at Orlando, Florida, USA, April 2-6, published byAmerican Society of Agricultural Engineers (ASAE), USA.
Sivanappan, R.K. (1998), “Irrigation Water Management for Sugarcane”, in VSI, pp.II 100 – II 125.
Styrbjorn, Almstorm, (1980), Fundamentals of Weed Management in Hot ClimatePeasant Agriculture, Crop Science, Department of Crop Production Science,Swedish University of Agricultural Sciences, Uppasala, Sweden.
Sudhakar, M.S. (1994), “New Joint Ventures in Drip Irrigation: Drip IrrigationTechnology Comes of Age in India”, in Agriculture and Industry Survey:1993-94, Vadamalai Media Limited, Coimbatore, Tamil Nadu.
Vaidyanathan, A. (1994), Food, Agriculture and Water: Second India Studies Revisited,Madras Institute of Development Studies, Madras, January.
Vaidyanathan, A. (1996), “Depletion of Groundwater: Some Issues”, Indian Journal ofAgricultural Economics, Vol.51, Nos. 1 and 2, January-March, pp.184-192.
Vaidyanathan, A. (1998), Water Resource Management: Institutions and IrrigationDevelopment in India, Oxford University Press, New Delhi.
Vaidyanathan, A.; A. Krishnakumar; A. Rajagopal and D. Varatharajan (1994),“Impact of Irrigation on Productivity of Land”, Journal of Indian School ofPolitical Economy, Vol.6, No.4, October-December, pp.601-645.
Vasantdada Sugar Institute (VSI) (1998), Proceedings of the National Seminar onIrrigation Water Management for Sugarcane, VSI, Pune, 5-6 June.
Venugopal, R. and M. Rajkumar (1998), “Drip Irrigation System – New Concept inSugarcane Culture at Baramba of Orissa state”, in VSI, pp. III 7 – III 12.
Varma, C.V.J., & Rao, A.R.G. (Eds.) (1998), Micro-Irrigation and Sprinkler IrrigationSystems, Central Board of Irrigation and Power, New Delhi.
Varma, C.V.J. and A.R.G. Rao (Eds.) (1998) Proceedings: Workshop on Micro Irrigationand Sprinkler Irrigation Systems, Central Board of Irrigation and Power, NewDelhi.
World Bank (1991), Irrigation Sector Review, Vol. I and II, Report No. 9518-IN, TheWorld Bank, Washington D.C., December.