4.0 environmental assessment environmental assessment ... water supplies can potentially be...
TRANSCRIPT

4 - 1
4.0 Environmental Assessment
Waterways and receiving waters near urban and suburban areas are often adverselyaffected by urban storm water runoff. The degree and type of impact varies from location tolocation, but it is often significant relative to other sources of pollution and environmentaldegradation. Urban storm water runoff affects water quality, water quantity, habitat andbiological resources, public health, and the aesthetic appearance of urban waterways. As reportedin the National Water Quality Inventory 1996 Report to Congress (US EPA, 1998d), urban runoffwas the leading source of pollutants causing water quality impairment related to human activitiesin ocean shoreline waters and the second leading cause in estuaries across the nation. Urbanrunoff was also a significant source of impairment in rivers and lakes. The percent of totalimpairment attributed to urban runoff is substantial. This impairment constitutes approximately5,000 square miles of estuaries, 1.4 million acres of lakes, and 30,000 miles of rivers. Sevenstates also reported in the Inventory that urban runoff contributes to wetland degradation.
Adverse impacts on receiving waters associated with storm water discharges have beendiscussed by EPA (1995b) in terms of three general classes. These are:
• Short-term changes in water quality during and after storm events including temporaryincreases in the concentration of one or more pollutants, toxics or bacteria levels.
• Long-term water quality impacts caused by the cumulative effects associated withrepeated storm water discharges from a number of sources.
• Physical impacts due to erosion, scour, and deposition associated with increasedfrequency and volume of runoff that alters aquatic habitat.
As described in the Terrene Institute’s Fundamentals of Urban Runoff Management(Horner et al, 1994), pollutants associated with urban runoff potentially harmful to receivingwaters fall into the categories listed below:
• Solids• Oxygen-demanding substances• Nitrogen and phosphorus• Pathogens• Petroleum hydrocarbons• Metals• Synthetic organics.
These pollutants degrade water quality in receiving waters near urban areas, and oftencontribute to the impairment of use and exceedences of criteria included in State water qualitystandards. The quantity of these pollutants per unit area delivered to receiving waters tends toincrease with the degree of development in urban areas.

4 - 2
While water quality impacts are often unobserved by the general public, other storm waterimpacts are more visible. Stream channel erosion and channel bank scour provide direct evidenceof water quantity impacts caused by urban storm water. Urban runoff increases directly withimperviousness and the degree of watershed development. As urban areas grow, urban streamsare forced to accommodate larger volumes of storm water runoff that recur on a more frequentbasis. This leads to stream channel instability. The change in watershed hydrology associated withurban development also causes channel widening and scour, and the introduction of largeramounts of sediment to urban streams. Visible impacts include eroded and exposed stream banks,fallen trees, sedimentation, and recognizably turbid conditions. The increased frequency offlooding in urban areas also poses a threat to public safety and property.
Both water quality and water quantity impacts associated with urban storm water combineto impact aquatic and riparian habitat in urban streams. Higher levels of pollutants, increased flowvelocities and erosion, alteration of riparian corridors, and sedimentation associated with stormwater runoff negatively impact the integrity of aquatic ecosystems. These impacts include thedegradation and loss of aquatic habitat, and reduction in the numbers and diversity of fish andmacroinvertebrates.
Public health impacts are for the most part related to bacteria and disease causingorganisms carried by urban storm water runoff into waters used for water supplies, fishing andrecreation. Water supplies can potentially be contaminated by urban runoff, posing a public healththreat. Bathers and others coming in contact with contaminated water at beaches and otherrecreational sites can become seriously ill. Beach closures caused by urban runoff have a negativeimpact on the quality of life, and can impede economic development as well. Similarly, thebacterial contamination of shellfish beds poses a public health threat to consumers, and shellfishbed closures negatively impact the fishing industry and local economies.
Aesthetic impacts in the form of debris and litter floating in urban waterways andconcentrated on stream banks and beaches are quite visible to the general public. Storm water isa major source of floatables that include paper and plastic bags and packaging materials, bottles,cans, and wood. The presence of floatables and other debris in receiving waters during andfollowing storm events reduces visual attractiveness of the waters and detracts from theirrecreational value. Nuisance algal conditions including surface scum and odor problems can alsobe attributed to urban storm water in many instances.
Based on available information and data, the following general statements can be madeabout urban storm water impacts.
• Impacts to water quality in terms of water column chemistry tend to be transient andelusive, particularly in rivers.
• Impacts to habitat and aquatic life are generally more profound, and are easier to seeand quantify than changes in water column chemistry.

4 - 3
• Impacts are typically complex because urban storm water is often one of severalsources including municipal discharges and diffuse runoff from agricultural and ruralareas that affect urban waterways.
• Impacts are often interrelated and cumulative. For example, both degraded waterquality and increased water quantity join to impact habitat and biological resources.
The following sections describe the sources of urban storm water runoff, the pollutantscontained in urban runoff and the impacts attributable to urban storm water discharges. Examplessupported by field observation and data have been used extensively to show storm water impacts. The impacts described include water quality impacts, water quantity impacts, public healthimpacts, habitat impacts, and aesthetic impacts.
4.1 Overview of Storm Water Discharges
Storm water runoff from urbanized areas is generated from a number of sources includingresidential areas, commercial and industrial areas, roads, highways and bridges. Essentially, anysurface which does not have the capability to pond and infiltrate water will produce runoff duringstorm events. When a land area is altered from a natural forested ecosystem to an urbanized landuse consisting of rooftops, streets and parking lots, the hydrology of the system is significantlyaltered. Water which was previously ponded on the forest floor, infiltrated into the soil andconverted to groundwater, utilized by plants and evaporated or transpired into the atmosphere isnow converted directly into surface runoff. An important measure of the degree of urbanizationin a watershed is the level of impervious surfaces. As the level of imperviousness increases in awatershed, more rainfall is converted to runoff. Figure 4-1 illustrates this transformation.

4 - 4
Natural Ground Cover 10-20% Impervious
30-50% Impervious 75-100% Impervious
25% DeepInfiltration
25% ShallowInfiltration
10% Runoff
38% Evapotranspiration
21% DeepInfiltration
21% ShallowInfiltration
20% Runoff
5% DeepInfiltration
10% ShallowInfiltration
35% Evapotranspiration
30% Runoff
15% DeepInfiltration
20 % ShallowInfiltration
30% Evapotranspiration
55% Runoff
40% Evapotranspiration
Source: Adapted from Arnold and Gibbons, 1996
Figure 4-1. Effects of Imperviousness on Runoff and Infiltration
The traditional means of managing storm water runoff in urban areas has been to constructa vast curb-and-gutter, catch basin, and storm drain network to transport this runoff volumequickly and efficiently away from the urbanized area and discharge the water to receiving streams. Two types of sewer systems are used to convey storm water runoff: separate storm sewers andcombined sewers.
• Separate storm sewer systems convey only storm water runoff. Water conveyed inseparate storm sewers is frequently discharged directly to receiving streams withoutreceiving any intentional form of treatment. (In a municipality with a separate stormsewer system, sanitary sewer flows are conveyed in a distinct sanitary sewer system tomunicipal wastewater treatment plants.)
• In a combined sewer system, storm water runoff is combined with sanitary sewer flowsfor conveyance. Flows from combined sewers are treated by municipal wastewater

4 - 5
treatment plants prior to discharge to receiving streams. During large rainfall eventshowever, the volume of water conveyed in combined sewers can exceed the storageand treatment capacity of the wastewater treatment system. As a result, discharges ofuntreated storm water and sanitary wastewater directly to receiving streams canfrequently occur in these systems. These types of discharges are known as combinedsewer overflows (CSOs).
Historically, as urbanization occurred and storm drainage infrastructure systems weredeveloped in this country, the primary concern was to limit nuisance and potentially damagingflooding due to the large volumes of storm water runoff that are generated. Little, if any, thoughtwas given to the environmental impacts of such practices. As a result, streams that receive stormwater runoff frequently cannot convey the large volumes of water generated during runoff eventswithout significant degradation of the receiving stream. In addition to the problems associatedwith excess water volume, the levels of toxic or otherwise harmful pollutants in storm waterrunoff and CSOs can cause significant water quality problems in receiving streams.
In addition to point sources such as municipal separate storm sewers and combined seweroverflows, storm water runoff can enter receiving streams as a non-point source. Storm waterrunoff from a variety of sources such as parking lots, highways, open land, rangeland, residentialareas and commercial areas can enter waterways directly as sheet flow or as a series of diffuse,discrete flows. Due to the diffuse nature of many storm water discharges, it is difficult to quantifythe range of pollutant loadings to receiving streams that are attributable to storm waterdischarges. It is much easier, however, to measure the increased stream flows during rainfallevents that occur in urbanized areas and to document impacts to streams that receive storm waterrunoff.
Awareness of the damaging effects storm water runoff is causing to the water quality andaquatic life of receiving streams is a relatively recent development. Storm water managementtraditionally was, and still is in many cases, a flood control rather than a quality control program. Local governments intending to improve the quality of their runoff-impacted streams areincorporating best management practices (BMPs) into their drainage programs. BMPs whichreduce the volume of runoff discharged to receiving streams, such as minimizing directlyconnected impervious surfaces, providing on-site storage and infiltration and implementing streambuffers and restoring riparian cover along urban streams can help to prevent further degradationand even result in improvements of streams which receive storm water discharges. However, inmany existing urbanized areas, the cost of infrastructure changes necessary to retrofit existingstorm water drainage systems with structural BMPs--to provide for storm water quality as well asquantity control--can be prohibitively expensive. In these cases, non-structural BMPs can beimplemented to reduce pollutant sources and to reduce the transfer of urban pollutants to runoff,before more expensive, structural controls are instituted.
The climate of a region can have a significant impact on the quantity and quality of stormwater runoff. Factors such as the length of the antecedent dry periods between storms, the

4 - 6
average rainfall intensity, the storm duration and the amount of snowmelt present can havesignificant impacts on the characteristics of runoff from an area. In areas where there is asignificant amount of atmospheric deposition of particulates, storm water runoff can contain highconcentrations of suspended solids, metals and nutrients. Areas that have infrequent rainfall suchas the southwest U.S. can have runoff with significant concentrations of pollutants, especiallyfrom “hot spots” such as roads, parking lots and industrial areas. These areas, which typicallyhave high-intensity, short-duration rainfall events, can generate significant loadings of suspendedsolids in storm water runoff. Many specific geographic factors can influence the nature andconstituents contained in storm water runoff. Factors such as the soil types, slopes, land usepatterns and the amount of imperviousness of a watershed can greatly affect the quality andquantity of runoff that is produced from an area.
4.2 Pollutants in Urban Storm Water
Storm water runoff from urban areas can contain significant concentrations of harmfulpollutants that can contribute to adverse water quality impacts in receiving streams. Effects caninclude such things as beach closures, shellfish bed closures, limits on fishing and limits onrecreational contact in waters that receive storm water discharges. Contaminants enter stormwater from a variety of sources in the urban landscape.
Urban storm water runoff has been the subject of intensive research since the inception ofthe Water Quality Act of 1965. There have been numerous studies conducted to characterize thenature of urban storm water runoff and the performance of storm water BMPs. Data sourcesinclude the "208 Studies," the area-wide waste treatment management plans conducted by statesunder section 208 of the 1972 CWA; EPA's Nationwide Urban Runoff Program (NURP); theU.S. Geological Survey (USGS) Urban Stormwater Database; and the Federal HighwayAdministration (FHWA) study of storm water runoff loadings from highways. In addition tothese federal sources, there is a great deal of information in the technical literature, as well as datacollected by states, counties and municipalities. A recent data source is storm water monitoringdata collected by municipalities regulated by the Phase I NPDES storm water regulations. As partof the Phase I permit application, regulated municipalities were required to collect data from fiverepresentative sites during a minimum of three storm events.
The most comprehensive study of urban runoff was NURP, conducted by EPA between1978 and 1983. NURP was conducted in order to examine the characteristics of urban runoffand similarities or differences between urban land uses, the extent to which urban runoff is asignificant contributor to water quality problems nationwide, and the performance characteristicsand effectiveness of management practices to control pollution loads from urban runoff (US EPA,1983). Sampling was conducted for 28 NURP projects which included 81 specific sites and morethan 2,300 separate storm events. NURP focused on the following ten constituents:
• Total Suspended Solids (TSS)

4 - 7
• Biochemical Oxygen Demand (BOD)• Chemical Oxygen Demand (COD)• Total Phosphorus (TP)• Soluble Phosphorus (SP)• Total Kjeldahl Nitrogen (TKN)• Nitrate + Nitrite (N)• Total Copper (Cu)• Total Lead (Pb)• Total Zinc (Zn).
NURP examined both the soluble and the particulate fraction of pollutants, since the waterquality impacts can depend greatly on the form that the contaminant is present. NURP alsoexamined coliform bacteria and priority pollutants at a subset of sites. Median event meanconcentrations (EMCs) for the ten general NURP pollutants for various urban land use categoriesare presented in Table 4-1.

4 - 8
Table 4-1. Median Event Mean Concentrations for Urban Land Uses
Pollutant UnitsResidential Mixed Commercial
Open/Non-Urban
Median COV Median COV Median COV Median COV
BOD mg/l 10 0.41 7.8 0.52 9.3 0.31 -- --
COD mg/l 73 0.55 65 0.58 57 0.39 40 0.78
TSS mg/l 101 0.96 67 1.14 69 0.85 70 2.92
Total Lead µg/l 144 0.75 114 1.35 104 0.68 30 1.52
Total Copper µg/l 33 0.99 27 1.32 29 0.81 -- --
Total Zinc µg/l 135 0.84 154 0.78 226 1.07 195 0.66
Total KjeldahlNitrogen
µg/l 1900 0.73 1288 0.50 1179 0.43 965 1.00
Nitrate +Nitrite
µg/l 736 0.83 558 0.67 572 0.48 543 0.91
TotalPhosphorus
µg/l 383 0.69 263 0.75 201 0.67 121 1.66
SolublePhosphorus
µg/l 143 0.46 56 0.75 80 0.71 26 2.11
COV: Coefficient of variationSource: Nationwide Urban Runoff Program (US EPA 1983)
Results from NURP indicate that there is not a significant difference in pollutantconcentrations in runoff from different urban land use categories. There is a significant difference,however, in pollutant concentrations in runoff from urban sources than that produced from non-urban areas.
The pollutants that are found in urban storm water runoff originate from a variety ofsources. The major sources include contaminants from residential and commercial areas, industrialactivities, construction, streets and parking lots, and atmospheric deposition. Contaminantscommonly found in storm water runoff and their likely sources are summarized in Table 4-2.

4 - 9
Table 4-2. Sources of Contaminants in Urban Storm Water Runoff
Contaminant Contaminant Sources
Sediment and Floatables Streets, lawns, driveways, roads, constructionactivities, atmospheric deposition, drainagechannel erosion
Pesticides and Herbicides Residential lawns and gardens, roadsides,utility right-of-ways, commercial andindustrial landscaped areas, soil wash-off
Organic Materials Residential lawns and gardens, commerciallandscaping, animal wastes
Metals Automobiles, bridges, atmospheric deposition,industrial areas, soil erosion, corroding metalsurfaces, combustion processes
Oil and Grease/Hydrocarbons
Roads, driveways, parking lots, vehiclemaintenance areas, gas stations, illicitdumping to storm drains
Bacteria and Viruses Lawns, roads, leaky sanitary sewer lines,sanitary sewer cross-connections, animalwaste, septic systems
Nitrogen and Phosphorus Lawn fertilizers, atmospheric deposition,automobile exhaust, soil erosion, animalwaste, detergents
The concentrations of pollutants found in urban runoff are directly related to degree ofdevelopment within the watershed. This trend is shown in Table 4-3, a compilation of typicalpollutant loadings from different urban land uses.

4 - 10
Table 4-3. Typical Pollutant Loadings from Runoff by Urban Land Use (lbs/acre-yr)
Land Use TSS TP TKN NH3-N NO2+NO3-N BOD COD Pb Zn Cu
Commercial 1000 1.5 6.7 1.9 3.1 62 420 2.7 2.1 0.4
Parking Lot 400 0.7 5.1 2 2.9 47 270 0.8 0.8 0.04
HDR 420 1 4.2 0.8 2 27 170 0.8 0.7 0.03
MDR 190 0.5 2.5 0.5 1.4 13 72 0.2 0.2 0.14
LDR 10 0.04 0.03 0.02 0.1 NA NA 0.01 0.04 0.01
Freeway 880 0.9 7.9 1.5 4.2 NA NA 4.5 2.1 0.37
Industrial 860 1.3 3.8 0.2 1.3 NA NA 2.4 7.3 0.5
Park 3 0.03 1.5 NA 0.3 NA 2 0 NA NA
Construction 6000 80 NA NA NA NA NA NA NA NA
HDR: High Density Residential, MDR: Medium Density Residential, LDR: Low Density ResidentialNA: Not available; insufficient data to characterize loadingsSource: Horner et al, 1994
As indicated in Table 4-3, urban storm water runoff can contain significant concentrationsof solids, nutrients, organics and metals. A comparison of the concentration of water qualityparameters in urban runoff with the concentrations in domestic wastewater is shown in Table 4-4.

4 - 11
Table 4-4. Comparison of Water Quality Parameters in Urban Runoff with DomesticWastewater (mg/l)
Constituent
Urban Runoff Domestic Wastewater
Separate Sewers Before Treatment After Secondary
Range Typical Range Typical Typical
COD 200-275 75 250-1,000 500 80
TSS 20-2,890 150 100-350 200 20
Total P 0.02-4.30 0.36 4-15 8 2
Total N 0.4-20.0 2 20-85 40 30
Lead 0.01-1.20 0.18 0.02-0.94 0.10 0.05
Copper 0.01-0.40 0.05 0.03-1.19 0.22 0.03
Zinc 0.01-2.90 0.02 0.02-7.68 0.28 0.08
Fecal Coliformper 100 ml
400-50,000 106-108 200
Source: Bastian, 1997
As indicated in Table 4-4, the concentrations of select water quality parameters in urbanrunoff is comparable to that found in untreated domestic wastewater. When untreated urbanrunoff is discharged directly to receiving streams, the loadings of pollutants can be much higherthan the loadings attributable to treated domestic wastewater.
The following paragraphs summarize the major pollutants which are commonly found inurban storm water runoff.
4.2.1 Solids, Sediment and Floatables
Solids are one of the most common contaminants found in urban storm water. Solidsoriginate from many sources including the erosion of pervious surfaces and dust, litter and otherparticles deposited on impervious surfaces from human activities and the atmosphere. Streambank erosion and erosion at construction sites are also major sources of solids. Solids contributeto many water quality, habitat and aesthetic problems in urban waterways. Elevated levels ofsolids increase turbidity, reduce the penetration of light at depth within the water column, andlimit the growth of desirable aquatic plants. Solids that settle out as bottom deposits contribute tosedimentation and can alter and eventually destroy habitat for fish and bottom-dwelling organisms

4 - 12
(see Figure 4-2). Solids also provide a medium for the accumulation, transport and storage ofother pollutants including nutrients and metals. Sediment bound pollutants often have a longhistory of interaction with the water column through cycles of deposition, re-suspension, and re-deposition. Impaired navigation due to sedimentation represents another impact affectingrecreation and commerce. The relative contribution of TSS in urban storm water from differentland uses is presented in Table 4-3. As shown in Table 4-4, the typical concentration of TSS inurban runoff is substantially higher than that in treated wastewater (Bastian, 1997). Constructionproduces the highest loading of TSS over other urban land use categories evaluated.
Figure 4-2. Effects of Siltation on Rivers and Streams
Source: US EPA, 1998d.
4.2.2 Oxygen-Demanding Substances and Dissolved Oxygen
The oxygen-demanding substances found in urban storm water can be measured byBiochemical Oxygen Demand (BOD), Chemical Oxygen Demand (COD), and Total OrganicCarbon (TOC). Maintaining appropriate levels of dissolved oxygen in receiving waters is one ofthe most important considerations for the protection of fish and aquatic life. The amount ofdissolved oxygen in urban runoff is typically 5.0 mg/l or greater, and it rarely poses a direct threatto in-stream conditions. As shown in Table 4-4, the level of COD associated with urban runoff iscomparable to treated wastewater. The direct impact of urban storm water runoff on dissolvedoxygen conditions in receiving waters is not thought to be substantial. However, the secondaryimpacts on the dissolved oxygen balance in receiving waters due to nutrient enrichment,eutrophication, and resulting sediment oxygen demand may be important.

4 - 13
4.2.3 Nitrogen and Phosphorus
Nitrogen and phosphorus are the principal nutrients of concern in urban storm water. Themajor sources of nutrients in urban storm water are urban landscape runoff (fertilizers, detergents,plant debris), atmospheric deposition, and improperly functioning septic systems (TerreneInstitute, 1996). Animal waste can also be an important source. There are a number ofparameters used to measure the various forms of nitrogen and phosphorus found in runoff. Ammonia (NH3) nitrogen is the nitrogen form that is usually the most readily toxic to aquatic life. Nitrate (NO3) and nitrite (NO2) are the inorganic fractions of nitrogen. Very little nitrite is usuallyfound in storm water. Total Kjeldahl nitrogen (TKN) measures the organic and ammonianitrogen forms. By subtraction, the organic fraction can be determined. Total phosphorusmeasures the total amount of phosphorus in both the organic and inorganic forms. Ortho-phosphate measures phosphorus that is most immediately biologically available. Most of thesoluble phosphorus in storm water is usually present in the ortho-phosphate form.
The degree to which nitrogen and phosphorus are present in a river, lake or estuary candetermine the trophic status and amount of algal biomass produced. Excess nutrients tend toincrease primary biological productivity. The major impact associated with nutrient over-enrichment is excessive growth of algae that leads to nuisance algal blooms and eutrophicconditions. A secondary impact is the residual negative effect of decomposing algae in the formof sediment oxygen demand that depletes dissolved oxygen concentrations, particularly in bottomwaters. The NURP study reported that nutrient levels in urban runoff appear not to be high incomparison with other possible discharges. However, more recent studies and programs haverecognized that the amount of nitrogen and phosphorus present in urban storm water can besubstantial, and becomes increasingly important as other point sources of nutrients are broughtunder control. Walker (1987) reported that “cause-effect relationships linking urban developmentto lake and reservoir eutrophication are well established,” and that “urban watersheds typicallyexport 5 to 20 times as much phosphorus per unit per year, as compared to undevelopedwatersheds in a given region.” The nutrient loadings from different urban and suburban land usesare presented in Table 4-3. As shown in Table 4-4, the total phosphorus and total nitrogenconcentrations in urban runoff are substantially less than treated wastewater concentrations, butstorm water volumes can be greater during wet weather events.
4.2.4 Pathogens
Pathogens are disease-producing organisms that present a potential public health threatwhen they are present in contact waters. Since storm water runoff typically does not come intocontact with domestic wastewaters, and direct exposure to runoff is usually limited, there isgenerally little threat of pathogens in storm water runoff causing a public health risk. However,where runoff is discharged to recreational waters such as beaches and lakes, or where runoffcomes into contact with shellfish beds, there is a potential public health risk associated withpathogen contamination.

4 - 14
There are a number of indicator organisms that have been used to evaluate the presence ofharmful pathogens in storm water runoff. Several strains of bacteria are present naturally in thesoil and can be transported by runoff. In addition, BMPs with standing water can be breedinggrounds for naturally occurring bacteria. Therefore, interpretation of bacteriological samplingresults can be difficult. Nevertheless, indicator organisms can provide useful insight into thepublic health risk associated with runoff. Fecal coliform has been widely used as an indicator forthe presence of harmful pathogens in domestic wastewaters, and therefore studies characterizingstorm water runoff have frequently used this indicator as well. Other bacterial indicators thathave been used to evaluate the presence of harmful pathogens in storm water runoff includeEscherichia coli, streptococci and enterococci. The presence of enteric viruses has also beenevaluated in storm water runoff, as well as protozoans such as Giardia lamblia andcryptosporidium.
Fecal coliform concentrations in urban runoff were evaluated by NURP at 17 sites for 156storm events. NURP reported that coliform bacteria are present at high levels in urban runoff andcan be expected to exceed EPA water quality criteria during and immediately after storm events inmany surface waters, even those providing high degrees of dilution. Concentrations of fecalcoliform found by NURP exhibited a large degree of variability, and did not indicate anydistinctions based on land use. Data from different sites did show a dramatic seasonal effect oncoliform concentrations. Coliform counts in urban runoff during warmer periods of the year werefound to be approximately 20 times greater that those found during colder periods. Based on thisdata, NURP concluded that coliform sources unrelated to those traditionally associated withhuman health risk may be significant.
The Terrene Institute (1996) reported that the primary sources of pathogens in urbanstorm water drains are animal wastes (including pets and birds), failing septic systems, illicitsewage connections, and boats and marinas. Field et al (1993) reported pathogens levels fromstorm water runoff and urban streams as shown in Table 4-5. Pathogens enumerated includedbacteria (total and fecal coliform, fecal streptococci, enterococci, Pseudomonas aeruginosa,Staphylococcus aureus, and Salmonella) and enteroviruses (poliovirus, Coxsackie virus, andEchovirus).

4 - 15
Table 4-5. Densities of Selected Pathogens and Indicator Microorganisms in Storm Waterin Baltimore, Maryland Area
Geometric Mean Densities
SamplingStation
Entero-virus
Salmonsp.
Pseudomon.aeruginosa
Staph.aureus
TotalColiform
FecalColiform
FecalStrep.
Enterococci
PFU/10 L
MPN/10 L
MPN/10 L
MPN/100 mL
MPN/100 mL(10^4)
MPN/100 mL(10^3)
No./100 mL(10^4)
No./100 mL(10^4)
Bush St. 6.9 30 2000 120 38 83 56 12
Northwood 170 5.7 590 12 3.8 6.9 5 2.1
PFU: Plaque-forming unitsMPN: Most Probable NumberSource: Field et al, 1993
As shown earlier in Table 4-4, typical fecal coliform concentrations for separate urbanstorm sewers varied widely, ranging between 400-50,000 mpn/100 ml. An example of fecalcoliform concentrations measured in sheet flow associated with different impervious surfaces ispresented in Table 4-6. The broad range in concentrations illustrates the highly variable nature offecal coliform concentrations in storm water.
Table 4-6. Fecal Coliform Concentrations Collected in Sheetflow from Urban Land Uses
Land UseMedian
(MPN/100 ml)Range
(MPN/100 ml)
Unpaved driveways and storage areas 26 0.02-300
Roof runoff 1.6 0.56-2.6
Sidewalks 55 19-90
Paved parking and driveways 2.8 0.03-66
Paved roads 19 1.8-430
MPN: Most Probable NumberSource: Field et al, 1993.
4.2.5 Petroleum Hydrocarbons
Petroleum hydrocarbons include oil and grease; the “BTEX” compounds: benzene,toluene, ethyl benzene, and xylene; and a variety of polynuclear aromatic hydrocarbons (PAHs).Sources of petroleum hydrocarbons include parking lots and roadways, leaking storage tanks,

4 - 16
auto emissions, and improper disposal of waste oil. Petroleum hydrocarbons are typicallyconcentrated along transportation corridors.
Petroleum hydrocarbons are known for their acute toxicity at low concentrations(Schueler, 1987). A study by Shepp (1996) measured the petroleum hydrocarbon concentrationsin urban runoff from a variety of impervious areas in the District of Columbia and suburbanMaryland. The amount of car traffic affects the concentration of hydrocarbons in runoff, withmedian concentrations ranging from 0.7 to 6.6 mg/l. Concentrations at these levels exceed themaximum concentrations recommended for the protection of drinking water supplies and fisheriesprotection. As pointed out by Shepp, the maximum concentration of petroleum hydrocarbons forprotection of fisheries is 0.01 to 0.1 mg/l.
4.2.6 Metals
The primary sources of metals in urban storm water are industry and automobiles. Atmospheric deposition (both wet and dry) can make a substantial contribution in some parts ofthe country. A major finding of the NURP study is as follows:
Heavy metals (especially copper, lead and zinc) are by far the most prevalent priority pollutantconstituents found in urban runoff. End-of-pipe concentrations exceed EPA ambient waterquality criteria and drinking water standards in many instances. Some of the metals are presentoften enough and in high enough concentrations to be potential threats to beneficial uses.
Metals in urban storm water have the potential to impact water supply and cause acute orchronic toxic impacts for aquatic life. Typical pollutant loading rates and urban runoffconcentrations for lead, zinc and copper are presented in Tables 4-3 and 4-4. The frequency withwhich metals were detected as priority pollutants in the NURP study is presented in Table 4-7.

4 - 17
Table 4-7. Most Frequently Detected Priority Pollutants in Nationwide Urban RunoffProgram Samples (1978-83)
Inorganics Organics
Detected in 75% or more
94% Lead94% Zinc91% Copper
None
Detected in 50-74%
58% Chromium52% Arsenic
None
Detected in 20-49%
48% Cadmium43% Nickel23% Cyanides
22% Bis(2-ethylhexyl)phthalate20% "-Hexachloro-cyclohexane
Detected in 10-19%
13% Antimony12% Beryllium11% Selenium
19% "-Endosulfan19% Pentachlorophenol*17% Chlordane*15% Lindane*15% Pyrene**14% Phenol12% Phenanthrene**11% Dichloromethane10% 4-Nitrophenol10% Chrysene**10% Fluoranthene**
* Chlorinated hydrocarbon** Polynuclear aromatic hydrocarbonSource: US EPA, 1983
A major study of the quality of Wisconsin storm water (Bannerman et al, 1996) found thatthe probability of event mean concentrations for some metals (particularly copper and zinc)exceeding Wisconsin water quality criteria for cold water fish communities was high (Table 4-8).A study in Coyote Creek, California reported lead and zinc levels from urban runoff of 100 to 500times the concentration in the ambient water column (Pitt, 1995).

4 - 18
Table 4-8. Probability of Event Mean Concentration of Constituents in Wisconsin StormWater Exceeding Wisconsin Surface Water and Ground Water Quality Standards: Metals
Constituent
Probability of exceedingacute toxicity criteria for
cold water fishcommunities (percent)
Storm Sewers Streams
Cadmium, total recoverable 11 0
Copper, total recoverable 87 9
Lead, total recoverable 18 0
Silver, total recoverable 20 -
Zinc, total recoverable 91 7
Source: Bannerman et al, 1996.
4.2.7 Synthetic Organic Compounds
Synthetic organic compounds include a variety of manufactured compounds coveringpesticides, solvents and household and industrial chemicals. The frequency that syntheticinorganics were detected as priority pollutants in the NURP study is presented in Table 4-7. Ingeneral, organic contaminants were found in less than 20 percent of samples. Nevertheless,synthetic organics do represent a threat. Even low concentrations of some synthetic organicsover a long period of time have the potential to pose a severe health risks to humans and aquaticlife though direct ingestion or bioaccumulation in the food chain. There is also some evidencethat pesticides are found in higher concentrations in urban areas than agricultural areas (US EPA,1995b). Further, Bannerman et al found that the probability for storm water and urban streamsamples to exceed human cancer criteria for public water supply, and toxicity criteria forcoldwater fish communities equaled or approached 100 percent for 10 compounds (Table 4-9).

4 - 19
Table 4-9. Probability of Event Mean Concentration of Constituents in Wisconsin StormWater Exceeding Wisconsin Surface Water and Ground Water Quality Standards:
Synthetic Organic Compounds
Constituent(Human cancer criteria
for public watersupply/ coldwater fish
communities)
Probability of exceedance(percent)
Storm Sewers Streams
Benzo[a]anthracene 98 100
Benzo[a]pyrene 99 100
Benzo[b]fluoranthene 100 100
Benzo[ghi]perylene 99 100
Benzo[k]fluoranthene 99 99
Chrysene 100 100
Indeno pyrene 100 99
Phenanthrene 100 99
Pyrene 100 100
DDT 98 100
Source: Bannerman et al, 1996
4.2.8 Temperature
Water temperature is an important measure of water quality. As described by Malina(1996), “the temperature of water affects some of the important physical properties andcharacteristics of water, such as… specific conductivity and conductance, salinity, and thesolubility of dissolved gases (e.g., oxygen and carbon dioxide).” Specifically, water holds lessoxygen as it becomes warmer, resulting in less oxygen being available for respiration by aquaticorganisms. Furthermore, elevated temperatures increase the metabolism, respiration, and oxygendemand of fish and other aquatic life, approximately doubling the respiration for a 10EC (18EF)temperature rise; hence the demand for oxygen is increased under conditions where supply islowered (California SWRCB, 1963).
Certain species of fish, such as salmon and trout, are particularly sensitive and requirerelatively low water temperatures. Even lower temperatures are required for spawning and egg

4 - 20
hatching (US EPA, 1976). If the temperature of a stream reach is raised by 5 to 10EC (9 to18EF), it is probable that such cold-water game fish will avoid this reach and that they will bereplaced by “rougher,” more tolerant fish (California SWRCB, 1963). Thus, even without directmortality, the character of the fish life will change. Sudden changes in temperature directly stressthe aquatic ecosystem. The states have adopted varying criteria to protect fisheries from suchstresses. Typically, states limit in-stream temperature rises above natural ambient temperatures to2.8EC (5EF). Allowable temperature rises in streams that support cold water fisheries may belower, with some states adopting values as low as 1EC (1.8EF) and 0.6EC (1EF) (US EPA, 1988).
The temperature of urban waters is often affected directly by urban runoff. Urban runoffcan be heated as it flows over rooftops, parking lots and roadways. When it reaches urbanwaterways it can cause a temporary fluctuation in the in-stream water temperature. Other factorsthat tend to increase summer water temperature in urban waters include the removal of vegetationfrom stream banks, reduced ground water baseflow, and discharges from storm water facilitieswith elevated water temperature. Frequent fluctuations in stream temperature stress the aquaticecosystem, and make it difficult for temperature-sensitive species to survive.
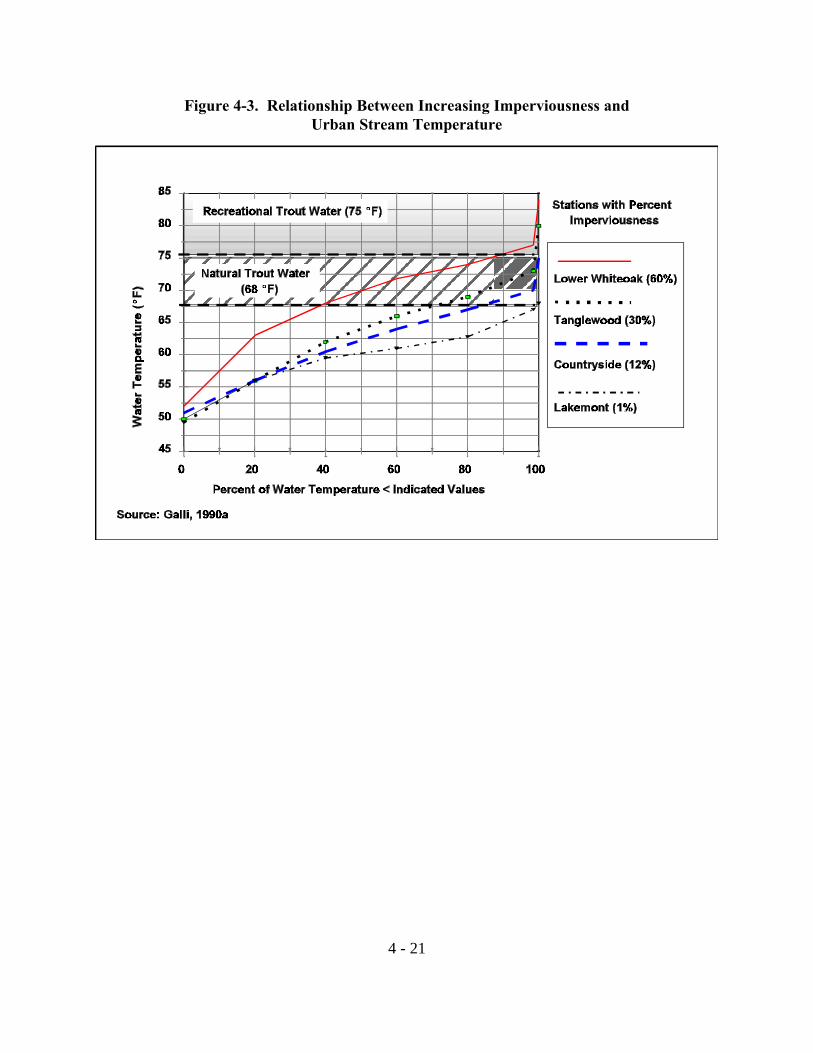
Galli (1990a) undertook a major study of thermal impacts associated with urbanizationand storm water management in Maryland. Temperature observations were taken at streamstations representing different levels of development, with impervious cover ranging from 1percent to 60 percent. Results were compared with Maryland Class III standards for natural troutwaters (68 EF) and Class IV standards for recreational trout waters (75 EF). As shown in Figure4-3, streams in developed watersheds (Lower Whiteoak and Tanglewood Stations) havesignificantly higher spring and summer temperatures than streams in less developed watersheds. Galli also found that “imperviousness together with local meteorological conditions had thelargest influence on urban stream temperatures.” As shown in Figure 4-4, the rate of increase inbaseflow water temperature in this study was determined to be 0.14 EF for each one percentincrease in watershed imperviousness.
4 - 21
Figure 4-3. Relationship Between Increasing Imperviousness andUrban Stream Temperature

4 - 22
Figure 4-4. Relationship Between Watershed Imperviousness and Baseflow WaterTemperature
4.2.9 pH
As pointed out by Novotny and Olem (1994), “most aquatic biota are sensitive to pHvariations,” and “fish kills and reduction and change of other species result when the pH is alteredoutside their tolerance limits.” Most pH impacts in urban waters are caused by runoff ofrainwater with low pH levels (acid precipitation). In fact, urban areas tend to have more acidicrainfall than less developed areas. Some buffering of low pH rainwater occurs during contactwith buildings, parking lots, roads and collection systems, and during overland flow. This is oftenvery site specific. The alkalinity and thus the capacity of receiving waters to neutralize acidicstorm water can also be important, and again is very site specific. Examples of pH impacts on fishpopulations are difficult to identify due to the cumulative, overlapping impacts from other factors. However, it is thought that the acidification problem in both the United States and Canada growsin magnitude when “episodic acidification” (brief periods of low pH levels from snow melt orheavy downpours) is taken into account (US EPA, 1992a). The spring snow melt can coincidewith fish spawning periods.

4 - 23
Estuaries and Ocean Shoreline
Lakes
Rivers and Streams
0 10 20 30 40 50
Percent of Impaired Waters
Major Impairment Moderate / Minor Not Specified
4.3 Reported Impacts of Urban Storm Water
Urban runoff, which includes runoff from impervious surfaces such as streets, parking lots,buildings, lawns and other paved areas is one of the leading causes of water quality impairment inthe United States. Based on the 1996 state Water Quality Inventory reports, siltation (sedimentdischarged from urban runoff, as well as construction sites, agriculture, mining and forests) is theleading cause of impaired water quality in rivers and streams. In the portion of the inventoryidentifying sources, urban runoff was listed as the leading source of pollutants causing waterquality impairment related to human activities in ocean shoreline waters and the second leadingcause in estuaries across the nation. Urban runoff was also a significant source of impairment inrivers and lakes. Urban runoff accounts for 47 percent of impaired miles of surveyed oceanshoreline, 46 percent of the impaired square miles of surveyed estuaries, 22 percent of theimpaired acres of surveyed lakes and 14 percent of the impaired miles of surveyed rivers. Figure4-5 illustrates the level of impairment attributable to urban storm water runoff based on states’Water Quality Inventory assessment reports.
Figure 4-5. Proportions of Impaired Water Bodies Attributed to Urban Runoff
Source: EPA, 1998d.
4.3.1 Flow Impacts
The volume and flow rate of storm water discharges can have significant impacts onreceiving streams. In many cases, the impacts on receiving streams due to high storm water flow

4 - 24
rates or volumes can be more significant than those attributable to the contaminants found instorm water discharges. While studies linking increased storm water flows due to urbanization tostream degradation are generally lacking in quantitative data, there are a number of studies thatsupport this hypothesis. EPA summarized studies which contain documented evidence of impactson steams due to urbanization (US EPA, 1997a). Impacts of urbanization and increased stormwater discharges to receiving streams documented in this evaluation include:
• Increase in the number of bankfull events and increased peak flow rates• Sedimentation and increased sediment transport• Frequent flooding• Stream bed scouring and habitat degradation• Shoreline erosion and stream bank widening• Decreased baseflow• Loss of fish populations and loss of sensitive aquatic species• Aesthetic degradation• Changes in stream morphology• Increased temperatures.
The amount of runoff generated within a watershed increases steadily with development.The presence of impervious areas such as roofs, parking lots and highways limits the volume ofrain water infiltrated into the soil, and increases the amount of runoff generated. Urbanized areasalso tend to have reduced storage capacities for runoff because of regrading, paving, and theremoval of vegetative cover. Decreases in infiltration and evapotranspiration and an increase inrunoff are the result of urbanization, with runoff volume linked to the percent of impervious area. The relationship between runoff coefficient and percent impervious area is illustrated in Figure 4-6.

4 - 25
0
0.2
0 .4
0 .6
0 .8
1
Ru
no
ff C
oef
fici
ent
0 20 40 60 80 100
W atershed Imperv iousness (%)
Source: Schueler , 1987
Figure 4-6. Relationship of Watershed Imperviousness to Runoff Coefficient Levels
As shown in Table 4-10, the physical impacts to streams associated with increasedimperviousness are substantial (US EPA, 1997a).

4 - 26
Table 4-10. Impacts from Increases in Impervious Surfaces
IncreasedImperviousnessLeads to:
Resulting Impacts
Flooding Habitat loss Erosion ChannelWidening
Stream bedAlteration
Increased Volume UU UU UU UU UU
Increased PeakFlow
UU UU UU UU UU
Increased PeakDuration
UU UU UU UU UU
Increased StreamTemp.
UU
Decreased BaseFlow
UU
Changes inSediment Loading
UU UU UU UU UU
Source: EPA, 1997
The Delaware Department of Natural Resources and Environmental Control alsoidentified a list of impacts on physical stream habitat attributed to urban storm water (DEDNREC, 1997). This list is as follows:
• Accelerated bank erosion• Accelerated bank undercutting• Increased siltation (burial of stable habitats)• Elimination of meanders (channelization)• Channel widening• Reduced depth• Reduced baseflow• Loss of shade• Increased temperature.
Specific impacts in the areas of flooding, stream bank erosion, and ground water rechargeare described in the following subsections.

4 - 27
Flooding
Urbanization increases the frequency and severity of flooding due to increased runoff. Because of the decreased availability of pervious, permeable surfaces, and the related decrease instorage capacity, smaller more frequently occurring storms can create flooding problems. Hydrographs in urban streams peak higher and faster than streams in undeveloped areas. Acomparison of estimated runoff volume and peak discharge for developed and undeveloped areasis presented in Table 4-11. As shown, both runoff volume and peak discharge are substantiallyincreased under developed conditions.
Table 4-11. Comparison of Estimated Runoff Volume and Peak Discharge for Developedand Undeveloped Areas
StormFrequency
(years)
Undeveloped Conditions (Woods in good condition)
Developed Conditions (Half-Acre Residential)
EstimatedRunoff (in)
Estimated PeakDischarge (cfs)
EstimatedRunoff (in)
Estimated PeakDischarge (cfs)
2 0.14 1.00 0.60 11.6
10 0.52 5.60 1.33 27.4
100 1.40 19.7 2.64 58.6
Source: Horner et al, 1994
The effects of urbanization on stream shape and the flood plain are illustrated in Figure 4-7. Increased peak discharge raises the flood plain level, flooding areas which were previously notat risk.

4 - 28
Floodplain Limit
Summer Low Flow Level
Floodplain Limit
Summer Low Flow Level
Undeveloped
Urbanized
Source: Adapted from Schueler, 1987
Figure 4-7. Effect of Urbanization on Stream Slope and Flooding
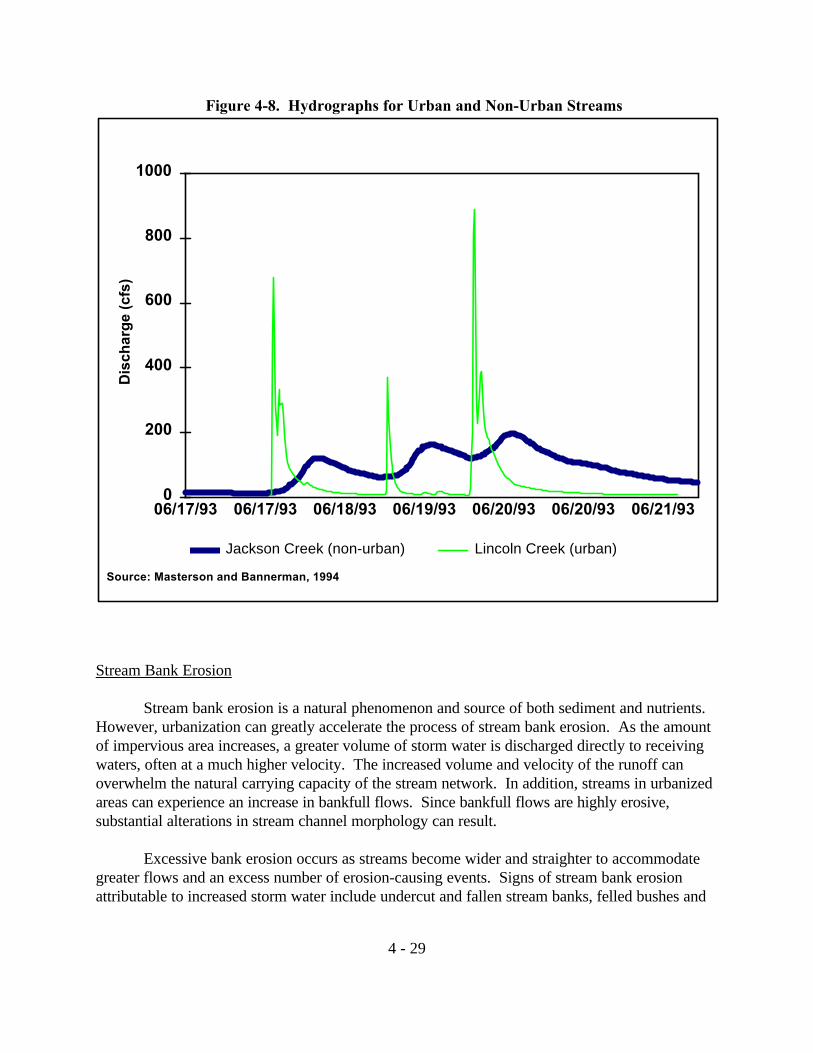
A comparison of hydrographs from an urbanized stream (Lincoln Creek) and a non-urbanized stream (Jackson Creek) in Wisconsin are presented in Figure 4-8 (Masterson andBannerman, 1994). As illustrated, the hydrograph for the urbanized stream exhibits a muchhigher peak flow rate that would correspond to a higher flood level.
4 - 29
0
200
400
600
800
1000
Dis
char
ge
(cfs
)
06/17/93 06/17/93 06/18/93 06/19/93 06/20/93 06/20/93 06/21/93
Jackson Creek (non-urban) Lincoln Creek (urban)
Source: Masterson and Bannerman, 1994
Figure 4-8. Hydrographs for Urban and Non-Urban Streams
Stream Bank Erosion
Stream bank erosion is a natural phenomenon and source of both sediment and nutrients. However, urbanization can greatly accelerate the process of stream bank erosion. As the amountof impervious area increases, a greater volume of storm water is discharged directly to receivingwaters, often at a much higher velocity. The increased volume and velocity of the runoff canoverwhelm the natural carrying capacity of the stream network. In addition, streams in urbanizedareas can experience an increase in bankfull flows. Since bankfull flows are highly erosive,substantial alterations in stream channel morphology can result.
Excessive bank erosion occurs as streams become wider and straighter to accommodategreater flows and an excess number of erosion-causing events. Signs of stream bank erosionattributable to increased storm water include undercut and fallen stream banks, felled bushes and

4 - 30
trees along the banks, and exposed sewer and utility pipes. Sediments from eroding banks (andupland construction) are deposited in areas where the water slows, causing buildup, destruction ofbenthic habitat, and a decreased stream capacity for flood waters. This ultimately results in agreater potential for further erosion.
Krug and Goddard (1986) documented these phenomena in their study of PheasantBranch, a developing watershed of 24.5 square miles near Middleton, Wisconsin. Localpopulation grew markedly between 1970 to 1980, from 8,246 to 11,851, and is projected to reach18,000 by the year 2000. Problems of stream channel erosion and suspended sediment developedin Pheasant Branch as a result of this growth. The increased erosion and sediment loadings havedecreased the mean stream bed elevation by almost 2 feet, and increased the mean channel widthby nearly 35 percent.
Table 4-12 shows the modeled percent increase at three sites for the volume of the 2-yearflood, bankfull width, and bankfull depth under two development scenarios. These are theprojected development levels in the year 2000 (projected urbanization), and complete urbanizationof the watershed. The projected results are shown relative to pre-development conditions.
Table 4-12. Percent Increase of Two-Year Flood, Bankfull Width, and Bankfull Depthfrom Pre-Development Conditions to Urbanized Conditions (Based on Modeling Results)
Site
Projected Urbanization Complete Urbanization
2-year Width Depth 2-year Width Depth
(Percent Increase from Pre-urbanization)
(Percent Increase from Pre-urbanization)
Site 1 99 40 30 140 60 40
Site 2 324 110 80 361 110 80
Site 3 32 10 10 224 80 60
Source: EPA, 1997a
An example of the impact of urbanization on increased sediment loadings in several smallstreams in Wisconsin before, during and after development is illustrated in Figure 4-9 (Krug andGoddard, 1986). Sediment loads are greatest during construction, but remain elevated afterconstruction relative to pre-development conditions.

4 - 31
Figure 4-9. Sediment Loadings on Small Streams in Wisconsin
0
2000
4000
6000
8000
10000
Cu
mu
lati
ve M
on
thly
Sed
imen
t L
oad
(to
n)
Pheasant Branch at Middleton
South Fork Pheasant Branch
Pheasant Branch at Cemtury
Source: Krug and Goddard, 1986
19801979 19811978
Water Year
Pheasant Branch at Mouth
Cumulative Monthly Sediment Load
Ground Water Recharge
Urbanization can have a major impact on ground water recharge. As shown earlier inFigure 4-1, both shallow and deep infiltration decrease as watersheds undergo development andurbanization. Ground water recharge is reduced along with a lowering of the water table. Thischange in watershed hydrology alters the baseflow contribution to stream flow, and it is mostpronounced during dry periods. Ferguson (1990) points out that “base flows are of criticalenvironmental and economic concern for several reasons. Base flows must be capable ofabsorbing pollution from sewage treatment plants and non-point sources, supporting aquatic lifedependent on stream flow, and replenishing water-supply reservoirs for municipal use in theseasons when [water] levels tend to be lowest and water demands highest.”
Base flows on Long Island, New York were substantially impacted by the construction ofstorm water conveyance systems during the period of rapid development between the 1940s and

4 - 32
1970s. As illustrated in Table 4-13, a steady decline in the average percent of baseflow wasobserved for streams in urbanized sewered areas relative to streams in un-sewered or rural areas(US EPA, 1997a).
Table 4-13. Average Percent Base Flow of Selected Streams on Long Island by Area
Years
Urbanized SeweredArea (% Flow from
Base Flow)
Urbanized Un-seweredArea (% Flow from
Base Flow)
Rural Un-sewered Area(% Flow from Base
Flow)
Stream 1 Stream 2 Stream 1 Stream 2 Stream 1 Stream 2
1948-1953 (No data) 86 84 94 96 95
1953-1964 63 69 89 89 95 97
1964-1970 17 22 83 84 96 97
Source: US EPA, 1997a
4.3.2 Habitat Impacts
Natural ecosystems are a complex arrangement of interactions between the land, water,plants, and animals. The relationship between storm water discharge and the biological integrity ofurban streams is illustrated in Figure 4-10 (Masterson and Bannerman, 1994). As shown, habitatis impacted by changes in both water quality and quantity, and the volume and quality ofsediment. As reported by Schueler (1987), “no single factor is responsible for the progressivedegradation of urban stream ecosystems. Rather, it is probably the cumulative impacts of manyindividual factors such as sedimentation, scouring, increased flooding, lower summer flows,higher water temperatures, and pollution.”

4 - 33
Biological Integrity of Urban Streams
Stormwater Discharges
Toxicity andbioaccumulation
insectsmacroinvertebrates
benthicorganisms
fin fish
shellfish
Degradedbiologicalintegrity
ContaminatedSediments
Excessivelyhigh and low
flows
Poor physicalhabitat
Poor waterquality
Increasedsediment volume
aquaticplants
Source: Adapted from Masterson and Bannerman, 1994
Figure 4-10. Relationship Between Urban Storm Water and Aquatic Ecosystems
Schueler and Claytor (1995) also suggest a direct relationship between watershedimperviousness and stream health (Figure 4-11), and found that stream health impacts tend tobegin in watersheds with only 10-20 percent imperviousness (the ten percent threshold). Asshown, sensitive streams can exist relatively unaffected by urban storm water with good levels ofstream quality where impervious cover is less than 10 percent although some sensitive streamshave been observed to experience water quality impacts at as low as 5 percent imperviousness. Impacted streams are threatened and exhibit physical habitat changes (erosion and channelwidening) and decreasing water quality where impervious cover is in the range of 10 to 25percent. Streams in watersheds where the impervious cover exceeds 25 percent are typicallydegraded, have a low level of stream quality, and do not support a rich aquatic community.

4 - 34
0
20
40
60
Wat
ersh
ed Im
per
vio
us
Co
ver
Level of Stream Quality
good lowfair
Non supporting (>25%)
Impacted (11to 25%)
Sensitive (0 to 10%)
Source: Schueler and Claytor, 1995
Figure 4-11. Relationship Between Impervious Cover and Stream Quality
A summary of water quality impacts on habitat is presented in Table 4-14. The alterationof species distribution is the major impact, with pollutant tolerant and less sensitive speciesreplacing native species in storm water impacted receiving waters.

4 - 35
Table 4-14. Water Quality Parameters Affecting Habitat
Water QualityParameter
Habitat Effect
Bacteria Contamination
Heavy metals Alteration of species distribution
Toxic organics Alteration of species distribution
Nutrients Eutrophication, algal blooms
Sediment Decreased spawning areas
BOD Reduced dissolved oxygen levels
Temperature Reduced dissolved oxygen levels
pH Alteration of species distribution
Figure 4-12 illustrates that the pH tolerance of various forms of aquatic life variessubstantially (US EPA, 1992b). The tolerance of aquatic life to changes in temperature, turbidityand toxic substances is also very important. Contaminants like heavy metals, pesticides, andhydrocarbons can alter the species distribution in receiving waters. Acute and chronic toxicityimpacts may also occur. The relative toxicity of storm water samples from a variety of loadingsource areas is presented in Table 4-15. Some of the identified chronic toxicity effects aredecreased growth and respiration rates (US EPA, 1996a). Toxic loads can reduce the hatchingand survival rates of aquatic organisms, cause gross effects such as lesions or fin erosion in fish,and can eventually destroy the entire population of some sensitive species (Novotny and Olem,1994). Hydrocarbons can be especially detrimental to benthic organisms because they canbecome bound to urban runoff sediments (Schueler, 1987).

4 - 36
pH
Trout
Bass
Perch
Frogs
Salamanders
Clams
Crayfish
Snails
Mayfly
4.07.0 6.5 6.0 5.5 5.0 4.5
Figure 4-12. Low pH Tolerance by Different Species
Source: EPA, 1992b

4 - 37
Table 4-15. Relative Toxicities of Samples Using Microtox® Measurement Method
Local Source Areas Highly Toxic (%) Moderately Toxic (%) Not Toxic (%)
Roofs 8 58 33
Parking areas 19 31 50
Storage areas 25 50 25
Streets 0 67 33
Loading docks 0 67 33
Vehicle service areas 0 40 60
Landscaped areas 17 17 66
Urban creeks 0 11 89
Detention ponds 8 8 84
All source areas 9 32 59
Note: Microtox® results are primarily for comparison purposes.Source: Pitt et al, 1995.
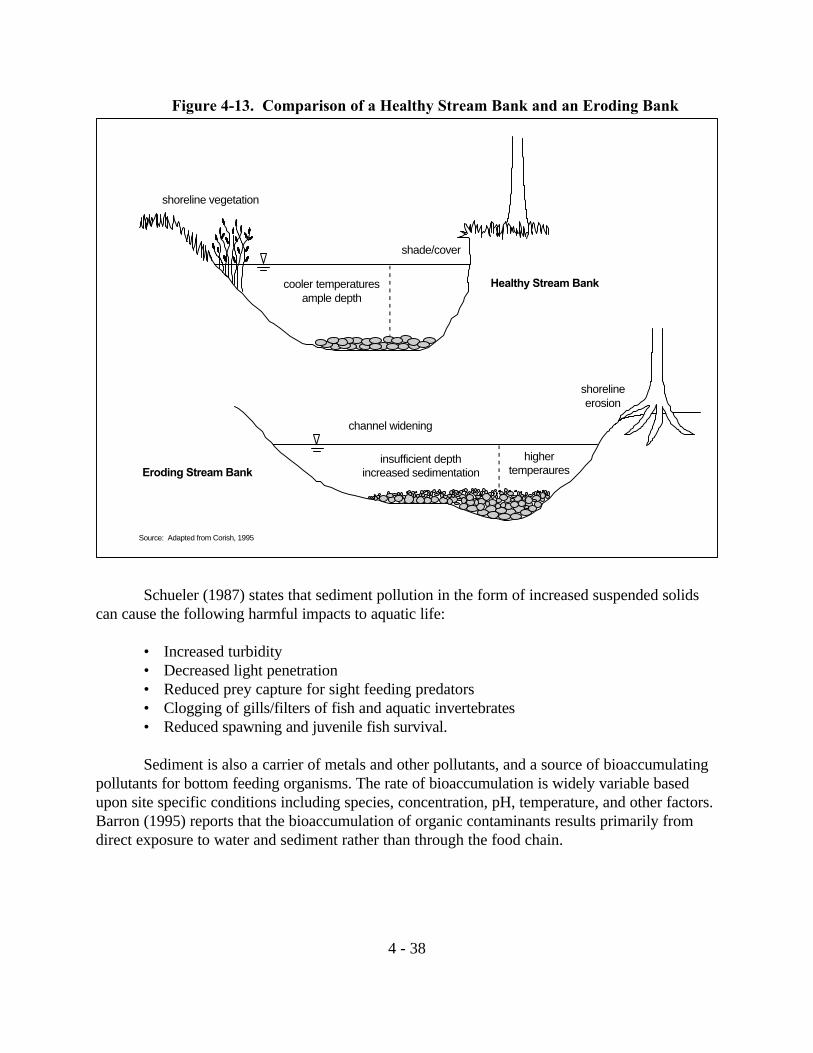
The physical impacts to streams due to urbanization and changes in watershed hydrologyalso cause many habitat changes. As illustrated in the comparison of healthy and eroding streambanks in Figure 4-13, loss of depth, sediment deposition, loss of shoreline vegetation, and highertemperatures combine to impact habitat.
4 - 38
Healthy Stream Bank
Eroding Stream Bank
cooler temperaturesample depth
shoreline vegetation
channel widening
insufficient depthincreased sedimentation
highertemperaures
shorelineerosion
shade/cover
Source: Adapted from Corish, 1995
Figure 4-13. Comparison of a Healthy Stream Bank and an Eroding Bank
Schueler (1987) states that sediment pollution in the form of increased suspended solidscan cause the following harmful impacts to aquatic life:
• Increased turbidity• Decreased light penetration• Reduced prey capture for sight feeding predators• Clogging of gills/filters of fish and aquatic invertebrates• Reduced spawning and juvenile fish survival.
Sediment is also a carrier of metals and other pollutants, and a source of bioaccumulatingpollutants for bottom feeding organisms. The rate of bioaccumulation is widely variable basedupon site specific conditions including species, concentration, pH, temperature, and other factors.Barron (1995) reports that the bioaccumulation of organic contaminants results primarily fromdirect exposure to water and sediment rather than through the food chain.

4 - 39
Macroinvertebrate Impacts
The biological integrity of receiving waters impacted by urban storm water is typicallyreduced from more pristine, undeveloped circumstances. Impacts include a reduction in totalnumbers and diversity of macroinvertebrates, and the emergence of more pollutant-tolerantspecies. In a study in Delaware, it was found that approximately 70 percent of themacroinvertebrate community in streams in undeveloped, forested watersheds consisted ofpollution sensitive mayflies, stoneflies and caddisflies, as compared with 20 percent in urbanizedwatersheds (Maxted and Shaver, 1997). As shown in Table 4-16, the relative abundance ofpollution tolerant organisms increased with urbanization, including worms, midges and beetles.

4 - 40
Table 4-16. Delaware Insect Population Abundance by Degree of Urbanization
Population DescriptionRelative Abundance
by Degree ofUrbanization (%)
Class/ Order Genus speciesCommonName
PT None Low High
Insecta/Trichoptera Diplectrona modesta caddisfly 0 14 2 1
Insecta/Ephemeroptera Ephemerella spp. mayfly 1 12 1 0
Insecta/Plecoptera Allocapnia spp. stonefly 3 10 18 3
Insecta/Ephemeroptera Eurylophella spp. mayfly 1 8 1 2
Insecta/Coleoptera Anchytarsus bicolor beetle 4 6 3 0
Insecta/Ephemeroptera Stenonema spp. mayfly 4 5 3 1
Insecta/Coleoptera Optiservus spp. beetle 4 4 2 8
Insecta/Coleoptera Oulimnius latiusculus beetle 2 4 3 5
Insecta/Trichoptera Cheumatopsyche spp. caddisfly 5 1 10 8
Insecta/Trichoptera Hydropsyche betteni caddisfly 6 1 4 5
Insecta/Diptera Simulium vittatum blackfly 7 0 8 1
Insecta/Diptera Parametriocnemus spp. midge 5 0 0 4
Oligochaeta unidentified (Tubificidae) worm 10 0 0 4
Note: rare organisms (fewer than 4 per 100 organisms) not included. Relative abundance (%) and pollutiontolerance (PT) of macroinvertebrate species commonly found in Piedmont streams of Delaware for three levels ofurbanization; none (0-2% impervious cover), low (6-13%), and high (15-50%); PT range from 0 (low tolerance) to10 (high tolerance).Source: Maxted and Shaver, 1997.
A study by Kohlepp and Hellenthal (1992) quantified the effects of sediment deposits onmacroinvertebrates in Juday Creek, a tributary to the St. Joseph River in Indiana. The studyincluded data before and after upstream channel maintenance operations introduced a largeamount of sediment to the creek, similar to increased sediment yield from urban areas. A dramaticchange in the species distribution of macroinvertebrates in the river was observed, and this wasattributed to the changing sediment load and increased sedimentation. As shown in Figure 4-14,“the result was a shift from a community dominated by filter-feeders in both numbers andproduction rate in 1981-82, to a community in 1989-90 in which less desirable collector-gatherersand shredders increased in importance in terms of relative contribution to both numbers andproduction.”

4 - 41
Proportion by Functional Feeding Group (percent)Figure 4-14. Effects of Sediment Deposits on Macroinvertebrates in Juday Creek, Indiana
Source: Kohlepp and Hellenthal, 1992
Fish ImpactsThe health of an ecosystem is often measured by the abundance and variety of fish species
present, and the presence of native species. A case study in California compared fish populationsin urbanized and non-urbanized sections of Coyote Creek (Pitt, 1995). The relative abundance ofdifferent fish species in the different reaches is presented in Table 4-17. As shown, the native fishare generally replaced by introduced fish in the urbanized section.

4 - 42
Table 4-17. Relative Abundance of Native and Introduced Fish in Urbanized and Non-Urbanized Areas in Coyote Creek, California
SpeciesRelative Abundance (%)
Non-urbanized Reach Urbanized Reach
Native Fish
Hitch 34.8 4.8
Threespine stickleback 27.3 0.8
Sacramento sucker 12.6 0.1
Introduced Fish
Mosquitofish 5.6 66.9
Fathead Minnow 0.6 20.6
Threadfin shad - 2.4
Source: Pitt, 1995
An illustration of the abundance of fish eggs and larvae associated with different levels ofurban land use in New York is presented in Figure 4-15 (Limburg and Schmidt, 1990). Thisgraph supports the “10 percent rule” reported by Schueler and Claytor (1995): stream impactstend to begin in watersheds with only 10 to 20 percent imperviousness.

4 - 43
0
1
2
3
4
Nat
ura
l lo
g o
f M
ean
Den
sity
(#/
m^3
)
0 20 40 60 80 Percent of Watershed in Urban Land Use
Source: Limburg and Schmidt, 1990
10% Threshold
Figure 4-15. Average Densities of Fish Eggs and Larvae in New York
The change in the resident fish community due to urbanization in Tuckahoe Creek inVirginia was quantified by Weaver and Garman (1994). With urbanization increasing the percentof urban land from 7 percent to 28 percent between 1958 and 1990, a dramatic change in the fishassemblage was observed. As shown in Table 4-18, the total number of fish observed droppedsharply along with the total number of species present and the number of common speciespresent.

4 - 44
Table 4-18. Effects of Urbanization on the Fish Community of Tuckahoe Creek, Virginia (Composite of 6 Sites)
Indicator
Fish AssemblageYear
1958 1990
% Urban (by land area) 7 28
total abundance 2,056 412
# species - total 31 23
# species - common* 21 6
% bluegill/shiner 28 67
* more than 10 individualsSource: Weaver and Garman, 1994
4.3.3 Public Health Impacts
Public health impacts associated with urban storm water occur when humans ingest orcome in contact with pathogens. While these impacts are not widely reported, they do occur, andsome impacts have been documented. Examples related to swimming and contact recreationimpacts and shellfish impacts are presented.
Contact Recreation Impacts
Beach closures are a common occurrence in many communities throughout the UnitedStates. Beach closures are primarily due to high levels of bacteria in water samples. Thepresence of medical waste and other dangerous floatable substances on beaches can also causebeach closures to occur. Storm water runoff can be responsible for both bacteria and floatables. Elevated levels of bacteria and viruses represent the most common threat to public health. Diarrhea and infection of the ear, eye, nose, or throat are possible.
A study of epidemiological impacts associated with swimming in the vicinity of stormwater outfalls in Santa Monica Bay in California was conducted in 1995 (SMBRP, 1996). Thestudy focused on health effects, and not on possible sources of contamination to the storm drain

1 Pilot studies conducted in the Bay prior to 1995 noted that some outfalls had regular dryweather discharges; this is a common indicator of storm drain contamination (SMBRP, 1990;SMBRP, 1992).
4 - 45
system, such as illicit sewage connections and infiltration.1 While the effects observed may beatypical of properly constructed and maintained storm drain outfalls, the findings indicate thepotential health risks associated with pathogens. Major findings of this study are as follows:
• There is an increased risk of illness associated with swimming near flowing storm drainoutlets in Santa Monica Bay.
• There is an increased risk of illness associated with swimming in areas with high densities of bacterial indicators.
• The total coliform to fecal coliform ratio was found to be one of the better indicatorsfor predicting health risks.
• Illnesses were reported more often on days when the samples were positive for entericviruses.
• High densities of bacterial indicators were measured on a significant number of surveydays, particularly in front of drains.
People who swim in areas adjacent to flowing storm drains were found to be 50 percentmore likely to get sick than people who swam in other areas. The sicknesses included fever,nausea, gastroenteritis, and flu-like symptoms such as nasal congestion, sore throat, fever, orcoughing. As illustrated in Figure 4-16, swimmers who swam directly in front of storm drainswere much more likely to become ill than those who swam away from the storm drains atdistances of 100 to 400 meters. A comparative health outcome in terms of relative risk forswimming in front of the storm drain vs. swimming 400 meters away is presented in Table 4-19.

4 - 46
Figure 4-16. Health Effects Observed Relative to Distancefrom Santa Monica Bay Storm Drains
Source: Santa Monica Bay Restoration Project, 1996

4 - 47
Table 4-19. Comparative Health Outcomes for Swimming in Front of Drains inSanta Monica Bay
Health Outcome
Relative Riskfor Swimming
in Front ofDrains*
Estimated No. Of Excess Casesper 10,000 Persons
Fever 57% 259
Chills 58% 138
Ear Discharge 127% 88
Vomiting 61% 115
Coughing with phlegm 59% 175
Any of the above symptoms 44% 373
HCGI-2 111% 95
SRD 66% 303
HCGI-2 or SRD 53% 314
* Compared to swimming 400 meters or more away from drainsSource: Santa Monica Bay Restoration Project, 1996
Seafood Hazard
The consumption of contaminated seafood, particularly shellfish, is a major public healthproblem. Shellfish are susceptible to bioaccumulating bacteria and viruses because they are filterfeeders. In waters polluted by urban runoff, bacteria and viruses can be concentrated in theshellfish to much higher levels than those found in the surrounding waters. This becomes a publichealth concern because many potentially harmful bacteria and viruses can be ingested when peopleeat contaminated shellfish. As shown in Figure 4-17, the largest proportion of shellfishharvesting restrictions are caused by urban runoff (US EPA, 1995a).

4 - 48
Figure 4-17. Sources Associated with Shellfish Harvesting Restrictions, in Percent
Source: US EPA, 1995a
Fish can also be contaminated for a number of reasons. Recent fish sampling surveys inregions of the U.S. have shown widespread mercury contamination in streams, wetlands,reservoirs, and lakes. Based on 1997 data, 33 states have issued fish consumption advisoriesbecause of mercury contamination (US EPA, 1998a). Mercury is an urban/industrial pollutantthat is released into the air and ends up in urban runoff by atmospheric deposition (Krabbenhoftand Rickert, 1995). The effects of fish contamination go beyond health issues, and hurt therecreational fishing industry as a whole.
4.3.4 Aesthetic Impacts
The aesthetic impacts associated with urban storm water are often difficult to quantify. However, aesthetic impacts are often very visible to the general public. EPA reports that “peoplehave a strong emotional attachment to water, arising from its aesthetic qualities--tranquillity,coolness, and beauty” (US EPA, 1995c). The presence of floatables within urban waters anddeposited along the banks of waterways represents a common aesthetic impact in most urbansettings. Floatable wastes originate from street litter and improper solid waste disposal practices. The average total street debris loading rate in New York City was quantified at approximately156 pounds per curb-mile per day, with a range from 3 to 2,700 pounds (HydroQual, 1995).

4 - 49
Aesthetic impacts from the eutrophication of urban waterways is caused in part bynutrients delivered in urban storm water. As reported by Schueler (1987), aesthetic impacts andnuisance conditions associated with eutrophication can include:
• Surface algal scum• Water discoloration• Strong odors• Release of toxins.
The visual damage to urban streams from accelerated rates of storm water runoff alsocontribute to aesthetic impacts. These include eroded stream banks, fallen trees, andsedimentation. In summary, aesthetic impacts are often very visible in public areas whereshoreline recreation occurs. Aesthetic impacts are therefore the storm water impacts mostfamiliar to the general public.