4 world conference on structural control and monitoringcocteau/papers/pdf/4wcscm.pdf · 4th world...
TRANSCRIPT

4th World Conference on Structural Control and Monitoring 4WCSCM-277
Baek, Hansen, Nigbor, and Tileylioglu 1
ELEVATORS AS AN EXCITATION SOURCE FOR
STRUCTURAL HEALTH MONITORING IN BUILDINGS
Jong-ho Baek, Mark H. Hansen, Robert L. Nigbor, and Salih TileyliogluUniversity of California, Los Angeles, CA, 90095 USA
[email protected], [email protected], [email protected], [email protected]
Abstract
Robust structural health monitoring (SHM) benefits from a repeatable excitation source, but in buildings and other civilengineering structures this is problematic for many technical and practical reasons. Ambient vibrations are therefore often usedinstead of artificial vibration excitation for repeated system identification of such civil structures. In tall buildings, the movementof elevators contributes to the mix of ambient vibrations. In this paper, we investigate the feasibility of using elevator motion as astatistically repeatable excitation for use in SHM of tall buildings. The 17-story Factor Building on the UCLA campus is heavilyinstrumented for earthquakes, and has high-resolution real-time continuous recording of vibration data. There are 72accelerometers distributed throughout the building in addition to nearby ground motion and borehole reference accelerometers.Using Factor as a test bed, we have conducted the following studies of elevator-induced building vibrations: A) Excitation with asmall (100-lb) shaker placed adjacent to an elevator shaft to estimate frequency response/acceleration; B) Direct measurement ofelevator counterweight vibrations to estimate the horizontal elevator forcing function; C) Correlation of elevator motion withmeasured structural vibrations; and D) Correlation of measured elevator forces with measured building vibrations. Initial resultsindicate that elevator-induced vibrations are statistically separable from other ambient vibration components in both the time andfrequency domains. However, it may be necessary to add additional data channels measuring elevator position and/or elevatorcounterweight vibrations. Work continues on the development of a methodology to use the elevators as a repeatable source forSHM of the Factor Building.
Introduction
The experiments discussed in this paper take place in the UCLA Doris and Louis Factor Building, a 17-story steel-frame structure on the UCLA campus. Following the 1994 Northridge earthquake, the U.S.Geological Survey, in partnership with the UCLA Center for Embedded Networked Sensing (CENS),deployed a 72-accelerometer seismic array throughout Factor, making it one of the most heavilyinstrumented buildings in North America. The design of the array is simple: There are four accelerometerchannels per floor - two horizontal NS and two horizontal EW components. The current accelerometershave a natural frequency of 200 Hz with a measurement bandwidth of 0 to 50 Hz (Skolnik, 2005). Thearray operates continually, generating data that are continuously recorded in real-time by a 24-bitresolution data acquisition system. For the most part this huge amount of data remains untouched until asignificant seismic event takes place. At that point, researchers examine how the earthquake’s motiontranslates through the various floors of the building, providing insight into the structural characteristics ofFactor (See Kohler et al, 2005; http://factor.gps.caltech.edu/ and Fig. 1).
Our goal with this paper is to make use of the microseismic events that take place in the buildingeveryday. We are hoping to capitalize on routine, natural experiments to identify vibrations patterns thatcan be monitored over the long term and possibly used to detect degradation or other changes in thestructure. In the parlance of structural health monitoring (SHM), we are proposing a kind of “shadow”sensor network that will allow us to identify significant components of the Factor’s ambient vibrations. Inits most direct implementation, SHM involves excitation with a (known) repeatable source of vibration. Ininhabited buildings like Factor (which houses auditoriums, classrooms, laboratories, and offices) this kindof experimentation is not feasible, and SHM researchers look to ambient vibrations. Unfortunately, themany sources of ambient vibrations are inherently variable: the movements of people in the building, theoperation of lab equipment, and even the traffic patterns outside the building. Therefore, in this paper weconsider ambient vibration sources that have the repeatability of traditional SHM excitation sources, but

Baek, Hansen, Nigbor, and Tileylioglu 2
occur “naturally” in the building. Repetition is key as it helps us characterize the statistical properties ofthe building response (Beck et al., 1994).
Figure 1. (a) Diagram of Factor building sensor locations. Arrows show polarities of sensors on each floor.
(b) The position of elevator (red) and one of building’s seismic sensors (blue).
In this paper, we examine elevator motion as a potentially repeatable source of vibrations to support SHMefforts. In tall buildings like Factor, elevators move at sufficient speeds to generate observable vibrationpatterns. After preliminary discussions with Factor’s facilities personnel, we focused on the elevator’scounterweight, a large mass that rides in a track along the back wall of the elevator shaft, oriented in anEW direction. The counterweight is roughly 6,500 lbs and is guided up the track by rubber rollers. Thereare two primary sources of vibration associated with an elevator counterweight: First, the wheels thatguide the counterweight can develop flat spots, producing vibrations at high speeds; and second, the trackitself can have irregularities that introduce vibrations at specific locations along the shaft. From an SHMperspective, this excitation source is repeatable (and in fact repeats many times over the course of a dayon its own) although it’s precise spectral characteristics are not known and will change slowly over time.
Our early work (literally riding the elevator, recording timeswhen the car was in motion and extracting building responses)indicated that short hops (trips fewer than 9 floors in length)do not provide sufficient excitation to register on the Factor’sseismic array. To get a sense of how common longer trips are,we conducted an informal survey of Factor elevator usage,tracking the frequency of trips of different lengths (in floors)during the week. (Activity on the weekend is very light;Factor is locked weekends). As we can see from Table 1,longer trips account for approximately 25% of the elevatoractivity during the week. We next conducted a series ofexperiments to help characterize the building’s response to
elevator activity. In the pages that follow, we describe a series of forced vibration studies, a more detailedanalysis of the building’s response to elevator movement, and finally measurements taken on thecounterweight itself to help describe the excitation.
Forced vibrations
From our early discussion with Factor’s facilities personnel and our own preliminary study of trip lengths,we designed a preliminary experiment to assess the response of the building to elevator-like vibrations.We positioned a 100-lb shaker (an APS Dynamics Model Electroseis 400) near the main bank of elevators
TimeTripLength Morn. Noon Eve.
1-4 18 50 26
5-8 14 27 32
9-12 5 22 12
13-16 4 10 8
Total 41 109 78
Table 1. Frequency of elevator trips
Baek, Hansen, Nigbor, and Tileylioglu 3
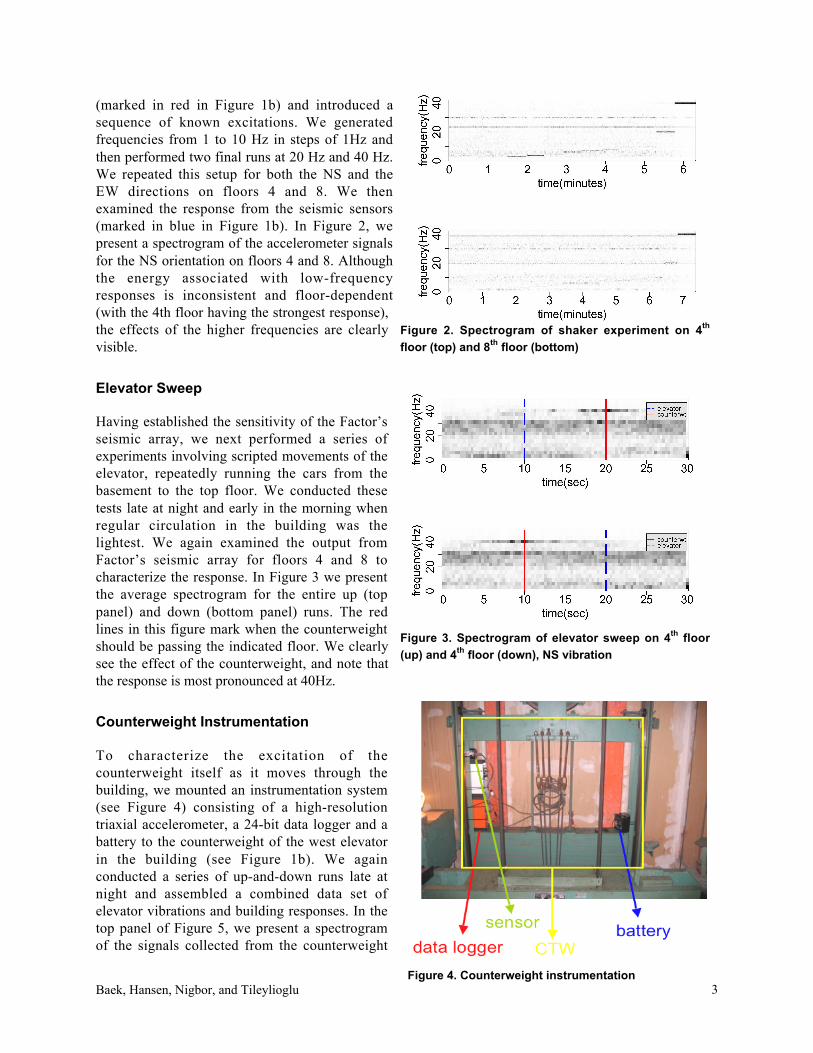
(marked in red in Figure 1b) and introduced asequence of known excitations. We generatedfrequencies from 1 to 10 Hz in steps of 1Hz andthen performed two final runs at 20 Hz and 40 Hz.We repeated this setup for both the NS and theEW directions on floors 4 and 8. We thenexamined the response from the seismic sensors(marked in blue in Figure 1b). In Figure 2, wepresent a spectrogram of the accelerometer signalsfor the NS orientation on floors 4 and 8. Althoughthe energy associated with low-frequencyresponses is inconsistent and floor-dependent(with the 4th floor having the strongest response),the effects of the higher frequencies are clearlyvisible.
Elevator Sweep
Having established the sensitivity of the Factor’sseismic array, we next performed a series ofexperiments involving scripted movements of theelevator, repeatedly running the cars from thebasement to the top floor. We conducted thesetests late at night and early in the morning whenregular circulation in the building was thelightest. We again examined the output fromFactor’s seismic array for floors 4 and 8 tocharacterize the response. In Figure 3 we presentthe average spectrogram for the entire up (toppanel) and down (bottom panel) runs. The redlines in this figure mark when the counterweightshould be passing the indicated floor. We clearlysee the effect of the counterweight, and note thatthe response is most pronounced at 40Hz.
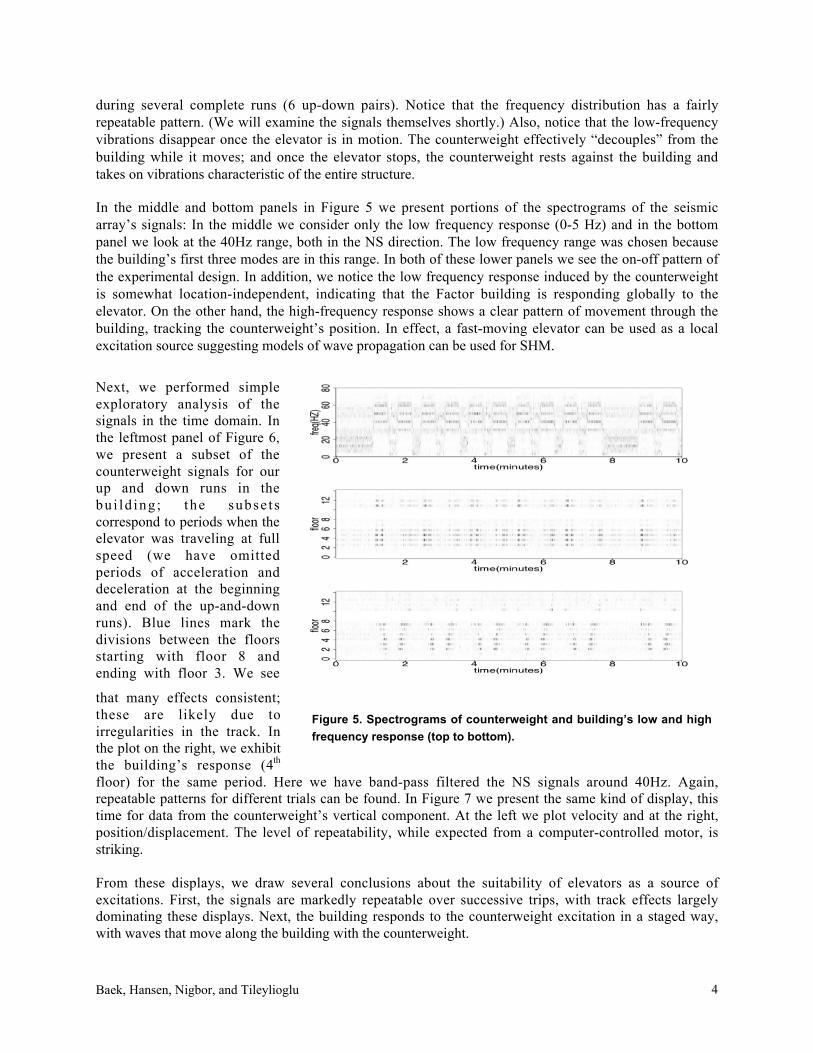
Counterweight Instrumentation
To characterize the excitation of thecounterweight itself as it moves through thebuilding, we mounted an instrumentation system(see Figure 4) consisting of a high-resolutiontriaxial accelerometer, a 24-bit data logger and abattery to the counterweight of the west elevatorin the building (see Figure 1b). We againconducted a series of up-and-down runs late atnight and assembled a combined data set ofelevator vibrations and building responses. In thetop panel of Figure 5, we present a spectrogramof the signals collected from the counterweight
Figure 4. Counterweight instrumentation
Figure 3. Spectrogram of elevator sweep on 4th floor
(up) and 4th floor (down), NS vibration
Figure 2. Spectrogram of shaker experiment on 4th
floor (top) and 8th floor (bottom)
Baek, Hansen, Nigbor, and Tileylioglu 4
Figure 5. Spectrograms of counterweight and building’s low and high
frequency response (top to bottom).
during several complete runs (6 up-down pairs). Notice that the frequency distribution has a fairlyrepeatable pattern. (We will examine the signals themselves shortly.) Also, notice that the low-frequencyvibrations disappear once the elevator is in motion. The counterweight effectively “decouples” from thebuilding while it moves; and once the elevator stops, the counterweight rests against the building andtakes on vibrations characteristic of the entire structure.
In the middle and bottom panels in Figure 5 we present portions of the spectrograms of the seismicarray’s signals: In the middle we consider only the low frequency response (0-5 Hz) and in the bottompanel we look at the 40Hz range, both in the NS direction. The low frequency range was chosen becausethe building’s first three modes are in this range. In both of these lower panels we see the on-off pattern ofthe experimental design. In addition, we notice the low frequency response induced by the counterweightis somewhat location-independent, indicating that the Factor building is responding globally to theelevator. On the other hand, the high-frequency response shows a clear pattern of movement through thebuilding, tracking the counterweight’s position. In effect, a fast-moving elevator can be used as a localexcitation source suggesting models of wave propagation can be used for SHM.
Next, we performed simpleexploratory analysis of thesignals in the time domain. Inthe leftmost panel of Figure 6,we present a subset of thecounterweight signals for ourup and down runs in thebu i ld ing ; the subse t scorrespond to periods when theelevator was traveling at fullspeed (we have omittedperiods of acceleration anddeceleration at the beginningand end of the up-and-downruns). Blue lines mark thedivisions between the floorsstarting with floor 8 andending with floor 3. We see
that many effects consistent;these are likely due toirregularities in the track. Inthe plot on the right, we exhibitthe building’s response (4th
floor) for the same period. Here we have band-pass filtered the NS signals around 40Hz. Again,repeatable patterns for different trials can be found. In Figure 7 we present the same kind of display, thistime for data from the counterweight’s vertical component. At the left we plot velocity and at the right,position/displacement. The level of repeatability, while expected from a computer-controlled motor, isstriking.
From these displays, we draw several conclusions about the suitability of elevators as a source ofexcitations. First, the signals are markedly repeatable over successive trips, with track effects largelydominating these displays. Next, the building responds to the counterweight excitation in a staged way,with waves that move along the building with the counterweight.

Baek, Hansen, Nigbor, and Tileylioglu 5
Figure 6. Acceleration of the counterweight (left) and 4th floor sensor response (right), both as a function of
displacement of the counterweight along the elevator shaft.
Figure 7. Velocity of the counterweight (left) and displacement (right) as a function of time: These arecomputed by numerically integrating (taking cumulative sum) of the acceleration signal. Note that the rangeon velocity plots is quite small (0.12cm/s).

Baek, Hansen, Nigbor, and Tileylioglu 6
Preliminary Analysis
Using data like those in Figures 6 and 7, with combinations of counterweight signals (inputs) and buildingsensor responses (outputs), we computed the contribution of the elevator to the overall energy of thebuildings 4th floor accelerometers. We computed the power spectrum for two time periods, one when theelevator is at rest (and is effectively coupled with the building; see the top plot in Figure 5) and the otherwhen the elevator is traveling past the 4th floor at full speed. Given our experimental design, choosing torun the length of the building during quiet periods, we assume that the difference in power is due to theelevator. As we mentioned previously, each floor has four sensors at different locations. On the 4th floor,for example, there are four sensors, the one on the east end of the building being the farthest from theelevator (with a NS orientation) and the one at the west end being closest (also with a NS orientation).Because the percentage of high frequency energy felt by these sensors is proportional to their physicaldistance from the elevator shaft, we expect to see smaller effects at the distant sensors. Also, thecounterweight’s track is oriented NS, so we expect to see more vibration in the NS direction. Table 2presents the calculated percentages of RMS acceleration as the difference between quiet and activeelevator sweeps. Notice that the energy in low frequencies is almost evenly distributed in the 20 to 30%range. This implies that the global modes of the Factor building are responding to elevator excitation.
Frequency Range North South East West
Broadband 0-80Hz 22.6% 8.3% 6.4% 14.4%
Low Frequency 0-5Hz 30.3% 21.0% 38.2% 27.0%
High Frequency 37-43Hz 58.2% 29.2% 21.5% 74.1%
Table 2. Elevator contribution to total RMS acceleration for the fouraccelerometers on floor 4
4Next, we attempt to characterize propagation of the elevator signal through the building. We commentthat this analysis is preliminary and incomplete. Initially, we compute simple correlations between thecounterweight and the sensors on the different floors. We first bandpass filter the signals around 40Hz,corresponding to our previous observation that these high frequencies propagate through the buildingfrom the elevator. We focus on floors 2 through 8 because the elevator runs at full speed between thesefloors. In Figure 8 we present correlation curves over time; we see the floor-by-floor shift and peaksaround floors 3-5 (and attenuating effects) for all three days. Simple correlations of this kind assume asimple linear relationship between the counterweight (inputs) and the building response (outputs).
The plots in Figure 6, however, give us reason to question this simple model. From Figure 6, we seeclearly that the excitations are nonstationary, primarily due to track effects. To characterize this signal, wehave examined simple methods that attempt to divide the signal into stationary pieces (Adak, 1998). Weare also considering models used in speech processing, and specifically hidden Markov models.Connecting these descriptions to the building response will be challenging given the nonlinear effectsnoted in the previous paragraph. As a preliminary attempt at examining this kind of relationship, weconducted an “envelope analysis.” Our input signal consists of different time segments, each with adifferent dominant set of frequencies. The amplitude of the vibration in each time window varies slowlywith time, and the shape of this variation is the envelope. The envelope contains important informationabout the signal. By using the Hilbert transform (Bendat et al. 2000), the rapid oscillations can beremoved from the signal to produce a direct representation of the envelope alone. This has advantagesover original signal because removal of the oscillations allows detailed study of the envelope.

Baek, Hansen, Nigbor, and Tileylioglu 7
Figure 8. Acceleration of counterweight (left) and 4th floor sensor (right) by building’s height
The Hilbert transform, H(f) is used to calculate a new time signal from the original time signal f. Themagnitude of the envelope can be directly calculated from both f and H(f) as
€
f 2 + {H( f )}2
One of the Hilbert transform applications is the estimation of propagation time from the correlationfunction. The propagation time (from point A to B) of signals is usually estimated by measuring thesignal at A and B, and calculating the correlation. By using the Hilbert transform, the correct propagationtime can easily be found from the envelope of the correlation function, whether or not the peak of thecorrelation corresponds to the envelope maximum. (Bendat and Piersol 2000).
Keeping this tool in our mind, we prepared plots of all test sets more carefully to identify repeated trackeffects. We estimated the start/end point associated with these several short track effects. For each run, weobtained the envelope signal from Hilbert transform to correlate the input signal with the buildingresponse for all floors in the wake of the counterweight. Next, we computed a sliding correlation with theenvelope transform. Here, the direction of counterweight matters to avoid overlapping the wavepropagation with the counterweight’s movement. Also, since the wave propagation happens within a veryshort time period, the time scale should be small. Figure 9 shows the output to estimate the counterweightwave propagation. The shift among floors is similar to previous correlation shift plot. This is a moreelegant way of showing the wave propagation of counterweight over the floors in a short time period.
Summary and Future Research
We have demonstrated that the elevators in the Factor Building can provide statistically separable signalsthat can be used for Structural Health Monitoring. Admittedly, these signals were studied under optimalconditions, in the very early morning when the building was vacant and we had full control of the elevatoroperations. However, these conditions are easily repeatable.
Simple time domain or short-time FFT (spectrogram) analyses show the potential in the measurement ofbuilding response to elevator-induced forces. At the low-frequency end of the vibration spectrum, from0-5Hz, the elevator excites global building motions in the lowest few modes of vibration; these data couldbe used in global SHM. At the high-frequency end, there is a concentration of local building responseenergy around 40 Hz, probably due to the elevator’s mechanical system. This vibration is veryrepeatable, and is responsible for as much as 74% of the rms vibration measured near the elevator on thebuilding structure. This repeatable energy source is a potential source for local SHM techniques.

Baek, Hansen, Nigbor, and Tileylioglu 8
At present, studies are underway to better characterize the elevator’s effect on building vibrations. Ashadow network is being introduced that will track the location of the elevators in the building andprovide automatic tagging of long sweeps through the building. In parallel, we are creating formalstatistical models to characterize propagation of this vibration source as it moves through the building.These models will evolve in time, allowing for slow changes to the counterweight signals. We areconsidering models that both require extra counterweight instrumentation as well as those that do not.Finally, we are looking to other engineered systems (e.g. HVAC) that could be folded into our shadownetwork and explain more of the ambient vibrations.
Figure 9. Correlation between Hilbert transformed counterweight and floor sensors
Acknowledgements
The authors gratefully acknowledge the support by the UCLA Center for Embedded Networked Sensingand the helpful discussions with UCLA colleagues. Finally, this effort would be impossible without helpfrom UCLA Facilities Management, Steve Osterday, Steve Kang, the resources of NEES@UCLA, andthe support of the U.S. Geological Survey’s Advanced National Seismic System.
References
Adak, S. (1998), Time-dependent Spectral Analysis of Nonstationary Time Series, Journal of the American StatisticalAssociation, 93, 1488-1501.
Beck, J., May, B., and Polidori, D. (1994), “Determination of modal parameters from ambient vibration data for structural healthmonitoring”, In Proceedings of the First World Conference on Structural Control.
Bendat, J. S. and Piersol, A. G. (2000), Random Data. Wiley, New York.Carmona, R., Hwang, W. and Torresani, B. (1998), Practical Time Frequency Analysis, Academic Press, San Diego.Chopra, A. (1995), Dynamics of Structures: Theory and Applications to Earthquake Engineering, Prentice Hall, Upper Saddle
River, NJ.Kohler, M., Davis, P., and Safak, E. (2005), “Earthquake and Ambient Vibration Monitoring of the Steel Frame UCLA Factor
Building”, Earthquake Spectra, Vol. 21, No. 3.Kramer, S.L. (1996), Geotechnical Earthquake Engineering, Prentice Hall, Upper Saddle River, N.J.Rildova. (2004), “Seismic Performance of Rail-Counterweight System of Elevator in Buildings”, PhD thesis, Virginia
Polytechnic Institute and State University.Safak, E. (1999), “Wave Propagation Formulation of Seismic Response of Multi-story Buildings”, Journal of Structural
Engineering, ASCE, Vol. 125, No. 4, pp. 426-437.Skolnik, D. (2005), “Identification, Model Updating, and Response Prediction of an Instrumented 15-Story Steel Frame
Building”, MS thesis, University of California, Los Angeles.UCLA CENS Homepage, http://www.cens.ucla.eduUCLA Factor Seismic Array, http://factor.gps.caltech.eduVenables, W.N. and Ripley, B.D. (1999), Modern Applied Statistics with S-PLUS, Springer-Verlag, New York.