4. the population-genetic environment
TRANSCRIPT

æ
4. THE POPULATION-GENETIC ENVIRONMENT
8 October 2021
The paths open to evolutionary change depend on pre-existing conditions, as all evo-lutionary processes operate by modifying extant genotypic variation. However, tounderstand the kinds of modifications that are evolutionarily possible, one must startwith an appreciation of population-genetic processes, as the three major dimensionsof the population-genetic environment ultimately dictate what natural selection canand cannot accomplish. Mutation gives rise to the variation upon which evolutiondepends. Recombination reassorts variation between nucleotide sites among indi-viduals in ways that can either accelerate or impede evolutionary progress. Finally,random genetic drift serves as a lens on the evolutionary process, modulating thelevel of noise in allele transmission across generations, hence dictating the efficiencyof selection. Although it is tempting to stare at biodiversity and spin adaptivestories as to why things are so, doing this in an absence of an understanding ofevolutionary genetic processes invites the pixies in.
The following three chapters introduce in a nontechnical way the minimum setof principles required to construct a logical evolutionary argument. In addition tointroducing some of the most elementary aspects of evolutionary theory, this chapterwill summarize the state of knowledge on the three dimensions of the population-genetic environment. All three factors will be shown to vary by several orders ofmagnitude across the Tree of Life, albeit in nonindependent ways. In particular,mutation and recombination rates will be shown to be strongly influenced by thepower of random genetic drift.
Quantitative information on how these forces are distributed across species iscritical to understanding inter-species divergence. For example, if the power ofgenetic drift exceeds the strength of selection operating on a particular variant, thelatter will be essentially immune to selection and will evolve in the direction dictatedby any prevailing mutation bias. This means that in species experiencing low levelsof random genetic drift (small microbes), natural selection can take advantage ofmutations of small effects that are unavailable to adaptive exploitation in speciesexperiencing higher levels of noise.
We will start with a more formal presentation of the preceding ideas. First,random genetic drift will be shown to be influenced by both population size andchromosomal architecture, leading to the concept of a genetic effective populationsize (Ne), which can be orders of magnitude smaller than the actual census size.Second, it will be shown how drift competes with the selection process, with 1/Ne
defining an approximate benchmark above and below which selection operating on amutation is effective vs. ineffective. Third, patterns of variation in rates of mutationand recombination across the Tree of Life will be shown to be consistent with somerelatively simple models based on random genetic drift. Further technical details on

2 CHAPTER 4
these matters can be found in Walsh and Lynch (2018, Chapters 2-7). Drawing fromthe information presented here, the following two chapters will take things a stepfurther by considering more specifically how the population-genetic environmentmodulates various processes involved in cellular evolution.
Demystifying Random Genetic Drift
Critical to understanding all aspects of evolution is the large role of chance in deter-mining the fates of mutant alleles. Consider a newly arisen mutation in a haploidpopulation of N individuals, each of which produces a large number of gametes. Toproduce the next generation, N newborns must be drawn from this pool. Becausea new mutant allele is present in a single copy, it has a frequency of 1/N, and theprobability that a randomly drawn gamete is not of this type is [1 − (1/N)]. Thereis then a [1 − (1/N)]N ' e−1 ' 0.368 chance that none of the newborns contain themutation, in which case the new mutation is lost in the first generation. Althoughthis result assumes a neutral mutation, the probability of immediate loss is not muchdifferent for an allele with fractional benefit s, as the previous expression generalizesto {1−[(1+s)/N ]}N ' e−(1+s), which is 0.333 when s = 0.1 (an enormous 10% selectiveadvantage, far beyond what is typically observed in nature). If the population isdiploid, a 2N is substituted for N in the preceding expressions, but the results arethe same. Thus, natural selection is a wasteful process in that the vast majority ofnew mutations, no matter how beneficial, are lost by chance.
If the mutant allele is fortunate enough to survive the first generation, the pro-cess of stochastic sampling will occur again. Each generation, the allele frequencycan wander up or down, but due to the cumulative effects of this sorting processover many generations, all mutant alleles eventually suffer the fate of either loss(returning to a frequency of 0.0) or fixation (progressing to a frequency of 1.0) (Fig-ure 4.1). For a neutral mutation, there is no directional pressure on the frequencychange across generations, and the probability of fixation is simply equal to theinitial frequency (1/N for a new mutation in a haploid population, and 1/(2N) in adiploid).
If over a series of generations, a beneficial mutation does wander to a sufficientlyhigh density, so that the probability of chance loss in any particular generation be-comes small relative to the strength of selection, then natural selection can propelit to eventual fixation in a nearly deterministic fashion. The critical frequency de-pends on a key feature known as the effective population size, generally abbreviatedas Ne. Only in an ideal population, where each adult has an equal probability ofcontributing to each offspring and family sizes are completely random, does Ne equalthe absolute population size N.
Nearly every conceivable property of natural populations conspires to cause apopulation to behave genetically as though it is much smaller than its actual size.For example, owing to some individuals acquiring more resources than others orattracting more predators or pathogens, nonrandom variation in family size causesgene transmission to the next generation to be dominated by the most successfulindividuals. In addition, because each individual in a sexual population has twoparents, with an uneven sex ratio, the genetic effective population size will more

POPULATION-GENETIC ENVIRONMENT 3
closely resemble the number of the rarer sex. Population subdivision can furtherreduce the species-wide Ne, as individual demes become increasingly inbred, andreflect the states of smaller numbers of gametes than expected under panmixia.And finally, fluctuations in population size have a major effect because reductionsin numbers of individuals have a much more substantial influence on sampling noisethan do increases.
All of the factors just noted can be viewed as being defined by ecological fac-tors imposed on species, without regard to their genetic constitution. However, aneven more important determinant of gene-transmission stochasticity is the physi-cal structure of the genetic machinery itself, and this is particularly true in largepopulations. Because genes are physically connected on chromosomes, the fate of anew mutation is determined by the states of the nucleotide sites to which it is ini-tially chromosomally linked (Figure 4.2). A beneficial mutation that arises adjacentto other segregating alleles whose collective effects are sufficiently deleterious willbe removed from the population unless it can be rapidly freed from such a back-ground by recombination. Because the vast majority of mutations have deleteriouseffects, this kind of background-selection process (Charlesworth 2012) is expectedto be on-going in all populations, but will be more significant in large populations,which generally harbor more variation (below). In contrast, a sufficiently beneficialmutation that is propelled to fixation by natural selection will drag all other linkedmutations to fixation as well (including those that are mildly deleterious). Suchselective sweeps have the same effect as a bottleneck in population size, althoughthe effects of each sweep are restricted to specific chromosomal regions.
No population can avoid stochastic effects associated with finite numbers of indi-viduals and chromosomal linkage, but what is the expected magnitude of generation-to-generation fluctuations? We start with the simple situation in which the noisein the evolutionary process is entirely due to random sampling of parental gametesacross generations, as this is identical to a coin-flipping problem. Imagine two alle-les, A and a, with respective frequencies in the population equal to p and (1− p). IfN alleles are randomly drawn to produce the next generation, as in an ideal hap-loid population, the frequency of A in the next generation will almost certainly beslightly different than p, just as the summed fraction of heads drawn from throwsof an unbiased coin will deviate slightly from 0.5. The variance in allele frequencyamong independent sets of N draws equals p(1− p)/N, showing that the smaller thenumber of draws (N), the larger the change in p across generations. (This becomesp(1− p)/(2N) in a diploid population).
Although random genetic drift is a relentless process, these results imply that theconsequences of drift unfold on longer time scales in larger populations. Consider theearly generations of the drift process for a neutral allele with intermediate frequency.As the process has no memory, the variance in allele-frequency change is cumulativeacross generations, i.e., p(1 − p)/N after the first generation, and approximately2p(1 − p)/N after the second generation, and tp(1 − p)/N after the tth generation(provided t � N). Thus, if the population size is doubled, it will take twice thenumber of generations to achieve the same level of allele-frequency change as in apopulation of size N . The key issue is that the time scale of random genetic driftis inversely proportional to the population size (Figure 4.1). As discussed furtherbelow, this linear scaling eventually breaks down as all alleles become fixed or lost.

4 CHAPTER 4
The deeper problem here is the one noted above – that the absolute number ofindividuals in the population, N , is generally not sufficient to define the stochastic-ity of allele-frequency change. To accommodate the substantial complexity of theproblem, population geneticists rely on the effective-population size concept. Thegoal is to determine the size of an ideal population (like that envisioned in the pre-ceding paragraph) that most closely mimics the between-generation dispersion ofallele frequencies experienced by the actual population. In other words, given themyriad of usually undefined ecological and genome-architectural issues, we desire acomposite measure of the effective population size (Ne) that yields a dispersion ofallele frequencies across generations approximately equal to p(1− p)/Ne.
This concept of an effective measure of an assumed underlying parameter maybe viewed as an oversimplification by some readers. However, although usuallyunstated, the use of surrogate measures underlies a myriad of model-fitting exer-cises in science – we attempt to reason out a theoretical framework to explain anexpected set of observations based on assumed underlying mechanisms, and thenobtain model parameter estimates that best fit the data. The limitations of thehuman mind demand such simplification, and in biology, we are often not botheredif an approximation leads us astray by no more than a few percent.
Numerous mathematical formulations have been developed to explicitly link Ne
to N under various conditions involving demography and chromosomal architecture(Walsh and Lynch 2018, Chapter 3). Although these can be difficult to implement ina practical sense, the general view is that, owing to the totality of genetic-interferenceeffects, for populations with absolute sizes in the range of unicellular species, Ne
grows only logarithmically with N, increasing ∼ 2× with each tenfold increase in thelatter (Neher 2013; Lynch 2020). The following section shows that estimates of Ne
indirectly derived from empirical data are in rough accord with this weak scaling.
The Genetic Effective Sizes of Populations
In Chapter 1, the case was made that the average number of individuals perspecies is on the order of 1021 for both bacteria and unicellular eukaryotes, and atleast nine to ten orders of magnitude lower for multicellular eukaryotes (with a verylarge range of variation within each group). Absolute numbers like these are ofrelevance to the field of ecology, but they may also leave the false impression thatthere is little room for the role of chance in long-term evolutionary processes.
There are numerous ways to estimate genetic effective population sizes, themost logically compelling being an evaluation of the fluctuations in allele frequenciesacross generations. As noted above, the variance in allele-frequency change acrossgenerations for a neutral nucleotide site is simply p(1 − p)/Ne or p(1 − p)/(2Ne), forhaploid and diploid populations respectively, where p is the initial allele frequency.However, observations of allele-frequency changes are only reliable with very smallpopulations or very long periods of elapsed generations, as otherwise the bulk ofsuch change is simply due to sampling error on the part of the investigator.
The most powerful alternative approach is to evaluate the standing level ofvariation in a population under the assumptions that the nucleotide sites beingobserved are neutral and have reached levels of variation expected under the balance

POPULATION-GENETIC ENVIRONMENT 5
between recurrent input by mutation and loss by drift. As noted in Foundations4.1, the expected average level of nucleotide variation (defined as heterozygosity) atneutral sites is θ ' 2Neu or 4Neu, again for haploid vs. diploid populations, whereu is the rate of base-substitution mutation per nucleotide site per generation. Notethat the composite parameter θ has a simple interpretation. It is equivalent to theratio of the power of mutation (2u for two sequences being compared) and thatof drift (1/Ne or 1/2Ne). Notably θ is also a function of the cumulative variationgenerated over multiple past generations.
Estimates of standing-levels of heterozygosity at neutral nucleotide sites aregenerally obtained by confining attention to synonymous positions within codons ofprotein-coding genes (e.g., third positions in codons that specify the same aminoacid whether they are occupied by A, C, G, or T) or deep within introns or in-tergenic regions (where no functional sites are thought to reside). In practice, θ isestimated by obtaining average estimates of neutral-site heterozygosity over a largenumber of sites in a sample of individuals. Such estimates integrate information overapproximately the past Ne generations, which is equivalent to the average numberof generations separating two random alleles in haploid populations (Kimura andOhta 1969; Ewens 2004). This point can be seen by noting that two alleles willaccumulate mutational differences at a rate 2u per site, which after an average ofNe generations sums to θ = 2Neu (for a diploid population, the average separationtime is 2Ne generations, yielding θ = 4Neu).
Estimates of θ derived with this approach have been summarized for a widerange of species across the Tree of Life by Lynch (2007) and Leffler et al. (2012), andmore specifically for metazoans and land plants by Romiguier et al. (2014), Corbett-Detig et al. (2015), and Chen et al. (2017). For this diverse assemblage of eukaryoticand prokaryotic species, there is a negative association between organism size andθ, with estimates for prokaryotes roughly averaging ∼ 0.10, those for unicellulareukaryotes averaging ∼ 0.05, invertebrates ∼ 0.03, and land plants and vertebratesgenerally being < 0.01. These are very approximate average estimates, and there isconsiderable variation around the mean. The main point is that for diverse sets oforganisms, the range in estimated θ (in part, a reflection of Ne) is only ∼ 10-fold. Incontrast, as noted above, the absolute numbers of individuals per species differ bymany orders of magnitude.
There are a number of sources of potential bias in these estimates. For ex-ample, for both bacteria and unicellular eukaryotes, most silent-site heterozygositymeasures are derived from surveys of pathogens, whose Ne may be abnormally lowbecause of the restricted distributions of their multicellular host species. In addi-tion, observed levels of silent-site diversity will deviate from the neutral expectationif such sites experience some form of selection. The direction of bias depends onwhether selection opposes or reinforces any prevailing mutation bias. If there is aconflict between selection and mutation bias, expected levels of heterozygosity canexceed the neutral expectation. Most results are consistent with this type of con-flict, but the resultant levels of heterozygosity are inflated by no more than three tofour-fold (Long et al. 2017). With these caveats in mind, the existing data lead toa compelling conclusion with respect to the relative power of mutation and randomgenetic drift – in essentially no species does the former exceed the latter (as thiswould cause θ = 4Neu > 1).

6 CHAPTER 4
Taken at face value, the preceding results might suggest that average Ne variesby no more than an order of magnitude between organisms as diverse as bacteriaand microbes. However, a problem remains in that θ is a function of the product ofNe and the mutation rate. The conclusion that Ne is relatively constant only followsif mutation rates are also relatively constant, which will be shown not to be the casein the following section. Factoring out known estimates of u from θ yields estimatesof Ne ranging from 104 in some vertebrates to > 108 in many bacteria (Figure 4.3).Over a nearly 1020 range of variation in adult size, Ne exhibits a negative power-lawrelationship with organism size.
Why the structure of life has led to this particular range and scaling remainsunclear. The fact that Ne estimates fall many orders of magnitude below the actualnumbers of individuals per species, especially in the case of microbes, is consistentwith the point made above that the predominant source of drift is the stochastic-ity in gene transmission resulting from jointly segregating polymorphisms linked onchromosomes. Recall from above the theoretical expectation that Ne increases log-arithmically with N (Neher 2013; Lynch 2020). If we assume that species with thelowest Ne (' 104) have N ' 106, then an average bacterial species with N ' 1021
(from above) would be expected to have an Ne ' e15 × 104 ' 1010. Considering thecrudeness of this estimate, it is remarkably close to the upper limit of observedNe ' 109 (Figure 4.3; and Bobay and Ochman 2018).
As will be shown in the next section, the fact that no species appears to haveNe > 109 means that beneficial mutations with selective advantages smaller than10−9 cannot be exploited by natural selection in any lineage. In contrast, mutationswith advantages smaller than about 10−5 are unavailable to selection in multicellularspecies with Ne ' 105. Thus, the range of sensitivity to mutations with fitness effectsexpands by about four orders of magnitude with decreasing organism size, enablingselection to operate in a more fine-grained manner in small organisms.
Probability of Fixation of a Mutant Allele
We now consider in more quantitative detail the specific issue of the probabilityof fixation (i.e., of rising to frequency 1.0) of a newly arisen mutant allele, as thiswill clarify the different roles played by both absolute and effective population sizes,while also demonstrating more formally the way in which the efficiency of naturalselection is dampened by the magnitude of random genetic drift. As noted above,fixation probabilities are virtually always� 1.0. Their magnitude depends on: 1) theinitial frequency p0, which for a new mutation is a function of the actual populationsize, with p0 = 1/N or 1/(2N) for haploid and diploid populations; 2) the strengthof selection; and 3) the effective population size Ne.
Here, we focus on a diploid population, with the mutant allele having additivefitness effects (such that each copy of the allele changes fitness by an amount s,yielding genotypic fitnesses of 1, 1 + s, and 1 + 2s, with heterozygotes being inter-mediate to the two homozygotes); see Walsh and Lynch (2018, Chapter 7) for morecomplex situations. Taking into consideration the stochastic effects noted above,Malecot (1952) and Kimura (1957) found that the probability of fixation of an allele

POPULATION-GENETIC ENVIRONMENT 7
starting at initial frequency p0 is
φf (p0) ' 1− e−4Nesp0
1− e−4Nes. (4.1a)
(The same formula applies to haploid populations if a 2 is substituted for each 4).For a newly arisen mutation, p0 = 1/(2N) for diploids, Equation 4.1a reduces to
φf (1/2N) ' 1− e−2(Ne/N)s
1− e−4Nes. (4.1b)
As discussed above, in almost all natural settings Ne/N � 1, and most mutationshave only minor effects on overall fitness (Chapter 5), so that |s| � 1. Thus, notingthat e−x ' 1 − x for x � 1, the numerator is closely approximated by 2s(Ne/N),simplifying things further to
φf (1/2N) ' 2s(Ne/N)1− e−4Nes
. (4.1c)
It is useful to note that 2Nes = s/[1/(2Ne)] is equivalent to the ratio of the power ofselection to that of drift.
Four limiting conditions are clear from Equations 4.1a-c. First, for strong selec-tion relative to drift, 2Nes� 1, e−4Nes ' 0, and the denominator is essentially equalto 1.0, showing that the probability of fixation of a new beneficial mutation is just2s (Ne/N). Thus, even in populations with very large Ne, the probability of fixationof a beneficial mutation is smaller than twice the selective advantage. These resultsformalize the point made earlier – owing to the high probability of stochastic loss inthe earliest generations, even strongly beneficial mutations only rarely proceed tofixation.
Second, only after the frequency of a beneficial allele becomes sufficiently high,does the probability of fixation become almost certain. For example, from Equation4.1a, if Nesp0 > 0.5, the probability of fixation exceeds 0.70, and if Nesp0 > 1,φf (p0) > 0.93. Thus, as a matter of convention, it is often argued that to be assurednear-certain fixation, a beneficial mutation requires a starting frequency of p0 �1/(4Nes).
Third, as |4Nes| → 0, the probability of fixation converges to the initial frequency(p0). This should be intuitive, as under these conditions drift is so dominant thatthere is effectively no directional pressure on allele-frequency change. For this rea-son, the domain in which |s| � 1/(4Ne) is known as effective neutrality. The salientpoint is that natural selection is unable to purge deleterious mutations or promotebeneficial mutations with effects < 1/(4Ne). The central principle is that the domainof variation recognizable by natural selection is expanded in large populations.
Finally, it follows from the above that the probability of fixation of a newlyarising, neutral mutation (s = 0) in a diploid population is always equal to its initialfrequency, 1/(2N), regardless of Ne. This has interesting implications for some formsof molecular evolution. Letting the mutation rate per nucleotide site equal u, then2Nu mutations arise in the population each generation, so that the long-term rateof evolution at a neutral site is simply equal to the product 2Nu · [1/(2N)] = u.Thus, the rate of molecular evolution at neutral sites is equal to the mutation rate,

8 CHAPTER 4
independent of the mode of gene action, rates of recombination, and population size(Kimura 1983).
Evolution of the Mutation Rate
The fact that no organism has evolved to have 100% replication fidelity is consistentwith basic thermodynamic principles, but the issues are much deeper than this.There is a 1000-fold range of variation in the mutation rate among species, raising thequestion as to why particular rates are associated with particular lineages. As firstpointed out by Kimura (1967), selection operates on the mutation rate indirectly, viathe effects of mutations linked to alleles associated with their production. Under thisview, a newly arisen mutator allele progressively acquires an excess linked mutationload. Thus, given that the vast majority of mutations are deleterious (Lynch et al.1999; Baer et al. 2007; Eyre-Walker and Keightley 2007; Katju and Bergthorsson2019), it follows that natural selection generally strives to minimize the mutationrate.
The ability of natural selection to eradicate a mutator allele is a function of themagnitude of this associated mutation load, which is equal to the product of threeterms: 1) the excess genome-wide rate of production of deleterious mutations relativeto the pre-existing population mean, ∆UD; 2) the reduction in fitness per mutation,s; and 3) the average number of generations that a mutation remains associated withthe mutator, t. The persistence time t, in turn, is determined by two factors: 1) theselective disadvantage of mutations (s), with individuals harboring an additionalmutation leaving a fraction s fewer progeny, and those with n mutations havingfitness (1 − s)n; and 2) the rate of recombination (r), which physically dissociatesthe mutator from the load it creates.
The strength of selection against a mutator is greatest in the case of asexualreproduction, as the mutator is never separated from its mutation load by recom-bination. Provided s � 1Ne, s is equivalent to the rate of removal of a deleteriousmutation from the population by selection, and the persistence time is simply equalto the reciprocal of the average rate of removal of a mutation (i.e., t = 1/s). Theselective disadvantage of a mutator allele is then the product of the three termsnoted above: sm = ∆UD · s · (1/s) = ∆UD, and hence is simply equal to the increasedper-generation rate of production of deleterious mutations. The selective disadvan-tage is completely independent of the effects of mutations, as mutations with largereffects are selectively removed from a population at higher rates (along with thelinked mutator allele).
Recombination weakens the selective disadvantage of a mutator allele by ex-porting the initially linked mutations to other members of the population. Withfree recombination (r = 0.5), mutant alleles are statistically uncoupled from theirsource in an average of just t = 1/r = 2 sexual generations. The mutator-allele disad-vantage then becomes sm ' 2s∆UD. Not every mutation will be freely recombiningwith respect to a mutator allele, but because most eukaryotic genomes contain mul-tiple chromosomes, most new mutations will arise unlinked to the mutator, and theload is unlikely to be greater than twice the preceding value (Lynch 2008). Thekey point is that sexual reproduction weakens the magnitude of selection against a
POPULATION-GENETIC ENVIRONMENT 9
mutator allele (relative to the case of complete linkage) by a factor of ∼ 2s. As willbe discussed in the following chapter, the average fitness effects of new mutationsare generally < 0.1, implying that recombination reduces the strength of selectionoperating on the mutation rate by at least 80% relative to the case under asexuality.
Impeding the directional selection pressure to reduce the mutation rate is ran-dom genetic drift, which begins to prevail once the level of replication fidelity be-comes so highly refined that the next incremental improvement is effectively neutral,i.e., sm � 1/Ne. The general principle can be understood by reference to the logicoutlined in the preceding section. Letting η < 1 be the fraction by which the mu-tation rate is reduced by an antimutator, so that ∆UD = ηUD, the drift-barrierhypothesis postulates that once the genome-wide deleterious mutation rate UD inan asexual (haploid) population is reduced to the point that ηUD < 1/Ne, selectionfor further reduction in the mutation rate will be overwhelmed by stochastic noise.The exact location of such a barrier will also depend on the relative rates of pro-duction of mutator and antimutator alleles (Lynch et al. 2016), as a substantial rateof production of mutation-rate enhancers will counter downward selection on themutation rate to some degree.
The key point is that owing to the stochastic consequences of finite populationsize, the degree of refinement that natural selection can achieve increases with Ne,which allows alleles with smaller incremental benefits to be promoted (Lynch 2011,2020; James and Jain 2016; Lynch et al. 2016). This drift-barrier hypothesis leadsto the prediction that the mutation rate will evolve to be negatively associated withNe (Figure 4.4). If this hypothesis is correct, the very process necessary for pro-ducing adaptive mutations is selected against, with the fuel for evolution (the smallfraction of beneficial mutations) simply being largely an inadvertent by-product ofan imperfect process.
How do the data accord with the drift-barrier hypothesis? Prior to this cen-tury, almost all estimates of the mutation rate were derived indirectly using reporterconstructs in microbes (Drake 1991; Drake et al. 1998), leaving considerable uncer-tainties with respect to efficiency of mutation detectability, marker position effects,etc. With the advent of whole-genome sequencing, it became possible to evaluatethe genome-wide appearance of mutations in replicate lines maintained by single-progeny (or single full-sib mating) descent (i.e., Ne ' 1 or 2) for large numbers ofgenerations (Lynch et al. 2016; Katju and Bergthorsson 2019). By maximizing thepower of drift relative to selection, such treatment ensures that essentially all mu-tations (other than the small fraction causing lethality or sterility) will accumulatein an effectively neutral fashion.
The numerous results from such work demonstrate a 1000-fold range of inter-specific variation in the mutation rate per nucleotide site per generation, from alow of ∼ 10−11 in some unicellular eukaryotes to a high of ∼ 10−8 in some mam-mals (including humans) (Lynch et al. 2016; Long et al. 2017; Lynch and Trickovic2020). Consistent with expectations under the drift-barrier hypothesis, the rate ofbase-substitution mutation per nucleotide site (u) scales negatively with Ne (Figure4.5, left). Although the three major groups (bacteria, unicellular eukaryotes, andmulticellular eukaryotes) appear as fairly discrete clusters, recall that the theoryoutlined above implies that selection operates on the genome-wide deleterious rate,which is the product of the mutation rate per nucleotide site (per generation) and

10 CHAPTER 4
the number of nucleotides under selection (the effective genome size, Pe). Multi-plying u by the effective genome size (approximated by the amount protein-codingDNA) unifies the overall set of results, leading to an inverse scaling between uPe
and Ne (Figure 4.5, right).Thus, mutation rates are lower in unicellular eukaryotes than in bacteria with
similar effective population sizes because the genomes of the former contain manymore genes than those of the latter, and hence are larger targets for deleteriousmutations. The scaling patterns in Figure 4.5 also hold for insertion-deletion muta-tions, which are about 10% as common as the former across the Tree of Life (Sunget al. 2016).
High mutability of mutation rates. The preceding results make clear that themutation rate is evolutionarily malleable, but what is the timescale of such change?The mutational target size for the mutation rate is likely to be very large, as itincludes multiple DNA polymerases, DNA-repair proteins, and essentially all geneswhose products alter the mutagenicity of the intracellular environment (includingthose influencing the production of free oxygen radicals via metabolic activity andthose modulating the relative abundances of free nucleotides). Thus, with the ex-pectation that both mutators and anti-mutators are recurrently introduced into allpopulations (Denamur and Matic 2006; Lynch 2008; Raynes and Sniegowski 2014),virtually all natural populations are expected to harbor polymorphisms for the mu-tation rate.
The idea that the mutation rate is capable of rapid change is supported by adiversity of observations. For example, Boe et al. (2000) estimate that E. coli cellswith mutation rates elevated by 20 to 80× arise at rates of 5×10⁻⁶ per cell division,and one can imagine even higher rates of origin of milder (and less easily detected)mutators (as well as antimutators). Indeed, in an E. coli mutation-accumulationexperiment initiated with a mutator strain that allowed accumulation of diversityover a period of 1250 generations, numerous lines evolved mutation rates < 10% ofthe baseline rate (antimutators), while a small fraction of them experienced up to10× increases in the mutation rate (Singh et al. 2017).
Given this potential for rapid change in the level of replication fidelity, it isnot surprising that microbes commonly evolve mutator genotypes when confrontedwith strong selective challenges (such as antibiotic treatment). Swings et al. (2017)found that in lethally stressful environments, laboratory E. coli populations rapidlyevolve a mutator phenotype (on a time scale of ∼ 100 generations), and then re-vert to background mutation-rate levels once adaptation has been achieved. Incontrast, in constant environments, bacterial populations founded with a mutatorgenotype frequently evolve lower mutation rates on relatively short time scales viacompensatory molecular changes at genomic sites not involved in the initial muta-tor construct (McDonald et al. 2012; Turrientes et al. 2013; Wielgoss et al. 2013;Williams et al. 2013). Taken together, these observations indicate that the mutationrate is among the most rapidly evolving traits known. In addition, the common ap-pearance of antimutators implies the presence of substantial unexploited potentialfor improvement in replication fidelity.
As further evidence that despite their extremely low values, evolved mutationrates are not constrained by biophysical limitations, consider the fact that although

POPULATION-GENETIC ENVIRONMENT 11
mammals harbor the highest known eukaryotic mutation rates per generation, therate per germline cell division rivals the very low per-generation rates for unicellularspecies (Lynch 2010). The human germline mutation rate per nucleotide site is∼ 6 × 10⁻¹¹ per cell division, approaching the lowest rates observed in unicellulareukaryotes, and 10 to 100× lower than rates in various human somatic tissues (Lynch2010; Behjati et al. 2014; Milholland et al. 2017). The point here is that althoughselection operates on the per-generation mutation rate, this is accommodated bychanges in replication fidelity at the cell-division level – an increased number ofgermline cell divisions is balanced by enhanced replication fidelity per division.
Error-prone polymerases. In all known organisms, almost all DNA replicationis carried out by one or two major polymerases, each of which has a high base-line level of accuracy, with a substantial fraction of the few errors arising at thisstep being removed secondarily via a proof-reading step. However, the genomes ofnearly all organisms also encode for one or more error-prone polymerases, whoseusage is restricted mostly to times of stress or to dealing with bulky lesions in DNA.Stress-induced mutagenesis (SIM) has been found in virtually all organisms thathave been examined, e.g., E. coli and many other bacteria (Kang et al. 2006; Foster2007; Kivisaar 2010); yeast (Heidenreich 2007); Chlamydomonas (Goho and Bell2000); Caenorhabditis (Matsuba et al. 2013); and Drosophila (Sharp and Agrawal2012). The distinction between SIM and normal mutagenesis is often blurry, inthat a variety of environmental stresses (e.g., nature of the limiting nutrient) al-ter the molecular spectrum of mutations without affecting the mutation rate itself(Maharjan and Ferenci 2017; Shewaramani et al. 2017).
An elevation in error rates under situations leading to physiological breakdownshould not be too surprising, as this can be expected for virtually all traits. Nonethe-less, some have argued that high mutation rates associated with error-prone poly-merases have been promoted by selection as a means for generating adaptive re-sponses to changing environments (Radman et al. 2000; Tenaillon et al. 2001; Earland Deem 2004; Foster 2007; Galhardo et al. 2007; Rosenberg et al. 2012). Directempirical support for such an argument is lacking, although special scenarios havebeen shown in theory to encourage selection for SIM, e.g., situations in which twomutations are required for an adaptation, with the first conferring reduced fitnessand an elevated mutation rate when alone (Ram and Hadany 2014), or when stressesare sufficiently diverse and persistently fluctuating (Lukacisinova et al. 2017). How-ever, establishing that an evolutionary outcome is theoretically possible is quitedifferent than demonstrating a high likelihood of it actually occurring.
A simpler and more compelling explanation for the error-prone nature of somepolymerases follows directly from the drift-barrier hypothesis – the net selectionpressure to improve accuracy is expected to be proportional to the average numberof nucleotide transactions that a DNA polymerase engages in per generation. Be-cause error-prone polymerases generally replicate only small patches of DNA and doso quite infrequently, the strength of selection on accuracy will be correspondinglyreduced (Lynch 2008, 2011; MacLean et al. 2013). This “use it or lose it” hypoth-esis is also consistent with the high error rates for polymerases deployed in thereplacement of small RNA primers used in replication initiation (Lynch 2011). Inaddition, the secondary and tertiary fidelity mechanisms associated with replication

12 CHAPTER 4
(proof-reading and mismatch repair), which necessarily involve far fewer nucleotidetransactions than the earlier polymerization step, have greatly elevated error rates(Lynch 2008). None of these latter observations can be explained as specific adap-tations to stress, as all of the factors involved are fundamental to normal replicationcycles.
This view does not deny the critical importance of error-prone polymerases asmechanisms for dealing with bulky lesions or other forms of DNA damage, nordoes it deny that induced mutagenesis can play a role in generating an appropri-ate adaptation in extreme times, sometimes being the only means for survival. Itdoes, however, eliminate the need for an adaptive explanation for high error rates,implying instead that there is no way to avoid such an outcome.
Optimizing the mutation rate. Because mutational processes generate a large frac-tion of detrimental variants that must be removed by natural selection and a smallfraction of beneficial mutations essential for adaptation in changing environments,considerable attention has been given to the idea that natural selection might fine-tune the mutation rate so as to maximize the long-term rate of adaptive evolution.In contrast to the drift-barrier hypothesis, under this view, selection does not con-stantly push the mutation rate to the lowest achievable level, but instead promoteshigher levels of mutation via indirect effects associated with the small pool of ben-eficial mutations. This is a difficult area for theory development as the relativemerits of increasing vs. decreasing the mutation rate depend on the distribution ofmutational effects, the population size, the recombination rate, and the pattern ofenvironmental change.
It is especially unclear how natural selection operating at the individual levelcan promote an elevated mutation rate in a sexual population by associated bene-ficial effects. The primary problem is that in a sexual population, hitch-hiking of amutator with a linked beneficial mutation will generally be thwarted by their dissoci-ation by recombination (on average in just two generations when the two loci are ondifferent chromosome arms). Continuous reinforcement necessary for the promotionof a mutator allele requires a substantial rate of input of closely linked beneficialmutations. However, as noted above, because the vast majority of mutations aredeleterious, there will be a steady-state background deleterious load associated withall mutator alleles, regardless of whether the mutator is involved in a transient (andmost likely incomplete) beneficial sweep. An additional limitation in multicellularorganisms is the direct negative effects that mutators impose via the productionof somatic mutations, which have immediate detrimental effects on fitness (Lynch2008, 2010).
Several attempts have been made to estimate the theoretically optimal muta-tion rates for maximizing long-term rates of adaptive evolution in nonrecombining,asexual populations, but the resultant models do not explain the most prominentpattern in the data – the inverse relationship between u and Ne (Figure 4.5). Nordo they explain why, if optimized, mutation rates are nearly 1000× higher in largemulticellular sexual species than in most microbes. Indeed, most models concernedwith optimal mutation rates in persistently changing environments imply a positiveassociation between Ne and u (Kimura 1967; Leigh 1970; Orr 2000; Desai and Fisher2007; Johnson and Barton 2002; Good and Desai 2016). Thus, one could argue that

POPULATION-GENETIC ENVIRONMENT 13
the utility of these models is not that they explain the data, but that they highlighthow the kinds of imagined scenarios involving distributions of mutational effects areinconsistent with the data.
In summary, both data and theory are incompatible with the idea that mutation-rate evolution is guided by a population-level goal of maximizing the long-term rateof incorporation of beneficial mutations. Hypotheses based on numbers of cell-divisions per generation do not explain the data in Figure 4.5 either, as nearly thefull range of variation in mutation rates per generation is encompassed by unicel-lular species alone. Nor does generation length explain the patterns, as unicellulareukaryotes have longer cell-division times but lower mutation rates than prokaryotes.
One lingering concern may be that, after accounting for effective proteome andpopulation sizes, bacteria have no lower mutation rates than eukaryotes, whereastheory predicts that the efficiency of selection on the mutation rate is increased inthe absence of recombination. As outlined below, however, a simple explanationfor this is that although bacteria lack meiotic recombination, they nonetheless ex-perience roughly the same amount of recombination per nucleotide site (via othermechanisms) at the population level as do eukaryotes.
The nonrandom nature of mutation. Decades of observations are consistent withthe postulate that mutations arise randomly with respect to the demands for modi-fications imposed by natural selection. However, some have argued that selection iscapable of modulating mutation rates on a gene-by gene basis by, for example, locat-ing genes in regions with or without potentially mutagenic collisions between DNAand RNA polymerase or by somehow providing protection against mutagenic aspectsof high rates of transcription (Martincorena et al. 2012; Paul et al. 2013). Theseclaims have not held up to close scrutiny, and the theory outlined above explainswhy. The differences in mutation rates among genes associated with chromosomallocations and/or transcriptional activities are simply too small to be promoted byselection (Chen and Zhang 2013; Lynch et al. 2016).
Nonetheless, although mutations are random with respect to desirable genetargets, they are nonrandom in essentially every physical way. For example, in somebacteria there is a symmetrical wave-like pattern of the mutation rate around thecircular chromosome (Foster et al. 2013; Long et al. 2015), although the amplitudeof differences does not exceed 2.5× and the pattern differs among species. Up to two-fold differences have also been found among locations on eukaryotic chromosomeson spatial scales ranging from 200 bp to 100 kb (Stamatoyannopoulos et al. 2009;Chen et al. 2012; Lang and Murray 2011). The molecular mechanisms driving theselarge-scale patterns remain unclear, but may be associated with variation in thenucleotide pool composition during the cell cycle, regional variation in transcriptionrates and their influence on replication, protection by nucleosomes in eukaryotes,and/or alterations in the rates of processivity of DNA polymerase across differentchromosomal regions.
On a more local scale, every genome that has been assayed reveals unevenfrequencies of the six types of base-substitution mutations (Long et al. 2017). Inmost prokaryotes, and all eukaryotes so far observed, there is mutation bias in thedirection of G+C → A+T. In addition, the mutabilities of the individual nucleotidesare context dependent, depending on the nature of the neighboring nucleotides (Sung

14 CHAPTER 4
et al. 2015).The appearance of mutations can also be temporally correlated within the same
genomes. The naive view is that if mutations arise at an average rate u per nucleotidesite, the rate of simultaneous origin of mutations at two specific sites would be u2,and at three sites would be u3. Given that average u is on the order of 10−9, thiswould imply that double mutants would rarely ever occur except in large microbialpopulations. However, data from mutation-accumulation experiments suggest thaton spatial scales of 100 bp or so, multinucleotide mutations commonly comprise 1 to3% of mutational events in diverse lineages (Drake 2007; Schrider et al. 2011; Harrisand Nielsen 2014; Terekhanova et al. 2013; Uphoff et al. 2016). Potential reasonsfor mutational clusters include local patches of DNA damage, the occasional use ofa defective DNA polymerase molecule, accidental deployment of an innately error-prone polymerase, and mutagenic repair of double-strand breaks (Drake 2007; Hickset al. 2010; Malkova and Haber 2012; Chan and Gordenin 2015).
The key point here is that transient, localized hypermutation is common enoughthat rates of occurrence of double mutations are often many orders of magnitudeabove the u2 expectation under independent occurrence, with double-mutation ratescommonly on the order of u/1000 to u/100, and perhaps triple-mutation rates only afew orders of magnitude lower. The occurrence of mutation clusters has major im-plications for the evolution of complex features, as modifications requiring multiplenucleotide changes need not await the sequential fixation of individual mutations,but can arise de novo and be promoted together. This change in view becomes par-ticularly important with respect to complex adaptations in which first-step single-nucleotide variants are deleterious (Chapters 5 and 6).
Recombination
Recombination is a double-edged sword in evolution. On the one hand, by elim-inating peculiarities associated with individual genetic backgrounds, the physicalscrambling of linked loci increases the ability of natural selection to perceive muta-tions on the basis of their individual effects. In addition, recombination can createfavorable genetic interactions by bringing together mutations that have arisen on in-dependent backgrounds. On the other hand, high rates of recombination can inhibitthe permanent establishment of pairs of mutations with favorable interactive effectsif they are separated more rapidly than they are advanced as a unit by selection.
Before proceeding, it may be useful to review the mechanics of recombination,as this will help clarify how the recombination rate scales with distance L betweennucleotide sites (Foundations 4.2; Figure 4.6). Contrary to common belief, the re-combination rate between sites is not equal to the crossover rate, except in the caseof distantly located sites (typically, > 10 kb). This is because much of recombina-tion involves localized patches of gene conversion that do not, in themselves, causeexchange of flanking chromosomal regions.
Two general approaches provide insight into the level of recombination per phys-ical distance along chromosomes. The first of these involves the construction ofgenetic maps, usually from observations on the frequency of meiotic crossovers be-tween molecular markers in controlled crosses. Such maps have the power to yield

POPULATION-GENETIC ENVIRONMENT 15
accurate estimates of average recombination rates over fairly long physical distances(usually with markers being separated by millions of nucleotide sites, which typicallycorresponds to > 1% recombination per generation). However, without enormousnumbers of evaluated progeny, such exercises cannot reveal recombination rates atsmall spatial scales, simply because of the absence of observed recombination eventsover short intervals. The details of constructing genetic maps will not be elaboratedon here, other than to note that they are assembled by use of mapping functions thatconvert observed recombination frequencies into the expected numbers of crossoversbetween pairs of markers (Chapter 14 in Lynch and Walsh 1998).
Despite the limitations, results from genetic-map construction allow a com-pelling general statement about average genome-wide levels of crossing-over. Al-though eukaryotic genome sizes (G, the total number of nucleotides per haploidgenome) vary by four orders of magnitude, the range of variation in genetic-maplengths (in units of the total number of crossovers per genome per meiosis) amongspecies is only about ten-fold (Lynch 2007; Lynch et al. 2011; Stapley et al. 2017).This behavior can be explained by a very simple physical constraint, which appearsto be nearly invariant across the eukaryotic phylogeny. During meiosis, there aretypically no more than two crossover events per chromosome arm, regardless of chro-mosome size. Because phylogenetic increases in genome size are generally associatedwith increases in chromosome size rather than chromosome number (Lynch 2007),the little variation in the total number of meiotic crossover events per genome thatexists among eukaryotes is due to variation in chromosome number.
These observations lead to a simple structural model for the average crossoverrate per physical distance across a genome, which is technically equal to the prod-uct of the rate of recombination initiation per nucleotide site (c0) and the fractionof such events that lead to a crossover (x) (Foundations 4.2). Letting M be thehaploid number of chromosomes per genome, G/M is the average physical length ofchromosomes. Letting κ be the average number of crossovers per chromosome permeiosis, then the average amount of recombination per nucleotide site associatedwith crossing over is c0 ' κM/G. If this model is correct, a regression of c0 on G
on a log scale should have a slope of -1.0, with the vertical distribution (residualdeviations) around the regression line being defined largely by variation in M (withspecies with the same genome size but more chromosomes having proportionallymore crossing over per nucleotide site).
The data closely adhere to this predicted pattern, with the smallest genomesof microbial eukaryotes having recombination rates per physical distance ∼ 1000×greater than those for the largest land plants (which have ∼ 1000× larger genomes,but approximately the same numbers of chromosomes) (Figure 4.7). Thus, thesmooth, overlapping decline in recombination intensity across unicellular species,invertebrates, vertebrates, and land plants, reflects the general increase in genomesizes among the latter eukaryotic domains, with the smaller level of vertical variationin the plot reflecting differences in chromosome numbers (Lynch et al. 2011).
Although these observations suggest that the vast majority of the variance inthe average crossing-over rate among eukaryotic species is simply due to variationin genome size and chromosome number, even the highest density genetic maps aregenerally unable to reveal the features of short chromosomal regions. Finer-scalemolecular analyses have shown that up to 100-fold differences in recombination

16 CHAPTER 4
rates can exist on spatial scales of a few kb, although the locations and molecularmechanisms dictating their distributions are highly variable among species (Petes2001; de Massy 2003, 2013; Jeffreys et al. 2004; Myers et al. 2005; Arnheim et al.2007; Coop et al. 2008; Mancera et al. 2008; Kohl and Sekelsky 2013; Lam andKeeney 2015; Haenel et al. 2018). For example, recombination hotspots in buddingyeast are enriched in the transcriptional promoters of genes, whereas in fission yeast,they are enriched in intergenic regions. Although in neither yeast species is theguiding mechanism known, in numerous mammals, a zinc-finger protein (PRDM9)marks nucleosomes with a distinct form of histone phosphorylation in the vicinityof specific DNA-sequence motifs, guiding the recruitment of Spo11 (Baudat et al.2013; Capilla et al. 2016; Wells et al. 2020).
In the genomes of mice and great apes, > 20, 000 hotspots are defined in thisway, although the localization of sites varies dramatically even among closely relatedspecies. Such shifts are associated with the rapid sequence evolution of the zinc-finger used in DNA motif recognition, leading to recombination-hotspot variationamong subspecies and even among individuals within species (Brick et al. 2012).Some mammals, such as dogs, do not even have such a system. A key issue withrespect to such a system is that if the positions of double-strand breaks are closelyassociated with the recognition motif, the latter will tend to eventually be lost bygene conversion to the allele on the recipient chromosome, hence leading to theeventual loss of the hotspot. A shift in the zinc-finger recognition motif in PRDM9could then lead to altered hotspot localization, unfolding a new series of events.There is, however, no evidence that recombination hotspots are promoted by naturalselection, and as yet there is no evidence of their existence in unicellular species.
A second approach to estimating recombination rates uses measures of linkagedisequilibrium (LD) in natural populations to quantify the statistical degree of as-sociation between allelic states at linked chromosomal sites. Just as theory revealsan equilibrium average level of molecular heterozygosity (variance) within neutralnucleotide sites at mutation-drift equilibrium (Foundations 4.1), the level of LD(covariance) between sites is expected to reach a balance between the forces of re-combination, mutation, and drift. The equilibrium LD between two sites (i and j)is a function of the composite parameter 4Necij, which is proportional to the ratioof the rate of recombination between sites (cij) and the power of random geneticdrift (1/2Ne for diploids) (Chapter 4 in Walsh and Lynch 2018).
The attractiveness of the LD approach is that the observations reflect the histori-cal outcome of many thousands of generations (and equivalently, thousands meioses).This provides the power to obtain much more refined (kilobase scale) views of therecombinational landscape than is possible with short-term breeding experiments.To understand this benefit, note that for a mapping cross involving n gametes withrecombination frequency cij between sites i and j, the expected number of recom-binants is ncij, so for sufficiently close sites (cij � 1/n), the typical outcome ofcross will be a complete absence of recombinants. On the other hand, if n randomdiploid individuals are sampled from a natural population, because the mean timeto a common ancestor between random neutral alleles is ' 2Ne generations (notedabove), the expected number of recombination events is 4Nencij.
Numerous population-level surveys have been made to estimate the normalizedrecombination parameter 4Nec0, where c0 is the rate of recombination per nucleotide

POPULATION-GENETIC ENVIRONMENT 17
site. This is usually done by first estimating the population-level parameter at vari-ous distances between sites (Lij), and then dividing by Lij under the assumption thatcij = c0Lij , i.e., a linear relationship between the recombination rate and physicaldistance between sites. As noted in Foundations 4.2, this is a reasonable approx-imation provided the distance between sites is less than the average length of agene-conversion tract, but will lead to an underestimate of 4Nec0 when greater dis-tances are relied upon (by a factor up to 20×). Using this procedure, all estimatesof the per-site parameter 4Nec0 are smaller than 0.1, with many falling below 0.01(Walsh and Lynch 2018, Chapter 4). These observations provide support for theidea that, as with mutation, random genetic drift is generally a more powerful forcethan recombination at the level of individual nucleotide sites, with the caveat thatmost existing analyses involve animals and land plants.
By dividing estimates of 4Nec0 by parallel estimates of θ = 4Neu, the effectivepopulation size cancels out, yielding an estimate of the ratio of recombination andmutation rates at the nucleotide level (c0/u). All such estimates for eukaryotes aresmaller than 5.0, and nearly half are smaller than 1.0 (Lynch 2007; Walsh and Lynch2018). For example, the average estimate of c0/u for Drosophila species is ∼ 2.7,whereas that for humans is ∼ 0.8, and the average for fourteen land plants is 1.1.These observations imply that the power of recombination between adjacent sites isoften of the same order of magnitude as the power of mutation, or perhaps somewhatlarger owing to the downward bias in c0 estimates noted above.
Contrary to common belief, relative to the background rate of mutation, re-combination at the nucleotide level is not exceptionally low in bacteria (Shapiro2016; Bobay and Ochman 2017; Garud and Pollard 2019; Sakoparnig et al. 2021).Although bacteria do not engage in the kinds of organized meiotic activities ofeukaryotes, they have several other pathways that can lead to homologous recombi-nation, including transduction of sequences by bacteriophage, physical conjugationand DNA exchange between conspecifics, and even consumption and integration offree DNA from dead cells. Consistent with high levels of recombination inducedby these alternative mechanisms, estimates of c0/u for such species are often of thesame order of magnitude as those for eukaryotes (Lynch 2007; Vos and Didelot 2009;Rosen et al. 2015).
Finally, as noted above, not all recombination events involve crossovers. Forexample, direct empirical observations suggest that the fraction of recombinationevents accompanied by crossing over is x ' 0.30 in the budding yeast S. cerevisiae(Malkova et al. 2004; Mancera et al. 2008), and ' 0.15 in the fly D. melanogaster(Hilliker et al. 1994). Indirect LD-based estimates suggest x ' 0.14 in humans (Frisseet al. 2001; Padhukasahasram and Rannala 2013), 0.09 on average in other verte-brates (Lynch et al. 2014), ' 0.08 in D. melanogaster (Langley et al. 2000; Yin et al.2009), and ' 0.10 in plants (Morrell et al. 2006; Yang et al. 2012). Thus, the datauniversally point to ∼ 30% to 90% of recombination events being simple local geneconversions unaccompanied by crossovers. This implies that recombination ratesat short distances are typically 3 to 10× greater than expected based on crossing-over alone. Average conversion-tract lengths tend to be several hundred to a fewthousand bp in diverse eukaryotes (Lynch et al. 2014; Liu et al. 2018).
Evolution of the recombination rate. Considerable attention has been devoted

18 CHAPTER 4
to understanding how selection might favor recombination-rate modifiers in variouscontexts (e.g., Feldman et al. 1996; Barton and Otto 2005; Keightley and Otto2006; Barton 2010; Hartfield et al. 2010). As in the case of mutation-rate evolution,selection on modifiers of the recombination rate will generally involve second-ordereffects, operating via fitness-altering recombination effects elsewhere in the genome.To this end, virtually all theoretical work on the evolution of the recombinationrate is motivated by the idea that natural selection inadvertently encourages thebuild-up of linkage disequilibrium in ways that inhibit full evolutionary potential.Two general aspects of genetic systems can encourage the buildup of hidden geneticvariance.
First, synergistic epistasis (with fitness declining at an increasing rate withincreasing numbers of deleterious alleles) tends to encourage the maintenance of in-termediate genotypes, thereby providing a selective advantage for recombinationalproduction of the extreme genotypes and their more efficient promotion/eliminationby selection (Eshel and Feldman 1970; Kondrashov 1988; Charlesworth 1990; Bar-ton 1995). In contrast, diminishing-returns epistasis (with fitness declining at adecreasing rate with increasing numbers of deleterious alleles) has the opposite ef-fect, thereby encouraging reduced recombination rates. As the evidence on therelative incidences of these two forms of epistasis is mixed, the role of epistasis inthe evolution of recombination rates remains unclear.
Second, as noted above, linkage reduces the efficiency of selection on multilocussystems by inducing Ne-reducing background selection and selective sweeps. Thesegeneral effects are expected to be more pronounced in larger populations, which gen-erally harbor larger numbers of cosegregating polymorphic loci. Plausible argumentshave been made that the power of this second effect in selecting for modifiers forincreased recombination rates may substantially outweigh that resulting from syn-ergistic epistasis (Felsenstein and Yokoyama 1976; Otto and Barton 2001; Palsson2002; Barton and Otto 2005; Keightley and Otto 2006; Roze and Barton 2006).
Nonetheless, despite all of the theory, the extent to which recombination-ratemodifiers ever arise with substantial enough fitness consequences to be promotedby these kinds of associative effects remains unclear. Most modeling attempts havefocused on rather extreme situations in which selection coefficients and/or the mag-nitude of the modifier’s effect on the recombination rate are quite large, and yet evenunder these conditions the selective advantage of the modifier can be quite small(Barton and Otto 2005), perhaps too small to overcome the likelihood of being lostby drift in most cases.
This is not to dispute the adaptive utility of sexual reproduction, which pro-motes both independent segregation of chromosomes and recombination within chro-mosomes. Laboratory experiments with yeast populations do support the idea thatfitness increases more rapidly in response to a selective challenge in the presence ofoutcrossing (Goddard et al. 2005; McDonald et al. 2016). The latter study is mostnotable in that it used pooled-population genome-wide sequencing to follow thefates of newly arising mutations, showing that in asexual populations many muta-tions go to fixation in a hitch-hiking fashion, with mildly deleterious mutations beingdragged along by linked beneficials (Figure 4.8). In contrast, in sexual populations,fewer mutations arise to high frequency, but most of those that do are beneficial. Ineffect, sexual reproduction reduces the effects of selective interference (simultaneous

POPULATION-GENETIC ENVIRONMENT 19
beneficial mutations competing with each other for fixation), while also reducingthe “ruby in the rubbish” effect (beneficial mutations being permanently linked toa background containing deleterious mutations in an asexual; Chapters 5 and 6).
The key issue here is whether, conditional on sexual reproduction, natural se-lection further fine-tunes the level of within-chromosome recombination. As notedabove, the fact remains that nearly all interspecific variation in the recombinationrate per physical distance can be explained by a simple, phylogenetically invariantphysical model of meiosis, leaving very little residual variation to be potentiallyassigned to adaptive fine-tuning. Variation in the recombination rate does existamong individuals and closely related species (Dapper and Payseur 2017; Ritz et al.2017), so evolutionary modification is certainly possible, but the level of variationis generally less than two-fold, and may simply reflect the recurrent introduction ofminor recombination-rate variants by mutation.
The most widely cited evidence in favor of the idea of adaptive modification ofrecombination rates involves examples of moderate increases in the crossover rate inpopulations exposed to strong directional selection (e.g., domestication, and insec-ticide resistance) (Ritz et al. 2017). In principle, such results might be examples ofhitch-hiking of recombination-rate enhancers with strongly favored gene combina-tions, much like the situation with transient increases in mutator-allele frequencies.However, enough counterexamples have been presented (Munoz-Fuentes et al. 2015;Stapley et al. 2017) that one must be concerned with reporting bias towards positiveresults.
An alternative view, consistent with the pattern in Figure 4.7, is that naturalselection generally operates to minimize the amount of meiotic recombination (onecrossover per arm being a minimum requirement for proper chromosome segrega-tion), with phylogenetic divergence in recombination rates being largely an indirectand passive response to changes in the population-genetic environment. With re-duced Ne in organisms with increasing cell/body size (Figure 4.3), genome sizespassively expand as selection becomes less capable of resisting the accumulation ofintronic and mobile-element associated DNAs (Lynch 2007). With an increase inchromosome length but not in the number of crossovers per chromosome, the re-combination rate per physical distance then naturally declines. Thus, as with themutation rate, the bulk of the variation in the recombination rate among speciesmay be largely governed by differences in the cumulative effects of random geneticdrift. Notably, Dumont and Payseur (2007) find that variation in recombinationrates across mammalian species evolves in a manner that cannot be discriminatedfrom the expectations of a neutral model.
Summary
• Evolution is a population-genetic process governed by the joint forces of mutation,recombination, and random genetic drift, all of which vary by more than fourorders of magnitude across the Tree of Life. As these three features define thepopulation-genetic playing field upon which evolution operates, such quantitativeknowledge is an essential resource for understanding the limits to all adaptive andnonadaptive evolutionary pathways.

20 CHAPTER 4
• All newly arisen mutations experience stochastic fluctuations in allele frequen-cies, with only a small fraction of them being harvested by natural selection. Themagnitude of noise in the evolutionary process (random genetic drift) is dictatedby the genetic effective population size (Ne), which is influenced by the noninde-pendence of simultaneously interfering mutations at linked chromosomal sites, bythe absolute numbers of individuals in the population (N), and by various eco-logical and behavioral factors. Ne is generally orders of magnitude smaller thanN , scaling negatively with organism size, with no known species having Ne > 109
individuals.
• The mutation rate is generally under persistent selection in the downward direc-tion, with the rate per nucleotide site per generation declining from ∼ 10−8 to∼ 10−11 with increasing Ne. This gradient can be explained by the drift-barrierhypothesis, with the efficiency of selection on replication fidelity and DNA repairbecoming stalled by random genetic drift as the room for improvement declines.This hypothesis also explains why microbial eukaryotes (with more functionalDNA) have lower mutation rates than prokaryotes with the same Ne and whyspecialized polymerases that engage in relatively small numbers of nucleotidetransactions have elevated error rates.
• Although mutations arise randomly with respect the selective demands operatingon recipient genes, they are nonrandom in almost all other respects, includingchromosomal location and nucleotide identity. Mutations are also commonlyclustered, so that the incidence of double and triple mutants can be orders ofmagnitude greater than expected by chance.
• Average rates of recombination per physical distance decline in larger organismswith decreased Ne. This is due to the fact that eukaryotic meiosis almost alwaysinvolves just one or two crossovers per chromosome arm. As average chromosomelengths increase via the passive accumulation of noncoding DNA in lineages withdecreasing Ne, the recombination rate per nucleotide site then passively declines.
• A unifying view of these observations is that ecological and behavioral factors,combined with the influence of chromosomal linkage, conspire to define the effec-tive sizes of populations, which in turn indirectly modify mutation and recombi-nation rates. Small organisms with high Ne tend to have low mutation rates buthigh recombination rates per nucleotide site. In contrast, larger organisms havelower Ne, and owing to higher levels of random genetic drift, passively evolvehigher mutation rates but lower recombination rates. These covarying aspectsof the population genetic environment modify the ways in which evolution bynatural selection can proceed in different phylogenetic lineages.
• Because mutations with selective effects � 1/Ne are overwhelmed by drift, small

POPULATION-GENETIC ENVIRONMENT 21
organisms with higher Ne are capable of utilizing a wider range of mutationaleffects in adaptive evolution. Larger organisms, with correspondingly smaller Ne,
have a reduced capacity for evolutionary fine-tuning and hence are constrainedto more coarse-grained evolution.
22 CHAPTER 4
Foundations 4.1. The amount of neutral nucleotide variation maintainedat mutation-drift equilibrium. Consider a population with a base-substitutionmutation rate of u per genomic site per generation, with a long-term average effectivepopulation size of Ne. Here we assume that each nucleotide base mutates to each of thethree other types at rate u/3. Each generation, new variation (defined as heterozygos-ity, which is the probability that randomly paired chromosomes differ at a nucleotidesite) will arise by mutation. In addition, a fraction of pre-existing variation will be lostby drift. If u and Ne are kept approximately constant, a stable equilibrium level ofheterozygosity per nucleotide site will eventually be reached, at which point the ratesof gain and loss of heterozygosity will be equal. Such heterozygosity can be measuredas either the fraction of all neutral sites that are heterozygous within single, randomdiploid individuals (assuming a randomly mating population) or as the average levelof heterozygosity over a large number of neutral sites at the population level.
To obtain the expected equilibrium, we start with a formulation for the dynamicsof neutral-site heterozygosity, and then seek the point at which the loss and gain ratesare equal. As the focus is on the neutral situation, we will assume that A, C, G,and T have equivalent fitness effects, as might be the case for a four-fold redundantsite in protein-coding sequence (e,g,, in the third positions of a number of amino-acidcodons).
Letting Ht denote the expected level of heterozygosity in generation t, and as-suming a diploid population with k allelic types per site, we wish to determine thedynamics of change in Ht and its eventual equilibrium value. It follows from basictheory (Walsh and Lynch 2018, Chapter 2) that drift causes a fractional loss of het-erozygosity equal to 1/(2Ne) per generation. Letting λ = 1 − (1/2Ne), the expectedfrequency of heterozygotes in generation t+ 1 in the absence of mutation is then λHt,whereas the expected frequency of homozygotes is 1 − λHt. Following mutation, theheterozygous state will be retained if: 1) neither allele mutates, the probability ofwhich is (1− 2u), ignoring the very small probability of double mutations to the samestate; or 2) one of the alleles mutates to a different state than the other, the probabilityof which is [2u(k − 2)/(k − 1)] assuming that all allelic types are equally mutation-ally exchangeable. For nucleotide sites, there are k = 4 alternative states, and thepreceding expression reduces to 4u/3 – each of two sites mutates to two other possi-ble nucleotides at rate 2u/3. On the other hand, homozygotes will be mutationallyconverted to heterozygotes at rate 2u.
Summing up, the expected dynamics of neutral-site heterozygosity under randommating can be expressed as
Ht+1 = λHt
((1− 2u) +
4u3
)+ 2u(1− λHt). (4.1.1)
Setting Ht+1 = Ht = H, the expected level of heterozygosity under drift-mutationbalance is found to be
H =θ
1 + (4θ/3), (4.1.2a)
where θ = 4Neu (Malecot 1948; Kimura 1968). The same expression applies to hap-loidy by setting θ = 2Neu.
There are two key points to note about Equation 4.1.2a. First, the final result isa function of one composite parameter, θ, which is equivalent to the ratio of the ratesof mutational production of heterozygotes from homozygotes (2u) and the rate of lossof heterozygosity by drift (1/2Ne). Second, if θ is � 3/4, as is almost always the casein natural populations,
H ' θ = 4Neu. (4.1.2b)
POPULATION-GENETIC ENVIRONMENT 23
Although Equation 4.1.1 needs to be modified if the different nucleotides mutate atdifferent rates (Kimura 1983; Cockerham 1984), provided the product of the averagemutation rate and 4Ne is� 1, the equilibrium approximation given by Equation 4.1.2bstill holds.
Foundations 4.2. Relationship of the recombination rate to physical dis-tance between sites. Meiotic recombination events involve heteroduplex formationsbetween paired homologous chromosomes in diploid cells. Temporary physical an-nealing of homologous regions occurs as a single strand from one chromosome invadesthe double-stranded recipient homolog (Figure 4.6). Upon separation of recombiningchromosomes, the heteroduplex DNA (containing one strand from each of the con-tributing chromosomes) remains. If heterozygous sites are contained within such apatch, the nonmatching sites have to be resolved by the mismatch-repair pathway.This leads to a process of gene conversion, as each mismatched pair of sites is restoredto a Watson-Crick state, some of which are altered to the donor-strand state. Depend-ing on how the heteroduplex is resolved, gene conversion may be accompanied by acrossover, which leads to a complete swapping of chromosomal material to one side ofthe conversion event. Gene conversion involves unidirectional exchange of information,whereas a crossover generates reciprocal exchange.
It is often assumed that the recombination rate is equivalent to the crossoverrate between sites, but this is generally not true. Although all recombination eventsinvolve gene conversion, only a fraction lead to crossovers. If a gene-conversion tractunaccompanied by a crossover occurs within the span between two distantly locatedsites, there will be no recombination between the pair of sites, as they will retain theiroriginal status. Thus, when the sites under consideration are far apart, most recombi-nation events involve crossing over because most conversion events are irrelevant. Onthe other hand, when sites are close together, recombination mostly results from theconversion of single sites (Figure 4.6).
To understand this behavior in a more quantitative way, let c0 be the total rate ofinitiation of recombination events per nucleotide site (with or without crossing over),L be the number of sites separating the two focal positions (with L = 1 for adja-cent sites), and x be the fraction of recombination events accompanied by crossingover. Using Haldane’s (1919) mapping function, which assumes equal probabilities ofrecombination at all sites, the Poisson probability of no crossover between two homol-ogous chromosomes during a meiotic event is e−2c0xL. The crossover rate can thenbe represented as 0.5(1 − e−2c0xL), which is ' c0xL for c0xL � 1, and asymptoti-cally approaches 0.5 for large c0xL. This asymptotic value of 0.5 follows from the factthat as the number of crossovers between markers increases, the recombination rateapproaches 50% because even numbers of events restore the parental state.
How does gene conversion alter the recombination rate between sites? In thefollowing, we assume distances between sites that are small enough that the crossoverrate ' c0xL; for c0xL > 1, the total recombination rate is very close to 0.5. Asnoted by Andolfatto and Nordborg (1998), from the perspective of two sites, a gene-conversion event causes recombination between a pair of sites if the conversion tractencompasses just one of the sites. Under the assumption of an exponential distributionof tract lengths with mean length T (in bp), the total conversion rate per site is(1−x)c0T (1− e−L/T ) (Langley et al. 2000; Frisse et al. 2001; Lynch et al. 2014). Thetotal recombination rate between sites separated by distance L is then
cL ' c0[xL+ (1− x)T (1− e−L/T )]. (4.2.1a)
For sites that are much more closely spaced than the average conversion-tract length,

24 CHAPTER 4
L� T,cL ' c0L, (4.2.1b)
whereas for L� T,cL ' c0Lx. (4.2.1c)
These results show that unless all recombination events are accompanied by crossovers(x = 1), the use of recombination rates between distantly related sites to extrapolateto closely spaced sites will underestimate the true rate by a factor of 1/x.
POPULATION-GENETIC ENVIRONMENT 25
Literature Cited
Andolfatto, P., and M. Nordborg. 1998. The effect of gene conversion on intralocus associations.
Genetics 148: 1397-1399.
Arnheim, N., P. Calabrese, and I. Tiemann-Boege. 2007. Mammalian meiotic recombination hot
spots. Annu. Rev. Genet. 41: 369-399.
Baer, C. F., M. M. Miyamoto, and D. R. Denver. 2007. Mutation rate variation in multicellular
eukaryotes: causes and consequences. Nature Rev. Genet. 8: 619-631.
Barton, N. H. 1995. A general model for the evolution of recombination. Genet. Res. 65: 123-145.
Barton, N. H. 2010. Mutation and the evolution of recombination. Philos. Trans. R. Soc. Lond. B
Biol. Sci. 365: 1281-1294.
Barton, N. H., and S. P. Otto. 2005. Evolution of recombination due to random drift. Genetics
169: 2353-2370.
Baudat, F., Y. Imai, and B. de Massy. 2013. Meiotic recombination in mammals: localization and
regulation. Nat. Rev. Genet. 14: 794-806.
Behjati, S., M. Huch, R. van Boxtel, W. Karthaus, D. C. Wedge, A. U. Tamuri, I. Martincorena, M.
Petljak, L. B. Alexandrov, G. Gundem, et al. 2014. Genome sequencing of normal cells reveals
developmental lineages and mutational processes. Nature 513: 422-425.
Bobay, L. M., and H. Ochman. 2017. Biological species are universal across Life’s domains. Genome
Biol. Evol. 9: 491-501.
Bobay, L. M., and H. Ochman. 2018. Factors driving effective population size and pan-genome
evolution in bacteria. BMC Evol. Biol. 18: 153.
Boe, L., M. Danielsen, S. Knudsen, J. B. Petersen, J. Maymann, and P. R. Jensen. 2000. The
frequency of mutators in populations of Escherichia coli. Mutat. Res. 448: 47-55.
Brick, K., F. Smagulova, P. Khil, R. D. Camerini-Otero, and G. V. Petukhova. 2012. Genetic
recombination is directed away from functional genomic elements in mice. Nature 485: 642-645.
Capilla, L., M. Garcia Caldes, and A. Ruiz-Herrera. 2016. Mammalian meiotic recombination: a
toolbox for genome evolution. Cytogenet. Genome Res. 150: 1-16.
Chan, K., and D. A. Gordenin. 2015. Clusters of multiple mutations: incidence and molecular
mechanisms. Annu. Rev. Genet. 49: 243-267.
Charlesworth, B. 1990. Mutation-selection balance and the evolutionary advantage of sex and
recombination. Genet. Res. 55: 199-221.
Charlesworth, B. 2012. The effects of deleterious mutations on evolution at linked sites. Genetics
190: 5-22.
Chen, J., S. Glemin, and M. Lascoux. 2017. Genetic diversity and the efficacy of purifying selection
across plant and animal species. Mol. Biol. Evol. 34: 1417-1428.
Chen, X., and J. Zhang. 2013. No gene-specific optimization of mutation rate in Escherichia coli.
Mol. Biol. Evol. 30: 1559-1562.
Chen, X., Z. Chen, H. Chen, Z. Su, J. Yang, F. Lin, S. Shi, and X. He. 2012. Nucleosomes suppress
spontaneous mutations base-specifically in eukaryotes. Science 335: 1235-1238.

26 CHAPTER 4
Cockerham, C. C. 1984. Drift and mutation with a finite number of allelic states. Proc. Natl. Acad.
Sci. USA 81: 530-534.
Coop, G., X. Wen, C. Ober, J. K. Pritchard, and M. Przeworski. 2008. High-resolution mapping
of crossovers reveals extensive variation in fine-scale recombination patterns among humans.
Science 319: 1395-1398.
Corbett-Detig, R. B., D. L. Hartl, and T. B. Sackton. 2015. Natural selection constrains neutral
diversity across a wide range of species. PLoS Biol. 13: e1002112.
Dapper, A. L., and B. A. Payseur. 2017. Connecting theory and data to understand recombination
rate evolution. Philos. Trans. R. Soc. Lond. B Biol. Sci. 372: 20160469.
de Massy, B. 2003. Distribution of meiotic recombination sites. Trends Genet. 19: 514-522.
de Massy, B. 2013. Initiation of meiotic recombination: how and where? Conservation and speci-
ficities among eukaryotes. Annu. Rev. Genet. 47: 563-599.
Denamur, E., and I. Matic. 2006. Evolution of mutation rates in bacteria. Mol. Microbiol. 60:
820-827.
Desai, M. M., and D. S. Fisher. 2007. Beneficial mutation selection balance and the effect of linkage
on positive selection. Genetics 176: 1759-1798.
Drake, J. W. 1991. A constant rate of spontaneous mutation in DNA-based microbes. Proc. Natl.
Acad. Sci. USA 88: 7160-7164.
Drake, J. W. 2007. Too many mutants with multiple mutations. Crit. Rev. Biochem. Mol. Biol.
42: 247-258.
Drake, J. W., B. Charlesworth, D. Charlesworth, and J. F. Crow. 1998. Rates of spontaneous
mutation. Genetics 148: 1667-1686.
Dumont, B. L., and B. A. Payseur. 2008. Evolution of the genomic rate of recombination in
mammals. Evolution 62: 276-294.
Earl, D. J., and M. W. Deem. 2004. Evolvability is a selectable trait. Proc. Natl. Acad. Sci. USA
101: 11531-11536.
Eshel, I., and M. W. Feldman. 1970. On the evolutionary effect of recombination. Theor. Popul.
Biol. 1: 88-100.
Ewens, W. J. 2004. Mathematical Population Genetics. 2nd Edition. Springer-Verlag, Berlin,
Germany.
Eyre-Walker, A., and P. D. Keightley. 2007. The distribution of fitness effects of new mutations.
Nature Rev. Genet. 8: 610-618.
Feldman, M. W., S. P. Otto, and F. B. Christiansen. 1996. Population genetic perspectives on the
evolution of recombination. Annu. Rev. Genet. 30: 261-295.
Felsenstein, J., and S. Yokoyama. 1976. The evolutionary advantage of recombination. II. Individ-
ual selection for recombination. Genetics 83: 845-859.
Foster, P. L. 2007. Stress-induced mutagenesis in bacteria. Crit. Rev. Biochem. Mol. Biol. 42:
373-397.
Foster, P. L., A. J. Hanson, H. Lee, E. M. Popodi, and H. Tang. 2013. On the mutational topology
of the bacterial genome. G3 (Bethesda) 3: 399-407.

POPULATION-GENETIC ENVIRONMENT 27
Frisse, L., R. R. Hudson, A. Bartoszewicz, J. D. Wall, J. Donfack, and A. Di Rienzo. 2001. Gene
conversion and different population histories may explain the contrast between polymorphism
and linkage disequilibrium levels. Amer. J. Hum. Genet. 69: 831-843.
Galhardo, R. S., P. J. Hastings, and S. M. Rosenberg. 2007. Mutation as a stress response and the
regulation of evolvability. Crit. Rev. Biochem. Mol. Biol. 42: 399-435.
Garud, N. R., and K. S. Pollard. 2020. Population genetics in the human microbiome. Trends
Genet. 36: 53-67.
Goddard, M. R., H. C. Godfray, and A. Burt. 2005. Sex increases the efficacy of natural selection
in experimental yeast populations. Nature 434: 636-640.
Goho, S., and G. Bell. 2000. Mild environmental stress elicits mutations affecting fitness in Chlamy-
domonas. Proc. Biol. Sci. 267: 123-129.
Good, B. H., and M. M. Desai. 2016. Evolution of mutation rates in rapidly adapting asexual
populations. Genetics 204: 1249-1266.
Haenel, Q., T. G. Laurentino, M. Roesti, and D. Berner. 2018. Meta-analysis of chromosome-scale
crossover rate variation in eukaryotes and its significance to evolutionary genomics. Mol. Ecol.
27: 2477-2497.
Haldane, J. B. S. 1919. The combination of linkage values, and the calculation of distance between
the loci of linked factors. J. Genetics 8: 299-309.
Harris, K., and R. Nielsen. 2014. Error-prone polymerase activity causes multinucleotide mutations
in humans. Genome Res. 24: 1445-1454.
Hartfield, M., S. P. Otto, and P. D. Keightley. 2010. The role of advantageous mutations in
enhancing the evolution of a recombination modifier. Genetics 184: 1153-1164.
Heidenreich, E. 2007. Adaptive mutation in Saccharomyces cerevisiae. Crit. Rev. Biochem. Mol.
Biol. 42: 285-311.
Hicks, W. M., M. Kim, and J. E. Haber. 2010. Increased mutagenesis and unique mutation
signature associated with mitotic gene conversion. Science 329: 82-85.
Hilliker, A. J., G. Harauz, A. G. Reaume, M. Gray, S. H. Clark, and A. Chovnick. 1994. Meiotic
gene conversion tract length distribution within the rosy locus of Drosophila melanogaster.
Genetics 137: 1019-1026.
James, A., and K. Jain. 2016. Fixation probability of rare nonmutator and evolution of mutation
rates. Ecol. Evol. 6: 755-764.
Jeffreys, A. J., J. K. Holloway, L. Kauppi, C. A. May, R. Neumann, M. T. Slingsby, and A. J.
Webb. 2004. Meiotic recombination hot spots and human DNA diversity. Phil. Trans. Roy.
Soc. Lond. B Biol. Sci. 359: 141-152.
Johnson, T., and N. H. Barton. 2002. The effect of deleterious alleles on adaptation in asexual
populations. Genetics 162: 395-411.
Kang, J. M., N. M. Iovine, and M. J. Blaser. 2006. A paradigm for direct stress-induced mutation
in prokaryotes. FASEB J. 20: 2476-2485.
Katju, V., and U. Bergthorsson. 2019. Old trade, new tricks: insights into the spontaneous
mutation process from the partnering of classical mutation accumulation experiments with high-

28 CHAPTER 4
throughput genomic approaches. Genome Biol. Evol. 11: 136-165.
Keightley, P. D., and S. P. Otto. 2006. Interference among deleterious mutations favours sex and
recombination in finite populations. Nature 443: 89-92.
Kimura, M. 1957. Some problems of stochastic processes in genetics. Ann. Math. Stat. 28: 882-901.
Kimura, M. 1967. On the evolutionary adjustment of spontaneous mutation rates. Genet. Res. 9:
23-34.
Kimura, M. 1968. Genetic variability maintained in a finite population due to mutational produc-
tion of neutral and nearly neutral isoalleles. Genet. Res. 11: 247-269.
Kimura, M. 1983. The Neutral Theory of Molecular Evolution. Cambridge Univ. Press, Cambridge,
UK.
Kimura, M., and T. Ohta. 1969. The average number of generations until fixation of a mutant
gene in a finite population. Genetics 61: 763-771.
Kivisaar, M. 2010. Mechanisms of stationary-phase mutagenesis in bacteria: mutational processes
in pseudomonads. FEMS Microbiol. Lett. 312: 1-14.
Kohl, K. P., and J. Sekelsky. 2013. Meiotic and mitotic recombination in meiosis. Genetics 194:
327-334.
Kondrashov, A. S. 1988. Deleterious mutations and the evolution of sexual reproduction. Nature
336: 435-440.
Lam, I., and S. Keeney. 2015. Nonparadoxical evolutionary stability of the recombination initiation
landscape in yeast. Science 350: 932-937.
Lang, G. I., and A. W. Murray. 2011. Mutation rates across budding yeast chromosome VI are
correlated with replication timing. Genome Biol. Evol. 3: 799-811.
Langley, C. H., B. P. Lazzaro, W. Phillips, E. Heikkinen, and J. M. Braverman. 2000. Linkage
disequilibria and the site frequency spectra in the su(s) and su(wa) regions of the Drosophila
melanogaster X chromosome. Genetics 156: 1837-1852.
Leffler, E. M., K. Bullaughey, D. R. Matute, W. K. Meyer, L. Segurel, A. Venkat, P. Andolfatto,
and M. Przeworski. 2012. Revisiting an old riddle: what determines genetic diversity levels
within species? PLoS Biol. 10: e1001388.
Leigh, E. G., Jr. 1970. Natural selection and mutability. Amer. Natur. 104: 301-305.
Liu, H., J. Huang, X. Sun, J. Li, Y. Hu, L. Yu, G. Liti, D. Tian, L. D. Hurst, and S. Yang. 2018.
Tetrad analysis in plants and fungi finds large differences in gene conversion rates but no GC
bias. Nat. Ecol. Evol. 2: 164-173.
Long, H., W. Sung, S. F. Miller, M. S. Ackerman, T. G. Doak, and M. Lynch. 2015. Muta-
tion rate, spectrum, topology, and context-dependency in the DNA mismatch-repair deficient
Pseudomonas fluorescens ATCC948. Genome Biol. Evol. 7: 262-271.
Long, H., W. Sung, S. Kucukyildirim, E. Williams, S. W. Guo, C. Patterson, C. Gregory, C.
Strauss, C. Stone, C. Berne, D. Kysela, et al. 2017. Evolutionary determinants of genome-wide
nucleotide composition. Nature Ecol. Evol. 2: 237-240.
Lukacisinova, M., S. Novak, and T. Paixao. 2017. Stress-induced mutagenesis: stress diversity
facilitates the persistence of mutator genes. PLoS Comput. Biol. 13: e1005609.

POPULATION-GENETIC ENVIRONMENT 29
Lynch, M. 2006. The origins of eukaryotic gene structure. Mol. Biol. Evol. 23: 450-468.
Lynch, M. 2007. The Origins of Genome Complexity. Sinauer Assocs., Inc. Sunderland, MA.
Lynch, M. 2008. The cellular, developmental, and population-genetic determinants of mutation-rate
evolution. Genetics 180: 933-943.
Lynch, M. 2010. Evolution of the mutation rate. Trends Genetics 26: 345-352.
Lynch, M. 2011. The lower bound to the evolution of mutation rates. Genome Biol. Evol. 3:
1107-1118.
Lynch, M. 2020. The evolutionary scaling of cellular traits imposed by the drift barrier. Proc. Natl.
Acad. Sci. USA 117: 10435-10444.
Lynch, M., M. Ackerman, J.-F. Gout, H. Long, W. Sung, W. K. Thomas, and P. L. Foster. 2016.
Genetic drift, selection, and evolution of the mutation rate. Nature Rev. Genetics 17: 704-714.
Lynch, M., J. Blanchard, D. Houle, T. Kibota, S. Schultz, L. Vassilieva, and J. Willis. 1999.
Spontaneous deleterious mutation. Evolution 53: 645-663.
Lynch, M., L. M. Bobay, F. Catania, J.-F. Gout, and M. Rho. 2011. The repatterning of eukaryotic
genomes by random genetic drift. Annu. Rev. Genomics Hum. Genet. 12: 347-366.
Lynch, M., and B. Trickovic. 2020. A theoretical framework for evolutionary cell biology. J. Mol.
Biol. 432: 1861-1879.
Lynch, M., and J. B. Walsh. 1998. Genetics and Analysis of Quantitative Traits. Sinauer Assocs.,
Inc., Sunderland, MA.
Lynch, M., S. Xu, T. Maruki, P. Pfaffelhuber, and B. Haubold. 2014. Genome-wide linkage-
disequilibrium profiles from single individuals. Genetics 198: 269-281.
MacLean, R. C., C. Torres-Barcelo, and R. Moxon. 2013. Evaluating evolutionary models of
stress-induced mutagenesis in bacteria. Nat. Rev. Genet. 14: 221-227.
Maharjan, R. P., and T. Ferenci. 2017. A shifting mutational landscape in 6 nutritional states:
stress-induced mutagenesis as a series of distinct stress input-mutation output relationships.
PLoS Biol. 15: e2001477.
Malecot, G. 1948. Les Mathmatiques de lHeredite. Masson, Paris.
Malecot, G. 1952. Les processes stochastiques et la methode des fonctions generatrices ou carac-
terestiques. Publ. Inst. Stat. Univ. Paris 1: Fasc. 3: 1-16.
Malkova, A., and J. E. Haber. 2012. Mutations arising during repair of chromosome breaks. Annu.
Rev. Genet. 46: 455-473.
Malkova, A., J. Swanson, M. German, J. H. McCusker, E. A. Housworth, F. W. Stahl, abnd J. E.
Haber. 2004. Gene conversion and crossing over along the 405-kb left arm of Saccharomyces
cerevisiae chromosome VII. Genetics 168: 49-63.
Mancera, E., R. Bourgon, A. Brozzi, W. Huber, and L. M. Steinmetz. 2008. High-resolution
mapping of meiotic crossovers and non-crossovers in yeast. Nature 454: 479-485.
Martincorena, I., A. S. Seshasayee, and N. M. Luscombe. 2012. Evidence of non-random mutation
rates suggests an evolutionary risk management strategy. Nature 485: 95-98.
Matsuba, C., D. G. Ostrow, M. P. Salomon, A. Tolani, and C. F. Baer. 2013. Temperature, stress
30 CHAPTER 4
and spontaneous mutation in Caenorhabditis briggsae and Caenorhabditis elegans. Biol. Lett.
9: 20120334.
McDonald, M. J., Y. Y. Hsieh, Y. H. Yu, S. L. Chang, and J. Y. Leu. 2012. The evolution of low
mutation rates in experimental mutator populations of Saccharomyces cerevisiae. Curr. Biol.
22: 1235-1240.
McDonald, M. J., D. P. Rice, and M. M. Desai. 2016. Sex speeds adaptation by altering the
dynamics of molecular evolution. Nature 531: 233-236.
Milholland, B., X. Dong, L. Zhang, X. Hao, Y. Suh, and J. Vijg. 2017. Differences between germline
and somatic mutation rates in humans and mice. Nat. Commun. 8: 15183.
Morrell, P. L., D. M. Toleno, K. E. Lundy, and M. T. Clegg. 2006. Estimating the contribution of
mutation, recombination and gene conversion in the generation of haplotypic diversity. Genetics
173: 1705-1723.
Munoz-Fuentes, V., M. Marcet-Ortega, G. Alkorta-Aranburu, C. Linde Forsberg, J. M. Morrell,
E. Manzano-Piedras, A. Soderberg, K. Daniel, A. Villalba, A. Toth, A. Di Rienzo, et al. 2015.
Strong artificial selection in domestic mammals did not result in an increased recombination
rate. Mol. Biol. Evol. 32: 510-523.
Myers, S., L. Bottolo, C. Freeman, G. McVean, and P. Donnelly. 2005. A fine-scale map of
recombination rates and hotspots across the human genome. Science 310: 321-324.
Neher, R. A. 2013. Genetic draft, selective interference, and population genetics of rapid adaptation.
Ann. Rev. Ecol. Evol. Syst. 44: 195-215.
Orr, H. A. 2000. The rate of adaptation in asexuals. Genetics 155: 961-968.
Otto, S. P., and N. H. Barton. 2001. Selection for recombination in small populations. Evolution
55: 1921-1931.
Padhukasahasram, B., and B. Rannala. 2013. Meiotic gene-conversion rate and tract length varia-
tion in the human genome. Eur. J. Hum. Genet. 2013: 1-8.
Palsson, S. 2002. Selection on a modifier of recombination rate due to linked deleterious mutations.
J. Hered. 93: 22-26.
Paul, S., S. Million-Weaver, S. Chattopadhyay, E. Sokurenko, and H. Merrikh. 2013. Accelerated
gene evolution through replication-transcription conflicts. Nature 495: 512-515.
Petes, T. D. 2001. Meiotic recombination hot spots and cold spots. Nat. Rev. Genetics 2: 360-369.
Radman, M., F. Taddei, and I. Matic. 2000. Evolution-driving genes. Res. Microbiol. 151: 91-95.
Ram, Y., and L. Hadany. 2014. Stress-induced mutagenesis and complex adaptation. Proc. Biol.
Sci. 281: 20141025.
Raynes, Y., and P. D. Sniegowski. 2014. Experimental evolution and the dynamics of genomic
mutation rate modifiers. Heredity 113: 375-380.
Ritz, K. R., M. A. F. Noor, and N. D. Singh. 2017. Variation in recombination rate: adaptive or
not? Trends Genet. 33: 364-374.
Romiguier, J., P. Gayral, M. Ballenghien, A. Bernard, V. Cahais, A. Chenuil, Y. Chiari, R. Dernat,
L. Duret, N. Faivre, et al. 2014. Comparative population genomics in animals uncovers the
determinants of genetic diversity. Nature 515: 261-263.

POPULATION-GENETIC ENVIRONMENT 31
Rosen, M. J., M. Davison, D. Bhaya, and D. S. Fisher. 2015. Fine-scale diversity and extensive
recombination in a quasisexual bacterial population occupying a broad niche. Science 348:
1019-1023.
Rosenberg, S. M. 2001. Evolving responsively: adaptive mutation. Nat. Rev. Genet. 2: 504-515.
Rosenberg, S. M., C. Shee, R. L. Frisch, and P. J. Hastings. 2012. Stress-induced mutation via
DNA breaks in Escherichia coli: a molecular mechanism with implications for evolution and
medicine. Bioessays 34: 885-892.
Roze, D., and N. H. Barton. 2006. The Hill-Robertson effect and the evolution of recombination.
Genetics 173: 1793-1811.
Sakoparnig, T., C. Field, and E. van Nimwegen. 2021. Whole genome phylogenies reflect the
distributions of recombination rates for many bacterial species. eLife 10: e65366.
Schrider, D. R., J. N. Hourmozdi, and M. W. Hahn. 2011. Pervasive multinucleotide mutational
events in eukaryotes. Curr. Biol. 21: 1051-1054.
Shapiro, B. J. 2016. How clonal are bacteria over time? Curr. Opin. Microbiol. 31: 116-123.
Sharp, N. P., and A. F. Agrawal. 2012. Evidence for elevated mutation rates in low-quality
genotypes. Proc. Natl. Acad. Sci. USA 109: 6142-6146.
Shewaramani, S., T. J. Finn, S. C. Leahy, R. Kassen, P. B. Rainey, and C. D. Moon. 2017.
Anaerobically grown Escherichia coli has an enhanced mutation rate and distinct mutational
spectra. PLoS Genet. 13: e1006570.
Singh, T., M. Hyun, and P. Sniegowski. 2017. Evolution of mutation rates in hypermutable
populations of Escherichia coli propagated at very small effective population size. Biol. Lett.
13: 20160849.
Stamatoyannopoulos, J. A., I. Adzhubei, R. E. Thurman, G. V. Kryukov, S. M. Mirkin, and S. R.
Sunyaev. 2009. Human mutation rate associated with DNA replication timing. Nat. Genet.
41: 393-395.
Stapley, J., P. G. D. Feulner, S. E. Johnston, A. W. Santure, and C. M. Smadja. 2017. Variation
in recombination frequency and distribution across eukaryotes: patterns and processes. Philos.
Trans. R. Soc. Lond. B Biol. Sci. 372: 20160455.
Sung, W., M. S. Ackerman, M. M. Dillon, T. G. Platt, C. Fuqua, V. S. Cooper, and M. Lynch.
2016. Evolution of the insertion-deletion mutation rate across the Tree of Life. G3 (Bethesda)
6: 2583-2591.
Sung, W., M. S. Ackerman, J. F. Gout, S. F. Miller, P. Foster, and M. Lynch. 2015. Asymmet-
ric context-dependent mutation patterns revealed through mutation-accumulation experiments.
Mol. Biol. Evol. 32: 1672-1683.
Swings, T., B. Weytjens, T. Schalck, C. Bonte, N. Verstraeten, J. Michiels, and K. Marchal. 2017.
Network-based identification of adaptive pathways in evolved ethanol-tolerant bacterial popu-
lations. Mol. Biol. Evol. 34: 2927-2943.
Tenaillon, O., F. Taddei, M. Radman, and I. Matic. 2001. Second-order selection in bacterial
evolution: selection acting on mutation and recombination rates in the course of adaptation.
Res. Microbiol. 152: 11-16.
Terekhanova, N. V., G. A. Bazykin, A. Neverov, A. S. Kondrashov, and V. B. Seplyarskiy. 2013.

32 CHAPTER 4
Prevalence of multinucleotide replacements in evolution of primates and Drosophila. Mol. Biol.
Evol. 30: 1315-1325.
Turrientes, M. C., F. Baquero, B. R Levin, J.-L. Martinez, A. Ripoll, J.-M. Gonzalez-Alba, R. Tobes,
M. Manrique, M.-R. Baquero, M.-J. Rodriguez-Dominguez, et al. 2013. Normal mutation rate
variants arise in a mutator (Mut S) Escherichia coli population. PLoS One 8: e72963.
Uphoff, S., N. D. Lord, B. Okumus, L. Potvin-Trottier, D. J. Sherratt, and J. Paulsson. 2016.
Stochastic activation of a DNA damage response causes cell-to-cell mutation rate variation.
Science 351: 1094-1097.
Vos, M., and X. Didelot. 2009. A comparison of homologous recombination rates in bacteria and
archaea. ISME J. 3: 199-208.
Walsh, J. B., and M. Lynch 2018. Evolution of Quantitative Traits. Sinauer Assocs., Inc., Sunder-
land, MA.
Wells, D., E. Bitoun, D. Moralli, G. Zhang, A. Hinch, J. Jankowska, P. Donnelly, C. Green, and S.
R. Myers. 2020. ZCWPW1 is recruited to recombination hotspots by PRDM9 and is essential
for meiotic double strand break repair. eLife 9: e53392.
Wielgoss, S., J. E. Barrick, O. Tenaillon, M. J. Wiser, W. J. Dittmar, S. Cruveiller, B. Chane-
Woon-Ming, C. Medigue, R. E. Lenski, and D. Schneider. 2013. Mutation rate dynamics in a
bacterial population reflect tension between adaptation and genetic load. Proc. Natl. Acad. Sci.
USA 110: 222-227.
Williams, L. N., A. J. Herr, and B. D. Preston. 2013. Emergence of DNA polymerase ε antimutators
that escape error-induced extinction in yeast. Genetics 193: 751-770.
Yang, S., Y. Yuan, L. Wang, J. Li, W. Wang, H. Liu, J. Q. Chen, L. D. Hurst, and D. Tian. 2012.
Great majority of recombination events in Arabidopsis are gene conversion events. Proc. Natl.
Acad. Sci. USA 109: 20992-20997.
Yin, J., M. I. Jordan, and Y. S. Song. 2009. Joint estimation of gene conversion rates and mean
conversion tract lengths from population SNP data. Bioinformatics 25: i231-i239.


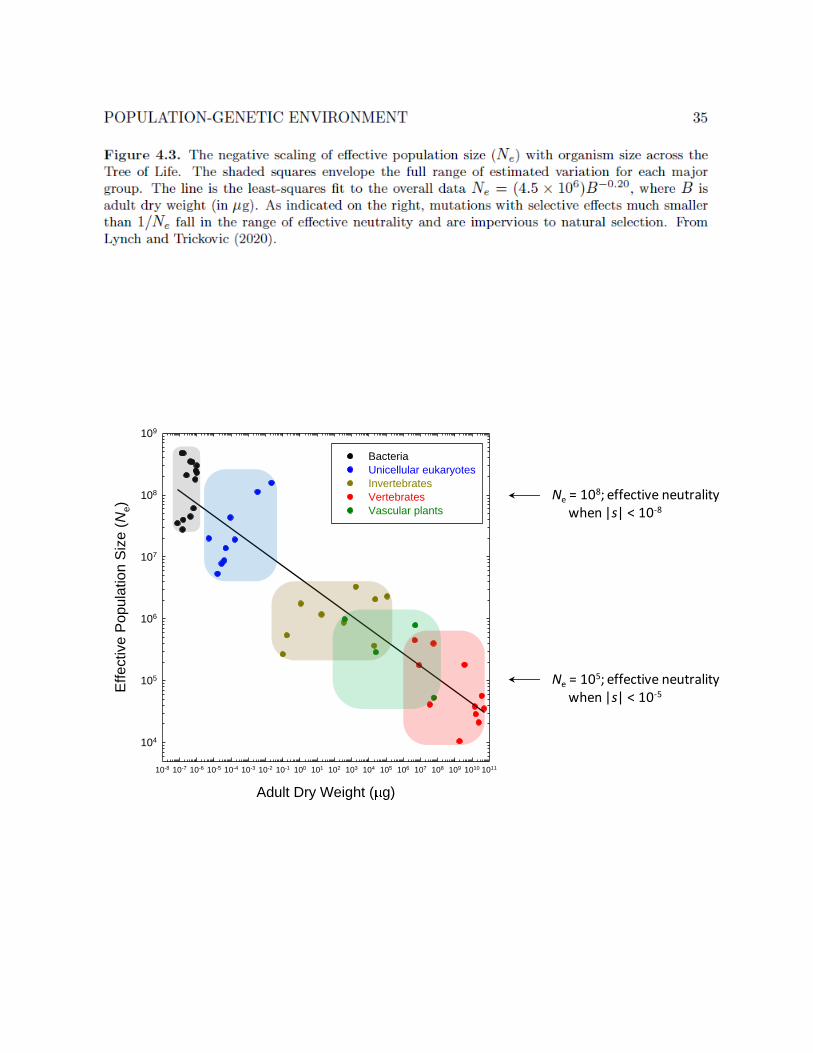
Ne = 108; effective neutrality when |s| < 10-8
Ne = 105; effective neutrality when |s| < 10-5
Adult Dry Weight ( g)
10-8 10-7 10-6 10-5 10-4 10-3 10-2 10-1 100 101 102 103 104 105 106 107 108 109 1010 1011
Effective P
opula
tion S
ize (
Ne)
104
105
106
107
108
109
Bacteria
Unicellular eukaryotes
Invertebrates
Vertebrates
Vascular plants


Effective Population Size (Ne)
104 105 106 107 108 109
Base
-su
bstitu
tio
n M
uta
tio
n R
ate
(/
site
/ g
en
era
tio
n)
10-11
10-10
10-9
10-8
10-7
Bacteria
Unicellular eukaryotes
Multicellular eukaryotes
Effective Population Size
104 105 106 107 108 109
Muta
tions /
codin
g D
NA
/ g
enera
tion
10-4
10-3
10-2
10-1
100

conversionpatch
potential siteof crossover
Parental DNAmolecules
Enzymaticbreaks
Strand invasion
Branchmigration
HeteroduplexDNA requiringgene conversion

