4 - 1 chapter 4 risk and return: the basics basic return concepts basic risk concepts stand-alone...
TRANSCRIPT

4 - 1
CHAPTER 4 Risk and Return: The Basics
Basic return concepts
Basic risk concepts
Stand-alone risk

4 - 2
What are investment returns?
Investment returns measure the financial results of an investment.
Returns may be historical or prospective (anticipated).
Returns can be expressed in:
Dollar terms.
Percentage terms.

4 - 3
What is the return on an investment that costs $1,000 and is sold
after 1 year for $1,100?
Dollar return:
Percentage return:
$ Received - $ Invested $1,100 - $1,000 = $100.
$ Return/$ Invested $100/$1,000 = 0.10 = 10%.

4 - 4
What is investment risk?
Typically, investment returns are not known with certainty.
Investment risk pertains to the probability of earning a return less than that expected.
The greater the chance of a return far below the expected return, the greater the risk.

4 - 5
Probability distribution
Rate ofreturn (%) 50150-20
Stock X
Stock Y
Which stock is riskier? Why?
30

4 - 6
Stock Y is riskier

4 - 7
Measuring Stand-Alone Risk: Standard deviation σ
1- Standard deviation σ ( absolute mean of risk)
Standard deviation measures the stand-alone risk of an investment.
The larger the standard deviation, the higher the probability that returns will be far below the expected return.
4 - 8
Measuring Stand-Alone Risk: The Coefficient of Variation
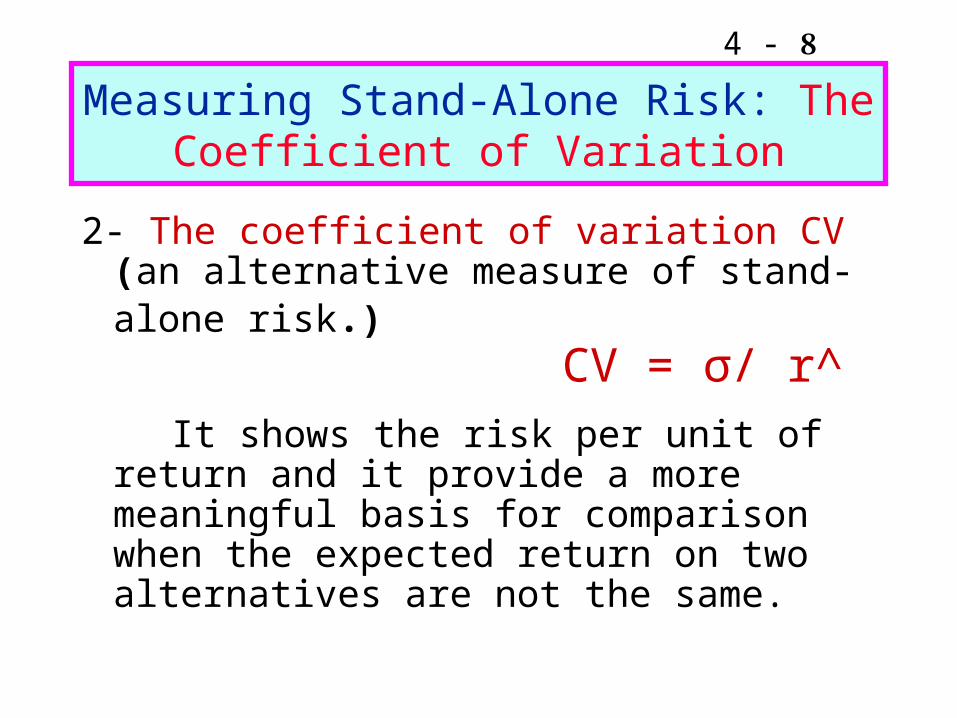
2- The coefficient of variation CV (an alternative measure of stand-alone risk.) CV = σ/ r^
It shows the risk per unit of return and it provide a more meaningful basis for comparison when the expected return on two alternatives are not the same.
4 - 9
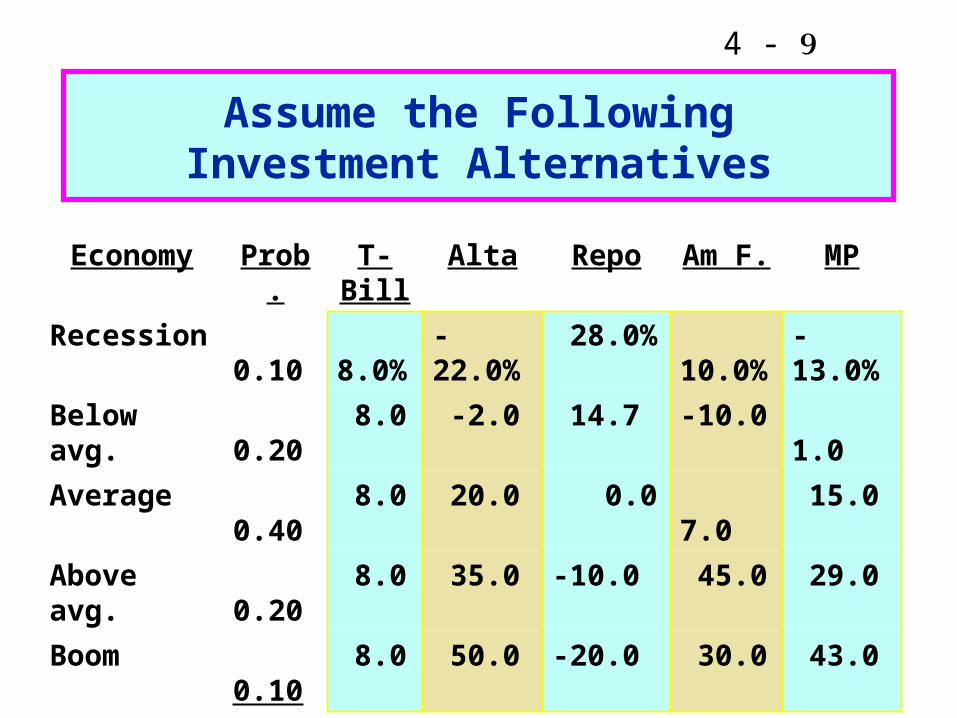
Assume the FollowingInvestment Alternatives
Economy Prob. T-Bill Alta Repo Am F. MP
Recession 0.10 8.0% -22.0% 28.0% 10.0% -13.0%
Below avg. 0.20 8.0 -2.0 14.7 -10.0 1.0
Average 0.40 8.0 20.0 0.0 7.0 15.0
Above avg. 0.20 8.0 35.0 -10.0 45.0 29.0
Boom 0.10 8.0 50.0 -20.0 30.0 43.0
1.00

4 - 10
What is unique about the T-bill return?
The T-bill will return 8% regardless of the state of the economy.
Is the T-bill riskless? Explain.

4 - 11
Do the returns of Alta Inds. and Repo Men move with or counter to the
economy?
Alta Inds. moves with the economy, so it is positively correlated with the economy. This is the typical situation.
Repo Men moves counter to the economy. Such negative correlation is unusual.

4 - 12
Calculate the expected rate of return on each alternative.
. n
1=iiiPr = r
r = expected rate of return.
rAlta = 0.10(-22%) + 0.20(-2%) + 0.40(20%) + 0.20(35%) + 0.10(50%) = 17.4%.
^
^

4 - 13
Alta has the highest rate of return. Does that make it best?
r
Alta 17.4%Market 15.0Am. Foam 13.8T-bill 8.0Repo Men 1.7
^

4 - 14
What is the standard deviationof returns for each alternative?
.
Variance
deviation Standard
1
2
2
n
iii Prr

4 - 15
T-bills = 0.0%.Alta = 20.0%.
Repo= 13.4%.Am Foam = 18.8%. Market = 15.3%.
.1
2
n
iii Prr
Alta Inds:
= ((-22 - 17.4)20.10 + (-2 - 17.4)20.20 + (20 - 17.4)20.40 + (35 - 17.4)20.20 + (50 - 17.4)20.10)1/2 = 20.0%.

4 - 16
Prob.
Rate of Return (%)
T-bill
Am. F.
Alta
0 8 13.8 17.4

4 - 17
Standard deviation measures the stand-alone risk of an investment.
The larger the standard deviation, the higher the probability that returns will be far below the expected return.
Coefficient of variation is an alternative measure of stand-alone risk.
4 - 18
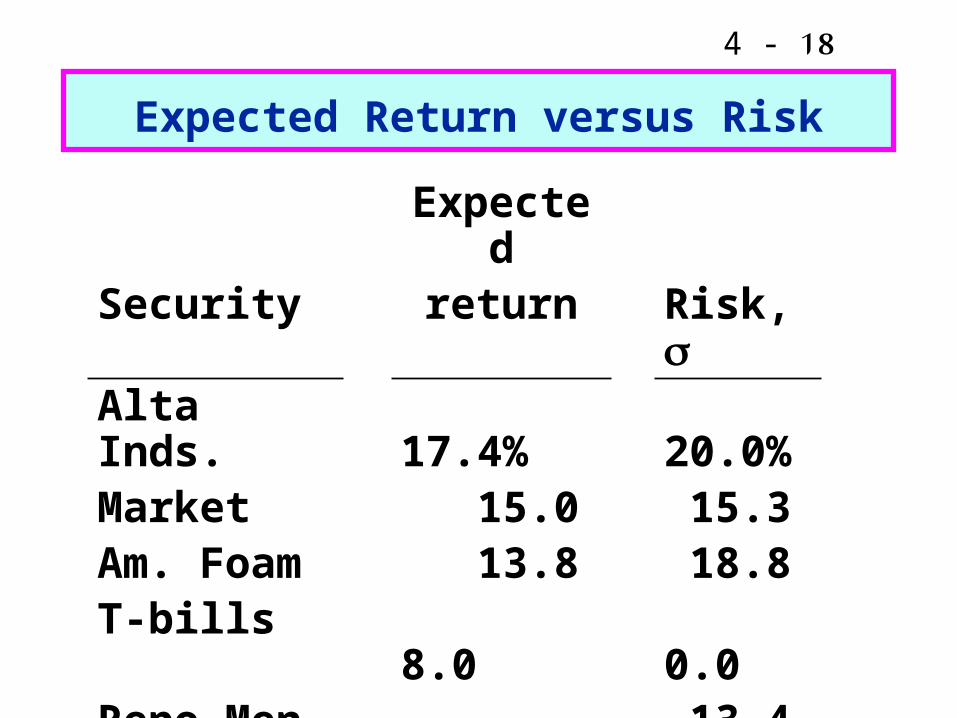
Expected Return versus Risk
Expected
Security return Risk, Alta Inds. 17.4% 20.0%
Market 15.0 15.3
Am. Foam 13.8 18.8
T-bills 8.0 0.0
Repo Men
1.7 13.4

4 - 19
Coefficient of Variation:CV = Standard deviation/expected return
CVT-BILLS = 0.0%/8.0% = 0.0.
CVAlta Inds = 20.0%/17.4% = 1.1.
CVRepo Men = 13.4%/1.7% = 7.9.
CVAm. Foam = 18.8%/13.8% = 1.4.
CVM = 15.3%/15.0% = 1.0.

4 - 20
Expected Return versus Coefficient of Variation
Expected
Risk: Risk:
Security return CV
Alta Inds 17.4% 20.0% 1.1
Market 15.0 15.3 1.0
Am. Foam 13.8 18.8 1.4
T-bills 8.0 0.0 0.0
Repo Men
1.7 13.4 7.9

4 - 21
T-bills
Repo
MktAm. Foam
Alta
0.0%2.0%4.0%6.0%8.0%
10.0%12.0%14.0%16.0%18.0%20.0%
0.0% 5.0% 10.0% 15.0% 20.0% 25.0%
Risk (Std. Dev.)
Ret
urn
Return vs. Risk (Std. Dev.): Which investment is best?