3g radio network planning for a mobile network operator miguel
TRANSCRIPT

3G Radio Network Planning for a Mobile
Network Operator
Miguel França Martins
Lisbon, November 28th 2014

Agenda2
o Motivation
o Objectives
o 3G Radio Network Planning
o Optimization Process
o Conclusions
Instituto Superior Técnico

Motivation3
Instituto Superior Técnico
o By the end of 2019, 3G networks will represent 50%
of worldwide mobile subscriptions
Motivation
Objectives
3G RNP
OptimizationProcess
Conclusions
Motivation4
Instituto Superior Técnico
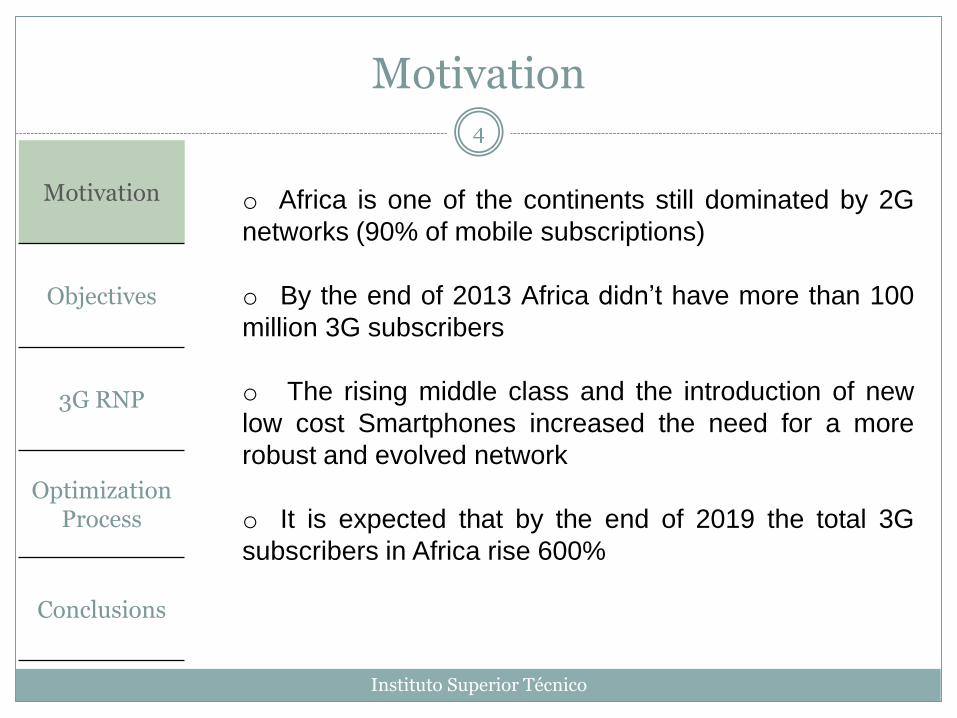
o Africa is one of the continents still dominated by 2G
networks (90% of mobile subscriptions)
o By the end of 2013 Africa didn’t have more than 100
million 3G subscribers
o The rising middle class and the introduction of new
low cost Smartphones increased the need for a more
robust and evolved network
o It is expected that by the end of 2019 the total 3G
subscribers in Africa rise 600%
Motivation
Objectives
3G RNP
OptimizationProcess
Conclusions

Objectives5
Instituto Superior Técnico
o Provide a 3G Radio Network Planning (RNP) for a
mobile operator in Cameroon
o Make predictions of coverage area by service, quality
and interference based on the 2G network configurations
(location of the sites and tilts)
o Optimize the network configurations to the new 3G
network
o Further optimize the network to achieve the Alcatel-
Lucent and the customer requirements
Motivation
Objectives
3G RNP
OptimizationProcess
Conclusions

3G Radio Network Planning6
Instituto Superior Técnico
o Alcatel-Lucent Link Budget ToolMotivation
Objectives
3G RNP
OptimizationProcess
Conclusions

3G Radio Network Planning7
Instituto Superior Técnico
o Alcatel-Lucent A9955 ToolMotivation
Objectives
3G RNP
OptimizationProcess
Conclusions

3G Radio Network Planning8
Instituto Superior Técnico
o Alcatel-Lucent A9955 Tool
o The propagation model adopted in the project
was the Standard Propagation Model (SPM)
o Is suited for predictions between 150 to 3500MHz
over long distances
o SPM is given by the following formula:
Motivation
Objectives
3G RNP
OptimizationProcess
Conclusions
3G Radio Network Planning9
Instituto Superior Técnico
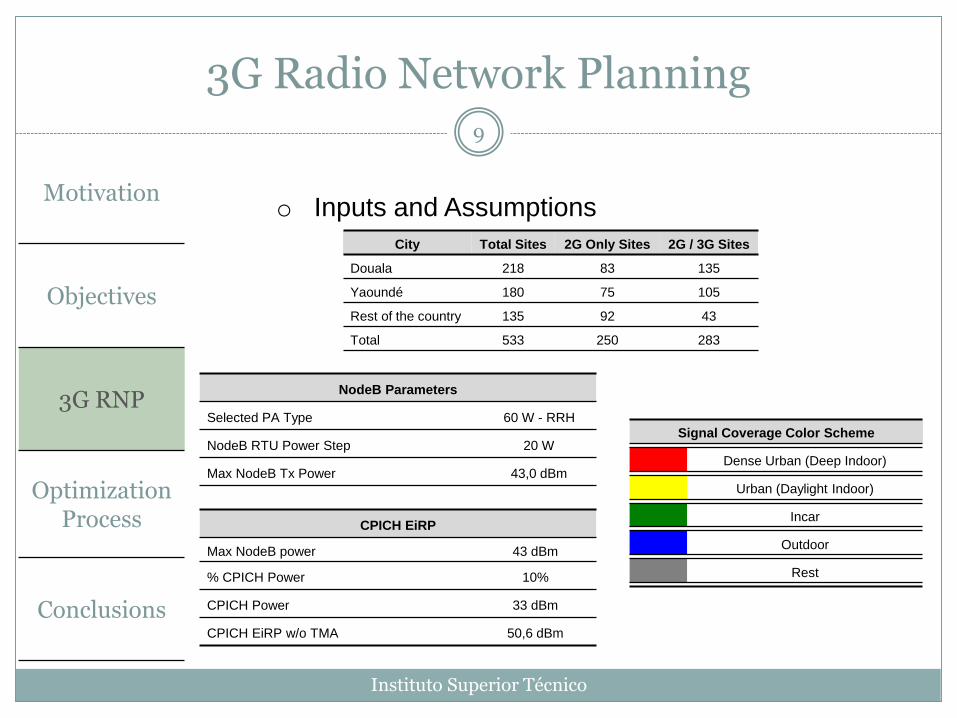
o Inputs and AssumptionsMotivation
Objectives
3G RNP
OptimizationProcess
Conclusions
City Total Sites 2G Only Sites 2G / 3G Sites
Douala 218 83 135
Yaoundé 180 75 105
Rest of the country 135 92 43
Total 533 250 283
NodeB Parameters
Selected PA Type 60 W - RRH
NodeB RTU Power Step 20 W
Max NodeB Tx Power 43,0 dBm
CPICH EiRP
Max NodeB power 43 dBm
% CPICH Power 10%
CPICH Power 33 dBm
CPICH EiRP w/o TMA 50,6 dBm
Signal Coverage Color Scheme
Dense Urban (Deep Indoor)
Urban (Daylight Indoor)
Incar
Outdoor
Rest

3G Radio Network Planning10
Instituto Superior Técnico
o Design Project Goals
o Alcatel-Lucent design goals:
o 95% covered area with outdoor RNP design
level in PS128 service
o 95% coverage area with Ec/I0 value of -15dB
o Less than 2% of covered area with 4 servers
within 4dB of the best server
o Customer design goals:
o 95% covered area with outdoor RNP design
level in PS128 & HSDPA 2Mbps service
o 70% covered area with urban RNP design
level in PS128 & HSDPA 2Mbps service
Motivation
Objectives
3G RNP
OptimizationProcess
Conclusions
Optimization Process11
Instituto Superior Técnico
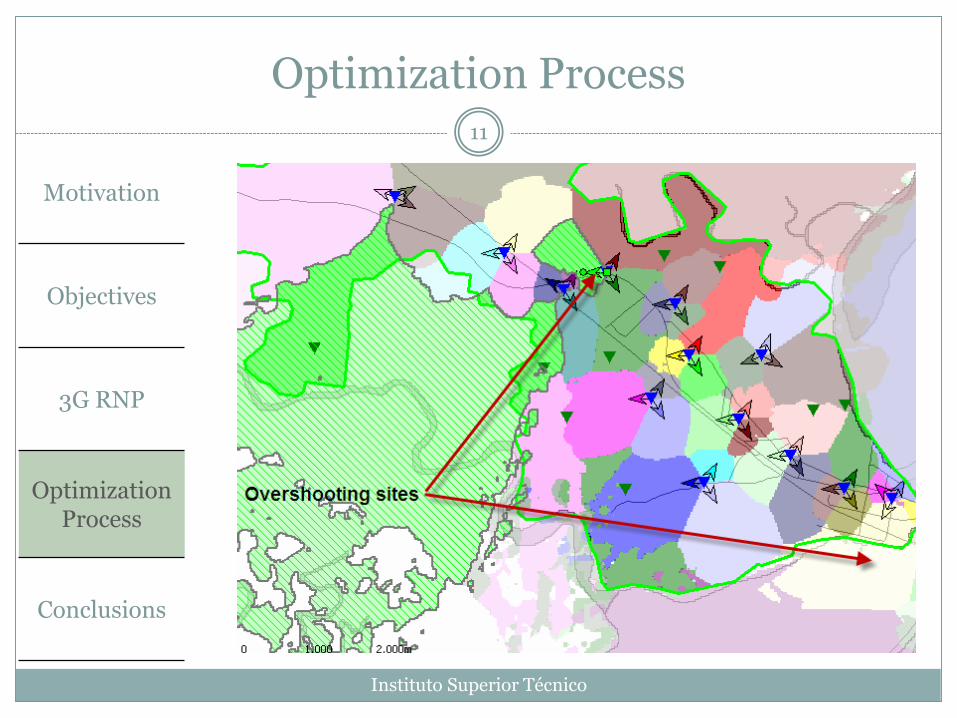
o Optimization criteria are limited to electrical Up/Down
tilt modifications, based on 3 points:
o Sectors in cluster border, with high electrical
down tilt, may be optimized
o Overshooting sectors may be optimized in order
to improve quality
o Sectors with excessive electrical down tilt may be
up tilted in order to improve coverage
o Based on these criteria there are 3 main optimization
phases: Tilt optimization, New Sites proposal and Power
optimization
Motivation
Objectives
3G RNP
OptimizationProcess
Conclusions

12
Instituto Superior Técnico
o Tilt optimization phase
Tilt Optimization Phase
Motivation
Objectives
3G RNP
OptimizationProcess
Conclusions
13
Instituto Superior Técnico
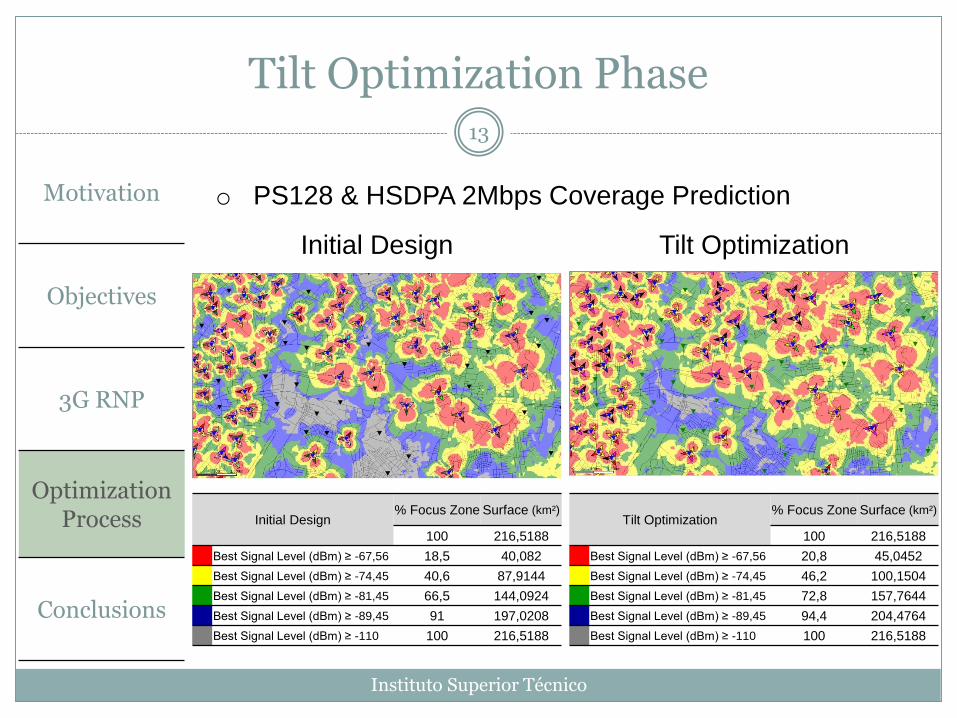
o PS128 & HSDPA 2Mbps Coverage Prediction
Tilt Optimization Phase
Initial Design Tilt Optimization
Initial Design% Focus Zone Surface (km²)
100 216,5188
Best Signal Level (dBm) ≥ -67,56 18,5 40,082
Best Signal Level (dBm) ≥ -74,45 40,6 87,9144
Best Signal Level (dBm) ≥ -81,45 66,5 144,0924
Best Signal Level (dBm) ≥ -89,45 91 197,0208
Best Signal Level (dBm) ≥ -110 100 216,5188
Tilt Optimization% Focus Zone Surface (km²)
100 216,5188
Best Signal Level (dBm) ≥ -67,56 20,8 45,0452
Best Signal Level (dBm) ≥ -74,45 46,2 100,1504
Best Signal Level (dBm) ≥ -81,45 72,8 157,7644
Best Signal Level (dBm) ≥ -89,45 94,4 204,4764
Best Signal Level (dBm) ≥ -110 100 216,5188
Motivation
Objectives
3G RNP
OptimizationProcess
Conclusions

14
Instituto Superior Técnico
o PS128 Pilot Quality Prediction
Tilt Optimization Phase
Initial Design
Inital Design% Focus Zone Surface (km²)
98,2 212,8124
Ec/I0 (dB) ≥ -8 30,8 66,8236
Ec/I0 (dB) ≥ -9 46,3 100,2276
Ec/I0 (dB) ≥ -10 59,2 128,32
Ec/I0 (dB) ≥ -11 73,3 158,726
Ec/I0 (dB) ≥ -12 84,4 182,8644
Ec/I0 (dB) ≥ -13 91,9 199,116
Ec/I0 (dB) ≥ -14 96,3 208,5684
Ec/I0 (dB) ≥ -15 98,2 212,8124
Tilt Optimization
Tilt Optimization% Focus Zone Surface (km²)
98,8 214,1232
Ec/I0 (dB) ≥ -8 30 64,984
Ec/I0 (dB) ≥ -9 46,5 100,7204
Ec/I0 (dB) ≥ -10 60,6 131,234
Ec/I0 (dB) ≥ -11 74,5 161,4596
Ec/I0 (dB) ≥ -12 85,3 184,6708
Ec/I0 (dB) ≥ -13 92,7 200,7492
Ec/I0 (dB) ≥ -14 96,9 209,9544
Ec/I0 (dB) ≥ -15 98,8 214,1232
Motivation
Objectives
3G RNP
OptimizationProcess
Conclusions
15
Instituto Superior Técnico
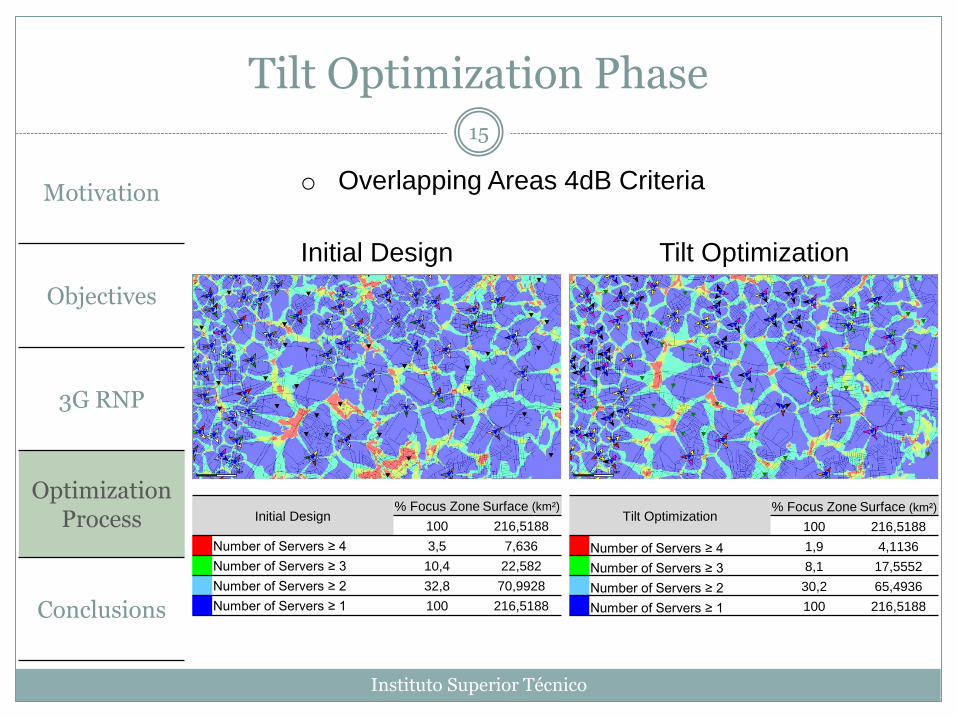
o Overlapping Areas 4dB Criteria
Tilt Optimization Phase
Initial Design
Initial Design% Focus Zone Surface (km²)
100 216,5188
Number of Servers ≥ 4 3,5 7,636
Number of Servers ≥ 3 10,4 22,582
Number of Servers ≥ 2 32,8 70,9928
Number of Servers ≥ 1 100 216,5188
Tilt Optimization
Tilt Optimization% Focus Zone Surface (km²)
100 216,5188
Number of Servers ≥ 4 1,9 4,1136
Number of Servers ≥ 3 8,1 17,5552
Number of Servers ≥ 2 30,2 65,4936
Number of Servers ≥ 1 100 216,5188
Motivation
Objectives
3G RNP
OptimizationProcess
Conclusions

16
Instituto Superior Técnico
o PS128 & HSDPA 2Mbps Coverage Prediction
New Sites Proposal
Tilt Optimization
Tilt Optimization% Focus Zone Surface (km²)
100 216,5188
Best Signal Level (dBm) ≥ -67,56 20,8 45,0452
Best Signal Level (dBm) ≥ -74,45 46,2 100,1504
Best Signal Level (dBm) ≥ -81,45 72,8 157,7644
Best Signal Level (dBm) ≥ -89,45 94,4 204,4764
Best Signal Level (dBm) ≥ -110 100 216,5188
New Sites Proposal
New Sites Proposal% Focus Zone Surface (km²)
100 216,5188
Best Signal Level (dBm) ≥ -67,56 32,6 70,6008
Best Signal Level (dBm) ≥ -74,45 63,6 137,8568
Best Signal Level (dBm) ≥ -81,45 85,7 185,6224
Best Signal Level (dBm) ≥ -89,45 97,6 211,4736
Best Signal Level (dBm) ≥ -110 100 216,5188
Motivation
Objectives
3G RNP
OptimizationProcess
Conclusions

17
Instituto Superior Técnico
o PS128 Pilot Quality Prediction
New Sites Proposal
Tilt Optimization
Tilt Optimization% Focus Zone Surface (km²)
98,8 214,1232
Ec/I0 (dB) ≥ -8 30 64,984
Ec/I0 (dB) ≥ -9 46,5 100,7204
Ec/I0 (dB) ≥ -10 60,6 131,234
Ec/I0 (dB) ≥ -11 74,5 161,4596
Ec/I0 (dB) ≥ -12 85,3 184,6708
Ec/I0 (dB) ≥ -13 92,7 200,7492
Ec/I0 (dB) ≥ -14 96,9 209,9544
Ec/I0 (dB) ≥ -15 98,8 214,1232
New Sites Proposal% Focus Zone Surface (km²)
99 214,4516
Ec/I0 (dB) ≥ -8 30,1 65,2312
Ec/I0 (dB) ≥ -9 48 103,9096
Ec/I0 (dB) ≥ -10 61,9 134,0752
Ec/I0 (dB) ≥ -11 76 164,5296
Ec/I0 (dB) ≥ -12 86,7 187,7072
Ec/I0 (dB) ≥ -13 93,7 203,0356
Ec/I0 (dB) ≥ -14 97,3 210,7644
Ec/I0 (dB) ≥ -15 99 214,4516
New Sites ProposalMotivation
Objectives
3G RNP
OptimizationProcess
Conclusions
18
Instituto Superior Técnico
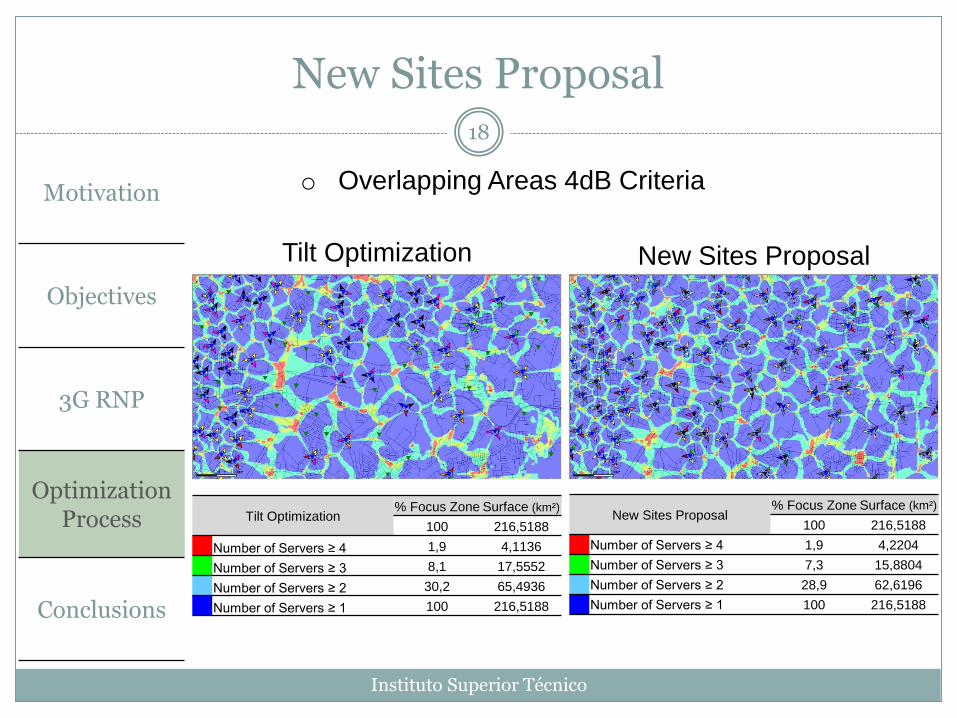
o Overlapping Areas 4dB Criteria
New Sites Proposal
Tilt Optimization
Tilt Optimization% Focus Zone Surface (km²)
100 216,5188
Number of Servers ≥ 4 1,9 4,1136
Number of Servers ≥ 3 8,1 17,5552
Number of Servers ≥ 2 30,2 65,4936
Number of Servers ≥ 1 100 216,5188
New Sites Proposal
New Sites Proposal% Focus Zone Surface (km²)
100 216,5188
Number of Servers ≥ 4 1,9 4,2204
Number of Servers ≥ 3 7,3 15,8804
Number of Servers ≥ 2 28,9 62,6196
Number of Servers ≥ 1 100 216,5188
Motivation
Objectives
3G RNP
OptimizationProcess
Conclusions
19
Instituto Superior Técnico
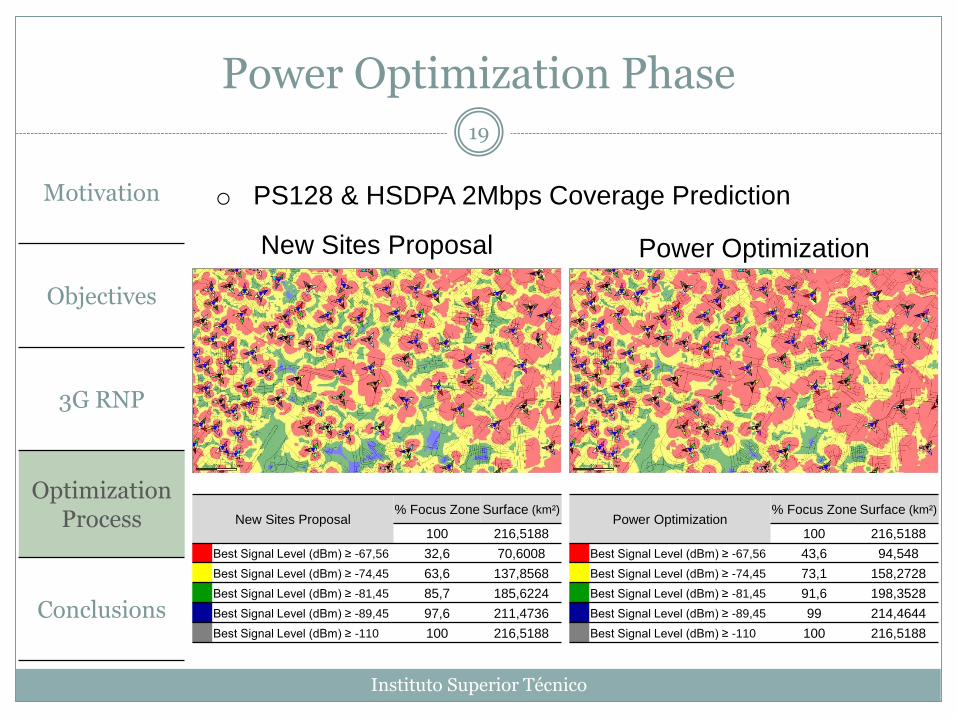
o PS128 & HSDPA 2Mbps Coverage Prediction
Power Optimization Phase
New Sites Proposal
New Sites Proposal% Focus Zone Surface (km²)
100 216,5188
Best Signal Level (dBm) ≥ -67,56 32,6 70,6008
Best Signal Level (dBm) ≥ -74,45 63,6 137,8568
Best Signal Level (dBm) ≥ -81,45 85,7 185,6224
Best Signal Level (dBm) ≥ -89,45 97,6 211,4736
Best Signal Level (dBm) ≥ -110 100 216,5188
Power Optimization
Power Optimization% Focus Zone Surface (km²)
100 216,5188
Best Signal Level (dBm) ≥ -67,56 43,6 94,548
Best Signal Level (dBm) ≥ -74,45 73,1 158,2728
Best Signal Level (dBm) ≥ -81,45 91,6 198,3528
Best Signal Level (dBm) ≥ -89,45 99 214,4644
Best Signal Level (dBm) ≥ -110 100 216,5188
Motivation
Objectives
3G RNP
OptimizationProcess
Conclusions

20
Instituto Superior Técnico
o PS128 Pilot Quality Prediction
Power Optimization Phase
New Sites Proposal% Focus Zone Surface (km²)
99 214,4516
Ec/I0 (dB) ≥ -8 30,1 65,2312
Ec/I0 (dB) ≥ -9 48 103,9096
Ec/I0 (dB) ≥ -10 61,9 134,0752
Ec/I0 (dB) ≥ -11 76 164,5296
Ec/I0 (dB) ≥ -12 86,7 187,7072
Ec/I0 (dB) ≥ -13 93,7 203,0356
Ec/I0 (dB) ≥ -14 97,3 210,7644
Ec/I0 (dB) ≥ -15 99 214,4516
New Sites Proposal Power Optimization
Power Optimization% Focus Zone Surface (km²)
99 214,4984
Ec/I0 (dB) ≥ -8 30,4 65,8376
Ec/I0 (dB) ≥ -9 48,3 104,5928
Ec/I0 (dB) ≥ -10 62,2 134,7284
Ec/I0 (dB) ≥ -11 76,2 165,0032
Ec/I0 (dB) ≥ -12 86,9 188,1468
Ec/I0 (dB) ≥ -13 93,8 203,1872
Ec/I0 (dB) ≥ -14 97,3 210,7956
Ec/I0 (dB) ≥ -15 99 214,4984
Motivation
Objectives
3G RNP
OptimizationProcess
Conclusions

21
Instituto Superior Técnico
o Overlapping Areas 4dB Criteria
Power Optimization Phase
New Sites Proposal
New Sites Proposal% Focus Zone Surface (km²)
100 216,5188
Number of Servers ≥ 4 1,9 4,2204
Number of Servers ≥ 3 7,3 15,8804
Number of Servers ≥ 2 28,9 62,6196
Number of Servers ≥ 1 100 216,5188
Power Optimization
Power Optimization% Focus Zone Surface (km²)
100 216,5188
Number of Servers ≥ 4 2 4,2608
Number of Servers ≥ 3 7,4 16,0068
Number of Servers ≥ 2 28,9 62,5896
Number of Servers ≥ 1 100 216,5188
Motivation
Objectives
3G RNP
OptimizationProcess
Conclusions

22
Instituto Superior Técnico
Conclusions
Motivation
Objectives
3G RNP
OptimizationProcess
Conclusions
o Both customer and Alcatel-Lucent project
requirements were fulfilled, regarding coverage, quality
and interference
o The work was done for the entire country with a total
of 533 sites and 1301 sectors optimized
o At the end of the project was developed a document
with the lessons learned with the RNP project
o Deployment of the network is scheduled for the end
of 2014/beginning of 2015, the future work is to perform
a QoS follow-up to address network issues

Instituto Superior Técnico
23

24
Instituto Superior Técnico
Backup
o Link Budget calculations per service
Link Budget - 2100 MHz
RNP Design Level Speech PS128 PS128 & HSDPA PS128 & HSDPA 2Mbps PS128 & HSDPA 1Mbps
Dense Urban
(Deep Indoor)-82,5 dBm -78,7 dBm -81,2 dBm -67,56 dBm -70,9 dBm
Urban
(Daylight Indoor)-85,4 dBm -81,7 dBm -84,1 dBm -74,45 dBm -77,8 dBm
Incar -94,4 dBm -90,7 dBm -93,1 dBm -81,45 dBm -84,8 dBm
Outdoor -102,4 dBm -98,7 dBm -101,1 dBm -89,45 dBm -92,8 dBm
Rest -110 dBm -110 dBm -110 dBm -110 dBm -110 dBm
25
Instituto Superior Técnico
Backup
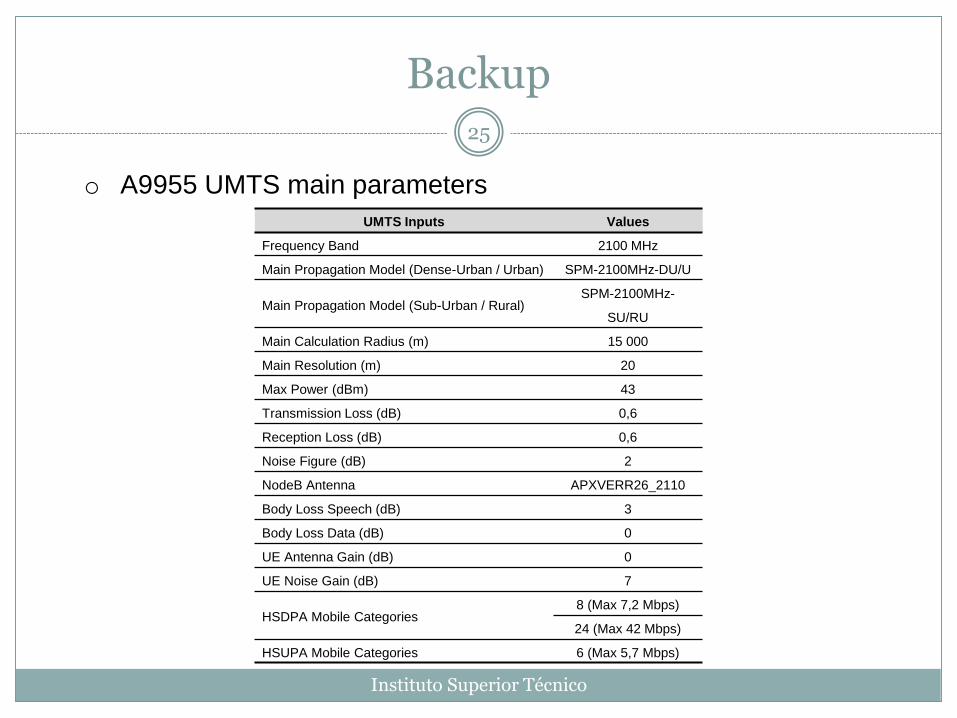
o A9955 UMTS main parameters
UMTS Inputs Values
Frequency Band 2100 MHz
Main Propagation Model (Dense-Urban / Urban) SPM-2100MHz-DU/U
Main Propagation Model (Sub-Urban / Rural)SPM-2100MHz-
SU/RU
Main Calculation Radius (m) 15 000
Main Resolution (m) 20
Max Power (dBm) 43
Transmission Loss (dB) 0,6
Reception Loss (dB) 0,6
Noise Figure (dB) 2
NodeB Antenna APXVERR26_2110
Body Loss Speech (dB) 3
Body Loss Data (dB) 0
UE Antenna Gain (dB) 0
UE Noise Gain (dB) 7
HSDPA Mobile Categories8 (Max 7,2 Mbps)
24 (Max 42 Mbps)
HSUPA Mobile Categories 6 (Max 5,7 Mbps)

26
Instituto Superior Técnico
Backup
Carrier 0 (R99 & HSDPA) Values
Total Power for Common Channels and R99 traffic Load (50%) 40 dBm
Remain power for HSDPA 39 dBm
UL Load Factor 50%
UL Load Factor due to HSUPA 25%
Max UL Load Factor 75%
Carrier 1 (Dedicated HSDPA) Values
Total Power for Common Channels Load (20%) 36 dBm
Remain power for HSDPA 41,8 dBm
UL Load Factor 0%
UL Load Factor due to HSUPA 25%
Max UL Load Factor 75%
o Carriers Parameters Definition