3d-printed lab-on-valve for fluorescent determination of
TRANSCRIPT
HAL Id: hal-01737459https://hal-amu.archives-ouvertes.fr/hal-01737459
Submitted on 18 Apr 2018
HAL is a multi-disciplinary open accessarchive for the deposit and dissemination of sci-entific research documents, whether they are pub-lished or not. The documents may come fromteaching and research institutions in France orabroad, or from public or private research centers.
L’archive ouverte pluridisciplinaire HAL, estdestinée au dépôt et à la diffusion de documentsscientifiques de niveau recherche, publiés ou non,émanant des établissements d’enseignement et derecherche français ou étrangers, des laboratoirespublics ou privés.
3D-printed lab-on-valve for fluorescent determination ofcadmium and lead in water
Elodie Mattio, Fabien Robert-Peillard, Laurent Vassalo, Catherine Branger,André Margaillan, Christophe Brach-Papa, Joel Knoery, Jean-Luc Boudenne,
Bruno Coulomb
To cite this version:Elodie Mattio, Fabien Robert-Peillard, Laurent Vassalo, Catherine Branger, André Margaillan, et al..3D-printed lab-on-valve for fluorescent determination of cadmium and lead in water. Talanta, Elsevier,2018, 183, pp.201-208. �10.1016/j.talanta.2018.02.051�. �hal-01737459�

3D-printed lab-on-valve for fluorescent determination of cadmium and lead in water 1
2
Elodie Mattio1, Fabien Robert-Peillard1, Laurent Vassalo1, Catherine Branger2, André 3
Margaillan2, Christophe Brach-Papa3, Joël Knoery3, Jean-Luc Boudenne1, Bruno Coulomb1* 4
1 Aix Marseille Univ, CNRS, LCE, Marseille, France. 5
2 University of Toulon, MAPIEM, La Garde, France. 6
3 IFREMER, LBCM, Nantes, France. 7
8
*Corresponding author: [email protected] 9
Full postal address: LCE, Case 29, 3 place Victor Hugo, 13331 Marseille cedex 3, France. 10
11
Abstract 12
In recent years, the development of 3D printing in flow analysis has allowed the creation of 13
new systems with various applications. Up to now, 3D printing was mainly used for the 14
manufacture of small units such as flow detection cells, preconcentration units or mixing 15
systems. In the present study, a new 3D printed lab-on-valve system was developed to 16
selectively quantify lead and cadmium in water. Different technologies were compared for lab-17
on-valve 3D printing. Printed test units have shown that stereolithography or digital light 18
processing are satisfactory techniques for creating complex lab-on-valve units. The lab-on-19
valve system was composed of two columns, eight peripheral ports and a central port, and a 20
coil integrating baffles to increase mixing possibilities. A selective extraction of lead was first 21
carried out by TrisKem Pb™ Resin column. Then, cadmium not retained on the first column 22
was extracted on a second column of Amberlite® IR 120 resin. In a following step, lead and 23
cadmium were eluted with ammonium oxalate and potassium iodide, respectively. Finally, the 24
two metals were sequentially detected by the same Rhod-5N™ fluorescent reagent. This 3D 25

printed lab-on-valve flow system allowed us to quantify lead and cadmium with a linear 1
response from 0.2 to 15 µg.L-1 and detection limits of 0.17 and 0.20 µg.L-1 for lead and 2
cadmium, respectively, which seems adapted for natural water analysis. 3
4
Keywords: stereolithography; digital light processing; LOV-MSFIA; natural waters 5
6
Introduction 7
Cadmium and lead are two of the most concerning metals in water in the light of their toxicities 8
and their levels in the environment. Many pollution sources can cause increased levels of Cd 9
and Pb: natural sources like volcanic activity [1] and anthropogenic sources which represent 10
the most important impact, such as metallurgy [2], mining operation [3], electronic industry [4], 11
pesticides [5], or even paints [6]. 12
These metals have several impacts on health: cadmium has a half-life in humans of 10 to 35 13
years [7] and is mainly accumulated in kidney and liver which might lead to deficiencies [8] 14
like the Itai-itai disease, but it can also be found in spleen, brain and blood, resulting in 15
increasing cancers risks. Lead intoxication can lead to many dysfunctions like cardiovascular 16
diseases [9], neurodevelopmental effects or impaired fertility [10]. In the light of these effects, 17
the World Health Organization has recommended a guideline value of 3 µg.L-1 and 10 µg.L-1 18
for cadmium and lead respectively in drinking water. 19
Accordingly, the development of simple, rapid and sensitive methods for on-line and on-site 20
Cd and Pb determination in natural waters has attracted widespread attention in modern 21
analytical chemistry. 22
Flow analysis seems to be appropriate for the development of these type of portable analytic 23
systems: this technology allows decreasing instrumentation size, and reagents and energy 24
consumption, which are significant advantages for an on-site system while simplifying the 1
manipulations required for the assays. 2
Many flow systems with minimal interferences and low detection limits have been developed 3
for the quantification of cadmium and lead in natural waters but most of these systems are 4
coupled with inductively coupled plasma spectroscopy [11] or atomic absorption spectrometry 5
[12,13], detection techniques that are not compatible with portable systems. 6
Sequential Injection-Lab-on-valve (SI-LOV) flow systems, developed by Ruzicka [14], allow 7
one to integrate the various steps of an analytical method in a miniaturized part placed on the 8
head of a selection valve. The lab-on-valve improves repeatability, reliability and robustness of 9
flow systems while being more compact thus facilitating on-site measurements. Some SI-LOV 10
systems have been developed for solid phase extraction and solid phase detection of metals [15-11
17]. For lead and cadmium determination, a SI-LOV system has recently been described [18] 12
but the limits of detection (34 µg.L-1 and 56 µg.L-1 for cadmium and lead respectively) limit the 13
use of the system to a rapid screening of the two metals in contaminated waters. 14
Until now, the possibilities of LOV creation have been limited by the machining of parts by 15
drilling, embossing or molding, which does not make it possible to integrate all the analysis 16
steps in the LOV. This problem henceforth can be solved by using 3D printing. 17
3D printing enables one to create three-dimensional object from computer-aided design model 18
by using different printing technologies, and is increasingly used in flow analysis to create 19
tailor-made units: an experimental comparison of three 3D printing technologies used in flow 20
analysis has been carried out to evaluate best performances [19], and many reviews resume 21
emerging applications of 3D printing in microfluidic systems [20-22]. A MSFIA system has 22
recently been developed for the iron speciation with a 3D printed device integrating analyte 23
oxidation, disk-based SPE and analyte complexation [23]. 24
Fused Deposition Modeling (FDM) and photo-polymerization processes such as 1
Stereolithography (SLA), Digital Light Processing (DLP) and Polyjet® are the main 3D 2
printing technologies used in flow systems. In SLA and DLP technologies, a unit is created 3
layer by layer from a photopolymer resin, cured by a UV-laser (SLA) or a conventional light 4
source (DLP). SLA and DLP enable formation of units directly in the liquid photopolymer resin 5
tank on a platform that goes up as the layers are printed. In Polyjet® technology, the liquid 6
material is deposited on a build platform and is cured, by the passage of an UV lamp layer after 7
layer. This technology requires the use of a water-soluble support material to fill the voids 8
(tubing, cells, and columns) of the part during printing. This water-soluble support material is 9
then cleaned during post-processing of the printed part. 10
In this paper, a new 3D printed lab-on-valve is presented and integrated in a MSFIA system for 11
the determination of low levels of Cd and Pb in natural waters. The 3D-printed LOV is 12
constituted of 8 peripheral ports and a central port connected to the 3-way valve of a syringe 13
and contains two columns used for solid phase extraction and preconcentration of lead and 14
cadmium, a mixing coil with baffles to break flow and increase turbulences in order to increase 15
mixing capabilities, and a fluorescence detection cell. The analytical procedure developed is 16
first based on the selective extraction of lead by the TrisKem Pb resin® (this resin has been 17
already studied and included in a 3D-printed flow system for determination of lead in natural 18
waters in a previous study [24]). In a second step, cadmium is extracted on Amberlite® IR 120 19
exchange resin and selectively eluted with potassium iodide. The quantification of the two 20
metals is based on the use of the Rhod-5N™ fluorescent reagent. The MSFIA-LOV developed 21
system has been validated on real river water samples. 22
23
2. Materials and methods 24
2.1. Reagents 25

All chemicals used were of analytical grade and used without further purification. Solutions 1
were prepared with ultra-pure water (Millipore, resistivity > 18 MΩ cm) and stocked in high 2
density polyethylene or Teflon flasks. Cadmium and lead standard solutions were prepared by 3
dilution of commercial 1 g.L-1 AAS stock solutions (Fisher Chemical, USA) and stabilized with 4
1% v/v nitric acid trace metal grade (Fisher Chemical, USA). Calcium solution was prepared 5
by dissolving anhydrous calcium chloride (Alfa Aesar, Germany) in ultra-pure water. A multi-6
metal solution (10 µmol.L-1 for each metal) was prepared by diluting and mixing eleven 7
commercial AAS stock solutions of aluminium, cadmium, calcium, cobalt, chromium, copper, 8
iron, lead, magnesium, nickel and zinc, at 1 g.L-1 (Fisher Chemical, USA) in ultra-pure water. 9
Cadmium and lead extraction were respectively carried out with the Amberlite® IR 120 10
Hydrogen Form resin (Prolabo, France) and the TrisKem Pb Resin (PB-B25-S, 50-100µm, 11
TrisKem, France). Eluents were prepared from potassium iodide (Sigma-Aldrich, USA) for 12
cadmium and from ammonium oxalate (Prolabo, France) for lead. Other eluents tested were 13
prepared from trace metal grade nitric acid (Fisher Chemical, USA) and ammonium nitrate 14
(Prolabo, France). 15
For detection, a 0.2 µmol.L-1 solution of Rhod-5N tripotassium salt (Fisher Chemical, USA) 16
was prepared in a 10 mmol.L-1 3-(N-morpholino)propanesulfonic acid (MOPS) buffer solution 17
at pH = 7 (Sigma-Aldrich, USA). To take into account the interferences related to the presence 18
of calcium in the samples, a two-step analytical procedure was developed and required the 19
addition of a 3 µmol.L-1 masking agent solution of N,N,N′,N′-tetrakis-(2-20
pyridylmethyl)ethylenediamine (TPEN) (Sigma-Aldrich, USA) to the Rhod-5N reagent. 21
22
2.2. Apparatus 23
2.2.1. Metal analysis 24

The extraction and elution steps of cadmium, lead and interfering metals on TrisKem Pb resin 1
and Amberlite® IR 120 resin were studied by inductively coupled plasma–atomic emission 2
spectrometry (ICP–AES) with a Jobin YVON JY2000 Ultratrace spectrometer, equipped with 3
a CMA spray chamber and a Meinhard R50-C1 glass nebuliser. Determinations were performed 4
with the following settings: power 1000W, pump speed 20 mL.min-1, plasma flow rate 12 5
L.min-1, coating gas flow rate 0.15 L.min−1, nebuliser flow rate 1.08 L.min−1 and nebuliser 6
pressure 2.6 bar. 7
Graphite furnace atomic absorption spectrometry (GF-AAS) was used to quantify lead in real 8
samples. The measurements were carried out on a Thermo Scientific ICE3500 (USA) atomic 9
absorption spectrometer equipped with a lead hollow-cathode lamp operated at 10 mA 10
(wavelength of 217 nm). Argon flow was 0.2 L.min-1 except during atomisation step (no flow). 11
The furnace settings were as follow: drying at 110 °C, ramp for 9 s, hold for 35 s; cracking at 12
800 °C, ramp for 5 s, hold for 20 s; atomising at 1200 °C, ramp for 1 s and 3 s hold; cleaning at 13
2500 °C, no ramp and 3 s hold. 14
15
2.2.2. Flow system 16
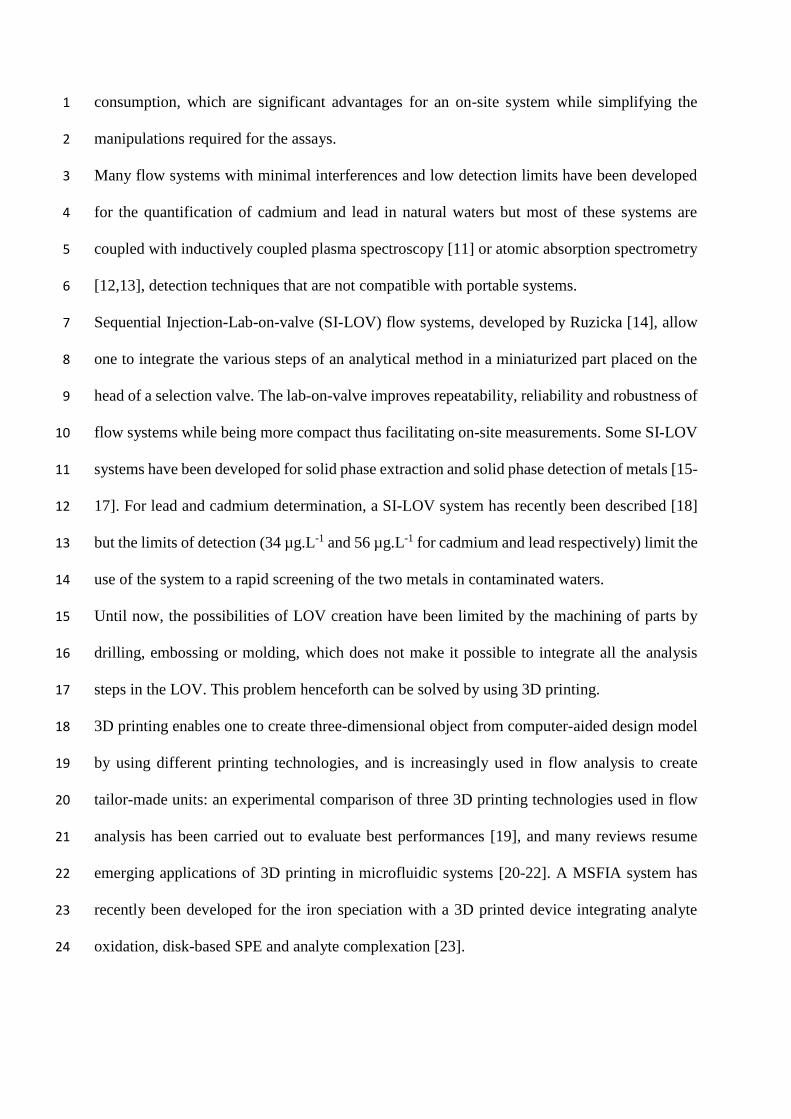
The MSFIA-LOV system used in this study is shown in Fig. 1. Different LOV units were 17
designed with Rhinoceros® 5.0 3D software (Robert McNeel & Associates Europe, Spain). 18
Various 3D printers were tested to fabricate units: the Form1+ printer (Formlabs, USA), the 19
Object500 Connex 3 printer (Stratasys, USA) and the Miicraft 100 printer (Miicraft, Rays 20
Optics Inc., Taiwan). The three printers were used with acrylic transparent resins that had 21
chemical resistance properties closed to those of poly(methyl methacrylate) (PMMA) with good 22
resistance to common diluted acids. The 3D printed LOV part was fixed on an 8-ports 23
multiposition selection valve module (Sciware Systems SL, Spain) and coupled with a 24
multisyringe burette module with programmable speed (Multiburette 4S, Crison Instruments, 25
Spain) equipped with three 5 mL glass syringes (Hamilton, Switzerland). Each syringe was 1
connected to a 3-way solenoid valve (S1, S2, S3) for multicommutation steps. A continuous 2
renewal of sample was done by a solenoid micro-pump (Bio-ChemValve Inc., USA) that had a 3
stroke volume of 20 µL and a high frequency of 250 cycles.min-1. 4
For the detection, a Kontron Instruments SFM25 fluorometer (Kontron, Germany) was used 5
with a Hellma™ quartz UV flow cell. It should be noted that the spectrofluorimeter used in this 6
study can be easily replaced by a more compact detection system based on the use of a laser 7
diode for excitation and a photodiode for detection. 8
The whole system, except the fluorometer, was controlled by AutoAnalysis 5.0 software 9
(Sciware Systems SL, Spain). 10
11
2.3. Lab-on-valve unit 12
The LOV had the following dimensions: height 66 x width 100 x depth 17 mm. It was composed 13
by eight peripheral ports and a central port connected to S1 via a holding coil (Figure 1). 14
Channel inner diameters were 1.2 mm, except for mixing coil which was 0.8 mm i.d. at the 15
narrowest point. Two ports (1 and 2) were externally linked on the top of columns (C1 and C2) 16
by a 0.8 mm i.d. PTFE tubing to introduce sample and reagents. Both columns were 3D printed 17
and were independent of the LOV system so that they could be easily changed (the two columns 18
were simply screwed to two LOV inputs). C1 and C2 were respectively filled with 50 mg of 19
TrisKem Pb resin for lead extraction and 50 mg of Amberlite® IR 120 for cadmium 20
preconcentration. These columns were linked to a 184 mm long mixing coil (connected to the 21
detector via port 8). This mixing coil was designed with 2 mm wide baffles in order to break 22
flow and increase turbulences, therefore increasing mixing capabilities of the coil. A two-way 23
microconduit allowed the introduction of detection reagents. 24
Ports 3 and 7 were employed for sample introduction and waste, respectively. The remaining 1
peripheral ports (port 4, 5 and 6) were used for the introduction of the eluents: nitric acid (4), 2
ammonium oxalate (5) and potassium iodide (6). 3
4
2.4. Analytical procedure 5
The complete analytical sequence for cadmium and lead preconcentration and detection is listed 6
in Table 1 and can be summarized as follows: 7
1. Conditioning of TrisKem Pb resin with HNO3 0.05 mol.L-1: the central port (CC) of the 8
LOV is connected to the peripheral port 4 to aspirate 4 mL of nitric acid in holding coil 9
(HC) which are propelled towards C1 via port 1. 10
2. Sample introduction: the sample is loaded in HC (port 3) and then dispensed towards 11
C1 (port 1) at a flow rate of 4 mL.min-1. Once the lead retained onto TrisKem Pb resin 12
(C1), this lead-extracted sample is reaspirated via port 8 in the HC and dispensed 13
through C2 (port 2) for cadmium extraction on the Amberlite® IR 120. 14
3. Elution and detection of cadmium: potassium iodide (0.15 mol.L-1) and Rhod-5N (0.2 15
µmol.L-1) are simultaneously dispensed respectively through C2 (port 2) to eluate 16
extracted cadmium and at the inlet of the mixing coil (S2). Measurement is based on the 17
peak height with ex = 550 nm and em = 575 nm. 18
4. Second introduction of sample: steps 3 to 6 are repeated. A total volume of 10 mL is 19
thus dispensed through the TrisKem Pb resin (C1). The aim of this second sample 20
introduction is to quantify interference of calcium for cadmium determination. During 21
the detection step, potassium iodide (port 6) solution and Rhod-5N+TPEN reagent (S3) 22
are simultaneous dispensed. TPEN is added to Rhod-5N reagent to complex cadmium 23
and detect calcium specifically. The interference generated by calcium can thus be 24
determined. 25
5. Elution and detection of lead: the TrisKem Pb resin (C1) is washed with nitric acid 1
solution (0.05 mol.L-1) to eliminate potential interfering species extracted by the resin. 2
Ammonium oxalate solution (0.025 mol.L-1) and Rhod-5N are simultaneously 3
dispensed to eluate and detect lead. 4
5
3. Results and discussion 6
3.1. 3D printing of the LOV unit 7
The first step to print a lab-on-valve, after its conception on a 3D software, was to select a 8
suitable technology. The printing of LOV units requires a good resolution on the 3 axes XYZ 9
and a high precision. Several printers have thus been tested to find the most suitable for the 10
manufacture of LOV units. 11
Fused Deposition Modeling (FDM), the most used technology in 3D printing, is not suitable 12
for creating fluidic systems, in the light of difficulties to form small tubings and smooth surface 13
without post-treatment. The same statement could be done with Selective Laser Sintering 14
(SLS), in which the grain size of powdered materials limits the resolution and gives a porous 15
unit. 16
Photopolymerisation technologies are therefore recommended for LOV printing: 17
stereolithography (SLA), digital light processing (DLP) and Polyjet® technology provide 18
sufficient performance to print complex flow units. These three technologies were therefore 19
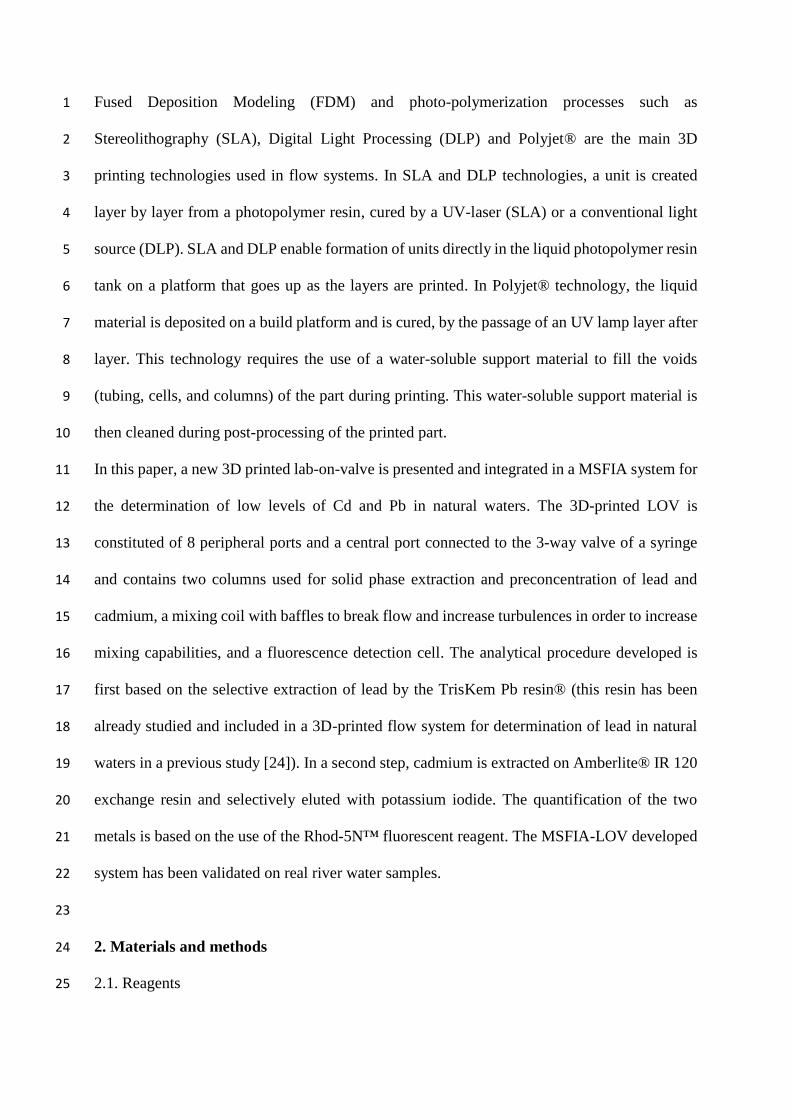
studied to print the LOV unit used in this study. Figure 2 shows photos of the printed LOV 20
units. 21
22
3.1.1. Polyjet® technology 23
Several LOV units have been printed with Polyjet® technology using an Object500 Connex 3 24
printer, a Veroclear® transparent acrylic/epoxy resin and a SUP706 soluble support material 25
(Stratasys, USA). Considering the high cost of the printer (more than 200 k€), the fabrication 1
of the piece was subcontracted to a specialized company (Maquette74, France). In this 2
technique, photopolymer drops are deposited and cured by an UV lamp and the printing of 3
micro conduits of LOV unit requires a water-soluble support material. Three 3D-printed LOV 4
units have been compared: one without mixing coil, one with classical coil, and another with a 5
mixing coil containing baffles, to increase turbulences and mixing capacities. 6
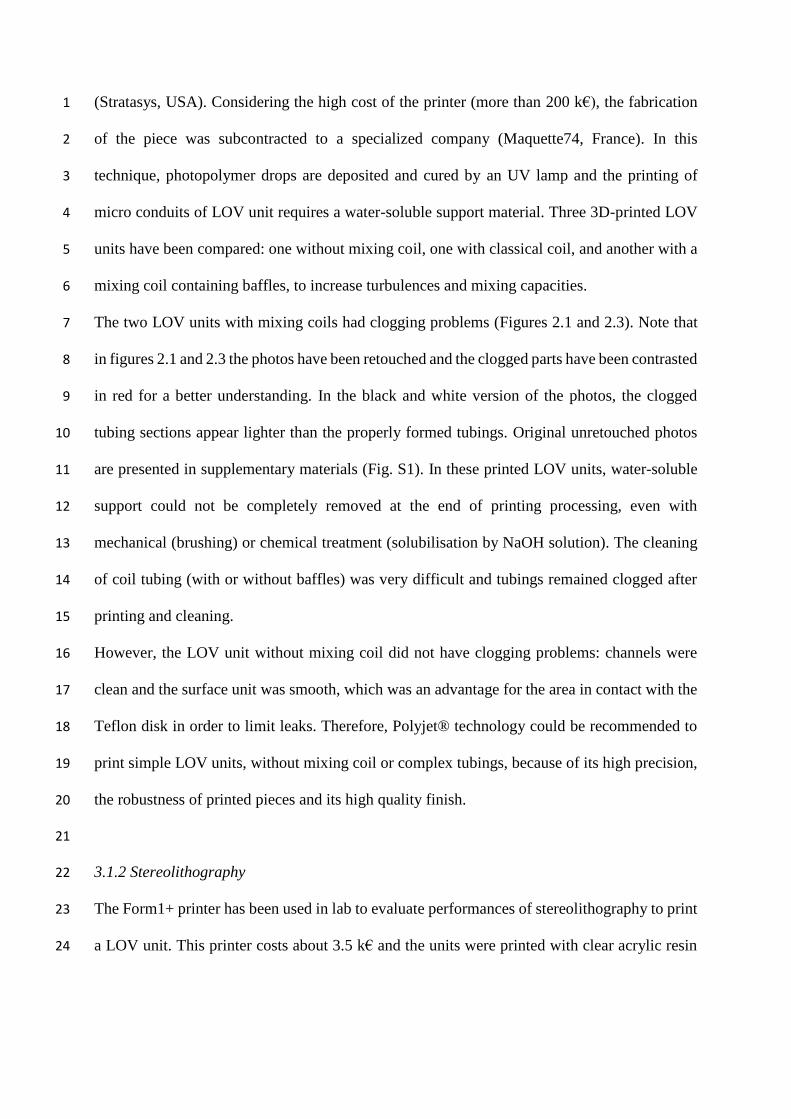
The two LOV units with mixing coils had clogging problems (Figures 2.1 and 2.3). Note that 7
in figures 2.1 and 2.3 the photos have been retouched and the clogged parts have been contrasted 8
in red for a better understanding. In the black and white version of the photos, the clogged 9
tubing sections appear lighter than the properly formed tubings. Original unretouched photos 10
are presented in supplementary materials (Fig. S1). In these printed LOV units, water-soluble 11
support could not be completely removed at the end of printing processing, even with 12
mechanical (brushing) or chemical treatment (solubilisation by NaOH solution). The cleaning 13
of coil tubing (with or without baffles) was very difficult and tubings remained clogged after 14
printing and cleaning. 15
However, the LOV unit without mixing coil did not have clogging problems: channels were 16
clean and the surface unit was smooth, which was an advantage for the area in contact with the 17
Teflon disk in order to limit leaks. Therefore, Polyjet® technology could be recommended to 18
print simple LOV units, without mixing coil or complex tubings, because of its high precision, 19
the robustness of printed pieces and its high quality finish. 20
21
3.1.2 Stereolithography 22
The Form1+ printer has been used in lab to evaluate performances of stereolithography to print 23
a LOV unit. This printer costs about 3.5 k€ and the units were printed with clear acrylic resin 24
FLGPCL02. In this technology, the unit is formed directly in the tank of the liquid 1
photopolymer and water-soluble support is thus not required to form tubing. 2
The same three LOV units were 3D printed by stereolithography (resolution of 100 µm, printing 3
time 6 hours) using the same .stl files previously used with Polyjet® technology printing. The 4
results did not show any clogging problem (Figure 2.2). The eight positions of the LOV were 5
correctly formed, however the surface was uneven and many defects were observed at several 6
layers of the units resulting in microcracks in the printed part. 7
Furthermore, deformations of printed units were observed: this problem is frequently 8
encountered in SLA due to resin shrinkage, which causes leaks between the positions of the 9
LOV, and furthermore, optical pathlengths may exhibit significant deformation preventing 10
optimal detection. Some printer software can take this issue into account by proposing X and 11
Y axis compensation, but this parameter was not found in the Preform software used to control 12
the Form1+. A smaller resolution was able to improve the precision of LOV positions (25 or 13
50 µm), but the printing time was longer (20 and 10 hours respectively) which could increase 14
the risk of printing problems like unit’s fall in resin tank or incomplete formation. Unsuccessful 15
printing tests with 25 and 50 μm resolution led us to limit the resolution to 100 μm for lab-on-16
valve fabrication. Besides, a post-treatment was necessary to obtain a real smooth area in 17
contact with the Teflon disk of the selection valve. 18
19
3.1.3. Digital light processing (DLP) 20
The disadvantages of previous technologies to print the designed LOV unit led us to study 21
digital light processing. For this technology, the unit formation is the same as in 22
stereolithography, however the resin is not progressively photo-polymerized by a laser like in 23
stereolithography but a projector displays directly an UV image of each layer to photo-24
polymerize resin on the platform. 25

Different units were printed in lab with the Miicraft 100 printer (printer price is about 10k euros) 1
and the BV-007 transparent acrylic resin: the printed parts showed a smoother surface with 2
faster printing (with a resolution of 20 μm, printing time 5 hours) than in stereolithography 3
(Figure 2.4). Moreover, tubings formation were more accurate and it has been possible to 4
decrease the inner diameter to 0.8 mm vs 1.2 mm in stereolithography. The area in contact with 5
the Teflon disk of the selection valve was perfectly formed and no leak has been observed. 6
In conclusion of this part, Figure 2 summarized the observations made for each technology: the 7
Polyjet technology® did not allow the printing of a mixing coil without clogging problem 8
(picture 1 and 3). At the opposite, the stereolithography could print an unclogged LOV unit but 9
with an uneven and harsh surface (picture 2), resulting in a bad positioning of the LOV part on 10
the valve rotor and causing leakage of the reagents used and deterioration of the Teflon disk of 11
the valve. The digital light processing gathered the advantages of the two previous technologies: 12
the printed surface was smooth and tubing were well-formed (picture 4). In these conditions, 13
DLP appeared to be the more adapted technology to print a LOV unit with mixing coil. 14
However, to work without mixing coil, the Polyjet technology® showed better performances 15
than DLP. 16
17
3.2. Lead determination 18
The procedure for lead determination in natural waters has already been described in a previous 19
study [24]. The determination was based on selective solid phase extraction of lead on a 20
commercial resin (TrisKem Pb resin) in HNO3 0.05 mol.L-1. For this study, the extraction of 21
lead has been studied at pH 7 in order to reuse the sample for cadmium determination. 22
The results showed that TrisKem Pb resin extracted lead more than 90% at pH 7, a result very 23
close to that obtained in the presence of nitric acid (Fig S2). Most of cations, including calcium 24
and magnesium, were not retained by the resin, except for iron that was partially extracted 25
(<20%). The washing step with HNO3 0.05 mol.L-1 has been previously studied [24] and 1
allowed elimination of 75% of iron extracted. Lead elution was carried out by ammonium 2
oxalate 0.025 mol.L-1 to extract more than 90% of lead. Lead was then detected by the Rhod-3
5N reagent and the remaining iron did not interfere in the measurement. 4
5
3.3. Cadmium determination 6
To measure low levels of cadmium in natural waters, a sensitive and selective reagent for 7
detection has to be used. In addition, the use of the same reagent for the detection of lead and 8
cadmium makes it possible to simplify the flow system. Several chromogenic reagents for a 9
spectrophotometric detection have been considered, like 4-(2-pyridylazo)resorcinol (PAR) or 10
dithizone, however, none of them allowed a selective detection at very low concentrations. 11
Fluorescent reagents have also been examined: 8-hydroxyquinoline-5-sulfonic acid [25] shows 12
major interferences that could disturb cadmium measurement. Rhod-5N [26] appears to meet 13
the requirements of selectivity and sensitivity and has been used in this study. Although Rhod-14
5N has some selectivity for cadmium, some other cations can be detected with this reagent. 15
Calcium, lead, copper, iron and zinc are the main interfering cations in natural waters. In this 16
study lead is extracted beforehand by TrisKem Pb resin and copper and iron do not react with 17
Rhod-5N. These cations will not interfere in the measurement of cadmium. However, it was 18
necessary to find a resin allowing the selective extraction of cadmium to avoid calcium and zinc 19
interferences. 20
21
3.3.1. Cadmium selective preconcentration 22
Several commercial cation exchange resins have been studied. Two resins have been 23
particularly tested: an iminodiacetic acid resin, the Amberlite® IRC 748, known for its high 24
selectivity for heavy metals cations [27], and an acidic resin, the Amberlite® IR 120, which 25
could be selective depending on the eluent used [28]. Extraction rates of these resins were 26

studied using a multi-metal solution at pH=7, with a concentration of 10 µmol.L-1 for each metal 1
and a flow rate of 2 mL.min-1. 2
The results obtained with the Amberlite® IRC 748 were unsatisfactory: only 48% of cadmium 3
were extracted, while for interfering cations, 33% of calcium and 80% of zinc were extracted. 4
In addition, the various eluents tested (nitric acid, potassium iodide, ammonium nitrate and 5
ammonium oxalate) did not improve the selectivity for cadmium over interfering cations. 6
For the Amberlite® IR 120, the extraction step was more efficient for cadmium with an 7
extraction of 65%, but also for calcium and zinc, with an extraction yield of 70 and 85% 8
respectively. However, the elution step was crucial for the selective preconcentration of 9
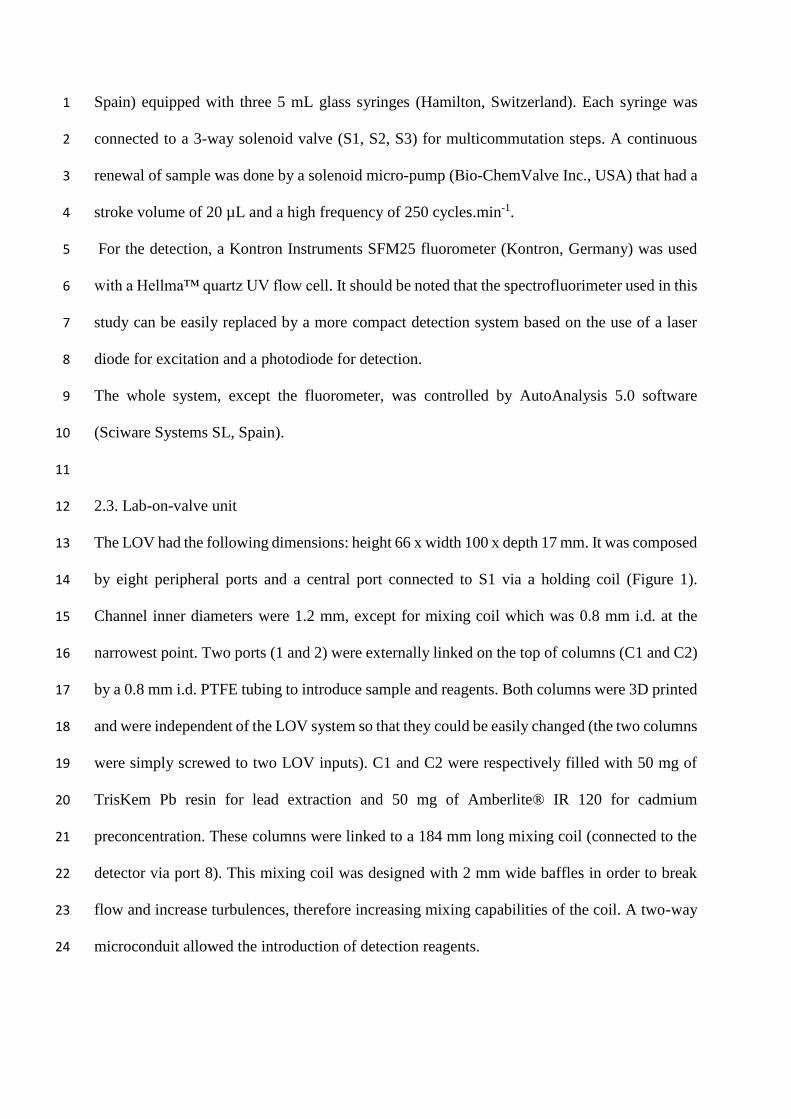
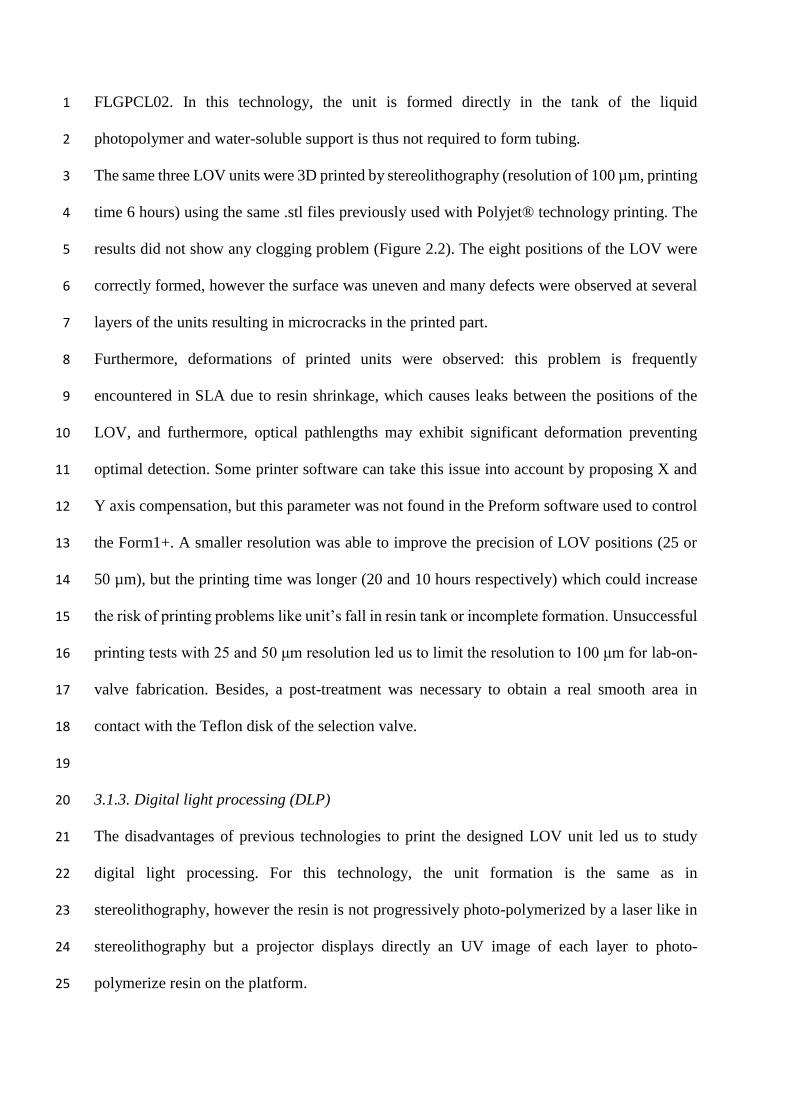
cadmium. Many eluents at different concentrations have been tested and the most significant 10
results are resumed in Figure 3. Elution with nitric acid, ammonium nitrate and ammonium 11
oxalate did not present any selectivity for cadmium. In contrast, potassium iodide (KI 0.15 12
mol.L-1) showed a significant selectivity for cadmium: 95% of cadmium was eluted, against 13
15% of calcium and 18% of zinc. Three concentrations of potassium iodide (0.05, 0.15 and 0.30 14
mol.L-1) have then been tested in order to optimize cadmium elution. Less than 10% of 15
cadmium and other metals were eluted with KI 0.05 mol.L-1. Cadmium was quantitatively 16
eluted at a rate of 95% with 0.15 and 0.30 mol.L-1 KI but with this last concentration, 30% of 17
calcium and about 40% of other metals such as Cu and Fe were also eluted. Thus, a 18
concentration of 0.15 mol.L-1 of potassium iodide was the most adequate to quantitatively elute 19
cadmium while limiting elution of interfering cations. Note that lead was previously extracted 20
by Triskem-Pb resin and therefore do not interfere in cadmium measurement. 21
Extraction and elution flow rates on Amberlite® IR 120 were tested between 1 and 6 mL.min-22
1. Results showed that the best compromise between extraction/elution rates and analysis 23
duration was obtained when flow rate was fixed at 4 mL.min-1. Flow rates above 4 mL.min-1 24
resulted in small bubbles introduction in the flow system. 25

1
3.3.2. Interfering cations during cadmium detection 2
The extraction and elution steps on Amberlite® IR 120 eliminated the majority of interfering 3
cations. Less than 15% zinc was extracted and eluted and, given zinc levels usually found in 4
natural waters and the response of zinc with Rhod-5N, this element does not interfere with the 5
measurement of cadmium. 6
With the previously described procedure, 10% of calcium was finally extracted and eluted: in 7
the light of the high calcium levels usually found in natural waters, this quantity could still 8
interfere during the cadmium detection step. In these conditions, a procedure to quantify 9
separately calcium and determinate a signal correction for cadmium determination has been 10
established. 11
After a first step of extraction and elution of the two resins, cadmium and calcium are quantified 12
by Rhod-5N reagent. The fluorescence signal obtained thus corresponds to the concentration of 13
cadmium in the sample to which is added the interference of calcium. The sample is then 14
injected into the flow system a second time for a new extraction/elution cycle on both resins. A 15
masking agent solution of N,N,N′,N′-tetrakis-(2-pyridylmethyl)ethylenediamine (TPEN) is 16
then added to Rhod-5N reagent and used to complex cadmium eluted [29]. The complex 17
cadmium-TPEN has a stability constant higher than those of cadmium-Rhod-5N [26,30] (log 18
KCd-TPEN=17; log KCd-Rhod-5N=8.85). The fluorescence signal obtained thus allow the specific 19
quantification of calcium in sample. From this value, the fluorescence signal obtained 20
previously for the sum of cadmium and calcium can be corrected, and the cadmium 21
concentration can be determined separately. This correction can be applied to correct calcium 22
interference up to 400 mg.L-1. 23
24
3.4. Analytical features 25
Main analytical features of the system developed are summarized in Table S1 (Supplementary 1
Materials). For cadmium analysis, a calibration curve has been constructed with a sample 2
volume of 5 mL. Domain range was linear between 0.2 and 15 µg.L-1, with a limit of detection 3
(LOD; 3σ; n=10) of 0.2 µg.L-1 and a coefficient of variation (CV; n=8) of 3.0%. For lead, a 4
sample volume of 10 mL has been used, and a linear domain range has been obtained between 5
0.17 and 20 µg.L-1, with a LOD of 0.17 µg.L-1 and a CV of 6.2%. The sample volume can be 6
increased to improve the detection limit and thus allow the analysis of fresh waters with very 7
low concentrations of lead and cadmium, but to avoid interferences, the calcium content should 8
not exceed 0.4 mg.mL-1 in the sample. The complete analysis time for the sequential 9
determination of cadmium and lead is 18 minutes allowing the analysis of 3 samples per hour. 10
Santos et al. [18] have recently compared sequential injection methods for the biparametric 11
determination of cadmium and lead in water samples. In this study this comparison has been 12
extended to other flow systems and updated. Main analytical features of these previously 13
reported flow systems are compared in Table 2 with analytical performances of the proposed 14
3D-printed lab-on-valve system. Some of these works required an atomic absorption 15
spectrometer as a detector (with or without preconcentration step), resulting in low limits of 16
detection [31,32,33] but these detection techniques are not compatible with compact systems. 17
On another hand, some systems based on voltammetric techniques show good limit of detection 18
with large dynamic range and use of compact detection systems [34,35] but require complex 19
protocols for the preparation of electrodes. Systems using spectrometry as a detection method 20
have high detection limits [36] and the only LOV system to our best knowledge that has been 21
developed for the biparametric detection of cadmium and lead has thus been applied to the 22
screening of these metals in contaminated waters [18]. The MSFIA-LOV with fluorimetric 23
detection proposed in this study makes it possible to find a compromise between the criteria of 24
sensitivity, simplicity and cost. The LODs obtained (0.20 and 0.17 µg.L-1 for cadmium and lead 25
respectively) are lower than the MAC-EQS (maximal allowable concentration-environmental 1
quality standards) as defined by the European regulations [37] (0.45 and 7.2 µg.L-1 in inland 2
surface waters for cadmium and lead respectively) and thus allow determinations of lead and 3
cadmium in natural waters. 4
5
3.5. Validation 6
To validate the 3D printed LOV-MSFIA system, three samples of natural waters have been 7
collected in different locations in the Marseille city area (south-east of France). The samples 8
were filtered on a 0.45 µm polyethersulfone membrane and then UV-photooxidized at 254 nm 9
during 30 minutes before analysis allowing liberation of cadmium and lead linked to natural 10
organic ligands, inorganic ligands or even to anthropogenic organic ligands. The samples were 11
analyzed in duplicate by the developed 3D printed LOV-MSFIA system and by AAS. The 12
results are summarized in Table 3. The values obtained by the two methods were consistent. 13
For lead, the mean difference between the two methods was 1.8%, (min -6.8%; max 7.3%). The 14
results obtained for lead determination by the proposed system were compared (t test) with the 15
reference method values (AAS) and no significant differences at the 95% confidence level were 16
found. For cadmium, as the levels were below the LOD, samples were spiked to 5 µg.L-1. The 17
results show an average underestimation of the cadmium content of 13%. These results can be 18
explained by the developed procedure which requires signal correction as a function of calcium 19
concentration. 20
21
Conclusion 22
A 3D printed LOV-MSFIA system has been developed to quantify lead and cadmium in natural 23
waters. Many 3D printing technologies have been tested to create the LOV unit, and digital 24
light processing seems to be the most adapted. Lead was selectively extracted on Triskem Pb 25

resin and eluted with ammonium oxalate. Cadmium was preconcentrated on Amberlite® IR 1
120 and selectively eluted with potassium iodide. These two metals were detected with Rhod-2
5N fluorescent reagent. Detection limits obtained (0.20 µg.L-1 for cadmium and 0.17 µg.L-1 for 3
lead) were compatible with analysis of lead and cadmium in fresh or brackish waters. The 4
demonstration of the use of 3D printing for the manufacture of LOV units opens new 5
perspectives for the design of more complex LOV systems. 6
7
Acknowledgment 8
This work was included in the project “Lab-on-Ship” funded by the French Research Agency 9
(ANR-14-CE04-0004). 10
11
References 12
13
[1] R. Vigneri, P. Malandrino, F. Gianì, M. Russo, P. Vigneri, Heavy metals in the volcanic 14
environment and thyroid cancer, Molecular and Cellular Endocrinology. 457 (2017) 73–15
80. doi:10.1016/j.mce.2016.10.027. 16
[2] X. Shao, H. Cheng, Q. Li, C. Lin, Anthropogenic atmospheric emissions of cadmium in 17
China, Atmospheric Environment. 79 (2013) 155–160. 18
doi:10.1016/j.atmosenv.2013.05.055. 19
[3] M.P. Taylor, S.A. Mould, L.J. Kristensen, M. Rouillon, Environmental arsenic, 20
cadmium and lead dust emissions from metal mine operations: Implications for 21
environmental management, monitoring and human health, Environ. Res. 135 (2014) 22
296–303. doi:10.1016/j.envres.2014.08.036. 23

[4] M. Pecht, Y. Fukuda, S. Rajagopal, The impact of lead-free legislation exemptions on 1
the electronics industry, IEEE Transactions on Electronics Packaging Manufacturing. 2
27 (2004) 221–232. doi:10.1109/TEPM.2004.843150. 3
[5] H. Galal‐Gorchev, Dietary intake of pesticide residues: Cadmium, mercury, and lead, 4
Food Additives and Contaminants. 8 (1991) 793–806. 5
doi:10.1080/02652039109374038. 6
[6] P. Mushak, Chapter 26 - Lead Regulation and Regulatory Policies: Lead in Paint, in: 7
Trace Metals and Other Contaminants in the Environment, Elsevier, 2011: pp. 841–873. 8
doi:10.1016/B978-0-444-51554-4.00026-2. 9
[7] WHO, Cadmium, WHO. (n.d.). 10
http://www.who.int/ipcs/assessment/public_health/cadmium/en/ (accessed December 11
8, 2017). 12
[8] A. Wilk, E. Kalisińska, D.I. Kosik-Bogacka, M. Romanowski, J. Różański, K. 13
Ciechanowski, M. Słojewski, N. Łanocha-Arendarczyk, Cadmium, lead and mercury 14
concentrations in pathologically altered human kidneys, Environmental Geochemistry 15
and Health. 39 (2017) 889–899. doi:10.1007/s10653-016-9860-y. 16
[9] S.C. Larsson, A. Wolk, Urinary cadmium and mortality from all causes, cancer and 17
cardiovascular disease in the general population: systematic review and meta-analysis 18
of cohort studies, Int J Epidemiol. 45 (2016) 782–791. doi:10.1093/ije/dyv086. 19
[10] WHO, Lead poisoning and health, WHO. (n.d.). 20
http://www.who.int/mediacentre/factsheets/fs379/en/ (accessed November 10, 2016). 21
[11] S. Cerutti, M.F. Silva, J.A. Gásquez, R.A. Olsina, L.D. Martinez, On-line 22
preconcentration/determination of cadmium in drinking water on activated carbon using 23
8-hydroxyquinoline in a flow injection system coupled to an inductively coupled plasma 24
optical emission spectrometer, Spectrochimica Acta Part B: Atomic Spectroscopy. 58 1
(2003) 43–50. doi:10.1016/S0584-8547(02)00215-X. 2
[12] L.O.B. Silva, L.A. Portugal, E. Palacio, L. Ferrer, V. Cerdà, S.L.C. Ferreira, Multi-3
commuted flow system for cadmium determination in natural water by cold vapour 4
atomic absorption spectrometry, J. Anal. At. Spectrom. 29 (2014) 2398–2404. 5
doi:10.1039/C4JA00305E. 6
[13] A.C.M. Aleluia, F.A. de Santana, G.C. Brandao, S.L.C. Ferreira, Sequential 7
determination of cadmium and lead in organic pharmaceutical formulations using high-8
resolution continuum source graphite furnace atomic absorption spectrometry, 9
Microchemical Journal. 130 (2017) 157–161. doi:10.1016/j.microc.2016.09.001. 10
[14] J. Ruzicka, Lab-on-valve: universal microflow analyzer based on sequential and bead 11
injection, The Analyst. 125 (2000) 1053–1060. doi:10.1039/b001125h. 12
[15] S.S.M.P. Vidigal, I.V. Tóth, A.O.S.S. Rangel, Sequential injection lab-on-valve 13
platform as a miniaturisation tool for solid phase extraction, Anal. Methods. 5 (2013) 14
585–597. doi:10.1039/C2AY26322J. 15
[16] I.C. Santos, R.B.R. Mesquita, A.O.S.S. Rangel, Micro solid phase spectrophotometry in 16
a sequential injection lab-on-valve platform for cadmium, zinc, and copper 17
determination in freshwaters, Analytica Chimica Acta. 891 (2015) 171–178. 18
doi:10.1016/j.aca.2015.08.021. 19
[17] A. González, R.B.R. Mesquita, J. Avivar, T. Moniz, M. Rangel, V. Cerdà, A.O.S.S. 20
Rangel, Microsequential injection lab-on-valve system for the spectrophotometric bi-21
parametric determination of iron and copper in natural waters, Talanta. (2017). 22
doi:10.1016/j.talanta.2017.02.055. 23
[18] I.C. Santos, R.B.R. Mesquita, A.O.S.S. Rangel, Screening of cadmium and lead in 1
potentially contaminated waters using a spectrophotometric sequential injection lab-on-2
valve methodology, Talanta. 143 (2015) 359–365. doi:10.1016/j.talanta.2015.05.005. 3
[19] N.P. Macdonald, J.M. Cabot, P. Smejkal, R.M. Guijt, B. Paull, M.C. Breadmore, 4
Comparing microfluidic performance of 3D printing platforms, Anal. Chem. (2017). 5
doi:10.1021/acs.analchem.7b00136. 6
[20] C. Chen, B.T. Mehl, A.S. Munshi, A.D. Townsend, D.M. Spence, R.S. Martin, 3D-7
printed microfluidic devices: fabrication, advantages and limitations—a mini review, 8
Anal. Methods. 8 (2016) 6005–6012. doi:10.1039/C6AY01671E. 9
[21] N. Bhattacharjee, A. Urrios, S. Kang, A. Folch, The upcoming 3D-printing revolution 10
in microfluidics, Lab Chip. 16 (2016) 1720–1742. doi:10.1039/C6LC00163G. 11
[22] A.A. Yazdi, A. Popma, W. Wong, T. Nguyen, Y. Pan, J. Xu, 3D printing: an emerging 12
tool for novel microfluidics and lab-on-a-chip applications, Microfluidics and 13
Nanofluidics. 20 (2016). doi:10.1007/s10404-016-1715-4. 14
[23] C. Calderilla, F. Maya, V. Cerdà, L.O. Leal, 3D printed device including disk-based 15
solid-phase extraction for the automated speciation of iron using the multisyringe flow 16
injection analysis technique, Talanta. 175 (2017) 463–469. 17
doi:10.1016/j.talanta.2017.07.028. 18
[24] E. Mattio, F. Robert-Peillard, C. Branger, K. Puzio, A. Margaillan, C. Brach-Papa, J. 19
Knoery, J.-L. Boudenne, B. Coulomb, 3D-printed flow system for determination of lead 20
in natural waters, Talanta. 168 (2017) 298–302. doi:10.1016/j.talanta.2017.03.059. 21
[25] J.F. García-Reyes, P. Ortega-Barrales, A. Molina-Díaz, Sensing of trace amounts of 22
cadmium in drinking water using a single fluorescence-based optosensor, 23
Microchemical Journal. 82 (2006) 94–99. doi:10.1016/j.microc.2005.11.001. 24
[26] M. Soibinet, V. Souchon, I. Leray, B. Valeur, Rhod-5N as a Fluorescent Molecular 1
Sensor of Cadmium(II) Ion, Journal of Fluorescence. 18 (2008) 1077–1082. 2
doi:10.1007/s10895-008-0352-z. 3
[27] A.F. Shaaban, D.A. Fadel, A.A. Mahmoud, M.A. Elkomy, S.M. Elbahy, Removal of 4
Pb(II), Cd(II), Mn(II), and Zn(II) using iminodiacetate chelating resin by batch and 5
fixed-bed column methods, Desalination and Water Treatment. 51 (2013) 5526–5536. 6
doi:10.1080/19443994.2012.758059. 7
[28] R. Přibil, V. Veselý, The extraction separation of cadmium and zinc and their 8
complexometric determination in the presence of other elements, Collect. Czech. Chem. 9
Commun., CCCC. 37 (1972) 13–21. doi:10.1135/cccc19720013. 10
[29] M. Ohkubo, A. Miyamoto, M. Shiraishi, Heavy metal chelator TPEN attenuates fura-2 11
fluorescence changes induced by cadmium, mercury and methylmercury, Journal of 12
Veterinary Medical Science. 78 (2016) 761–767. 13
[30] C.A. Blindauer, M.T. Razi, S. Parsons, P.J. Sadler, Metal complexes of N,N,N′,N′-14
tetrakis(2-pyridylmethyl)ethylenediamine (TPEN): Variable coordination numbers and 15
geometries, Polyhedron. 25 (2006) 513–520. doi:10.1016/j.poly.2005.08.019. 16
[31] A.N. Anthemidis, K.-I. G. Ioannou, Development of a sequential injection dispersive 17
liquid–liquid microextraction system for electrothermal atomic absorption spectrometry 18
by using a hydrophobic sorbent material: Determination of lead and cadmium in natural 19
waters, Analytica Chimica Acta 668 (2010) 35-40. doi:10.1016/j.aca.2009.10.063. 20
[32] Z.H. Wang, Z.P. Zhang, Z.P. Wang, L.W. Liu, X.P. Yan, Acrylic acid grafted 21
polytetrafluoroethylene fiber as new packing for flow injection on-line microcolumn 22
preconcetration coupled with falme atomic absorption spectrometry for determination 23
of lead and cadmium in environmental and biological samples, Analytica Chimie Acta 24
514 (2004) 151-157. doi:10.1016/j.aca.2004.03.049. 25

[33] A. N.Anthemidis, G.G.S. Xidia, M. Miró, On-line sorptive preconcentration platform 1
incorporating a readily exchangeable Oasis HLB extraction micro-cartridge for trace 2
cadmium and lead determination by flow injection–flame atomic absorption 3
spectrometry, Microchemical Journal 98 (2011) 66-71. 4
doi.org/10.1016/j.microc.2010.11.007. 5
[34] B. Nimwong, S. Chuanuwatanakul, O. Chailapakul, W. Dungchai, S. Motomizu, On-6
line preconcentration and determination of lead and cadmium by sequential 7
injection/anodic stripping voltammetry, Talanta 96 (2012) 75-81. 8
doi:10.1016/j.talanta.2012.03.057. 9
[35] W. Wonsawatt, S. Chuanuwatanakul, W. Dungchai, E. Punrat, S. Motomizu, O. 10
Chailapakul, Graphene-carbon paste electrode for cadmium and lead ion monitoring in 11
a flow-based system, Talanta 100 (2012) 282-289. doi:10.1016/j.talanta.2012.07.045. 12
[36] J.F.van Staden, R.E.Taljaard, Determination of Lead(II), Copper(II), Zinc(II), 13
Cobalt(II), Cadmium(II), Iron(III), Mercury(II) using sequential injection extractions, 14
Talanta64 (2004) 1203-1212. doi.org/10.1016/j.talanta.2004.06.020. 15
[37] Directive 2008/105/EC of the European parliament and of the council of 16 December 16
2008 on environmental quality standards in the field of water policy, amending and 17
subsequently repealing Council Directives 82/176/EEC, 83/513/EEC, 84/156/EEC, 18
84/491/EEC, 86/280/EEC and amending Directive 2000/60/EC of the European 19
Parliament and of the Council. http://data.europa.eu/eli/dir/2008/105/oj. 20
[38] V. Guzsványa, H. Nakajima, N. Soh, K. Nakano, T. Imato, Antimony-film electrode for 21
the determination of trace metals by sequential-injection analysis/anodic stripping 22
voltammetry, Analytica Chimica Acta 658 (2010) 12–17. 23
doi:10.1016/j.aca.2009.10.049. 24
[39] S. Suteerapataranon, J. Jakmunee, Y. Vaneesorn, K. Grudpan, Exploiting flow injection 1
and sequential injection anodic stripping voltammetric systems for simultaneous 2
determination of some metals, Talanta 58 (2002) 1235-1242. 3
[40] E.L. Silva, P. dos Santos Roldan, Simultaneous flow injection preconcentration of lead 4
and cadmium using cloud point extraction and determination by atomic absorption 5
spectrometry, Journal of Hazardous Materials 161 (2009) 142–147. 6
doi:10.1016/j.jhazmat.2008.03.100. 7
[41] T. Yamane, Y. Yamaguchi, Complex formation of 2-(5-nitro-2-pyridylazo)-5-(N-8
propyl-N-sulfo-propylamino)phenol with lead, cadmium and manganese for their 9
sensitive spectrophotometric detection in flow injection and ion chromatography 10
systems, Analytica Chimie Acta 345 (1997) 139-146. 11
[42] W. Siriangkhawut, S. Pencharee, K. Grudpan, J. Jakmunee, Sequential injection 12
monosegmented flow voltammetric determination of cadmium and lead using a bismuth 13
film working electrode, Talanta 79 (2009) 1118-1124. 14
doi:10.1016/j.talanta.2009.03.032. 15
16
17
1
2
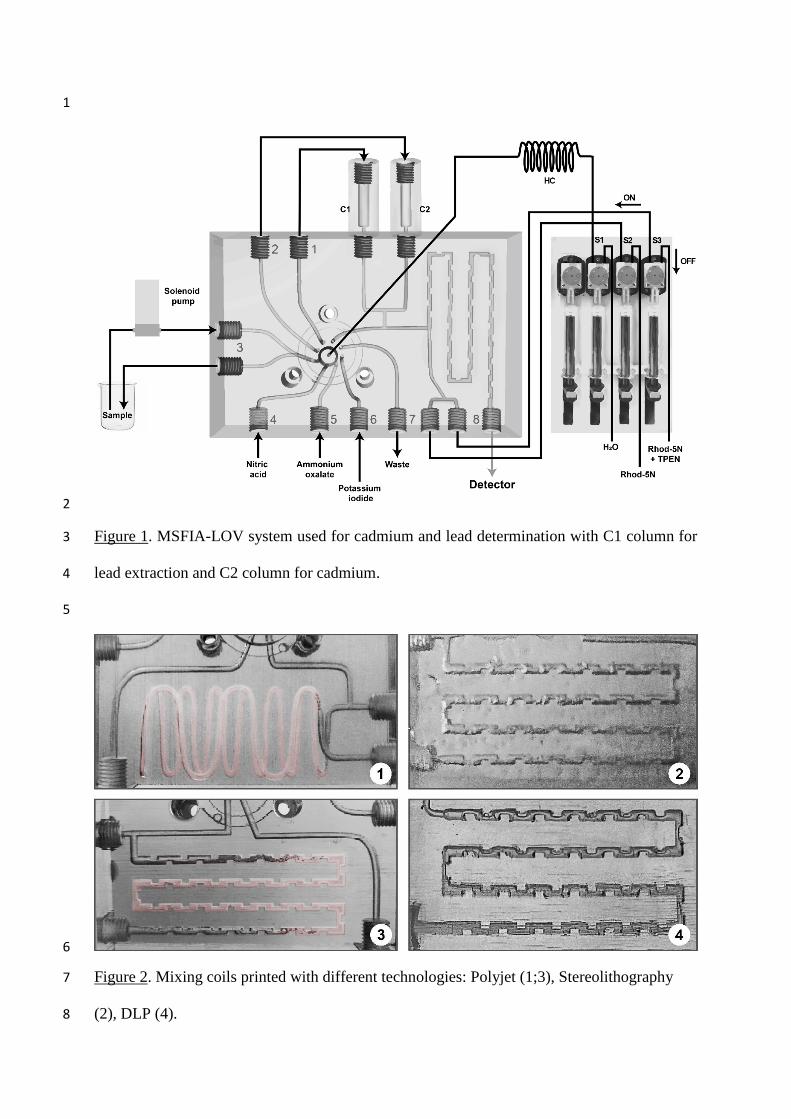
Figure 1. MSFIA-LOV system used for cadmium and lead determination with C1 column for 3
lead extraction and C2 column for cadmium. 4
5
6
Figure 2. Mixing coils printed with different technologies: Polyjet (1;3), Stereolithography 7
(2), DLP (4). 8

1
Figure 2. Elution rate of a multi-metal solution (10 µmol.L-1 for each metal) on Amberlite® IR 2
120 H with different eluents. 3
4
Table 1. Flow procedure for cadmium and lead determination. 5
Step
LOV
position
Volume
(mL)
Flow-
rate
(mL/
min)
S1 S2 S3
Conditioning TrisKem Pb resin (C1)
1 Loading HNO3 4 4 4 ON OFF OFF
2 Dispensing HNO3 towards C1 1 4 4 ON OFF OFF
Sample loading
3 Loading sample into HC 3 5 4 ON OFF OFF
4 Dispensing sample into C1 1 5 4 ON OFF OFF
5 Loading previous sample into HC 8 5 4 ON OFF OFF
6 Dispensing previous sample into C2 2 5 4 ON OFF OFF
Elution of Amberlite® IR 120 (C2) and
cadmium detection
7 Loading potassium iodide into HC 6 4 4 ON OFF OFF
8 Simultaneous dispensing of potassium iodide
into C2 and Rhod-5N into mixing coil 2 4 4 ON ON OFF
Sample loading through
9 Loading sample into HC 3 5 4 ON OFF OFF
0
10
20
30
40
50
60
70
80
90
100
Al Ca Cd Co Cr Cu Fe Mg Ni Pb Zn
Elu
tio
n r
ate
(%)
HNO3 1M KI 0,15M NH4NO3 1M
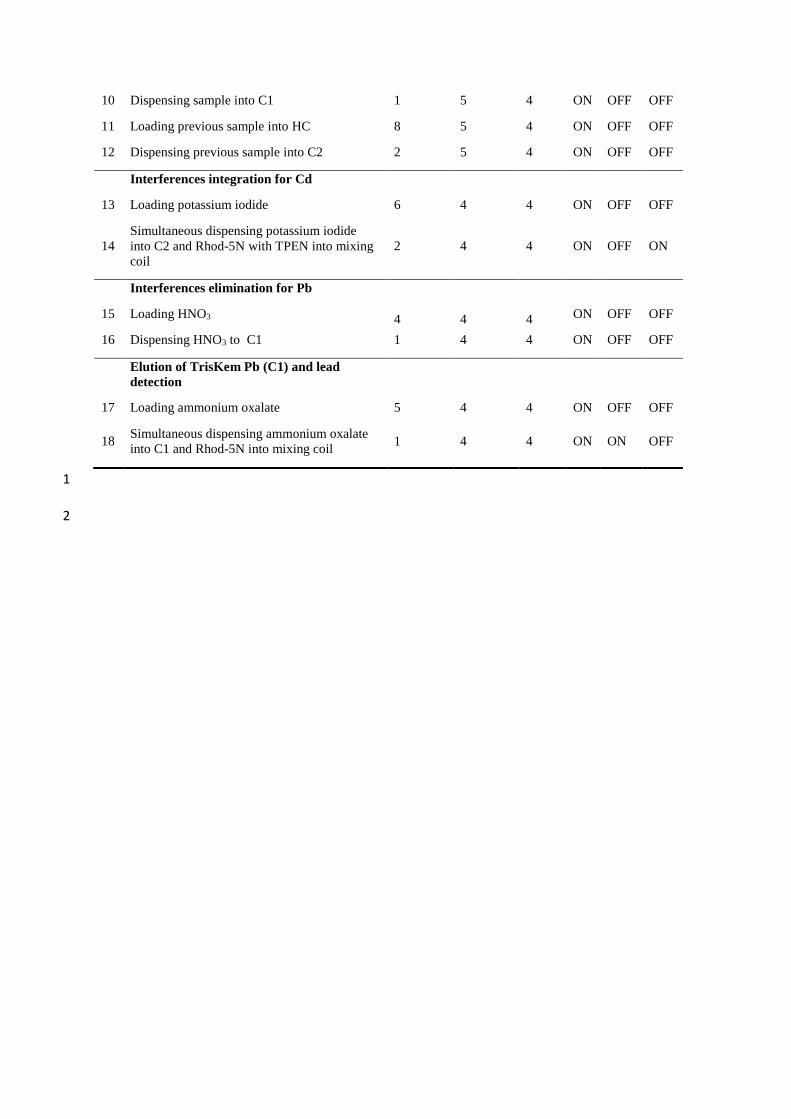
10 Dispensing sample into C1 1 5 4 ON OFF OFF
11 Loading previous sample into HC 8 5 4 ON OFF OFF
12 Dispensing previous sample into C2 2 5 4 ON OFF OFF
Interferences integration for Cd
13 Loading potassium iodide 6 4 4 ON OFF OFF
14
Simultaneous dispensing potassium iodide
into C2 and Rhod-5N with TPEN into mixing
coil
2 4 4 ON OFF ON
Interferences elimination for Pb
15 Loading HNO3 4 4 4 ON OFF OFF
16 Dispensing HNO3 to C1 1 4 4 ON OFF OFF
Elution of TrisKem Pb (C1) and lead
detection
17 Loading ammonium oxalate 5 4 4 ON OFF OFF
18 Simultaneous dispensing ammonium oxalate
into C1 and Rhod-5N into mixing coil 1 4 4 ON ON OFF
1
2

Table 2. Comparison of main analytical features of flow systems for cadmium and lead 1
determination in water samples. 2
3
Flow
system Detection
Pb
Range
(µg.L-1)
Pb
LOD
(µg.L-1)
Cd
Range
(µg.L-1)
Cd
LOD
(µg.L-1)
Matrix Ref.
SI-
DLLME ETAAS
0.04-
1.5 0.01
0.006-
0.15 0.002
Natural
waters [31]
SI ASV 0.5-15 0.01 0.5-15 0.01 Tap water [34]
SI CV or
SWASV 0.1-50 0.04 0.1-50 0.07 Tap water [35]
MSFIA-
LOV Fluorimetry 0.2-15 0.17 0.2-20 0.20
Natural
waters
This
work
FI FAAS 2.5-250 0.26 0.5-60 0.1
HNO3
extracts of
biological and
environmental
samples
[32]
FI FAAS 3.1-200 0.92 0.3-12 0.09 Water
samples [33]
SI ASV 4.7-120 1.5 5.2-110 1.7 Tap water [38]
FI ASV 10-100 2 10-30 1 Wastewater
samples [39]
FI CPE-FAAS 50-250 4.5 5-25 0.75 Water
samples [40]
FI IC-PCR-
PAD 0-300 4.8 0-150 1.9
Food samples
after
microwave
digestion
[41]
SI-MSFA ASV 10-100 6.9 10-100 1.4 Water
samples [42]
SI ASV 10-100 10 10-70 6 Wastewater
samples [39]
SI-LOV Spectrometry 500-
10000 56
500-
10000 34
Contaminated
waters [18]
SI Spectrometry 1000-
20000 -
1000-
5000 - Tap water [36]

FI, flow injection; SI, sequential injection; SI-MSFA, sequential injection-monosegmented 1
flow analysis; SI-DLLME, sequential injection-dispersive liquid-liquid microextraction; SI-2
LOV, sequential injection-lab-on-valve; MSFIA-LOV, multisyringe flow injection analysis-3
lab-on-valve; SV, anodic stripping voltammetry; CV, cyclic voltammetry; SWASV, square 4
wave anodic stripping voltammetry; FAAS, flame atomic absorption spectrometry; IC-PCR-5
PAD, ion chromatography-post column reaction-photodiode array detector, ETAAS, 6
electrothermal atomic absorption spectrometry; CPE-FAAS, cloud point extraction-flame 7
atomic absorption spectrometry. 8
9
Table 3. Lead and cadmium determination in natural waters with 3D printed LOV-MSFIA 10 system. 11
12
13
14
Samples Lead (µg/L) Cadmium (µg/L)
3D LOV-MSFIA AAS 3D LOV-MSFIA 3D LOV-MSFIA
Spiked to 5 µg/L
Spring water 11.7 ± 0.4 10.9 ± 0.5 < LOD 4.4 ± 0.6
City canal water 6.9 ± 0.5 7.4 ± 0.6 < LOD 4.1 ± 0.3
Well water 11.1 ± 0.3 11.8 ± 0.4 < LOD 4.5 ± 0.5