3.9 ghz deflecting mode cavity
DESCRIPTION
3.9 GHz Deflecting Mode Cavity. History of 3.9 GHz DMC Cell Shape Cavity Simulations The “Other Modes” concern and modeling R/Qs Wake Field Simulations Design: OM couplers Infrastructure. Timothy W. Koeth October 3 & 4, 2005. OFF. 13 CELL CAVITY. head is deflected up. B-Field. ON. - PowerPoint PPT PresentationTRANSCRIPT
3.9 GHz Deflecting Mode CavityTimothy W. Koeth
October 3 & 4, 2005
History of 3.9 GHz DMC
Cell Shape
Cavity Simulations
The “Other Modes” concern and modeling
R/Qs
Wake Field Simulations
Design: OM couplers
Infrastructure
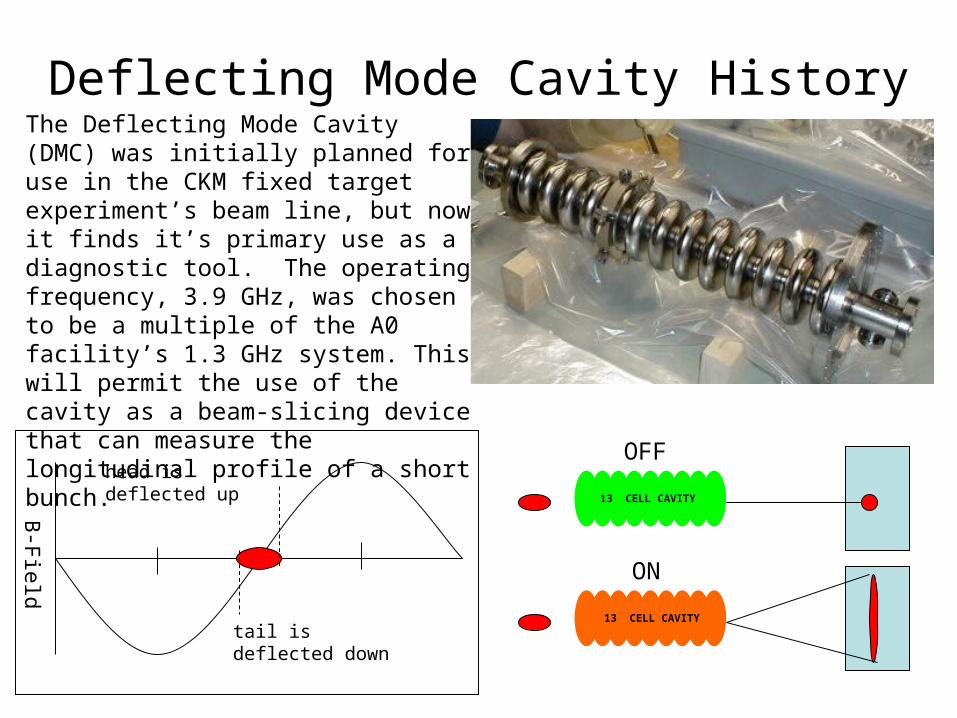
Deflecting Mode Cavity HistoryThe Deflecting Mode Cavity (DMC) was initially planned for use in the CKM fixed target experiment’s beam line, but now it finds it’s primary use as a diagnostic tool. The operating frequency, 3.9 GHz, was chosen to be a multiple of the A0 facility’s 1.3 GHz system. This will permit the use of the cavity as a beam-slicing device that can measure the longitudinal profile of a short bunch.
13 CELL CAVITY
OFF
13 CELL CAVITY
ON
B-F
ield
head is deflected up
tail is deflected down
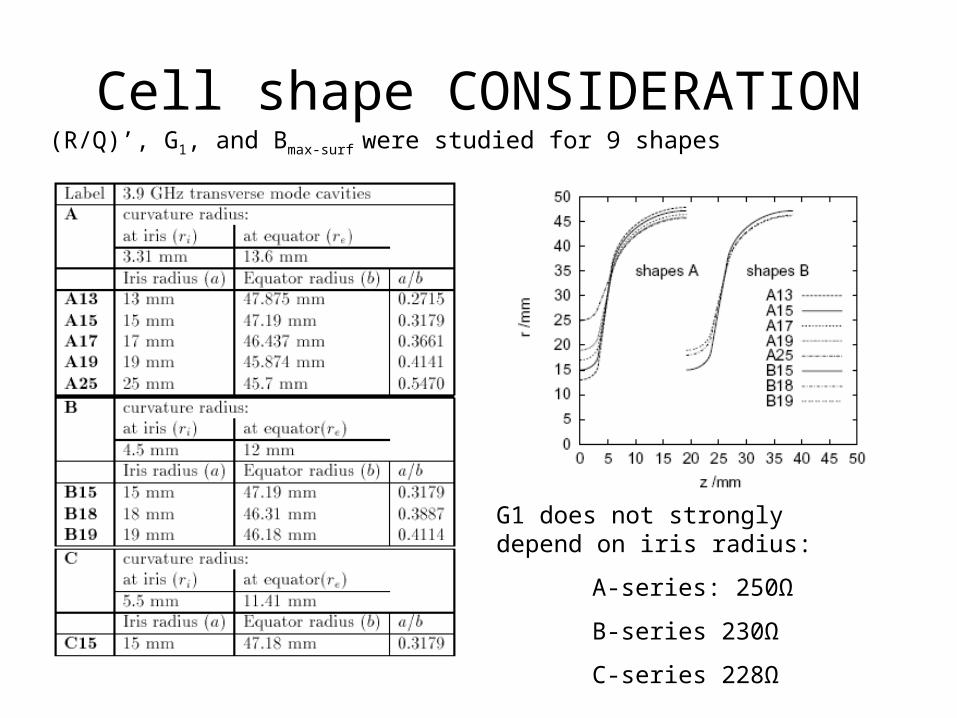
Cell shape CONSIDERATION(R/Q)’, G1, and Bmax-surf were studied for 9 shapes
G1 does not strongly depend on iris radius:
A-series: 250Ω
B-series 230Ω
C-series 228Ω
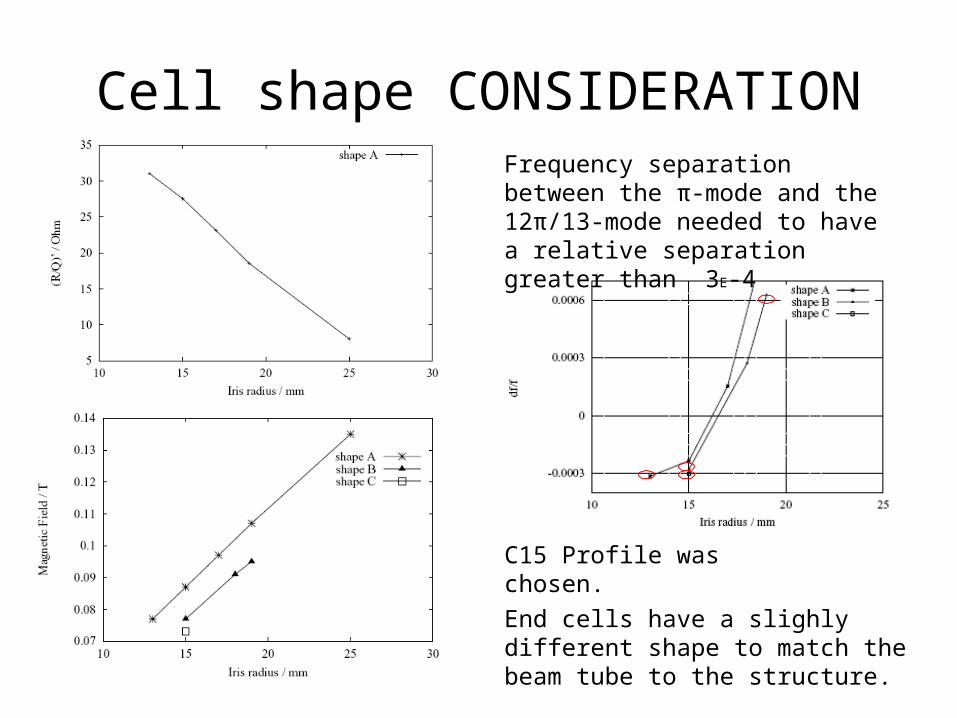
Cell shape CONSIDERATIONFrequency separation between the π-mode and the 12π/13-mode needed to have a relative separation greater than 3E-4
End cells have a slighly different shape to match the beam tube to the structure.
C15 Profile was chosen.
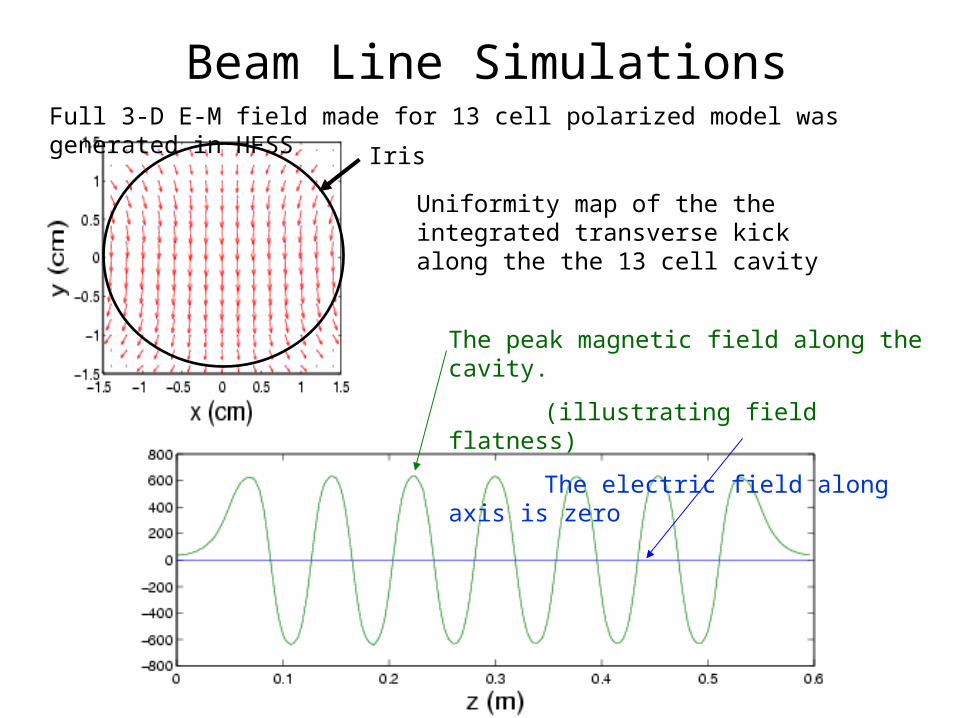
Beam Line SimulationsFull 3-D E-M field made for 13 cell polarized model was generated in HFSS
Uniformity map of the the integrated transverse kick along the the 13 cell cavity
The peak magnetic field along the cavity.
(illustrating field flatness)
The electric field along axis is zero
Iris
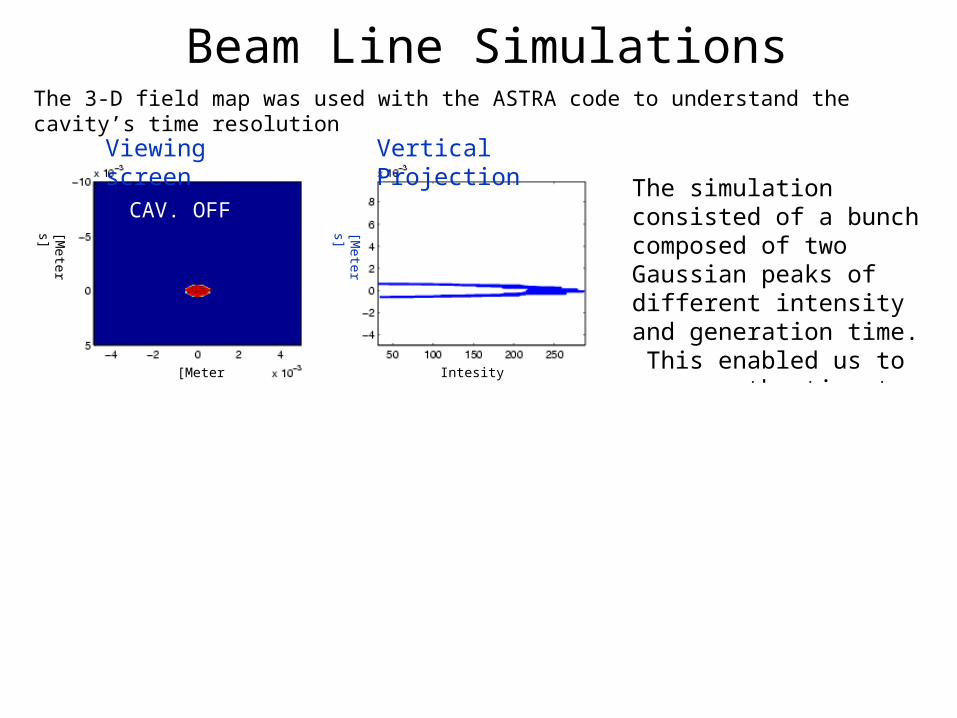
Beam Line SimulationsThe 3-D field map was used with the ASTRA code to understand the cavity’s time resolution
Resolution: 10 to 20 fsec
2.0mm 730fsec
The simulation consisted of a bunch composed of two Gaussian peaks of different intensity and generation time. This enabled us to compare the time to spacial correlation preservance.
BLUE: Vertical Position
GREEN: Time domain
CAV. OFF
CAV. ON
Viewing screen Vertical Projection
Intesity [arb]
Intesity [arb]
[Meters] [T
ime]
[Meters]
[Meters]
[Meters]
[Meters]
[Meters]
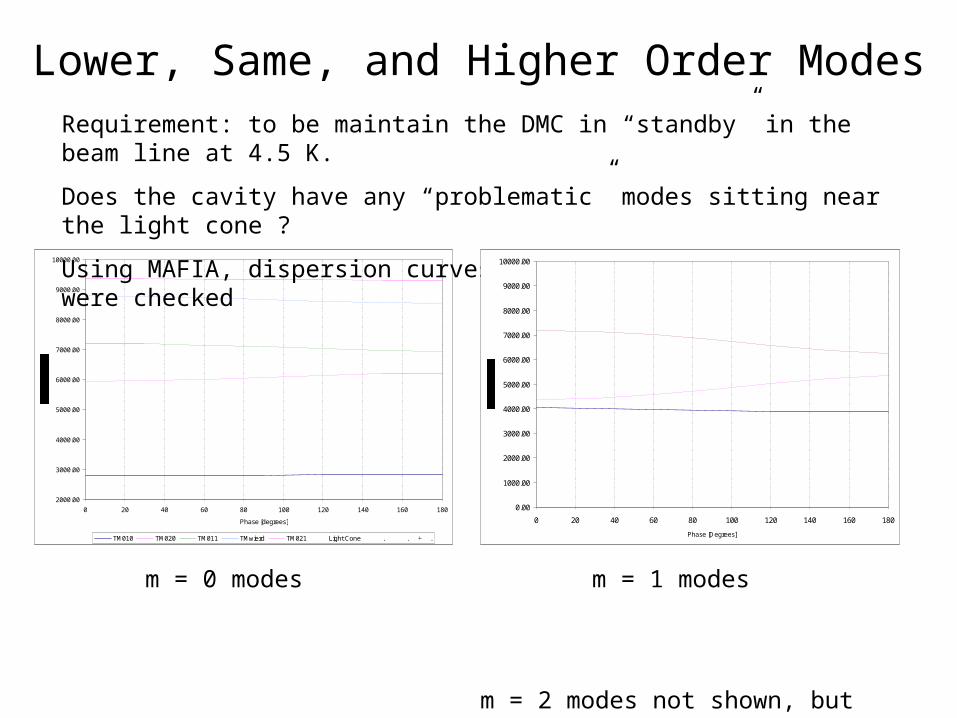
Lower, Same, and Higher Order Modes
2000.00
3000.00
4000.00
5000.00
6000.00
7000.00
8000.00
9000.00
10000.00
0 20 40 60 80 100 120 140 160 180
Phase [degrees]
TM010 TM020 TM011 TMwierd TM021 Light Cone . . .
m = 0 modes m = 1 modes
m = 2 modes not shown, but modeled.
Requirement: to be maintain the DMC in “standby” in the beam line at 4.5 K.
Does the cavity have any “problematic” modes sitting near the light cone ?
Using MAFIA, dispersion curves for modes up to cut-off were checked
0.00
1000.00
2000.00
3000.00
4000.00
5000.00
6000.00
7000.00
8000.00
9000.00
10000.00
0 20 40 60 80 100 120 140 160 180
Phase [Degrees]
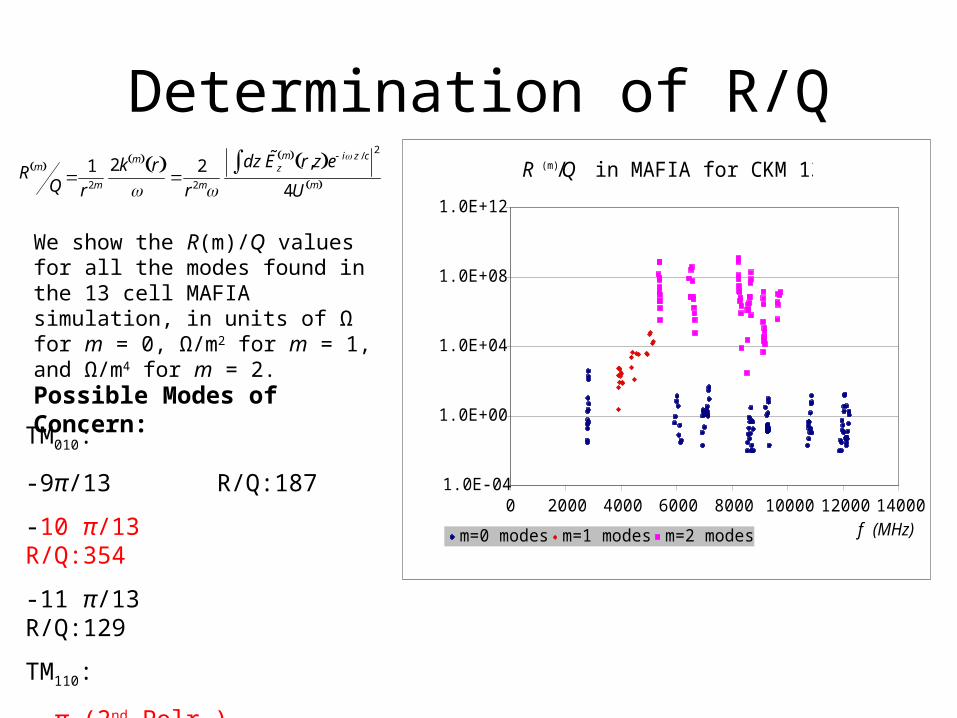
Determination of R/QR (m)/Q in MAFIA for CKM 13 cell
1.0E-04
1.0E+00
1.0E+04
1.0E+08
1.0E+12
0 2000 4000 6000 8000 10000 12000 14000f (MHz)
R(m
)/
Q (
W/m
(2m
))
m=0 modes m=1 modes m=2 modes
R m
Q 1
r2m
2k m r
2
r2m
dz ˜ E zm r,z e i z / c
2
4U m
Possible Modes of Concern:
We show the R(m)/Q values for all the modes found in the 13 cell MAFIA simulation, in units of Ω for m = 0, Ω/m2 for m = 1, and Ω/m4 for m = 2.
TM010:
-9π/13 R/Q:187
-10 π/13 R/Q:354
-11 π/13 R/Q:129
TM110:
- π (2nd Polr.) R/Q:2.3x106 !
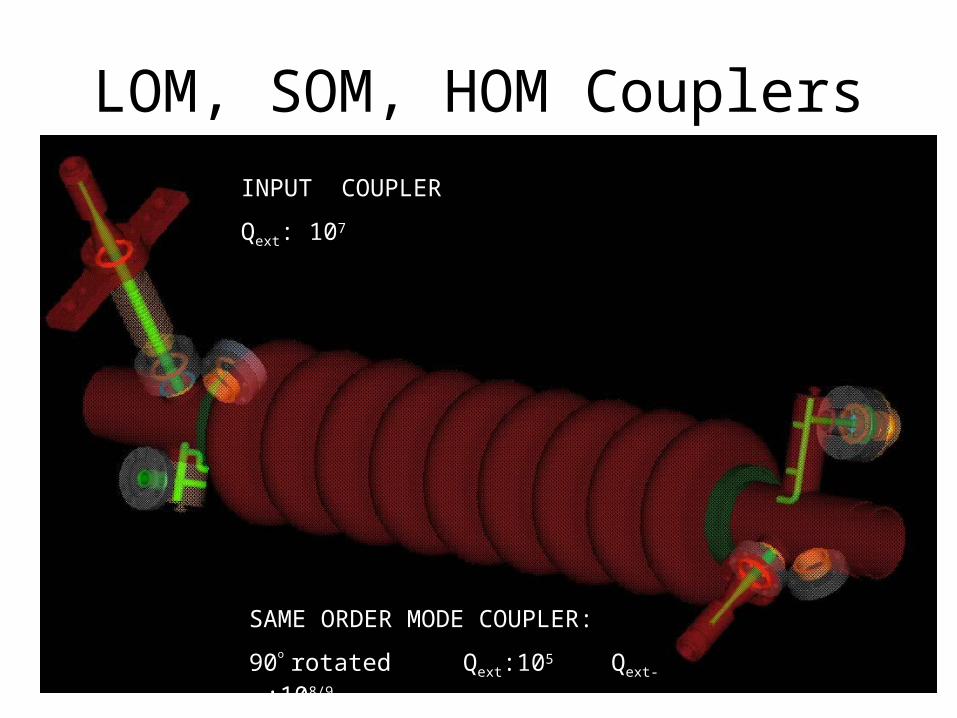
LOM, SOM, HOM Couplers
SAME ORDER MODE COUPLER:
90o rotated Qext:105 Qext-op:108/9
INPUT COUPLER
Qext: 107
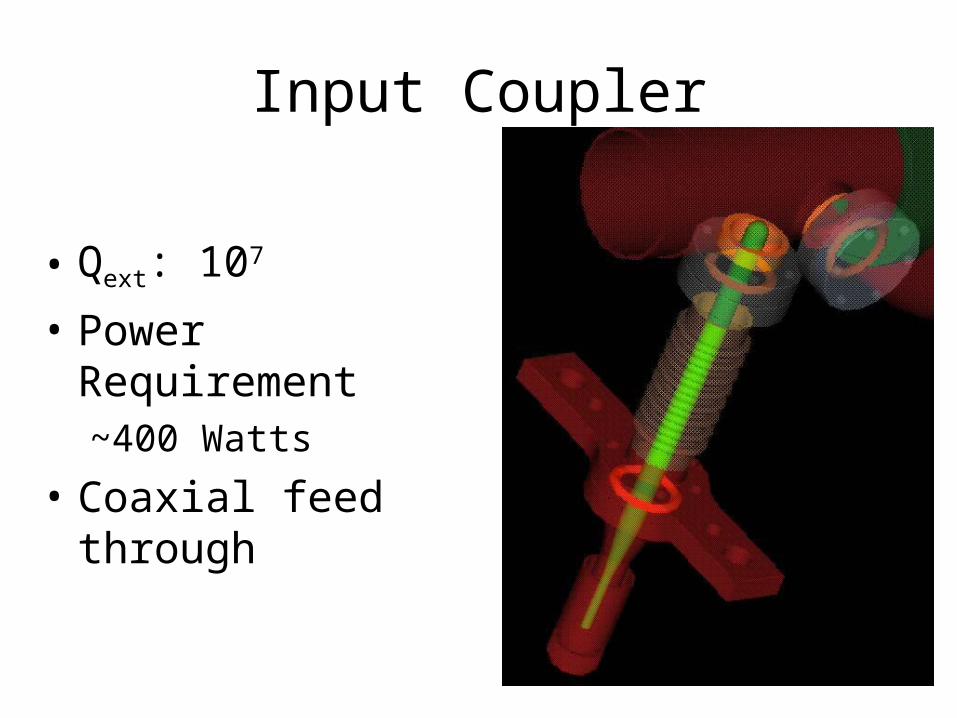
Input Coupler
• Qext: 107
• Power Requirement~400 Watts
• Coaxial feed through
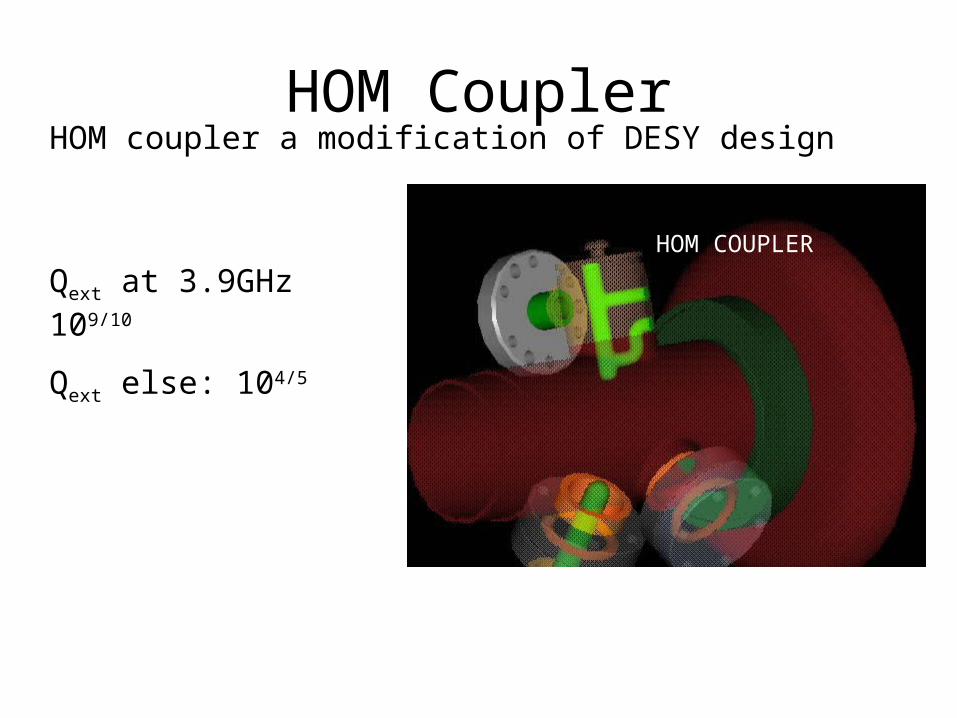
HOM CouplerHOM coupler a modification of DESY design
HOM COUPLER
Qext at 3.9GHz 109/10
Qext else: 104/5
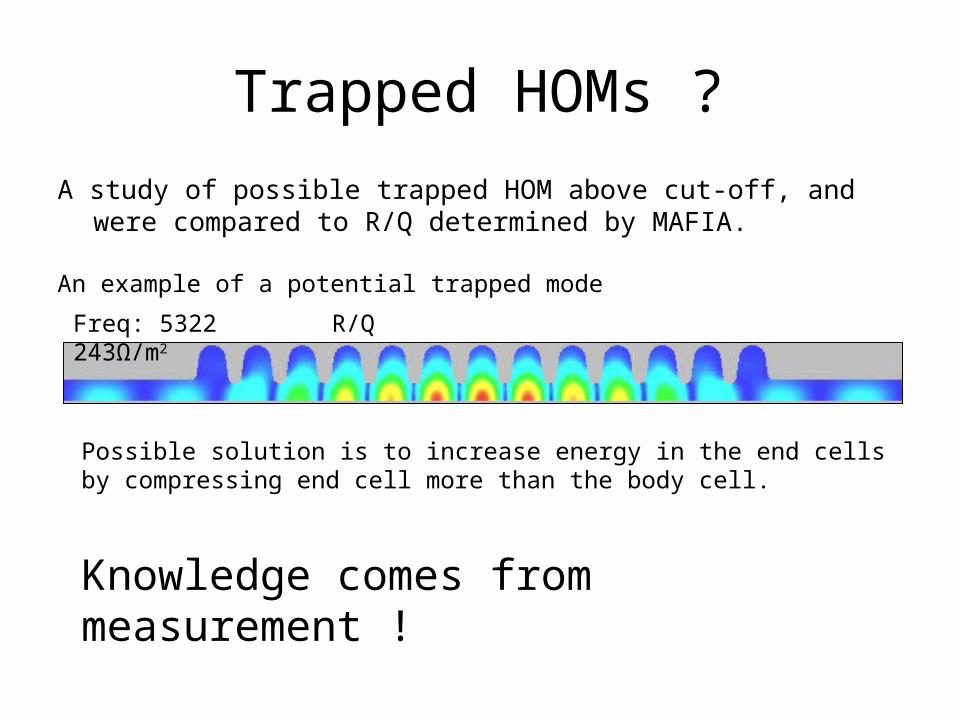
Trapped HOMs ?
A study of possible trapped HOM above cut-off, and were compared to R/Q determined by MAFIA.
Freq: 5322 R/Q 243Ω/m2
An example of a potential trapped mode
Knowledge comes from measurement !
Possible solution is to increase energy in the end cells by compressing end cell more than the body cell.
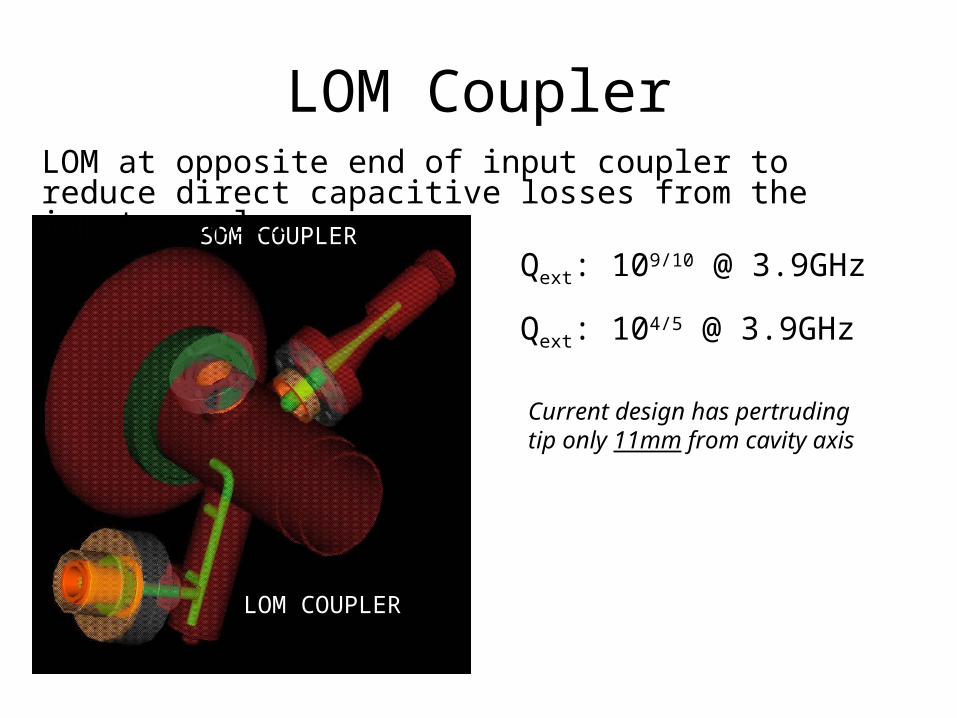
LOM Coupler
LOM COUPLER
SOM COUPLERQext: 109/10 @ 3.9GHz
Qext: 104/5 @ 3.9GHz
LOM at opposite end of input coupler to reduce direct capacitive losses from the input coupler
Current design has pertruding tip only 11mm from cavity axis
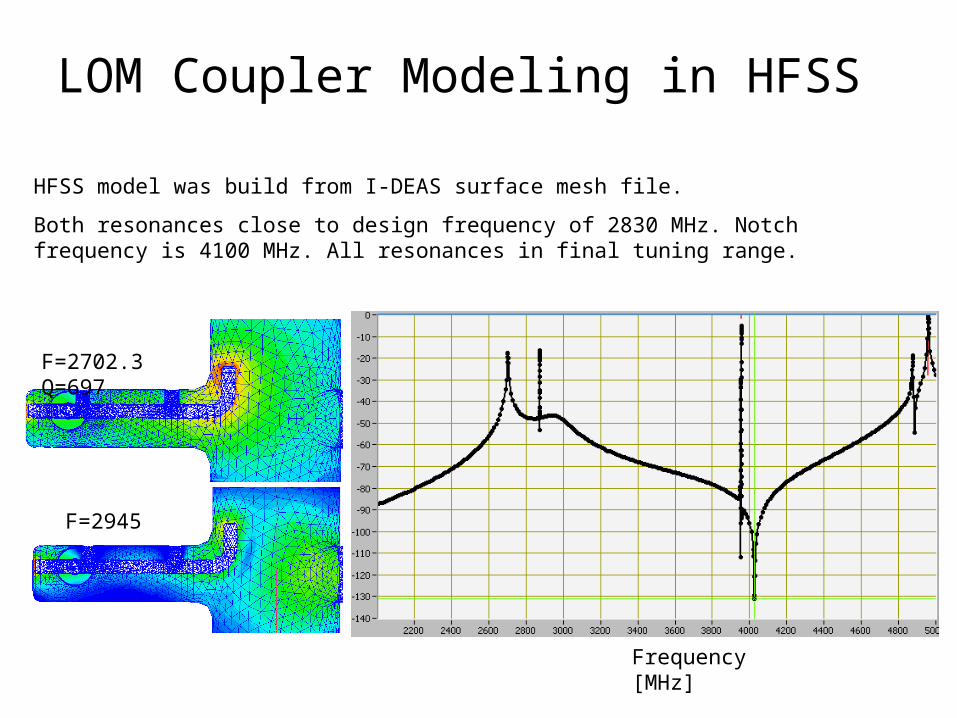
F=2702.3 Q=697
F=2945
HFSS model was build from I-DEAS surface mesh file.
Both resonances close to design frequency of 2830 MHz. Notch frequency is 4100 MHz. All resonances in final tuning range.
Frequency [MHz]
LOM Coupler Modeling in HFSS
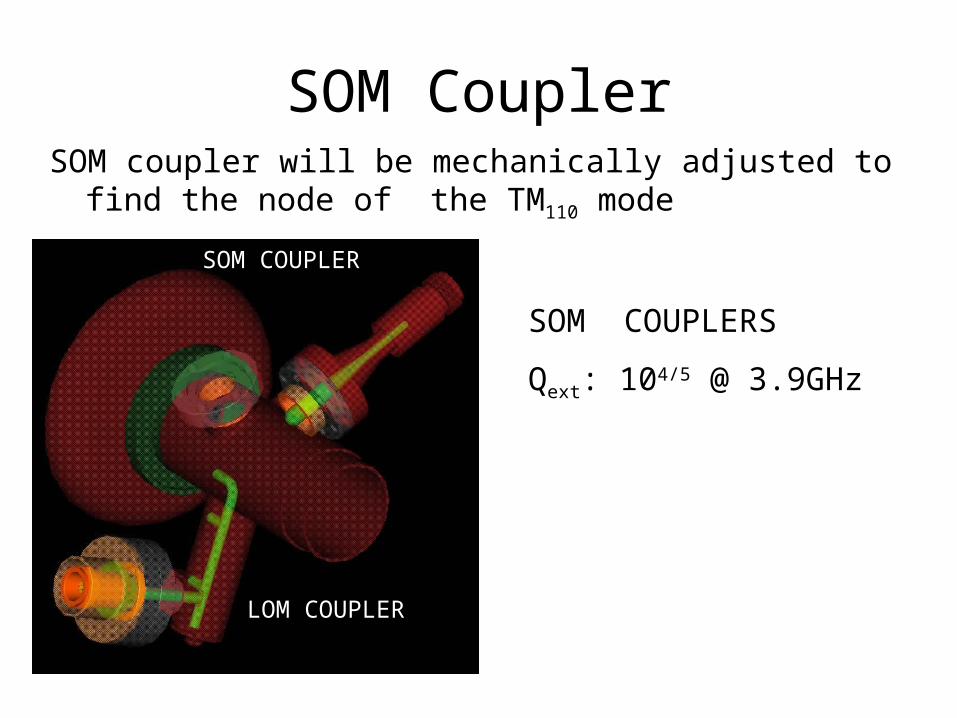
SOM CouplerSOM coupler will be mechanically adjusted to find the node
of the TM110 mode
LOM COUPLER
SOM COUPLER
SOM COUPLERS
Qext: 104/5 @ 3.9GHz
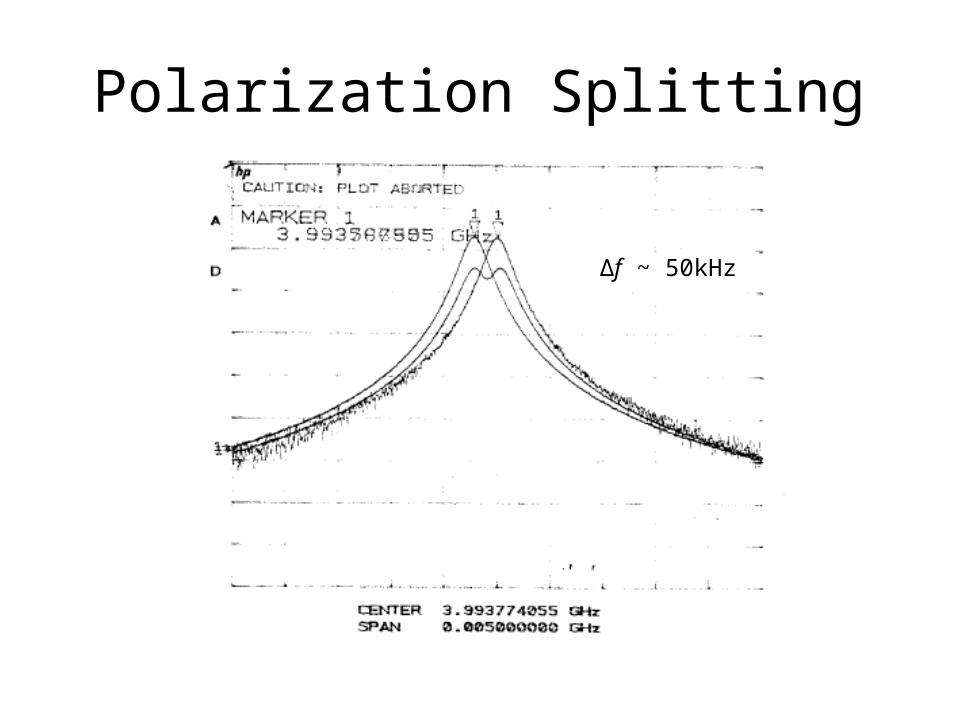
Polarization Splitting
Δf ~ 50kHz
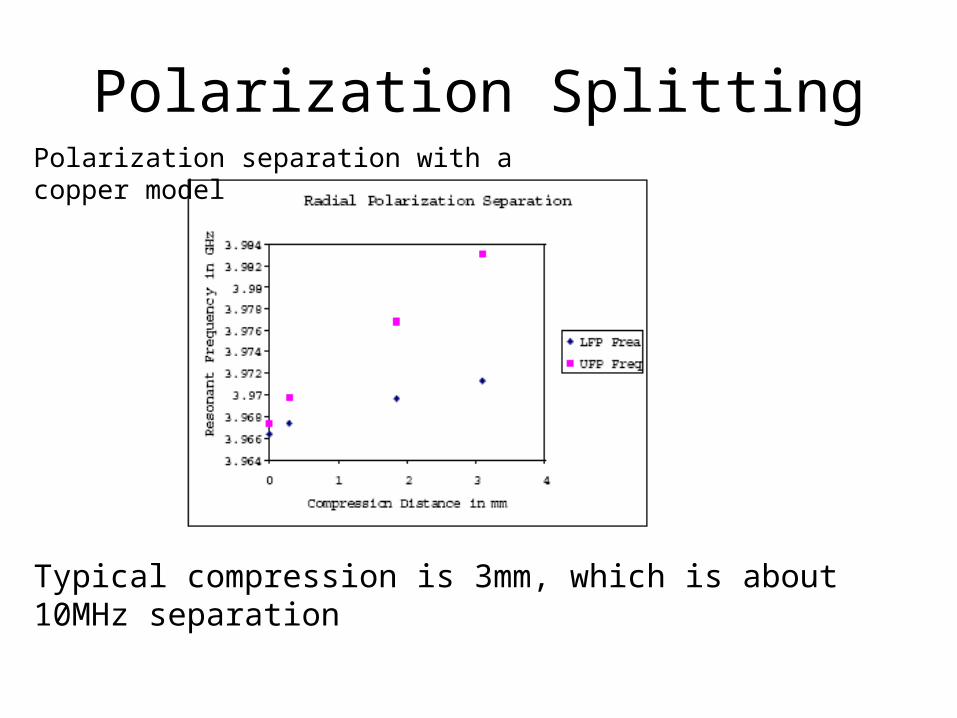
Polarization SplittingPolarization separation with a copper model
Typical compression is 3mm, which is about 10MHz separation
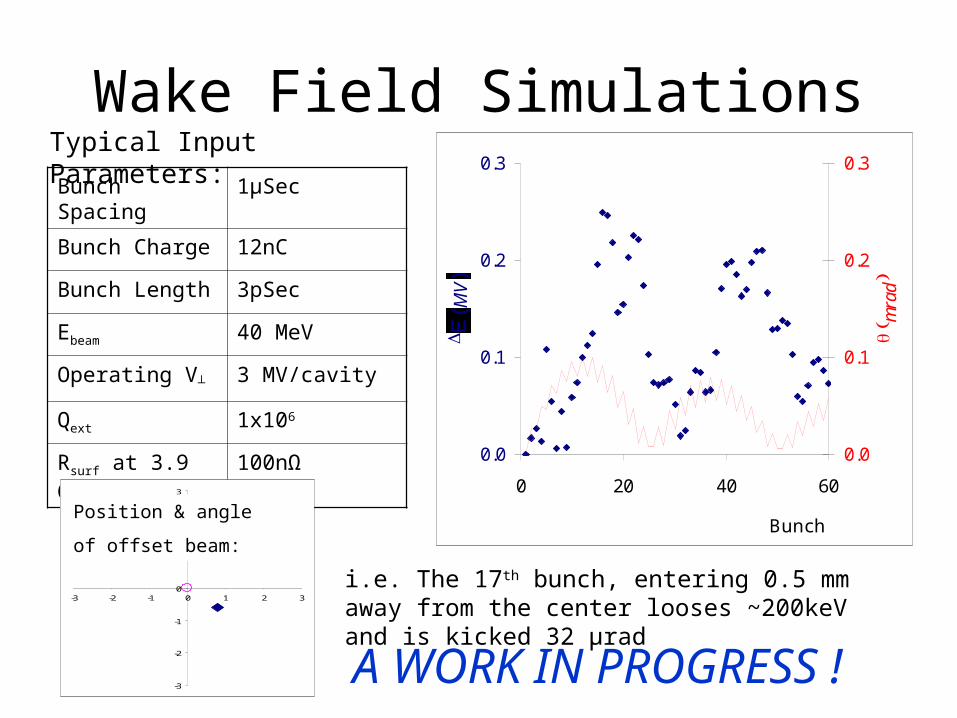
Wake Field SimulationsBunch Spacing 1μSec
Bunch Charge 12nC
Bunch Length 3pSec
Ebeam 40 MeV
Operating V┴ 3 MV/cavity
Qext 1x10⁶
Rsurf at 3.9 GHz 100nΩ
-3
-2
-1
0
1
2
3
-3 -2 -1 0 1 2 3
Typical Input Parameters:
Position & angle
of offset beam:
0.0
0.1
0.2
0.3
0 20 40 60
Bunch
DM
V0.0
0.1
0.2
0.3
q m
rad
i.e. The 17th bunch, entering 0.5 mm away from the center looses ~200keV and is kicked 32 μrad
A WORK IN PROGRESS !
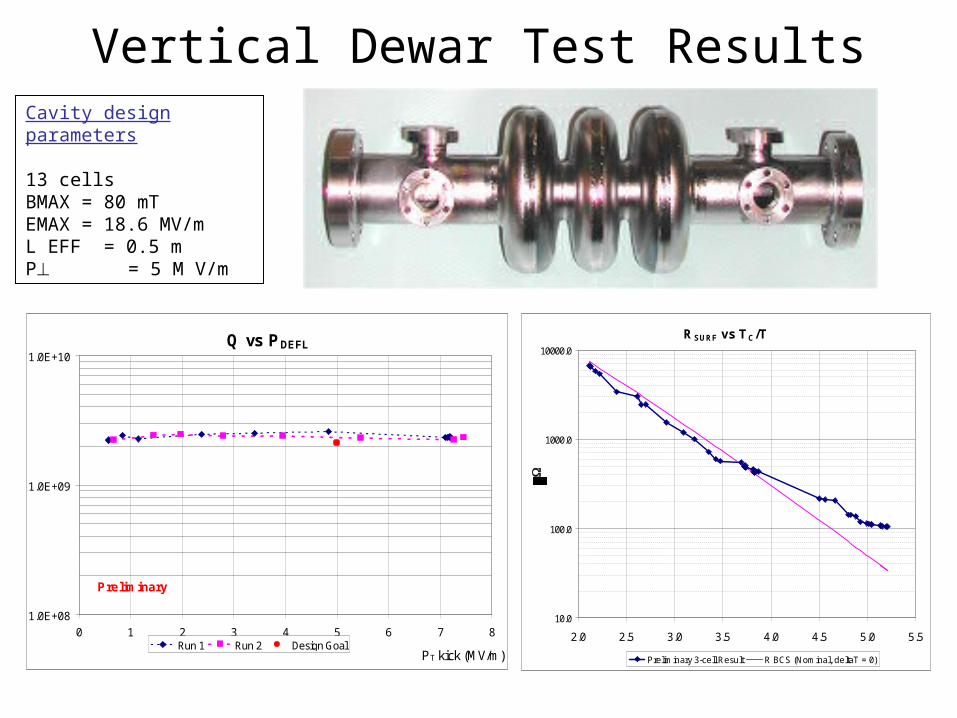
Vertical Dewar Test Results
RSURF vs TC/T
10.0
100.0
1000.0
10000.0
2.0 2.5 3.0 3.5 4.0 4.5 5.0 5.5
W
Preliminary 3-cell Result R BCS (Nominal, deltaT = 0)
Q vs PDEFL
1.0E+08
1.0E+09
1.0E+10
0 1 2 3 4 5 6 7 8
PT kick (MV/m)Run 1 Run 2 Design Goal
Preliminary
Cavity design parameters 13 cellsBMAX = 80 mT EMAX = 18.6 MV/mL EFF = 0.5 mP = 5 M V/m
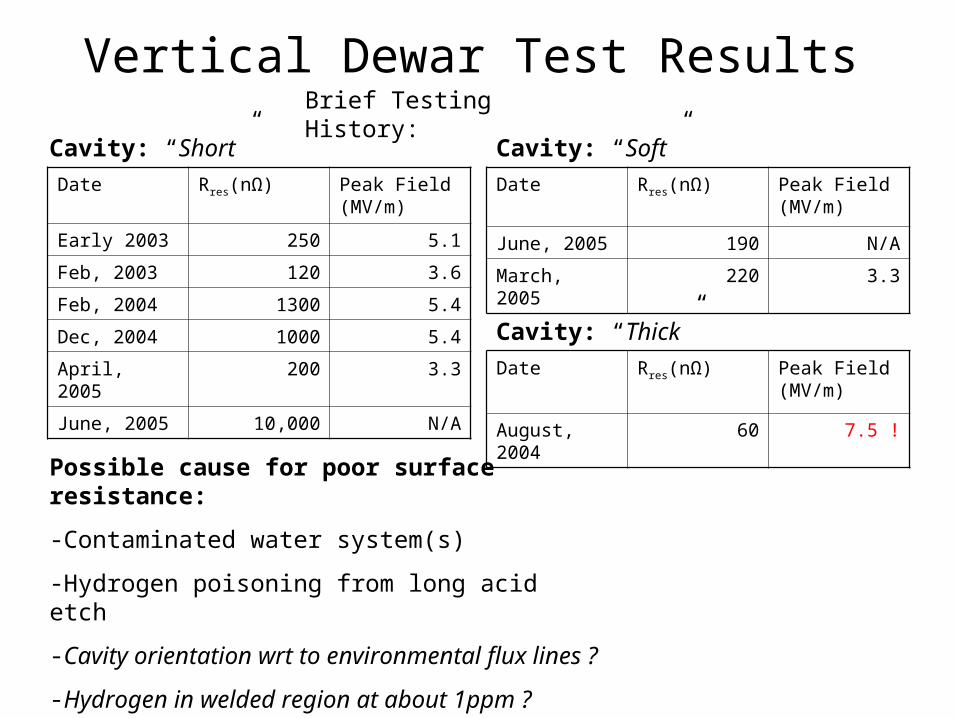
Vertical Dewar Test Results
Date Rres(nΩ) Peak Field (MV/m)
Early 2003 250 5.1
Feb, 2003 120 3.6
Feb, 2004 1300 5.4
Dec, 2004 1000 5.4
April, 2005 200 3.3
June, 2005 10,000 N/A
Date Rres(nΩ) Peak Field (MV/m)
June, 2005 190 N/A
March, 2005 220 3.3
Brief Testing History:
Cavity: “Short” Cavity: “Soft”
Cavity: “Thick”
Date Rres(nΩ) Peak Field (MV/m)
August, 2004 60 7.5 !
Possible cause for poor surface resistance:
-Contaminated water system(s)
-Hydrogen poisoning from long acid etch
-Cavity orientation wrt to environmental flux lines ?
-Hydrogen in welded region at about 1ppm ?
- Losses on tip of Input Coupler
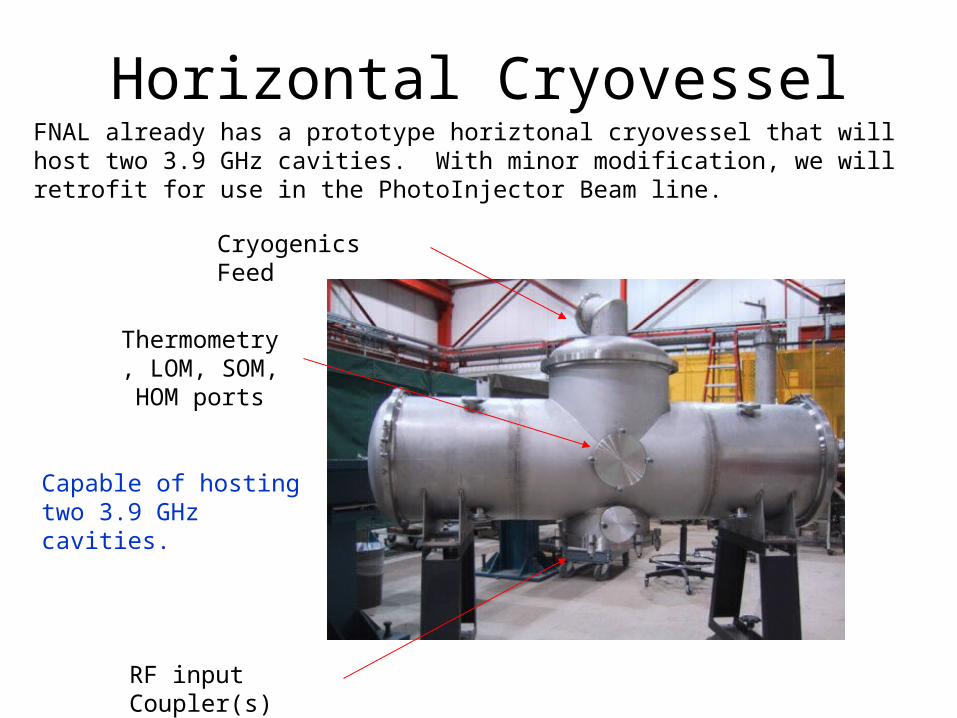
Horizontal CryovesselFNAL already has a prototype horiztonal cryovessel that will host two 3.9 GHz cavities. With minor modification, we will retrofit for use in the PhotoInjector Beam line.
Cryogenics Feed
Thermometry, LOM, SOM, HOM ports
RF input Coupler(s)
Capable of hosting two 3.9 GHz cavities.
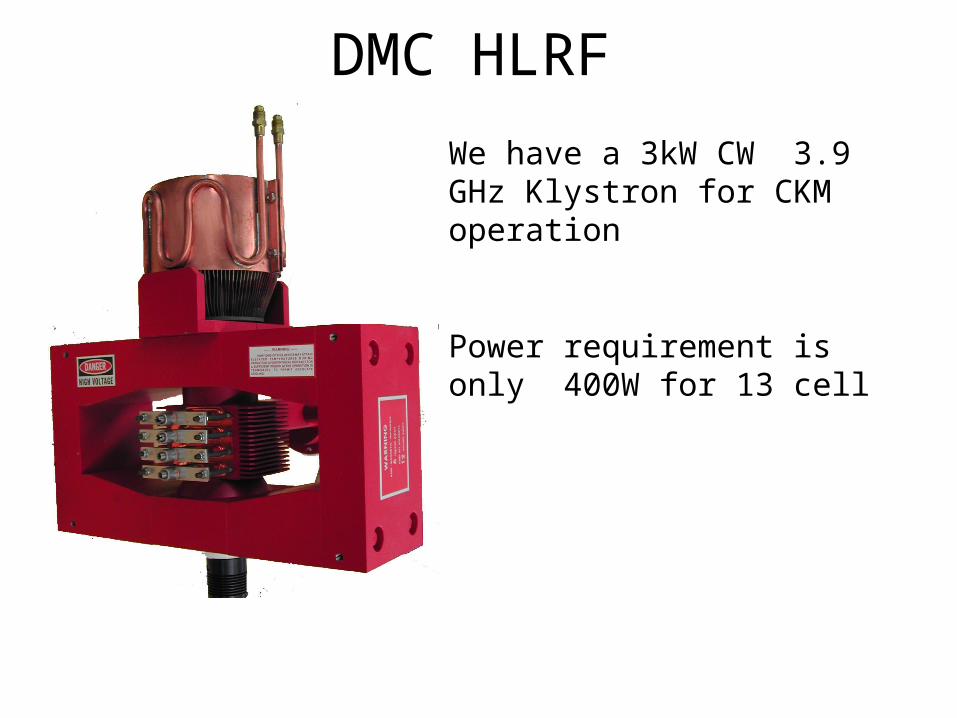
DMC HLRF
We have a 3kW CW 3.9 GHz Klystron for CKM operation
Power requirement is only 400W for 13 cell
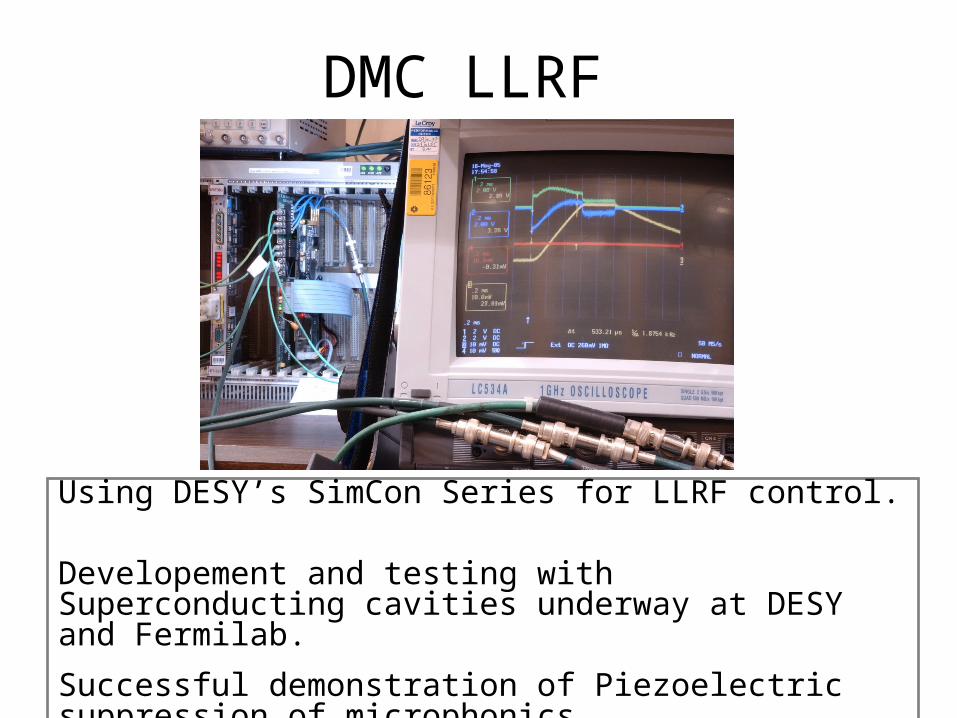
Using DESY’s SimCon Series for LLRF control.
Developement and testing with Superconducting cavities underway at DESY and Fermilab.
Successful demonstration of Piezoelectric suppression of microphonics.
DMC LLRF

Deflecting Mode Cavity Status:
Fall 2005: Fine tuning L/S/HOM design
December 2005: Cavity assemblies in construction
Summer 2006: Finish cavity production
Fall 2006 : Assembled cavity in cryovessel
Winter/Spring 2007: Commission with beam
Acknowledgements
Helen Edwards, Leo Bellantoni, Timergali Khabiboulline, Don Mitchell, Mike Foley, Allan Rowe, Bill Soyars, Peggy Crayton
HiGHLY RECOMMENDED READING: FERMILAB-TM-2144 May 2001
RF Design of a Transverse Mode Cavity for Kaon Separation