344 forward integration flash floods romania · forward integration of flood warning in areas prone...
TRANSCRIPT
FORWARD INTEGRATION OF FLOOD WARNING IN AREAS PRONE TO FLASH FLOODS
ROMANIA
Submitted by: Global Water Partnership—Romania
For the WMO/GWP Associated Programme on Flood Management
_______________________________________ NOTE The designations employed and the presentation of material in this document do not imply the expression of any opinion whatsoever on the part of the Secretariat of the World Meteorological Organization concerning the legal status of any country, territory, city or area or of its authorities, or concerning the delimitation of its frontiers or boundaries. It should be noted that this document is not an official WMO Publication and has not been subjected to the Organization's standard editorial procedures. The views expressed by individuals or groups of experts and published in this document do not necessarily have the endorsement of the Organization.
World Meteorological Organization

WMO/GWP Associated Programme on Flood Management
1
1. INTRODUCTION In Romania numerous severe flash floods developed in small basins encompassed either in large areas affected by regional floods or produced by local heavy rainstorms that brought about immense damages and loss of human lives. For example, in 2005 floods in Romania affected no less than 1734 localities, amounting to approximately EURO 1.4 bn worth of damages as well as 76 human casualties. Flash floods in Romania typically occur in the spring - summer period of time. Some of those, which have been recorded recently, were extreme from the precipitation intensity and flood effects points of view. Year 2005, is a typical example of a wet year, with floods mainly of the flash types which are exemplified bellow: Romania is located in Central and Eastern Europe having Hungary in the North-West, Serbia in the South-West, Moldova in the North East, Ukraine in the North part of Danube Delta and Black-Sea in the South-East, Bulgaria in the South and Ukraine again in the North as neighbors. Romanian territory is nearly all part of the great Danube Catchment Area, which is over 800.000 km² and totally part of the Black Sea Catchments Area. Basic figures for Romanian as part of Danube basin area: Catchment area: 232,193 km2 equal of 97, 4%of the country surface and representing 29 % of the Danube Basin surface Population: 21, 7 Milo representing 26, 79 % of the Danube Basin population 2. Precipitations and streams flows 2.1 Meteorological characterization of the year 2005 for Romania The meteorological characterization and forecasts are based on the data and information generated by the National Meteorological Administration organized as a management headquarter unit with specific processing/forecast functions and the national distributed network covering the whole country. In Romania, the year 2005 was 0.1º C colder than the climatic norm (1961-1990). The closeness to the normal values was due to the fact that throughout the year, the all-country thermal pattern was characterized by positive deviations ranging within 0.2 - 2.4º C in six of the year’s months (January, May, July, through September, December) and values lower by 0.3 – 2.6 ºC in the other six months of the year: February through April, June, October, November (Figure 1) At whole country level, the mean precipitation amount in 2005 was 866.5 mm (against a climatic norm of 647.0 mm). Precipitation amounts, above the average in January through May, July through September and December and the scanty ones in June, October and November, shaped a yearly precipitation pattern in excess of the average by 33.9% against the reference period. In August, following large precipitation amounts, the positive deviation against the normal was 124.2%. Significant positive precipitation deviations against the climatic norm were also recorded in April: 45.1%, July: 46.3%, September: 90.4%, (Fig. 2).

WMO/GWP Associated Programme on Flood Management
2
Figure 1.Mean monthly temperature in 2005 against the climatice norm (1961-1990)
0.0
20.0
40.0
60.0
80.0
100.0
120.0
140.0
160.0
I II III IV V VI VII VIII IX X XI XII
2005 61-90 Figure 2.Mean monthly precipitation amounts in 2005, against the climatic norm (1961-1990)
The 2004-2005 winters were characterized by a thermal pattern close to the climatic norm, with exception of the eastern and southeastern areas, where it was below normal values. The precipitation pattern showed excess in the northern border, locally in the south of the country and was normal in the rest of the territory. During the winter, there was an alternation of warm spells with spells colder than the normal value. February was colder than normal, with an excessive precipitation pattern and severe winter phenomena. The spring of 2005, characterized through the alternation of warm and cold periods, displayed a thermal pattern close to the normal values, except the west of the country, where it was below normal. Precipitation amounts were above the average, except in the northeast and southeast parts of the country, where they were close to normal values. In April, heavy precipitation was accompanied by hail, thunder and hard wind gusts. In the southwest of the country, rains were torrential, with positive deviations, larger than 225%. That situation triggered flooding, which caused important damages. Overall, the summer of 2005 displayed a thermal pattern within the normal limits and a precipitation pattern above the average. However, it was a season of thermal extremes, particularly unsettled, with weather phenomena unusually intense for Romania’s latitude . Torrential rainfalls were
-4.0-2.00.02.04.06.08.0
10.012.014.016.018.020.0
I II III IV V VI VII VIII IX X XI XII
T (°C)
2005 61-90

WMO/GWP Associated Programme on Flood Management
3
frequent throughout the summer and precipitation amounts exceeded the monthly means in July and August, causing flooding and landslides in most districts, which led to life losses and important damages. A notable deviation of the monthly precipitation amount from the climatic norm occurred in August, when positive deviations of 100% and even 200% were reported over wide areas. The autumn of 2005 was characterized through mean monthly temperatures within the normal limits. Precipitation amounts were excessive in the south, scanty in the northeast and normal elsewhere. During the last decade of September, rainfalls were torrential in the south of the country. Exceptionally high 24-hour amounts were recorded: 150-200 mm on the Black Sea coast and over 100 mm in the south of the country, which caused flooding, landslides, resulting in life losses and heavy damages. At Mangalia weather station, (on the Black Sea Coast) the monthly precipitation amount was 330.4 mm (against a climatic norm of 32.0 mm). This made the September precipitation pattern excessive, with positive deviations exceeding 275% in the south of the country and reaching 932.5% at Mangalia. In 2005, precipitation caused widespread flooding. 1374 localities were affected in all of the 41 counties of Romania and also the city of Bucharest and 76 lives were lost. The floodsdestroyed or affected 93 976 houses and household annexes, 656 392 ha. of agricultural land, 1063 social-economic units and an important share of the infrastructure. The flooding events caused destructions estimated at 5 975 201.5 thousand RON*. */ The EURO / RON exchange rate varied along the year, the parity being 1 EURO =3.6771 RON at the end of 2005. 2.2 Annual report of Romanian water situation in 2005 2.2.1 Rivers The year 2005 was characterized, from the hydrological point of view, by a runoff over the normal annual values on the rivers in the western side of the country and under these values on the rivers in the rest of the country. The smallest values (between 40 -60 % of the normal annual discharges) occurred on Prut and Barlad rivers. The warning levels were exceeded in almost every month of the year (except of October) but the most significant flood waves, causing important damages, were recorded in July, August and November. Between January and April the most dangerous increases of discharge were determined both by liquid precipitation amounts as well as by snow melt. The flood levels were exceeded in February and March on some rivers in the Western, Southern and Northern parts and in April in the Western side of the country. The small amounts of short time precipitation fallen in June, mostly in the western river basins of the country, affected only small controlled and uncontrolled tributaries and torrents that flooded some agricultural fields and villages located near the channel of those rivers. Between July and August the most significant flood waves (destroying villages and fields) were recorded both in some controlled and uncontrolled catchments during the intervals 11-15 of July in the Southern and Eastern part, during 27-31 of July in the Western, the Southern and the Eastern part and finally, during 1-25 and 27-29 of August in the Central, the Southern and the Eastern part. They were determined by a high atmospheric instability with important amounts of short time precipitation fallen on small areas.

WMO/GWP Associated Programme on Flood Management
4
The flood levels were exceeded in November in four intervals (during 8-11; 14-16; 19-20 and 23-25 of November), with 10-80cm, on many rivers in the Western and Southern part and in December in two intervals (during 2-4 and 19-20 of December) on some rivers of the Western part of the country.
Iza
Lapus
Barcau
Crasna
Cerna
Gilo
rt
Motru
Desnatui
PrahovaTeleajen
Rm.Sarat
Suceava
LespeziBahlui
Ciucea
Oradea
Cluj
Turda
Band
Satu Mare
Bistra
Nepos
Bistrita
Itcani
Frumosu
Tupilati
SarateniGoioasa
Tg. Ocna
RacatauSancraieni
BlajMures
Mur
es
Branisca
Talmaciu
VoineasaIscroni
Feldioara
NehoiuTesilaBotarlau
Lungoci
Bahna Rusului
PoianaTapului
Turburea
Filiasi
Malucu
FloriCosereni
Fata Motrului
BalsVartoapele
Malu spart
PitestiLunguletu
Alexandria
Gataia
Moravita
Valea PaiPartos
Varadia
Dalboset
Lugoj
BucovaVoislova
FagetBalint
Chizatau
Arad
BeregsauPischia
Radna
Gurahont
Chisineu Cris
Tinca Holod
Talpos
Zerind
Mihalt
Sire t Barla
d
Tur
Somes
Aries
Somesul Mare
Som
esul
Mic
Tarnava Mica
Tarnava Mare
Viseu
Crisul Repede
Crisul Negru
Holod
Crisul Alb
BegaBega Veche
Nera
JiuO
ltet
Vedea
Teleorman Arges
Neajlov
Buzau
Calmatui
Putna
Trotus
Hom
orod
Raul N
egru
Moldova
BaseuJijia
Bistrita
Dambovita
Barzava
Caras
Moravita Timis
Pogonis Bistra
Sebe
s
TurulungNegresti
Prut
Dunarea
Dunarea
Olt
Olt
Cibin
Lotru
R. Bistrita s.h. Frumosu
0
10
20
30
40
50
60
70
80
90
1 2 3 4 5 6 7 8 9 10 11 12luna
Q (m
c/s)
R.Viseu s.h. Bistra
0
10
20
30
40
50
60
70
80
90
100
1 2 3 4 5 6 7 8 9 10 11 12luna
Q (m
c/s)
R. Crisul Negru s.h. Tinca
0
10
20
30
40
50
60
70
80
90
100
1 2 3 4 5 6 7 8 9 10 11 12luna
Q (m
c/s)
R.Mures s.h.Alba Iulia
0
50
100
150
200
250
300
350
1 2 3 4 5 6 7 8 9 10 11 12luna
Q (m
c/s)
R. Vedea s.h. Alexandria
0
5
10
15
20
25
1 2 3 4 5 6 7 8 9 10 11 12luna
Q (m
c/s)
R.Birlad s.h.Birlad
0
2
4
6
8
10
12
14
16
1 2 3 4 5 6 7 8 9 10 11 12luna
Q (m
c/s)
Barlad
Figure 3. Map regarding the repartition of the mean annual discharges in 2004 (__) compared to the mean multiannual discharges (__), the hydrographs of the mean monthly discharges ( ) compared to the normal monthly values ( ), for the most representative areas of the country In May and in September there were only some isolated increases determined by short time precipitation fallen on small areas and only attention levels were exceeded. The ice phenomena occurred on almost all the Romanian rivers and their evolution during the interval January - March and also in December determined great level variations, exceeding sometimes the warning levels on some rivers from the Western, Southern and Eastern part of the country. Grease ice occurred on many rivers, mainly in the northern part of the country and on the upper course of Bistrita (Suceava and Neamt districts) and created an artificial dam of ice, located upstream of the Izvorul Muntelui reservoir. In 2005, there were no recorded periods of very small values of water discharges, so there were no drought problems.

WMO/GWP Associated Programme on Flood Management
5
In APRIL, the most important increase of water discharges occurred during 15 -22, on many rivers from Crisuri and lower Mures river basins as well as in the Banat area and exceeded FLOODING and DANGEROUS water levels. In the Banat area, the most significant floods were recorded in the river basins of: Bega, Timis, Barzava, Moravita, Caras, Nera and Cerna and were at the beginning caused by the rain fallen during 14 -16 April, having values between 15 -75 mm. Then, followed a new greater wave of precipitation, of 40 -100 mm covering the same territory during 17-19 and the high atmospheric instability lasted until the 22nd. The rain amounts of 80-220 mm that fell during 14-22 April superposed on a soil with a high humidity, together with high discharges in the river beds and the presence of a thick snow cover in the high mountains (for example: 126 cm on Tarcu Peak and 26 cm on Semenic Peak), caused historical floods on the entire territory of the BANAT AREA. Timis and Bega Rivers bound together by Topolovat channel transported the greatest water volume ever known. This huge water volume broke the dam, released 320 billion m3 of water and formed the so called “Sea of Banat”.
Iza
Lapus
Barcau
Crasna
Cerna
Gilo
rt
Motru
Desnatui
PrahovaTeleajen
Rm.Sarat
Suceava
LespeziBahlui
Ciucea
Oradea
Cluj
Turda
Band
Satu Mare
Bistra
Nepos
Bistrita
Itcani
Brodina
G. Humorului
SiretDorohoi
Radauti Prut
Frumosu
Tupilati
SarateniGoioasa
Tg. Ocna
Dragesti
Victoria
Ungheni
Drangeni
Iasi
Negresti
Barlad
Oancea
Tataru
Racovita
Casimcea
Adancata
Budesti
Calugareni
Teleorman
Buzesti
Podari
Gruia
Cetate
Calafat
Bechet Corabia Tr. MagureleZimnicea
Giurgiu
OltenitaCalarasi
Fetesti
Harsova
Braila
Galati
IsacceaTulcea
Cernavoda
Toplet
Salard
Domanesti
Lapusel
Vadu Izei
Dej
Glodeni
Tarnaveni
Medias
Sebes
Cornet
Rupea Gara
Hoghiz
M. Domneasca
Sancraieni
BlajMures
Mur
es
Branisca
Talmaciu
VoineasaIscroni
Feldioara
NehoiuTesila
ReciBotarlau
Lungoci
Bahna Rusului
Malureni
Mioveni
PoianaTapului
Turburea
Filiasi
Malucu
FloriCosereni
Fata Motrului
Bals
Malu Spart
Lunguletu
Alexandria
Gataia
Moravita
Partos
Varadia
Dalboset
Bazias
LugojVoislova
FagetBalint
Chizatau
Arad
BeregsauPischia
Radna
Gurahont
Chisineu Cris
Tinca Holod
Talpos
Zerind
Mihalt
Sire t Barla
d
Tur
Somes
Aries
Somesul Mare
Som
esul
Mic
Tarnava Mica
Tarnava Mare
Viseu
Crisul Repede
Crisul Negru
Holod
Crisul Alb
BegaBega Veche
Nera
JiuO
ltet
Vedea
Teleorman Arges
Neajlov
Buzau
Calmatui
Putna
Trotus
Hom
orod
Raul N
egru
Moldova
BaseuJijia
Bistrita
Dambovita
Barzava
Caras
Moravita Timis
Pogonis Bistra
Stre
i
TurulungNegresti
Prut
Dunarea
Olt
Olt
Cibin
Lotru
Iza
Lapus
Barcau
Crasna
Cerna
Gilo
rt
Motru
Desnatui
PrahovaTeleajen
Rm.Sarat
Suceava
LespeziBahlui
Ciucea
Oradea
Cluj
Turda
Band
Satu Mare
Bistra
Nepos
Bistrita
Itcani
Brodina
G. Humorului
SiretDorohoi
Radauti Prut
Frumosu
Tupilati
SarateniGoioasa
Tg. Ocna
Dragesti
Victoria
Ungheni
Drangeni
Iasi
Negresti
Barlad
Oancea
Tataru
Racovita
Casimcea
Adancata
Budesti
Calugareni
Teleorman
Buzesti
Podari
Gruia
Cetate
Calafat
Bechet CorabiaTr. Magurele
Zimnicea
Giurgiu
OltenitaCalarasi
Fetesti
Harsova
Braila
Galati
IsacceaTulcea
Cernavoda
Toplet
Salard
Domanesti
Lapusel
Vadu Izei
Dej
Glodeni
Tarnaveni
Medias
Sebes
Cornet
Rupea Gara
Hoghiz
M. Domneasca
Sancraieni
BlajMures
Mur
es
Branisca
Talmaciu
VoineasaIscroni
Feldioara
NehoiuTesila
ReciBotarlau
Lungoci
Bahna Rusului
Malureni
Mioveni
PoianaTapului
Turburea
Filiasi
Malucu
FloriCosereni
Fata Motrului
Bals
Malu Spart
Lunguletu
Alexandria
Gataia
Moravita
Partos
Varadia
Dalboset
Bazias
LugojVoislova
FagetBalint
Chizatau
Arad
BeregsauPischia
Radna
Gurahont
Chisineu Cris
Tinca Holod
Talpos
Zerind
Mihalt
Sire t Barla
d
Tur
Somes
Aries
Somesul Mare
Som
esul
Mic
Tarnava Mica
Tarnava Mare
Viseu
Crisul Repede
Crisul Negru
Holod
Crisul Alb
BegaBega Veche
Nera
JiuO
ltet
Vedea
Teleorman Arges
Neajlov
Buzau
Calmatui
Putna
Trotus
Hom
orod
Raul N
egru
Moldova
BaseuJijia
Bistrita
Dambovita
Barzava
Caras
Moravita Timis
Pogonis Bistra
Stre
i
TurulungNegresti
Prut
Dunarea
Olt
Olt
Cibin
Lotru
SMMM
SVBT
BH SJ BNNT
IS
CJMS
HR BC VSAR
AB
SB
BVCV VN GL
TM
HD
CSGJ VL
AG DB PH
BZ
BRTL
MH
DJ
OT
TR
GR
SAI
CL
IL
CT
ABOVE FLOODING LEVELS
ABOVE DANGEROUS LEVELS
Figure 4. Floods in 2005 During the entire observation period on the Barzava River, beginning 1880, the highest water levels were recorded in 2005. , Historical values of levels and discharges were also recorded on the other rivers from the Southern part of Banat (Caras, Nera and Cerna). In the last MAY decade , important torrential rain that gradually covered the entire territory of the country, produced high values of levels and water discharges on rivers, especially in the Western and Southern parts of Romania, were big floods were recorded.

WMO/GWP Associated Programme on Flood Management
6
In JUNE, the most characteristic period was during 9-13 in the Olt (middle and downstream course), Somes, Vedea, Mures, Jiu, Prahova and Jijia River Basins where the FLOODING and DANGEROUS levels were exceeded. The month of JULY started with prolonged, high intensity and great precipitation amounts. For example, between 1- 4 of July, great floods were recorded, especially in the South part of the country, with casualties and important damages because of great amounts of prolonged rain (100-200mm/72 hours) as well as of high intensity showers (55 mm/2hours on the Iminog river at Maruntei gauging station; 73 mm/3 hours on the Casimcea river at Casimcea gauging station; 80 mm/5 hours on theVedea river at Valeni ; 74 mm/ 4 hours on the Cotmeana river at Ciobani station . After one week pause, between 11-13 July, a new wave of precipitation covered the entire Romanian territory, the greatest amounts of more than 200 mm were recorded on Siret tributaries (Trotus, Putna, Rm.Sarat). More than 100 mm/48 hours were also recorded on areas located in the Western, Central and Eastern parts of the country and this peculiar meteorological situation generated historical floods, under 1% occurrence probability on the Trotus, Putna, Rm Sarat basins, on the lower course of Siret and on some tributaries of Bistrita and also big floods in the following river basins:Crisul Alb, Crisul Negru, Crisul Repede, Mures, Olt, Vedea, Arges, Ialomita, Buzau, Bistrita .
Iza
Lapus
Barcau
Crasna
Cerna
Gilo
rt
Motru
Desnatui
PrahovaTeleajen
Rm.Sarat
Suceava
LespeziBahlui
Ciucea
Oradea
Cluj
Turda
Band
Satu Mare
Bistra
Nepos
Bistrita
Itcani
Brodina
G. Humorului
SiretDorohoi
Radauti Prut
Frumosu
Tupilati
SarateniGoioasa
Tg. Ocna
Dragesti
Victoria
Ungheni
Drangeni
Iasi
Negresti
Barlad
Oancea
Tataru
Racovita
Casimcea
Adancata
Budesti
Calugareni
Teleorman
Buzesti
Podari
Gruia
Cetate
Calafat
Bechet Corabia Tr. MagureleZimnicea
Giurgiu
OltenitaCalarasi
Fetesti
Harsova
Braila
Galati
IsacceaTulcea
Cernavoda
Toplet
Salard
Domanesti
Lapusel
Vadu Izei
Dej
Glodeni
Tarnaveni
Medias
Sebes
Cornet
Rupea Gara
Hoghiz
M. Domneasca
Sancraieni
BlajMures
Mur
es
Branisca
Talmaciu
VoineasaIscroni
Feldioara
NehoiuTesila
ReciBotarlau
Lungoci
Bahna Rusului
Malureni
Mioveni
PoianaTapului
Turburea
Filiasi
Malucu
FloriCosereni
Fata Motrului
Bals
Malu Spart
Lunguletu
Alexandria
Gataia
Moravita
Partos
Varadia
Dalboset
Bazias
LugojVoislova
FagetBalint
Chizatau
Arad
BeregsauPischia
Radna
Gurahont
Chisineu Cris
Tinca Holod
Talpos
Zerind
Mihalt
Sire t Barla
d
Tur
Somes
Aries
Somesul Mare
Som
esul
Mic
Tarnava Mica
Tarnava Mare
Viseu
Crisul Repede
Crisul Negru
Holod
Crisul Alb
BegaBega Veche
Nera
JiuO
ltet
Vedea
Teleorman Arges
Neajlov
Buzau
Calmatui
Putna
Trotus
Hom
orod
Raul N
egru
Moldova
BaseuJijia
Bistrita
Dambovita
Barzava
Caras
Moravita Timis
Pogonis Bistra
Stre
i
TurulungNegresti
Prut
Dunarea
Olt
Olt
Cibin
Lotru
Iza
Lapus
Barcau
Crasna
Cerna
Gilo
rt
Motru
Desnatui
PrahovaTeleajen
Rm.Sarat
Suceava
LespeziBahlui
Ciucea
Oradea
Cluj
Turda
Band
Satu Mare
Bistra
Nepos
Bistrita
Itcani
Brodina
G. Humorului
SiretDorohoi
Radauti Prut
Frumosu
Tupilati
SarateniGoioasa
Tg. Ocna
Dragesti
Victoria
Ungheni
Drangeni
Iasi
Negresti
Barlad
Oancea
Tataru
Racovita
Casimcea
Adancata
Budesti
Calugareni
Teleorman
Buzesti
Podari
Gruia
Cetate
Calafat
Bechet CorabiaTr. Magurele
Zimnicea
Giurgiu
OltenitaCalarasi
Fetesti
Harsova
Braila
Galati
IsacceaTulcea
Cernavoda
Toplet
Salard
Domanesti
Lapusel
Vadu Izei
Dej
Glodeni
Tarnaveni
Medias
Sebes
Cornet
Rupea Gara
Hoghiz
M. Domneasca
Sancraieni
BlajMures
Mur
es
Branisca
Talmaciu
VoineasaIscroni
Feldioara
NehoiuTesila
ReciBotarlau
Lungoci
Bahna Rusului
Malureni
Mioveni
PoianaTapului
Turburea
Filiasi
Malucu
FloriCosereni
Fata Motrului
Bals
Malu Spart
Lunguletu
Alexandria
Gataia
Moravita
Partos
Varadia
Dalboset
Bazias
LugojVoislova
FagetBalint
Chizatau
Arad
BeregsauPischia
Radna
Gurahont
Chisineu Cris
Tinca Holod
Talpos
Zerind
Mihalt
Sire t Barla
d
Tur
Somes
Aries
Somesul Mare
Som
esul
Mic
Tarnava Mica
Tarnava Mare
Viseu
Crisul Repede
Crisul Negru
Holod
Crisul Alb
BegaBega Veche
Nera
JiuO
ltet
Vedea
Teleorman Arges
Neajlov
Buzau
Calmatui
Putna
Trotus
Hom
orod
Raul N
egru
Moldova
BaseuJijia
Bistrita
Dambovita
Barzava
Caras
Moravita Timis
Pogonis Bistra
Stre
i
TurulungNegresti
Prut
Dunarea
Olt
Olt
Cibin
Lotru
JULY
JUNE
AUGUST
Figure 5. Floods in the summer of 2003
The main characteristics of AUGUST were: a high frequency of increased discharges on the majority of rivers, big floods, some of them having historical values, casualties and important damage due to the enormous water quantities resulting from both total amounts of monthly rainfall and of intense showers. Big floods were recorded on rivers located mainly in the Southern and Eastern part of the country, such as: Cricovul Dulce, Teslui, Terpezita, Bega, Jiu, Olt, Vedea, Arges, Ialomita, Siret and Prut. Beginning from the 18th of SEPTEMBER, after a pause period, a new wave of precipitation crossed the Southern part of the country and determined frequent important floods between 20 and

WMO/GWP Associated Programme on Flood Management
7
24 September. The most destructive floods occurred in the Lalomita and in the Dobrogea basins mostly on the Black Sea coast, and the results were awful: dead people and a lot of damages. The amounts of precipitation at the meteorological station fallen between 19 and 21 were impressive: Sinaia 1500 (218 mm), Campina (143 mm), Targoviste 103 mm, Bucuresti Afumati (182 mm), Bucuresti Baneasa (158 mm), Ploiesti 164 mm and continued in the next 24 hours with new 60-80 mm amounts determining huge discharges on Lalomita and its tributaries (Prahova, Teleajen, Cricovul Sarat). Between 21 and 22 September, the torrential precipitation moved to Dobrogea, especially on the Black Sea Shore, where huge amounts of rain were recorded only in a few hours (165 mm in Mangalia, 222 mm in Biruinta) and determined flash floods on small, uncontrolled rivers and torrents and the result was the flooding of streets, houses, social and economic objectives in the resorts of Agigea, Eforie, Techirghiol, Tuzla, Costinesti, 23 August. Amounts of 200-250 mm of rain fallen in three or four days in the basin of Colentina, upstream Buftea town and also in Bucharest, caused an important increase of volumes in the neighbouring lakes of Bucharest and an intervention of enabled authorities was necessary in order to prevent city flooding. During the first five days of OCTOBER a few rivers were affected by floods and the next period until the end of the year was out of hydrological events, except of short periods in December (2÷5; 27÷31) when floods of smaller intensity occurred on some rivers located in the Southern and Western part of the country. 2.2.2 The Danube River 2005 stream flow:
• 6340 m3/s eq. 199,93824 km3 /year at Bazias - the entrance in the country- 115.9% against 2004 average flow at the same cross section
• 8700 m3/s eq 274,36320 km3 /year at Isaccea - the entrance in the Danube Delta-133,23 % against 2004 average flow at the same cross section
• Total volume discharged in the Black Sea via Danube Delta in 2005, approximately 274,36320 km3, irrespective was about 132,54 % against multiannual flow =207 km2
Regarding the Danube river, in The Iron Gates reservoir section, the water discharges exceeded the normal monthly values in March, April, May, July, August, September, October and December (110-156%). The Danube had a special evolution during spring time, when average discharges exceeded the normal values and the following maximum discharges were recorded: 12500 m 3/s in March, 12900 m 3/s in April and 10800 m 3/s in May. From the second decade of March until the end of May on the Romanian course of the Danube River, the FLOODING levels were exceeded, especially between Gruia and Braila gauging stations because of the constantly growing incoming waterse and released discharges from the Iron Gates Reservoir. The ATTENTION levels were exceeded in the first decade of June at Zimnicea, Oltenita, Cernavoda, Harsova, Braila and Tulcea gauging stations. In July and August the exceeding of the ATTENTION levels at Isaccea gauging station were determined by the great incoming discharges from the Siret river. The lowest values of water discharges were recorded during 14-20 of November, (2900 m3/s), which were the lowest values over the entire year.

WMO/GWP Associated Programme on Flood Management
8
These low discharge values coming in and out of the Iron Gates reservoir caused levels beneath the lowest water level necessary for navigation (with 4-50 cm) beginning from the 8th of November on the Gruia, Calafat and Giurgiu gauging stations and lasted until the end of the month.
Danube River - Entrance in Romania (Bazias section)
0
2000
4000
6000
8000
10000
12000
14000
I II III IV V VI VII VIII IX X XI XII
Month
Dis
char
ge (m
3 /s)
2005 Mean Monthly Values Mean Multiannual Values 2005 Maximum Daily Values
2005 Minimum Daily Values Multiannual Mean Monthly Values
Figure 6. Discharges at entrance in Romania of Danube River 2.2.3 Situation of damages caused by floods in and hazardous meteorological phenomena during 2005 Source: Central Commission for the Defence against Flooding, Hazardous Meteorological Phenomena and Accidents at Hydrological units, Permanent Technical Secretariat, Ministry of Waters and Environmental Protection General total: 5975201, 5 thousands RON Counties:42 Localities:1734 Population: 76 persons dead 93976 houses and annexes 652763,8 thousands RON 656392 ha agricultural land 734239,7 thousands RON 1063 social-economic units 147945,6 thousands RON 90394 fountains 12781,8 thousands RON dead animals 1759,9 thousands RON Infrastructure 560,4 km of national road 948526,4 thousands RON 9860,63 km of county and commune road 1244398,0 thousands RON 2465,84 km of streets 158329,1 thousands RON 2644,9 km of forest roads 61250,2 thousands RON 23,8 km railroad 177715,9 thousands RON 9113 small and large bridges 461286,6 thousands RON 630 hydrotechnical units 1100571,9 thousands RON water supply network 23429,2 thousands RON electrical networks 69823,8 thousands RON

WMO/GWP Associated Programme on Flood Management
9
gas pipes 32262,0 thousands RON sewerage networks 83407,2 thousands RON other damages (land slides) 64710,2 thousands RON Regarding the Danube river in The Iron Gates reservoir section, the water discharges exceeded the normal monthly values in February, March, April, May, October, November and December and they were situated between 77-94% during the rest of the year. The lowest values of water discharges were recorded in July, August and September and they were situated under 90% from the normal monthly values. The peak discharge of 10800 cm/s was reached in April, when the maximum mean monthly value of 9660 cm/s occurred. During this month, on the Danube Romanian territory, the peak discharges over 9500 cm/s recorded beginning with the 13th of April, determined the exceeding of flood and warning levels at almost all the gauging stations, except of Calarasi, Fetesti, Galati and Tulcea. Flood levels were exceeded at Calafat, Bechet, Corabia and Turnu Magurele gauging stations with 0-39 cm and warning levels were exceeded, with 0-80 cm, at the following gauging stations: Gruia, Zimnicea, Oltenita, Cernavoda, Harsova, Braila and Isaccea. The warning levels exceeding also maintained during the first decade of May at the following gauging stations: Gruia, Calafat, Bechet, Corabia, Tr.Magurele, Zimnicea, Cernavoda, Braila and Isaccea. The lowest values of water discharges were recorded in September and the lowest one reached 2300 cm/s, the lowest value of the entire year. These low discharge values coming in and out the Iron Gates reservoir caused levels under the lowest water level necessary for navigation (with 3-80 cm) in the last two decades of September on the sector between Gruia and Harsova gauging stations. At present, only some large river basins in Europe are provided with warning systems against flooding, one of them being the Danube and which was created at the transboundary level in the frame of ICPDR. In many cases, these are not directly accessible to the public. The main reason for the absence of such systems in smaller basins is the lack of certain prediction criteria designed for these sub-basins. Flash floods that occurred in small basins have either been subsumed under regional floods affecting wider-spread regions, or assumed to have been triggered by highly powerful local storms. Steep terrain, excessive previous rainfall and thin soils all amount to create favorable conditions for flash flooding. Therefore, early flash flood warning systems need to be implemented in all regions that are prone to such floods. Though local systems (such as ALERT systems) can provide quick warnings in due time, they must be implemented catchment by catchment and are therefore cost - prohibitive when implemented regionally. In Romania, a project named DESWAT is under enforced process throughout the whole country, in order to provide flash flood guidance The system is designed to generate a suite of products as an additional tool to help forecasters make rapid evaluations as to the threat of rainfall-induced flash floods. DESWAT FFG will be able to give the warning in real time. Computations of the flash flood guidance estimates will be operated alongside all the necessary input (radar rainfall, rain gauge

WMO/GWP Associated Programme on Flood Management
10
rainfall, air temperature), with data updates every 3 hours. So far, the DESWAT project is still in a developing and implementation stage and the rural areas are gradually being covered. The main purpose of the above-named project is to devise and adapt a flash flood warning system accessible to the general public, for the Upper Teleajen Representative Basin (Cheia). This is also one of the goals of the GWP/NIHMW - WMO joint project, “Forward Integration of Flood Warning in Areas Prone to Flash Floods”, which comes as a continuation of the 2005 “Study into the history of floods in view of an integrated flood management”. 3. OBJECTIVES & TASKS Listed below are the objectives that we have set out and tried to accomplish during the project persiod: Objectives:
• Develop a local flash flood warning system in selected river basins, which can be used to provide accurate flash flood forecasts and warnings based on telemetry data, grid-based meteorological data as radar imagery, satellite imagery and meteorological models coupled with the hydrological models,
• Enable local-municipalities/communities to establish an integrated flash flood management system in selected river basins, by actively involving community/local stakeholders participation
• Elaborate preparedness plans at community level and experimentally implement them in a pilot area involving the legal resources available as well as the local stakeholders
• Raise citizens awareness concerning the risk of flooding and possibilities of decrease the damages and causalities
Tasks:
• Task 1: Description of the Cheia basin (including socio-economic aspects) - Sensibility of the areas, research work. Main activities: Description of the Cheia basin Analysis of existing meteorological and hydrological data from the local measurement
network
• Task 2: Gathering data for the rainfall-runoff model from the local monitoring network already built in the Cheia region. Model implementation Main activities Application of the model, using historical measurement data from the local network Threshold values check-up (water levels) in view of deciding whether the city’s crisis
intervention forces need to be warned
• Task 3: Preparing and implementing the warning procedures for the Cheia village inhabitants as well as tourists Main activities: Analysis of flood hazards and their causes for the Cheia village Analysis of existing county, municipal and village warning mechanisms Preparation of concept towards mitigating flood damage for Cheia, including a
warning-response system Implementation of a warning system for the Cheia village:
- Preparation of competency areas division procedure, concerning warning of inhabitants between county and municipality (agreement)
- Survey concerning flood risk perception by the inhabitants of the Cheia village

WMO/GWP Associated Programme on Flood Management
11
- Analysis of already existing less formal means of communicating crisis situations to the Cheia inhabitants, as alternative methods (other than the telephone) for disseminating warnings.
- Preparation and testing of warning and response procedures based on telephone alarm system in use at the county office, and on previous practice (among other things, devising a database with the inhabitants’ telephone numbers, as well as those of flood plain users and hotel owners, alongside information updating procedures).
• Task 4: Prepare a concept and test an education and training program meant to improve flood plain inhabitants’ and users’ knowledge/awareness concerning the hazard and loss diminution methods (including the warning system operation) Operations concern two groups of addressees: adults and children The following actions will be taken: Preparation of an educational program targeted to school children and adults living in
Cheia Preparation of brochures, flyers, posters and some other brochures for tourists
concerning the hazard, warning system and methods for individual loss diminution Actual testing of the educational program (execution in practice)
• Task 5: Disseminate experiences drawn from the project in other areas prone to flash
flooding Experiences from the project would be addressed to other communities that experience this kind of problems. The proposed scope of work includes: - Presentation and discussions among the county’s mayors on the basis of experiences
drawn from the project, in view of implementing the same tools and prepared action methods in other municipalities as well.
- Organization of workshops for the locals, devoted to the issue of building a local flood damage diminution plan
- Preparation of a brochure (print and CD version) concerning experiences from the project in the area (dissemination of these experiences in other counties in Romania)
- Dissemination of the brochure via the GWP Romania web page
• Task 6: Project coordination Among the tasks of coordination, the following can be listed: - Supervising the proper flow of the project process, according to designated aims, tasks
and schedule - Preparing financial and content reports concerning the work To ensure performance of other operations essential to obtain a satisfactory effect from the project further discussions will be needed between the mayor of Cheia and a member of the Local Committee for Emergency Situations. The project is financially and in terms of IWRM principles application coordinated through GWP Romania.
The scheduled duration of the project: 1st November 2005 - 30th June 2006. The coordinator and beneficiary of the Forward Integration of Flood Warning in Areas Prone to Flash Floods project is:
• World Meteorological Organization (WMO), overall coordinator of the project components in three countries, namely Poland, Romania, and Slovakia. Responsible force for water and environmental development policy and strategy. It imposes the rules according to the bilateral agreements in water problems. The project component is undertaken within the framework of the WMO/GWP Associated Programme on Flood

WMO/GWP Associated Programme on Flood Management
12
Management (APFM), under Letter of Agreement between WMO and the Association Global Water Partnership Romania. The APFM promotes the concept of Integrated Flood Management, i.e. flood management within the context of Integrated Water Resources Management.
• Association Global Water Partnership Romania (GWP-Ro) – coordinator of the project
component in Romania. It is an institution dealing with the facilitation of water resources management and environmental issues, based mainly of Integrated Water Resources management - IWRM principles, including flood prevention, political interfaces and control studies, wetland conservation, economic instruments, flood plain economic evaluation and so on. GWP-Ro is equally responsible for ensuring a fruitful collaboration between NIHMV and WMO.
• National Institute of Hydrology and Water Management (NIHWM) is the national
institution responsible for the implementation of a unitary methodology measurement, data collecting and processing, hydrological forecasting and prevention during dangerous meteorological situations. This task is aimed to ensure a good dissemination of data to multilevel authorities.

WMO/GWP Associated Programme on Flood Management
13
4. RESULTS OF TECHNICAL DEVELOPMENT The technical aspects and results are presented for each approved tasks of the project in conjunction with the points agreed within the regional workshop to be part of the national final reports
The project’s main objective through this task is to accurately describe the pilot area, Upper Teleajen Representative Basin (Cheia), which has been chosen for implementing this particular project, alongside a description of the intervening factors that alter the flow and the area’s propensity to flash flood flooding. 4.1 Description of Upper Teleajen Representative Basin (Cheia) and the hydrographical network
Figure 7. Location of the Upper Teleajen Representative Basin (Cheia) The Upper Teleajen Representative Basin (Cheia) is located in the Southern part of The Eastern Carpathians (the Curve group), close to the spring of the Teleajen river, the main affluent of Prahova (figure 1). The basin, with a surface of 41.3 sq km, lies on the Southern side of the Ciucaş Mountains and its border is situated at approximately 250 m downstream from the confluence of the Cheita and Tâmpa streams, whose joining forms the Teleajen river itself (Figure 7.). Access to the basin is facilitated due to the modernized national road connecting Vălenii de Munte to Braşov via Cheia, which makes a detour around the eastern edge of the depression, reaching afterwards the region above the Cheiţa canyon and leaving the basin behind at the Bratocea pass. There is a slip road that traverses the Cheiţa Valley, cutting across the depression through the village of Cheia and ending right at the entrance of the canyon.
TASK 1: Description of the Cheia basin (including socio-economic aspects) - Sensibility ofthe areas, research work.

WMO/GWP Associated Programme on Flood Management
14
The Basin consists of 8 smaller basins (or sub-basins), each with a surface of 1.51 to 21.0 km2 (table 1) Table 1.Physico-geographical characteristics of the sub-basins in the Cheia representative basin
S E Slope Name of river
Gauging station
Establishmentyear Km2 m ‰
Cheita Cheia 1975 21 1320 0.397 Cucu Cheia 1975 1.2 1096 0.201 Gropşoare Cheia 1995 8.82 1290 0.376 Zăganu Cheia 1995 2.87 1073 0.182 Baicu Cheia 1995 1.18 1004 0.042 Tampa Cheia 1975 13.9 1213 0.27 Ciobu Cheia 1975 1.78 1085 0.292 Teleajen Cheia 1975 41.3 1263 0.339
The hydrographic network is made up of the two main creeks, Cheiţa and Gropşoare (Tâmpa), as well as several minor tributaries (figure 8.). Even though their source is at a height of 1,500 – 1,600 m, under the plateau between the two peaks of Ciucaş and Gropşoare, the springs themselves are located much lower, at about 1,350 m. This is due to the thick layer of conglomerates, especially of the permeable type, which generally cause the lack of water resources at high altitudes on the Ciucaş Mt. The springs occur on precise alignments, following the conglomerates’ contact with the impermeable rock existent in the base. While the Gropşoare Valley descends quickly from under the Roşu Mt, to meander for some time along Cheia depression towards the confluence with Cheiţa, the latter has a somewhat more complex path. At the beginning, it flows down through a deep and narrow valley, between the Roşu Mt and the Bratocea peak; then, it penetrates the little erosion basin form Podu Berii (the name that Cheiţa bears upstream), where its river bed forms quite a thick alluvial sheet; leaving this little basin, it enters the wild, narrow and approximately 1 km-long canyon between the Grohotiş Mt (Babeş) and the final spur of the Roşu Mt. (the Balaban Mt). Once in the Cheia depression, the valley becomes increasingly wider, especially to the left, where the two terrace levels of Cheiţa are very well developed. The closing section is located not far from here, upstream from the confluence with the Gropşoare creek.

WMO/GWP Associated Programme on Flood Management
15
Figure 8. The hydrometric network of the representative basin Cheia 4.2 The physic-geographical parameters, (relief, geological structures, slopes, elevation, land cover) characteristics of the Cheia representative basin 4.2.1 soil vegetation coverage Due to the existing lithological variety, the soil coverage displays a significant diversity. At the forestry layer, the brown-acid soil and the ferri-illuvial soil are predominant, while towards the Cheia depression, the brown and eu-mezobaic ones are most prevalent: throughout the depression, along the valleys of Cheiţa and Gropşoare alluvial soils start to appear, with a wider occurrence in the confluence area. Above the forestry level, the brown ferri-illuvial soils appear more predominantly, often also associated with humico-sillicate ones, generally characteristic of meadows. Very often also, rendsins are to be encountered, as well as litho soils on the steep and rocky sides of the Ciucaş and Zăganului Mt. In this basin, the forest covers approximately 67% of the total surface; the Southern part is especially rich in beech as well as mixed-type forests, which spread across 42% of the basin’s whole surface. These are situated at altitudes of 850-1,400 m, and there are places (such as the eastern side of Cheiţa and large areas belonging to the Cucu and Gropşoare basins) where the beech is encountered in compact clusters. Coniferous forests are also present, in the form of narrow bands, at an altitude of 1,500 – 1,600 m, but below this altitude their number decreases on the Western and shadowed side of Cheiţa, and they appear only in isolate clusters in the depression of Cheia. The meadows, representing 38% of the basin’s surface, generally appear at over 1,450 m altitude in the Grohotiş Mts, where however they only come second. Figure 9 (table 2.) clearly depicts the flora variety in the basin.

WMO/GWP Associated Programme on Flood Management
16
Figure 9. Upper Teleajen Representative Basin (Cheia). Vegetation structure
Tabele 2. Lithology and vegetation coverage of the basin’s soil
F H vegetation
Name of River Hydrometric Station km2 m Vegetation structure Forresting
coefficient
Predominant lithology
Cheita Cheia 21 1320 Coniferous, deciduous, mixed type forrests, subalpine meadows
65 Conglomerate,gritstone
Cucu Cheia 1.2 1096 Deciduous forrests 100 gritstone
Gropsoare Cheia 8.82 1290 Mixted and deciduous forrests, secondary and subalpine meadows
71 Conglomerate,gritstone
Zaganu Cheia 2.87 1073 Mixted and decidious forrests, subalpine meadows 95 Conglomerate,gritst
one
Baicu Cheia 1.18 1004 Mixted and deciduous forrests 80 Gritstone, marl, clay
Tampa Cheia 13.9 1213 Coniferous, deciduous, mixed type forrests, subalpine meadows
65 Conglomerate gritstone, marl, clay
Ciobu Cheia 1.78 1085 Mixted and deciduous forrests, subalpine meadows 81 Gritstone, marl,
clay
Teleajen Cheia 41.3 1263 Mixted and deciduous forrests, secondary and subalpine meadows
62 Conglomerate, gritstone, marl

WMO/GWP Associated Programme on Flood Management
17
4.2.2 geology The Cheia basin is situated in an area where the internal flysh is maximally extended, consisting almost entirely of elements of the Ceahlău Sheet (V. Mutihac, 1968). Within the latter, the most wide-spread are polygenous conglomerates dating back to the Albian age, with sandy cement (Zaganu conglomerates), arranged in a thick layer of 5-600 m, in which a great number of limy klippe are fixed.
Figure 10. Upper Teleajen Representative Basin (Cheia). Geologic map
These conglomerates are displaced on less erosion-resistant structures, made up of sandy flysh, with intrusions of marly slate, as well as marly lime and granular limestone (Sinaia layers). They make up the Southern part of the basin. This entire complex sediment cluster causes anticline and syncline saddles or folds, both faulted and tectonically heightened, thus forming a suspended synclinal; this is underlined by means of a series of structural forms, such as the Zăganu cueste. Figure 10. (table 2.) depicts the basin’s simplified geological map, function of the predominant structures.

WMO/GWP Associated Programme on Flood Management
18
4.2.3 relief The Southern side of the Ciucaş Massif is made up of two long peaks, over 1,700 m high. They are divided by a long saddle, which has the aspect of a slightly wavy elevated plane, displaying some erosion evidence (the Chiruşca Platform, dating back to the Myocen, similar to the Râu Şes level). In the West, there is the oblong ridge of Bratocea, with the highest peak, Ciucaş, at 1,954 m. South of the Bratocea pass, at 1,263 m, it is followed by the lower and somewhat more round-off summit of the Grohotiş Mts (1,500 – 1,700 m); The second Southern peak of the Ciucaş Massif, whose ridge has a cogged appearance, is the Gropşoare-Zăganu peak (1,883 m), which extends towards the South into the lower Buzianului peak, at an altitude of 1,224 m, in fact a saddle reaching out to the Clăbucet Massif (1,460 m). In between these two summits are the valleys of Cheiţa and Gropşoare, kept apart by the feet of the Roşu Mt.
Figure 11. Upper Teleajen Representative Basin (Cheia), Terrain Digital Model (TDM)

WMO/GWP Associated Programme on Flood Management
19
4.2.4 altitude The primary characteristics of the relief are revealed by the differentiated erosion processes that have affected the existing conglomerates and limestone, and which helped generate a highly picturesque residual relief (Tigăile, Sfinxul Bratocei, Colţii Zăganului, etc.). It is furthermore enhanced by the intensity with which the periglacial processes occur at over 1,700 m, in the presence of stony ridges. The Cheia basin stretches between altitudes of 865 to 1,954 m, with an average of 1,263 m. Due to the presence of the Cheia depression, the most wide-spread surfaces display hypsometric steps of under 1,200 m. The relief energy displays differentiated values. In the Northern half of the basin, corresponding to the Ciucaş Massif, the fragmentation depth depicts values of 700 to 800 m; in the Southern part, along the Cheia depression and its Southern margin, made up of the Grohotiş and Buzoianu Mts, it seldom exceeds 300-350 m. 4.2.5 basin slope The relief fragmentation density equally displays different values. In the Northern half, the wide slopes – which are almost entirely de-forested – have allowed the abundant development of flood organisms, whose density may reach 2.4 – 2.6 km/km2, and even 3.0 km/km2 in isolated cases, fact which would indicate an intense relief fragmentation. In the depression, the fragmentation density is less than 1.0 km/sq. km. As far as the slopes are concerned, the Cheia basin displays extreme cases. In the Northern part, the slopes are quite steep, over 25-30°. Abrupt surfaces have quite a significant spreading, especially on the ridge of Zăganu. In the Southern half, the mountains display much steadier slopes, generally of 15-20°. The least steep slopes are to be encountered in the Cheia depression and on the erosion level at 1,500÷1,600 m (the Chiruşca platform and the Grohotiş peak), with values of under 5°. 4.2.6 climate The Upper Teleajen Representative Basin (Cheia), located in the Southern part of the Curve Group (at the junction of the Eastern and Southern Carpathians), obviously lies in a transition area. It is affected both by oceanic influences coming from the North-West, and forced advections of the relatively humid air from the South-West, from the Mediterranean Sea. Thus, when the North-West currents are predominant, foehn phenomena consequently occur which causes the snow cover to be quite unstable during some winters. When, on the contrary, the air comes from the South-West, its forced ascension unto the Southern mountainside generates strong connective advections, which trigger heavy rainfall with torrential features. 4.3 Presentation of the Cheia touristic area. Socio-economic considerations The village of Cheia is encompassed within the Măneciu commune, the only settlement in the area, which was granted the legal status of tourist resort. However, Cheia has also been acknowledged as a local interest tourist resort. It is a very picturesque spa, where people can come for a rest at any time of year, situated within the Măneciu commune, in Prahova County, on the banks of the Teleajen River and within the depression bearing the same name. It lies at the feet of the Ciucaş Mt, in the Eastern Carpathians, 61 km north of Ploieşti. The climate of the area is typical of such mountainous depressions, displaying tonic and stimulative features, highly ozonized. The summers are generally cool (the average temperature in July is 16ºC) and the winters are quite mild (the average temperature in Janaury is -4ºC). The average annual temperature is ~ 6ºC, and the average rainfall amount range 750-800mm per year. The resort is the perfect spot to relax and have a rest.

WMO/GWP Associated Programme on Flood Management
20
There is a telecommunications center and a satellite television transmission relaying, which has been into operation since December 19th 1991. Next to the houses of the 350 inhabitants or maybe more, the resort boasts of several guesthouses, inns, hotels and restaurants, all of which readily offer favorable conditions for touristic development. The locality’s infrastructure consists of over 12 km of road, which links it to the main touristic spots of the area. The streets are rectangular displaced, so that they facilitate easy access into the built-in areas. Most outside traffic is conducted on the DN 1A national road, which makes a detour around the resort, thus relaying local traffic to the existent inner roads. The locality’s economic potential mostly relies on its‚TOURISTIC OFFER’, at the basis of which are the following factors:
• High services and accommodations standards • The existence of architectural, memorial and historical sites, which constitute a constant
tourist attraction • The existence of spots and spaces adequate for hosting a wide range of meetings, business
or otherwise, as well as symposia and conferences Accommodation places:
• 2 hotels • 28 pensions • 2 motels • Accommodation at locals
On the tourist resort Cheia there are 4 restaurants with of 350 places and coefficient of utilization until 80% plus tourist pensions. According to last evidences of local administration annually the Cheia resort is visited by 23000 tourists among witch 2.5% are foreigners. The landmarks in Cheia village are: Cheia Monastery (1770) and Upper Valley Teleajen Museum, subsidiary of Ploiesti Museum.

WMO/GWP Associated Programme on Flood Management
21
Age groups
11%
14%
19%
14%
13%
10%
11%
8%
10 years old
10 – 20 ani
20 – 30 ani
30 – 40 ani
40 – 50 ani
50 – 60 ani
60 – 70 ani
beyond 70 years
Occupations of distribution
27%
26%15%
10%
22%
industry
construction
transports and communications
education, public administration, social security
others
Activity
12.30
24.70
0
10
20
30
employers (%) pupils (%)
A few demographic and social elements:
4.4 GIS-Info layers and derived thematic products With the help of information extracted from the NIHWM database, as well as the territorial info we have managed to gather form the Hydrological Station in Ploieşti, we have drawn the maps, using GIS software package ArcGis 9.0:
• the hydrometrical network • the rain station network • the geological structure • the land covering • areas prone to flooding
and as a result of the analysis made using Spatial Analyst and Hydrology Modeling extensions the Digital Terrain Model (DTM) has been obtained (Figure 12.). The Digital Terrain Model (DTM) has been performed using topographical maps 1:5000 and 1:25000 by digitizing the contour lines and the known elevations. Another info – layers have been added in order to apply flood simulating scenarios. The info – plan of the hydrographical network, has been achieved for the Upper Teleajen Representative Basin (Cheia).
Task 2 Gathering data for the rainfall-runoff model from the local monitoring network already built in the Cheia region. Model implementation
WMO/GWP Associated Programme on Flood Management
22
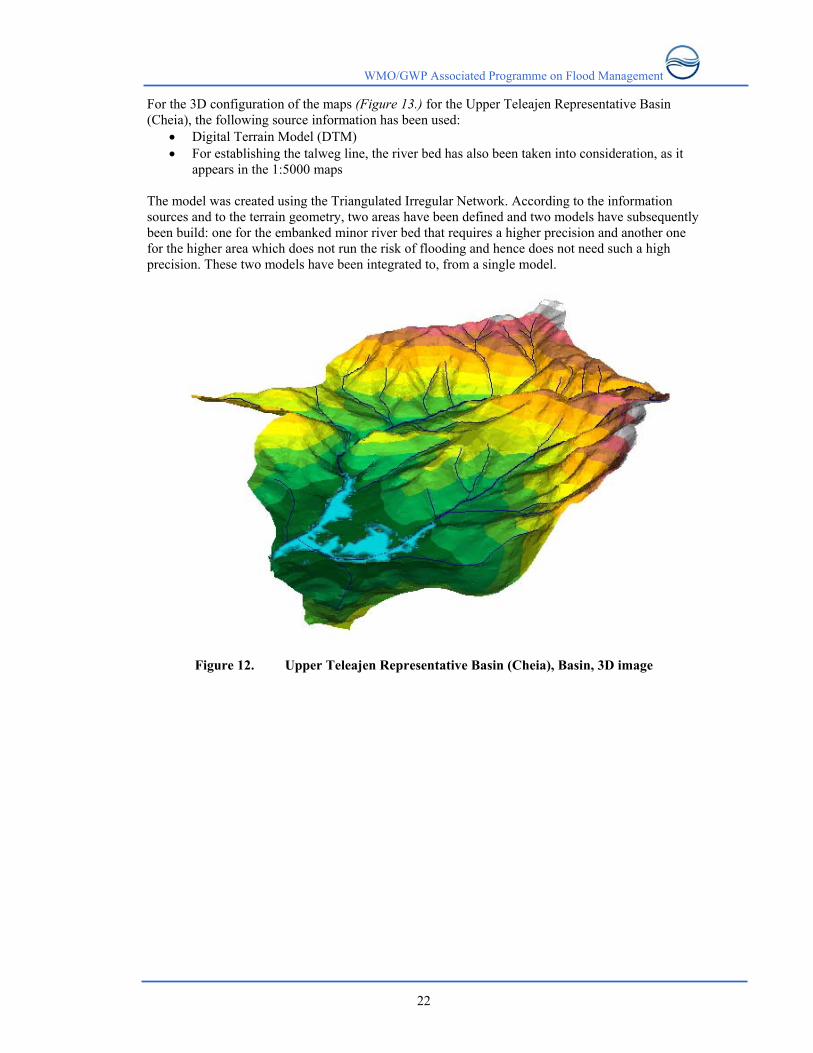
For the 3D configuration of the maps (Figure 13.) for the Upper Teleajen Representative Basin (Cheia), the following source information has been used:
• Digital Terrain Model (DTM) • For establishing the talweg line, the river bed has also been taken into consideration, as it
appears in the 1:5000 maps The model was created using the Triangulated Irregular Network. According to the information sources and to the terrain geometry, two areas have been defined and two models have subsequently been build: one for the embanked minor river bed that requires a higher precision and another one for the higher area which does not run the risk of flooding and hence does not need such a high precision. These two models have been integrated to, from a single model.
Figure 12. Upper Teleajen Representative Basin (Cheia), Basin, 3D image

WMO/GWP Associated Programme on Flood Management
23
Figure 13. Digital Terrain Model, flooding simulation
4.5 Analysis of existing meteorological and hydrological data from the local measurement network The philosophy discussed and promoted for the Warning system in the Cheia area for flash flood situations in the local context:
Needs to be solved Activities Results The cognition of the hydro-meteorological situation: - Rain gauging stations - RADAR
There is a project launched for the installation of about 500 automatic gauging stations Nowadays there are 8 Doppler- type meteo-RADARS functioning in the country
DESWAT FFG –will be capable to give the warning in real time
Technical possibility for the warning: - telephone - alarm system
Plans for development of local actions plans for warning using existing technical and human resources
Telephone company capacitated for this function Existing volunteers fireman’s organised for warning of peoples without phone connections
At the 8 gauging stations throughout the Cheia basin, the following hydrological data are recorded on a permanent basis:

WMO/GWP Associated Programme on Flood Management
24
• the water level (twice a day at hydrometer 7h / 17h – winter time, 6h / 18h – summer time, exception made during the flood periods when the readings are made hourly or even more often )
• amount of precipitations (rainfall recorder) • water temperature (water thermometer, morning and evening, exception made during the
freezing periods when the frequency is higher at the snow melting point) The liquid discharges are calculated function of the level measurements. The suspended alluvium discharges are calculated only during periods when the level increases at the basin closing station that is the Cheia gauging station, and Teleajen respectively. During intense rainfall, the alluvium deposited onto the river bed, the waste existent in the region, as well as other types of drift deposits are washed away and consequently the water quality can be extremely deteriorated (table 3.) Table 3. Multi-annual mean monthly rainfall, liquid discharges and suspended alluvium discharges Cheia gauging station, Teleajen river I II III IV V VI VII VIII IX X XI XII Multi-annual mean monthly rainfall 1975 - 1995 32,8 36,1 34,5 57,0 113,3 145,6 111,5 85,3 59,5 56,0 58,5 46,6 Multi-annual mean monthly liquid discharges 1975 - 1995 0,481 0,499 0,849 1,28 1,23 1,27 1,03 0,749 0,614 0,521 0,582 0,627 Multi-annual mean monthly suspended alluvium discharges 1975 - 1995 0,007 0,008 0,091 0,101 0,255 0,389 0,081 0,030 0,028 0,015 0,025 0,048
Maximal liquid discharges ( m³/s ) with overcharge possibilities
0,5 % 1% 2% 5% 10% 149 124 98,0 67,9 46,9
The data basis also comprises:
• cross section profiles • daily, monthly and annual mean discharges • daily, monthly and annual mean suspended alluvium discharges • turbidity
For the 8 component sub-basins, the geological resistance index is known (RG), as well as the vegetal protection index (PV), and the erosion resistance one (RE). The values are depicted in table no.4.

WMO/GWP Associated Programme on Flood Management
25
Table 4. (RG), (PV) and (RE) values for the component sub-basins of the Upper Teleajen Representative Basin (Cheia)
Nr. crt
Name of sub –basin Gauging station
S (km²)
E (m) RG PV RE
1. Cheiţa - Cheia 21.0 1320 7,1 5,5 16,6 2. Cucu - Cheia 1.20 1096 6,1 8,0 17,2 3. Gropşoare – Cheia 8.82 1290 6.8 5.7 16,2 4. Zăganu – Cheia 2.87 1073 6,9 6.1 17.0 5. Baicu – Cheia 1.18 1004 6,0 7,2 16,1 6. Tâmpa – Cheia 13.9 1213 6,7 5.9 16,3 7. Ciobu – Cheia 1.78 1085 6,3 7,0 16,7 8. Teleajen – Cheia 41.3 1263 6.7 5.2 15.3 Taking into account the fact that the area has a somewhat limited surface (the closing section’s surface is of only 41,3 sq. km), the geological resistance index values do not differ greatly, allowing for two situations: on the one hand, the average altitude sub-basins have been formed into the conglomerate structures of the Zăganu sheet, which are rougher, therefore presenting a higher-value, of over 6.5; on the other hand, the lower altitude sub-basins, formed into somewhat softer structures (mixtures of grit stone, marl and clay), characteristic of wildflysh, display RG values under 6.5. Even greater differences in value can be observed in the case of the vegetal protection index (PV), due to the type of vegetation and the way it is spread across the sub-basins. Thus, in the areas where the beech and the mixed-type forests are more predominant, PV has significantly high values, over 7.0, while in the case of the sub-basins where the lawns and meadows are predominant, PV registers lower values, of under 6.0. The RE values are quite close, varying between 16.1 and 17.2. Only the closing section has a lower value of 15.3, due to the fact that the lower section of the basin is fraught with alluvium deposits on top of which secondary lawns have developed (such as the village’s cattle run) The multi-annual mean specific suspended alluvium runoff has values, which range between 0.80 t/acre/year at the Cucu gauging station and 1.02 t/acre/year at the Baciu station. If we convert them into multi-annual mean suspended alluvium discharge (R, kg/s), by means of the R = r x F/315, 6 formula, the resulting values will be as follows: For the Cheiţa hydrographic station 0.063 kg/s, for the Cucu station 0.003 kg/s, for the Gropşoare station 0.028 kg/s, for Zăganu 0.008 kg/s, for the Baicu station 0.004, for Tâmpa 0.044 kg/s, and finally for Ciobu 0.005 kg/s. At the Cheia hydrographic station, on the Teleajen river, at the closing section, where the alluvium measurements are generally conducted, the multi-annual average value of R during 1975 – 2004 is of 0.139 kg/s, which means that over the same period of time, the average specific runoff value has been of 1.06 t/acre/year. We can therefore predict that it is possible to use the relation between the resistance index RG and the basin’s average altitude, or with the suspended alluvium specific runoff r, in order to evaluate quantitatively the alluvium runoff potential in small basins, but only for areas displaying the same physico-geographical features. On June 19th 1985 great floods were registered, with a rainfall value of 168.4 mm, and then again later on, on June 6th 1994, with a value of 132.0mm. Such rainfall has caused significant floods in the localities situated in the Cheia basin, as well as in the village of Cheia itself. The mean maximal

WMO/GWP Associated Programme on Flood Management
26
discharge at the Cheia gauging station is of 17.4 m3/s, to which another value corresponds, namely 0.447 m3/s⋅km2, representing the specific maximal discharge. The 1% discharge is of 150 m3/s. 4.6 Floods characteristics and methodologies for their estimation In the case of small-surface hydrological basins (F < 100÷200 km2) the time of response to rain is very short (from 15 minutes to a few hours) making the use of hydrological modeling impossible. In this case, the real warning insurance imposes a quick evaluation of the precipitation amounts provided by automatic stations, corroborated with the radar information and the comparison of these precipitation values with different critical precipitation thresholds associated with the pre-established attention (or risk) levels. Through this study, a simple warning method is carried out, allowing more anticipation time when flash floods occur in these basins. The connection between the precipitation thresholds, leading to the reaching/exceeding of attention levels in the sections controlling small basins with torrential regime, can be established by correlating the characteristics of high flood with its triggering factors. On the basis of these correlations, there can be pre-established thresholds of the precipitation characteristics (amount, duration, etc.), which can cause flash floods. When these pre-established values are operatively forecast or recorded, warnings are immediately released to decision-makers, allowing them to estimate the gravity and risk of the event. This study aims to establish some relations between maximum discharge and the characteristics of precipitation recorded at Cheia Rain Gauging Station on the Teleajen River. The advantage of this method consists on the one hand in releasing earlier warnings (immediately after recording the rainfall), and on the other hand, the information from a single rain gauging station can be used as warning information for a larger area (for which it is representative) and which can cover the basin surface of several rivers.The selection of rainfall - runoff events for the analyzed section was made in several stages. In a first stage, all the high floods whose maximum discharge exceeds a certain value were selected. If, after applying this first criterion, the number of events significantly reduced, high floods with lower maximum discharges have been also selected so that, for each section, at least 15-20 rainfall – runoff events should be analyzed. At the same time, in order to determine the runoff volume, when selecting the rainfall – runoff event, it was also taken into account that the fact that the selected high floods should fulfill all hydrometrical conditions. In order to estimate the amount and duration of the triggering precipitation, another criterion taken into account was that exclusively rainfalls should cause the selected high floods. The amount and duration of the triggering precipitation were calculated starting from the rainfall recorded by the rain gauge in the Cheia Basin. The events considered for each analyzed high flood are the following:
• maximum high flood discharge maxQ (m3/s) • depth of runoff hs (mm)

WMO/GWP Associated Programme on Flood Management
27
• depth of rainfall, hp (mm) • rainfall duration Dp (h); • previous humidity Ui (mm) • basic discharge Qb (m3/s)
The depth of runoff, hs(mm) and the maximum high flood discharge maxQ (m3/s) are determined from the high floods analysis (Figure 14.).
Figure 14. Elements characterizing the maximum flow The depth of rainfall and the rainfall duration Dp (h), triggering the high flood, were estimated after analyzing simultaneously the high flood and the hourly distribution of the triggering rainfall recorded at Cheia Rain Gauging Station, on the Teleajen River. The previous humidity Ui (mm), representing soil humidity when a high flood occurred, is a characteristic feature more difficult to be estimated. The soil humidity is usually characterized by a soil humidity index, depending on the precipitation amount existing before the high flood occurrence in a given interval. The specialized literature proposes different formulas to calculate this index. Some of these methods are based on totalizing daily mean precipitation per basin, for a certain number of days (which differs from one method to another) eventually, with a certain weight, which decreases in value as the time up to the beginning of high flood, increases. Another method is that of mass balance, a method estimating the water amount kept by the soil in the given interval, as the difference between mean precipitation amounts per basin, depth of runoff and evapotranspiration. From the point of view of the physical processes, which are produce in a hydrographic basin, this last method is the closest to reality, but it is hard to work with in the usual forecasting practice. The simplest method is that of totalizing the daily precipitation amounts recorded before the high flood occurrence. It was noticed that when building the relation between the depth of rainfall and the depth of runoff, the position of graph points does not follow a same strict rule with the previous humidity. Significant deviations are especially recorded in case of high floods occurring in April-May and beginning of June when, in most of the cases and particularly for the mountain basins, the depth of runoff not only originating from rainfalls but also from snow melting. At the same time, in the case of successive high floods, the soil humidity is not directly proportional to the sum of these
S
0123456789
0 1 2 3t
Q
maxsQ
bQ
W
SWhs =

WMO/GWP Associated Programme on Flood Management
28
precipitation amounts, which triggered the previous floods. As to the high floods occurred during the summer months, an important role in assessing the previous humidity is played by the evapotranspiration. In the attempt of adjusting these large deviations and at the same time not to complicate further the calculations, the following formula was selected for previous humidity (Simota & Mic, 1993) based on the balance method (2.1):
ENP)α1(U10
1iii ⋅−
⋅−= ∑
=
(2.1)
where discharge coefficient (α ) and evapotranspiration (E) follow a general assessing rule, established on the basis of some analyses of general behavior, while Pi is daily mean precipitation per basin. N is number of days without precipitation. Coefficient α is considered to be a function of ∑ iP (Table 5.), while E is a function of the high flood month (Table 6.).
Table 5. Coefficient α as a function of previous precipitation sum
∑ iP (mm)
<10 10÷30 30÷50 50÷80 80÷100 100÷140 140÷180 >180
1-α 0.7 0.6 0.5 0.4 0.35 0.3 0.25 0.25
Table 6. Assessing evapotranspiration according to high flood month month April May June July August September October
E(mm) 0.5 1 2 3 3.5 3 2 Also, during spring intervals when melting occurs, it is added 10-15 mm to previous humidity. Basic high flood discharge is considered to be the discharge when precipitation that brings about high flood begins. Figure 15. shows as an example the 16 June 1983 high flood recorded at Cheia rain gauging station as well as the precipitation from basin’s recording rain-gauge.
Figure 15. The Teleajen River - Cheia R G.S. – the 16 June 1983 High Flood
r. Teleajen, R. G.S. CHEIA, the 16 June 1983 High Flood
0
10
20
30
40
t (h)
Q (m
3 /s)
-30
-20
-10
0
p (m
m)
Qb = 1.3 m3/s

WMO/GWP Associated Programme on Flood Management
29
Forecasting maximum discharges in hydrographical basins of torrential behavior After analyzing the high floods and hyetographs of triggering rains, there were chosen as representative for the Upper Teleajen Basin (Cheia) the precipitation values recorded at Cheia R G.S. (the Teleajen River) (Figure16. and Table 7.). To determine the rain-gauging station that is representative for runoff in the Representative Upper Teleajen Basin (Cheia), when rainfall – runoff events were selected it was carried out an analysis of precipitation recorded by each rain gauging station’s recording gauges. The position of these gauges within the Upper Teleajen Basin (Cheia) is shown in Figure 16.
Figure 16. Rain Gauging Network, the Representative Upper Teleajen Basin (Cheia)
Table 7. The Representative Upper Teleajen Basin, Cheia R G.S. Characteristics of the 16 June 1983 High Flood and Precipitation
W hs Qmax Qb hp Dp Tcr (m3) (mm) (m3/s) (m3/s) (mm) (h) (h) PG 90000 2.18 22 1.3 24 34 7 The amount of triggering precipitation, hp (mm), and its duration, Dp (h), were calculated starting from figures provided by the selected recording rain gauge from the analyzed basin, the Upper Teleajen (Cheia). 4.7 Technological aspects of forecasts (including links between local and national level) Forecasting maximum discharges according to triggering factors To assess maximum discharge when triggering characteristics are known, it was employed the multiple linear regressions method. This consists of assessing a variable Y through a number of m other variables, called explanatory variables: X1, X2,Xm. Maximum high flood discharge can be expressed, as a function of high flood-triggering elements, thus:
εαααα ε⋅⋅⋅⋅⋅= ppCCCeQ .....210
21max (2.2)
where: Cj are explanatory variables, αj parameters to be assessed and ε a normalized error.

WMO/GWP Associated Programme on Flood Management
30
By applying logarithm to (2.2.), we can get the assessed value of Qmax, noted maxQ̂ , as follows:
εαααα +++= pp CCCQ log...loglogˆlog 22110max (2.3) where: α1 , α2 , …αm are regression coefficients, α0 is a constant, and ε is the assessment error. Finding out the regression coefficients was based on minimizing the mean square deviation between Qmax and its assessed value maxQ̂ :
( ) min Q-2
max =∑=
n
1imaxQ̂ (2.4)
n being the number of events used in calculations. The correlation between the various precipitation characteristics and those of its high flood was verified by calculating the correlation coefficient R2 (3.5). It shows the correlation between two sequences of values xi and yi. A R2 equal to 0 means no connection between x and y, the assessment being so much the better as R2 is closer to 1.
2
n
1i
2n
1ii
2i
n
1i
2n
1ii
2i
n
1i
n
1ii
n
1iiii
2
yynxxn
xxyxnR
−⋅
−
⋅−=
∑ ∑∑ ∑
∑ ∑∑
= == =
= == (2.5)
Calculating these correlations also shows how these characteristics, which produce maximum high flood discharges, are correlated between them. Another criterion taken into account when selecting explanatory variables was also that of simplifying these relations touching maximum discharge with a view to use them operatively. Thus, after carrying out the study, it was noticed that soil humidity when a high flood occurs is directly correlated with basic high flood discharge. Therefore, to obtain maximum discharge in this case, there were employed only three explanatory variables (precipitation, rain duration, and basic discharge), giving up previous precipitation, which needs entering daily precipitation into the program. To determine the suitable character of an explanatory variable Xi, partial correlation coefficients were calculated. They show how strong the connection is between the variable to be determined and one of the explanatory variables when the other explanatory variables’ influence is removed [Duband, 1978]. Taking as an example the partial correlation between Y and explanatory variable X1, assessment error from the relation defining multiple linear regression can be expressed as follows:
)aXa........XaXa(Y 0mm3322 ++++−=ξ
)bXb........XbXb(X 0mm33221 ++++−=ψ (2.6) Coefficients a and b have been calculated by the method of smallest squares. The coefficient of partial correlation between Y and variable X1 will be:

WMO/GWP Associated Programme on Flood Management
31
∑∑
∑
==
=
⋅
⋅=
n
1i
2i1
n
1i
2i1
n
1ii1i1
Xm,...X,X,Y 21r
ψξ
ψξ (2.7)
To know if an explanatory variable Xj is or is not significant, namely if it has a real contribution in determining variable Y, a Student test can be carried out on partial correlation coefficients. Having a dependent variable defined by m explanatory variables, it can be taken into account a partial coefficient θ, from which the influences of m-1 variables have been removed, whose distribution density can be written as follows [Michel, 1982]:
( )
−−
−⋅−−
−
⋅= 23mn
2n )1(
21mn
2mn
1)(g θΓ
Γ
πθ (2.8)
The transform variable )1/()1mn( 2θθ −⋅−− follows a Student rule with (n-m-1) degrees of freedom. Thus, if tp is the value corresponding to p% probability, there are p chances out of 100
to obtain ptt >⋅ or 1mnt
t2p
p
−−+>θ .
Taking into account an error margin of 1%, to have one single chance to err out of 100, considering that there is a connection between Y and variables X1, X2,…...Xm , the following is necessary to be:
1mnt/t 2 −−+>θ with = t 0.99.
If (n-m-1) >10, it will be chosen as limit value: ))2mn(7.6
)mn(1/(1 2
2
+−⋅−
+
For the analyzed basin, calculating partial correlation coefficients and limit values shows the weight of each characteristic of the four ones taken into account. A calculation aiming at optimum results for the analyzed section enabled us to obtain a relation for maximum discharge (Qmax):
43210bappmax QPDHeQ ααααα ⋅⋅⋅⋅= (2.9)
where Hp(mm) is depth of rainfall, Dp(h) – precipitation duration, Pa(mm) – previous precipitation, and Qb (m3/s) - basic high flood discharge. The coefficients of regressions for the analyzed section are shown below. Table 8. Coefficients of the regressions established for calculating maximum discharge
River – Rain Gauging Station S (km2) Rain-Gauging Post α0 α1 α2 α3 α4
Teleajen - CHEIA 41.3 Cheia -2.614 0.194 0.069 -0.147 2.802 Both from directly comparing calculated and observed values and from calculating relative errors (Figure 7.), it was noted a satisfactory assessment of maximum discharges through the method employed.

WMO/GWP Associated Programme on Flood Management
32
At different levels (attention, flooding) for the correspondents discharges we estimated the depth of rainfall Hp (mm) at precipitations duration 6 and 12 hours (table 9.).
Table 9. Depth of rainfall for difference levels (attention, flooding) S River Gauging
Station km2 Levels Q (m3/s) Hp (mm) Dp (h)
Catenţie 10.3 25 6 Teleajen CHEIA 41.3 Cinundaţie 34.3 150 12
Figure 17. Calculated and measured maximum high flood discharges; relative errors between them at Cheia Rain Gauging Station on the Teleajen River Also, to verify these relations, the relative mean square deviation between observed and calculated values of the analyzed section was calculated (Figure 18.) and it was noted that it has values of 12-25% both for calculated discharges and for verification ones.
Figure 18. Relative mean square deviation between Qmax observed and Qmax calculated The relations obtained from this method can be used in forecasting maximum discharges of rapid high floods. These relations can be employed operatively through the program for automatic calculation created under EXCEL.
r. Teleajen, R. G.S. CHEIA
R2 = 0.8160
5
10
15
0 5 10 15Qmax obs
Qm
ax c
alc
-1.00
-0.60
-0.20
0.20
0.60
1.00
0 5 10 15 20
r. Teleajen - R. G.S. CHEIA
relative errors
r. Teleajen - R. G.S. CHEIA
0
5
10
15
20
25
1 3 5 7 9 11 13 15 17
the f loods
Qm
ax (m
3 /s)
Qmax obs Qmax cal
r. Teleajen - R. G.S. CHEIA
0
5
10
15
11 12 13 14 15 16 17the f loods
Qm
ax (m
3 /s)
Qmax obs Qmax obs
VerificationCalculation

WMO/GWP Associated Programme on Flood Management
33
In the Upper Teleajen Representative Basin (Cheia), summer floods have a higher occurrence degree, and due to foehn processes, the hydric regime from the winter period becomes relatively unstable, winter floods having a frequency of up to 40%. The maximum discharges of pluvial origin have a coefficient of 80% at Cheia hydrometric station. Flood occurrence and their characteristics are determined, besides the climatic conditions and other factors, like: permeability, degree of humidity, soil temperature, vegetation, riverbed slopes, shape and surface of reception basins, riverbed characteristic. Human interventions lead to significant changes in the structure of the natural landscape, fact that influenced runoff in Cheia river basin (figure 19.) Characteristic is the ones caused by deforestation, settlement extension, and development of the road network. All these lead to important changes in the natural processes, and the appearance of specific anthropic landscapes. On the limitrophe slopes, the forest is replaced by pastures or by certain crops. The development of the forest industry in Maneciu, situated downstream, determined the extension of the forest roads on most of the valleys, and linked to them, the occurrence of new processes, among which erosion, land slides, in sectors in which human intervention was stronger, a more alert development rhythm that sometimes lead to degradation.
Figure 19. Factors that influence the runoff in the Upper Teleajen Representative Basin
(Cheia) Some Objective Causes of Flood Occurrence in the Upper Teleajen Basin (Cheia)
• Heavy precipitation in a very short time on extended areas • The inadequate maintenance of certain agro technical works that facilitate the erosion
processes and lead to the increase of runoff coefficient on slopes and dislocation of large sediment quantities
anthropic factors significant changes in
the infrastructure of the natural landscape
deforestation
infrastructure
settlement expansion
climatic conditions
Other factors
soil permeability
riverbed slopes and slopes
humidity degree
vegetation
shape and surface of reception basins
Task 3: Preparing and implementing the procedures for warning inhabitants of the village ofCheia and the tourists

WMO/GWP Associated Programme on Flood Management
34
• The placement of unauthorized objectives (hoses, dependencies, etc.) in floodable areas • Building of houses, in floodable areas, on inadequate foundations and the use of building
materials of poor quality • Clogged sewerage networks, under dimensioned, un-maintained, which are inadequate to
the torrential runoff regimes • Lack or insufficiency of funds for the realization of the whole ensemble of hydro- technical
developments foreseen in the framework schemes and for the reconstruction of the works affected by floods occurred in the previous years, as well as for new flood defense works, both in riverbeds and slopes
• Impermanent staff at certain town halls in the rural areas, which makes difficult the informational flux for the warning-alerting of the population
4.8 Methodologies and tools for involving the local comunities including warning dissemination methods In the case of Cheia area, subject of our pilot project, the alert is declared by the Operative Center from Ploiesti County, which sends the messages to the Operative center from Maneciu town which is also host the local administrative body of the Cheia area. These messages are delivered with higher frequencies depending on the level of alert estimated and declared. At the villages level the telephone messages are sent, via the telephone central station, via the sirens, messengers, or other means, which traditionally were used by the inhabitants and are still accepted by them. The first announced by these responsible centers are the schools, hospitals, army camps, hotels and other kind of institutions where large numbers of peoples are agglomerated, in order to organize themselves, to help those that are in need, including their families. The remote inhabitants are also warned by different means depending by the location and the level of danger in which they are. At this point, the risk maps which are not existing yet show the need of creation and based on the discussion during the workshop a short list was convened to be prepared which remains to be included in the Operative Alert Center responsibility. In the special conditions from Cheia which is a mountain type resort and where the houses many of them are located far one from another the inhabitants has decided and organized themselves as firefighters brigade and they also accepted to communicate with the hydrological station technicians for getting acquainted with the necessary information in useful time. The rule of double checking and validating the information before are used was also expressly requested. The hydrometrical stations system within Representative Upper Teleajen Basin (Cheia) is not, for the time being connected with the NIHMW network of forecast because it is not endowed with automatic stations. Consequently, the raw data are not connected in real – time share with the central server located at NIHMW but as soon as the automatic gauging stations will be installed they will be included in he automatic network, having the forecast as continuous outputs. NIHMW is involved and responsible since 2005, in the DESWAT project (Destructive Water Abatement and Control of Water Disasters). As said above this project is designed to give a top-level system overview of the integrated system components for DESWAT by Baron Advanced Meteorological Systems (BAMS). These components form the central processing system of the real-time hydrologic analysis and prediction system, assisting hydrologists and water managers in their decisions regarding life saving and property preserving decisions. The pilot Representative Upper Teleajen Basin (Cheia) is included in this project, for endow with automatically measurements stations.

WMO/GWP Associated Programme on Flood Management
35
Figure 20. Measurement Section at Cheia Hydrometric Station, Teleajen River
Preparation of the concept of reducing damages caused by floods, including warning and reaction system At present, in Cheia locality there is an electronic acoustical system placed in school to warn population against floods. Phone communications are present through underground cables of great importance (at a depth of 0,6m- 1,2m) on both sides of the national road DN1A (cables of conductors and optical fibers) and telephone exchange in Cheia locality, with aerial and underground network for local subscribers. Following the information received from the competent structures, the school electrician activates the electronic acoustical system. The village does not have military units of firemen. Consequently, at the initiative of the community a group of voluntary firemen was set-up including 12 persons with ages between 20 –40. This group is attached to the UM Military Firemen from Maneciu Commune, Prahova County. The UM Military Firemen from Maneciu Commune, Prahova County with the help of the Maneciu mayor’s hall provides the equipment of the group. The informational content of this project among the local population was shared with the mayor, counselors and locals. In preparing the Workshop, we collected the necessary material (maps, pictures) for editing and publishing educational brochures for children, tourists (Cheia is a tourist resort) and locals.

WMO/GWP Associated Programme on Flood Management
36
Figura 21. Presents the action plan in case of floods in the Representative Upper Teleajen Basin (Cheia) At Cheia village at the end of May (30 May) the planed Workshop devoted to the dissemination of the project outcomes was organized. During the workshop, the local authorities, regional water administrations representatives, the teaching staff and the hydrometer technicians were invited, informed and instructed about the necessary actions in case of flash flood by the members of the working team in this project. Talks were delivered by the GWP representative and by the representatives from NIHWN. The latter presented the fulfilled tasks and the above-mentioned brochures. 4.9 Link with policies and other projects The National Institute for Hydrology and Water Management is a member and an active participant to numerous associations and organizations in which the water policies at global, regional and international level are drawn and based on the agreements realized at political levels. They are developed at the Scientifically and technical levels, included in action plans for their implementation and application in day by day life. Some of the most representative international organizations in which the institute is part of can be found bellow:
• World Meteorological Organization–WMO National Committee for International Hydrological Program - IHP UNESCOInternational Association of Hydrological Sciences – IAHSEuropean Union of Earth Sciences
• Romanian Association of Hydrological Sciences
Hydrometeorological real-time data acquisition
Quantitative rainfallforecast
Flood forecasting: Extension Magnitude
Occurrence time
Flood warning based on meteorological forecast
Entering into stand by system of intervention
Operational intervention according to the
forecasted information and intervention plans
Authorities and population alert
Evacuation of thepopulation and
material goods rescue
Survey of infrastructure flood protection works (levees, polders)
Maneuvering the hydraulic works for high water release in compliance with the flood
forecast
Emergency medical
assistance

WMO/GWP Associated Programme on Flood Management
37
In order to cover the multiple transboundary interconnections and obligations, the institute is involved in a number of international projects which conduct to the improvement of scientifical and technical expertise of the experts teams and which also allows the identification of those high-tech solutions existing or possible to be developed in such international and multidisciplinary teams. Some of the projects are enlisted bellow:
• CADSEALAND Interreg III – CADSES Region CINFAI, Italia - CE: 10.000EUROHYDROCARE Interreg III – CADSES RegionCINFAI, ItaliaI - 3.010.000 EURO (Funds for mobility assured by de CINFAI - Italy)HYDROSED - Partenereship with Franta Cemagref, Franta – 2.410.000 EURO – CemagrefENSEMBLES – based Predictions of Climate Changes and their Impacts - FP6 Hadley Centre for Climate Prediction and Research 2004 – 2009 UE: 28.000 EURO MEC: 54.600 RON NIHWM: 54.600 RON
• LIFE03 ENV/RO/000539 – Dezvoltarea unui sistem integrat de management bazinal
pentru a corela analizele de cantitate si calitate ale apei cu analiza socio-economica, folosind tehnologie OPEN-GIS LIFE Universitatea „Pierre et Marie Curie”, Franta 688.532 EURO CE: 314391 MMGA: 374.141“Managementul integrat al apelor subterane dintre Bulgaria si Romania in zona Dobrogei” Phare CBCAgrifor, BelgiaIn derulare24 luni0,667 MEURO Din care: Phare: 0,5 M EURO MMGA: 0.167 M EUROHYETOPOLIS (Dezvoltare urbana durabila prin eficientizarea gestionarii resurselor de apa de suprafaţa si subterana) LIFE Ydronomi Engineers Consulting, Atena, Grecia 36300.000 EURO LIFE: 137.500 MMGA: 162.500HYDRATE (Hydrometeorological Data Resources an Technologies for Effective Flash Flood ForecastingFP6 – 2005 - GLOBAL-Universitatea din Padova, Italia 36140.000 EURO :CE: 70.000 NIHWM: 70.000
• Central and Eastern Europe Climate Change Impact and Vulnerability Assessment
(CECILIA – FP6 037005) FP6 – STREP Charles University, Praga, Republica Ceha 36.130.000 EURO: CE: 65.000 NIHWM: 65.000Climate Change and variability: Impact in Central and Eastern Europe (CLAVIER – FP6 037013) FP6 – 2005 - GLOBAL-4 Max Plank Institute for Meteorology, Hamburg, Germany 80.000 EURO:CE: 40.000 NIHWM: 40.000CADSEALAND IIInterreg III – CADSES Region CINFAI, Italia 30100.000 EUROCE : 50.000 NIHWM: 50.000FLOODMEDInterreg III – CADSES RegionUniversitatea Tehnica din Atena 36250.000 EURO CE: 180.000; INHGA: 70.000MOSES (Imbunatatirea Sistemului de Gestionare a Inundatiilor) Interreg III – CADSES Region Slovak Hydrometeorological Institute 36300.000 EURO Phare: 225.000 NIHWM: 75.000
The main tasks that have to be carried out within these projects for their practical realization, in which some are referring to the efficient flash floods alert systems, are the following:
• define the criteria to justify the use of alert systemsdefine the configuration of the local alert systems for flash floods define the parameters that trigger the alert system
• develop and deploy an alert system on a watershed Based on the Analysis of the existing Alert Systems, at National, Municipal and Communal Level a number of measures were considered in order to achieve the tasks mentioned above and then they were included in a group of technical development projects: WATMAN PROJECT is a cover system, which was thought to integrate all tasks for water resources management in the multiple aspects. WATMAN PROJECT integrates SIMIN, DESWAT and others national and international projects results, in the National Informational System of the

WMO/GWP Associated Programme on Flood Management
38
Water Domain and it refers mainly to: Water resources optimum usage at the basin and national level
• Water resources optimum availability/assigning, from the quantitative and qualitative point of view
• Water infrastructure optimum management in the case of disaster • Hydro technical works optimum exploitation • Population, real-time warning system in the case of disaster • Material and human lost mitigation in case of disaster • Fast evaluation of the disaster damages • Romanian bilateral relation improvement, through the respect of the bilateral agreements in
the water domain. Starting with 2005, through the implementation of the DESWAT Project – Destructive Water Abatement and Control of Water Disasters, the hydrology and water management activities enter in a new stage of development and modernization of the following systems:
• River monitoring through the installing of automated stations with measuring channels and sensors of water level, precipitation, air and water temperature, as well as the measurement of the main water quality parameters.
• Short and medium term hydrological forecast, through the purchase of state of the art forecast modeling software, NWSRFS (USA), etc. and the integration of Romanian forecast models VIDRA, CONSUL and UNDA in the water decision – making system.
The DESWAT Project will integrate the communication and radar system within the SIMIN Project (National Integrated Meteorological System) During 2005 and 2006 as a result of high waters and floods which affected nearly all of the country, the Ministry of Environment Water Management, the National Water Administration and the Ministry of Internal Affairs organized from the national level to county level and lower to municipalities and communes / villages, the so called “Informational and Decisional Scheme for Urgency Situations generated by Floods, Meteorological Dangerous Phenomena, Accidents created by Hydro-technical Constructions and Pollution Accidents”. Within this structure, which is a multilevel and multidisciplinary one, there are technical working groups that validate and declare the alert state, which follow the application of preparedness plans and strategies elaborated for different situations and which signalize the end of alert state based on the field data and information that shows and proves that. NIHMW is involved and responsible since 2005, in the DESWAT project (Destructive Water Abatement and Control of Water Disasters). As said above, this project is designed to give a top-level system overview of the integrated system components for DESWAT by Baron Advanced Meteorological Systems (BAMS). These components form the central processing system of the real-time hydrologic analysis and prediction system, assisting hydrologists and water managers in their decisions regarding life saving and property preserving decisions. The pilot basin Teleajenul Superior (Cheia) is included in this larger project, for endow with automatic measurements stations. Hydro meteorological time series and parametric data are used by the system in a manner coordinated by the FFG Model Process Core through a two-way interaction with the system Database (DB). The DB stores all parametric, historical and real-time data. This includes geometric, hydrologic and hydraulic parameters for small watersheds of area 100-300 km2 that cover the entire area of Romania (approximately 500,000 km2). The DB stores real-time hourly rainfall data together with daily and historical hydro meteorological data. The time series of raw hydro meteorological data undergoes pre-processing to remove erroneous values and any biases that may be present in the real-time satellite rainfall product. The mean area rainfall and daily temperature products are stored in DB in the form of mean area values for each small watershed. Periodic archival functions are
WMO/GWP Associated Programme on Flood Management
39
engaged through an automated extract process to create regular system archives of data and products. The FFG Model Process Core uses the output of the soil moisture and flash flood guidance models to develop products and to make those available to the Dissemination process. System products and messages are defined in close collaboration with system users. Some of these products are shown below. Flash Flood Guidance The FFG receives gauge-corrected radar-based MAP, as well as daily air temperature, and monthly potential evapotranspiration information. This information is then sent to the FFG model, which runs on the Flash Flood Guidance Computational Server (FFGCS), uses a SAC/SMA model along with spatial data to produce FFG products. The FFG products are then sent to a Flash Flood Guidance Dissemination Server (FFGCS) where they may be view using a web browser. At present the Cheia basin warning system consists of an electro-acoustical system located in the school building, a toll exchange and a team of firefighters in place, which may act in case of flash flood. The Flash Flood Guidance System is designed to provide flash flood guidance information to the National Forecast Center and eleven – II- Level - Basin Offices by the National Institute of Hydrology and Water Management (NIHWM) on a small basins scale across their entire area of responsibility. This component is developed in cooperation with Hydrological Research Center from USA. HOW DO USERS INTERACT WITH RO_FFG?
• Participating Agency key for remote access to the Dissemination Server - ID/ Password – Login – based access privileges - HTTPS – Secure (encrypted) and restricted web access - SCP – Secure (encrypted) and restricted data transfer - National Agency access to respective data
• Administrative remote access to the Dissemination Server Public access to sample regional products at HRC web site – http://www.hrc-web.org/Ro_FFG
4.10 Inter-institutional collaboration As said already, in order to improve the technical capacities of hydro-meteorological services in Romania, the MEWM - Ministry of Environment and Water Management collaborates with the Ministry of Administration and Internal Affairs – MAI, with the National Water Administration “Apele Romane”- NWAAR as well as with all their distributed departments and offices within the country, and they are working for the development of more advanced systems in order to reduce the floods effects, and aimed to the improvement of the produced data and information reliability, which then will be used for the respective tasks . Bellow, are presented the schemes showing the structure, compositions and informational-decisional flux scheme for urgency situations generated by floods, dangerous meteorological phenomena, due to hydro technical constructions accidents, and/or accidental pollutions events.
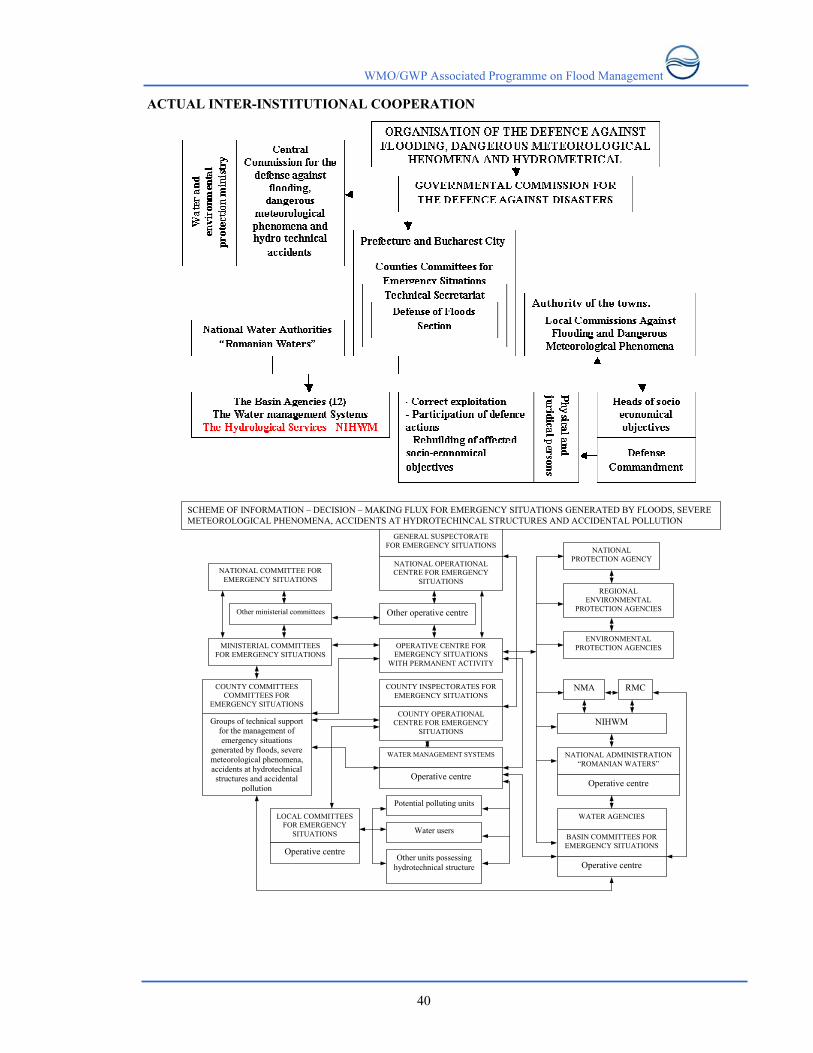
WMO/GWP Associated Programme on Flood Management
40
ACTUAL INTER-INSTITUTIONAL COOPERATION
NATIONAL COMMITTEE FOR EMERGENCY SITUATIONS
Other ministerial committees
MINISTERIAL COMMITTEES FOR EMERGENCY SITUATIONS
COUNTY COMMITTEES COMMITTEES FOR
EMERGENCY SITUATIONS
Groups of technical support for the management of emergency situations
generated by floods, severe meteorological phenomena, accidents at hydrotechnical
structures and accidental pollution
LOCAL COMMITTEES FOR EMERGENCY
SITUATIONS
Operative centre
GENERAL SUSPECTORATE FOR EMERGENCY SITUATIONS
NATIONAL OPERATIONAL CENTRE FOR EMERGENCY
SITUATIONS
Other operative centre
OPERATIVE CENTRE FOR EMERGENCY SITUATIONS
WITH PERMANENT ACTIVITY
COUNTY INSPECTORATES FOR EMERGENCY SITUATIONS
COUNTY OPERATIONAL CENTRE FOR EMERGENCY
SITUATIONS
WATER MANAGEMENT SYSTEMS
Operative centre
Potential polluting units
Water users
Other units possessing hydrotechnical structure
NATIONAL PROTECTION AGENCY
REGIONAL ENVIRONMENTAL
PROTECTION AGENCIES
ENVIRONMENTAL PROTECTION AGENCIES
NMA RMC
NIHWM
NATIONAL ADMINISTRATION “ROMANIAN WATERS”
Operative centre
WATER AGENCIES
BASIN COMMITTEES FOR EMERGENCY SITUATIONS
Operative centre
SCHEME OF INFORMATION – DECISION – MAKING FLUX FOR EMERGENCY SITUATIONS GENERATED BY FLOODS, SEVERE METEOROLOGICAL PHENOMENA, ACCIDENTS AT HYDROTECHINCAL STRUCTURES AND ACCIDENTAL POLLUTION

WMO/GWP Associated Programme on Flood Management
41
4.11 Relationship with the national disaster management mechanisms The flood defense system is part of the National System for Emergency Situations, recently set-up in 2004, after the change of the old system based on the functioning of the Central Defense Commission, set up within the Ministry of the Environment and Water Management. The system was modified in 2004, through the Government Emergency Ordinance no. 21/2004. The flood defense system is part of the National System for Emergency Situations and was set - up in 2004, after the change of the old system. This old system was based on the functioning of the Central Commission for defense against floods and dangerous meteorological and hydrological phenomena, which was set- up within the Ministry of Environment and Water Management. The old system for emergency intervention functioned temporarily, only when emergency occurred. That is why the system was incapable to give an adequate answer to the new challenges of national security, life defense, population health and environment during cases of emergencies including calamities such as floods. The fundamental idea of the new regulation resides in the setting- up of the National Management System for Emergency Situations. Some of its components have a permanent functioning which aims at preventing and co-ordinating emergency situations, at providing and co-ordinating human resources, materials, financial resources and of other nature, necessary for restoring normal conditions. The public administration authorities organized the National System that is made up of a network of bodies such as:
• Committees for emergencies situations at local, county, municipal, ministerial and national level;
• The General Inspectorates for Emergency Situations; • Competent community public services for emergency situations; • Operational centers for emergency Situations; • The leaders of operations.
The National Committee for Emergency Situations is set - up and functions under the leadership of the Minister of Administration and Internal Affairs and under the co-ordination of the Prime Minister. The General Inspectorate for Emergency Situations as a specialized body of the Ministry of Administration and Internal Affairs ensures the permanent and unitary co-ordination of prevention and management of emergencies through “the national Operational Center”. This center functions permanently and carries out the tasks of monitoring, evaluation, information, warning, pre-alarming, alert and operational- technical co-ordination at the national level. Similar systems are organized at the level of ministries, on different types of activities as well as at different levels of local administrations. The “alert state” can be declared depending on how serious the situation is. In case of floods, the risk management aims at reducing the probability and/ or the potential impact of floods. Within the activity of defense against floods there are three main stages, each characterized by specific measures. The precursory stage of floods is characterized by measures of preventing and minimizing the risk of floods as well as by constructing some hydro- technical works that facilitate the control of the phenomenon when it occurs. In addition to these measures, one can mention non- structural measures regarding the improvement of the institutional framework, which aim again at increasing the efficiency of flood risk management. Education and training of population and local authorities for such situations represent an important factor.

WMO/GWP Associated Programme on Flood Management
42
It is also highly important to provide in advance some stocks of materials and equipment that facilitate the operational intervention in real time, when floods occur. The second stage is an operational stage of intervention in the moment the floods occur. In a system of environment management, in its stage of implementation there is an important sub- stage related to the capacity of solving emergencies. This capacity may be obtained by planning in advance the required interventions, by knowing the tasks assigned to all the institutions involved in such cases, by co- relating their actions and assimilating the intervention procedures through training, and by participating to flood simulation exercises. In this stage, the existence of an information and alarm system plays a special role to reduce the number of victims and damages; this system helps population to be informed beforehand in order to take refuge from zones, which are at risk to be flooded. Evacuation must be done towards higher areas, established in advance and known by each person. The third stage, after the event, is related to the mitigation of the flood effects, to the reconstruction of the destroyed hydro- technical works, to the provision for house reconstruction, drinking water, food and drugs for affected population. After the floods of 2005, two manuals were elaborated and approved through a joint order of the Ministry of Administration and Internal Affairs and the Ministry of Environment and Water Management to improve the involvement of local communities in case of floods:
• The prefect’s manual for emergencies in case of floods • The mayor’s manual for emergencies in case of floods
The protection of population, possessions and cultural values can be achieved through a set of activities such as: information, warning, pre-alarming and alarming, sheltering, evacuation and other technical and organizational measures. Information is given by the General Inspectorate for emergencies or the specialized emergency services on the basis of information received form the population or the structures monitoring the risk sources. The local or central public administrative authorities do warning of the population through specific warning devices based on the notification received from the competent structures. Pre - alarming is done through sending out the messages / warning signs to the authorities about the probability of a disaster occurrence or an aerial attack. Alarming of the population is done by the local or central public administrative authorities through specific means based on the notification received from the competent structures. Specific means of warning and alarming shall be installed in places established by the General Inspectorate for emergencies and specialized emergency services. Messages of warning and alarming shall be transmitted obligatorily, first rank and free of charge through all systems of telecommunication, radio and TV posts and networks, including satellite and cable, which function on Romanian territory, at the express request of the leaders of structures for emergency situations. Through mayor’s order, operational emergency centers with temporary activity shall be set up at the level of local public administration.

WMO/GWP Associated Programme on Flood Management
43
These centers are technical- administrative structures for carrying out specific tasks during the alert period in emergency cases as well as during the exercises, applications and training for solving such cases. Emergency services are specialized and voluntary. The activity of the emergency service is co-coordinated locally by the mayor. The main aims of emergency services are protection of life, goods and environment against disasters as well as the creation of protective and intervention measures in case of floods. Citizens have the right to enter into contracts of voluntary actions with the representatives of local public administrative authorities for joining voluntary emergency services that are approved through Government decision. The staff of the voluntary emergency services and citizens, who participate to prevention and intervention actions to limit, recover and rehabilitate during emergency cases benefit by social rights and other facilities established in the Rules for the voluntary staff.
4.12 Educational and awareness building A number of practical steps are taken in order to spread the knowledge and the measures to be put into practice among the beneficiaries of this project (locals, children, tourists). In this regard three brochures have been edited:
• “The destructive power of floods and flash floods”-destined to local inhabitants • “Watch out-the storm is coming!”-destined to children • “How to keep out of floods during holydays”-destined to tourists
The brochures contain practical and easy to understand advices in case of floods, how to help yourself and the others for the well-being of the entire community. We think that besides a few specifics linked to the Cheia basin the information and the advices offered in the brochures can be used by people in other similar situations in areas prone to flash floods. Therefore, the results of point of the project are to be generalized with minor modifications at the level of any basin of similar characteristics on the entire scale of Romania.
Task 4: To prepare a concept and test a program of education and training to improve knowledge of flood plain inhabitants and users concerning the hazard and loss mitigation methods

WMO/GWP Associated Programme on Flood Management
44
• Brochure for locals:
“The destructive power of floods and flash floods!” Comprises: - Short historical overview of floods in Romania - The Upper Teleajen Representative Basin (Cheia) - Types of floods: caused by floods on rivers, coastal, stationary/urban, flooding of lakes
and channels - Aspects regarding floods - Way to act before/during/after the flood - Areas in Romania prone to floods.
• Brochure for Children:
“Watch Out! The Storm is Coming!”
Comprises: - Information regarding meteorological phenomena - Information regarding the way in which we must act in case of floods depending on the
place in which the school, house, car is situated - Necessary equipments in case of isolation or evacuation during floods
• Brochure for Tourists:
“How to keep out of floods during holydays?!”
Comprises: - The Upper Teleajen Representative Basin (Cheia) - Aspects regarding floods - Ways in which we have to act before/ during/ after the flood - Ways in which we have to act in case of floods, for tourists who are camping, hiking or
driving - Necessary equipments in case of isolation or evacuation during floods
Other aspect regarding floods is: the risk of epidemic disaster in the areas affected by the lack of the fresh water supply and the minimum of hygienic conditions and ecological accidents which were treated within the brochures in terms of preventing measures which needs to be taken.
educational materials - brochures-
2. for children Atentie vine furtuna!
(Watch out-the storm is coming!)
Equipments necessary food products
1. for inhabitants Puterea distrugatoare a inundatiilor (The destructive power of floods and
flash floods)
The car Camping
3. for tourists Cum ne ferim de inundatii in vacanta?!
(How to keep out of floods during holydays)?!
The storm tornado
In the car At home In the school
equipments necessary food

WMO/GWP Associated Programme on Flood Management
45
The Project results dissemination had been materialize in the Workshop already mentioned, which took place on 29 – 31 Mai 2006 in Cheia village, Prahova Country. The workshop was organized by the National Institute of Hydrology and Water Management, Bucharest in collaboration with Global Water Partnership - Romania. The primordial purpose of this meeting was to inform the population regarding the flash floods and the flood effects based on the Project achievements, to introduce them the informative means prepared within the project like the brochures, the web-sites of the Ministry of the Environment and Water Management of the National System for Emergency Situations, of the project organized within the GWP-Romania site and within the National Institute of Hydrology and Water Management site. Authorities from Maneciu City Hall and representatives of the educational units (primary and secondary school) from the region had participated in the workshop. The presentations also had a large audience formed by the specialists from the NIHWM, GWP-Ro and technicians from the hydrometrical territorial network. The workshop was organized in two sections and it was moderated by Mr. eng. Liviu Popescu, GWP-Ro. In the opening, Mr. Liviu Popescu spoke about the necessity and the benefits of the implementation of the Project “Forward Integration of Flood Warning in Areas Prone to Flash Floods”. In the first section, the two collaborator institutions NIHWM and GWP-Ro presented the international and national context of the project, the necessity of the implementation of the Project. The first section closed with free discussions between the participants regarding the level of local and communal implementation of the protection measures at flood, what they try to do and the problems they meet during the process, what they need and what can be done to acquire the objectives. The second section was reserved to the presentation of the educational materials (the brochures) realized during the Project, regarding the preparation and testing of the educational program in case of floods and damage reduction methods. In the end, the participants discussed the flood risk in the area and the measures, which must be taken, in an unpleasant flood situation. Other actions aimed at information, education and preparation of different authorities, institutions and persons for flood effects minimization were organized by the Ministries involved and responsible with this task. Between them it can be specified also: In order to improve, after 2005 floods the responses of the local communities in case of floods, two manuals were elaborated:
• Prefect Manual for Flooding Situation Management • Mayor Manual for Flooding Situation ManagementIn collaboration with the Ministry of
Transport, Civil Engineering and Tourism it was launched: The Financial Programme for Preparedness Plans in the cases of Natural Hazard and Flooding for each county.
The Ministry of Environment and Water Management has a real concern and interest in the information system modernization for real-time Warning/Alerting of the population. In this sense, in 2006 the two projects DESWAT – Integrated Decisional Informational System in Case of Water Disaster and WATMAN – decisional informational system for water management in case of disaster, which are in the phase of implementation, were made publicly and the debates on cooperation of different parts of the society within the different phases of the 2 systems development started M. Possible performance indicators for the proposed approach The main performance indicators, which are already established within the works plans of the National Commission for the Defence against Disasters are:
• the reduction of human casualties • the reduction of damages created to population from flash floods prone areas
WMO/GWP Associated Programme on Flood Management
46
• the increase of efficiency of warning systems in terms of increase of successful warnings numbers of warnings events against total number events
• the increase of successful operations for preparatory activities within the flash floods prone areas in terms of provided safety location for the use in case of floods, all necessary materials for population and their belongings transfer their depositing and for temporary living until the end of alert situation and entering in normal conditions
• the increase of educational events in the schools for children through the simulation exercises for the inhabitants together with the responsible administrations units and all other involved organizations.
4.13 Sustainability of the process for diminishing the flash floods efects Proposals of measures necessary for reducing floods risk
• To build new damming and regulation works (riverbed readjusting) in co-relation with conservation of wet zones as well as torrent harnessing, restocking and fighting against soil erosion.
• To organize some simulation exercises at the river basin and county level to check the functioning of the informational flux for warning- alarming population in case of floods.
• To analyze some modalities to increase population awareness about the risk of the existence of a reservoir near a locality and the placing of houses near the dams and easily flooded areas. This shall be done by the ministerial Committee for emergencies, within the Ministry of environment and water management and the General Inspectorate for emergency situations.
• To carry on the actions for checking the construction and maintenance of drains and drainage ditches as well as the maintenance of watercourses in the areas of bridges and footbridges, particularly in the areas affected repeatedly by floods from sheet flows.
• To forbid the construction of houses by the local public authorities in the areas exposed to floods form river overflow and sheet flows.
• To form at the level of localities some teams of operational intervention made up of natives that shall be trained periodically on their assignments for defense against floods.
4.14 Proposed national and regional outreach strategy Aiming at broader dissemination, a web–page has been created displaying the spreading out of the results, web–page hosted by the National Institute of Hydrology and Water management site www.inhga.ro. The web page will have a link to Global Water Partnership –Romania, www.gwp-romania.ro. Another way of disseminating the results of the APFM project Romanian component was discussed already with the National Water Administration “Apele Romane” general managers presenting the achieved products and agreeing that this experience should be expanded in the other parts of our country affected by the floods which became more and more dramatically. The discussion took place during the ICPDR early summer meeting and with this occasion the invitation to share this products in a large circulation language with the rest of Danube countries was addressed. The location where these products may be hosted is the Danube Education KIT in the ICPDR site when they will be finalized in English language and in the case that the main owner WMO will accept this.
Task 5: To disseminate experiences from the project in other areas prone to flash flooding

WMO/GWP Associated Programme on Flood Management
47
To ensure performance of other operations essential to obtain a satisfactory effect from the project, some other discussions will have to take place with the mayor of Cheia village other members of the Local Committee for Emergency Situations The project is coordinated from an organizational point of view, from financially and contractual promotion, and from public participation supporting events perspective by and through GWP Romania. The coordination process was materialized in short and clear nearly day-by-day work together in the conditions of very scarce time budget we had available. The quality control of the project was also assured through the mechanisms installed in which the proposed steps in the work made for the project were discussed and agreed between the partners and then the results, gaps week points and solutions for removing them were also part of these processes.