31. magnetic diagenesis, organic input, interstitial water …
TRANSCRIPT
Berger, W.H., Kroenke, L.W., Mayer, L.A., et al., 1993Proceedings of the Ocean Drilling Program, Scientific Results, Vol. 130
31. MAGNETIC DIAGENESIS, ORGANIC INPUT, INTERSTITIAL WATER CHEMISTRY,AND PALEOMAGNETIC RECORD OF THE CARBONATE SEQUENCE
ON THE ONTONG JAVA PLATEAU1
Robert J. Musgrave,2 Margaret L. Delaney,3 Rainer Stax,4 and John A. Tarduno5
ABSTRACT
Shipboard paleomagnetic studies on Ocean Drilling Program Leg 130 were plagued by a severe reduction in the remanenceintensity, which affected sediments below a sharply defined onset at sub-bottom depths of 50 mbsf or less. This loss of intensitywas accompanied by a reduction in magnetic stability and consequent loss of polarity and paleolatitude information. Viscousremanent magnetization and drilling-induced remanences contributed high-coercivity overprints, further obscuring the greatlydiminished primary magnetization. The depth at which the reduction in intensity occurred correlates with the organic carboncontent of the sediments, and a further relationship is present between intensity downhole and the level of sulfate reduction. Thisimplies that loss of intensity is related to the microbial reduction of magnetite. Reduction of sulfate results in the generation of amagnetic iron sulfide, which appears to be the carrier of the high-coercivity overprints. Oxidation and drying of the sediment aftersampling leads to partial destruction of this sulfide, and complete decomposition occurs at temperatures below 300°C. Thesefeatures identify the magnetic sulfide as the metastable phase, greigite. Varying inputs of organic material in past times, presumablyreflecting both latitude and climatic changes, resulted in varying degrees of reduction, which are now reflected in differences inmagnetic intensity, degree of overprinting, and survival of primary magnetization. The highest reduction levels result in the almosttotal dissolution of magnetite, and the weak surviving remanence is dominated by greigite. At lower reduction states, multidomainmagnetite persists together with greigite. Still-less-reducing conditions in turn cause the survival of fine-grained, single-domainmagnetite, and then of hematite.
An earlier paleomagnetic study of Ontong Java Plateau sediments from Deep Sea Drilling Project Leg 30 produced apaleolatitude curve that differed significantly from other records of Pacific paleolatitude. It is likely that the samples in this earlierstudy also carried high-coercivity overprints, which biased the results. Those samples from Leg 130 that appear to preserve aprimary magnetization yielded paleolatitudes consistent with expected Pacific Plate motion.
INTRODUCTION
Paleomagnetic investigations of the carbonate sediment sequenceof the Ontong Java Plateau have met with limited success. A study ofthe paleomagnetic inclination of discrete samples collected from DeepSea Drilling Project (DSDP) Hole 289 (Hammond et al., 1975) yieldeda paleolatitude curve that, although apparently internally consistent,does not match paleomagnetic and hotspot track evidence for absolutemotion from other parts of the Pacific Plate (e.g., Duncan, 1981; Sager,1983; Sager and Pringle, 1988). Cryogenic magnetometer long-coremeasurements on Ocean Drilling Program (ODP) Leg 130 were frus-trated by an almost complete loss of signal following a precipitous dropin the remanence intensity of 2 orders of magnitude below a criticaldepth of between 10 and 50 meters below seafloor (mbsf). Althoughsome intervals of consistently preserved magnetostratigraphy wereobserved in the Oligocene section of Hole 803D and the Miocene toEocene of Site 807, the signal overall was both discontinuous andbiased toward one polarity. Similarly, inclinations of the Tertiarysediment samples in the earlier DSDP study appeared to be biased (13of a total of 18 samples have a positive inclination). Inclinationflattening during sediment compaction (Anson and Kodama, 1987;Arason and Levi, 1990; Deamer and Kodama, 1990; Levi and Baner-
1 Berger, W.H., Kroenke, L.W., Mayer, L.A., et al., 1993. Proc. ODP, Sci. Results,130: College Station, TX (Ocean Drilling Program).
2 Geology Department, University of Tasmania, G.P.O. Box 252C, Hobart, Tasmania7001, Australia (present address: Ocean Drilling Program, Texas A&M University, 1000Discovery Drive, College Station, TX 77845-9547, U.S.A.).
3 Institute of Marine Sciences, University of California, Santa Cruz, Applied SciencesBuilding, 1156 High Street, Santa Cruz, CA 95064, U.S.A.
4 Alfred Wegener Institute for Polar and Marine Research, Columbusstrasse, D-2850Bremerhaven, Federal Republic of Germany.
5 Geological Research Division, Scripps Institution of Oceanography, University ofCalifornia, San Diego, La Jolla, CA 92093, U.S.A.
jee, 1990; Tarduno, 1990), a mechanism suggested as the explanationof other anomalous paleolatitude records from marine sediments,cannot explain this bias in the polarity distribution. An alternateexplanation is that the alternating field (AF) demagnetization con-ducted in the two studies (to a maximum of 30 mT in the DSDP study,with characteristic inclinations determined at 10 mT, and to a maxi-mum of 15 mT on board Leg 130) was unable to completely removean overprint.
During Leg 130, a correlation was noted between the sulfate ionconcentration in the interstitial water and remanence intensity overthe interval in which remanence suddenly declines and the magne-tostratigraphic signal is lost (the intensity reduction event [IRE]).This relationship was interpreted as the result of a link betweenmicrobial reduction of the sediments, destruction of magnetite, andproduction of magnetic iron sulfides. A general correlation betweenthe sub-bottom depth at which these diagenetic processes occurredand the local organic productivity was suspected, but low total organiccarbon (TOC) contents precluded shipboard evaluation of this rela-tionship. Microbially driven reduction of magnetite has been reportedby several authors (e.g., Karlin and Levi, 1983; van Vreumingen,1984; Bloemendal et al., 1989). Sager (1988) suspected that a meta-stable magnetic iron sulfide, either greigite or pyrrhotite, had beengenerated in Leg 101 sediments, and that this phase was the carrierof an overprint.
Land-based paleomagnetic studies of discrete carbonate samplesfrom Leg 130 have focused on recognition of the magnetic mineral-ogy of the sediments, with the intention both to understand themagnetic diagenesis and to reveal the depositional and early post-depositional remanence (DRM and pDRM) for magneto-strati-graphic and paleolatitude purposes. Direct observation of themagnetic mineralogy was not possible, as the very low concentra-tions of magnetic phases, implied by typical remanences of <IO~5
Am"1 that are encountered below the IRE, prevented separation of
527
R.J. MUSGRAVE, M.L. DELANEY, R. STAX, J.A. TARDUNO
significant quantities and analysis of these phases. Magnetic methodsof determining the magnetic mineralogy proved to be more amenable,though indirect.
METHODS
A 2G pass-through cryogenic magnetometer (PCM) with on-axisAF demagnetization coils was available for use during Leg 130.Analysis with this instrument was principally directed towardrecognition of the magnetic polarity sequence. Record-breakingcore recovery coupled with low intensities of magnetization throughmost of the carbonate sequence limited our ability to conduct usefulPCM measurements on a large proportion of the cores, and so detailedshipboard analysis, including measurement at 3- and 5-cm intervals(and 1-cm intervals in the top one or two cores of each hole), and AFdemagnetization at 5, 10, and 15 mT, was discontinued a few coresbelow the IRE in each hole. Below the IRE, measurement of carbonatecores was expanded to 10-cm intervals, and demagnetization wasconducted as a single step at 15 mT. In cores where intensities droppedbelow 10^ Am"1, no systematic magnetization was observed, anddemagnetization was restricted to one section per core, which wasscanned for evidence of reliably measurable remanence. Measure-ment was discontinued below the IRE in Holes 805C, 806C, and807B, stopping at the tenth core in each.
Discrete samples were collected with the intention of determiningprimary magnetic inclinations, from which paleolatitudes could bedirectly calculated. These samples were reserved for study on land,with a more sensitive cryogenic magnetometer than was availableaboard ship. Two samples were usually sampled from each core in thelongest Tertiary-Quaternary sequence possible at each site, either froma single hole per site (Holes 803D, 804C, and 806B) or by continuingsampling from the base of one hole to the equivalent sub-bottom depthin a second, deeper hole (from Hole 805B to 805 C, and fromHole 807 A to 8O7C). Discrete samples were taken by pressing standardODPplastic boxes (2.1 × 2.1 × 1.5 cm) into soft carbonate oozes. Stifferoozes were cut with a stainless steel knife, and soft chalks with parallelsaw blades, and these samples were also placed into ODP boxes. Moreconsolidated chalks and limestones were sampled as cylinders cut withthe 2.5-cm diameter minidrill apparatus. Samples in the oozes weretaken only from parts of the core that displayed no evidence of"flow-in" or other sampling disruption. Where chalks and limestoneshad been biscuited, samples were taken in segments long enough toallow confidence that the segment had not been rotated about ahorizontal axis. Measurement of the discrete samples was reserved forland-based study, where more sensitive magnetometers and bettershielding from spurious fields is available.
On-land paleomagnetic and rock magnetic studies of the discretecarbonate samples were conducted at the Bureau of Mineral Resources—Australian National University facility at Black Mountain, Canberra.Remanence was measured on an SCT two-axis cryogenic magne-tometer. Systematic and repeatable measurements of remanences assmall as 5 x 10~6 AπT1 on the 6.6-cm3 box samples were achieved.AF demagnetization in 5-mT steps to 50 mT (or until the inconsis-tency between repeated measurements of the samples in first uprightand then inverted orientations exceeded 25°) was applied to plastic-boxed samples from Sites 803 to 806. A Schonstedt two-axis, tumbler-shielded AF demagnetizer was used. Stepwise thermal demagnetizationwas conducted on cylinder samples from Sites 803,805, 806, and 807 toa maximum of 625°C, using two feedback-controlled, Helmholtz-coil-shielded furnaces. AF demagnetization is usually preferred forplastic-boxed samples, as this technique does not require the samplesto be removed from their boxes or dried. However, the failure tocompletely remove magnetic overp r m t s from the primary magnetiza-tion by AF demagnetization in many of the boxed samples, and thecomparatively good resolution of the primary magnetization by ther-mal demagnetization of the cylinders, encouraged an attempt to applythermal demagnetization to boxed samples from Hole 807A. These
were slowly dried while still in their boxes, and (where possible)removed from the boxes whole. Samples that could be successfullyremoved were heated in a Schonstedt shielded thermal demagnetizerin steps up to 575°C. After cooling, samples were returned (maintain-ing their orientation) to the boxes for measurement. The boxes werethemselves AF demagnetized to minimize their contribution to themeasured remanence. Demagnetization remanences were plotted oncartesian ("As-Zijderveld") plots (Zijderveld, 1967), following themodification suggested by Roy and Park (1974). Components ofmagnetization were fitted by principal component analysis of linearsegments of the demagnetization path (Kirschvink, 1980).
An isothermal remanence (IRM) was imparted to selected samplesby a steady-field electromagnet in steps of 0.1 T from 0.2 T up tosaturation or until the limits of the DC power supply at applied fieldsof about 1.5 to 1.7 T.
An attempt was made to concentrate the magnetic fraction fromgroups of samples representing various intervals in the carbonatesequence by magnetic separation after removal of the carbonatefraction by dissolution in 10% HC1. The concentrations of the mag-netic fraction proved too low for this to be successful.
Interstitial water sampling was conducted on 5- to 10-cm-long,whole-round sections cut immediately after the cores arrived on deck.Before squeezing, whole-round surfaces were carefully scraped withspatulas to remove potentially contaminated exteriors. The whole-round sections were then placed into stainless-steel squeezing devices(Mannheim and Sayles, 1974) and squeezed with a hydraulic press.Interstitial water samples were filtered through 0.45-µm disposablefilters and collected in plastic syringes. Among other measurements,sulfate concentrations were determined by ion chromatography witha Dionex 2120i chromatograph.
The initial failure of the nitrogen-carbon-sulfur (NCS) analyzerrestricted determinations of TOC at Sites 803, 804, and 805 to use ofthe Rock-Eval pyrolysis technique (Espitalié et al., 1977). The TOCvalues at these sites were mostly less than the 0.05% detection limitof this technique. At Sites 806 and 807, the NCS analyzer wasavailable to determine total carbon (TC), and TOC was then calcu-lated as the difference between TC and inorganic carbon. CalculatedTOC values were very low, between 0.02% and 0.6%, near thedetection limit of the shipboard analytical techniques. Because of arelationship suspected between diagenesis of the magnetic phases andorganic content of the upper few tens of meters of the cores, TOC wasredetermined on land for samples from Cores 1H to 6H of Holes 803D,804C, 805C, 806B, and 807A. Measurements were made with aHeraeus carbon-hydrogen-nitrogen (CHN) analyzer on a bulk sample(TC) and on a HCl-treated split of the same sample (TOC). TOC wascalculated by:
TOC = [100 - (8.334 × TC)]/[(100/TOC) - 8.334].
RESULTS
Pass-through Cryogenic Magnetometer
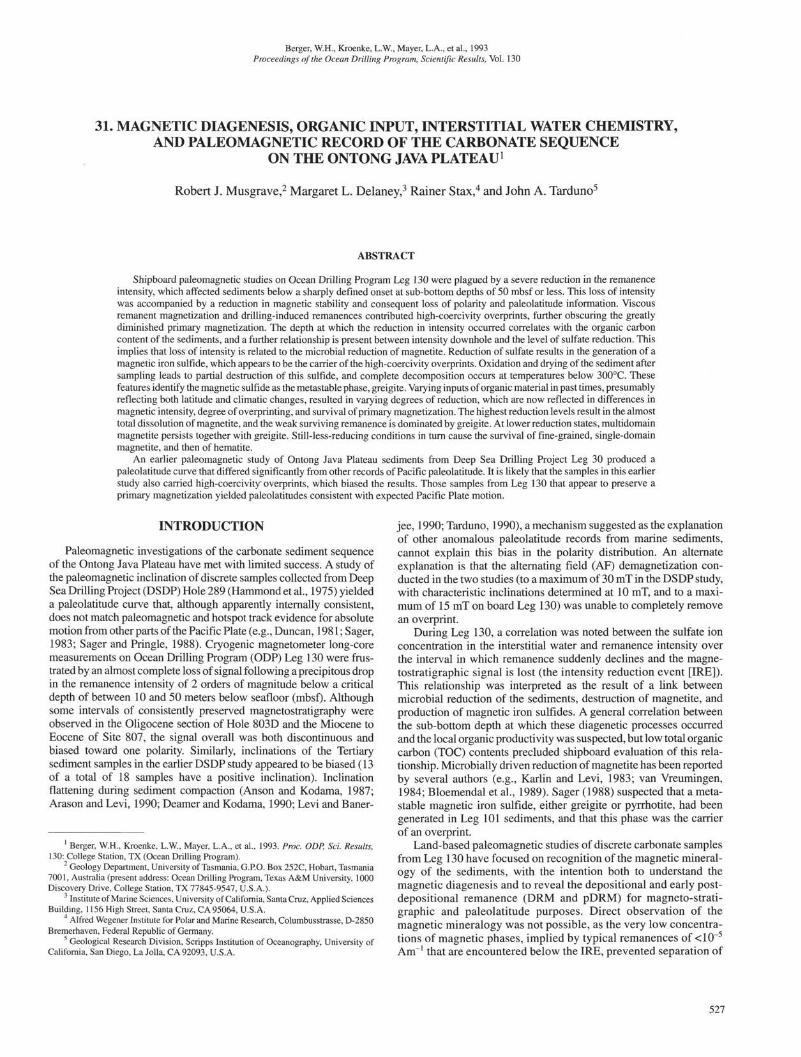
Despite some ambiguities in magnetic polarity caused by problemswith the multishot orientation tool, and compounded by the lowpaleomagnetic inclination resulting from the near-equatorial latitudeof Leg 130 sites, a clearly defined magnetostratigraphy can be deter-mined from demagnetized PCM measurements of the uppermost partof each site (Fig. 1). This otherwise clear signal is totally lost, however,below a point where a sharply defined drop of about 2 orders ofmagnitude occurs in the intensity (the IRE). Above the IRE, maximumintensities after 15-mT AF demagnetization range from about 10~2
Am"1 at Site 806 to about 2 × 10~3 Am"1 at Site 803. Immediately belowthe IRE at all sites, maximum demagnetized intensities drop to valuesof about 10^ to 10~5 Am"1 (roughly the detection limit of the PCM).Sub-bottom depths of the IRE vary from a maximum of 47.5 mbsf inHole 803C to a minimum of 9.8 mbsf in Hole 806C. Differences inboth the sub-bottom depth of the IRE and in sedimentation rates
528
B
10
20
30
{
.y.
vr. .„
.«:r-.+.-:*
j,..:,.
Sr
N t
Declination Inclination
0 90 180 270 360 -90 -60 -JO 0 30 60 90 10" 10"' 1 10 10' 10' 10'
MAGNETIC DIAGENESIS OF THE CARBONATE SEQUENCE
IntensitIntensity(mA/m)
E2 32.5
*^f
1
• ..«v . < .
&
ff
•~vj
r
<:::*•';***-
. i , r•
. s *
rt. i, ,,,,1 4 J
10 •J,:\ffciη
30
. -*•"
f
•i
•Λ" tL
0 90 180 270 360 -90 -30 0 30 90 102 1 102 10' 0 90 180 270 360 -90 -30 30 90 102 1 102 10'
Declination Inclination Intensity Declination Inclination Intensity(degrees) (degrees) (mA/m) (degrees) (degrees) (mA/m)
Figure 1. Remanence after 15-mT AF demagnetization. A. Oriented Cores 13O-8O5C-3H to -5H. B. Unoriented Cores 130-806B-1H to -4H. C. Unoriented Cores130-806C-lHto-4H.
529
R.J. MUSGRAVE, M.L. DELANEY, R. STAX, J.A. TARDUNO
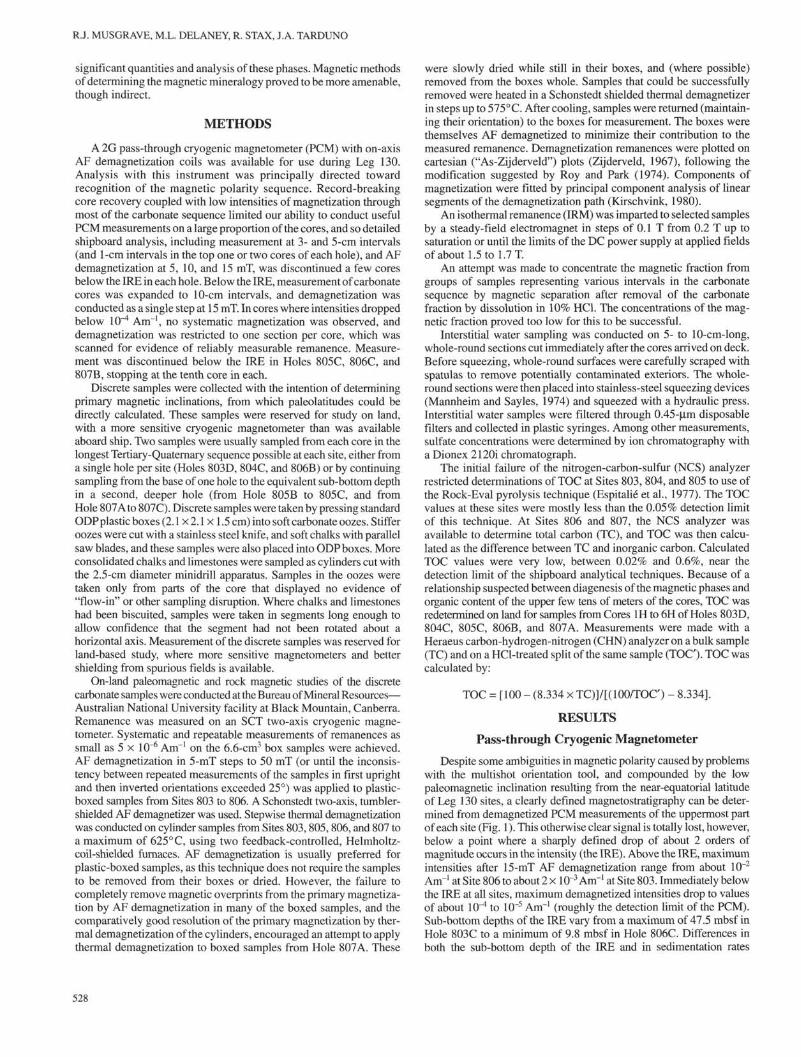
between sites result in a large variation in the oldest chron preserved,from the Cochiti Subchron in the Gilbert Chron at Site 804, to a pointstill within the Brunhes Chron at Site 806. The sub-bottom depth ofthe IRE was found to increase with increases in both water depth andlatitude (Fig. 2). Both relationships suggest that IRE sub-bottomdepth increases with decreasing organic input to the sediments. In-creasing latitude away from the equatorial high-productivity zonereduces organic productivity. Greater water depth allows more timefor the oxidation of organic matter as it falls through the water column,resulting in a diminished final input of organic matter to the seafloor.
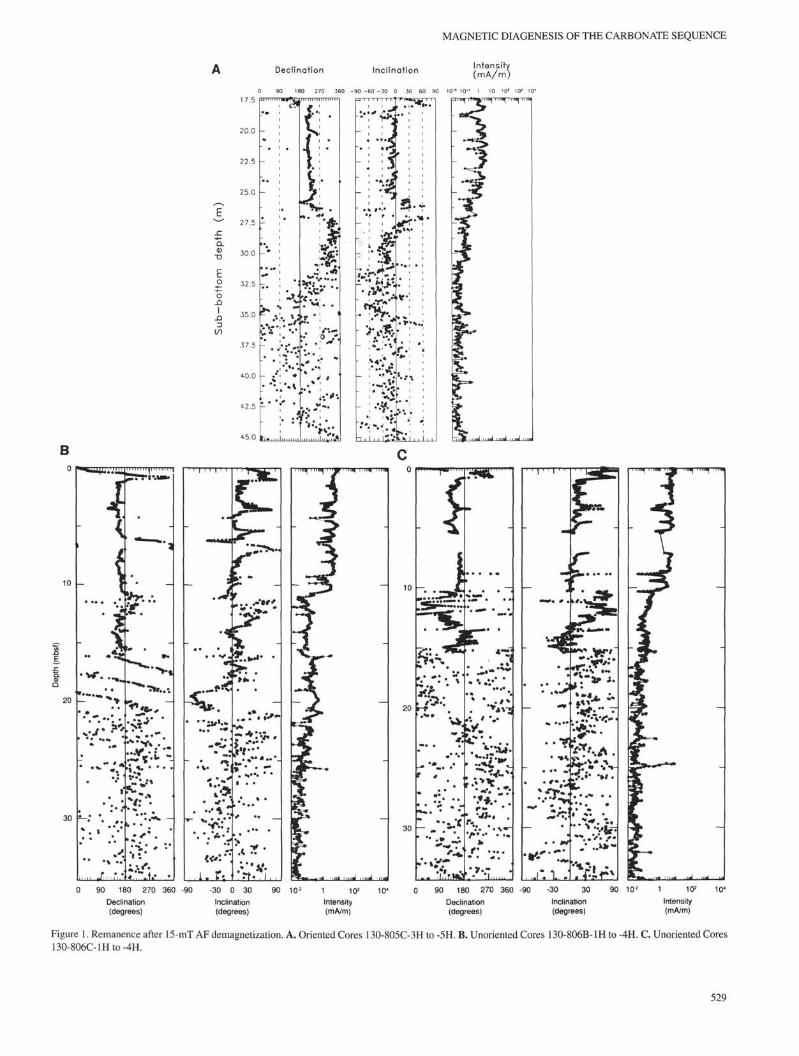
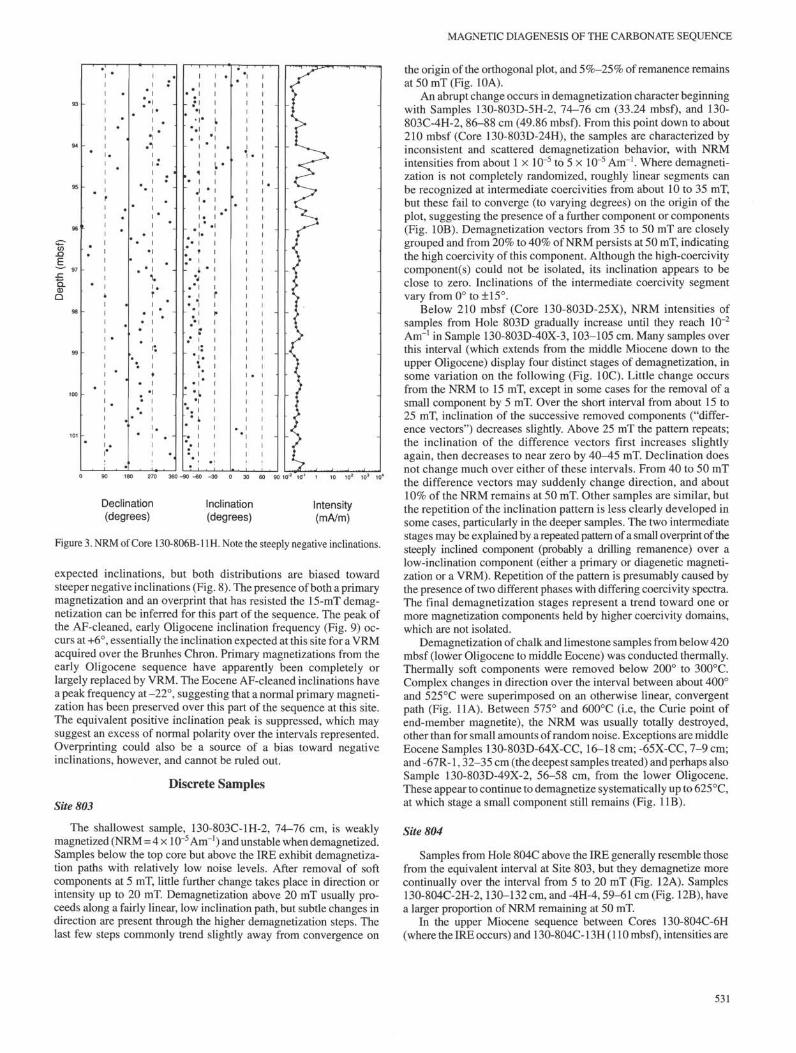
Below the IRE through the lower Pliocene and upper Miocenerecord, AF-demagnetized intensities for the most part remain near thePCM detection limit. Interpretation was also hampered by the presenceof an overprint characterized by steeply inclined negative inclinations(-60° to -80°), which are at their most severe at Sites 805 and 806(Fig. 3), where 15-mT demagnetization reduces remanence intensityto 10% of the natural remanent magnetization (NRM). Inclinationsafter demagnetization are widely scattered, but they remained biasedtoward negative directions. Similar steeply inclined overprints affect-ing DSDP and ODP cores have been reported by Barton and Bloemen-dal (1986), Bleil (1989), Tauxe et al. (1989), and Hounslow et al.(1990). Hall and Sager (1990) interpreted a similar overprint affectingLeg 116 sediments as a drilling-induced remanence related to the corebarrel, which they found to be intensely magnetized.
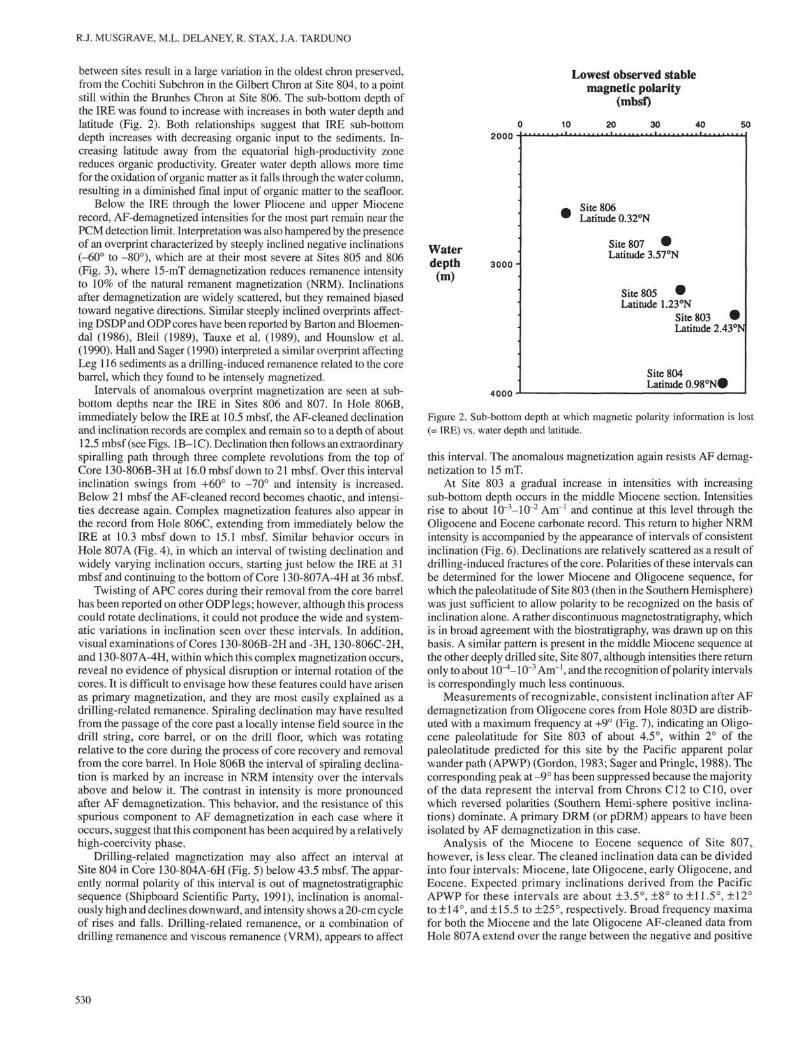
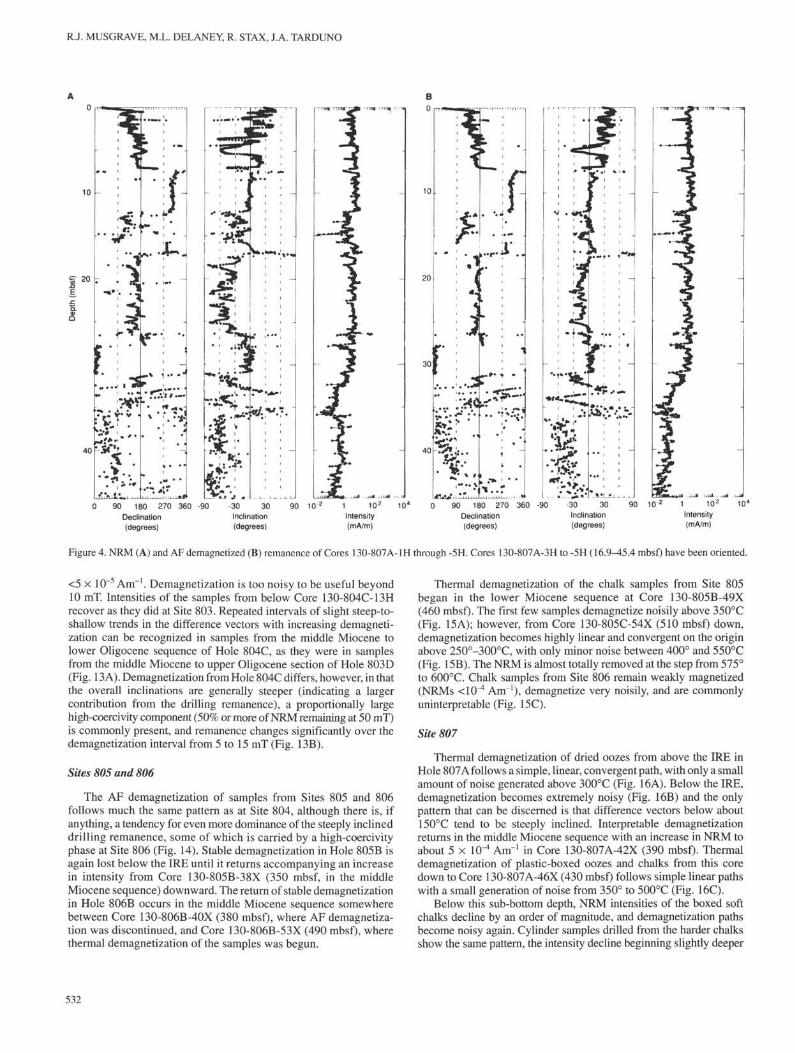
Intervals of anomalous overprint magnetization are seen at sub-bottom depths near the IRE in Sites 806 and 807. In Hole 806B,immediately below the IRE at 10.5 mbsf, the AF-cleaned declinationand inclination records are complex and remain so to a depth of about12.5 mbsf (see Figs. 1B-1C). Declination then follows an extraordinaryspiralling path through three complete revolutions from the top ofCore 130-806B-3H at 16.0 mbsf down to 21 mbsf. Over this intervalinclination swings from +60° to -70° and intensity is increased.Below 21 mbsf the AF-cleaned record becomes chaotic, and intensi-ties decrease again. Complex magnetization features also appear inthe record from Hole 806C, extending from immediately below theIRE at 10.3 mbsf down to 15.1 mbsf. Similar behavior occurs inHole 807A (Fig. 4), in which an interval of twisting declination andwidely varying inclination occurs, starting just below the IRE at 31mbsf and continuing to the bottom of Core 130-807A-4H at 36 mbsf.
Twisting of APC cores during their removal from the core barrelhas been reported on other ODP legs; however, although this processcould rotate declinations, it could not produce the wide and system-atic variations in inclination seen over these intervals. In addition,visual examinations of Cores 130-806B-2Hand-3H, 130-806C-2H,and 130-807A-4H, within which this complex magnetization occurs,reveal no evidence of physical disruption or internal rotation of thecores. It is difficult to envisage how these features could have arisenas primary magnetization, and they are most easily explained as adrilling-related remanence. Spiraling declination may have resultedfrom the passage of the core past a locally intense field source in thedrill string, core barrel, or on the drill floor, which was rotatingrelative to the core during the process of core recovery and removalfrom the core barrel. In Hole 806B the interval of spiraling declina-tion is marked by an increase in NRM intensity over the intervalsabove and below it. The contrast in intensity is more pronouncedafter AF demagnetization. This behavior, and the resistance of thisspurious component to AF demagnetization in each case where itoccurs, suggest that this component has been acquired by a relativelyhigh-coercivity phase.
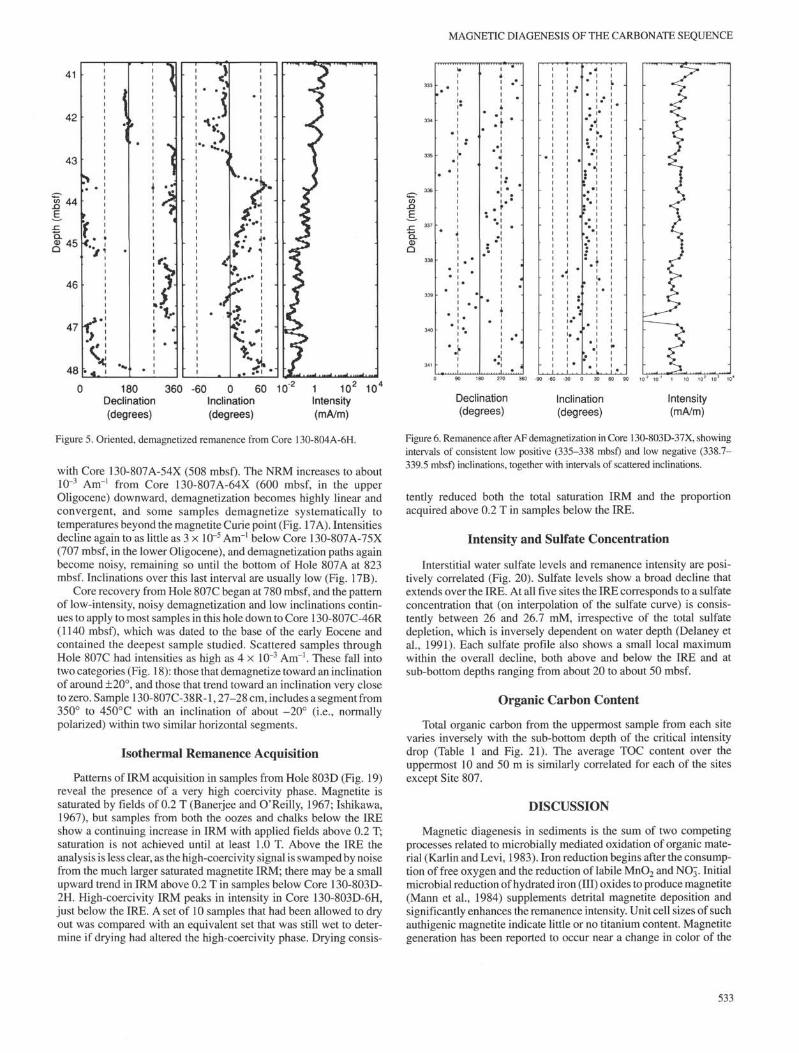
Drilling-related magnetization may also affect an interval atSite 804 in Core 130-804A-6H (Fig. 5) below 43.5 mbsf. The appar-ently normal polarity of this interval is out of magnetostratigraphicsequence (Shipboard Scientific Party, 1991), inclination is anomal-ously high and declines downward, and intensity shows a 20-cm cycleof rises and falls. Drilling-related remanence, or a combination ofdrilling remanence and viscous remanence (VRM), appears to affect
Lowest observed stablemagnetic polarity
(mbsf)
10 20 30 40 50
2000
Waterdepth
(m)3000-
4000
Site 806Latitude 0.32°N
Site 807Latitude 3.57°N
Site 805Latitude 1.23°N
Site 803 iLatitude 2.43°N
Site 804Latitude 0.98°N#
Figure 2. Sub-bottom depth at which magnetic polarity information is lost(= IRE) vs. water depth and latitude.
this interval. The anomalous magnetization again resists AF demag-netization to 15 mT.
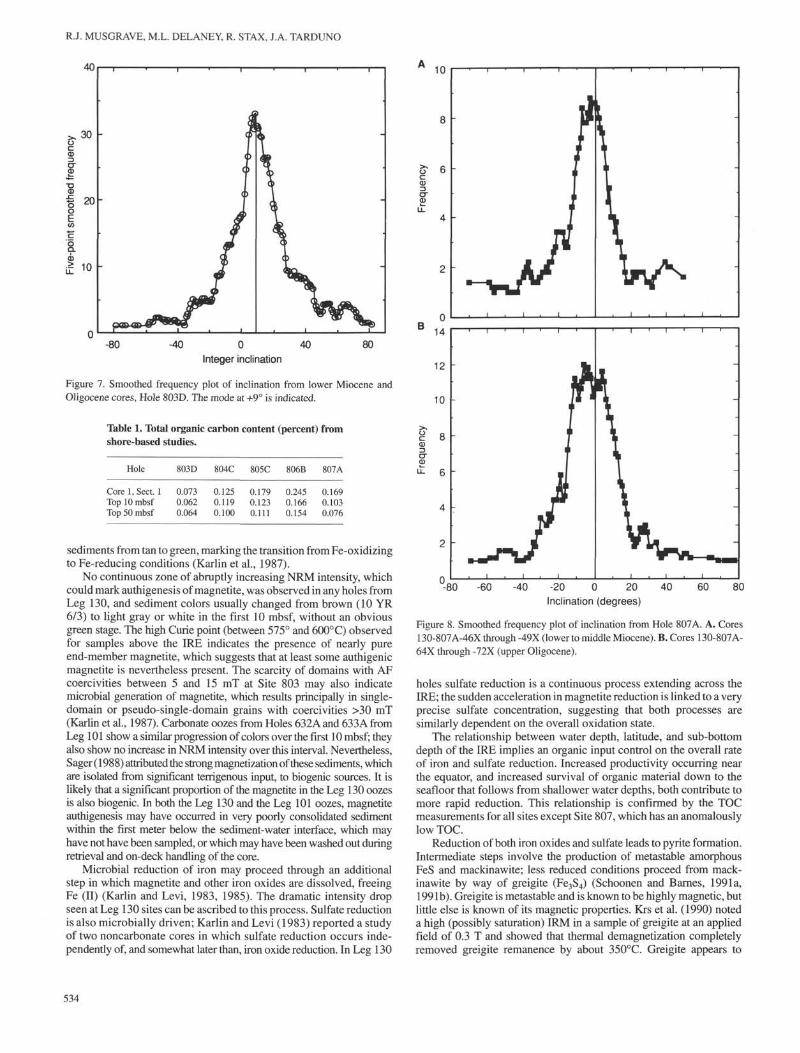
At Site 803 a gradual increase in intensities with increasingsub-bottom depth occurs in the middle Miocene section. Intensitiesrise to about 10~3-10~2 Am'1 and continue at this level through theOligocene and Eocene carbonate record. This return to higher NRMintensity is accompanied by the appearance of intervals of consistentinclination (Fig. 6). Declinations are relatively scattered as a result ofdrilling-induced fractures of the core. Polarities of these intervals canbe determined for the lower Miocene and Oligocene sequence, forwhich the paleolatitude of Site 803 (then in the Southern Hemisphere)was just sufficient to allow polarity to be recognized on the basis ofinclination alone. A rather discontinuous magnetostratigraphy, whichis in broad agreement with the biostratigraphy, was drawn up on thisbasis. A similar pattern is present in the middle Miocene sequence atthe other deeply drilled site, Site 807, although intensities there returnonly to about 10^-10~3 Am"1, and the recognition of polarity intervalsis correspondingly much less continuous.
Measurements of recognizable, consistent inclination after AFdemagnetization from Oligocene cores from Hole 803D are distrib-uted with a maximum frequency at +9° (Fig. 7), indicating an Oligo-cene paleolatitude for Site 803 of about 4.5°, within 2° of thepaleolatitude predicted for this site by the Pacific apparent polarwander path (APWP) (Gordon, 1983; Sager and Pringle, 1988). Thecorresponding peak at -9° has been suppressed because the majorityof the data represent the interval from Chrons C12 to C10, overwhich reversed polarities (Southern Hemi-sphere positive inclina-tions) dominate. A primary DRM (or pDRM) appears to have beenisolated by AF demagnetization in this case.
Analysis of the Miocene to Eocene sequence of Site 807,however, is less clear. The cleaned inclination data can be dividedinto four intervals: Miocene, late Oligocene, early Oligocene, andEocene. Expected primary inclinations derived from the PacificAPWP for these intervals are about ±3.5°, ±8° to ±11.5°, ±12°to ±14°, and ±15.5 to ±25°, respectively. Broad frequency maximafor both the Miocene and the late Oligocene AF-cleaned data fromHole 807A extend over the range between the negative and positive
530
MAGNETIC DIAGENESIS OF THE CARBONATE SEQUENCE
Q.CD
Q
•
t
•
•
•
•
•
-
•
•
r <
>
i
• * i
- .*'m i
•i• i. i
i *ii
• i
J *i .ii .i * .
' T. 1- 1 *
*J. * 1• 1• *l
" I 1. l
, 1I j
" * l .: #
i *
- i. i
. i• ;
• i- . i
' » i•^ i
.
•
•
P
•
360 -90 -60 -30 30 60 90 102 10"'
Declination(degrees)
Inclination(degrees)
Intensity(mA/m)
Figure 3. NRM of Core 130-806B-11H. Note the steeply negative inclinations.
expected inclinations, but both distributions are biased towardsteeper negative inclinations (Fig. 8). The presence of both a primarymagnetization and an overprint that has resisted the 15-mT demag-netization can be inferred for this part of the sequence. The peak ofthe AF-cleaned, early Oligocene inclination frequency (Fig. 9) oc-curs at +6°, essentially the inclination expected at this site for a VRMacquired over the Brunhes Chron. Primary magnetizations from theearly Oligocene sequence have apparently been completely orlargely replaced by VRM. The Eocene AF-cleaned inclinations havea peak frequency at -22°, suggesting that a normal primary magneti-zation has been preserved over this part of the sequence at this site.The equivalent positive inclination peak is suppressed, which maysuggest an excess of normal polarity over the intervals represented.Overprinting could also be a source of a bias toward negativeinclinations, however, and cannot be ruled out.
Discrete Samples
Site 803
The shallowest sample, 130-803C-1H-2, 74-76 cm, is weaklymagnetized (NRM = 4 × 10"5 Am"1) and unstable when demagnetized.Samples below the top core but above the IRE exhibit demagnetiza-tion paths with relatively low noise levels. After removal of softcomponents at 5 mT, little further change takes place in direction orintensity up to 20 mT. Demagnetization above 20 mT usually pro-ceeds along a fairly linear, low inclination path, but subtle changes indirection are present through the higher demagnetization steps. Thelast few steps commonly trend slightly away from convergence on
the origin of the orthogonal plot, and 5%-25% of remanence remainsat 50 mT (Fig. 10A).
An abrupt change occurs in demagnetization character beginningwith Samples 130-803D-5H-2, 74-76 cm (33.24 mbsf), and 130-803C-4H-2, 86-88 cm (49.86 mbsf). From this point down to about210 mbsf (Core 130-803D-24H), the samples are characterized byinconsistent and scattered demagnetization behavior, with NRMintensities from about 1 × 10~5 to 5 × 10~5 Am"1. Where demagneti-zation is not completely randomized, roughly linear segments canbe recognized at intermediate coercivities from about 10 to 35 mT,but these fail to converge (to varying degrees) on the origin of theplot, suggesting the presence of a further component or components(Fig. 10B). Demagnetization vectors from 35 to 50 mT are closelygrouped and from 20% to 40% of NRM persists at 50 mT, indicatingthe high coercivity of this component. Although the high-coercivitycomponent(s) could not be isolated, its inclination appears to beclose to zero. Inclinations of the intermediate coercivity segmentvary from 0° to ±15°.
Below 210 mbsf (Core 130-803D-25X), NRM intensities ofsamples from Hole 803D gradually increase until they reach 10~2
Am"1 in Sample 130-803D-40X-3,103-105 cm. Many samples overthis interval (which extends from the middle Miocene down to theupper Oligocene) display four distinct stages of demagnetization, insome variation on the following (Fig. 10C). Little change occursfrom the NRM to 15 mT, except in some cases for the removal of asmall component by 5 mT. Over the short interval from about 15 to25 mT, inclination of the successive removed components ("differ-ence vectors") decreases slightly. Above 25 mT the pattern repeats;the inclination of the difference vectors first increases slightlyagain, then decreases to near zero by 40-45 mT. Declination doesnot change much over either of these intervals. From 40 to 50 mTthe difference vectors may suddenly change direction, and about10% of the NRM remains at 50 mT. Other samples are similar, butthe repetition of the inclination pattern is less clearly developed insome cases, particularly in the deeper samples. The two intermediatestages may be explained by a repeated pattern of a small overprint of thesteeply inclined component (probably a drilling remanence) over alow-inclination component (either a primary or diagenetic magneti-zation or a VRM). Repetition of the pattern is presumably caused bythe presence of two different phases with differing coercivity spectra.The final demagnetization stages represent a trend toward one ormore magnetization components held by higher coercivity domains,which are not isolated.
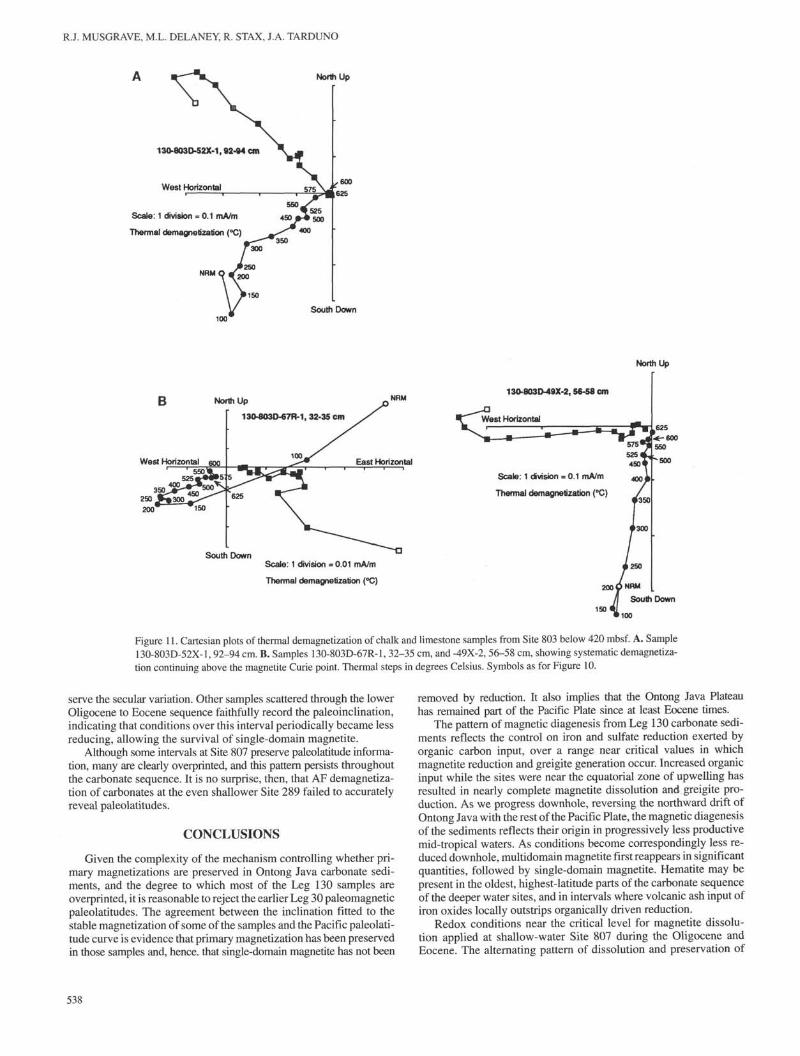
Demagnetization of chalk and limestone samples from below 420mbsf (lower Oligocene to middle Eocene) was conducted thermally.Thermally soft components were removed below 200° to 300°C.Complex changes in direction over the interval between about 400°and 525°C were superimposed on an otherwise linear, convergentpath (Fig. 11 A). Between 575° and 600°C (i.e, the Curie point ofend-member magnetite), the NRM was usually totally destroyed,other than for small amounts of random noise. Exceptions are middleEocene Samples 130-803D-64X-CC, 16-18 cm; -65X-CC, 7-9 cm;and -67R-1,32-35 cm (the deepest samples treated) and perhaps alsoSample 130-803D-49X-2, 56-58 cm, from the lower Oligocene.These appear to continue to demagnetize systematically up to 625 °C,at which stage a small component still remains (Fig. 11B).
Site 804
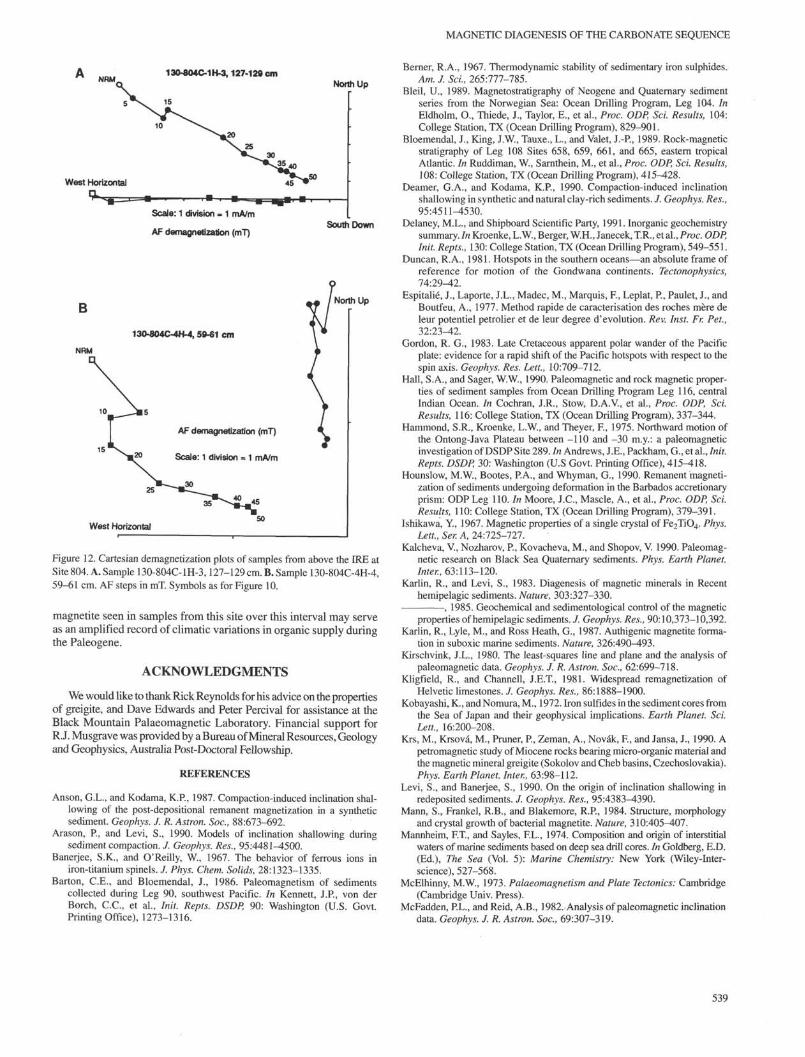
Samples from Hole 804C above the IRE generally resemble thosefrom the equivalent interval at Site 803, but they demagnetize morecontinually over the interval from 5 to 20 mT (Fig. 12A). Samples130-804C-2H-2,130-132 cm, and -4H-4,59-61 cm (Fig. 12B), havea larger proportion of NRM remaining at 50 mT.
In the upper Miocene sequence between Cores 130-804C-6H(where the IRE occurs) and 130-804C-13H (110 mbsf), intensities are
531
R.J. MUSGRAVE, M.L. DELANEY, R. STAX, J.A. TARDUNO
40
90 180 270 360 -90Declination(degrees)
90 180 270 360 -90Declination(degrees)
Figure 4. NRM (A) and AF demagnetized (B) remanence of Cores 130-807A- 1H through -5H. Cores 130-807A-3H to -5H (16.9-45.4 mbsf) have been oriented.
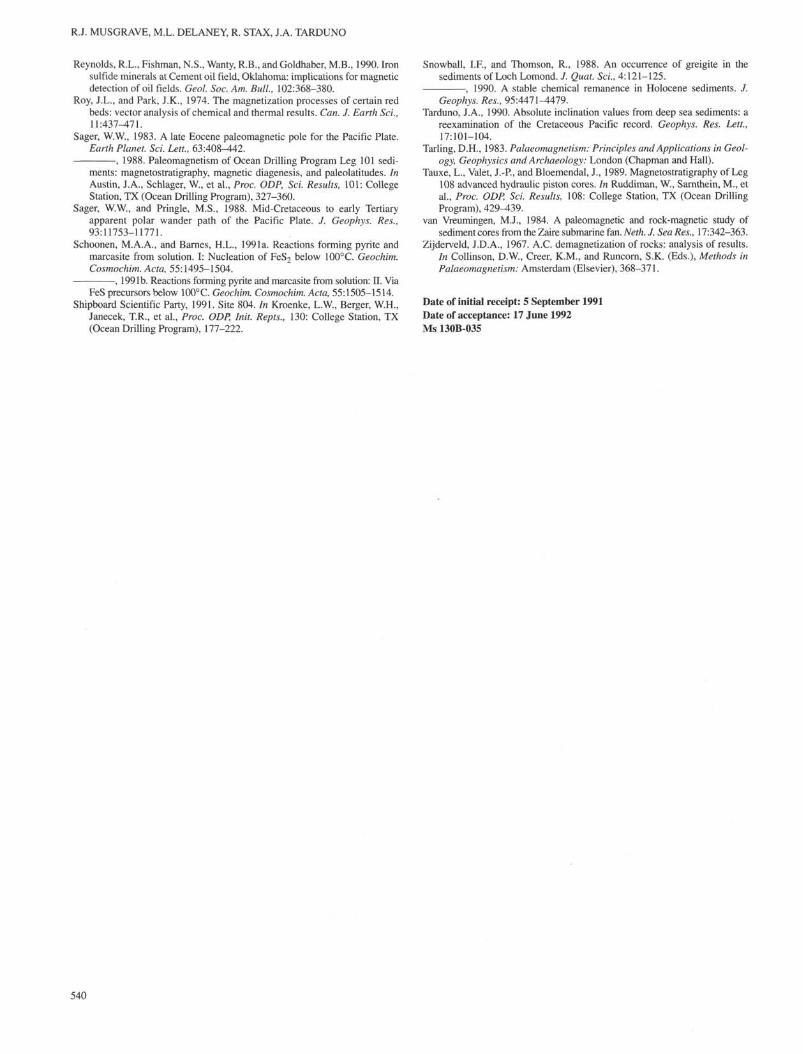
<5 × 10 5 Am '. Demagnetization is too noisy to be useful beyond10 mT. Intensities of the samples from below Core 130-804C-13Hrecover as they did at Site 803. Repeated intervals of slight steep-to-shallow trends in the difference vectors with increasing demagneti-zation can be recognized in samples from the middle Miocene tolower Oligocene sequence of Hole 804C, as they were in samplesfrom the middle Miocene to upper Oligocene section of Hole 803D(Fig. 13A). Demagnetization from Hole 804C differs, however, in thatthe overall inclinations are generally steeper (indicating a largercontribution from the drilling remanence), a proportionally largehigh-coercivity component (50% or more of NRM remaining at 50 mT)is commonly present, and remanence changes significantly over thedemagnetization interval from 5 to 15 mT (Fig. 13B).
Sites 805 and 806
The AF demagnetization of samples from Sites 805 and 806follows much the same pattern as at Site 804, although there is, ifanything, a tendency for even more dominance of the steeply inclineddrilling remanence, some of which is carried by a high-coercivityphase at Site 806 (Fig. 14). Stable demagnetization in Hole 805B isagain lost below the IRE until it returns accompanying an increasein intensity from Core 130-805B-38X (350 mbsf, in the middleMiocene sequence) downward. The return of stable demagnetizationin Hole 806B occurs in the middle Miocene sequence somewherebetween Core 130-806B-40X (380 mbsf), where AF demagnetiza-tion was discontinued, and Core 130-806B-53X (490 mbsf), wherethermal demagnetization of the samples was begun.
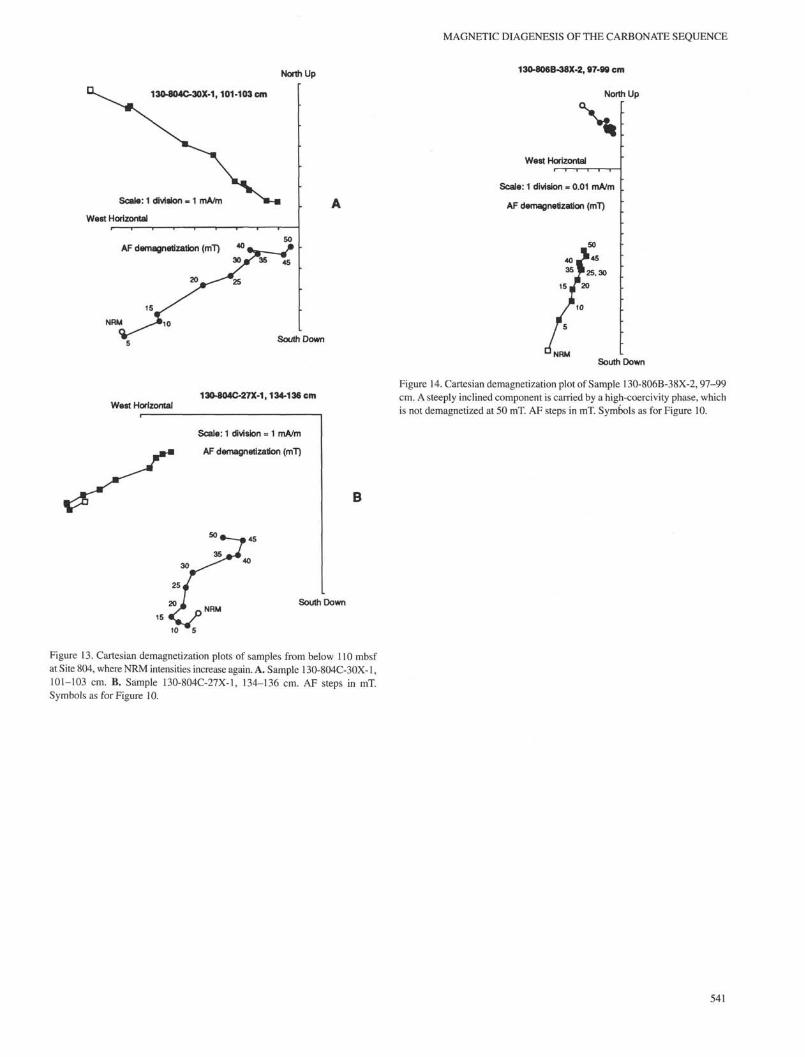
Thermal demagnetization of the chalk samples from Site 805began in the lower Miocene sequence at Core 130-805B-49X(460 mbsf) The first few samples demagnetize noisily above 350°C(Fig. 15A); however, from Core 130-805C-54X (510 mbsf) down,demagnetization becomes highly linear and convergent on the originabove 250°-300°C, with only minor noise between 400° and 550°C(Fig. 15B). The NRM is almost totally removed at the step from 575°to 600°C. Chalk samples from Site 806 remain weakly magnetized(NRMs <IO^4 Am"1), demagnetize very noisily, and are commonlyuninterprctable (Fig. 15C).
Site 807
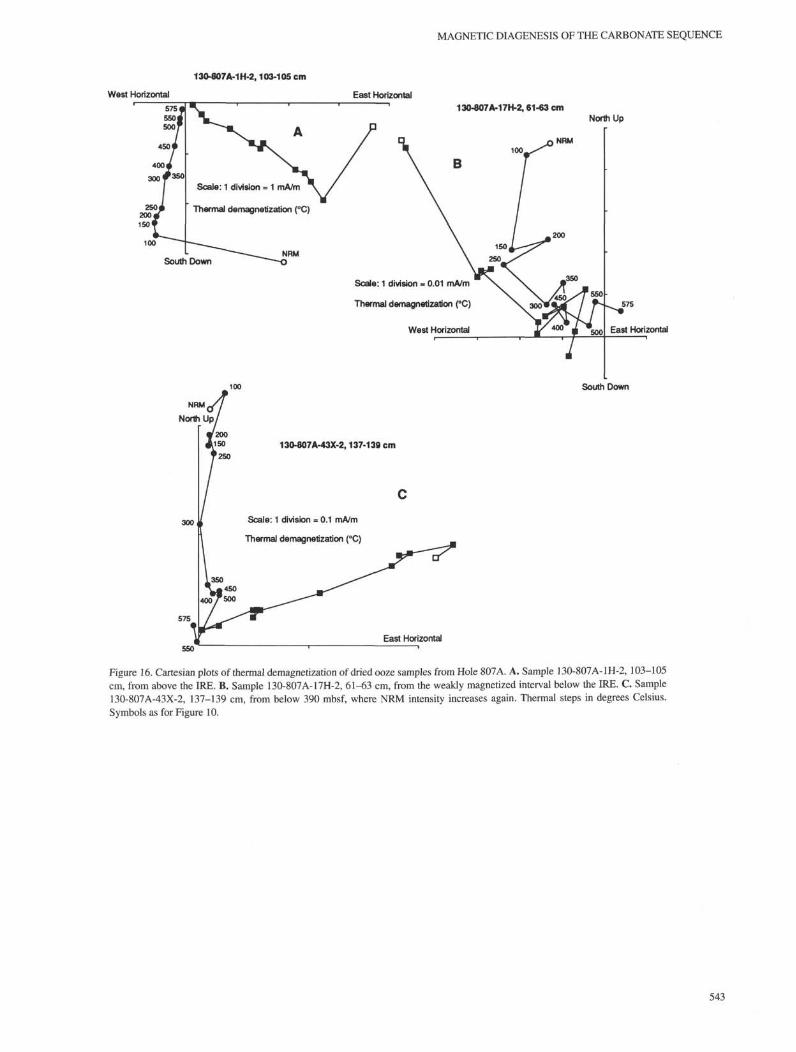
Thermal demagnetization of dried oozes from above the IRE inHole 807 A follows a simple, linear, convergent path, with only a smallamount of noise generated above 300°C (Fig. 16A). Below the IRE,demagnetization becomes extremely noisy (Fig. 16B) and the onlypattern that can be discerned is that difference vectors below about150°C tend to be steeply inclined. Interpretable demagnetizationreturns in the middle Miocene sequence with an increase in NRM toabout 5 × 10"1 Am"1 in Core 130-807A-42X (390 mbsf). Thermaldemagnetization of plastic-boxed oozes and chalks from this coredown to Core 130-807A-46X (430 mbsf) follows simple linear pathswith a small generation of noise from 350° to 500°C (Fig. 16C).
Below this sub-bottom depth, NRM intensities of the boxed softchalks decline by an order of magnitude, and demagnetization pathsbecome noisy again. Cylinder samples drilled from the harder chalksshow the same pattern, the intensity decline beginning slightly deeper
532
MAGNETIC DIAGENESIS OF THE CARBONATE SEQUENCE
41
42
43
f 44ε
pth
i
oj 45o
46
47
48
f
f.fV
X
•
* 4 ' ""
"I]I
r ii
11i *i ?i .iiiii
i'V
»
• i
< >
1
•
>
* ' .
< :
v ' •
- 5^̂j
<<*
\1
lj._l._l._l._J.-
,-2 10 2 1 0 40 180 360 -60 0 60 10" 1
Declination Inclination Intensity(degrees) (degrees) (mA/m)
Figure 5. Oriented, demagnetized remanence from Core 130-804A-6H.
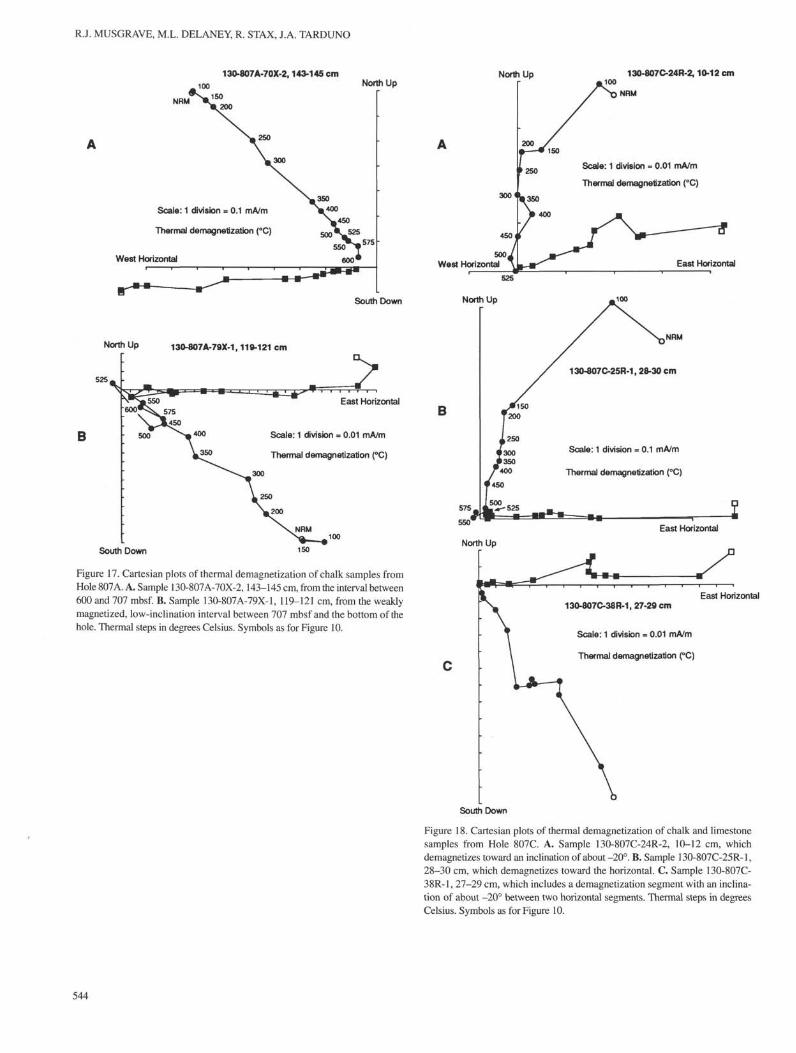
with Core 130-807A-54X (508 mbsf). The NRM increases to about10"3 Am"1 from Core 130-807A-64X (600 mbsf, in the upperOligocene) downward, demagnetization becomes highly linear andconvergent, and some samples demagnetize systematically totemperatures beyond the magnetite Curie point (Fig. 17A). Intensitiesdecline again to as little as 3 × 10"5 Am"1 below Core 130-807A-75X(707 mbsf, in the lower Oligocene), and demagnetization paths againbecome noisy, remaining so until the bottom of Hole 807A at 823mbsf. Inclinations over this last interval are usually low (Fig. 17B).
Core recovery from Hole 807C began at 780 mbsf, and the patternof low-intensity, noisy demagnetization and low inclinations contin-ues to apply to most samples in this hole down to Core 130-807C-46R(1140 mbsf), which was dated to the base of the early Eocene andcontained the deepest sample studied. Scattered samples throughHole 807C had intensities as high as 4 × 10"3 Am"1. These fall intotwo categories (Fig. 18): those that demagnetize toward an inclinationof around ±20°, and those that trend toward an inclination very closeto zero. Sample 130-807C-38R-1,27-28 cm, includes a segment from350° to 450°C with an inclination of about -20° (i.e., normallypolarized) within two similar horizontal segments.
Isothermal Remanence Acquisition
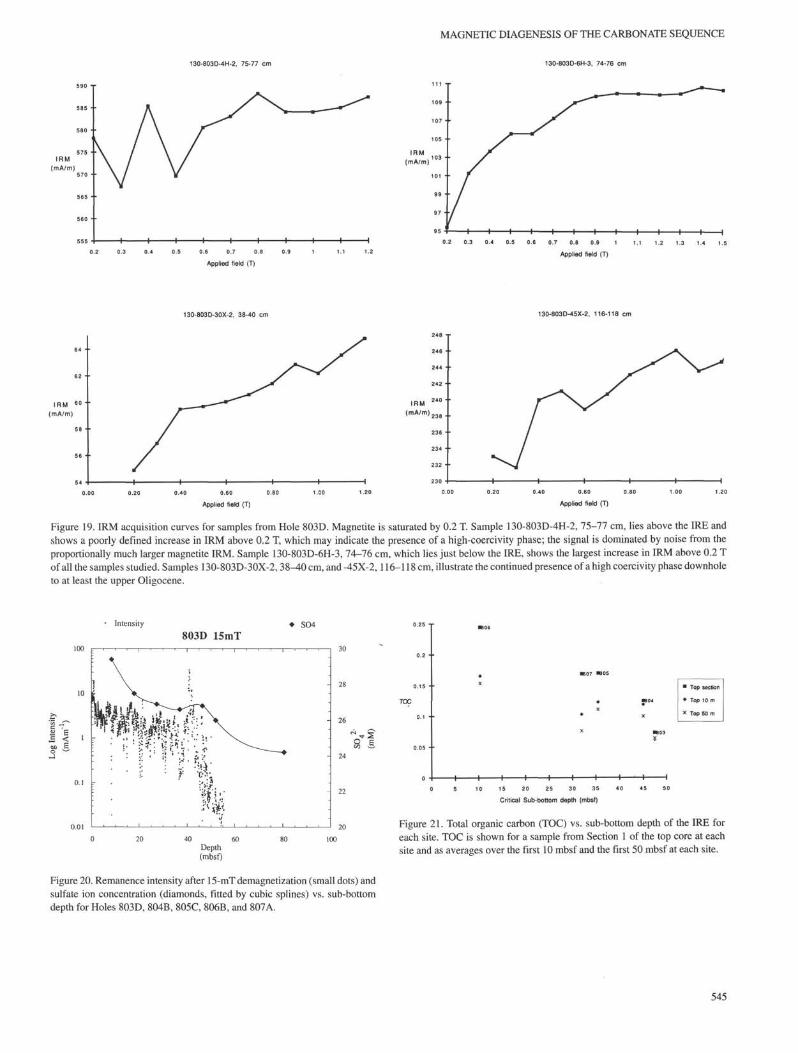
Patterns of IRM acquisition in samples from Hole 803D (Fig. 19)reveal the presence of a very high coercivity phase. Magnetite issaturated by fields of 0.2 T (Banerjee and O'Reilly, 1967; Ishikawa,1967), but samples from both the oozes and chalks below the IREshow a continuing increase in IRM with applied fields above 0.2 T;saturation is not achieved until at least 1.0 T. Above the IRE theanalysis is less clear, as the high-coercivity signal is swamped by noisefrom the much larger saturated magnetite IRM; there may be a smallupward trend in IRM above 0.2 T in samples below Core 13O-8O3D-2H. High-coercivity IRM peaks in intensity in Core 130-803D-6H,just below the IRE. A set of 10 samples that had been allowed to dryout was compared with an equivalent set that was still wet to deter-mine if drying had altered the high-coercivity phase. Drying consis-
-Q
ε
CD
a
•
• «
•
•
•
•
•
<
*
1
*
> *
• *
• * •
•
•
•
* #
1
i
•
. . .
•
0 90 180 270 360 90 60 -30 0 30 60 90 10 2 10 ' 0 10 10 10
Declination(degrees)
Inclination(degrees)
Intensity(mA/m)
Figure 6. Remanence after AF demagnetization in Core 130-803D-37X, showingintervals of consistent low positive (335-338 mbsf) and low negative (338.7-339.5 mbsf) inclinations, together with intervals of scattered inclinations.
tently reduced both the total saturation IRM and the proportionacquired above 0.2 T in samples below the IRE.
Intensity and Sulfate Concentration
Interstitial water sulfate levels and remanence intensity are posi-tively correlated (Fig. 20). Sulfate levels show a broad decline thatextends over the IRE. At all five sites the IRE corresponds to a sulfateconcentration that (on interpolation of the sulfate curve) is consis-tently between 26 and 26.7 mM, irrespective of the total sulfatedepletion, which is inversely dependent on water depth (Delaney etal., 1991). Each sulfate profile also shows a small local maximumwithin the overall decline, both above and below the IRE and atsub-bottom depths ranging from about 20 to about 50 mbsf.
Organic Carbon Content
Total organic carbon from the uppermost sample from each sitevaries inversely with the sub-bottom depth of the critical intensitydrop (Table 1 and Fig. 21). The average TOC content over theuppermost 10 and 50 m is similarly correlated for each of the sitesexcept Site 807.
DISCUSSION
Magnetic diagenesis in sediments is the sum of two competingprocesses related to microbially mediated oxidation of organic mate-rial (Karlin and Levi, 1983). Iron reduction begins after the consump-tion of free oxygen and the reduction of labile MnO2 and NO3. Initialmicrobial reduction of hydrated iron (III) oxides to produce magnetite(Mann et al., 1984) supplements detrital magnetite deposition andsignificantly enhances the remanence intensity. Unit cell sizes of suchauthigenic magnetite indicate little or no titanium content. Magnetitegeneration has been reported to occur near a change in color of the
533
R.J. MUSGRAVE, M.L. DELANEY, R. STAX, J.A. TARDUNO
401—r
-40 0 40Integer inclination
80
Figure 7. Smoothed frequency plot of inclination from lower Miocene andOligocene cores, Hole 803D. The mode at +9° is indicated.
Table 1. Total organic carbon content (percent) fromshore-based studies.
Hole
Core l,Sect. 1Top 10 mbsfTop 50 mbsf
803D
0.0730.0620.064
804C
0.1250.1190.100
805C
0.1790.1230.111
806B
0.2450.1660.154
807A
0.1690.1030.076
sediments from tan to green, marking the transition from Fe-oxidizingto Fe-reducing conditions (Karlin et al., 1987).
No continuous zone of abruptly increasing NRM intensity, whichcould mark authigenesis of magnetite, was observed in any holes fromLeg 130, and sediment colors usually changed from brown (10 YR6/3) to light gray or white in the first 10 mbsf, without an obviousgreen stage. The high Curie point (between 575° and 600° C) observedfor samples above the IRE indicates the presence of nearly pureend-member magnetite, which suggests that at least some authigenicmagnetite is nevertheless present. The scarcity of domains with AFcoercivities between 5 and 15 mT at Site 803 may also indicatemicrobial generation of magnetite, which results principally in single-domain or pseudo-single-domain grains with coercivities >30 mT(Karlin et al., 1987). Carbonate oozes from Holes 632A and 633A fromLeg 101 show a similar progression of colors over the first 10 mbsf; theyalso show no increase in NRM intensity over this interval. Nevertheless,Sager (1988) attributed the strong magnetization of these sediments, whichare isolated from significant terrigenous input, to biogenic sources. It islikely that a significant proportion of the magnetite in the Leg 130 oozesis also biogenic. In both the Leg 130 and the Leg 101 oozes, magnetiteauthigenesis may have occurred in very poorly consolidated sedimentwithin the first meter below the sediment-water interface, which mayhave not have been sampled, or which may have been washed out duringretrieval and on-deck handling of the core.
Microbial reduction of iron may proceed through an additionalstep in which magnetite and other iron oxides are dissolved, freeingFe (II) (Karlin and Levi, 1983, 1985). The dramatic intensity dropseen at Leg 130 sites can be ascribed to this process. Sulfate reductionis also microbially driven; Karlin and Levi (1983) reported a studyof two noncarbonate cores in which sulfate reduction occurs inde-pendently of, and somewhat later than, iron oxide reduction. In Leg 130
-20 0 20Inclination (degrees)
Figure 8. Smoothed frequency plot of inclination from Hole 807A. A. Cores130-807A-46X through -49X (lower to middle Miocene). B. Cores 130-807 A-64X through -72X (upper Oligocene).
holes sulfate reduction is a continuous process extending across theIRE; the sudden acceleration in magnetite reduction is linked to a veryprecise sulfate concentration, suggesting that both processes aresimilarly dependent on the overall oxidation state.
The relationship between water depth, latitude, and sub-bottomdepth of the IRE implies an organic input control on the overall rateof iron and sulfate reduction. Increased productivity occurring nearthe equator, and increased survival of organic material down to theseafloor that follows from shallower water depths, both contribute tomore rapid reduction. This relationship is confirmed by the TOCmeasurements for all sites except Site 807, which has an anomalouslylow TOC.
Reduction of both iron oxides and sulfate leads to pyrite formation.Intermediate steps involve the production of metastable amorphousFeS and mackinawite; less reduced conditions proceed from mack-inawite by way of greigite (Fe3S4) (Schoonen and Barnes, 1991a,1991b). Greigite is metastable and is known to be highly magnetic, butlittle else is known of its magnetic properties. Krs et al. (1990) noteda high (possibly saturation) IRM in a sample of greigite at an appliedfield of 0.3 T and showed that thermal demagnetization completelyremoved greigite remanence by about 350°C. Greigite appears to
534
MAGNETIC DIAGENESIS OF THE CARBONATE SEQUENCE
-80 -60 -40 -20 0 20 40 60 80
-60 -30 0 30Inclination (degrees)
60 90
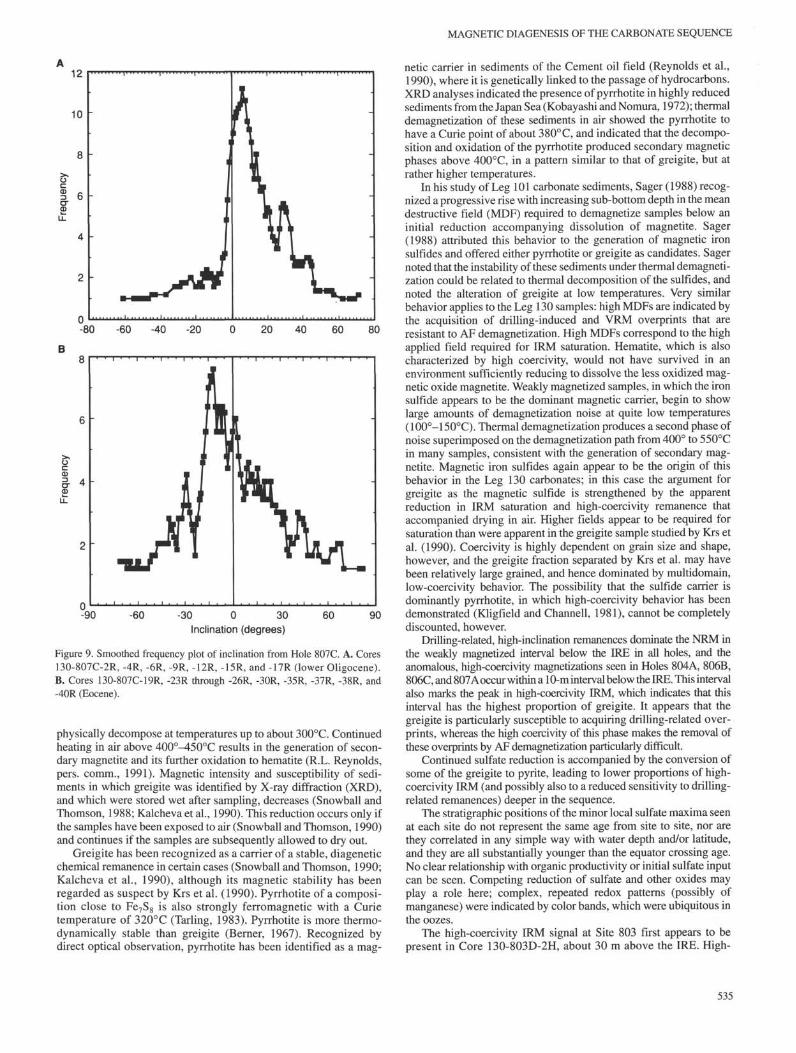
Figure 9. Smoothed frequency plot of inclination from Hole 807C. A. Cores130-807C-2R, -4R, -6R, -9R, -12R, -15R, and -17R (lower Oligocene).B. Cores 130-807C-19R, -23R through -26R, -30R, -35R, -37R, -38R, and-40R (Eocene).
physically decompose at temperatures up to about 300°C. Continuedheating in air above 400°-450°C results in the generation of secon-dary magnetite and its further oxidation to hematite (R.L. Reynolds,pers. comm., 1991). Magnetic intensity and susceptibility of sedi-ments in which greigite was identified by X-ray diffraction (XRD),and which were stored wet after sampling, decreases (Snowball andThomson, 1988; Kalcheva et al., 1990). This reduction occurs only ifthe samples have been exposed to air (Snowball and Thomson, 1990)and continues if the samples are subsequently allowed to dry out.
Greigite has been recognized as a carrier of a stable, diageneticchemical remanence in certain cases (Snowball and Thomson, 1990;Kalcheva et al., 1990), although its magnetic stability has beenregarded as suspect by Krs et al. (1990). Pyrrhotite of a composi-tion close to Fe7S8 is also strongly ferromagnetic with a Curietemperature of 320°C (Tarling, 1983). Pyrrhotite is more thermo-dynamically stable than greigite (Berner, 1967). Recognized bydirect optical observation, pyrrhotite has been identified as a mag-
netic carrier in sediments of the Cement oil field (Reynolds et al.,1990), where it is genetically linked to the passage of hydrocarbons.XRD analyses indicated the presence of pyrrhotite in highly reducedsediments from the Japan Sea (Kobayashi and Nomura, 1972); thermaldemagnetization of these sediments in air showed the pyrrhotite tohave a Curie point of about 38O°C, and indicated that the decompo-sition and oxidation of the pyrrhotite produced secondary magneticphases above 400°C, in a pattern similar to that of greigite, but atrather higher temperatures.
In his study of Leg 101 carbonate sediments, Sager (1988) recog-nized a progressive rise with increasing sub-bottom depth in the meandestructive field (MDF) required to demagnetize samples below aninitial reduction accompanying dissolution of magnetite. Sager(1988) attributed this behavior to the generation of magnetic ironsulfides and offered either pyrrhotite or greigite as candidates. Sagernoted that the instability of these sediments under thermal demagneti-zation could be related to thermal decomposition of the sulfides, andnoted the alteration of greigite at low temperatures. Very similarbehavior applies to the Leg 130 samples: high MDFs are indicated bythe acquisition of drilling-induced and VRM overprints that areresistant to AF demagnetization. High MDFs correspond to the highapplied field required for IRM saturation. Hematite, which is alsocharacterized by high coercivity, would not have survived in anenvironment sufficiently reducing to dissolve the less oxidized mag-netic oxide magnetite. Weakly magnetized samples, in which the ironsulfide appears to be the dominant magnetic carrier, begin to showlarge amounts of demagnetization noise at quite low temperatures(100°-150°C). Thermal demagnetization produces a second phase ofnoise superimposed on the demagnetization path from 400° to 550°Cin many samples, consistent with the generation of secondary mag-netite. Magnetic iron sulfides again appear to be the origin of thisbehavior in the Leg 130 carbonates; in this case the argument forgreigite as the magnetic sulfide is strengthened by the apparentreduction in IRM saturation and high-coercivity remanence thataccompanied drying in air. Higher fields appear to be required forsaturation than were apparent in the greigite sample studied by Krs etal. (1990). Coercivity is highly dependent on grain size and shape,however, and the greigite fraction separated by Krs et al. may havebeen relatively large grained, and hence dominated by multidomain,low-coercivity behavior. The possibility that the sulfide carrier isdominantly pyrrhotite, in which high-coercivity behavior has beendemonstrated (Kligfield and Channell, 1981), cannot be completelydiscounted, however.
Drilling-related, high-inclination remanences dominate the NRM inthe weakly magnetized interval below the IRE in all holes, and theanomalous, high-coercivity magnetizations seen in Holes 804A, 806B,806C, and 807 A. occur within a 10-m interval below the IRE. This intervalalso marks the peak in high-coercivity IRM, which indicates that thisinterval has the highest proportion of greigite. It appears that thegreigite is particularly susceptible to acquiring drilling-related over-prints, whereas the high coercivity of this phase makes the removal ofthese overprints by AF demagnetization particularly difficult.
Continued sulfate reduction is accompanied by the conversion ofsome of the greigite to pyrite, leading to lower proportions of high-coercivity IRM (and possibly also to a reduced sensitivity to drilling-related remanences) deeper in the sequence.
The stratigraphic positions of the minor local sulfate maxima seenat each site do not represent the same age from site to site, nor arethey correlated in any simple way with water depth and/or latitude,and they are all substantially younger than the equator crossing age.No clear relationship with organic productivity or initial sulfate inputcan be seen. Competing reduction of sulfate and other oxides mayplay a role here; complex, repeated redox patterns (possibly ofmanganese) were indicated by color bands, which were ubiquitous inthe oozes.
The high-coercivity IRM signal at Site 803 first appears to bepresent in Core 130-803D-2H, about 30 m above the IRE. High-
535
R.J. MUSGRAVE, ML. DELANEY, R. STAX, J.A. TARDUNO
North Up
130-803D-4H-2,75-77 cm
East Horizontal
Scale: 1 division • 1 mA/m
AF demagnetization (mT)
South Down
B130-803D-8H-2, 68-70 cm
West Horizontal
North Up 130-803D-24H-2, 75-77 cm
North Up
West Horizontal
Scale: 1 division = 0.01 mA/m
AF demagnetization (mT)
NRM
South Down
East Horizontal
South Down
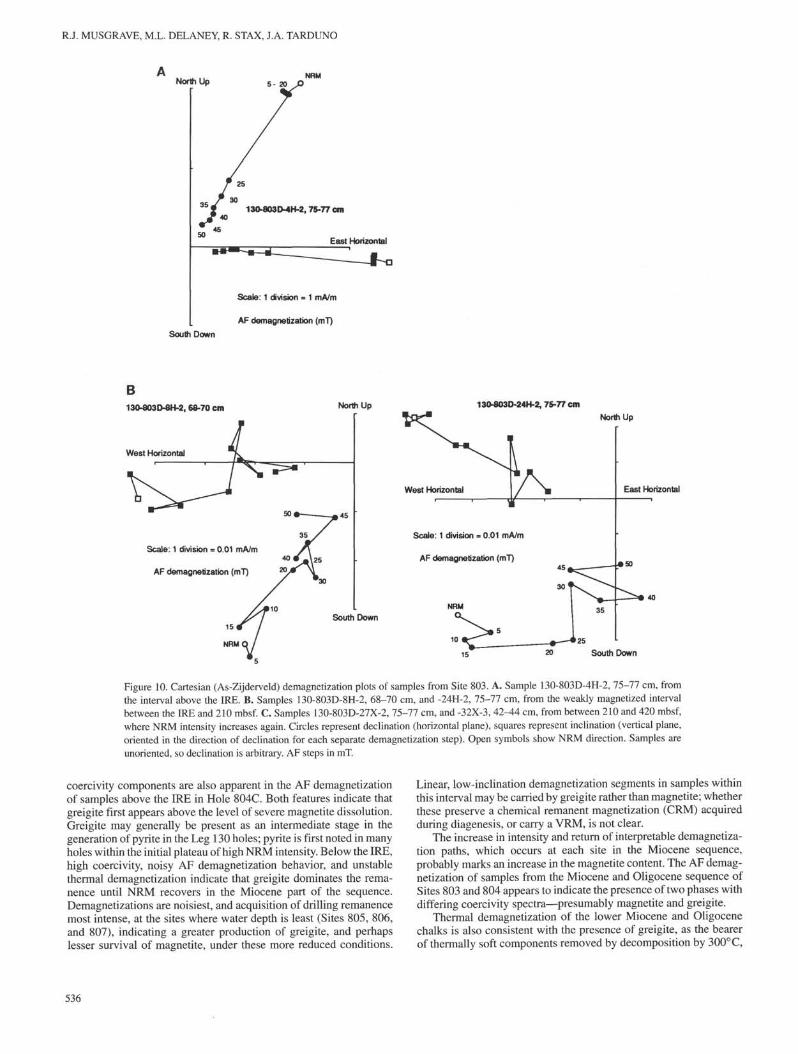
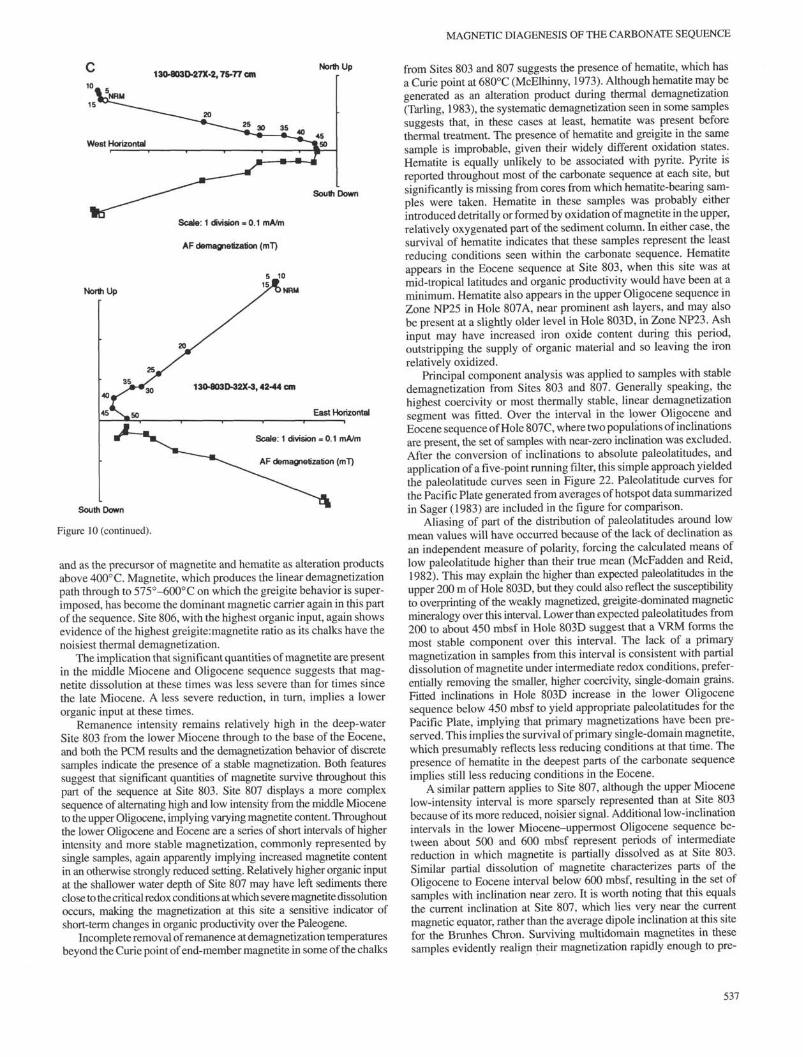
Figure 10. Cartesian (As-Zijderveld) demagnetization plots of samples from Site 803. A. Sample 130-803D-4H-2, 75-77 cm, fromthe interval above the IRE. B. Samples 130-803D-8H-2, 68-70 cm, and -24H-2, 75-77 cm, from the weakly magnetized intervalbetween the IRE and 210 mbsf. C. Samples 130-803D-27X-2, 75-77 cm, and -32X-3, 42-A4 cm, from between 210 and 420 mbsf,where NRM intensity increases again. Circles represent declination (horizontal plane), squares represent inclination (vertical plane,oriented in the direction of declination for each separate demagnetization step). Open symbols show NRM direction. Samples areunoriented, so declination is arbitrary. AF steps in mT.
coercivity components are also apparent in the AF demagnetizationof samples above the IRE in Hole 804C. Both features indicate thatgreigite first appears above the level of severe magnetite dissolution.Greigite may generally be present as an intermediate stage in thegeneration of pyrite in the Leg 130 holes; pyrite is first noted in manyholes within the initial plateau of high NRM intensity. Below the IRE,high coercivity, noisy AF demagnetization behavior, and unstablethermal demagnetization indicate that greigite dominates the rema-nence until NRM recovers in the Miocene part of the sequence.Demagnetizations are noisiest, and acquisition of drilling remanencemost intense, at the sites where water depth is least (Sites 805, 806,and 807), indicating a greater production of greigite, and perhapslesser survival of magnetite, under these more reduced conditions.
Linear, low-inclination demagnetization segments in samples withinthis interval may be carried by greigite rather than magnetite; whetherthese preserve a chemical remanent magnetization (CRM) acquiredduring diagenesis, or carry a VRM, is not clear.
The increase in intensity and return of interpretable demagnetiza-tion paths, which occurs at each site in the Miocene sequence,probably marks an increase in the magnetite content. The AF demag-netization of samples from the Miocene and Oligocene sequence ofSites 803 and 804 appears to indicate the presence of two phases withdiffering coercivity spectra—presumably magnetite and greigite.
Thermal demagnetization of the lower Miocene and Oligocenechalks is also consistent with the presence of greigite, as the bearerof thermally soft components removed by decomposition by 300°C,
536
MAGNETIC DIAGENESIS OF THE CARBONATE SEQUENCE
North Up
South Down
Scale: 1 division - 0.1 mA/m
AF demagnetization (mT)
North Up
130-803D-32X-3, 42-44 cm
East Horizontal
Scale: 1 division = 0.1 mA/m
AF demagnetization (mT)
South Down
Figure 10 (continued).
and as the precursor of magnetite and hematite as alteration productsabove 400° C. Magnetite, which produces the linear demagnetizationpath through to 575°-600°C on which the greigite behavior is super-imposed, has become the dominant magnetic carrier again in this partof the sequence. Site 806, with the highest organic input, again showsevidence of the highest greigite:magnetite ratio as its chalks have thenoisiest thermal demagnetization.
The implication that significant quantities of magnetite are presentin the middle Miocene and Oligocene sequence suggests that mag-netite dissolution at these times was less severe than for times sincethe late Miocene. A less severe reduction, in turn, implies a lowerorganic input at these times.
Remanence intensity remains relatively high in the deep-waterSite 803 from the lower Miocene through to the base of the Eocene,and both the PCM results and the demagnetization behavior of discretesamples indicate the presence of a stable magnetization. Both featuressuggest that significant quantities of magnetite survive throughout thispart of the sequence at Site 803. Site 807 displays a more complexsequence of alternating high and low intensity from the middle Mioceneto the upper Oligocene, implying varying magnetite content. Throughoutthe lower Oligocene and Eocene are a series of short intervals of higherintensity and more stable magnetization, commonly represented bysingle samples, again apparently implying increased magnetite contentin an otherwise strongly reduced setting. Relatively higher organic inputat the shallower water depth of Site 807 may have left sediments thereclose to the critical redox conditions at which severe magnetite dissolutionoccurs, making the magnetization at this site a sensitive indicator ofshort-term changes in organic productivity over the Paleogene.
Incomplete removal of remanence at demagnetization temperaturesbeyond the Curie point of end-member magnetite in some of the chalks
from Sites 803 and 807 suggests the presence of hematite, which hasa Curie point at 680°C (McElhinny, 1973). Although hematite may begenerated as an alteration product during thermal demagnetization(Tarling, 1983), the systematic demagnetization seen in some samplessuggests that, in these cases at least, hematite was present beforethermal treatment. The presence of hematite and greigite in the samesample is improbable, given their widely different oxidation states.Hematite is equally unlikely to be associated with pyrite. Pyrite isreported throughout most of the carbonate sequence at each site, butsignificantly is missing from cores from which hematite-bearing sam-ples were taken. Hematite in these samples was probably eitherintroduced detritally or formed by oxidation of magnetite in the upper,relatively oxygenated part of the sediment column. In either case, thesurvival of hematite indicates that these samples represent the leastreducing conditions seen within the carbonate sequence. Hematiteappears in the Eocene sequence at Site 803, when this site was atmid-tropical latitudes and organic productivity would have been at aminimum. Hematite also appears in the upper Oligocene sequence inZone NP25 in Hole 807A, near prominent ash layers, and may alsobe present at a slightly older level in Hole 803D, in Zone NP23. Ashinput may have increased iron oxide content during this period,outstripping the supply of organic material and so leaving the ironrelatively oxidized.
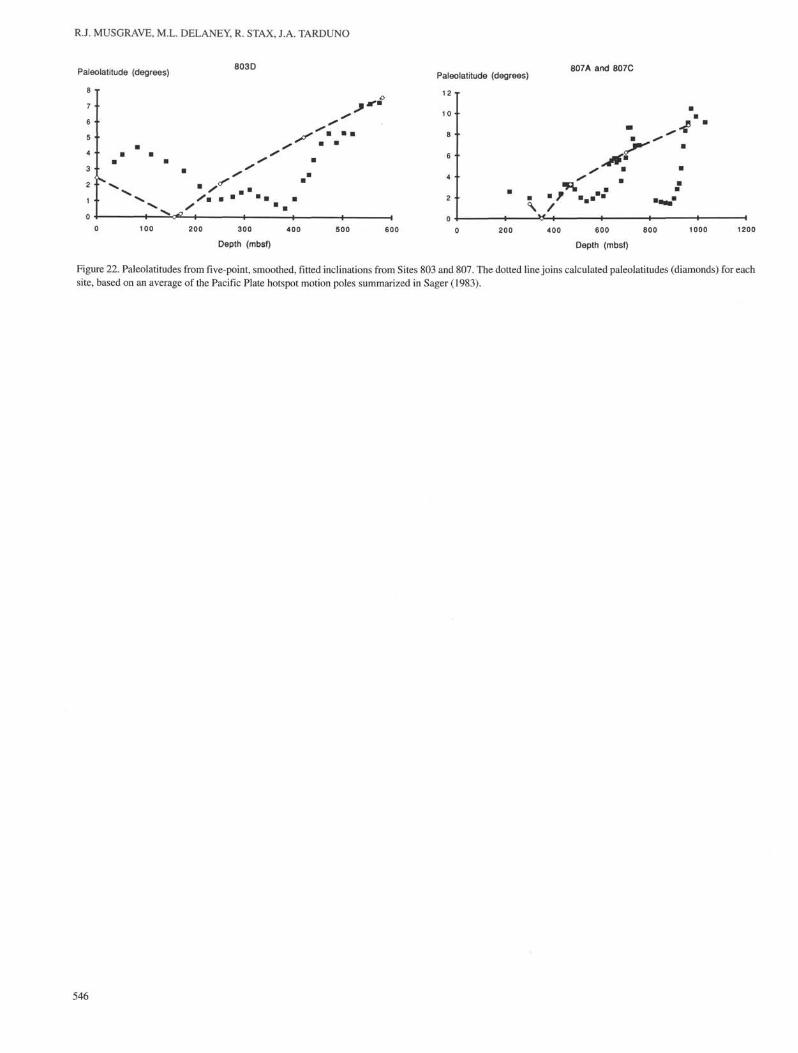
Principal component analysis was applied to samples with stabledemagnetization from Sites 803 and 807. Generally speaking, thehighest coercivity or most thermally stable, linear demagnetizationsegment was fitted. Over the interval in the lower Oligocene andEocene sequence of Hole 807C, where two populations of inclinationsare present, the set of samples with near-zero inclination was excluded.After the conversion of inclinations to absolute paleolatitudes, andapplication of a five-point running filter, this simple approach yieldedthe paleolatitude curves seen in Figure 22. Paleolatitude curves forthe Pacific Plate generated from averages of hotspot data summarizedin Sager (1983) are included in the figure for comparison.
Aliasing of part of the distribution of paleolatitudes around lowmean values will have occurred because of the lack of declination asan independent measure of polarity, forcing the calculated means oflow paleolatitude higher than their true mean (McFadden and Reid,1982). This may explain the higher than expected paleolatitudes in theupper 200 m of Hole 803D, but they could also reflect the susceptibilityto overprinting of the weakly magnetized, greigite-dominated magneticmineralogy over this interval. Lower than expected paleolatitudes from200 to about 450 mbsf in Hole 803D suggest that a VRM forms themost stable component over this interval. The lack of a primarymagnetization in samples from this interval is consistent with partialdissolution of magnetite under intermediate redox conditions, prefer-entially removing the smaller, higher coercivity, single-domain grains.Fitted inclinations in Hole 803D increase in the lower Oligocenesequence below 450 mbsf to yield appropriate paleolatitudes for thePacific Plate, implying that primary magnetizations have been pre-served. This implies the survival of primary single-domain magnetite,which presumably reflects less reducing conditions at that time. Thepresence of hematite in the deepest parts of the carbonate sequenceimplies still less reducing conditions in the Eocene.
A similar pattern applies to Site 807, although the upper Miocenelow-intensity interval is more sparsely represented than at Site 803because of its more reduced, noisier signal. Additional low-inclinationintervals in the lower Miocene-uppermost Oligocene sequence be-tween about 500 and 600 mbsf represent periods of intermediatereduction in which magnetite is partially dissolved as at Site 803.Similar partial dissolution of magnetite characterizes parts of theOligocene to Eocene interval below 600 mbsf, resulting in the set ofsamples with inclination near zero. It is worth noting that this equalsthe current inclination at Site 807, which lies very near the currentmagnetic equator, rather than the average dipole inclination at this sitefor the Brunhes Chron. Surviving multidomain magnetites in thesesamples evidently realign their magnetization rapidly enough to pre-
537
R.J. MUSGRAVE, ML. DELANEY, R. STAX, J.A. TARDUNO
North Up
13O-803D-52X-1,92-94 cm
West Horizontal
Scale: 1 division = 0.1 mA/m
Thermal demagnetization (°C)
, 6 0 0
625
South Down
North Up
East Horizontal
130-803D-49X-2,56-58 cm
Scale: 1 division - 0.1 mA/m
Thermal demagnetization (°C)
South DownScale: 1 division =0.01 mA/m
Thermal demagnetization (°C)200PNRM
South Down150 l"
~MOO
Figure 11. Cartesian plots of thermal demagnetization of chalk and limestone samples from Site 803 below 420 mbsf. A. Sample130-803D-52X-1, 92-94 cm. B. Samples 130-803D-67R-1, 32-35 cm, and -49X-2, 56-58 cm, showing systematic demagnetiza-tion continuing above the magnetite Curie point. Thermal steps in degrees Celsius. Symbols as for Figure 10.
serve the secular variation. Other samples scattered through the lowerOligocene to Eocene sequence faithfully record the paleoinclination,indicating that conditions over this interval periodically became lessreducing, allowing the survival of single-domain magnetite.
Although some intervals at Site 807 preserve paleolatitude informa-tion, many are clearly overprinted, and this pattern persists throughoutthe carbonate sequence. It is no surprise, then, that AF demagnetiza-tion of carbonates at the even shallower Site 289 failed to accuratelyreveal paleolatitudes.
CONCLUSIONS
Given the complexity of the mechanism controlling whether pri-mary magnetizations are preserved in Ontong Java carbonate sedi-ments, and the degree to which most of the Leg 130 samples areoverprinted, it is reasonable to reject the earlier Leg 30 paleomagneticpaleolatitudes. The agreement between the inclination fitted to thestable magnetization of some of the samples and the Pacific paleolati-tude curve is evidence that primary magnetization has been preservedin those samples and, hence, that single-domain magnetite has not been
removed by reduction. It also implies that the Ontong Java Plateauhas remained part of the Pacific Plate since at least Eocene times.
The pattern of magnetic diagenesis from Leg 130 carbonate sedi-ments reflects the control on iron and sulfate reduction exerted byorganic carbon input, over a range near critical values in whichmagnetite reduction and greigite generation occur. Increased organicinput while the sites were near the equatorial zone of upwelling hasresulted in nearly complete magnetite dissolution and greigite pro-duction. As we progress downhole, reversing the northward drift ofOntong Java with the rest of the Pacific Plate, the magnetic diagenesisof the sediments reflects their origin in progressively less productivemid-tropical waters. As conditions become correspondingly less re-duced downhole, multidomain magnetite first reappears in significantquantities, followed by single-domain magnetite. Hematite may bepresent in the oldest, highest-latitude parts of the carbonate sequenceof the deeper water sites, and in intervals where volcanic ash input ofiron oxides locally outstrips organically driven reduction.
Redox conditions near the critical level for magnetite dissolu-tion applied at shallow-water Site 807 during the Oligocene andEocene. The alternating pattern of dissolution and preservation of
538
MAGNETIC DIAGENESIS OF THE CARBONATE SEQUENCE
NRM130-804C-1H-3,127-129 cm
West Horizontal
North Up
Scale: 1 division = 1 mA/m
AF demagnetization (mT)South Down
B
NRM
North Up
130-804C-4H-4, 59-61 cm
AF demagnetization (mT)
Scale: 1 division = 1 mA/m
West Horizontal
Figure 12. Cartesian demagnetization plots of samples from above the IRE atSite 804. A. Sample 130-804C-1H-3,127-129 cm. B. Sample 130-804C-4H-4,59-61 cm. AF steps in mT. Symbols as for Figure 10.
magnetite seen in samples from this site over this interval may serveas an amplified record of climatic variations in organic supply duringthe Paleogene.
ACKNOWLEDGMENTS
We would like to thank Rick Reynolds for his advice on the propertiesof greigite, and Dave Edwards and Peter Percival for assistance at theBlack Mountain Palaeomagnetic Laboratory. Financial support forR.J. Musgrave was provided by a Bureau of Mineral Resources, Geologyand Geophysics, Australia Post-Doctoral Fellowship.
REFERENCES
Anson, G.L., and Kodama, K.R, 1987. Compaction-induced inclination shal-lowing of the post-depositional remanent magnetization in a syntheticsediment. Geophys. J. R. Astron. Soc, 88:673-692.
Arason, P., and Levi, S., 1990. Models of inclination shallowing duringsediment compaction. /. Geophys. Res., 95:4481^1500.
Banerjee, S.K., and O'Reilly, W., 1967. The behavior of ferrous ions iniron-titanium spinels. J. Phys. Chem. Solids, 28:1323-1335.
Barton, C.E., and Bloemendal, J., 1986. Paleomagnetism of sedimentscollected during Leg 90, southwest Pacific. In Kennett, J.P., von derBorch, C.C., et al., Init. Repts. DSDP, 90: Washington (U.S. Govt.Printing Office), 1273-1316.
Berner, R.A., 1967. Thermodynamic stability of sedimentary iron sulphides.Am. J. Sci., 265:777-785.
Bleil, U., 1989. Magnetostratigraphy of Neogene and Quaternary sedimentseries from the Norwegian Sea: Ocean Drilling Program, Leg 104. InEldholm, O., Thiede, J., Taylor, E., et al., Proc. ODP, Sci. Results, 104:College Station, TX (Ocean Drilling Program), 829-901.
Bloemendal, J., King, J.W., Tauxe., L., and Valet, J.-P, 1989. Rock-magneticstratigraphy of Leg 108 Sites 658, 659, 661, and 665, eastern tropicalAtlantic. In Ruddiman, W., Sarnthein, M., et al., Proc. ODP, Sci. Results,108: College Station, TX (Ocean Drilling Program), 415-Φ28.
Deamer, G.A., and Kodama, K.P., 1990. Compaction-induced inclinationshallowing in synthetic and natural clay-rich sediments. J. Geophys. Res.,95:4511-4530.
Delaney, M.L., and Shipboard Scientific Party, 1991. Inorganic geochemistrysummary. In Kroenke, L.W., Berger, W.H., Janecek, T.R., et al., Proc. ODP,Init. Repts., 130: College Station, TX (Ocean Drilling Program), 549-551.
Duncan, R.A., 1981. Hotspots in the southern oceans—an absolute frame ofreference for motion of the Gondwana continents. Tectonophysics,74:29-42.
Espitalié, J., Laporte, J.L., Madec, M., Marquis, F., Leplat, P., Paulet, J., andBoutfeu, A., 1977. Method rapide de caracterisation des roches mere deleur potentiel petrolier et de leur degree devolution. Rev. Inst. Fr. Pet.,32:23-42.
Gordon, R. G., 1983. Late Cretaceous apparent polar wander of the Pacificplate: evidence for a rapid shift of the Pacific hotspots with respect to thespin axis. Geophys. Res. Lett., 10:709-712.
Hall, S.A., and Sager, W.W., 1990. Paleomagnetic and rock magnetic proper-ties of sediment samples from Ocean Drilling Program Leg 116, centralIndian Ocean. In Cochran, J.R., Stow, D.A.V., et al., Proc. ODP, Sci.Results, 116: College Station, TX (Ocean Drilling Program), 337-344.
Hammond, S.R., Kroenke, L.W., and Theyer, F , 1975. Northward motion ofthe Ontong-Java Plateau between -110 and -30 m.y.: a paleomagneticinvestigation of DSDP Site 289. In Andrews, J.E., Packham, G., et al., Init.Repts. DSDP, 30: Washington (U.S Govt. Printing Office), 415^18.
Hounslow, M.W., Bootes, P.A., and Whyman, G., 1990. Remanent magneti-zation of sediments undergoing deformation in the Barbados accretionaryprism: ODP Leg 110. In Moore, J.C., Mascle, A., et al., Proc. ODP, Sci.Results, 110: College Station, TX (Ocean Drilling Program), 379-391.
Ishikawa, Y., 1967. Magnetic properties of a single crystal of Fe2Ti04. Phys.Lett., Sen A, 24:725-727.
Kalcheva, V., Nozharov, P., Kovacheva, M., and Shopov, V. 1990. Paleomag-netic research on Black Sea Quaternary sediments. Phys. Earth Planet.Inter., 63:113-120.
Karlin, R., and Levi, S., 1983. Diagenesis of magnetic minerals in Recenthemipelagic sediments. Nature, 303:327-330.
, 1985. Geochemical and sedimentological control of the magneticproperties of hemipelagic sediments. / . Geophys. Res., 90:10,373-10,392.
Karlin, R., Lyle, M., and Ross Heath, G., 1987. Authigenic magnetite forma-tion in suboxic marine sediments. Nature, 326:490-493.
Kirschvink, J.L., 1980. The least-squares line and plane and the analysis ofpaleomagnetic data. Geophys. J. R. Astron. Soc, 62:699-718.
Kligfield, R., and Channell, J.E.T., 1981. Widespread remagnetization ofHelvetic limestones. J. Geophys. Res., 86:1888-1900.
Kobayashi, K., and Nomura, M., 1972. Iron sulfides in the sediment cores fromthe Sea of Japan and their geophysical implications. Earth Planet. Sci.Lett., 16:200-208.
Krs, M., Krsová, M., Pruner, P., Zeman, A., Novak, F., and Jansa, J., 1990. Apetromagnetic study of Miocene rocks bearing micro-organic material andthe magnetic mineral greigite (Sokolov and Cheb basins, Czechoslovakia).Phys. Earth Planet. Inter., 63:98-112.
Levi, S., and Banerjee, S., 1990. On the origin of inclination shallowing inredeposited sediments. J. Geophys. Res., 95:4383^390.
Mann, S., Frankel, R.B., and Blakemore, R.P., 1984. Structure, morphologyand crystal growth of bacterial magnetite. Nature, 310:405^07.
Mannheim, FT, and Sayles, F.L., 1974. Composition and origin of interstitialwaters of marine sediments based on deep sea drill cores. In Goldberg, E.D.(Ed.), The Sea (Vol. 5): Marine Chemistry: New York (Wiley-Inter-science), 527-568.
McElhinny, M.W., 1973. Palaeomagnetism and Plate Tectonics: Cambridge(Cambridge Univ. Press).
McFadden, PL., and Reid, A.B., 1982. Analysis of paleomagnetic inclinationdata. Geophys. J. R. Astron. Soc, 69:307-319.
539
R.J. MUSGRAVE, M.L. DELANEY, R. STAX, J.A. TARDUNO
Reynolds, R.L., Fishman, N.S., Wanty, R.B., and Goldhaber, M.B., 1990. Ironsulfide minerals at Cement oil field, Oklahoma: implications for magneticdetection of oil fields. Geol. Soc. Am. Bull., 102:368-380.
Roy, J.L., and Park, J.K., 1974. The magnetization processes of certain redbeds: vector analysis of chemical and thermal results. Can. J. Earth Sci.,11:437-471.
Sager, W.W., 1983. A late Eocene paleomagnetic pole for the Pacific Plate.Earth Planet. Sci. Lett, 63:408^42.
, 1988. Paleomagnetism of Ocean Drilling Program Leg 101 sedi-ments: magnetostratigraphy, magnetic diagenesis, and paleolatitudes. InAustin, J.A., Schlager, W., et al., Proc. ODP, Sci. Results, 101: CollegeStation, TX (Ocean Drilling Program), 327-360.
Sager, W.W., and Pringle, M.S., 1988. Mid-Cretaceous to early Tertiaryapparent polar wander path of the Pacific Plate. J. Geophys. Res.,93:11753-11771.
Schoonen, M.A.A., and Barnes, H.L., 1991a. Reactions forming pyrite andmarcasite from solution. I: Nucleation of FeS2 below 100°C. Geochim.Cosmochim. Acta, 55:1495-1504.
, 1991b. Reactions forming pyrite and marcasite from solution: II. ViaFeS precursors below 100°C. Geochim. Cosmochim. Acta, 55:1505-1514.
Shipboard Scientific Party, 1991. Site 804. In Kroenke, L.W., Berger, W.H.,Janecek, T.R., et al., Proc. ODP, Init. Repts., 130: College Station, TX(Ocean Drilling Program), 177-222.
Snowball, I.F., and Thomson, R., 1988. An occurrence of greigite in thesediments of Loch Lomond. J. Quat. Sci., 4:121-125.
, 1990. A stable chemical remanence in Holocene sediments. J.Geophys. Res., 95:4471-4479.
Tarduno, J.A., 1990. Absolute inclination values from deep sea sediments: areexamination of the Cretaceous Pacific record. Geophys. Res. Lett.,17:101-104.
Tarling, D.H., 1983. Palaeomagnetism: Principles and Applications in Geol-ogy, Geophysics and Archaeology: London (Chapman and Hall).
Tauxe, L., Valet, J.-P., and Bloemendal, J., 1989. Magnetostratigraphy of Leg108 advanced hydraulic piston cores. In Ruddiman, W., Sarnthein, M., etal., Proc. ODP, Sci. Results, 108: College Station, TX (Ocean DrillingProgram), 429-Φ39.
van Vreumingen, M.J., 1984. A paleomagnetic and rock-magnetic study ofsediment cores from the Zaire submarine fan. Neth. J. Sea Res., 17:342-363.
Zijderveld, J.D.A., 1967. A.C. demagnetization of rocks: analysis of results.In Collinson, D.W., Creer, K.M., and Runcorn, S.K. (Eds.), Methods inPalaeomagnetism: Amsterdam (Elsevier), 368-371.
Date of initial receipt: 5 September 1991Date of acceptance: 17 June 1992Ms 130B-035
540
MAGNETIC DIAGENESIS OF THE CARBONATE SEQUENCE
North Up
130-804C-30X-1,101-103 cm
Scale: 1 division = 1 mA/m
West Horizontal
AF demagnetization (mT) *° i301
NRM
130-806B-38X-2, 97-99 cm
North Up
West Horizontal
Scale: 1 division = 0.01 mA/m
AF demagnetization (mT)
West Horizontal
South Down
130-804C-27X-1,134-136 cm
'NRMSouth Down
Scale: 1 division - 1 mA/m
AF demagnetization (mT)
30
Figure 14. Cartesian demagnetization plot of Sample 130-806B-38X-2,97-99cm. A steeply inclined component is carried by a high-coercivity phase, whichis not demagnetized at 50 mT. AF steps in mT. Symbols as for Figure 10.
B
NRMSouth Down
Figure 13. Cartesian demagnetization plots of samples from below 110 mbsfat Site 804, where NRM intensities increase again. A. Sample 130-804C-30X-1,101-103 cm. B. Sample 130-804C-27X-1, 134-136 cm. AF steps in mT.Symbols as for Figure 10.
541
R.J. MUSGRAVE, M.L. DELANEY, R. STAX, J.A. TARDUNO
130-805B-49X-3, 92-94 cm
West Horizontal NRM East Horizontal
South Down
Scale: 1 division = 0.01 mA/m
Thermal demagnetization (°C)
130-805C-55X-2,129-131 cm
600
Scale: 1 division = 0.1 mA/m
Thermal demagnetization (°C)
South Down
East Horizontal
NRM
B
North Up
I 550
575
West Horizontal
130-806B-68X-1, 82-84 cm
Scale: 1 division = 0.01 mA/m
Thermal demagnetization (°C)
East Horizontal
150
South Down
Figure 15. Cartesian plots of thermal demagnetization of chalk samples fromSites 805 and 806. A. Sample 130-805B-49X-3, 92-94 cm. B. Sample 130-805C-55X-2, 129-131 cm. C. Sample 130-806B-68X-1, 82-84 cm. Thermalsteps in degrees Celsius. Symbols as for Figure 10.
542
MAGNETIC DIAGENESIS OF THE CARBONATE SEQUENCE
130-807 A-1H-2,103-105 cm
West Horizontal East Horizontal
Scale: 1 division = 1 mA/m
Thermal demagnetization (°C)
130-807A-17H-2, 61-63 cmNorth Up
NRM
South Down
Scale: 1 division = 0.01 mA/m
Thermal demagnetization (°C)
West Horizontal 500
IEast Horizontal
130-807A-43X-2,137-139 cm
Scale: 1 division = 0.1 mA/m
Thermal demagnetization (°C)
South Down
Figure 16. Cartesian plots of thermal demagnetization of dried ooze samples from Hole 807A. A. Sample 130-807A-1H-2, 103-105cm, from above the IRE. B. Sample 130-807A-17H-2, 61-63 cm, from the weakly magnetized interval below the IRE. C. Sample130-807A-43X-2, 137-139 cm, from below 390 mbsf, where NRM intensity increases again. Thermal steps in degrees Celsius.Symbols as for Figure 10.
543
R.J. MUSGRAVE, M.L. DELANEY, R. STAX, J.A. TARDUNO
130-807A-70X-2,143-145 cmNorth Up
NRM
North Up 130-807C-24R-2,10-12 cm
West Horizontal
Scale: 1 division = 0.1 mA/m
Thermal demagnetization (°C) 525
Scale: 1 division = 0.01 mA/m
Thermal demagnetization (°C)
South Down
500West Horizontal
North Up
East Horizontal
North Up 130-807 A-79X-1,119-121 cm
B
East HorizontalB
Scale: 1 division = 0.01 mA/m
Thermal demagnetization (°C)
130-807C-25R-1,28-30 cm
Scale: 1 division = 0.1 mA/m
Thermal demagnetization (°C)
South Down
Figure 17. Cartesian plots of thermal demagnetization of chalk samples fromHole 807A. A. Sample 130-807A-70X-2,143-145 cm, from the interval between600 and 707 mbsf. B. Sample 130-807A-79X-1, 119-121 cm, from the weaklymagnetized, low-inclination interval between 707 mbsf and the bottom of thehole. Thermal steps in degrees Celsius. Symbols as for Figure 10.
\East Horizontal
130-807C-38R-1, 27-29 cm
Scale: 1 division 0.01 mA/m
Thermal demagnetization (°C)
East Horizontal
South Down
Figure 18. Cartesian plots of thermal demagnetization of chalk and limestonesamples from Hole 807C. A. Sample 130-807C-24R-2, 10-12 cm, whichdemagnetizes toward an inclination of about-20°. B. Sample 130-807C-25R-1,28-30 cm, which demagnetizes toward the horizontal. C. Sample 130-807C-38R-1, 27-29 cm, which includes a demagnetization segment with an inclina-tion of about -20° between two horizontal segments. Thermal steps in degreesCelsius. Symbols as for Figure 10.
544
MAGNETIC DIAGENESIS OF THE CARBONATE SEQUENCE
130-803D-4H-2, 75-77 en 130-803D-6H-3, 74-76 cm
IRM(mA/m)
111
109
107
105
IRM(mA/m)1
1.1 1.2
Applied field (T)
130-803D-30X-2, 38-40 cm
0.2 0.3 0.4 0.5 0.6 0.7 0.8 0.9 1 1.1 1.2 1.3 1.4 1.5
Applied field (T)
130-803D-45X-2, 116-118 cm
248
246
244
242
IRM 2 4 °( m A / m ) 2 3 ( | . .
236 •
234 •
232 •
230
0.60
Applied field (T)
0.60
Applied field (T)
Figure 19. IRM acquisition curves for samples from Hole 803D. Magnetite is saturated by 0.2 T. Sample 130-803D-4H-2, 75-77 cm, lies above the IRE andshows a poorly defined increase in IRM above 0.2 T, which may indicate the presence of a high-coercivity phase; the signal is dominated by noise from theproportionally much larger magnetite IRM. Sample 13O-8O3D-6H-3, 74-76 cm, which lies just below the IRE, shows the largest increase in IRM above 0.2 Tof all the samples studied. Samples 130-803D-30X-2,38^0 cm, and -45X-2,116-118 cm, illustrate the continued presence of a high coercivity phase downholeto at least the upper Oligocene.
Intensity SO4
803D 15mT
• Top section
* Top 10 m
x Top 50 m
H 1 1 1- H 1 1 1
Critical Sub-bottom depth (mbsf)
Figure 21. Total organic carbon (TOC) vs. sub-bottom depth of the IRE foreach site. TOC is shown for a sample from Section 1 of the top core at eachsite and as averages over the first 10 mbsf and the first 50 mbsf at each site.
Figure 20. Remanence intensity after 15-mT demagnetization (small dots) andsulfate ion concentration (diamonds, fitted by cubic splines) vs. sub-bottomdepth for Holes 803D, 804B, 805C, 806B, and 807A.
545
R.J. MUSGRAVE, M.L. DELANEY, R. STAX, J.A. TARDUNO
Palθolatitude (degrees)
8 "
7 •
6 •
5 •
4 ••
3 •
2
0
803D
* * *
• ××m u
200 300 400
Depth (mbsf)
Paleolatitude (degrees)
1 2 • •
1 0 • •
8 •
6 • •
4 • '
•2 • •
0 •l 1
807A and 807C
400 600 800
Depth (mbsf)
Figure 22. Paleolatitudes from five-point, smoothed, fitted inclinations from Sites 803 and 807. The dotted line joins calculated paleolatitudes (diamonds) for eachsite, based on an average of the Pacific Plate hotspot motion poles summarized in Sager (1983).
546