6.11 sediment diagenesis and benthic flux · sediment diagenesis and benthic flux ... understanding...
TRANSCRIPT
6.11Sediment Diagenesis andBenthic FluxS. Emerson and J. Hedges
University of Washington, Seattle, WA, USA
6.11.1 INTRODUCTION 293
6.11.2 DIAGENESIS AND PRESERVATION OF ORGANIC MATTER 2946.11.2.1 The Pillars of Organic Matter Diagenesis 294
6.11.2.1.1 Thermodynamics and sequential use of electron acceptors 2946.11.2.1.2 Kinetics of organic matter degradation 296
6.11.2.2 Organic Matter Diagenesis Down the Redox Progression 2976.11.2.2.1 O2, NO3
2, and Mn(IV) diagenesis 2976.11.2.2.2 Fe, SO4
22 reduction, and CH4 production 2996.11.2.3 Benthic Respiration 3016.11.2.4 Factors Controlling Organic Matter Degradation 301
6.11.2.4.1 Mineral association 3016.11.2.4.2 The importance of oxygen 302
6.11.3 DIAGENESIS AND PRESERVATION OF CALCIUM CARBONATE 3046.11.3.1 Mechanisms Controlling CaCO3 Burial: Thermodynamics 3056.11.3.2 Mechanism of CaCO3 Dissolution: Kinetics 307
6.11.3.2.1 The dissolution rate constant 3076.11.3.2.2 The effect of organic matter degradation 3086.11.3.2.3 The interpretation of the 14C age of surface sediments 309
6.11.4 DIAGENESIS AND PRESERVATION OF SILICA 3116.11.4.1 Controls on the H4SiO4 Concentration in Sediment Pore Waters: Thermodynamics 3136.11.4.2 Controls on the H4SiO4 Concentration in Sediment Pore Waters: Kinetics 3136.11.4.3 The Importance of Aluminum and the Rebirth of “Reverse Weathering” 314
APPENDIX A 315
APPENDIX B 316
REFERENCES 316
6.11.1 INTRODUCTION
Chemical reactions in marine sediments andthe resulting fluxes across the sediment–waterinterface influence the global carbon cycle andthe pH of the sea and affect the abundance ofCaCO3 and opal-forming plankton in the ocean.On very long timescales these diagenetic reac-tions control carbon burial in sedimentary rocksand the oxygen content of the atmosphere.Sedimentary deposits that remain after diagenesisare the geochemical artifacts used for interpretingpast changes in ocean circulation, biogeochem-ical cycles, and climate. This chapter is aboutthe processes of diagenesis and burial of the
chemical elements that make up the bulk of theparticulate matter that reaches the seafloor(organic matter, CaCO3, SiO2, Fe, Mn, andaluminosilicates).
Understanding of sediment diagenesis andbenthic fluxes has evolved with advances inboth experimental methods and modeling.Measurements of chemical concentrations insediments, their associated pore waters and fluxesat the sediment–water interface have been used toidentify the most important reactions. Becausetransport in pore waters is usually by moleculardiffusion, this medium is conducive to interpreta-tion by models of heterogeneous chemicalequilibrium and kinetics. Large chemical changes
293
and manageable transport mechanisms have ledto elegant models of sediment diagenesis andgreat advances in understanding of diageneticprocesses.
We shall see, though, that the environmentdoes not yield totally to simple models ofchemical equilibrium and chemical kinetics, andlaboratory determined constants often cannotexplain the field observations. For example,organic matter degradation rate constants deter-mined from modeling are so variable that thereare essentially no constraints on these valuesfrom laboratory experiments. In addition, reac-tion rates of CaCO3 and opal dissolutiondetermined from modeling pore waters usuallycannot be reproduced in laboratory experimentsof these reactions. The inability to mechanisti-cally understand reaction kinetics calculated fromdiagenesis models is an important uncertainty inthe field today.
Processes believed to be most important incontrolling the preservation of organic matterhave evolved from a focus on the lability of thesubstrate to the protective mechanisms ofmineral–organic matter interactions. The specificelectron acceptor is not particularly importantduring very early diagenesis, but the importanceof oxygen to the degradation of organic matterduring later stages of diagenesis has been clarifiedby the study of diagenesis in turbidites depositedon the ocean floor during glacial periods.
Evolution of thinking about the importance ofreactions between seawater and detrital clayminerals has come full circle since the mid-1960s. “Reverse weathering” reactions werehypothesized in very early chemical equilibrium(Sillen, 1961) and mass-balance (Mackenzie andGarrels, 1966) models of the oceans. Subsequentobservations that marine clay minerals generallyresemble those weathered from adjacent land andthe discovery of hydrothermal circulation putthese ideas on the back burner. Recent studies ofsilicate and aluminum diagenesis, however, haverekindled awareness of this process, and it is backin the minds of geochemists as a potentiallyimportant process for closing the marine massbalance of some elements.
6.11.2 DIAGENESIS AND PRESERVATIONOF ORGANIC MATTER
Roughly 90% of the organic matter that exitsthe euphotic zone of the ocean is degraded in thewater column. Of the ,10% of the organic carbonflux that reaches the seafloor, only about one-tenthescapes oxidation and is buried. Degradation ofthe organic matter that reaches the ocean sedi-ments drives the reactions that control sedimentdiagenesis and benthic flux.
We begin our discussion with what we call the“pillars” of knowledge in the field—those con-cepts that are basic to understanding the mechan-isms of organic matter diagenesis and on whichfuture developments rested. This is followed by adescription of the dominant mechanisms oforganic-matter diagenesis as one progresses fromoxic through the anoxic conditions. Finally, wewill discuss factors controlling the reactivity oforganic matter and the mechanisms of organicmatter preservation.
6.11.2.1 The Pillars of Organic MatterDiagenesis
The basic concepts of organic matter diagenesisare described here as (i) the thermodynamicsequence of reactions of electron acceptors andtheir stoichiometry, and (ii) the kinetics of organicmatter degradation as described by the diagenesisequations and observations of degradation rates.These ideas derived mainly from studies of oceansediments in which pore-water transport is con-trolled by molecular diffusion (deepsea oxic andanoxic-SO4 reducing), but represent the intellec-tual points of departure for studying near-shoresystems where transport is more complicated, butwhere the bulk of marine organic matter isdegraded.
6.11.2.1.1 Thermodynamics and sequentialuse of electron acceptors
The large highly structured molecules oforganic matter are formed by energy from thesun and exist at atmospheric temperature andpressure in a reduced, thermodynamically unstablestate. These compounds subsequently undergoreactions with oxidants to decrease the free energyof the system. The oxidants accept electrons fromthe organic matter during oxidation reactions(Stumm and Morgan, 1981). The electron accep-tors that are in major abundance in the environ-ment include O2, NO3
2, Mn(IV), Fe(III), SO422,
and organic matter itself during fermentation(described here as methane production). Thesereactions are listed in the order of the free energygained in Table 1. Half reactions for both theorganic matter oxidation and the electron-acceptorreductions are represented. The changes in freeenergy for the reactions depend on the free energyof formation of the solids involved (organicmatter, iron, and manganese oxides), and thusvary slightly among compilations in the literature.Note that the amounts of free energy gain for thewhole reactions involving oxygen, nitrate, andmanganese are similar. Values drop-offdramatically for iron and sulfate reactions andthen again for methane production. The sequence
Sediment Diagenesis and Benthic Flux294
of electron acceptor use is sometimes categorizedinto oxic diagenesis (O2 reduction), suboxicdiagenesis (NO3
2 and Mn(IV) reduction), andanoxic diagenesis (Fe(III) and SO4
22 reductionand methane formation). This terminology is notused here because the definition of suboxic isvague and ambiguous. We recommend referring tothese reactions using the true meaning of theterms—oxic for O2 reduction and anoxic for therest (anoxic-NO3
2 reduction, anoxic-Mn(IV)reduction and so forth).
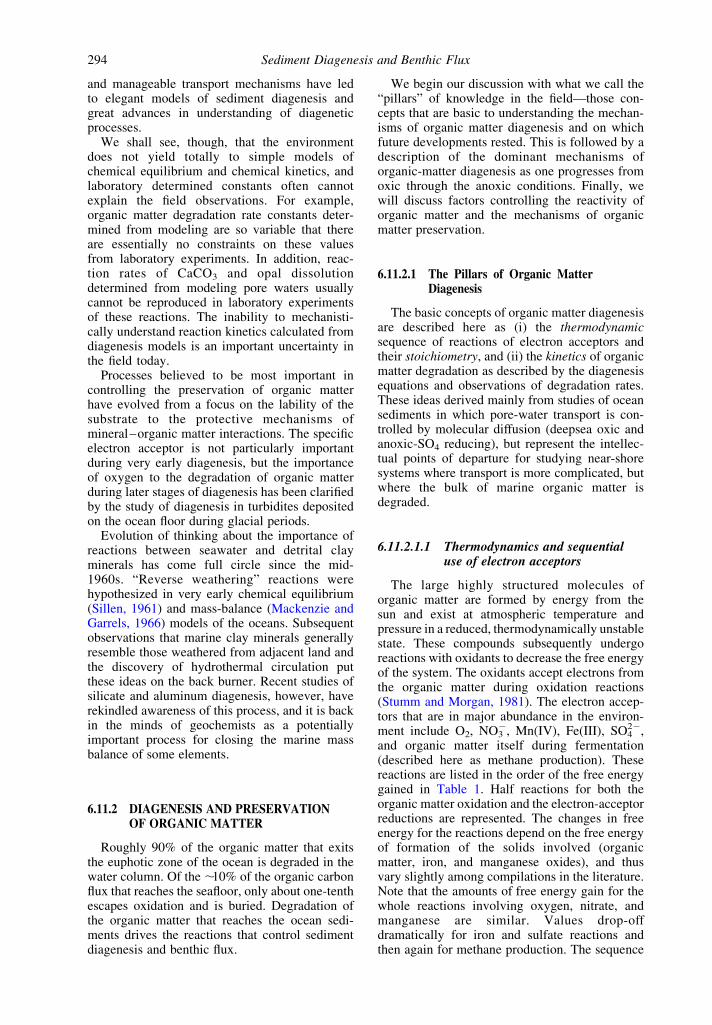
While all of these reactions are favoredthermodynamically, they are almost always enzy-matically catalyzed by bacteria. It has beenobserved from the study of pore waters in deepseasediments (e.g., Froelich et al., 1979) and anoxicbasins (e.g., Reeburgh, 1980) that there is anordered sequence of redox reactions in which themost energetically favorable reactions occur firstand the active electron acceptors do not overlapsignificantly. Bacteria are energy opportunists.Using estimates of the stoichiometry of thediagenesis reactions (Table 2) one can sketch theorder and shape of reactant profiles actuallyobserved in sediment pore-water chemistry
(Figure 1). The schematic figure shows allelectron acceptors in a single sequence. This israrely observed in the environment becauseregions with abundant bottom-water oxygen andmoderate organic matter flux to the sediments(i.e., the deep ocean) run out of reactive organiccarbon before sulfate reduction becomes import-ant. In near-shore environments, where there issufficient organic matter flux to the sediments toactivate sulfate reduction and deplete sulfate inpore waters, zones of oxygen, nitrate, and Mn(IV)reduction are very thin or obscured by benthicanimal irrigation and bioturbation.
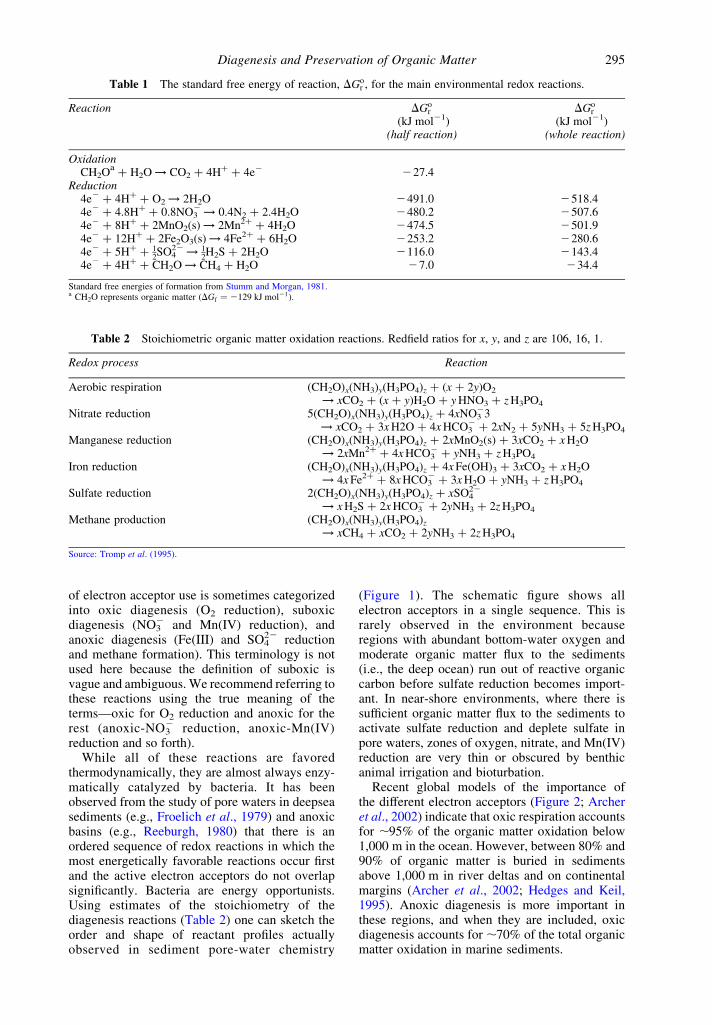
Recent global models of the importance ofthe different electron acceptors (Figure 2; Archeret al., 2002) indicate that oxic respiration accountsfor ,95% of the organic matter oxidation below1,000 m in the ocean. However, between 80% and90% of organic matter is buried in sedimentsabove 1,000 m in river deltas and on continentalmargins (Archer et al., 2002; Hedges and Keil,1995). Anoxic diagenesis is more important inthese regions, and when they are included, oxicdiagenesis accounts for ,70% of the total organicmatter oxidation in marine sediments.
Table 1 The standard free energy of reaction, DGor ; for the main environmental redox reactions.
Reaction DGor
(kJ mol21)(half reaction)
DGor
(kJ mol21)(whole reaction)
OxidationCH2O
aþ H2O ! CO2 þ 4Hþ þ 4e2 227.4
Reduction4e2 þ 4Hþ þ O2 ! 2H2O 2491.0 2518.44e2 þ 4.8Hþ þ 0.8NO3
2 ! 0.4N2 þ 2.4H2O 2480.2 2507.64e2 þ 8Hþ þ 2MnO2(s) ! 2Mn2þ þ 4H2O 2474.5 2501.94e2 þ 12Hþ þ 2Fe2O3(s) ! 4Fe2þ þ 6H2O 2253.2 2280.64e2 þ 5Hþ þ 1
2SO4
22 ! 12H2S þ 2H2O 2116.0 2143.4
4e2 þ 4Hþ þ CH2O ! CH4 þ H2O 27.0 234.4
Standard free energies of formation from Stumm and Morgan, 1981.a CH2O represents organic matter ðDGf ¼ 2129 kJ mol21Þ:
Table 2 Stoichiometric organic matter oxidation reactions. Redfield ratios for x; y, and z are 106, 16, 1.
Redox process Reaction
Aerobic respiration (CH2O)x(NH3)y(H3PO4)z þ (x þ 2y)O2
! xCO2 þ (x þ y)H2O þ y HNO3 þ z H3PO4
Nitrate reduction 5(CH2O)x(NH3)y(H3PO4)z þ 4xNO323
! xCO2 þ 3x H2O þ 4x HCO32 þ 2xN2 þ 5yNH3 þ 5z H3PO4
Manganese reduction (CH2O)x(NH3)y(H3PO4)z þ 2xMnO2(s) þ 3xCO2 þ x H2O! 2xMn2þ þ 4x HCO3
2 þ yNH3 þ z H3PO4
Iron reduction (CH2O)x(NH3)y(H3PO4)z þ 4x Fe(OH)3 þ 3xCO2 þ x H2O! 4x Fe2þ þ 8x HCO3
2 þ 3x H2O þ yNH3 þ z H3PO4
Sulfate reduction 2(CH2O)x(NH3)y(H3PO4)z þ xSO422
! x H2S þ 2x HCO32 þ 2yNH3 þ 2z H3PO4
Methane production (CH2O)x(NH3)y(H3PO4)z
! xCH4 þ xCO2 þ 2yNH3 þ 2z H3PO4
Source: Tromp et al. (1995).
Diagenesis and Preservation of Organic Matter 295
6.11.2.1.2 Kinetics of organic matterdegradation
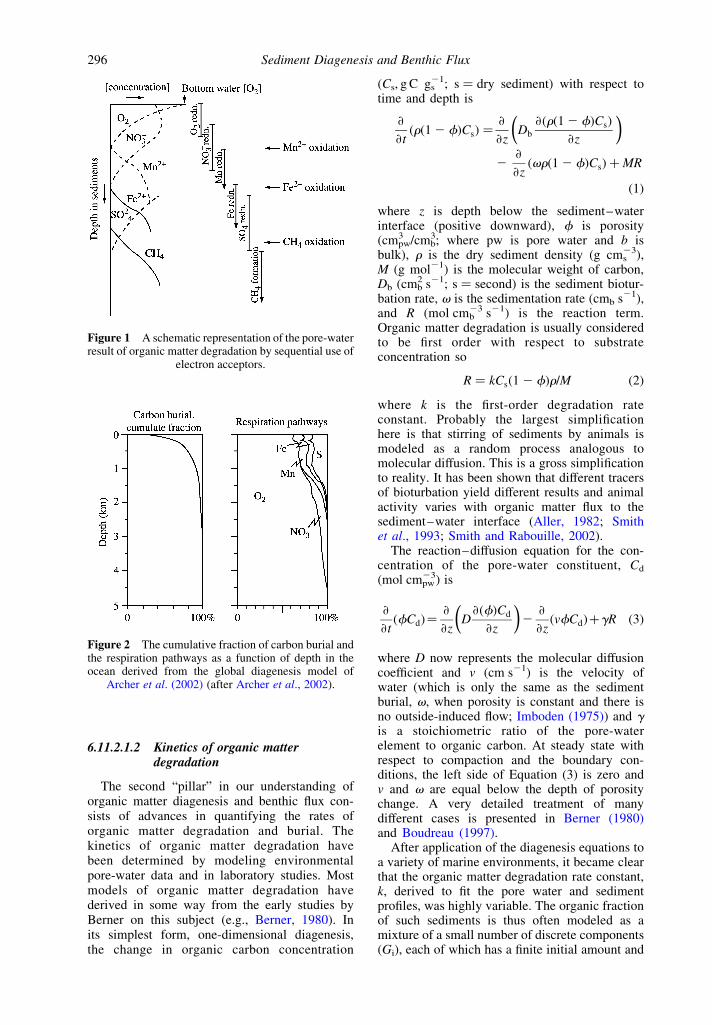
The second “pillar” in our understanding oforganic matter diagenesis and benthic flux con-sists of advances in quantifying the rates oforganic matter degradation and burial. Thekinetics of organic matter degradation havebeen determined by modeling environmentalpore-water data and in laboratory studies. Mostmodels of organic matter degradation havederived in some way from the early studies byBerner on this subject (e.g., Berner, 1980). Inits simplest form, one-dimensional diagenesis,the change in organic carbon concentration
(Cs, g C gs21; s ¼ dry sediment) with respect to
time and depth is
›
›tðrð1 2 fÞCsÞ ¼
›
›z
�Db
›ðrð1 2 fÞCsÞ
›z
�
2›
›zðvrð1 2 fÞCsÞ þ MR
ð1Þ
where z is depth below the sediment–waterinterface (positive downward), f is porosity(cmpw
3 /cmb3; where pw is pore water and b is
bulk), r is the dry sediment density (g cms23),
M (g mol21) is the molecular weight of carbon,Db (cmb
2 s21; s ¼ second) is the sediment biotur-bation rate, v is the sedimentation rate (cmb s21),and R (mol cmb
23 s21) is the reaction term.Organic matter degradation is usually consideredto be first order with respect to substrateconcentration so
R ¼ kCsð1 2 fÞr=M ð2Þ
where k is the first-order degradation rateconstant. Probably the largest simplificationhere is that stirring of sediments by animals ismodeled as a random process analogous tomolecular diffusion. This is a gross simplificationto reality. It has been shown that different tracersof bioturbation yield different results and animalactivity varies with organic matter flux to thesediment–water interface (Aller, 1982; Smithet al., 1993; Smith and Rabouille, 2002).
The reaction–diffusion equation for the con-centration of the pore-water constituent, Cd
(mol cmpw23) is
›
›tðfCdÞ¼
›
›z
�D›ðfÞCd
›z
�2
›
›zðvfCdÞþgR ð3Þ
where D now represents the molecular diffusioncoefficient and v (cm s21) is the velocity ofwater (which is only the same as the sedimentburial, v, when porosity is constant and there isno outside-induced flow; Imboden (1975)) and gis a stoichiometric ratio of the pore-waterelement to organic carbon. At steady state withrespect to compaction and the boundary con-ditions, the left side of Equation (3) is zero andv and v are equal below the depth of porositychange. A very detailed treatment of manydifferent cases is presented in Berner (1980)and Boudreau (1997).
After application of the diagenesis equations toa variety of marine environments, it became clearthat the organic matter degradation rate constant,k, derived to fit the pore water and sedimentprofiles, was highly variable. The organic fractionof such sediments is thus often modeled as amixture of a small number of discrete components(Gi), each of which has a finite initial amount and
Figure 1 A schematic representation of the pore-waterresult of organic matter degradation by sequential use of
electron acceptors.
Figure 2 The cumulative fraction of carbon burial andthe respiration pathways as a function of depth in theocean derived from the global diagenesis model of
Archer et al. (2002) (after Archer et al., 2002).
Sediment Diagenesis and Benthic Flux296
first-order decay constant (e.g., Jørgensen, 1979;Westrich and Berner, 1984). An alternative tosuch discrete models is to treat sedimentaryorganic matter as containing either one componentwhose reactivity decreases continuously over time(Middelburg, 1989), or as a continuum of multiplecomponents whose distribution changes overtime (Boudreau and Ruddick, 1991). All thesediscrete and continuum models capture thefundamental feature that bulk organic matterbreaks down at an increasingly slower rate as itdegrades.
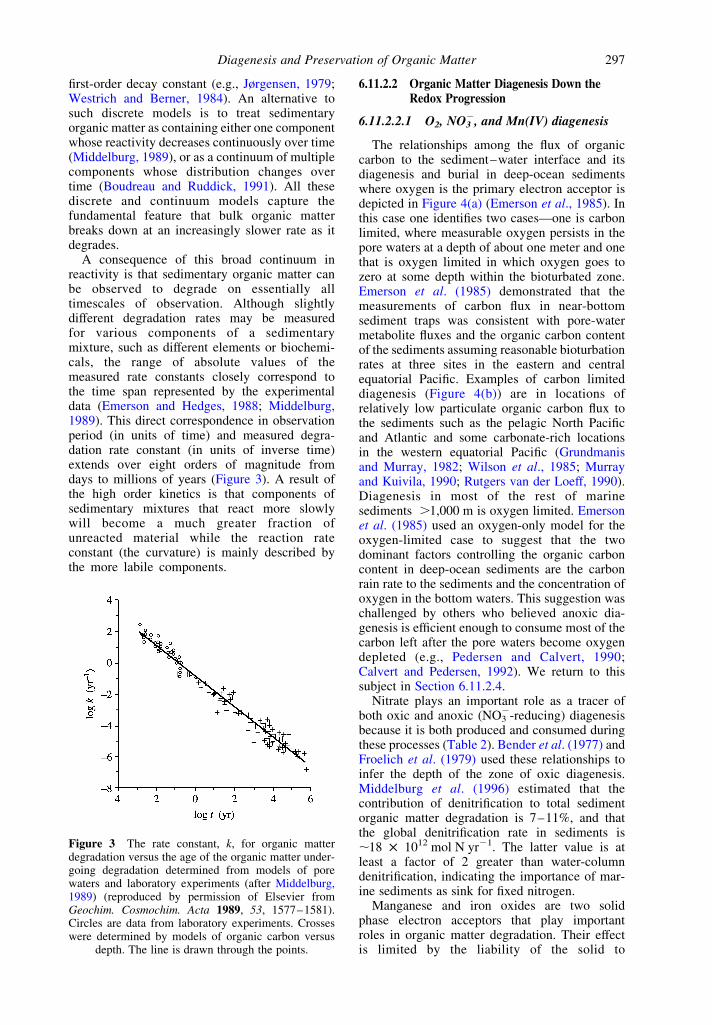
A consequence of this broad continuum inreactivity is that sedimentary organic matter canbe observed to degrade on essentially alltimescales of observation. Although slightlydifferent degradation rates may be measuredfor various components of a sedimentarymixture, such as different elements or biochemi-cals, the range of absolute values of themeasured rate constants closely correspond tothe time span represented by the experimentaldata (Emerson and Hedges, 1988; Middelburg,1989). This direct correspondence in observationperiod (in units of time) and measured degra-dation rate constant (in units of inverse time)extends over eight orders of magnitude fromdays to millions of years (Figure 3). A result ofthe high order kinetics is that components ofsedimentary mixtures that react more slowlywill become a much greater fraction ofunreacted material while the reaction rateconstant (the curvature) is mainly described bythe more labile components.
6.11.2.2 Organic Matter Diagenesis Down theRedox Progression
6.11.2.2.1 O2, NO32, and Mn(IV) diagenesis
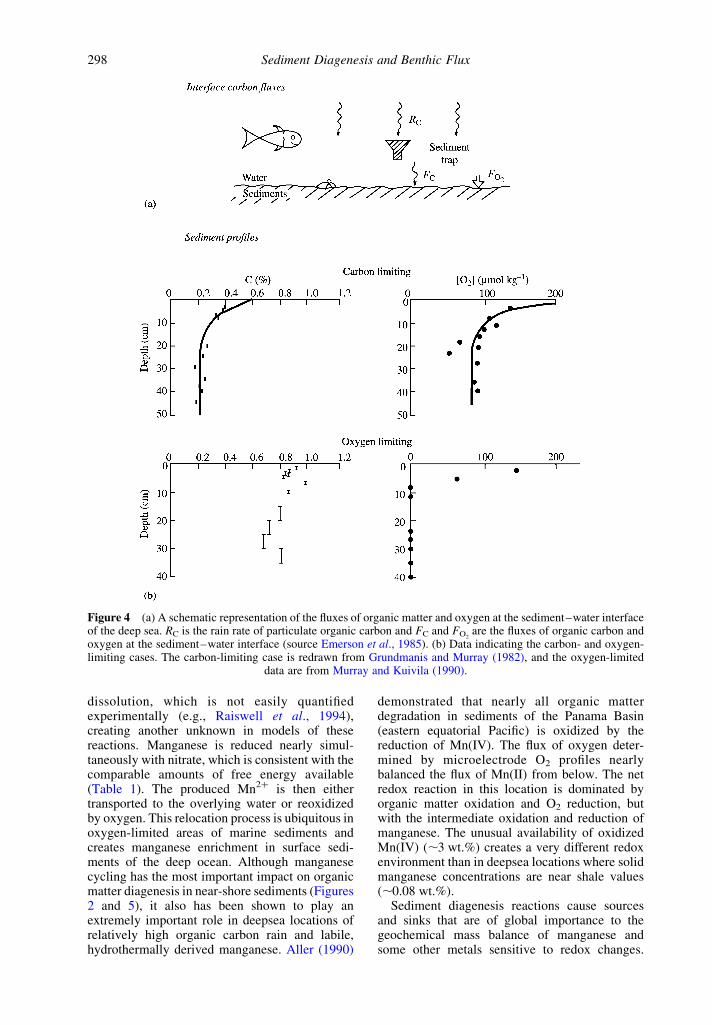
The relationships among the flux of organiccarbon to the sediment–water interface and itsdiagenesis and burial in deep-ocean sedimentswhere oxygen is the primary electron acceptor isdepicted in Figure 4(a) (Emerson et al., 1985). Inthis case one identifies two cases—one is carbonlimited, where measurable oxygen persists in thepore waters at a depth of about one meter and onethat is oxygen limited in which oxygen goes tozero at some depth within the bioturbated zone.Emerson et al. (1985) demonstrated that themeasurements of carbon flux in near-bottomsediment traps was consistent with pore-watermetabolite fluxes and the organic carbon contentof the sediments assuming reasonable bioturbationrates at three sites in the eastern and centralequatorial Pacific. Examples of carbon limiteddiagenesis (Figure 4(b)) are in locations ofrelatively low particulate organic carbon flux tothe sediments such as the pelagic North Pacificand Atlantic and some carbonate-rich locationsin the western equatorial Pacific (Grundmanisand Murray, 1982; Wilson et al., 1985; Murrayand Kuivila, 1990; Rutgers van der Loeff, 1990).Diagenesis in most of the rest of marinesediments .1,000 m is oxygen limited. Emersonet al. (1985) used an oxygen-only model for theoxygen-limited case to suggest that the twodominant factors controlling the organic carboncontent in deep-ocean sediments are the carbonrain rate to the sediments and the concentration ofoxygen in the bottom waters. This suggestion waschallenged by others who believed anoxic dia-genesis is efficient enough to consume most of thecarbon left after the pore waters become oxygendepleted (e.g., Pedersen and Calvert, 1990;Calvert and Pedersen, 1992). We return to thissubject in Section 6.11.2.4.
Nitrate plays an important role as a tracer ofboth oxic and anoxic (NO3
2-reducing) diagenesisbecause it is both produced and consumed duringthese processes (Table 2). Bender et al. (1977) andFroelich et al. (1979) used these relationships toinfer the depth of the zone of oxic diagenesis.Middelburg et al. (1996) estimated that thecontribution of denitrification to total sedimentorganic matter degradation is 7–11%, and thatthe global denitrification rate in sediments is,18 £ 1012 mol N yr21. The latter value is atleast a factor of 2 greater than water-columndenitrification, indicating the importance of mar-ine sediments as sink for fixed nitrogen.
Manganese and iron oxides are two solidphase electron acceptors that play importantroles in organic matter degradation. Their effectis limited by the liability of the solid to
Figure 3 The rate constant, k, for organic matterdegradation versus the age of the organic matter under-going degradation determined from models of porewaters and laboratory experiments (after Middelburg,1989) (reproduced by permission of Elsevier fromGeochim. Cosmochim. Acta 1989, 53, 1577–1581).Circles are data from laboratory experiments. Crosseswere determined by models of organic carbon versus
depth. The line is drawn through the points.
Diagenesis and Preservation of Organic Matter 297
dissolution, which is not easily quantifiedexperimentally (e.g., Raiswell et al., 1994),creating another unknown in models of thesereactions. Manganese is reduced nearly simul-taneously with nitrate, which is consistent with thecomparable amounts of free energy available(Table 1). The produced Mn2þ is then eithertransported to the overlying water or reoxidizedby oxygen. This relocation process is ubiquitous inoxygen-limited areas of marine sediments andcreates manganese enrichment in surface sedi-ments of the deep ocean. Although manganesecycling has the most important impact on organicmatter diagenesis in near-shore sediments (Figures2 and 5), it also has been shown to play anextremely important role in deepsea locations ofrelatively high organic carbon rain and labile,hydrothermally derived manganese. Aller (1990)
demonstrated that nearly all organic matterdegradation in sediments of the Panama Basin(eastern equatorial Pacific) is oxidized by thereduction of Mn(IV). The flux of oxygen deter-mined by microelectrode O2 profiles nearlybalanced the flux of Mn(II) from below. The netredox reaction in this location is dominated byorganic matter oxidation and O2 reduction, butwith the intermediate oxidation and reduction ofmanganese. The unusual availability of oxidizedMn(IV) (,3 wt.%) creates a very different redoxenvironment than in deepsea locations where solidmanganese concentrations are near shale values(,0.08 wt.%).
Sediment diagenesis reactions cause sourcesand sinks that are of global importance to thegeochemical mass balance of manganese andsome other metals sensitive to redox changes.
Figure 4 (a) A schematic representation of the fluxes of organic matter and oxygen at the sediment–water interfaceof the deep sea. RC is the rain rate of particulate organic carbon and FC and FO2
are the fluxes of organic carbon andoxygen at the sediment–water interface (source Emerson et al., 1985). (b) Data indicating the carbon- and oxygen-limiting cases. The carbon-limiting case is redrawn from Grundmanis and Murray (1982), and the oxygen-limited
data are from Murray and Kuivila (1990).
Sediment Diagenesis and Benthic Flux298
Morford and Emerson (1999) were able toquantify this effect using experimental evidencethat indicated manganese and vanadium areremobilized to the ocean when oxygen penetratespore waters 1 cm or less. Other redox-sensitiveelements (rhenium, cadmium, and uranium) aretaken up in the sediments under these redoxconditions. They then applied the oxygen- andcarbon-only models discussed in Section 6.11.2.2and distributions of bottom-water O2 and particu-late organic carbon rain to the sediments below1,000 m (Jahnke, 1996) to determine that theglobal extent of this redox condition is ,3% of thesediments. For manganese, vanadium, and rhe-nium the fluxes from and to the more reducingareas are very large even though the calculationmust be considered a minimum because thesediments shallower than 1,000 m were notconsidered. For example, the manganese fluxfrom the reducing sediments on the ocean marginsis 1.4–2.6 times that from rivers indicating amassive redistribution of this element within theocean basins.
6.11.2.2.2 Fe, SO422 reduction, and
CH4 production
As one approaches continents from the deepocean, overlying productivity becomes greaterand the water depth shoals so that particles aredegraded less while sinking. Both factors increasethe particulate organic matter flux to thesediment–water interface. This creates moreextensive anoxia in the sediments, which issometimes compounded on continental slopes bylow bottom-water oxygen conditions. A natural
result of the greater supply of organic matter to thesediments is that benthic animals become biggerand more diverse. The consequence to organicmatter diagenesis is that bioturbation is deeper andmore intense and that animal irrigation activitiesare rapid enough to compete with moleculardiffusion as the mechanism of pore-watertransport.
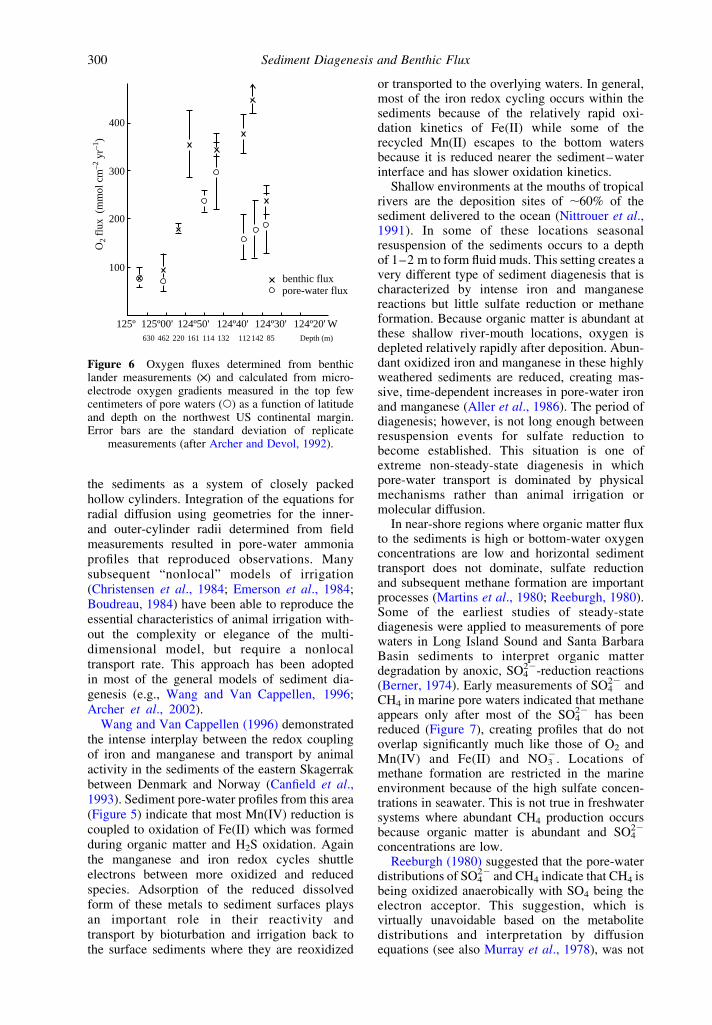
The relative roles of diffusion and animal-induced advection across the sediment–waterinterface has been quantified by comparingoxygen fluxes determined by benthic landermeasurements with those calculated from pore-water micro-electrode oxygen profiles (Figure 6;Archer and Devol, 1992). As one progresses upthe continental slope and onto the shelf ofthe northwest US the fluxes determined by thesetwo methods diverge. Those determined fromthe benthic lander become greater at depths,,100 m indicating the local importance ofanimal irrigation activity. This process compli-cates the diagenetic redox balance in coastalmarine sediments, where 80–90% of marineorganic matter is buried, because it is much moredifficult to generalize on the mechanism andmagnitude of animal irrigation than moleculardiffusion.
Aller (1984) created a mechanistic model forthe multi-dimensional transport of dissolved pore-water species by animals. He observed thatammonia profiles caused by sulfate reduction inthe top-ten-centimeter layer of Long Island Soundsediments could not be interpreted by one-dimensional diffusion (Equation (3)). The multi-dimensional effects of irrigation were reproducedmathematically by characterizing the top layer of
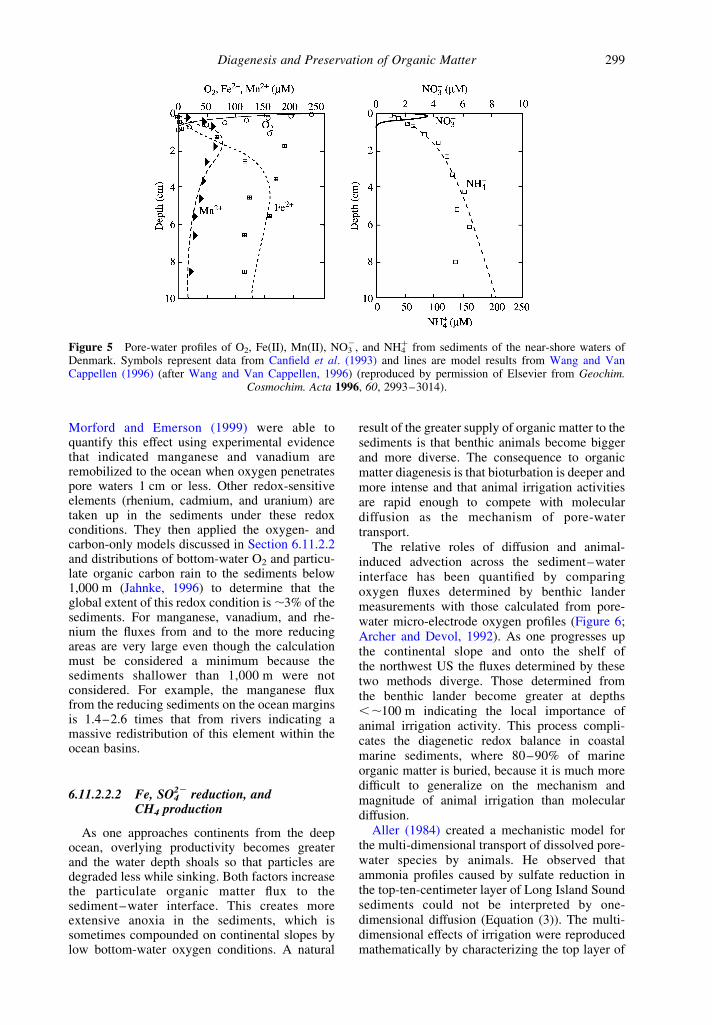
Figure 5 Pore-water profiles of O2, Fe(II), Mn(II), NO32, and NH4
þ from sediments of the near-shore waters ofDenmark. Symbols represent data from Canfield et al. (1993) and lines are model results from Wang and VanCappellen (1996) (after Wang and Van Cappellen, 1996) (reproduced by permission of Elsevier from Geochim.
Cosmochim. Acta 1996, 60, 2993–3014).
Diagenesis and Preservation of Organic Matter 299
the sediments as a system of closely packedhollow cylinders. Integration of the equations forradial diffusion using geometries for the inner-and outer-cylinder radii determined from fieldmeasurements resulted in pore-water ammoniaprofiles that reproduced observations. Manysubsequent “nonlocal” models of irrigation(Christensen et al., 1984; Emerson et al., 1984;Boudreau, 1984) have been able to reproduce theessential characteristics of animal irrigation with-out the complexity or elegance of the multi-dimensional model, but require a nonlocaltransport rate. This approach has been adoptedin most of the general models of sediment dia-genesis (e.g., Wang and Van Cappellen, 1996;Archer et al., 2002).
Wang and Van Cappellen (1996) demonstratedthe intense interplay between the redox couplingof iron and manganese and transport by animalactivity in the sediments of the eastern Skagerrakbetween Denmark and Norway (Canfield et al.,1993). Sediment pore-water profiles from this area(Figure 5) indicate that most Mn(IV) reduction iscoupled to oxidation of Fe(II) which was formedduring organic matter and H2S oxidation. Againthe manganese and iron redox cycles shuttleelectrons between more oxidized and reducedspecies. Adsorption of the reduced dissolvedform of these metals to sediment surfaces playsan important role in their reactivity andtransport by bioturbation and irrigation back tothe surface sediments where they are reoxidized
or transported to the overlying waters. In general,most of the iron redox cycling occurs within thesediments because of the relatively rapid oxi-dation kinetics of Fe(II) while some of therecycled Mn(II) escapes to the bottom watersbecause it is reduced nearer the sediment–waterinterface and has slower oxidation kinetics.
Shallow environments at the mouths of tropicalrivers are the deposition sites of ,60% of thesediment delivered to the ocean (Nittrouer et al.,1991). In some of these locations seasonalresuspension of the sediments occurs to a depthof 1–2 m to form fluid muds. This setting creates avery different type of sediment diagenesis that ischaracterized by intense iron and manganesereactions but little sulfate reduction or methaneformation. Because organic matter is abundant atthese shallow river-mouth locations, oxygen isdepleted relatively rapidly after deposition. Abun-dant oxidized iron and manganese in these highlyweathered sediments are reduced, creating mas-sive, time-dependent increases in pore-water ironand manganese (Aller et al., 1986). The period ofdiagenesis; however, is not long enough betweenresuspension events for sulfate reduction tobecome established. This situation is one ofextreme non-steady-state diagenesis in whichpore-water transport is dominated by physicalmechanisms rather than animal irrigation ormolecular diffusion.
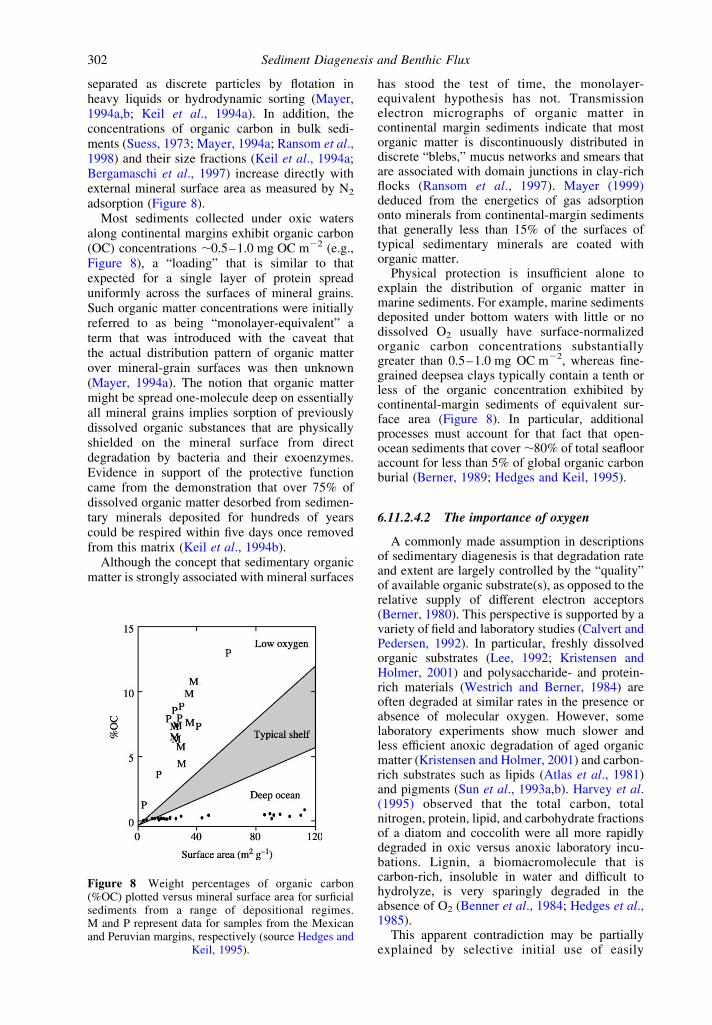
In near-shore regions where organic matter fluxto the sediments is high or bottom-water oxygenconcentrations are low and horizontal sedimenttransport does not dominate, sulfate reductionand subsequent methane formation are importantprocesses (Martins et al., 1980; Reeburgh, 1980).Some of the earliest studies of steady-statediagenesis were applied to measurements of porewaters in Long Island Sound and Santa BarbaraBasin sediments to interpret organic matterdegradation by anoxic, SO4
22-reduction reactions(Berner, 1974). Early measurements of SO4
22 andCH4 in marine pore waters indicated that methaneappears only after most of the SO4
22 has beenreduced (Figure 7), creating profiles that do notoverlap significantly much like those of O2 andMn(IV) and Fe(II) and NO3
2. Locations ofmethane formation are restricted in the marineenvironment because of the high sulfate concen-trations in seawater. This is not true in freshwatersystems where abundant CH4 production occursbecause organic matter is abundant and SO4
22
concentrations are low.Reeburgh (1980) suggested that the pore-water
distributions of SO422 and CH4 indicate that CH4 is
being oxidized anaerobically with SO4 being theelectron acceptor. This suggestion, which isvirtually unavoidable based on the metabolitedistributions and interpretation by diffusionequations (see also Murray et al., 1978), was not
benthic fluxpore-water flux
125º
100
200
O2
flux
(m
mol
cm
–2 y
r–1)
300
400
125º00' 124º50'630 462 220 161 114 132 112 142 85 Depth (m)
124º40' 124º30' 124º20' W
Figure 6 Oxygen fluxes determined from benthiclander measurements (£) and calculated from micro-electrode oxygen gradients measured in the top fewcentimeters of pore waters (W) as a function of latitudeand depth on the northwest US continental margin.Error bars are the standard deviation of replicate
measurements (after Archer and Devol, 1992).
Sediment Diagenesis and Benthic Flux300
accepted initially by many microbiologistsbecause it has been difficult to culture the SO4
22
reducing/CH4 oxidizing bacteria.
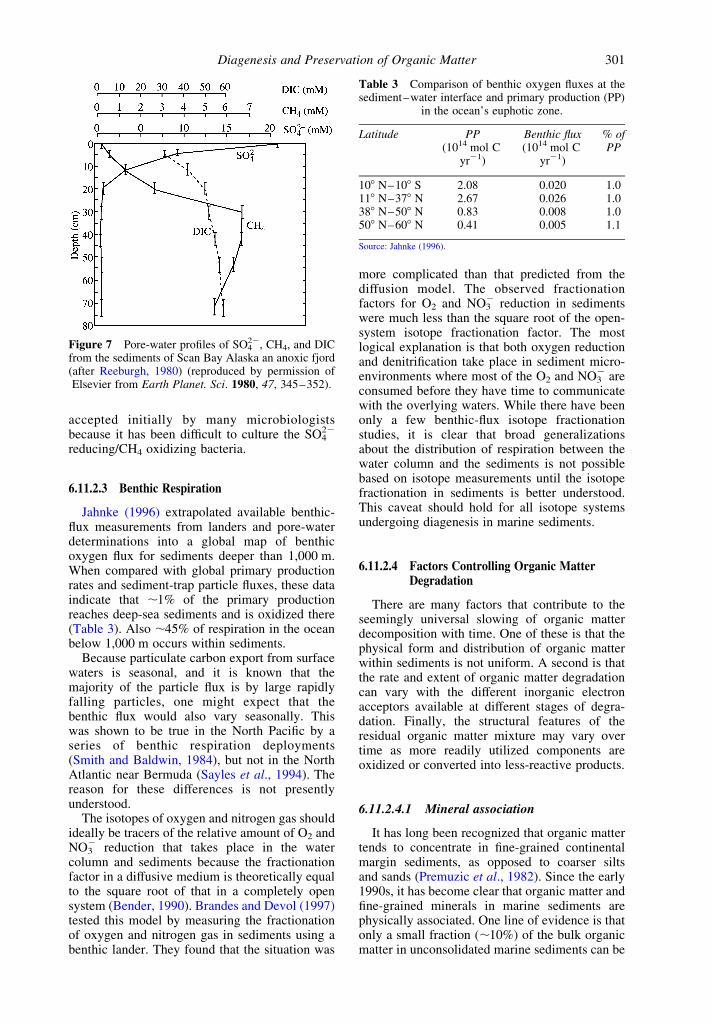
6.11.2.3 Benthic Respiration
Jahnke (1996) extrapolated available benthic-flux measurements from landers and pore-waterdeterminations into a global map of benthicoxygen flux for sediments deeper than 1,000 m.When compared with global primary productionrates and sediment-trap particle fluxes, these dataindicate that ,1% of the primary productionreaches deep-sea sediments and is oxidized there(Table 3). Also ,45% of respiration in the oceanbelow 1,000 m occurs within sediments.
Because particulate carbon export from surfacewaters is seasonal, and it is known that themajority of the particle flux is by large rapidlyfalling particles, one might expect that thebenthic flux would also vary seasonally. Thiswas shown to be true in the North Pacific by aseries of benthic respiration deployments(Smith and Baldwin, 1984), but not in the NorthAtlantic near Bermuda (Sayles et al., 1994). Thereason for these differences is not presentlyunderstood.
The isotopes of oxygen and nitrogen gas shouldideally be tracers of the relative amount of O2 andNO3
2 reduction that takes place in the watercolumn and sediments because the fractionationfactor in a diffusive medium is theoretically equalto the square root of that in a completely opensystem (Bender, 1990). Brandes and Devol (1997)tested this model by measuring the fractionationof oxygen and nitrogen gas in sediments using abenthic lander. They found that the situation was
more complicated than that predicted from thediffusion model. The observed fractionationfactors for O2 and NO3
2 reduction in sedimentswere much less than the square root of the open-system isotope fractionation factor. The mostlogical explanation is that both oxygen reductionand denitrification take place in sediment micro-environments where most of the O2 and NO3
2 areconsumed before they have time to communicatewith the overlying waters. While there have beenonly a few benthic-flux isotope fractionationstudies, it is clear that broad generalizationsabout the distribution of respiration between thewater column and the sediments is not possiblebased on isotope measurements until the isotopefractionation in sediments is better understood.This caveat should hold for all isotope systemsundergoing diagenesis in marine sediments.
6.11.2.4 Factors Controlling Organic MatterDegradation
There are many factors that contribute to theseemingly universal slowing of organic matterdecomposition with time. One of these is that thephysical form and distribution of organic matterwithin sediments is not uniform. A second is thatthe rate and extent of organic matter degradationcan vary with the different inorganic electronacceptors available at different stages of degra-dation. Finally, the structural features of theresidual organic matter mixture may vary overtime as more readily utilized components areoxidized or converted into less-reactive products.
6.11.2.4.1 Mineral association
It has long been recognized that organic mattertends to concentrate in fine-grained continentalmargin sediments, as opposed to coarser siltsand sands (Premuzic et al., 1982). Since the early1990s, it has become clear that organic matter andfine-grained minerals in marine sediments arephysically associated. One line of evidence is thatonly a small fraction (,10%) of the bulk organicmatter in unconsolidated marine sediments can be
Table 3 Comparison of benthic oxygen fluxes at thesediment–water interface and primary production (PP)
in the ocean’s euphotic zone.
Latitude PP Benthic flux % of(1014 mol C
yr21)(1014 mol C
yr21)PP
108 N–108 S 2.08 0.020 1.0118 N–378 N 2.67 0.026 1.0388 N–508 N 0.83 0.008 1.0508 N–608 N 0.41 0.005 1.1
Source: Jahnke (1996).
Figure 7 Pore-water profiles of SO422, CH4, and DIC
from the sediments of Scan Bay Alaska an anoxic fjord(after Reeburgh, 1980) (reproduced by permission ofElsevier from Earth Planet. Sci. 1980, 47, 345–352).
Diagenesis and Preservation of Organic Matter 301
separated as discrete particles by flotation inheavy liquids or hydrodynamic sorting (Mayer,1994a,b; Keil et al., 1994a). In addition, theconcentrations of organic carbon in bulk sedi-ments (Suess, 1973; Mayer, 1994a; Ransom et al.,1998) and their size fractions (Keil et al., 1994a;Bergamaschi et al., 1997) increase directly withexternal mineral surface area as measured by N2
adsorption (Figure 8).Most sediments collected under oxic waters
along continental margins exhibit organic carbon(OC) concentrations ,0.5–1.0 mg OC m22 (e.g.,Figure 8), a “loading” that is similar to thatexpected for a single layer of protein spreaduniformly across the surfaces of mineral grains.Such organic matter concentrations were initiallyreferred to as being “monolayer-equivalent” aterm that was introduced with the caveat thatthe actual distribution pattern of organic matterover mineral-grain surfaces was then unknown(Mayer, 1994a). The notion that organic mattermight be spread one-molecule deep on essentiallyall mineral grains implies sorption of previouslydissolved organic substances that are physicallyshielded on the mineral surface from directdegradation by bacteria and their exoenzymes.Evidence in support of the protective functioncame from the demonstration that over 75% ofdissolved organic matter desorbed from sedimen-tary minerals deposited for hundreds of yearscould be respired within five days once removedfrom this matrix (Keil et al., 1994b).
Although the concept that sedimentary organicmatter is strongly associated with mineral surfaces
has stood the test of time, the monolayer-equivalent hypothesis has not. Transmissionelectron micrographs of organic matter incontinental margin sediments indicate that mostorganic matter is discontinuously distributed indiscrete “blebs,” mucus networks and smears thatare associated with domain junctions in clay-richflocks (Ransom et al., 1997). Mayer (1999)deduced from the energetics of gas adsorptiononto minerals from continental-margin sedimentsthat generally less than 15% of the surfaces oftypical sedimentary minerals are coated withorganic matter.
Physical protection is insufficient alone toexplain the distribution of organic matter inmarine sediments. For example, marine sedimentsdeposited under bottom waters with little or nodissolved O2 usually have surface-normalizedorganic carbon concentrations substantiallygreater than 0.5–1.0 mg OC m22, whereas fine-grained deepsea clays typically contain a tenth orless of the organic concentration exhibited bycontinental-margin sediments of equivalent sur-face area (Figure 8). In particular, additionalprocesses must account for that fact that open-ocean sediments that cover ,80% of total seaflooraccount for less than 5% of global organic carbonburial (Berner, 1989; Hedges and Keil, 1995).
6.11.2.4.2 The importance of oxygen
A commonly made assumption in descriptionsof sedimentary diagenesis is that degradation rateand extent are largely controlled by the “quality”of available organic substrate(s), as opposed to therelative supply of different electron acceptors(Berner, 1980). This perspective is supported by avariety of field and laboratory studies (Calvert andPedersen, 1992). In particular, freshly dissolvedorganic substrates (Lee, 1992; Kristensen andHolmer, 2001) and polysaccharide- and protein-rich materials (Westrich and Berner, 1984) areoften degraded at similar rates in the presence orabsence of molecular oxygen. However, somelaboratory experiments show much slower andless efficient anoxic degradation of aged organicmatter (Kristensen and Holmer, 2001) and carbon-rich substrates such as lipids (Atlas et al., 1981)and pigments (Sun et al., 1993a,b). Harvey et al.(1995) observed that the total carbon, totalnitrogen, protein, lipid, and carbohydrate fractionsof a diatom and coccolith were all more rapidlydegraded in oxic versus anoxic laboratory incu-bations. Lignin, a biomacromolecule that iscarbon-rich, insoluble in water and difficult tohydrolyze, is very sparingly degraded in theabsence of O2 (Benner et al., 1984; Hedges et al.,1985).
This apparent contradiction may be partiallyexplained by selective initial use of easily
Figure 8 Weight percentages of organic carbon(%OC) plotted versus mineral surface area for surficialsediments from a range of depositional regimes.M and P represent data for samples from the Mexicanand Peruvian margins, respectively (source Hedges and
Keil, 1995).
Sediment Diagenesis and Benthic Flux302
degraded proteins and polysaccharides and theresulting concentration of carbon-rich, hydrolysis-resistant substrates such as lipids and lignin whoseeffective degradation requires O2 (Emerson andHedges, 1988; Canfield, 1994). The rate-determining step for both aerobic and anaerobicmicrobial degradation of polysaccharides andproteins is hydrolysis by extracellular enzymes,after which the released oligosaccharides andpeptides less than ,600 amu are taken into cellsfor further alteration (Weiss et al., 1991). Giventhis commonality and the fact that molecularoxygen is not required in the initial depolymeriza-tion phase, it is not surprising that these two majorbiochemical types often are both degraded effec-tively, although not necessarily at the same rates,under both oxic and anoxic conditions (Harveyet al., 1995). In contrast, effective degradation ofcarbon-rich substrates and hydrolysis-resistantmaterials such as lignin, hydrocarbons, and pollenrequires molecular oxygen, as opposed to simplywater addition. Such degradation is often accom-plished by O2-requiring enzymes that catalyzeelectron (or hydrogen) removal or directly insertone or two oxygen atoms into organic molecules(Sawyer, 1991).
The most direct field evidence that the extent ofsedimentary organic matter preservation isaffected by exposure to bottom-water oxygencomes from oxidation fronts in deepsea turbiditesof various ages and depositional settings (Wilsonet al., 1985; Weaver and Rothwell, 1987). One ofthese deposits in which the timing of theexposure to oxic and anoxic conditions is welldocumented, is the relict f-turbidite from theMadeira abyssal plain (MAP) ,700 km offshore
of northwest Africa (Prahl et al., 1989, 1997;Cowie et al., 1995). This ,4 m-thick deposit wasemplaced ,140 ka at a water depth of ,5,400 mwhen fine-grained carbonate-rich sedimentsslumped off the African continental slope andflowed down to cover the entire MAP with atexturally and compositionally uniform layer. Thisdeposit was subsequently exposed to oxygenatedbottom water for thousands of years during whichtime an oxidation front slowly penetrated approxi-mately one-half meter into the turbidite beforediffusive O2 input was halted by accumulatingsediment and the entire turbidite relaxed back toanoxic conditions (Buckley and Cranston, 1988).Pore-water sulfate concentrations measuredwithin the sediments indicate little or no in situsulfate reduction (De Lange et al., 1987).
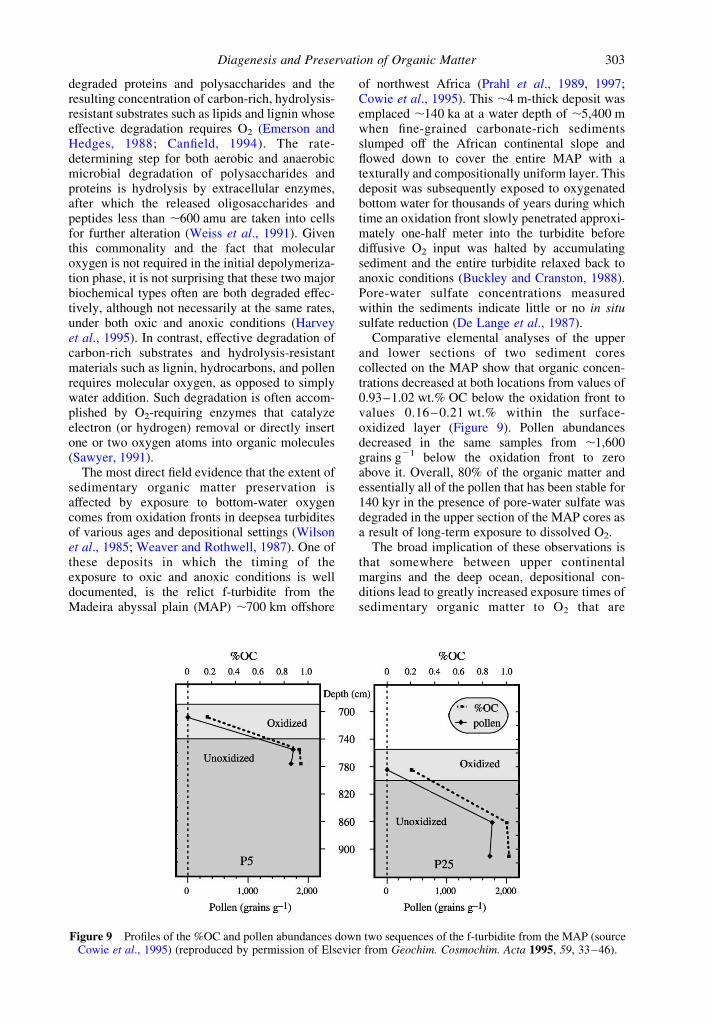
Comparative elemental analyses of the upperand lower sections of two sediment corescollected on the MAP show that organic concen-trations decreased at both locations from values of0.93–1.02 wt.% OC below the oxidation front tovalues 0.16 – 0.21 wt.% within the surface-oxidized layer (Figure 9). Pollen abundancesdecreased in the same samples from ,1,600grains g21 below the oxidation front to zeroabove it. Overall, 80% of the organic matter andessentially all of the pollen that has been stable for140 kyr in the presence of pore-water sulfate wasdegraded in the upper section of the MAP cores asa result of long-term exposure to dissolved O2.
The broad implication of these observations isthat somewhere between upper continentalmargins and the deep ocean, depositional con-ditions lead to greatly increased exposure times ofsedimentary organic matter to O2 that are
Figure 9 Profiles of the %OC and pollen abundances down two sequences of the f-turbidite from the MAP (sourceCowie et al., 1995) (reproduced by permission of Elsevier from Geochim. Cosmochim. Acta 1995, 59, 33–46).
Diagenesis and Preservation of Organic Matter 303
sufficient to create the greatly reduced organicmatter concentrations typical of modern-pelagicsediments (e.g., Figure 8). A test for thishypothesis was carried out for modern sedimentsdepositing at varying distances and rates off theWashington State coast (see Hartnett et al., 1998;Hedges et al., 1999). Oxygen penetration depthswere found to increase offshore from fractions of acentimeter in continental shelf and upper-slopesediments to over three centimeters in deeper(,3,000 m) offshore deposits. Average sedimentaccumulation rates decreased offshore from,15 cm to 3 cm per thousand years. The com-bined result of these two trends is that oxygenexposure time (OET, the depth of oxygenpenetration divided by the sedimentation rate)increases consistently offshore from decades onthe continental shelf and upper slope to hundredsof years on the lower slope to over 1,000 yr at themost offshore study site. Corresponding concen-trations of organic matter per unit sediment-surface area decreased consistently offshore frommaximal values typical of upper-continentalmargin sediments depositing under oxygenatedbottom water (,1 mg OC m22) to substantiallylower concentrations (,0.3 mg OC m22) in off-shore deep sediments. Mole percentages ofnonprotein amino acids and physically corrodedpollen increased consistently offshore, indicatingthat the remnant organic matter in deeperdeposits is appreciably more degraded. Thus,over time spans of hundreds to thousands ofyears, exposure to molecular oxygen appears toaffect both the amount and composition oforganic matter preserved in continental marginsediments.
6.11.3 DIAGENESIS AND PRESERVATIONOF CALCIUM CARBONATE
Between 20% and 30% of the carbonateproduced in the surface ocean is preserved inmarine sediments. The fraction of CaCO3 pro-duced that is buried dramatically affects thealkalinity and dissolved inorganic carbon (DIC)of seawater, and is thus important for under-standing the processes that control the partialpressure of carbon dioxide in the atmosphere.Paleoceanographers have observed that theCaCO3 content of marine sediments has changedwith time in concert with glacial–interglacialperiods. By studying the mechanisms that pre-sently control CaCO3 preservation, one seeks tounderstand what past changes imply about thechemistry of the ocean through time.
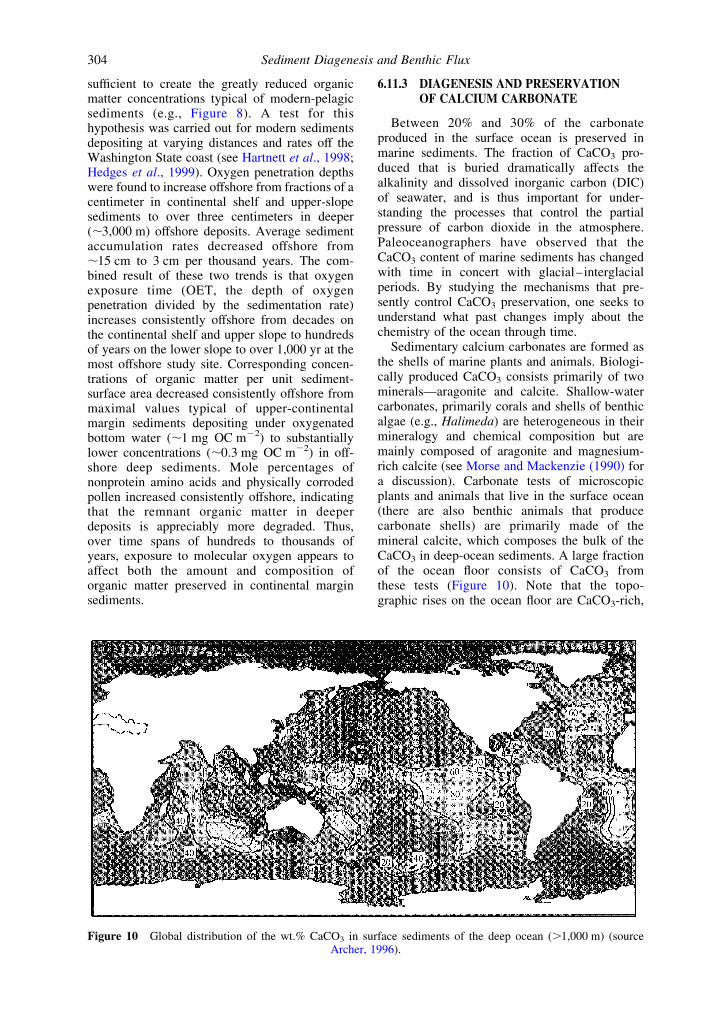
Sedimentary calcium carbonates are formed asthe shells of marine plants and animals. Biologi-cally produced CaCO3 consists primarily of twominerals—aragonite and calcite. Shallow-watercarbonates, primarily corals and shells of benthicalgae (e.g., Halimeda) are heterogeneous in theirmineralogy and chemical composition but aremainly composed of aragonite and magnesium-rich calcite (see Morse and Mackenzie (1990) fora discussion). Carbonate tests of microscopicplants and animals that live in the surface ocean(there are also benthic animals that producecarbonate shells) are primarily made of themineral calcite, which composes the bulk of theCaCO3 in deep-ocean sediments. A large fractionof the ocean floor consists of CaCO3 fromthese tests (Figure 10). Note that the topo-graphic rises on the ocean floor are CaCO3-rich,
Figure 10 Global distribution of the wt.% CaCO3 in surface sediments of the deep ocean (.1,000 m) (sourceArcher, 1996).
Sediment Diagenesis and Benthic Flux304
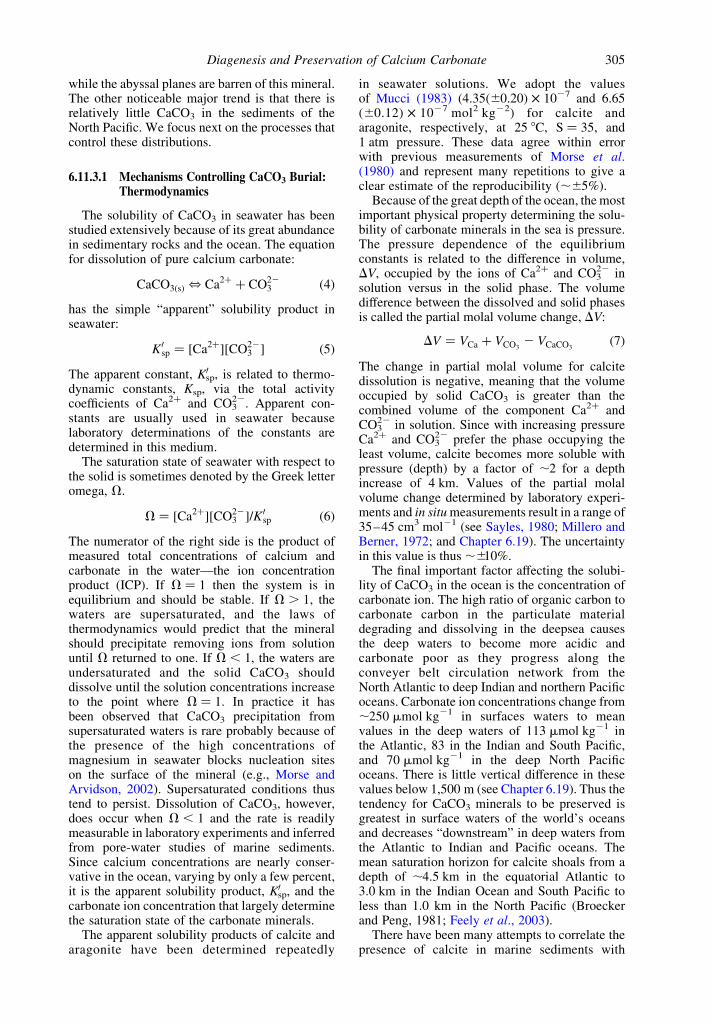
while the abyssal planes are barren of this mineral.The other noticeable major trend is that there isrelatively little CaCO3 in the sediments of theNorth Pacific. We focus next on the processes thatcontrol these distributions.
6.11.3.1 Mechanisms Controlling CaCO3 Burial:Thermodynamics
The solubility of CaCO3 in seawater has beenstudied extensively because of its great abundancein sedimentary rocks and the ocean. The equationfor dissolution of pure calcium carbonate:
CaCO3ðsÞ , Ca2þ þ CO223 ð4Þ
has the simple “apparent” solubility product inseawater:
K 0sp ¼ ½Ca2þ�½CO22
3 � ð5Þ
The apparent constant, K0sp, is related to thermo-
dynamic constants, Ksp, via the total activitycoefficients of Ca2þ and CO3
22. Apparent con-stants are usually used in seawater becauselaboratory determinations of the constants aredetermined in this medium.
The saturation state of seawater with respect tothe solid is sometimes denoted by the Greek letteromega, V.
V ¼ ½Ca2þ�½CO223 �=K 0
sp ð6Þ
The numerator of the right side is the product ofmeasured total concentrations of calcium andcarbonate in the water—the ion concentrationproduct (ICP). If V ¼ 1 then the system is inequilibrium and should be stable. If V . 1; thewaters are supersaturated, and the laws ofthermodynamics would predict that the mineralshould precipitate removing ions from solutionuntil V returned to one. If V , 1, the waters areundersaturated and the solid CaCO3 shoulddissolve until the solution concentrations increaseto the point where V ¼ 1. In practice it hasbeen observed that CaCO3 precipitation fromsupersaturated waters is rare probably because ofthe presence of the high concentrations ofmagnesium in seawater blocks nucleation siteson the surface of the mineral (e.g., Morse andArvidson, 2002). Supersaturated conditions thustend to persist. Dissolution of CaCO3, however,does occur when V , 1 and the rate is readilymeasurable in laboratory experiments and inferredfrom pore-water studies of marine sediments.Since calcium concentrations are nearly conser-vative in the ocean, varying by only a few percent,it is the apparent solubility product, K0
sp, and thecarbonate ion concentration that largely determinethe saturation state of the carbonate minerals.
The apparent solubility products of calcite andaragonite have been determined repeatedly
in seawater solutions. We adopt the valuesof Mucci (1983) (4.35(^0.20) £ 1027 and 6.65(^0.12) £ 1027 mol2 kg22) for calcite andaragonite, respectively, at 25 8C, S ¼ 35, and1 atm pressure. These data agree within errorwith previous measurements of Morse et al.(1980) and represent many repetitions to give aclear estimate of the reproducibility (,^5%).
Because of the great depth of the ocean, the mostimportant physical property determining the solu-bility of carbonate minerals in the sea is pressure.The pressure dependence of the equilibriumconstants is related to the difference in volume,DV, occupied by the ions of Ca2þ and CO3
22 insolution versus in the solid phase. The volumedifference between the dissolved and solid phasesis called the partial molal volume change, DV:
DV ¼ VCa þ VCO32 VCaCO3
ð7Þ
The change in partial molal volume for calcitedissolution is negative, meaning that the volumeoccupied by solid CaCO3 is greater than thecombined volume of the component Ca2þ andCO3
22 in solution. Since with increasing pressureCa2þ and CO3
22 prefer the phase occupying theleast volume, calcite becomes more soluble withpressure (depth) by a factor of ,2 for a depthincrease of 4 km. Values of the partial molalvolume change determined by laboratory experi-ments and in situ measurements result in a range of35–45 cm3 mol21 (see Sayles, 1980; Millero andBerner, 1972; and Chapter 6.19). The uncertaintyin this value is thus , 10%.
The final important factor affecting the solubi-lity of CaCO3 in the ocean is the concentration ofcarbonate ion. The high ratio of organic carbon tocarbonate carbon in the particulate materialdegrading and dissolving in the deepsea causesthe deep waters to become more acidic andcarbonate poor as they progress along theconveyer belt circulation network from theNorth Atlantic to deep Indian and northern Pacificoceans. Carbonate ion concentrations change from,250 mmol kg21 in surfaces waters to meanvalues in the deep waters of 113 mmol kg21 inthe Atlantic, 83 in the Indian and South Pacific,and 70 mmol kg21 in the deep North Pacificoceans. There is little vertical difference in thesevalues below 1,500 m (see Chapter 6.19). Thus thetendency for CaCO3 minerals to be preserved isgreatest in surface waters of the world’s oceansand decreases “downstream” in deep waters fromthe Atlantic to Indian and Pacific oceans. Themean saturation horizon for calcite shoals from adepth of ,4.5 km in the equatorial Atlantic to3.0 km in the Indian Ocean and South Pacific toless than 1.0 km in the North Pacific (Broeckerand Peng, 1981; Feely et al., 2003).
There have been many attempts to correlate thepresence of calcite in marine sediments with
Diagenesis and Preservation of Calcium Carbonate 305
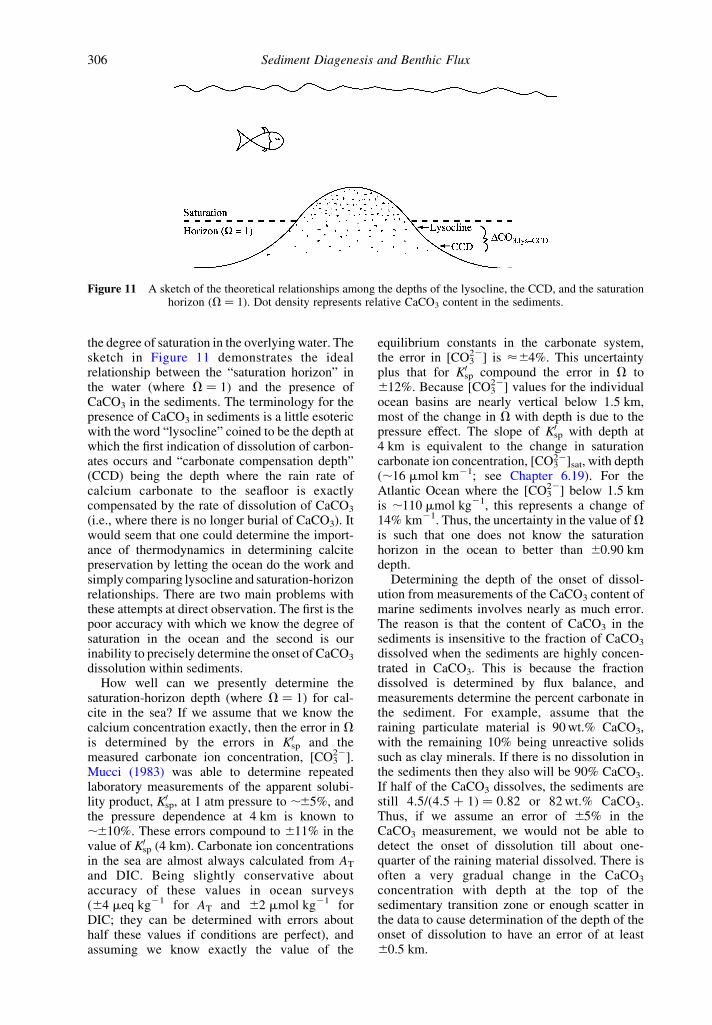
the degree of saturation in the overlying water. Thesketch in Figure 11 demonstrates the idealrelationship between the “saturation horizon” inthe water (where V ¼ 1) and the presence ofCaCO3 in the sediments. The terminology for thepresence of CaCO3 in sediments is a little esotericwith the word “lysocline” coined to be the depth atwhich the first indication of dissolution of carbon-ates occurs and “carbonate compensation depth”(CCD) being the depth where the rain rate ofcalcium carbonate to the seafloor is exactlycompensated by the rate of dissolution of CaCO3
(i.e., where there is no longer burial of CaCO3). Itwould seem that one could determine the import-ance of thermodynamics in determining calcitepreservation by letting the ocean do the work andsimply comparing lysocline and saturation-horizonrelationships. There are two main problems withthese attempts at direct observation. The first is thepoor accuracy with which we know the degree ofsaturation in the ocean and the second is ourinability to precisely determine the onset of CaCO3
dissolution within sediments.How well can we presently determine the
saturation-horizon depth (where V ¼ 1) for cal-cite in the sea? If we assume that we know thecalcium concentration exactly, then the error in Vis determined by the errors in K0
sp and themeasured carbonate ion concentration, [CO3
22].Mucci (1983) was able to determine repeatedlaboratory measurements of the apparent solubi-lity product, K0
sp, at 1 atm pressure to , 5%, andthe pressure dependence at 4 km is known to, 10%. These errors compound to ^11% in thevalue of K0
sp (4 km). Carbonate ion concentrationsin the sea are almost always calculated from AT
and DIC. Being slightly conservative aboutaccuracy of these values in ocean surveys(^4 meq kg21 for AT and ^2 mmol kg21 forDIC; they can be determined with errors abouthalf these values if conditions are perfect), andassuming we know exactly the value of the
equilibrium constants in the carbonate system,the error in [CO3
22] is <^4%. This uncertaintyplus that for K0
sp compound the error in V to^12%. Because [CO3
22] values for the individualocean basins are nearly vertical below 1.5 km,most of the change in V with depth is due to thepressure effect. The slope of K0
sp with depth at4 km is equivalent to the change in saturationcarbonate ion concentration, [CO3
22]sat, with depth(,16 mmol km21; see Chapter 6.19). For theAtlantic Ocean where the [CO3
22] below 1.5 kmis ,110 mmol kg21, this represents a change of14% km21. Thus, the uncertainty in the value of Vis such that one does not know the saturationhorizon in the ocean to better than ^0.90 kmdepth.
Determining the depth of the onset of dissol-ution from measurements of the CaCO3 content ofmarine sediments involves nearly as much error.The reason is that the content of CaCO3 in thesediments is insensitive to the fraction of CaCO3
dissolved when the sediments are highly concen-trated in CaCO3. This is because the fractiondissolved is determined by flux balance, andmeasurements determine the percent carbonate inthe sediment. For example, assume that theraining particulate material is 90 wt.% CaCO3,with the remaining 10% being unreactive solidssuch as clay minerals. If there is no dissolution inthe sediments then they also will be 90% CaCO3.If half of the CaCO3 dissolves, the sediments arestill 4.5/(4.5 þ 1) ¼ 0.82 or 82 wt.% CaCO3.Thus, if we assume an error of ^5% in theCaCO3 measurement, we would not be able todetect the onset of dissolution till about one-quarter of the raining material dissolved. There isoften a very gradual change in the CaCO3
concentration with depth at the top of thesedimentary transition zone or enough scatter inthe data to cause determination of the depth of theonset of dissolution to have an error of at least^0.5 km.
Figure 11 A sketch of the theoretical relationships among the depths of the lysocline, the CCD, and the saturationhorizon (V ¼ 1). Dot density represents relative CaCO3 content in the sediments.
Sediment Diagenesis and Benthic Flux306
While errors in evaluating the depths of both thesaturation horizon and the onset of CaCO3
dissolution complicate “field” tests of the import-ance of chemical equilibrium, the differencein carbonate ion concentration over the depthrange of the transition between calcite-richand calcite-poor sediments is more clearbecause it is easier to know the difference inboth [CO3
22] and CaCO3 wt.% than theabsolute value. The difference, DCO3, lys – CCD
( ¼ [CO322]lys 2 [CO3
22]CCD; Figure 11), has beenmapped by Archer (1996) in all areas of the oceanwhere both [CO3
22] in the bottom water andCaCO3 wt.% in sediments have been determined.The ocean mean is 19 ^ 12 mmol kg21 ðn ¼ 30Þ:The simple fact that the transition fromCaCO3-rich to CaCO3-poor sediments occursover a broad range of [CO3
22] values indicatesthat the pattern of CaCO3 preservation cannot bebased on thermodynamics alone. Kinetic pro-cesses must be important.
6.11.3.2 Mechanism of CaCO3 Dissolution:Kinetics
6.11.3.2.1 The dissolution rate constant
The dissolution rates of the minerals of calciumcarbonate have been shown in laboratory experi-ments to follow the rate law:
R ¼ k{K 0sp 2 ICP}n ð8Þ
where k is the dissolution rate constant which hasunits necessary to match those of the rate. Theexponent n is one for diffusion-controlled reac-tions and usually some higher number for surface-controlled reaction rates (see Morse and Arvidson,2002). The above equation can be recast forCaCO3 dissolution in two ways:
R ¼ k{½Ca2þ�s½CO223 �s 2 ½Ca2þ�½CO22
3 �}nð9Þ
and, if [Ca]s ¼ [Ca],
R ¼ k½Ca2þ�n{½CO223 �2 ½CO22
3 �}n
where kp ¼ k½Ca�n; alternatively,
R ¼ k{K 0spð1 2VÞ}n ¼ kK 0
spn ð1 2VÞn ð10Þ
where kp ¼ kK 0spn:
These equations are indistinguishable for ratemeasurements at a single temperature and press-ure, but predict different results for the variation ofthe rate constant, kp; with environmental variables(i.e., T, P, and [Ca2þ]). Because [Ca2þ] is notconstant in laboratory experiments during thecourse of dissolution, Equation (10) is normallyused to interpret these results (e.g., Morse andArvidson, 2002; Keir, 1980). In the ocean, where[Ca2þ] is nearly a constant but K 0
sp varies
dramatically with pressure, Equation (9) is moreconvenient.
There are several studies that have beensuccessful in determining the dissolution rate atconditions near seawater saturation. Acker et al.(1987) was able to employ very precise determi-nations of pH to measure the rate of dissolution of asingle pteropod shell at different pressures from15 atm to 300 atm. Because his measurementswere at different pressures and K 0
sp is a function ofpressure, he was able to determine whether the rateconstant is indeed a function of K 0
sp: He found thatEquation (9) fit his data better than (10), suggestingthat the constant is not pressure dependent and theformer is a more accurate universal rate law. Anexponent of n ¼ 1:9 was obtained for this surface-controlled dissolution reaction and a partial molalvolume, DV, of 239 cm3 mol21 (very close to themean of the values determined in laboratoryexperiments for calcite) best fit the data.
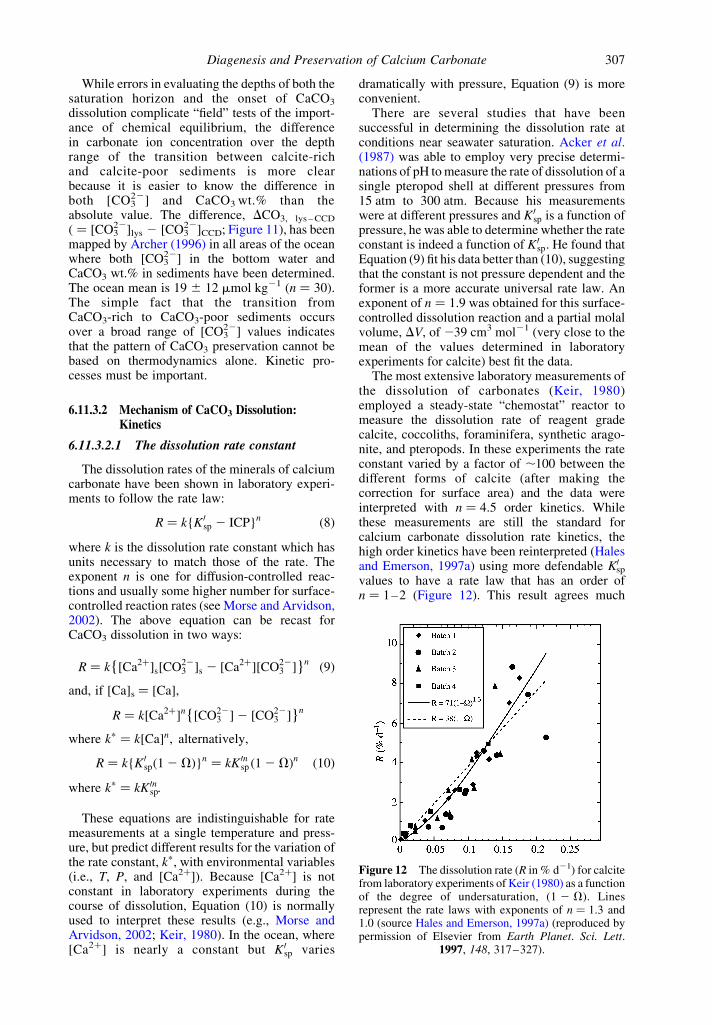
The most extensive laboratory measurements ofthe dissolution of carbonates (Keir, 1980)employed a steady-state “chemostat” reactor tomeasure the dissolution rate of reagent gradecalcite, coccoliths, foraminifera, synthetic arago-nite, and pteropods. In these experiments the rateconstant varied by a factor of ,100 between thedifferent forms of calcite (after making thecorrection for surface area) and the data wereinterpreted with n ¼ 4:5 order kinetics. Whilethese measurements are still the standard forcalcium carbonate dissolution rate kinetics, thehigh order kinetics have been reinterpreted (Halesand Emerson, 1997a) using more defendable K0
sp
values to have a rate law that has an order ofn ¼ 1–2 (Figure 12). This result agrees much
Figure 12 The dissolution rate (R in % d21) for calcitefrom laboratory experiments of Keir (1980) as a functionof the degree of undersaturation, (1 2 V). Linesrepresent the rate laws with exponents of n ¼ 1.3 and1.0 (source Hales and Emerson, 1997a) (reproduced bypermission of Elsevier from Earth Planet. Sci. Lett.
1997, 148, 317–327).
Diagenesis and Preservation of Calcium Carbonate 307
more closely with the aragonite experiments anddissolution rate laws determined for other min-erals, and we adopt it as more likely than n ¼ 4:5:Note that the units of the rate constant (Figure 12;k ¼ 0.38 d21or 100 times this value, 38% d21) arenormalized to the concentration of solid in theexperimental reactor. A convenient way to viewthis rate constant is that the units represent molesCO3
22 cm23 d21 released to the water per mole ofCaCO3 cm23 in the solution, thus mol cm23 d21/mol cm23 ¼ d21. At the time of using the rateconstant to calculate dissolution in the environ-ment the units must be “transformed.”
One of the great uncertainties in our under-standing of the kinetics of CaCO3 dissolution atthis time is that the dissolution rate constantsrequired to interpret ocean observations are muchsmaller than those measured in the laboratory. Thiscan be illustrated rather simply by applying theobserved laboratory kinetic rate constant todetermine the DCO3 necessary to produce thetransition in CaCO3 concentrations observed inmarine sediments (Appendix A). To make thecalculation we have to assume dissolution beginswhen the bottom waters become undersaturatedwith respect to calcite and then determine the fluxof calcium from the sediments as the degree ofundersaturation increases. It is assumed that thedissolution flux of CaCO3 is equal to the flux ofCO3
22 from the sediments and that CO322 does not
react with other carbonate system ions in solution.These assumptions are, of course, incorrect butacceptable for a first order of approximation. (The2 : 1 change in AT and DIC, that accompaniesCaCO3 dissolution, increases the [CO3
22] by,35%of the DIC increase at pH ¼ 7.5. Thus, the gradientof [Ca2þ] would be ,3 times the gradient in[CO3
22] at the pH of pore waters. This is consideredan acceptable error for this demonstration.)
The result of the calculation (Appendix A)indicates that the rate constant necessary tocreate the DCO3,lys – CCD ¼ 19 mmol kg21, has tobe at least 100 times less than the laboratory-determined values. This has been confirmed byin situ measurements (see later). Perhaps the mostimportant lesson here is that models and laboratoryexperiments consider primarily pure phaseswhereas impurities and surface coatings maygreatly influence dissolution rates in nature. Untilthere is better agreement between the laboratoryand in situ model-determined values, the latter willhave to be used in model reconstructions of therelationship between ocean chemistry and sedi-mentary carbonate content.
6.11.3.2.2 The effect of organic matterdegradation
The relatively slow dissolution of calcite canexplain the gradual change between carbonate-rich
and carbonate-poor sediments. There is, however,another important issue that we have notconsidered—the role of organic matter degra-dation in sediments in promoting in situ calcitedissolution. It was long suspected that organicmatter degradation would promote dissolution,but this was not quantified until the 1980s and1990s. Two factors lead to the realization that theinorganic kinetic interpretation of CaCO3 burial inthe ocean was incomplete. First, observations ofthe carbon content of particles that rain to theocean floor collected in sediment traps 1 km orless above the bottom suggest the molar organiccarbon to CaCO3 carbon rain ratio is about one. Afew centimeters below the sediment surface thisratio is more like 0.1, indicating that somethinglike 90% of the organic carbon that reaches thesurface is degraded rather than buried. Second,sediment pore-water studies in the same areas asthe sediment trap deployments show strongoxygen depletions in the top few centimeters.Simple-flux calculations require that the bulk ofthe organic matter degradation between thesinking particles and that buried takes placewithin the sediments (Emerson et al., 1985;Figure 4). Thus, most particles that reach theseafloor are stirred into the sediments before theyhave a chance to degrade while sitting on thesurface. If this were not the case, and the particlesdegraded on the surface, there would be littleoxygen depletion within the sediments.
Organic matter degradation within the sedi-ments creates a microenvironment that is corros-ive to CaCO3 even if the bottom waters are not,because addition of DIC and no AT to the porewater causes it to have a lower pH and smaller[CO3
22]. Using a simple analytical model and first-order dissolution rate kinetics, Emerson andBender (1981) predicted that this effect shouldresult in up to 50% of the CaCO3 that rains to theseafloor being dissolved even at the saturationhorizon, where the bottom waters are saturatedwith respect to calcite. Because the percentCaCO3 in sediments is so insensitive to dissol-ution and the saturation-horizon depth so uncer-tain, this suggestion was well within theconstraints of environmental observations.
The effect of organic matter driven dissolutionis to raise the carbonate transition in sedimentsrelative to the saturation horizon in thewater column (Emerson and Archer, 1990;Figure 11), but there should be little change inthe DCO3,lys – CCD necessary to create the tran-sition in %CaCO3. Thus, the argument about therelationship between the dissolution rate constantand observed transition of %CaCO3 in sediments(Appendix A) should not be affected.
The suggestion of “organic CaCO3 dissolution”in sediments has been tested by determining thegradient of oxygen and [CO3
22] in the sediment
Sediment Diagenesis and Benthic Flux308
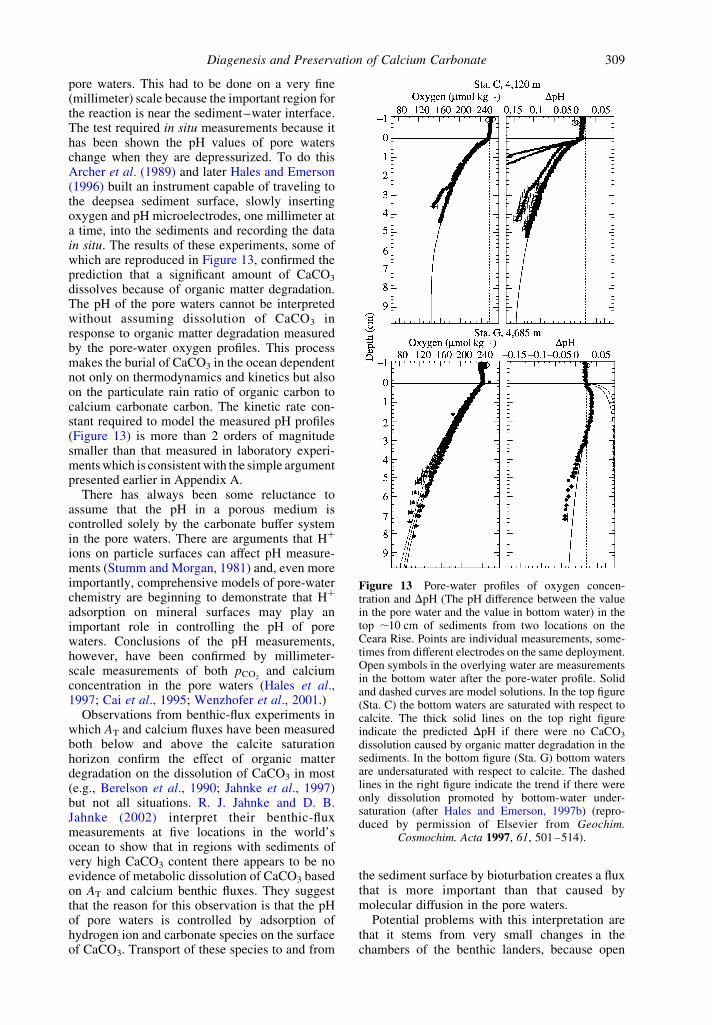
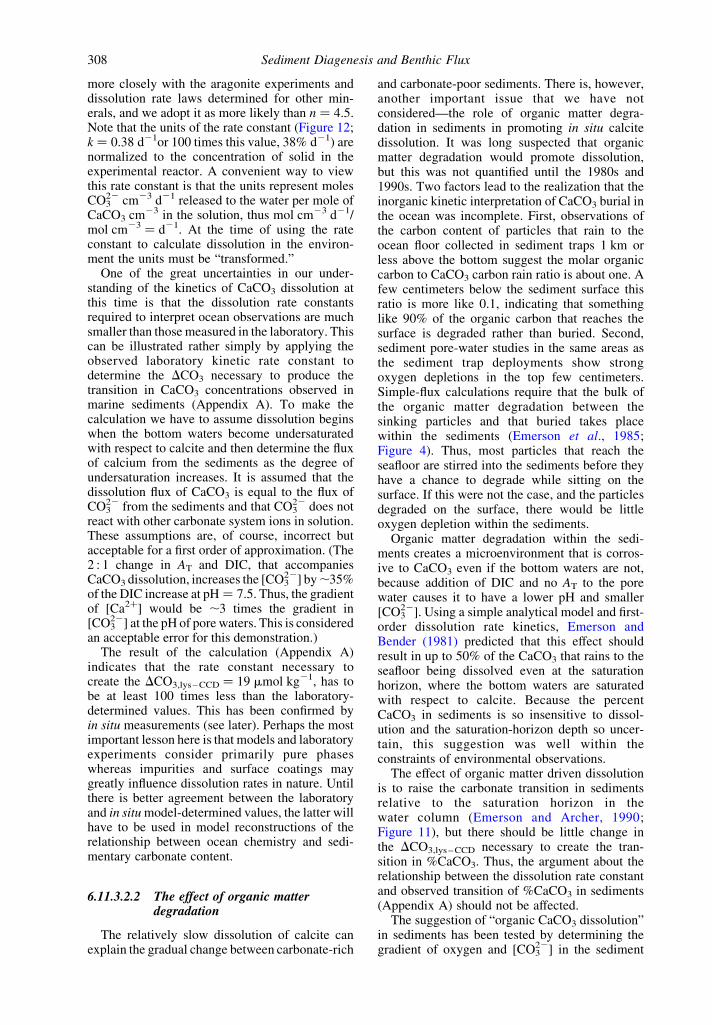
pore waters. This had to be done on a very fine(millimeter) scale because the important region forthe reaction is near the sediment–water interface.The test required in situ measurements because ithas been shown the pH values of pore waterschange when they are depressurized. To do thisArcher et al. (1989) and later Hales and Emerson(1996) built an instrument capable of traveling tothe deepsea sediment surface, slowly insertingoxygen and pH microelectrodes, one millimeter ata time, into the sediments and recording the datain situ. The results of these experiments, some ofwhich are reproduced in Figure 13, confirmed theprediction that a significant amount of CaCO3
dissolves because of organic matter degradation.The pH of the pore waters cannot be interpretedwithout assuming dissolution of CaCO3 inresponse to organic matter degradation measuredby the pore-water oxygen profiles. This processmakes the burial of CaCO3 in the ocean dependentnot only on thermodynamics and kinetics but alsoon the particulate rain ratio of organic carbon tocalcium carbonate carbon. The kinetic rate con-stant required to model the measured pH profiles(Figure 13) is more than 2 orders of magnitudesmaller than that measured in laboratory experi-ments which is consistent with the simple argumentpresented earlier in Appendix A.
There has always been some reluctance toassume that the pH in a porous medium iscontrolled solely by the carbonate buffer systemin the pore waters. There are arguments that Hþ
ions on particle surfaces can affect pH measure-ments (Stumm and Morgan, 1981) and, even moreimportantly, comprehensive models of pore-waterchemistry are beginning to demonstrate that Hþ
adsorption on mineral surfaces may play animportant role in controlling the pH of porewaters. Conclusions of the pH measurements,however, have been confirmed by millimeter-scale measurements of both pCO2
and calciumconcentration in the pore waters (Hales et al.,1997; Cai et al., 1995; Wenzhofer et al., 2001.)
Observations from benthic-flux experiments inwhich AT and calcium fluxes have been measuredboth below and above the calcite saturationhorizon confirm the effect of organic matterdegradation on the dissolution of CaCO3 in most(e.g., Berelson et al., 1990; Jahnke et al., 1997)but not all situations. R. J. Jahnke and D. B.Jahnke (2002) interpret their benthic-fluxmeasurements at five locations in the world’socean to show that in regions with sediments ofvery high CaCO3 content there appears to be noevidence of metabolic dissolution of CaCO3 basedon AT and calcium benthic fluxes. They suggestthat the reason for this observation is that the pHof pore waters is controlled by adsorption ofhydrogen ion and carbonate species on the surfaceof CaCO3. Transport of these species to and from
the sediment surface by bioturbation creates a fluxthat is more important than that caused bymolecular diffusion in the pore waters.
Potential problems with this interpretation arethat it stems from very small changes in thechambers of the benthic landers, because open
Figure 13 Pore-water profiles of oxygen concen-tration and DpH (The pH difference between the valuein the pore water and the value in bottom water) in thetop ,10 cm of sediments from two locations on theCeara Rise. Points are individual measurements, some-times from different electrodes on the same deployment.Open symbols in the overlying water are measurementsin the bottom water after the pore-water profile. Solidand dashed curves are model solutions. In the top figure(Sta. C) the bottom waters are saturated with respect tocalcite. The thick solid lines on the top right figureindicate the predicted DpH if there were no CaCO3
dissolution caused by organic matter degradation in thesediments. In the bottom figure (Sta. G) bottom watersare undersaturated with respect to calcite. The dashedlines in the right figure indicate the trend if there wereonly dissolution promoted by bottom-water under-saturation (after Hales and Emerson, 1997b) (repro-duced by permission of Elsevier from Geochim.
Cosmochim. Acta 1997, 61, 501–514).
Diagenesis and Preservation of Calcium Carbonate 309
ocean areas high in CaCO3 are locations withrelatively low organic matter degradation rates.In addition, the surface properties of CaCO3 inseawater have not been measured sufficiently wellto incorporate adsorption effects into diagenesismodels. The observations, however, demandinterpretation, and, if adsorption effects turn outto be important, it will have ramifications forinterpreting mechanisms of CaCO3 preservationbecause of the wide-spread distribution of CaCO3-rich sediments.
Recent measurements of calcium and alkalinityin the ocean above the calcite saturation horizon(Milliman et al., 1999; Chen, 2002) suggestdissolution in supersaturated waters. The proposedmechanisms are variations of the organic matterdriven CaCO3 dissolution mechanism. In thesecases the authors suggest that microenvironmentsin falling particulate material (Milliman et al.,1999) or anerobic dissolution in sediments of thecontinental shelves and marginal seas (Chen,2002) are locations of CaCO3 dissolution. As thedetails and accuracy of measurements improve,thermodynamic and kinetic mechanisms requiredto interpret the results become more and morecomplex.
6.11.3.2.3 The interpretation of the 14C ageof surface sediments
Determining the 14C accumulation rate as afunction of the degree of saturation should be asensitive way of determining the extent andmechanism of CaCO3 dissolution in sediments.The 14C age of the bioturbated layer (the top4–8 cm of sediments based on the constancy of14C measurements) and the accumulation ratebelow depend on the rain rate and dissolution fluxof CaCO3. Two simple end-member cases illus-trate the complexity of interpreting core top 14Cdata. If dissolution takes place within the sedi-ments, as it must for organic matter-drivendissolution to be effective, and all CaCO3 particlesdissolve at the same rate, the radiocarbon ageshould decrease with the extent of dissolution—the reservoir size decreases but the influx remainsthe same. In this case the probability of survival ofall CaCO3 particles is the same so there would befewer older particles in the sediment mixed layerwith more intense dissolution. If, however,dissolution takes place primarily at the sediment–water interface before the particles are mixed intothe sediment, or for some reason younger particlesdissolve faster, the mixed layer ages wouldincrease with progressive dissolution becausethe input flux decreases faster than the reservoirsize.
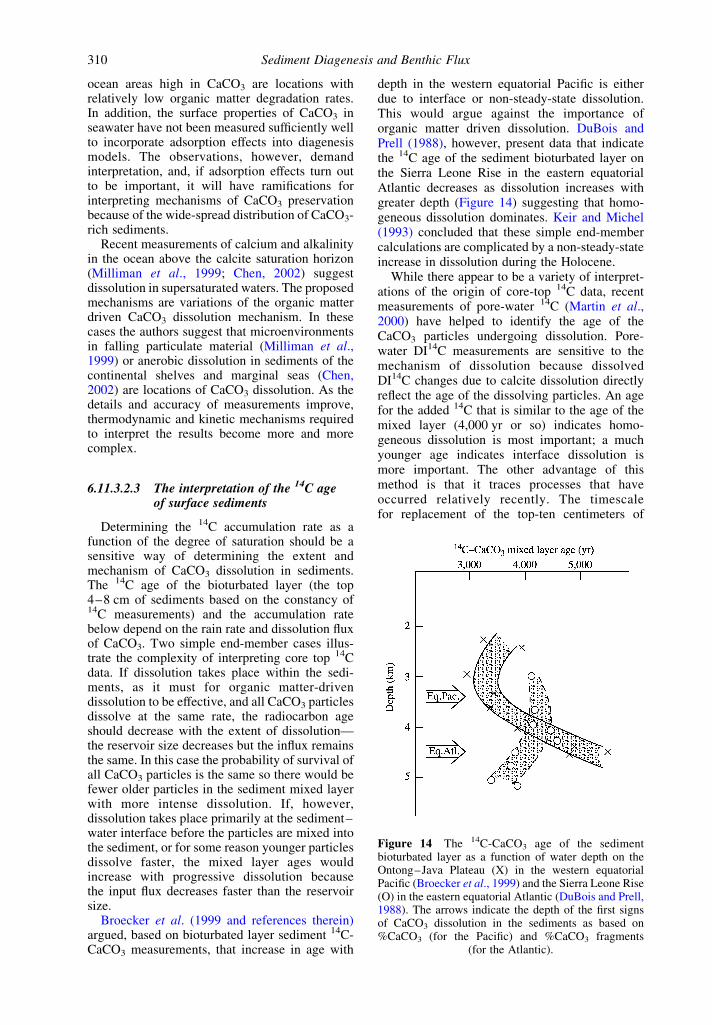
Broecker et al. (1999 and references therein)argued, based on bioturbated layer sediment 14C-CaCO3 measurements, that increase in age with
depth in the western equatorial Pacific is eitherdue to interface or non-steady-state dissolution.This would argue against the importance oforganic matter driven dissolution. DuBois andPrell (1988), however, present data that indicatethe 14C age of the sediment bioturbated layer onthe Sierra Leone Rise in the eastern equatorialAtlantic decreases as dissolution increases withgreater depth (Figure 14) suggesting that homo-geneous dissolution dominates. Keir and Michel(1993) concluded that these simple end-membercalculations are complicated by a non-steady-stateincrease in dissolution during the Holocene.
While there appear to be a variety of interpret-ations of the origin of core-top 14C data, recentmeasurements of pore-water 14C (Martin et al.,2000) have helped to identify the age of theCaCO3 particles undergoing dissolution. Pore-water DI14C measurements are sensitive to themechanism of dissolution because dissolvedDI14C changes due to calcite dissolution directlyreflect the age of the dissolving particles. An agefor the added 14C that is similar to the age of themixed layer (4,000 yr or so) indicates homo-geneous dissolution is most important; a muchyounger age indicates interface dissolution ismore important. The other advantage of thismethod is that it traces processes that haveoccurred relatively recently. The timescalefor replacement of the top-ten centimeters of
Figure 14 The 14C-CaCO3 age of the sedimentbioturbated layer as a function of water depth on theOntong–Java Plateau (X) in the western equatorialPacific (Broecker et al., 1999) and the Sierra Leone Rise(O) in the eastern equatorial Atlantic (DuBois and Prell,1988). The arrows indicate the depth of the first signsof CaCO3 dissolution in the sediments as based on%CaCO3 (for the Pacific) and %CaCO3 fragments
(for the Atlantic).
Sediment Diagenesis and Benthic Flux310
pore-water DIC by diffusion is years rather thanthousands of years for the processes that controlsediment ages. Martin et al. (2000) measuredpore-water DI14C at a stations above and belowthe saturation horizon in the western equatorialPacific. Below the saturation horizon, whereCaCO3 dissolves spontaneously by inorganicprocesses, DI14C values indicate younger particlesare preferentially dissolved, in accordance withthe sediment 14C ages that increase with greaterundersaturation and interface dissolution. Pore-water DIC from the sediments above thesaturation horizon, however, had ages that aremore consistent with a mixture of interfaceparticles undergoing homogeneous dissolution.
It appears at the time of writing this chapter thatthe mechanisms determining the 14C age ofsurface sediments are variable and may bedifferent for different saturation states even atthe same ocean location. This observation,compounded by the non-steady-state possibility(Keir and Michel, 1993) indicates that themechanisms controlling core top 14C ages areprobably too complicated to distinguish theimportance of organic matter driven dissolution.
6.11.4 DIAGENESIS AND PRESERVATIONOF SILICA
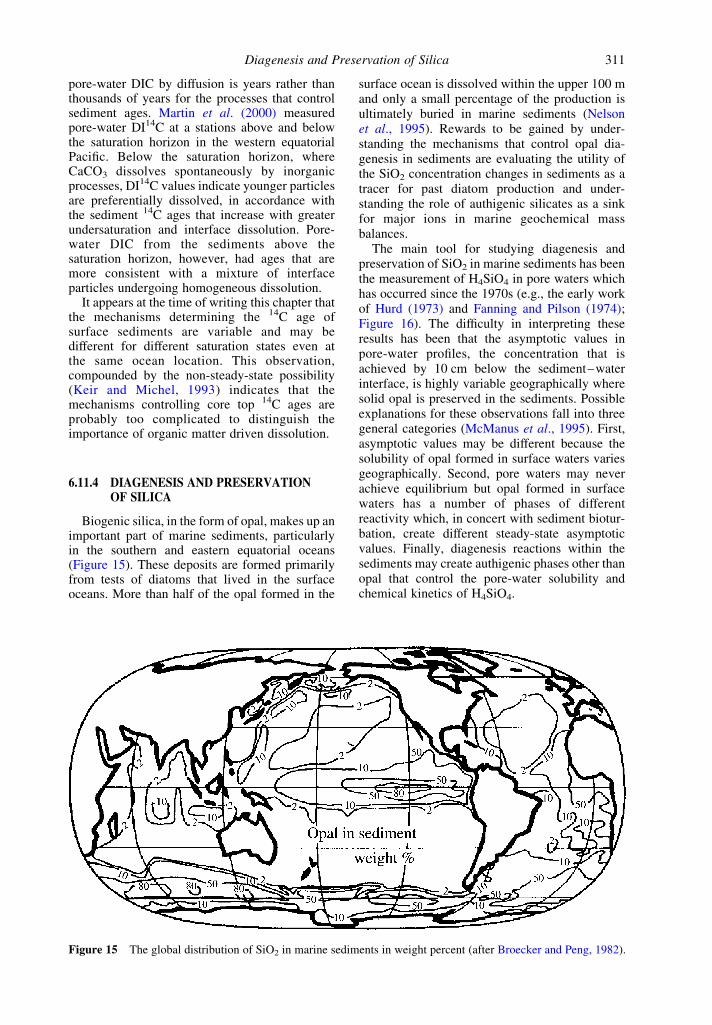
Biogenic silica, in the form of opal, makes up animportant part of marine sediments, particularlyin the southern and eastern equatorial oceans(Figure 15). These deposits are formed primarilyfrom tests of diatoms that lived in the surfaceoceans. More than half of the opal formed in the
surface ocean is dissolved within the upper 100 mand only a small percentage of the production isultimately buried in marine sediments (Nelsonet al., 1995). Rewards to be gained by under-standing the mechanisms that control opal dia-genesis in sediments are evaluating the utility ofthe SiO2 concentration changes in sediments as atracer for past diatom production and under-standing the role of authigenic silicates as a sinkfor major ions in marine geochemical massbalances.
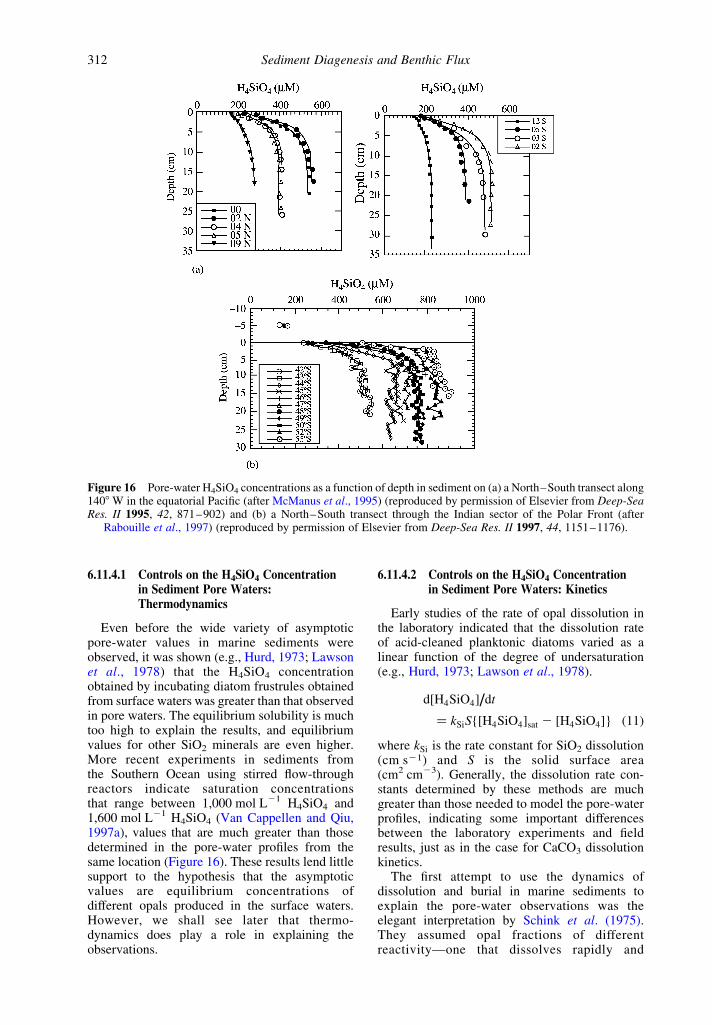
The main tool for studying diagenesis andpreservation of SiO2 in marine sediments has beenthe measurement of H4SiO4 in pore waters whichhas occurred since the 1970s (e.g., the early workof Hurd (1973) and Fanning and Pilson (1974);Figure 16). The difficulty in interpreting theseresults has been that the asymptotic values inpore-water profiles, the concentration that isachieved by 10 cm below the sediment–waterinterface, is highly variable geographically wheresolid opal is preserved in the sediments. Possibleexplanations for these observations fall into threegeneral categories (McManus et al., 1995). First,asymptotic values may be different because thesolubility of opal formed in surface waters variesgeographically. Second, pore waters may neverachieve equilibrium but opal formed in surfacewaters has a number of phases of differentreactivity which, in concert with sediment biotur-bation, create different steady-state asymptoticvalues. Finally, diagenesis reactions within thesediments may create authigenic phases other thanopal that control the pore-water solubility andchemical kinetics of H4SiO4.
Figure 15 The global distribution of SiO2 in marine sediments in weight percent (after Broecker and Peng, 1982).
Diagenesis and Preservation of Silica 311
6.11.4.1 Controls on the H4SiO4 Concentrationin Sediment Pore Waters:Thermodynamics
Even before the wide variety of asymptoticpore-water values in marine sediments wereobserved, it was shown (e.g., Hurd, 1973; Lawsonet al., 1978) that the H4SiO4 concentrationobtained by incubating diatom frustrules obtainedfrom surface waters was greater than that observedin pore waters. The equilibrium solubility is muchtoo high to explain the results, and equilibriumvalues for other SiO2 minerals are even higher.More recent experiments in sediments fromthe Southern Ocean using stirred flow-throughreactors indicate saturation concentrationsthat range between 1,000 mol L21 H4SiO4 and1,600 mol L21 H4SiO4 (Van Cappellen and Qiu,1997a), values that are much greater than thosedetermined in the pore-water profiles from thesame location (Figure 16). These results lend littlesupport to the hypothesis that the asymptoticvalues are equilibrium concentrations ofdifferent opals produced in the surface waters.However, we shall see later that thermo-dynamics does play a role in explaining theobservations.
6.11.4.2 Controls on the H4SiO4 Concentrationin Sediment Pore Waters: Kinetics
Early studies of the rate of opal dissolution inthe laboratory indicated that the dissolution rateof acid-cleaned planktonic diatoms varied as alinear function of the degree of undersaturation(e.g., Hurd, 1973; Lawson et al., 1978).
d½H4SiO4�=dt
¼ kSiS{½H4SiO4�sat 2 ½H4SiO4�} ð11Þ
where kSi is the rate constant for SiO2 dissolution(cm s21) and S is the solid surface area(cm2 cm23). Generally, the dissolution rate con-stants determined by these methods are muchgreater than those needed to model the pore-waterprofiles, indicating some important differencesbetween the laboratory experiments and fieldresults, just as in the case for CaCO3 dissolutionkinetics.
The first attempt to use the dynamics ofdissolution and burial in marine sediments toexplain the pore-water observations was theelegant interpretation by Schink et al. (1975).They assumed opal fractions of differentreactivity—one that dissolves rapidly and
Figure 16 Pore-water H4SiO4 concentrations as a function of depth in sediment on (a) a North–South transect along1408 W in the equatorial Pacific (after McManus et al., 1995) (reproduced by permission of Elsevier from Deep-SeaRes. II 1995, 42, 871–902) and (b) a North–South transect through the Indian sector of the Polar Front (after
Rabouille et al., 1997) (reproduced by permission of Elsevier from Deep-Sea Res. II 1997, 44, 1151–1176).
Sediment Diagenesis and Benthic Flux312
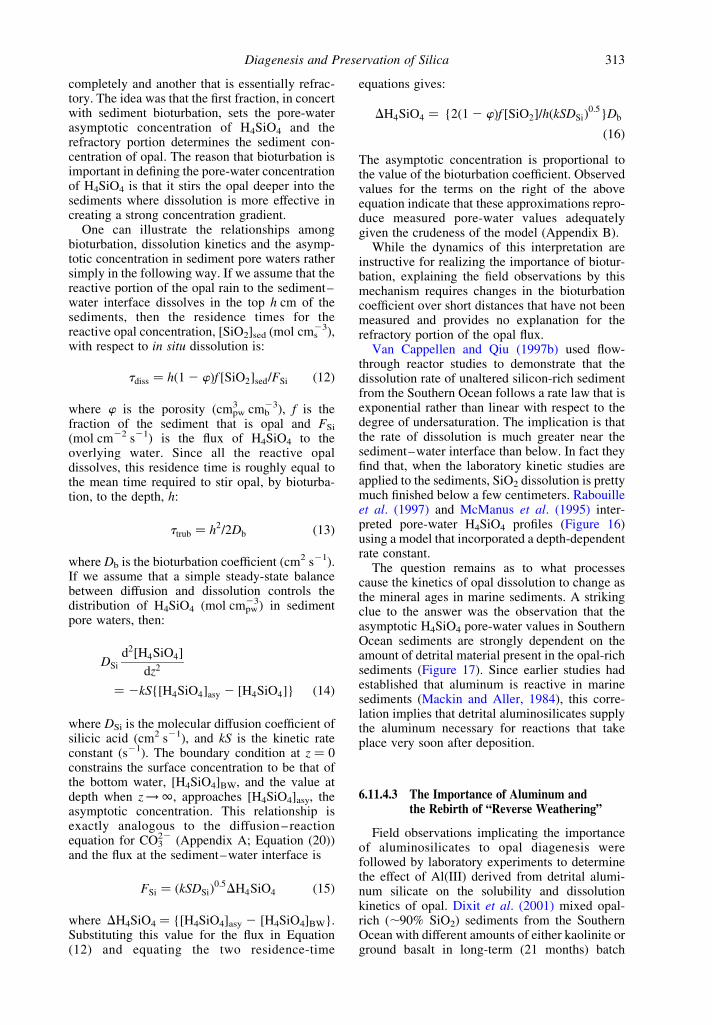
completely and another that is essentially refrac-tory. The idea was that the first fraction, in concertwith sediment bioturbation, sets the pore-waterasymptotic concentration of H4SiO4 and therefractory portion determines the sediment con-centration of opal. The reason that bioturbation isimportant in defining the pore-water concentrationof H4SiO4 is that it stirs the opal deeper into thesediments where dissolution is more effective increating a strong concentration gradient.
One can illustrate the relationships amongbioturbation, dissolution kinetics and the asymp-totic concentration in sediment pore waters rathersimply in the following way. If we assume that thereactive portion of the opal rain to the sediment–water interface dissolves in the top h cm of thesediments, then the residence times for thereactive opal concentration, [SiO2]sed (mol cms
23),with respect to in situ dissolution is:
tdiss ¼ hð1 2 wÞf ½SiO2�sed=FSi ð12Þ
where w is the porosity (cmpw3 cmb
23), f is thefraction of the sediment that is opal and FSi
(mol cm22 s21) is the flux of H4SiO4 to theoverlying water. Since all the reactive opaldissolves, this residence time is roughly equal tothe mean time required to stir opal, by bioturba-tion, to the depth, h:
ttrub ¼ h2=2Db ð13Þ
where Db is the bioturbation coefficient (cm2 s21).If we assume that a simple steady-state balancebetween diffusion and dissolution controls thedistribution of H4SiO4 (mol cmpw
23) in sedimentpore waters, then:
DSi
d2½H4SiO4�
dz2
¼ 2kS{½H4SiO4�asy 2 ½H4SiO4�} ð14Þ
where DSi is the molecular diffusion coefficient ofsilicic acid (cm2 s21), and kS is the kinetic rateconstant (s21). The boundary condition at z ¼ 0constrains the surface concentration to be that ofthe bottom water, [H4SiO4]BW, and the value atdepth when z !1; approaches [H4SiO4]asy, theasymptotic concentration. This relationship isexactly analogous to the diffusion – reactionequation for CO3
22 (Appendix A; Equation (20))and the flux at the sediment–water interface is
FSi ¼ ðkSDSiÞ0:5DH4SiO4 ð15Þ
where DH4SiO4 ¼ {[H4SiO4]asy 2 [H4SiO4]BW}.Substituting this value for the flux in Equation(12) and equating the two residence-time
equations gives:
DH4SiO4 ¼ {2ð1 2 wÞf ½SiO2�=hðkSDSiÞ0:5}Db
ð16Þ
The asymptotic concentration is proportional tothe value of the bioturbation coefficient. Observedvalues for the terms on the right of the aboveequation indicate that these approximations repro-duce measured pore-water values adequatelygiven the crudeness of the model (Appendix B).
While the dynamics of this interpretation areinstructive for realizing the importance of biotur-bation, explaining the field observations by thismechanism requires changes in the bioturbationcoefficient over short distances that have not beenmeasured and provides no explanation for therefractory portion of the opal flux.
Van Cappellen and Qiu (1997b) used flow-through reactor studies to demonstrate that thedissolution rate of unaltered silicon-rich sedimentfrom the Southern Ocean follows a rate law that isexponential rather than linear with respect to thedegree of undersaturation. The implication is thatthe rate of dissolution is much greater near thesediment–water interface than below. In fact theyfind that, when the laboratory kinetic studies areapplied to the sediments, SiO2 dissolution is prettymuch finished below a few centimeters. Rabouilleet al. (1997) and McManus et al. (1995) inter-preted pore-water H4SiO4 profiles (Figure 16)using a model that incorporated a depth-dependentrate constant.
The question remains as to what processescause the kinetics of opal dissolution to change asthe mineral ages in marine sediments. A strikingclue to the answer was the observation that theasymptotic H4SiO4 pore-water values in SouthernOcean sediments are strongly dependent on theamount of detrital material present in the opal-richsediments (Figure 17). Since earlier studies hadestablished that aluminum is reactive in marinesediments (Mackin and Aller, 1984), this corre-lation implies that detrital aluminosilicates supplythe aluminum necessary for reactions that takeplace very soon after deposition.
6.11.4.3 The Importance of Aluminum andthe Rebirth of “Reverse Weathering”
Field observations implicating the importanceof aluminosilicates to opal diagenesis werefollowed by laboratory experiments to determinethe effect of Al(III) derived from detrital alumi-num silicate on the solubility and dissolutionkinetics of opal. Dixit et al. (2001) mixed opal-rich (,90% SiO2) sediments from the SouthernOcean with different amounts of either kaolinite orground basalt in long-term (21 months) batch
Diagenesis and Preservation of Silica 313
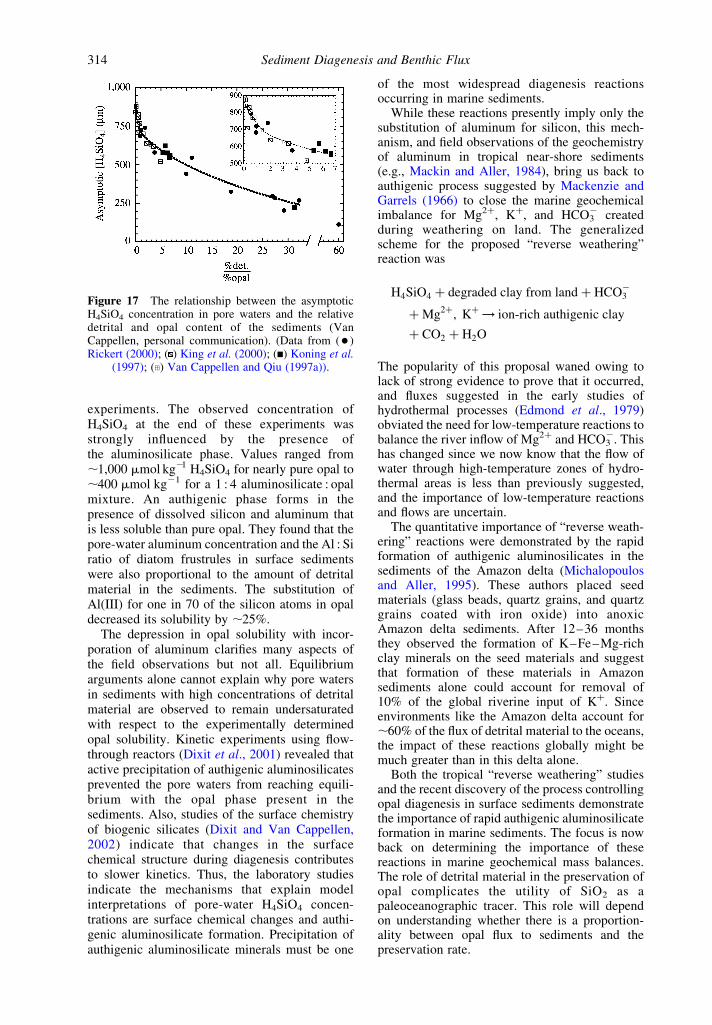
experiments. The observed concentration ofH4SiO4 at the end of these experiments wasstrongly influenced by the presence ofthe aluminosilicate phase. Values ranged from,1,000 mmol kg21 H4SiO4 for nearly pure opal to,400 mmol kg21 for a 1 : 4 aluminosilicate : opalmixture. An authigenic phase forms in thepresence of dissolved silicon and aluminum thatis less soluble than pure opal. They found that thepore-water aluminum concentration and the Al : Siratio of diatom frustrules in surface sedimentswere also proportional to the amount of detritalmaterial in the sediments. The substitution ofAl(III) for one in 70 of the silicon atoms in opaldecreased its solubility by ,25%.
The depression in opal solubility with incor-poration of aluminum clarifies many aspects ofthe field observations but not all. Equilibriumarguments alone cannot explain why pore watersin sediments with high concentrations of detritalmaterial are observed to remain undersaturatedwith respect to the experimentally determinedopal solubility. Kinetic experiments using flow-through reactors (Dixit et al., 2001) revealed thatactive precipitation of authigenic aluminosilicatesprevented the pore waters from reaching equili-brium with the opal phase present in thesediments. Also, studies of the surface chemistryof biogenic silicates (Dixit and Van Cappellen,2002) indicate that changes in the surfacechemical structure during diagenesis contributesto slower kinetics. Thus, the laboratory studiesindicate the mechanisms that explain modelinterpretations of pore-water H4SiO4 concen-trations are surface chemical changes and authi-genic aluminosilicate formation. Precipitation ofauthigenic aluminosilicate minerals must be one
of the most widespread diagenesis reactionsoccurring in marine sediments.
While these reactions presently imply only thesubstitution of aluminum for silicon, this mech-anism, and field observations of the geochemistryof aluminum in tropical near-shore sediments(e.g., Mackin and Aller, 1984), bring us back toauthigenic process suggested by Mackenzie andGarrels (1966) to close the marine geochemicalimbalance for Mg2þ, Kþ, and HCO3
2 createdduring weathering on land. The generalizedscheme for the proposed “reverse weathering”reaction was
H4SiO4 þ degraded clay from land þ HCO23
þ Mg2þ; Kþ ! ion-rich authigenic clay
þ CO2 þ H2O
The popularity of this proposal waned owing tolack of strong evidence to prove that it occurred,and fluxes suggested in the early studies ofhydrothermal processes (Edmond et al., 1979)obviated the need for low-temperature reactions tobalance the river inflow of Mg2þ and HCO3
2. Thishas changed since we now know that the flow ofwater through high-temperature zones of hydro-thermal areas is less than previously suggested,and the importance of low-temperature reactionsand flows are uncertain.
The quantitative importance of “reverse weath-ering” reactions were demonstrated by the rapidformation of authigenic aluminosilicates in thesediments of the Amazon delta (Michalopoulosand Aller, 1995). These authors placed seedmaterials (glass beads, quartz grains, and quartzgrains coated with iron oxide) into anoxicAmazon delta sediments. After 12–36 monthsthey observed the formation of K–Fe–Mg-richclay minerals on the seed materials and suggestthat formation of these materials in Amazonsediments alone could account for removal of10% of the global riverine input of Kþ. Sinceenvironments like the Amazon delta account for,60% of the flux of detrital material to the oceans,the impact of these reactions globally might bemuch greater than in this delta alone.
Both the tropical “reverse weathering” studiesand the recent discovery of the process controllingopal diagenesis in surface sediments demonstratethe importance of rapid authigenic aluminosilicateformation in marine sediments. The focus is nowback on determining the importance of thesereactions in marine geochemical mass balances.The role of detrital material in the preservation ofopal complicates the utility of SiO2 as apaleoceanographic tracer. This role will dependon understanding whether there is a proportion-ality between opal flux to sediments and thepreservation rate.
Figure 17 The relationship between the asymptoticH4SiO4 concentration in pore waters and the relativedetrital and opal content of the sediments (VanCappellen, personal communication). (Data from (†)Rickert (2000); ( ) King et al. (2000); (B) Koning et al.
(1997); (i) Van Cappellen and Qiu (1997a)).
Sediment Diagenesis and Benthic Flux314
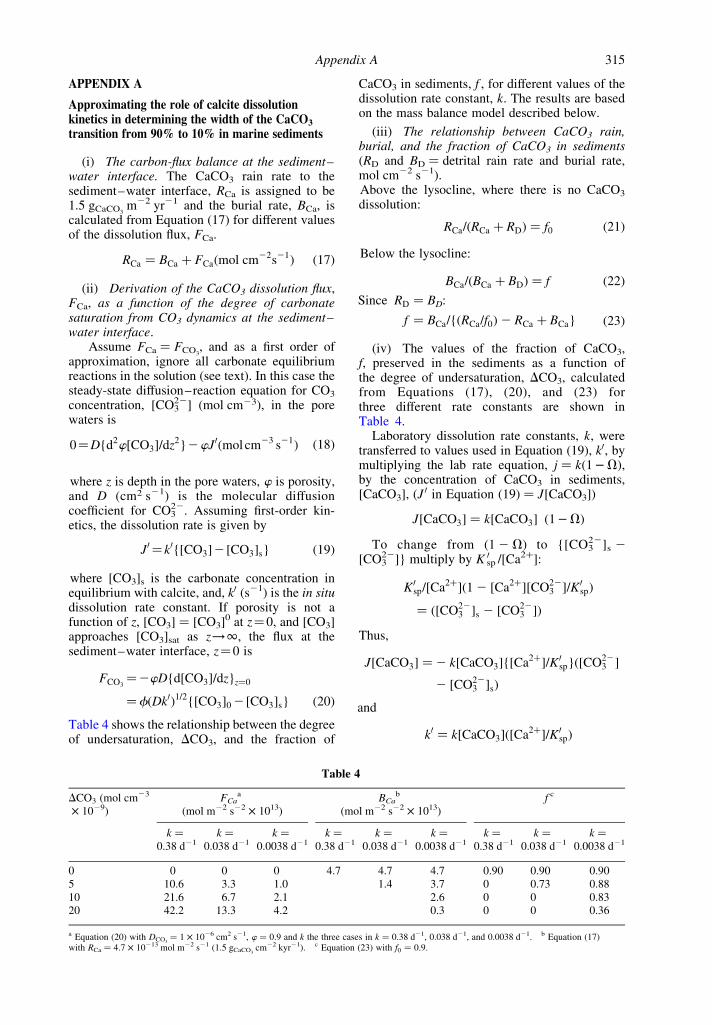
APPENDIX A
Approximating the role of calcite dissolutionkinetics in determining the width of the CaCO3
transition from 90% to 10% in marine sediments
(i) The carbon-flux balance at the sediment–water interface. The CaCO3 rain rate to thesediment–water interface, RCa is assigned to be1.5 gCaCO3
m22 yr21 and the burial rate, BCa, iscalculated from Equation (17) for different valuesof the dissolution flux, FCa.
RCa ¼ BCa þ FCaðmol cm22s21Þ ð17Þ
(ii) Derivation of the CaCO3 dissolution flux,FCa, as a function of the degree of carbonatesaturation from CO3 dynamics at the sediment–water interface.
Assume FCa ¼ FCO3, and as a first order of
approximation, ignore all carbonate equilibriumreactions in the solution (see text). In this case thesteady-state diffusion–reaction equation for CO3
concentration, [CO322] (mol cm23), in the pore
waters is
0¼D{d2w½CO3�=dz2}2wJ 0ðmol cm23 s21Þ ð18Þ
where z is depth in the pore waters, w is porosity,and D (cm2 s21) is the molecular diffusioncoefficient for CO3
22. Assuming first-order kin-etics, the dissolution rate is given by
J 0 ¼ k0{½CO3�2 ½CO3�s} ð19Þ
where [CO3]s is the carbonate concentration inequilibrium with calcite, and, k0 (s21) is the in situdissolution rate constant. If porosity is not afunction of z, [CO3] ¼ [CO3]0 at z¼0; and [CO3]approaches [CO3]sat as z!1; the flux at thesediment–water interface, z¼0 is
FCO3¼2wD{d½CO3�=dz}z¼0
¼fðDk0Þ1=2{½CO3�02 ½CO3�s} ð20Þ
Table 4 shows the relationship between the degreeof undersaturation, DCO3, and the fraction of
CaCO3 in sediments, f , for different values of thedissolution rate constant, k. The results are basedon the mass balance model described below.
(iii) The relationship between CaCO3 rain,burial, and the fraction of CaCO3 in sediments(RD and BD ¼ detrital rain rate and burial rate,mol cm22 s21).Above the lysocline, where there is no CaCO3
dissolution:
RCa=ðRCa þ RDÞ ¼ f0 ð21Þ
Below the lysocline:
BCa=ðBCa þ BDÞ ¼ f ð22Þ
Since RD ¼ BD:
f ¼ BCa={ðRCa=f0Þ2 RCa þ BCa} ð23Þ
(iv) The values of the fraction of CaCO3,f, preserved in the sediments as a function ofthe degree of undersaturation, DCO3, calculatedfrom Equations (17), (20), and (23) forthree different rate constants are shown inTable 4.
Laboratory dissolution rate constants, k, weretransferred to values used in Equation (19), k0, bymultiplying the lab rate equation, j ¼ kð1 VÞ,by the concentration of CaCO3 in sediments,[CaCO3], (J 0 in Equation (19) ¼ J[CaCO3])
J½CaCO3� ¼ k½CaCO3� ð1 VÞ
To change from ð1 2VÞ to {[CO322]s 2
[CO322]} multiply by K 0
sp /[Ca2þ]:
K 0sp=½Ca2þ�ð1 2 ½Ca2þ�½CO22
3 �=K 0spÞ
¼ ð½CO223 �s 2 ½CO22
3 �Þ
Thus,
J½CaCO3� ¼2 k½CaCO3�{½Ca2þ�=K 0sp}ð½CO22
3 �
2 ½CO223 �sÞ
and
k0 ¼ k½CaCO3�ð½Ca2þ�=K 0spÞ
Table 4
DCO3 (mol cm23
£ 1029)FCa
a
(mol m22 s22 £ 1013)BCa
b
(mol m22 s22 £ 1013)f c
k ¼
0.38 d21k ¼
0.038 d21k ¼
0.0038 d21k ¼
0.38 d21k ¼
0.038 d21k ¼
0.0038 d21k ¼
0.38 d21k ¼
0.038 d21k ¼
0.0038 d21
0 0 0 0 4.7 4.7 4.7 0.90 0.90 0.905 10.6 3.3 1.0 1.4 3.7 0 0.73 0.8810 21.6 6.7 2.1 2.6 0 0 0.8320 42.2 13.3 4.2 0.3 0 0 0.36
a Equation (20) with DCO3¼ 1 £ 1026 cm2 s21, w ¼ 0:9 and k the three cases in k ¼ 0:38 d21, 0.038 d21, and 0.0038 d21. b Equation (17)
with RCa ¼ 4.7 £ 10213 mol m22 s21 (1.5 gCaCO3cm22 kyr21). c Equation (23) with f0 ¼ 0:9:
Appendix A 315
Evaluating [CaCO3] and [Ca2þ]/K0sp
½CaCO3� ¼ f ð1 2 wÞr=M ¼ 0:5ð0:1Þ2:5=100
¼ 1:25 £ 1023 molCaCO3cm21
bulk
½Ca2þ�=K 0sp ¼ 0:01 mol cm23
=10212 mol2 cm26
ðat 4 kmÞ
¼ 107ðmol21 cm3Þ
APPENDIX B
Importance of bioturbation to the asymptoticconcentration of H4SiO4 in marine sediment porewaters
We consider the simple balance presentedin Equation (16):
DH4SiO4 ¼ {2ð1 2 wÞf ½SiO2�=hðkSDÞ0:5}Db
where:
. f ¼ 0:5 is the fraction of opal in the sediments;
. ð1 2 wÞ ¼ 0:3 (cms3 cmb
23), porosity, w ¼ 0.7;. [SiO2] ¼ r/M ¼ 2.0 g cms
23/65 gSiO2mol21 ¼
0.031 mol cms23;
. h ¼ 5 cm, the 1/e depth of the pore-waterprofiles (Figure 16);
. kS ¼ 1 £ 1027 s21 (2 8C) from pore-watermodels (Broecker and Peng, 1982; Hurd,1973; Vanderborght et al., 1977); DH4SiO4
(2 8C) ¼ 2 £ 1026.
Values of DB in the equatorial Pacific Ocean are(7 2 40) £ 1029 cm2 s21 from 210Pb and 234Thprofiles, respectively (McManus et al., 1995):
Db
(cm2 s21)[H4SiO4]asy 2 [H4SiO4]BW
(mmol L21)
1029 41028 421027 416
REFERENCES
Acker J. G., Byre R. H., Ben-Yaakov S., Feely R. A., andBetzer P. R. (1987) The effect of pressure on aragonitedissolution rates in seawater. Geochim. Cosmochim. Acta 51,2171–2175.
Aller R. C. (1982) The effects of macrobenthos on chemicalproperties of marine sediment and overlying water. InAnimal-sediment Relations (eds. D. L. McCall and M. J. S.Tevesz). Plenum, New York, pp. 53–102.
Aller R. C. (1984) The importance of relict burrow structuresand burrow irrigation in controlling sedimentarysolute distributions. Geochim. Cosmochim. Acta 48,1929–1934.
Aller R. C. (1990) Bioturbation and manganese cycling inhemipelagic sediments. Phil. Trans. Roy. Soc. London A331, 51–68.
Aller R. C., Mackin J. E., and Cox R. T. (1986) Diagenesisof Fe and S in Amazon inner shelf muds:apparent dominance of Fe reduction and implications forthe genesis of ironstones. Continent. Shelf Res. 6,263–389.
Archer D. (1996) An atlas of the distribution of calciumcarbonate in sediments of the deep sea. Global Biogeochem.Cycles 10, 159–174.
Archer D. and Devol A. (1992) Benthic oxygen fluxes on theWashington shelf and slope: a comparison of in situmicroelectrode and chamber flux measurements. Limnol.Oceanogr. 37, 614–629.
Archer D., Emerson S. R., and Reimers C. E. (1989)Dissolution of calcite in deep-sea sediments: pH and O2
microelectrode results. Geochim. Cosmochim. Acta 53,2831–2845.
Archer D. E., Morford J. L., and Emerson S. (2002) A model ofsuboxic sedimentary diagenesis suitable for automatictuning and gridded global domains. Global Biogeochem.Cycles 16 (1), doi 10.1029/2000G001288.
Atlas R. M., Boehm P. D., and Calder J. A. (1981) Chemicaland biological weathering of oil from the Amoco Cadizspillage within the littoral zone. Estuar. Coast. Shelf Sci. 12,589–608.
Bender M. L. (1990) The d18O of dissolved O2 in seawater: aunique tracer of circulation and respiration in the deep sea.J. Geophys. Res. 95, 22243–22252.
Bender M. L., Fanning K., Froelich P. N., Heath G. R., andMaynard V. (1977) Interstitial nitrate profiles and oxidationof sedimentary organic matter in the eastern equatorialAtlantic. Science 198, 605–609.
Benner R., Maccubbin A. E., and Hodson R. E. (1984)Anaerobic biodegradation of the lignin and polysaccharidecomponents of lignocellulose and synthetic lignin bysediment microflora. Appl. Environ. Microbiol. 47,998–1004.
Berelson W. M., Hammond D., and Cutter G. A. (1990) In situmeasurements of calcium carbonate dissolution rates indeep-sea sediments. Geochim. Cosmochim. Acta 54,3013–3020.
Bergamaschi B. A., Tsamakis E., Keil R. G., Eglinton T. I.,Montlucon D. B., and Hedges J. I. (1997) The effect of grainsize and surface area on organic matter, lignin andcarbohydrate concentration, and molecular compositions inPeru margin sediments. Geochim. Cosmochim. Acta 61,1247–1260.
Berner R. A. (1974) Kinetic models for the early diagenesis ofnitrogen, sulfur, phosphorus, and silicon in anoxic marinesediments. In The Sea (ed. E. D. Goldberg). Wiley,New York, vol. 5, pp. 427–450.
Berner R. A. (1980) Early Diagenesis: A TheoreticalApproach. Princeton University Press, Princeton, NJ.
Berner R. A. (1989) Biogeochemical cycles of carbon andsulfur and their effect on atmospheric oxygen overphanerozoic time. Palaeogeogr. Palaeoclimatol. Palaeoe-col. 73, 97–122.
Boudreau B. P. (1984) On the equivalence of non-local andradial diffusion models for pore water irrigation. J. Mar. Res.42, 731–735.
Boudreau B. P. (1997) Diagenetic Models and their Impli-cation: Modeling Transport and Reactions in AquaticSediments. Springer, Berlin.
Boudreau B. P. and Ruddick B. R. (1991) On a reactivecontinuum representation of organic matter diagenesis. Am.J. Sci. 291, 507–538.
Brandes J. A. and Devol A. H. (1997) Isotopic fractionation ofoxygen and nitrogen in coastal marine sediments. Geochim.Cosmochim. Acta 61, 1793–1801.
Broecker W. S. and Peng T.-H. (1982) Tracers in the Sea.Lamont-Doherty Geological Observatory, Palisades, NY.
Sediment Diagenesis and Benthic Flux316
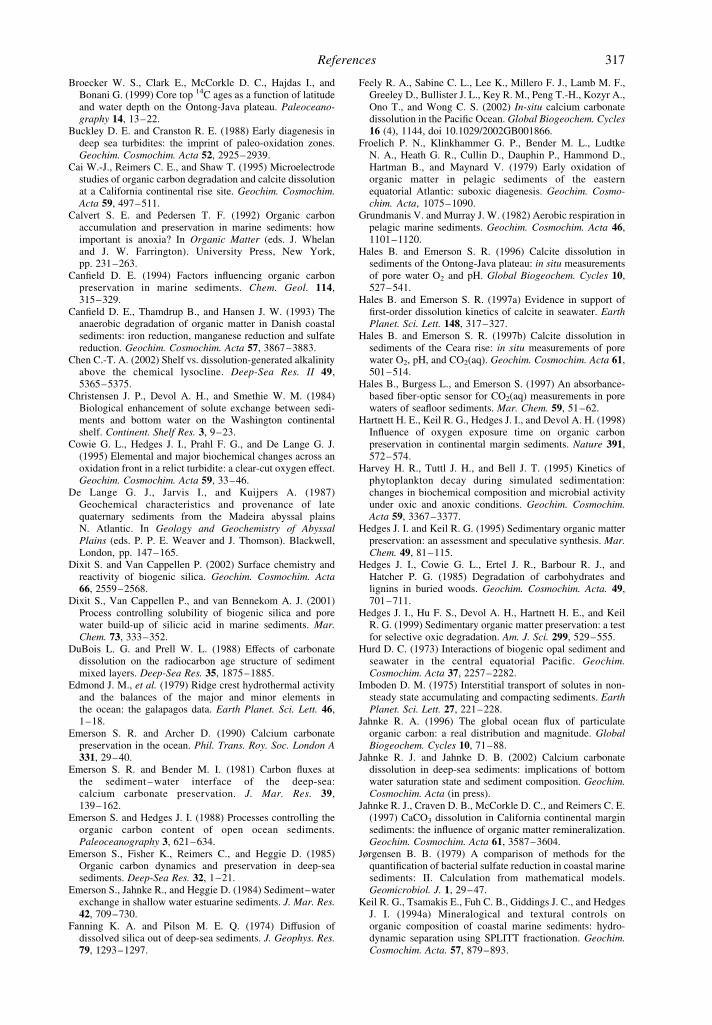
Broecker W. S., Clark E., McCorkle D. C., Hajdas I., andBonani G. (1999) Core top 14C ages as a function of latitudeand water depth on the Ontong-Java plateau. Paleoceano-graphy 14, 13–22.
Buckley D. E. and Cranston R. E. (1988) Early diagenesis indeep sea turbidites: the imprint of paleo-oxidation zones.Geochim. Cosmochim. Acta 52, 2925–2939.
Cai W.-J., Reimers C. E., and Shaw T. (1995) Microelectrodestudies of organic carbon degradation and calcite dissolutionat a California continental rise site. Geochim. Cosmochim.Acta 59, 497–511.
Calvert S. E. and Pedersen T. F. (1992) Organic carbonaccumulation and preservation in marine sediments: howimportant is anoxia? In Organic Matter (eds. J. Whelanand J. W. Farrington). University Press, New York,pp. 231–263.
Canfield D. E. (1994) Factors influencing organic carbonpreservation in marine sediments. Chem. Geol. 114,315–329.
Canfield D. E., Thamdrup B., and Hansen J. W. (1993) Theanaerobic degradation of organic matter in Danish coastalsediments: iron reduction, manganese reduction and sulfatereduction. Geochim. Cosmochim. Acta 57, 3867–3883.
Chen C.-T. A. (2002) Shelf vs. dissolution-generated alkalinityabove the chemical lysocline. Deep-Sea Res. II 49,5365–5375.
Christensen J. P., Devol A. H., and Smethie W. M. (1984)Biological enhancement of solute exchange between sedi-ments and bottom water on the Washington continentalshelf. Continent. Shelf Res. 3, 9–23.
Cowie G. L., Hedges J. I., Prahl F. G., and De Lange G. J.(1995) Elemental and major biochemical changes across anoxidation front in a relict turbidite: a clear-cut oxygen effect.Geochim. Cosmochim. Acta 59, 33–46.
De Lange G. J., Jarvis I., and Kuijpers A. (1987)Geochemical characteristics and provenance of latequaternary sediments from the Madeira abyssal plainsN. Atlantic. In Geology and Geochemistry of AbyssalPlains (eds. P. P. E. Weaver and J. Thomson). Blackwell,London, pp. 147–165.
Dixit S. and Van Cappellen P. (2002) Surface chemistry andreactivity of biogenic silica. Geochim. Cosmochim. Acta66, 2559–2568.
Dixit S., Van Cappellen P., and van Bennekom A. J. (2001)Process controlling solubility of biogenic silica and porewater build-up of silicic acid in marine sediments. Mar.Chem. 73, 333–352.
DuBois L. G. and Prell W. L. (1988) Effects of carbonatedissolution on the radiocarbon age structure of sedimentmixed layers. Deep-Sea Res. 35, 1875–1885.
Edmond J. M., et al. (1979) Ridge crest hydrothermal activityand the balances of the major and minor elements inthe ocean: the galapagos data. Earth Planet. Sci. Lett. 46,1–18.
Emerson S. R. and Archer D. (1990) Calcium carbonatepreservation in the ocean. Phil. Trans. Roy. Soc. London A331, 29–40.
Emerson S. R. and Bender M. I. (1981) Carbon fluxes atthe sediment– water interface of the deep-sea:calcium carbonate preservation. J. Mar. Res. 39,139–162.
Emerson S. and Hedges J. I. (1988) Processes controlling theorganic carbon content of open ocean sediments.Paleoceanography 3, 621–634.
Emerson S., Fisher K., Reimers C., and Heggie D. (1985)Organic carbon dynamics and preservation in deep-seasediments. Deep-Sea Res. 32, 1–21.
Emerson S., Jahnke R., and Heggie D. (1984) Sediment–waterexchange in shallow water estuarine sediments. J. Mar. Res.42, 709–730.
Fanning K. A. and Pilson M. E. Q. (1974) Diffusion ofdissolved silica out of deep-sea sediments. J. Geophys. Res.79, 1293–1297.
Feely R. A., Sabine C. L., Lee K., Millero F. J., Lamb M. F.,Greeley D., Bullister J. L., Key R. M., Peng T.-H., Kozyr A.,Ono T., and Wong C. S. (2002) In-situ calcium carbonatedissolution in the Pacific Ocean. Global Biogeochem. Cycles16 (4), 1144, doi 10.1029/2002GB001866.
Froelich P. N., Klinkhammer G. P., Bender M. L., LudtkeN. A., Heath G. R., Cullin D., Dauphin P., Hammond D.,Hartman B., and Maynard V. (1979) Early oxidation oforganic matter in pelagic sediments of the easternequatorial Atlantic: suboxic diagenesis. Geochim. Cosmo-chim. Acta, 1075–1090.
Grundmanis V. and Murray J. W. (1982) Aerobic respiration inpelagic marine sediments. Geochim. Cosmochim. Acta 46,1101–1120.
Hales B. and Emerson S. R. (1996) Calcite dissolution insediments of the Ontong-Java plateau: in situ measurementsof pore water O2 and pH. Global Biogeochem. Cycles 10,527–541.
Hales B. and Emerson S. R. (1997a) Evidence in support offirst-order dissolution kinetics of calcite in seawater. EarthPlanet. Sci. Lett. 148, 317–327.
Hales B. and Emerson S. R. (1997b) Calcite dissolution insediments of the Ceara rise: in situ measurements of porewater O2, pH, and CO2(aq). Geochim. Cosmochim. Acta 61,501–514.
Hales B., Burgess L., and Emerson S. (1997) An absorbance-based fiber-optic sensor for CO2(aq) measurements in porewaters of seafloor sediments. Mar. Chem. 59, 51–62.
Hartnett H. E., Keil R. G., Hedges J. I., and Devol A. H. (1998)Influence of oxygen exposure time on organic carbonpreservation in continental margin sediments. Nature 391,572–574.
Harvey H. R., Tuttl J. H., and Bell J. T. (1995) Kinetics ofphytoplankton decay during simulated sedimentation:changes in biochemical composition and microbial activityunder oxic and anoxic conditions. Geochim. Cosmochim.Acta 59, 3367–3377.
Hedges J. I. and Keil R. G. (1995) Sedimentary organic matterpreservation: an assessment and speculative synthesis. Mar.Chem. 49, 81–115.
Hedges J. I., Cowie G. L., Ertel J. R., Barbour R. J., andHatcher P. G. (1985) Degradation of carbohydrates andlignins in buried woods. Geochim. Cosmochim. Acta. 49,701–711.
Hedges J. I., Hu F. S., Devol A. H., Hartnett H. E., and KeilR. G. (1999) Sedimentary organic matter preservation: a testfor selective oxic degradation. Am. J. Sci. 299, 529–555.
Hurd D. C. (1973) Interactions of biogenic opal sediment andseawater in the central equatorial Pacific. Geochim.Cosmochim. Acta 37, 2257–2282.
Imboden D. M. (1975) Interstitial transport of solutes in non-steady state accumulating and compacting sediments. EarthPlanet. Sci. Lett. 27, 221–228.
Jahnke R. A. (1996) The global ocean flux of particulateorganic carbon: a real distribution and magnitude. GlobalBiogeochem. Cycles 10, 71–88.
Jahnke R. J. and Jahnke D. B. (2002) Calcium carbonatedissolution in deep-sea sediments: implications of bottomwater saturation state and sediment composition. Geochim.Cosmochim. Acta (in press).
Jahnke R. J., Craven D. B., McCorkle D. C., and Reimers C. E.(1997) CaCO3 dissolution in California continental marginsediments: the influence of organic matter remineralization.Geochim. Cosmochim. Acta 61, 3587–3604.
Jørgensen B. B. (1979) A comparison of methods for thequantification of bacterial sulfate reduction in coastal marinesediments: II. Calculation from mathematical models.Geomicrobiol. J. 1, 29–47.
Keil R. G., Tsamakis E., Fuh C. B., Giddings J. C., and HedgesJ. I. (1994a) Mineralogical and textural controls onorganic composition of coastal marine sediments: hydro-dynamic separation using SPLITT fractionation. Geochim.Cosmochim. Acta. 57, 879–893.
References 317
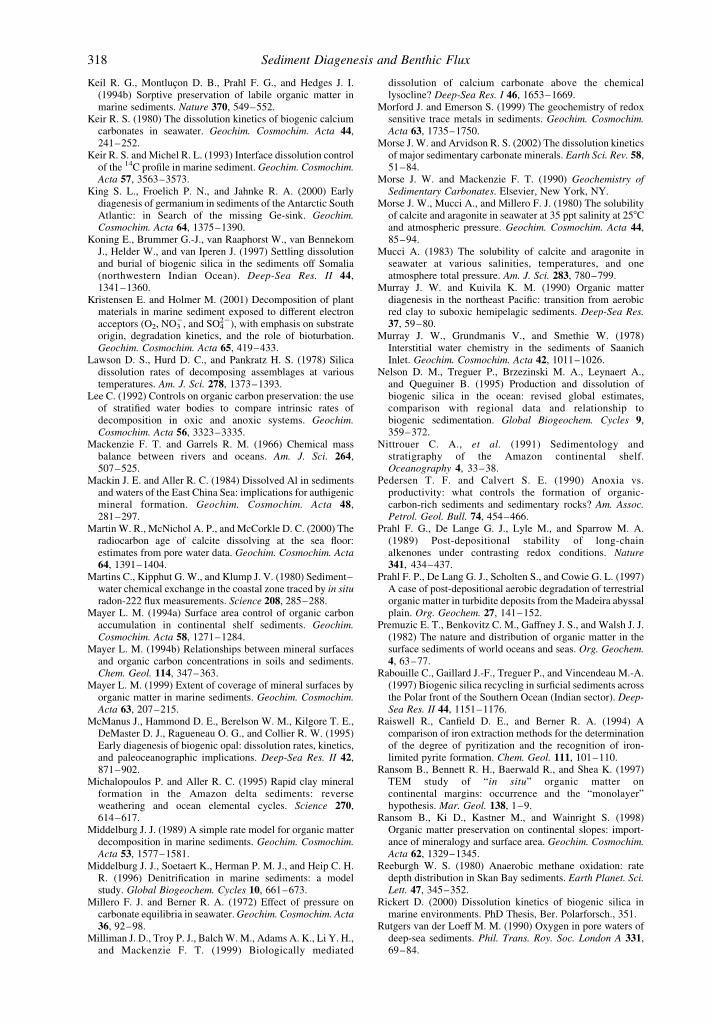
Keil R. G., Montlucon D. B., Prahl F. G., and Hedges J. I.(1994b) Sorptive preservation of labile organic matter inmarine sediments. Nature 370, 549–552.
Keir R. S. (1980) The dissolution kinetics of biogenic calciumcarbonates in seawater. Geochim. Cosmochim. Acta 44,241–252.
Keir R. S. and Michel R. L. (1993) Interface dissolution controlof the 14C profile in marine sediment. Geochim. Cosmochim.Acta 57, 3563–3573.
King S. L., Froelich P. N., and Jahnke R. A. (2000) Earlydiagenesis of germanium in sediments of the Antarctic SouthAtlantic: in Search of the missing Ge-sink. Geochim.Cosmochim. Acta 64, 1375–1390.
Koning E., Brummer G.-J., van Raaphorst W., van BennekomJ., Helder W., and van Iperen J. (1997) Settling dissolutionand burial of biogenic silica in the sediments off Somalia(northwestern Indian Ocean). Deep-Sea Res. II 44,1341–1360.
Kristensen E. and Holmer M. (2001) Decomposition of plantmaterials in marine sediment exposed to different electronacceptors (O2, NO3
2, and SO422), with emphasis on substrate
origin, degradation kinetics, and the role of bioturbation.Geochim. Cosmochim. Acta 65, 419–433.
Lawson D. S., Hurd D. C., and Pankratz H. S. (1978) Silicadissolution rates of decomposing assemblages at varioustemperatures. Am. J. Sci. 278, 1373–1393.
Lee C. (1992) Controls on organic carbon preservation: the useof stratified water bodies to compare intrinsic rates ofdecomposition in oxic and anoxic systems. Geochim.Cosmochim. Acta 56, 3323–3335.
Mackenzie F. T. and Garrels R. M. (1966) Chemical massbalance between rivers and oceans. Am. J. Sci. 264,507–525.
Mackin J. E. and Aller R. C. (1984) Dissolved Al in sedimentsand waters of the East China Sea: implications for authigenicmineral formation. Geochim. Cosmochim. Acta 48,281–297.
Martin W. R., McNichol A. P., and McCorkle D. C. (2000) Theradiocarbon age of calcite dissolving at the sea floor:estimates from pore water data. Geochim. Cosmochim. Acta64, 1391–1404.
Martins C., Kipphut G. W., and Klump J. V. (1980) Sediment–water chemical exchange in the coastal zone traced by in situradon-222 flux measurements. Science 208, 285–288.
Mayer L. M. (1994a) Surface area control of organic carbonaccumulation in continental shelf sediments. Geochim.Cosmochim. Acta 58, 1271–1284.
Mayer L. M. (1994b) Relationships between mineral surfacesand organic carbon concentrations in soils and sediments.Chem. Geol. 114, 347–363.
Mayer L. M. (1999) Extent of coverage of mineral surfaces byorganic matter in marine sediments. Geochim. Cosmochim.Acta 63, 207–215.
McManus J., Hammond D. E., Berelson W. M., Kilgore T. E.,DeMaster D. J., Ragueneau O. G., and Collier R. W. (1995)Early diagenesis of biogenic opal: dissolution rates, kinetics,and paleoceanographic implications. Deep-Sea Res. II 42,871–902.
Michalopoulos P. and Aller R. C. (1995) Rapid clay mineralformation in the Amazon delta sediments: reverseweathering and ocean elemental cycles. Science 270,614–617.
Middelburg J. J. (1989) A simple rate model for organic matterdecomposition in marine sediments. Geochim. Cosmochim.Acta 53, 1577–1581.
Middelburg J. J., Soetaert K., Herman P. M. J., and Heip C. H.R. (1996) Denitrification in marine sediments: a modelstudy. Global Biogeochem. Cycles 10, 661–673.
Millero F. J. and Berner R. A. (1972) Effect of pressure oncarbonate equilibria in seawater. Geochim. Cosmochim. Acta36, 92–98.
Milliman J. D., Troy P. J., Balch W. M., Adams A. K., Li Y. H.,and Mackenzie F. T. (1999) Biologically mediated
dissolution of calcium carbonate above the chemicallysocline? Deep-Sea Res. I 46, 1653–1669.
Morford J. and Emerson S. (1999) The geochemistry of redoxsensitive trace metals in sediments. Geochim. Cosmochim.Acta 63, 1735–1750.
Morse J. W. and Arvidson R. S. (2002) The dissolution kineticsof major sedimentary carbonate minerals. Earth Sci. Rev. 58,51–84.
Morse J. W. and Mackenzie F. T. (1990) Geochemistry ofSedimentary Carbonates. Elsevier, New York, NY.
Morse J. W., Mucci A., and Millero F. J. (1980) The solubilityof calcite and aragonite in seawater at 35 ppt salinity at 258Cand atmospheric pressure. Geochim. Cosmochim. Acta 44,85–94.
Mucci A. (1983) The solubility of calcite and aragonite inseawater at various salinities, temperatures, and oneatmosphere total pressure. Am. J. Sci. 283, 780–799.
Murray J. W. and Kuivila K. M. (1990) Organic matterdiagenesis in the northeast Pacific: transition from aerobicred clay to suboxic hemipelagic sediments. Deep-Sea Res.37, 59–80.
Murray J. W., Grundmanis V., and Smethie W. (1978)Interstitial water chemistry in the sediments of SaanichInlet. Geochim. Cosmochim. Acta 42, 1011–1026.
Nelson D. M., Treguer P., Brzezinski M. A., Leynaert A.,and Queguiner B. (1995) Production and dissolution ofbiogenic silica in the ocean: revised global estimates,comparison with regional data and relationship tobiogenic sedimentation. Global Biogeochem. Cycles 9,359–372.
Nittrouer C. A., et al. (1991) Sedimentology andstratigraphy of the Amazon continental shelf.Oceanography 4, 33–38.
Pedersen T. F. and Calvert S. E. (1990) Anoxia vs.productivity: what controls the formation of organic-carbon-rich sediments and sedimentary rocks? Am. Assoc.Petrol. Geol. Bull. 74, 454–466.
Prahl F. G., De Lange G. J., Lyle M., and Sparrow M. A.(1989) Post-depositional stability of long-chainalkenones under contrasting redox conditions. Nature341, 434–437.
Prahl F. P., De Lang G. J., Scholten S., and Cowie G. L. (1997)A case of post-depositional aerobic degradation of terrestrialorganic matter in turbidite deposits from the Madeira abyssalplain. Org. Geochem. 27, 141–152.
Premuzic E. T., Benkovitz C. M., Gaffney J. S., and Walsh J. J.(1982) The nature and distribution of organic matter in thesurface sediments of world oceans and seas. Org. Geochem.4, 63–77.
Rabouille C., Gaillard J.-F., Treguer P., and Vincendeau M.-A.(1997) Biogenic silica recycling in surficial sediments acrossthe Polar front of the Southern Ocean (Indian sector). Deep-Sea Res. II 44, 1151–1176.
Raiswell R., Canfield D. E., and Berner R. A. (1994) Acomparison of iron extraction methods for the determinationof the degree of pyritization and the recognition of iron-limited pyrite formation. Chem. Geol. 111, 101–110.
Ransom B., Bennett R. H., Baerwald R., and Shea K. (1997)TEM study of “in situ” organic matter oncontinental margins: occurrence and the “monolayer”hypothesis. Mar. Geol. 138, 1–9.
Ransom B., Ki D., Kastner M., and Wainright S. (1998)Organic matter preservation on continental slopes: import-ance of mineralogy and surface area. Geochim. Cosmochim.Acta 62, 1329–1345.
Reeburgh W. S. (1980) Anaerobic methane oxidation: ratedepth distribution in Skan Bay sediments. Earth Planet. Sci.Lett. 47, 345–352.
Rickert D. (2000) Dissolution kinetics of biogenic silica inmarine environments. PhD Thesis, Ber. Polarforsch., 351.
Rutgers van der Loeff M. M. (1990) Oxygen in pore waters ofdeep-sea sediments. Phil. Trans. Roy. Soc. London A 331,69–84.
Sediment Diagenesis and Benthic Flux318
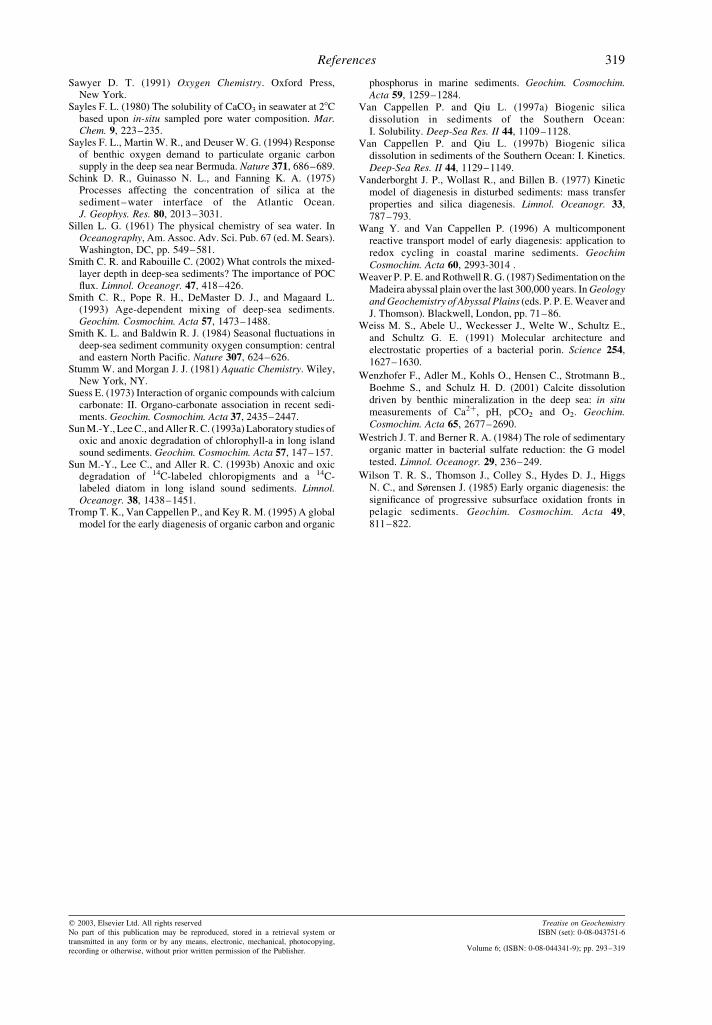
Sawyer D. T. (1991) Oxygen Chemistry. Oxford Press,New York.
Sayles F. L. (1980) The solubility of CaCO3 in seawater at 28Cbased upon in-situ sampled pore water composition. Mar.Chem. 9, 223–235.
Sayles F. L., Martin W. R., and Deuser W. G. (1994) Responseof benthic oxygen demand to particulate organic carbonsupply in the deep sea near Bermuda. Nature 371, 686–689.
Schink D. R., Guinasso N. L., and Fanning K. A. (1975)Processes affecting the concentration of silica at thesediment – water interface of the Atlantic Ocean.J. Geophys. Res. 80, 2013–3031.
Sillen L. G. (1961) The physical chemistry of sea water. InOceanography, Am. Assoc. Adv. Sci. Pub. 67 (ed. M. Sears).Washington, DC, pp. 549–581.
Smith C. R. and Rabouille C. (2002) What controls the mixed-layer depth in deep-sea sediments? The importance of POCflux. Limnol. Oceanogr. 47, 418–426.
Smith C. R., Pope R. H., DeMaster D. J., and Magaard L.(1993) Age-dependent mixing of deep-sea sediments.Geochim. Cosmochim. Acta 57, 1473–1488.
Smith K. L. and Baldwin R. J. (1984) Seasonal fluctuations indeep-sea sediment community oxygen consumption: centraland eastern North Pacific. Nature 307, 624–626.
Stumm W. and Morgan J. J. (1981) Aquatic Chemistry. Wiley,New York, NY.
Suess E. (1973) Interaction of organic compounds with calciumcarbonate: II. Organo-carbonate association in recent sedi-ments. Geochim. Cosmochim. Acta 37, 2435–2447.
Sun M.-Y., Lee C., and Aller R. C. (1993a) Laboratory studies ofoxic and anoxic degradation of chlorophyll-a in long islandsound sediments. Geochim. Cosmochim. Acta 57, 147–157.
Sun M.-Y., Lee C., and Aller R. C. (1993b) Anoxic and oxicdegradation of 14C-labeled chloropigments and a 14C-labeled diatom in long island sound sediments. Limnol.Oceanogr. 38, 1438–1451.
Tromp T. K., Van Cappellen P., and Key R. M. (1995) A globalmodel for the early diagenesis of organic carbon and organic
phosphorus in marine sediments. Geochim. Cosmochim.Acta 59, 1259–1284.
Van Cappellen P. and Qiu L. (1997a) Biogenic silicadissolution in sediments of the Southern Ocean:I. Solubility. Deep-Sea Res. II 44, 1109–1128.
Van Cappellen P. and Qiu L. (1997b) Biogenic silicadissolution in sediments of the Southern Ocean: I. Kinetics.Deep-Sea Res. II 44, 1129–1149.
Vanderborght J. P., Wollast R., and Billen B. (1977) Kineticmodel of diagenesis in disturbed sediments: mass transferproperties and silica diagenesis. Limnol. Oceanogr. 33,787–793.
Wang Y. and Van Cappellen P. (1996) A multicomponentreactive transport model of early diagenesis: application toredox cycling in coastal marine sediments. GeochimCosmochim. Acta 60, 2993-3014 .
Weaver P. P. E. and Rothwell R. G. (1987) Sedimentation on theMadeira abyssal plain over the last 300,000 years. In Geologyand Geochemistry of Abyssal Plains (eds. P. P. E. Weaver andJ. Thomson). Blackwell, London, pp. 71–86.
Weiss M. S., Abele U., Weckesser J., Welte W., Schultz E.,and Schultz G. E. (1991) Molecular architecture andelectrostatic properties of a bacterial porin. Science 254,1627–1630.
Wenzhofer F., Adler M., Kohls O., Hensen C., Strotmann B.,Boehme S., and Schulz H. D. (2001) Calcite dissolutiondriven by benthic mineralization in the deep sea: in situmeasurements of Ca2þ, pH, pCO2 and O2. Geochim.Cosmochim. Acta 65, 2677–2690.
Westrich J. T. and Berner R. A. (1984) The role of sedimentaryorganic matter in bacterial sulfate reduction: the G modeltested. Limnol. Oceanogr. 29, 236–249.
Wilson T. R. S., Thomson J., Colley S., Hydes D. J., HiggsN. C., and Sørensen J. (1985) Early organic diagenesis: thesignificance of progressive subsurface oxidation fronts inpelagic sediments. Geochim. Cosmochim. Acta 49,811–822.
q 2003, Elsevier Ltd. All rights reservedNo part of this publication may be reproduced, stored in a retrieval system ortransmitted in any form or by any means, electronic, mechanical, photocopying,recording or otherwise, without prior written permission of the Publisher.
Treatise on GeochemistryISBN (set): 0-08-043751-6
Volume 6; (ISBN: 0-08-044341-9); pp. 293–319
References 319