3 microemulsions
TRANSCRIPT

3. Microemulsions
This chapter is devoted to another important property of surfactants,
that of stabilization of water-oil films and formation of microemulsions. These
are a special kind of colloidal dispersion that have attracted a great deal of
attention because of their ability to solubilise otherwise insoluble materials.
Industrial applications of microemulsions have escalated in the last 40 years
following an increased understanding of formation, stability and the role of
surfactant molecular architecture. This chapter reviews main theoretical
features relevant to the present work and some common techniques used to
characterize microemulsion phases.
3.1 MICROEMULSIONS: DEFINITION AND HISTORY
One of the best definitions of microemulsions is from Danielsson and
Lindman [1] “a microemulsion is a system of water, oil and an amphiphile
which is a single optically isotropic and thermodynamically stable liquid
solution”. In some respects, microemulsions can be considered as small-scale
versions of emulsions, i.e., droplet type dispersions either of oil-in-water (o/w)
or of water-in-oil (w/o), with a size range in the order of 5−50 nm in drop
radius. Such a description, however, lacks precision since there are significant
differences between microemulsions and ordinary emulsions (or
macroemulsions). In particular, in emulsions the average drop size grows
continuously with time so that phase separation ultimately occurs under
gravitational force, i.e., they are thermodynamically unstable and their
formation requires input of work. The drops of the dispersed phase are
59

generally large (> 0.1 µm) so that they often take on a milky, rather than a
translucent appearance. For microemulsions, once the conditions are right,
spontaneous formation occurs. As for simple aqueous systems, microemulsion
formation is dependent on surfactant type and structure. If the surfactant is
ionic and contains a single hydrocarbon chain (e.g., sodium dodecylsulphate,
SDS) microemulsions are only formed if a co-surfactant (e.g., a medium size
aliphatic alcohol) and/or electrolyte (e.g., 0.2 M NaCl) are also present. With
double chain ionics (e.g., Aerosol-OT) and some non-ionic surfactants a co-
surfactant is not necessary. This results from one of the most fundamental
properties of microemulsions, that is, an ultra-low interfacial tension between
the oil and water phases, γo/w. The main role of the surfactant is to reduce γo/w
sufficiently − i.e., lowering the energy required to increase the surface area −
so that spontaneous dispersion of water or oil droplets occurs and the system is
thermodynamically stable. As described in Section 3.2.1 ultra-low tensions are
crucial for the formation of microemulsions and depend on system composition.
Microemulsions were not really recognized until the work of Hoar and
Schulman in 1943, who reported a spontaneous emulsion of water and oil on
addition of a strong surface-active agent [2]. The term “microemulsion” was
first used even later by Schulman et al. [3] in 1959 to describe a multiphase
system consisting of water, oil, surfactant and alcohol, which forms a
transparent solution. There has been much debate about the word
“microemulsion” to describe such systems [4]. Although not systematically used
today, some prefer the names “micellar emulsion” [5] or “swollen micelles” [6].
Microemulsions were probably discovered well before the studies of Schulmann:
Australian housewives have used since the beginning of last century
water/eucalyptus oil/soap flake/white spirit mixtures to wash wool, and the first
commercial microemulsions were probably the liquid waxes discovered by
Rodawald in 1928. Interest in microemulsions really stepped up in the late
1970's and early 1980's when it was recognized that such systems could
improve oil recovery and when oil prices reached levels where tertiary recovery
methods became profit earning [7]. Nowadays this is no longer the case, but
60

other microemulsion applications were discovered, e.g., catalysis, preparation
of submicron particles, solar energy conversion, liquid−liquid extraction
(mineral, proteins, etc.). Together with classical applications in detergency and
lubrication, the field remains sufficiently important to continue to attract a
number of scientists. From the fundamental research point of view, a great deal
of progress has been made in the last 20 years in understanding microemulsion
properties. In particular, interfacial film stability and microemulsion structures
can now be characterized in detail owing to the development of new and
powerful techniques such as small-angle neutron scattering (SANS, as
described in Chapter 4). The following sections deal with fundamental
microemulsion properties, i.e., formation and stability, surfactant films,
classification and phase behaviour.
3.2 THEORY OF FORMATION AND STABILITY
3.2.1 Interfacial tension in microemulsions
A simple picture for describing microemulsion formation is to consider a
subdivision of the dispersed phase into very small droplets. Then the
configurational entropy change, ∆Sconf, can be approximately expressed as [8]:
( ){ } ( )[ ]φφφφ −−+−=∆ 1ln/1lnkS Bconf n (3.2.1)
where n is the number of droplets of dispersed phase, kB is the Boltzmann
constant and φ is the dispersed phase volume fraction. The associated free
energy change can be expressed as a sum of the free energy for creating new
area of interface, ∆Aγ12, and configurational entropy in the form [9]:
conf12form STAG ∆−γ∆=∆ (3.2.2)
61
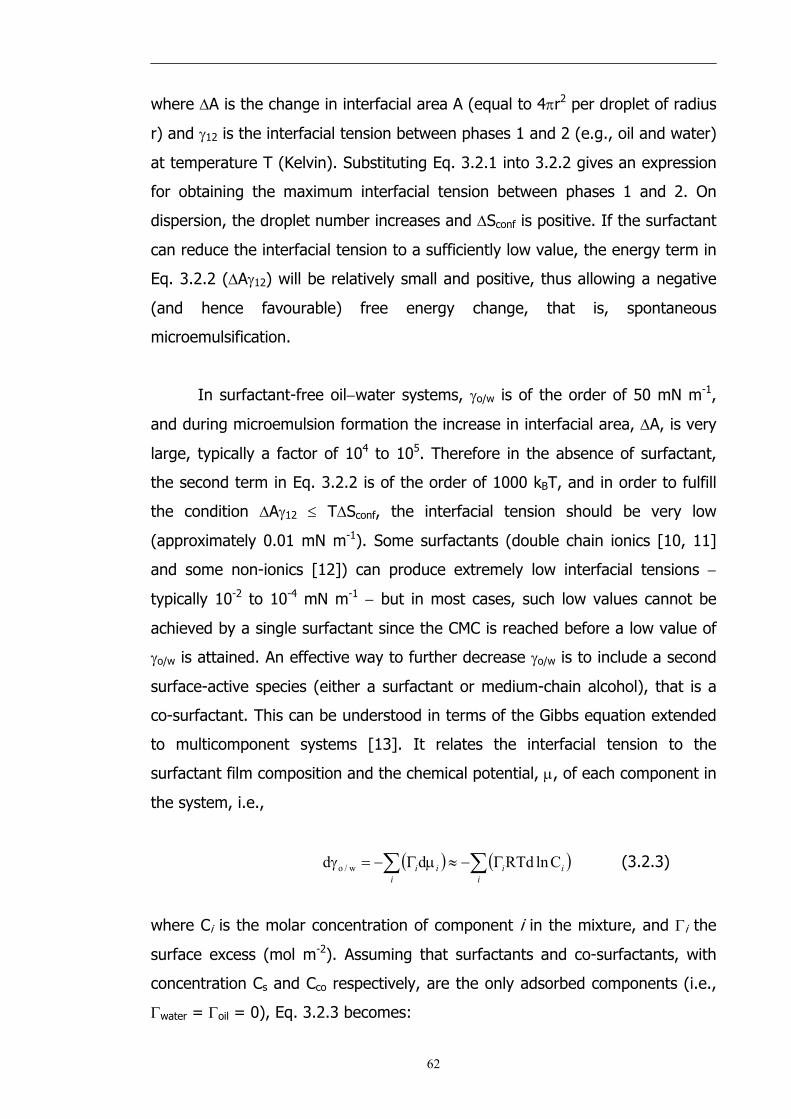
where ∆A is the change in interfacial area A (equal to 4πr2 per droplet of radius
r) and γ12 is the interfacial tension between phases 1 and 2 (e.g., oil and water)
at temperature T (Kelvin). Substituting Eq. 3.2.1 into 3.2.2 gives an expression
for obtaining the maximum interfacial tension between phases 1 and 2. On
dispersion, the droplet number increases and ∆Sconf is positive. If the surfactant
can reduce the interfacial tension to a sufficiently low value, the energy term in
Eq. 3.2.2 (∆Aγ12) will be relatively small and positive, thus allowing a negative
(and hence favourable) free energy change, that is, spontaneous
microemulsification.
In surfactant-free oil−water systems, γo/w is of the order of 50 mN m-1,
and during microemulsion formation the increase in interfacial area, ∆A, is very
large, typically a factor of 104 to 105. Therefore in the absence of surfactant,
the second term in Eq. 3.2.2 is of the order of 1000 kBT, and in order to fulfill
the condition ∆Aγ12 ≤ T∆Sconf, the interfacial tension should be very low
(approximately 0.01 mN m-1). Some surfactants (double chain ionics [10, 11]
and some non-ionics [12]) can produce extremely low interfacial tensions −
typically 10-2 to 10-4 mN m-1 − but in most cases, such low values cannot be
achieved by a single surfactant since the CMC is reached before a low value of
γo/w is attained. An effective way to further decrease γo/w is to include a second
surface-active species (either a surfactant or medium-chain alcohol), that is a
co-surfactant. This can be understood in terms of the Gibbs equation extended
to multicomponent systems [13]. It relates the interfacial tension to the
surfactant film composition and the chemical potential, µ, of each component in
the system, i.e.,
( ) ( )∑∑ Γ−≈µΓ−=γi
iii
ii ClnRTddd w/o (3.2.3)
where Ci is the molar concentration of component i in the mixture, and Γi the
surface excess (mol m-2). Assuming that surfactants and co-surfactants, with
concentration Cs and Cco respectively, are the only adsorbed components (i.e.,
Γwater = Γoil = 0), Eq. 3.2.3 becomes:
62

cocossw/o ClnRTdClnRTdd Γ−Γ−=γ (3.2.4)
Integration of Eq. 3.2.4 gives:
∫∫ Γ−Γ−γ=γ cos C
0 coco
C
0 ssw/ow/o ClnRTdClnRTdo (3.2.5)
Eq. 3.2.5 shows that is lowered by two terms, both from the surfactant
and co-surfactant (of surface excesses Γ
ow/oγ
s and Γco respectively) so their effects
are additive. It should be mentioned, however, that the two molecules should
be adsorbed simultaneously and should not interact with each other (otherwise
they lower their respective activities), i.e., are of completely different chemical
nature, so that mixed micellisation does not occur.
Figure 3.1 shows typical low interfacial tensions found in microemulsions,
in this case spanning ~ 1 to 10-3 mN m-1. The effect of salt concentration is
consistent with changes in the phase behaviour, which are discussed in more
detail in Section 3.3 and Figure 3.2 below.
3.2.2 Kinetic instability
Internal contents of the microemulsion droplets are known to exchange,
typically on the millisecond time scale [16, 17]. They diffuse and undergo
collisions. If collisions are sufficiently violent, then the surfactant film may
rupture thereby facilitating droplet exchange, that is the droplets are kinetically
unstable. However, if one disperses emulsions sufficiently small droplets (< 500
Å), the tendency to coalesce will be counteracted by an energy barrier. Then
the system will remain dispersed and transparent for a long period of time
(months) [18]. Such an emulsion is said to be kinetically stable [19]. The
mechanism of droplet coalescence has been reported for AOT w/o
microemulsions [16]; the droplet exchange process was characterized by a
second order rate constant kex, which is believed to be activation controlled
63

(hence the activation energy, Ea, barrier to fusion) and not purely diffusion
controlled. Other studies [20] have shown that the dynamic aspects of
microemulsions are affected by the flexibility of the interfacial film, that is film
rigidity (see Section 3.3.2), through a significant contribution to the energy
barrier. Under the same experimental conditions, different microemulsion
systems can have different kex values [16]: for AOT w/o system at room
temperature, kex is in the range 106−109 dm3 mol-1 s-1, and for non-ionics CiEj,
108−109 dm3 mol-1 s-1 [16, 17, 20]. In any case, an equilibrium droplet shape
and size is always maintained and this can be studied by different techniques
[20].
Figure 3.1 Oil-water interfacial tension between n-heptane and aqueous NaCl solutions as a function of salt concentration in the presence of AOT surfactant. The values were determined by spinning drop tensiometry. The AOT surfactant concentration is 0.050 mol dm-3, temperature 25°C.
-3
-2
-1
0
0.02 0.04 0.06 0.08 0.10
[NaCl] / (mol dm-3)[NaCl] / (mol dm-3)
log
[ γo/
w/ (
mN
m-1
)]lo
g [ γ
o/w
/ (m
Nm
-1)]
-3
-2
-1
0
0.02 0.04 0.06 0.08 0.10
[NaCl] / (mol dm-3)[NaCl] / (mol dm-3)[NaCl] / (mol dm-3)[NaCl] / (mol dm-3)
log
[ γo/
w/ (
mN
m-1
)]lo
g [ γ
o/w
/ (m
Nm
-1)]
log
[ γo/
w/ (
mN
m-1
)]lo
g [ γ
o/w
/ (m
Nm
-1)]
64

3.3 PHYSICOCHEMICAL PROPERTIES
This section gives an overview of the main parameters characterizing
microemulsions. References will be made to related behaviour for planar
interfaces presented in Chapter 2.
3.3.1 Predicting microemulsion type
A well-known classification of microemulsions is that of Winsor [21] who
identified four general types of phase equilibria:
• Type I: the surfactant is preferentially soluble in water and oil-in-water
(o/w) microemulsions form (Winsor I). The surfactant-rich water phase
coexists with the oil phase where surfactant is only present as
monomers at small concentration.
• Type II: the surfactant is mainly in the oil phase and water-in-oil (w/o)
microemulsions form. The surfactant-rich oil phase coexists with the
surfactant-poor aqueous phase (Winsor II).
• Type III: a three-phase system where a surfactant-rich middle-phase
coexists with both excess water and oil surfactant-poor phases (Winsor
III or middle-phase microemulsion).
• Type IV: a single-phase (isotropic) micellar solution, that forms upon
addition of a sufficient quantity of amphiphile (surfactant plus alcohol).
Depending on surfactant type and sample environment, types I, II, III or
IV form preferentially, the dominant type being related to the molecular
arrangement at the interface (see below). As illustrated in Figure 3.2, phase
transitions are brought about by increasing either electrolyte concentration (in
the case of ionic surfactants) or temperature (for non-ionics). Table 3.1
summarizes the qualitative changes in phase behaviour of anionic surfactants
when formulation variables are modified [22].
65

Various investigators have focused on interactions in an adsorbed
interfacial film to explain the direction and extent of interfacial curvature. The
first concept was that of Bancroft [23] and Clowes [24] who considered the
adsorbed film in emulsion systems to be duplex in nature, with an inner and an
outer interfacial tension acting independently [25]. The interface would then
curve such that the inner surface was one of higher tension. Bancroft’s rule was
stated as “that phase will be external in which the emulsifier is most soluble”;
i.e., oil-soluble emulsifiers will form w/o emulsions and water-soluble
emulsifiers o/w emulsions. This qualitative concept was largely extended and
several parameters have been proposed to quantify the nature of the surfactant
film. They are briefly presented in this section. Further details concerning the
these microemulsion types and their location in the phase diagram will be given
in Section 3.3.3.
The R-ratio
The R-ratio was first proposed by Winsor [21] to account for the
influence of amphiphiles and solvents on interfacial curvature. The primary
concept is to relate the energies of interaction between the amphiphile layer
and the oil and water regions. Therefore, this R-ratio compares the tendency
for an amphiphile to disperse into oil, to its tendency to dissolve in water. If
one phase is favoured, the interfacial region tends to take on a definite
curvature. A brief description of the concept is given below, and a full account
can be found elsewhere [26].
In micellar or microemulsion solutions, three distinct (single or
multicomponent) regions can be recognized: an aqueous region, W, an oil or
organic region, O, and an amphiphilic region, C. As shown in Figure 3.3, it is
useful to consider the interfacial zone as having a definite composition,
separating essentially bulk-phase water from bulk-phase oil. In this simple
picture, the interfacial zone has a finite thickness, and will contain, in addition
to surfactant molecules, some oil and water.
66

Figure 3.2 Winsor classification and phase sequence of microemulsions encountered as temperature or salinity is scanned for non-ionic and ionic surfactant respectively. Most of the surfactant resides in the shaded area. In the three-phase system the middle-phase microemulsion (M) is in equilibrium with both excess oil (O) and water (W).
O/W
excessoil
W /O
excesswater
M
O
W
2 phases 2 phases3 phases
Increasing temperature(non-ionic surfactants)
Increasing salinity(ionic surfactants)
Winsor I IIII I
O/W
excessoil
W /O
excesswater
M
O
W
2 phases 2 phases3 phases
Increasing temperature(non-ionic surfactants)
Increasing salinity(ionic surfactants)
Winsor I IIII I
Table 3.1 Qualitative effect of several variables on the observed phase
behaviour of anionic surfactants. After Bellocq et al. [22]
Scanned variables (increase) Ternary diagram transition
SalinityOil: Alkane carbon numberAlcohol: low M.W.a
Alcohol: high M.W.b
Surfactant: lipophilic chain lengthTemperature
I ⌫III ⌫IIII ⌫III ⌫II ⌫III ⌫III ⌫III ⌫III ⌫III ⌫IIII ⌫III ⌫I
Scanned variables (increase) Ternary diagram transition
SalinityOil: Alkane carbon numberAlcohol: low M.W.a
Alcohol: high M.W.b
Surfactant: lipophilic chain lengthTemperature
I ⌫III ⌫IIII ⌫III ⌫II ⌫III ⌫III ⌫III ⌫III ⌫III ⌫IIII ⌫III ⌫I
67

Figure 3.3 Interaction energies in the interfacial region of an oil-surfactant-water system.
Aw w
AH cw
AHco
Aoo
ALL
ALc o
AHH
ALcw
OIL PHASE: O
SURFACTANTLAYER
WATER PHASE: W
: C
Aco = A Lco + A Hco
Acw = ALcw + A Hcw
Aw w
AH cw
AHco
Aoo
ALL
ALc o
AHH
ALcw
OIL PHASE: O
SURFACTANTLAYER
WATER PHASE: W
: C
Aco = A Lco + A Hco
Acw = ALcw + A Hcw
Cohesive interaction energies therefore exist within the C layer, and these
determine interfacial film stability. They are depicted schematically in Figure
3.3: the cohesive energy between molecules x and y is defined as Axy, and is
positive whenever interaction between molecules is attractive. Axy is depicted as
the cohesive energy per unit area between surfactant, oil and water molecules
residing in the anisotropic interfacial C layer. For surfactant−oil and
surfactant−water interactions Axy can be considered to be composed of two
additive contributions:
HxyLxyxy AAA += (3.3.1)
68
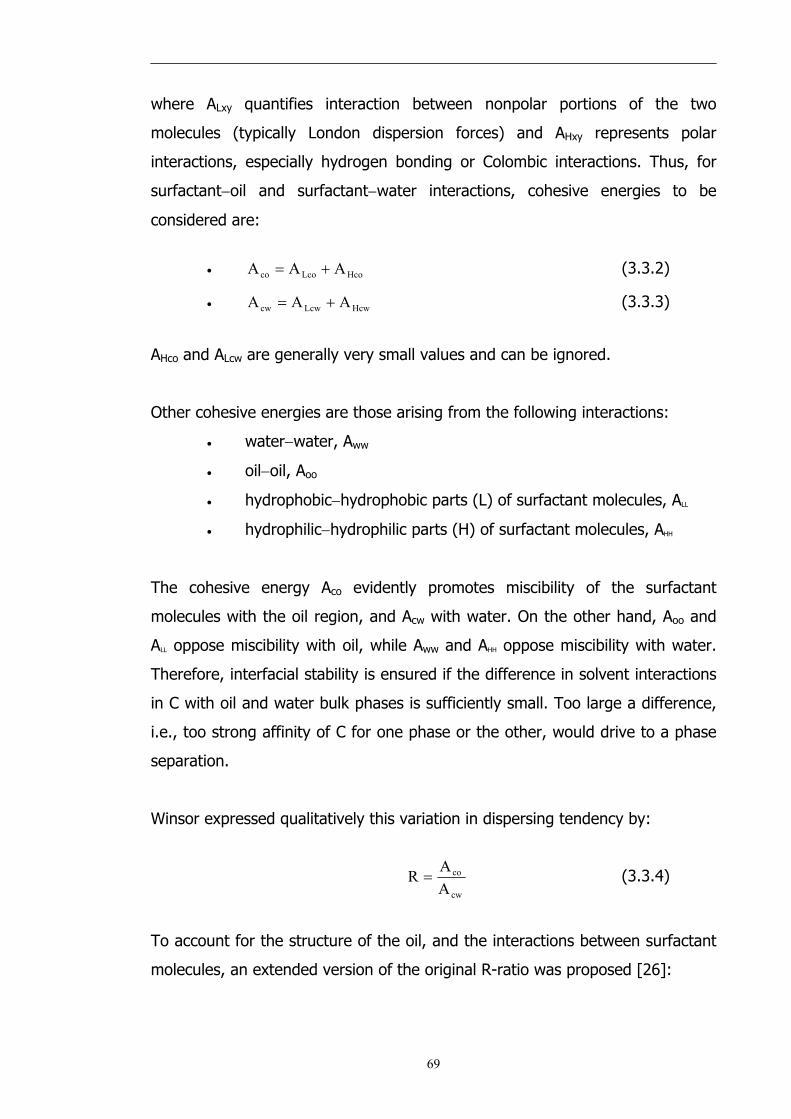
where ALxy quantifies interaction between nonpolar portions of the two
molecules (typically London dispersion forces) and AHxy represents polar
interactions, especially hydrogen bonding or Colombic interactions. Thus, for
surfactant−oil and surfactant−water interactions, cohesive energies to be
considered are:
• (3.3.2) HcoLcoco AAA +=
• (3.3.3) HcwLcwcw AAA +=
AHco and ALcw are generally very small values and can be ignored.
Other cohesive energies are those arising from the following interactions:
• water−water, Aww
• oil−oil, Aoo
• hydrophobic−hydrophobic parts (L) of surfactant molecules, ALL
• hydrophilic−hydrophilic parts (H) of surfactant molecules, AHH
The cohesive energy Aco evidently promotes miscibility of the surfactant
molecules with the oil region, and Acw with water. On the other hand, Aoo and
ALL oppose miscibility with oil, while Aww and AHH oppose miscibility with water.
Therefore, interfacial stability is ensured if the difference in solvent interactions
in C with oil and water bulk phases is sufficiently small. Too large a difference,
i.e., too strong affinity of C for one phase or the other, would drive to a phase
separation.
Winsor expressed qualitatively this variation in dispersing tendency by:
cw
co
AAR = (3.3.4)
To account for the structure of the oil, and the interactions between surfactant
molecules, an extended version of the original R-ratio was proposed [26]:
69

( )( )HH
LL
AAAAAAR
wwcw
ooco
−−−−
= (3.3.5)
As mentioned before, in many cases, AHco and ALcw are negligible, so Aco and
Acw can be approximated respectively to ALco and AHcw.
In brief, Winsor's primary concept is that this R-ratio of cohesive
energies, stemming from interaction of the interfacial layer with oil, divided by
energies resulting from interactions with water, determines the preferred
interfacial curvature. Thus, if R > 1, the interface tends to increase its area of
contact with oil while decreasing its area of contact with water. Thus oil tends
to become the continuous phase and the corresponding characteristic system is
type II (Winsor II). Similarly, a balanced interfacial layer is represented by R =
1.
Packing parameter and microemulsion structures
Changes in film curvature and microemulsion type can be addressed
quantitatively in terms of geometric requirements. This concept was introduced
by Israelachivili et al. [27] and is widely used to relate surfactant molecular
structure to interfacial topology. As described in Section 2.3.3, the preferred
curvature is governed by relative areas of the head group, ao, and the tail
group, v/lc (see Figure 2.6 for the possible aggregate structures). In terms of
microemulsion type,
• if ao > v/lc, then an oil-in-water microemulsion forms,
• if ao < v/lc, then a water-in-oil microemulsion forms,
• if ao ≈ v/lc, then a middle-phase microemulsion is the preferred
structure.
Hydrophilic−Lipophilic Balance (HLB)
Another concept relating molecular structure to interfacial packing and
film curvature is HLB, the hydrophilic−lipophilic balance. It is generally
70

expressed as an empirical equation based on the relative proportions of
hydrophobic and hydrophilic groups within the molecule. The concept was first
introduced by Griffin [28] who characterized a number of surfactants, and
derived an empirical equation for non-ionic alkyl polyglycol ethers (CiEj) based
on the surfactant chemical composition [29]:
( ) 5/%wt OH%wt EHLB j += (3.3.6)
where Ej wt% and OH wt% are the weight percent of ethylene oxide and
hydroxide groups respectively.
Davies et al. [30] proposed a more general empirical equation that
associates a constant to the different hydrophilic and hydrophobic groups:
( ) ( )[ ] 7LHHLB LH +×−×= nn (3.3.7)
where H and L are constants assigned to hydrophilic and hydrophobic groups
respectively, and nH and nL the number of these groups per surfactant
molecule.
For bicontinuous structures, i.e., zero curvature, it was shown that HLB ≈
10 [31]. Then w/o microemulsions form when HLB < 10, and o/w
microemulsion when HLB > 10. HLB and packing parameter describe the same
basic concept, though the latter is more suitable for microemulsions. The
influence of surfactant geometry and system conditions on HLB numbers and
packing parameter is illustrated in Figure 3.4.
71

Figure 3.4 Effect of molecular geometry and system conditions on the packing parameter and HLB number (after Israelachvili [31]).
v/aolc
HLB
Structure of Surfactantaggregate
Micelle Bilayervesicle
Invertedmicelle
40 20 10 2 1
1/3 1/2 1 2 3
O / W W / O
SMALLER v, LARGER lc LARGER v, SMALLER lc
SMALLER aoLARGER ao
lc
ao
vd
Larger, more hydrated head groupsLower ionic strength, larger d/lcLower pH (cationics), higher pH (anionics)Lower temperature (non-ionics)
Smaller, less hydrated head groupsHigher ionic strength, smaller d/lcHigher pH (cationics), lower pH (anionics)Higher temperature (non-ionics)
Single, saturated chainsShorter chains, larger d/lcLess oil-penetrationHigher MW oil
Branched, unsaturated chainsDouble-chains, higher temperatureGreater oil-penetrationCo-surfactant addition
v/aolc
HLB
Structure of Surfactantaggregate
Micelle Bilayervesicle
Invertedmicelle
Structure of Surfactantaggregate
Micelle Bilayervesicle
Invertedmicelle
40 20 10 2 140 20 10 2 1
1/3 1/2 1 2 3
O / W W / O
SMALLER v, LARGER lc LARGER v, SMALLER lc
SMALLER aoLARGER ao SMALLER aoLARGER ao
lc
ao
vd
Larger, more hydrated head groupsLower ionic strength, larger d/lcLower pH (cationics), higher pH (anionics)Lower temperature (non-ionics)
Smaller, less hydrated head groupsHigher ionic strength, smaller d/lcHigher pH (cationics), lower pH (anionics)Higher temperature (non-ionics)
Larger, more hydrated head groupsLower ionic strength, larger d/lcLower pH (cationics), higher pH (anionics)Lower temperature (non-ionics)
Smaller, less hydrated head groupsHigher ionic strength, smaller d/lcHigher pH (cationics), lower pH (anionics)Higher temperature (non-ionics)
Single, saturated chainsShorter chains, larger d/lcLess oil-penetrationHigher MW oil
Branched, unsaturated chainsDouble-chains, higher temperatureGreater oil-penetrationCo-surfactant addition
Phase Inversion Temperature (PIT)
Non-ionic surfactants form water−oil microemulsions (and emulsions)
with a high temperature sensitivity. In particular, there is a specific phase
inversion temperature (PIT) and the film curvature changes from positive to
negative. This critical point was defined by Shinoda et al. [32]:
• if T < PIT, an oil-in-water microemulsion forms (Winsor I),
• if T > PIT, a water-in-oil microemulsion forms (Winsor II),
• at T = PIT, a middle-phase microemulsion exists (Winsor III) with a
spontaneous curvature equal to zero, and a HLB number (Eq. 3.3.6)
approximately equal to 10.
72

The HLB number and PIT are therefore connected; hence the term HLB
temperature is sometimes employed [33].
3.3.2 Surfactant film properties
an alternative, more physically realistic, approach is to consider
mechanical properties of a surfactant film at an oil−water interface. This film
can be characterized by three phenomenological constants: tension, bending
rigidity, and spontaneous curvature. Their relative importance depends on the
constraints felt by the film. It is important to understand how these parameters
relate to interfacial stability since surfactant films determine the static and
dynamic properties of microemulsions (and emulsions). These include phase
behaviour and stability, structure, and solubilisation capacity.
Ultra-low interfacial tension
Interfacial (or surface) tensions, γ, were defined in Chapter 2 for planar
surfaces, and the same principle applies for curved liquid−liquid interfaces, i.e.,
it corresponds to the work required to increase interfacial area by unit amount.
As mentioned in Section 3.2.1, microemulsion formation is accompanied by
ultra-low interfacial oil−water tensions, γo/w, typically 10-2 to 10-4 mN m-1. They
are affected by the presence of a co-surfactant, as well as electrolyte and/or
temperature, pressure, and oil chain length. Several studies have been reported
on the effect of such variables on γo/w. In particular, Aveyard and coworkers
performed several systematic interfacial tension measurements on both ionics
[34, 35] and non-ionics [36], varying oil chain length, temperature, and
electrolyte content. For example, in the system water−AOT−n-heptane, at
constant surfactant concentration (above its CMC), a plot of γo/w as a function
of electrolyte (NaCl) concentration shows a deep minimum that corresponds to
the Winsor phase inversion; i.e., upon addition of NaCl, γo/w decreases to a
minimum critical value (Winsor III structure), then increases to a limiting value
close to 0.2−0.3 mN m-1 (Winsor II region). At constant electrolyte
concentration, varying temperature [34], oil chain length and co-surfactant
73

content [35] have a similar effect. With non-ionics, a similar tension curve and
phase inversion are observed, but on increasing temperature [36]. In addition,
when increasing surfactant chain length, the interfacial tension curves shift to
higher temperatures and the minimum in γo/w decreases [37]. Ultra-low
interfacial tensions cannot be measured with standard techniques such as Du
Nouy Ring, Wilhelmy plate, or drop volume (DVT). Appropriate techniques for
this low tension range are spinning drop tensiometry (SDT) and surface light
scattering [38].
Spontaneous curvature
Spontaneous (or natural or preferred) curvature Co is defined as the
curvature formed by a surfactant film when a system consists of equal amounts
of water and oil. Then, there is no constraint on the film, which is free to adopt
the lowest free energy state. Whenever one phase is predominant, there is a
deviation from Co. In principle, every point on a surface possesses two principal
radii of curvature, R1 and R2 and their associated principal curvatures are C1 =
1/R1 and C2 = 1/R2. Mean and Gaussian curvatures are used to define the
bending of surfaces. They are defined as follows [39]:
Mean curvature: C = ½ (1/R1 + 1/R2)
Gaussian curvature: κ = 1/R1 × 1/R2
C1 and C2 are determined as follows: every point on the surface of the
surfactant film has two principal radii of curvature, R1 and R2 as shown in
Figure 3.5. If a circle is placed tangentially to a point p on the surface and if the
circle radius is chosen so that its second derivative at the contact point equals
that of the surface in the direction of the tangent (of normal vector, n), then
the radius of the circle is a radius of curvature of the surface. The curvature of
the surface is described by two such circles chosen in orthogonal (principal)
directions as shown in Figure 3.5(a).
74

For a sphere, R1 and R2 are equal and positive (Figure 3.5(b)). For a
cylinder R2 is indefinite (Figure 3.5(c)) and for a plane, both R1 and R2 are
indefinite. In the special case of a saddle, R1 = −R2, i.e., at every point the
surface is both concave and convex (Figure 3.5(d)). Both a plane and saddle
have the property of zero mean curvature.
The curvature Co depends both on the composition of the phases it
separates and on surfactant type. One argument applied to the apolar side of
the interface is that oil can penetrate to some extent between the surfactant
hydrocarbon tails. The more extensive the penetration, the more curvature is
imposed toward the polar side. This results in a decrease of Co since, by
convention, positive curvature is toward oil (and negative toward water). The
longer the oil chains, the less they penetrate the surfactant film and the smaller
the effect on Co. Recently, Eastoe et al. have studied the extent of solvent
penetration in microemulsions stabilized by di-chained surfactants, using SANS
and selective deuteration. Results suggested that oil penetration is a subtle
effect, which depends on the chemical structures of both surfactant and oil. In
particular, unequal surfactant chain length [40-43] or presence of C = C bonds
[44] result in a more disordered surfactant/oil interface, thereby providing a
region of enhanced oil mixing. For symmetric di-chained surfactants (e.g.,
DDAB and AOT), however, no evidence for oil mixing was found [42]. The
effect of alkane structure, and molecular volume on the oil penetration was also
investigated with n-heptane, and cyclohexane. The results indicate that
heptane is essentially absent from the layers, but the more compact
cyclohexane has a greater penetrating effect [43].
75
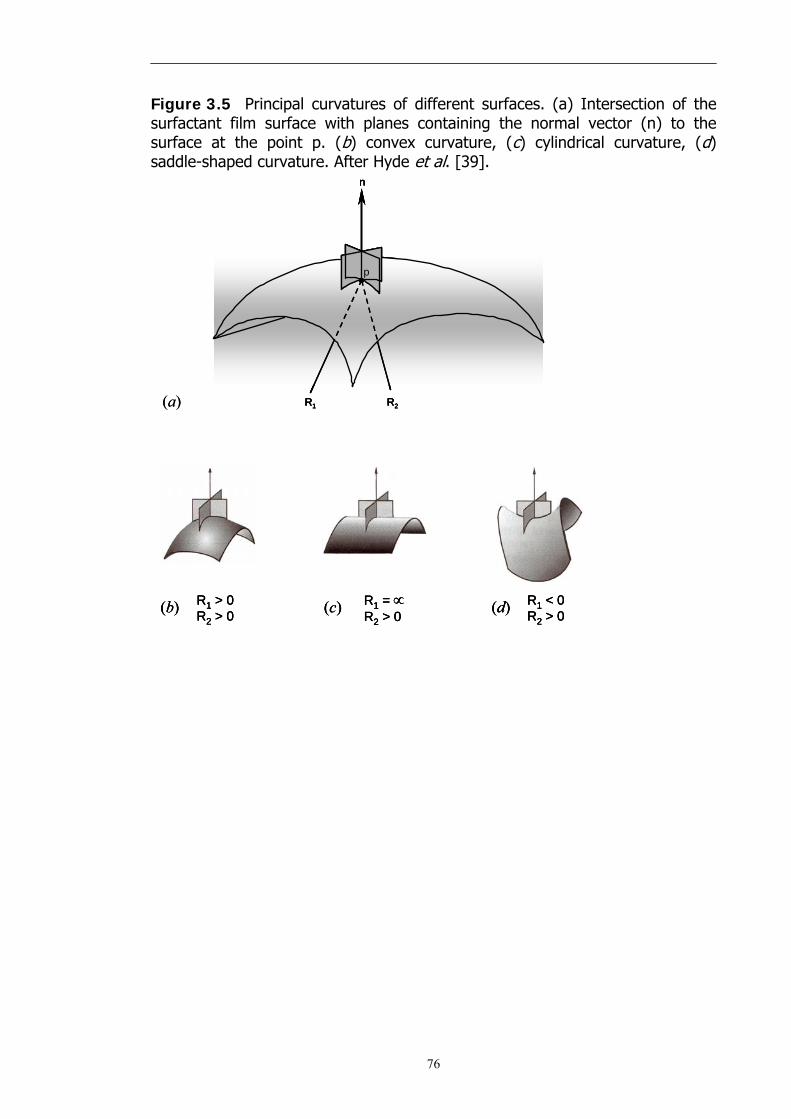
Figure 3.5 Principal curvatures of different surfaces. (a) Intersection of the surfactant film surface with planes containing the normal vector (n) to the surface at the point p. (b) convex curvature, (c) cylindrical curvature, (d) saddle-shaped curvature. After Hyde et al. [39].
(a)
p
n
R1 R2
(d)(c)(b) R1 > 0R2 > 0
R1 = ∝R2 > 0
R1 < 0R2 > 0
(a)
p
n
R1 R2
p
n
R1 R2
p
n
R1 R2
(d)(c)(b) R1 > 0R2 > 0
R1 = ∝R2 > 0
R1 < 0R2 > 0(d)(c)(b) R1 > 0
R2 > 0R1 = ∝R2 > 0
R1 < 0R2 > 0
76

Surfactant type, and nature of the polar head group, also influences Co through
different interactions with the polar (aqueous) phase:
• For ionic surfactants electrolyte content and temperature affect the
spontaneous curvature in opposite ways. An increase in salt concentration
screens electrostatic head group repulsions − i.e., decreases head group
area − so the film curves more easily toward water, leading to a decrease in
Co. Raising temperature has two effects: (1) an increase in electrostatic
repulsions between head groups due to higher counterion dissociation, so
Co increases; (2) more gauche conformations are induced in the surfactant
chains, which become more coiled, resulting in a decrease in Co. Therefore
the combined effects of temperature on the apolar chains and on
electrostatic interactions are competitive. The electrostatic term is believed
to be slightly dominant, so Co increases weakly with increasing
temperature.
• For non-ionic surfactants, unsurprisingly, electrolytes have very little effect
on Co, whereas temperature is a critical parameter due to the strong
dependence of their solubility (in water or oil) on temperature. For
surfactants of the CiEj type as temperature increases water becomes a less
good solvent for the hydrophilic units and penetrates less into the surfactant
layer. In addition, on the other side of the film, oil can penetrate further into
the hydrocarbon chains, so that increasing temperature for this type of
surfactant causes a strong decrease in Co. This phenomenon explains the
strong temperature effects on the phase equilibria of such surfactants as
shown in Figure 2.8 (see Chapter 2).
Thus, by changing external parameters such as temperature, nature of
the oil or electrolyte concentration, the spontaneous curvature can be tuned to
the appropriate value, and so drive transitions between Winsor systems. Other
factors affect Co in a similar fashion; they include varying the polar head group,
77

type and valency of counterions, length and number of apolar chains, adding a
co-surfactant, or mixing surfactants.
Film bending rigidity
Film rigidity is an important parameter associated with interfacial
curvature. The concept of film bending energy was first introduced by Helfrich
[45] and is now considered as an essential model for understanding
microemulsion properties. It can be described by two elastic moduli [46] that
measure the energy required to deform the interfacial film from a preferred
mean curvature:
• the mean bending elasticity (or rigidity), K, associated with the mean
curvature, that represents the energy required to bend unit area of
surface by unit amount. K is positive, i.e., spontaneous curvature is
favoured;
• the factor K is associated with Gaussian curvature, and hence accounts
for film topology. K is negative for spherical structures or positive for
bicontinuous cubic phases.
Theoretically, it is expected that bending moduli should depend on surfactant
chain length [47], area per surfactant molecule in the film [48] and electrostatic
head group interactions [49].
The film rigidity theory is based on the interfacial free energy associated
with film curvature. The free energy, F, of a surfactant layer at a liquid
interface may be given by the sum of an interfacial energy term, Fi, a bending
energy term, Fb, and an entropic term, Fent. For a droplet type structure this is
written as [50]:
( ) )(TfkdA CCKC2CC2KAFFFF B21
2o21entbi φn+⎥⎦
⎤⎢⎣⎡ +−++γ=++= ∫
(3.3.8)
where γ is the interfacial tension, A is the total surface area of the film, K is the
mean elastic bending modulus, K is the Gaussian bending modulus, C1 and C2
78

are the two principal curvatures, Co the spontaneous curvature, n is the number
of droplets, kB is the Boltzmann constant, and f(φ) is a function accounting for
the entropy of mixing of the microemulsion droplets, where φ is the droplet
core volume fraction. For dilute systems where φ < 0.1, it was shown that
[ 1)ln()(f ]−= φφ [50]. Microemulsion formation is associated with ultra-low
interfacial tension, γ so the γA term is small compared to Fb and Fent and can be
ignored as an approximation.
As mentioned previously, the curvatures C1, C2 and Co can be expressed
in terms of radii as 1/R1, 1/R2, and 1/Ro respectively. For spherical droplets, R1
= R2 = R, and the interfacial area is . Note that R and R2R4A π= n o are core
radii rather than droplet radii [50]. Solving Eq. 3.3.8 and dividing by area A, the
total free energy, F, for spherical droplets (of radius R) is expressed as:
⎥⎦⎤
⎢⎣⎡
π++⎟⎟
⎠
⎞⎜⎜⎝
⎛−= )(f
R4Tk
RK
R1
R1K2
AF
2B
2
2
o
φ (3.3.9)
For systems where the solubilisation boundary is reached (WI or WII region), a
microemulsion is in equilibrium with an excess phase of the solubilisate and the
droplets have achieved their maximum size, i.e., the maximum core radius,
. Under this condition the minimization of the total free energy leads to a
relation between the spontaneous radius, R
avmaxR
o, and the elastic constants K and
K [51]:
)(fK8Tk
K2KK2
RR B
o
avmax φ
π+
+= (3.3.10)
A number of techniques have been used to determine K and K
separately, in particular, ellipsometry, X-ray reflectivity, and small-angle X-ray
scattering (SAXS) techniques [52-54]. De Gennes and Taupin [55] have
developed a model for bicontinuous microemulsions. For Co = 0 the layer is
79

supposed to be flat in the absence of thermal fluctuations. They introduced the
term ξK, the persistence length of the surfactant layer that relates to K via:
)Tk/K2exp(a BK π=ξ (3.3.11)
where a is a molecular length and ξK is the correlation length for the normals to
the layer, i.e., the distance over which this layer remains flat in the presence of
thermal fluctuations. ξK is extremely sensitive to the magnitude of K. When K
>> kBT, ξK is macroscopic, i.e., the surfactant layer is flat over large distances
and ordered structures such as lamellar phases may form. If K is reduced to ~
kBT then ξK is microscopic, ordered structures are unstable and disordered
phases such as microemulsions may form. Experiments reveal that K is typically
between 100 kBT for condensed insoluble monolayers [56] and about 10 kBT for
lipid bilayers [57-59] but can decrease below kBT in microemulsion systems
[60]. The role of K is also important, however, there are few measurements of
this quantity in the literature [e.g., 53, 61]. Its importance in determining the
structure of surfactant−oil−water mixtures is still far from clear.
An alternative, more accessible, method to quantify film rigidities is to
calculate the composite parameter )KK2( + using tensiometry and SANS
techniques. This parameter can be derived for droplet microemulsion at the
solubilisation boundary, WI or WII system, by combining the radius of the
droplet with interfacial tensions or droplet polydispersity. Two expressions can
be derived from Eq. 3.3.9 and 3.3.10.
1. Using the interfacial tension γo/w (measured by SLS or SDT) and the
maximum mean core radius (measured by SANS see Chapter 4): avmaxR
γo/w at the interface between microemulsion and excess phases at the
solubilisation boundary can be expressed in terms of these elastic moduli and
[52]. Any new area created must be covered by a monolayer of
surfactant, and so this energy may be calculated in the case of WI or WII
systems since the surfactant monolayer is taken from around the curved
avmaxR
80

microemulsion droplets [56]. To do this it is necessary to unbend the surfactant
film, introducing a contribution from K, of . The resulting change in
the number of microemulsion droplets introduces an entropic contribution and a
contribution due to the change in topology involving
2avmax )R/(K2
K , of 2avmax )R/(K . So the
interfacial tension between the microemulsion and excess phase is given by:
)(f)R(4
Tk)R(KK2
2avmax
B2av
maxw/o φ
π+
+=γ (3.3.11)
which gives for the bending moduli:
)(f4
Tk)R(KK2 B2avmaxw/o φ
π−γ=+ (3.3.12)
2. Using the Schultz polydispersity width obtained from SANS
analysis (see Chapter 4):
avmaxσ/Rp =
Droplet polydispersity relates to the bending moduli through thermal
fluctuations of the microemulsion droplets. Safran [62] and Milner [63]
described the thermal fluctuations by an expansion of the droplet deformation
in terms of spherical harmonics. The principal contribution to these fluctuations
was found to arise from the deformation mode l = 0 only [50]; and l = 0
deformations are fluctuations in droplet size, i.e., changes of the mean droplet
radius and hence the droplet polydispersity. In the case of the two phase
equilibria at maximum solubilisation (WI or WII), this polydispersity, p, may be
expressed as a function of K and K :
)(Tfk2)KK2(8Tk
4up
B
B2o2
φ++π=
π= (3.3.13)
where uo is the fluctuation amplitude for the l = 0 mode. This polydispersity is
given by the SANS Schultz polydispersity parameter [64], and Eq. 3.3.13
can be written:
avmaxσ/R
81

)(f4
Tk)σ/R(8
TkKK2 B2av
max
B φπ
−π
=+ (3.3.14)
Therefore Eq. 3.3.12 and 3.3.14 give two accessible expressions for the
sum )KK2( + using data from SANS and tensiometry. This approach has been
shown to work well with non-ionic films in WI systems [50, 65], and also
cationic [64] and zwitterionic [66] layers in WII microemulsions. Figure 3.6
shows results for these latter two classes of system, as a function of surfactant
alkyl carbon number n-C. The good agreement between equation 3.3.12 and
3.3.14 suggests they can be used with confidence. These values are in line with
current statistical mechanical theories [48], which suggest that K should vary as
n-C2.5 to n-C3, whereas there is only a small effect on K .
82

Figure 3.6 Film rigidities )KK2( + as a function of total alkyl carbon number n-C from Winsor II microemulsions. The lines are guides to the eye.
0.0
0.5
1.0
1.5
2.0
2.5
3.0
3.5
4.0
15 20 25 30 35 40
n-C
phospholipidszwitterionic
dialkylammoniumcationics
2.35C-~)K(2K n+
(2K
+ K
) /k
BT
0.0
0.5
1.0
1.5
2.0
2.5
3.0
3.5
4.0
15 20 25 30 35 40
n-C
phospholipidszwitterionic
dialkylammoniumcationics
2.35C-~)K(2K n+
(2K
+ K
) /k
BT
(2K
+ K
) /k
BT
SANS
SANS &tensiometry
)f(4
Tk)/R(8
Tk)K(2K B
max
B
2avφ
π−
σπ=+
)f(4
Tk)(R)K(2K Bav
2maxo/w φ
π−γ=+
SANS
SANS &tensiometry
)f(4
Tk)/R(8
Tk)K(2K B
max
B
2avφ
π−
σπ=+
)f(4
Tk)(R)K(2K Bav
2maxo/w φ
π−γ=+
0.0
0.5
1.0
1.5
2.0
2.5
3.0
3.5
4.0
15 20 25 30 35 40
n-C
phospholipidszwitterionic
dialkylammoniumcationics
2.35C-~)K(2K n+
(2K
+ K
) /k
BT
0.0
0.5
1.0
1.5
2.0
2.5
3.0
3.5
4.0
15 20 25 30 35 40
n-C
phospholipidszwitterionic
dialkylammoniumcationics
2.35C-~)K(2K n+
(2K
+ K
) /k
BT
(2K
+ K
) /k
BT
SANS
SANS &tensiometry
)f(4
Tk)/R(8
Tk)K(2K B
max
B
2avφ
π−
σπ=+
)f(4
Tk)(R)K(2K Bav
2maxo/w φ
π−γ=+
SANS
SANS &tensiometry
)f(4
Tk)/R(8
Tk)K(2K B
max
B
2avφ
π−
σπ=+
)f(4
Tk)(R)K(2K Bav
2maxo/w φ
π−γ=+
83

3.3.3 Phase behaviour
Solubilisation and interfacial properties of microemulsions depend upon
pressure, temperature and also on the nature and concentration of the
components. The determination of phase stability diagrams (or phase maps),
and location of the different structures formed within these
water(salt)−oil−surfactant−alcohol systems in terms of variables are, therefore,
very important. Several types of phase diagram can be identified depending on
the number of variables involved. In using an adequate mode of
representation, it is possible to describe not only the limits of existence of the
single and multiphase regions, but also to characterize equilibria between
phases (tie-lines, tie-triangles, critical points, etc.). Below is a brief description
of ternary and binary phase maps, as well as the phase rule that dictates their
construction.
Phase rule
The phase rule enables the identification of the number of variables (or
degrees of freedom) depending on the system composition and conditions. It
is generally written as [67]:
F = C − P + 2 (3.3.15)
where F is the number of possible independent changes of state or degrees of
freedom, C the number of independent chemical constituents, and P the
number of phases present in the system. A system is called invariant,
monovariant, bivariant, and so on, according to whether F is zero, 1, 2, and so
on. For example, in the simplest case of a system composed of three
components and two phases, F is univariant at a fixed temperature and
pressure. This means that the mole or weight fraction of one component in one
of the phases can be specified but all other compositions in both phases are
fixed. In general, microemulsions contain at least three components: oil (O),
water (W) and amphiphile (S), and as mentioned previously a co-surfactant
(alcohol) and/or an electrolyte are usually added to tune the system stability.
These can be considered as simple O−W−S systems: whenever a co-surfactant
84
is used, the ratio oil:alcohol is kept constant and it is assumed that the alcohol
does not interact with any other component so that the mixture can be treated
(to a first approximation) as a three-component system. At constant pressure,
the composition−temperature phase behaviour can be presented in terms of a
phase prism, as illustrated in Figure 3.7. However, the construction of such a
phase map is rather complex and time consuming so it is often convenient to
simplify the system by studying specific phase-cuts. The number of variables
can be reduced either by keeping one term constant and/or by combining two
or more variables. Then, ternary and binary phase diagrams are produced.
Ternary phase diagrams
At constant temperature and pressure, the ternary phase diagram of a
simple three-component microemulsion is divided into two or four regions as
shown in Figure 3.8. In each case, every composition point within the single-
phase region above the demixing line corresponds to a microemulsion.
Composition points below this line correspond to multiphase regions comprising
in general microemulsions in equilibrium with either an aqueous or an organic
phase or both, i.e., Winsor type systems (see Section 3.3.1).
Any system whose overall composition lies within the two-phase region
(e.g., point o in Figures 3.8(a) and 3.8(c)) will exist as two phases whose
compositions are represented by the ends of the “tie-line”, i.e., a segment
formed by phases m and n. Therefore, every point on a particular tie-line has
identical coexisting phases (m and n) but of different relative volumes. When
the two conjugate phases have the same composition (m = n), this
corresponds to the plait (or critical) point, p.
If three phases coexist (Figure 3.8(b)), i.e., corresponding to WIII, the
system at constant temperature and pressure is, according to the phase rule,
invariant. Then, there is a region of the ternary diagram that consists of three-
phase systems having invariant compositions and whose boundaries are tie-
lines in the adjacent two-phase regions that surround it. This region of three-
phase invariant compositions is therefore triangular in form and called “tie-
85

triangle” [26]. Any overall composition, such as point q (Figure 3.8(b)) lying
within the tie-triangle will divide into three phases having compositions
corresponding to the vertices A, B, and C of the triangle. The compositions A, B,
and C are invariant in the sense that varying the position q, the overall
composition, throughout the triangle will result in variations in the amounts of
the phases A, B, and C but not in their composition.
86

Figure 3.7 The phase prism, describing the phase behaviour of a ternary system at constant pressure.
W O
S
Temp.W O
S
Temp.
Figure 3.8 Ternary diagram representations of two- and three-phase regions formed by simple water−oil−surfactant systems at constant temperature and pressure. (a) Winsor I type, (b) Winsor II type, (c) Winsor III type systems.
Salinity
Winsor type I IIII
(b)
I
surfactant
1φ
2φ2φB
3φ
water oil
water oil
surfactant
1φ
2φ
(a)
po
(c)
surfactant
1φ
2φ
water oil
p o
q
n
m
n
m
A C
SalinitySalinity
Winsor type I IIII
(b)
surfactant
1φ
2φ2φB
3φ
water oilwater oil
water oil
surfactant
1φ
2φ
(a)
po
(c)
surfactant
1φ
2φ
water oilwater oil
p o
q
n
m
n
m
A C
I
87
Binary phase diagrams
As mentioned previously, ternary diagrams can be further simplified by
fixing some parameters and/or combining two variables together (e.g., water
and electrolyte into brine, or water and oil into water−to−oil ratio), i.e.,
reducing the degrees of freedom. Then, determining the phase diagram of such
systems reduces to a study of a planar section through the phase prism.
Examples of such pseudo-binary diagrams are given in Figures 3.9 to 3.11 for
non-ionic and anionic surfactants.
Figure 3.9 shows the schematic phase diagram for a non-ionic
surfactant−water−oil ternary system. Since temperature is a crucial variable in
the case of non-ionics, the pseudo-binary diagram is represented by the planar
section defined by φw = φo, where φw and φo are the volume fractions of water
and oil respectively. Then, at constant pressure, defining the system in a single-
phase region requires the identification of two independent variables (F = 2),
i.e., temperature and surfactant concentration. The section shown in Figure
3.9(b) can be used to determine TL and TU, the lower and upper temperatures,
respectively, of the phase equilibrium W+M+O (with M, the microemulsion
phase), and the minimum amount of surfactant necessary to solubilise equal
amounts of water and oil, denoted Cs* [68]. The lower Cs
* the more efficient
the surfactant. Figure 3.10 illustrates the determination of a second possible
section for a non-ionic surfactant−water−oil ternary system: pressure and
surfactant concentration are kept constant, leaving the two variables,
temperature and water−to−oil ratio (φw-o). This diagram shows the various
surfactant phases obtained as a function of temperature and water−to−oil ratio
[68]. The third example (Figure 3.11) concerns an anionic surfactant, Aerosol-
OT. In order to obtain F = 2 when defining the ternary W−O−S system in a
single-phase region at constant pressure, the surfactant concentration
parameter is fixed. Then, the two variables are temperature and w, the
water−to−surfactant molar ratio defined as w = [water] / [surfactant]. w
represents the number of water molecules solubilised per surfactant molecule,
so that this phase diagram characterizes the surfactant efficiency, as a
microemulsifier.
88

Figure 3.9 Binary phase behaviour in ternary microemulsion systems formed with non-ionic surfactants. (a) Illustration of the section through the phase prism at equal water and oil content. (b) Schematic phase diagram plotted as temperature versus surfactant concentration Cs. TL and TU are the lower and upper temperatures, respectively, of the phase equilibrium W+M+O. T* is the temperature at which the three-phase triangle is an isosceles, i.e., when the middle-phase microemulsion contains equal amounts of water and oil. This condition is also termed 'balanced'. Cs
* is the surfactant concentration in the middle-phase microemulsion at balanced conditions. ‘Lam’ denotes a lamellar liquid crystalline phase. After Olsson and Wennerström [68].
Surfactant conc.
Cs*
Tem
pera
ture
TL
TU
T* W+M+O
W+M
O+M
M Lam+M Lam
(b)
(a) W O
S
Temp.
Surfactant conc.
Cs*
Tem
pera
ture
TL
TU
T* W+M+O
W+M
O+M
M Lam+M Lam
(b) Surfactant conc.
Cs*
Tem
pera
ture
TL
TU
T* W+M+O
W+M
O+M
M Lam+M Lam
Surfactant conc.
Cs*
Tem
pera
ture
TL
TU
T* W+M+O
W+M
O+M
M Lam+M Lam
(b)
(a) W O
S
Temp.(a) W O
S
Temp.
89

Figure 3.10 Binary phase behaviour in ternary microemulsion systems formed with non-ionic surfactants. (a) Illustration of a section at constant surfactant concentration through the phase prism. (b) Schematic phase diagram, plotted as temperature versus volume fraction of oil, φo, at constant surfactant concentration. Also shown are various microstructures found in different regions of the microemulsion phase, M. At higher temperatures the liquid phase is in equilibrium with excess water (M+W), and at lower temperatures with excess oil (M+O). At intermediate temperatures a lamellar phase is stable at higher water contents and higher oil contents, respectively. After Olsson and Wennerström [68].
(b)0 0.2 0.4 0.6 0.8 1
20
30
35
40
M+O
M+W
MLam Lam
M+O
M+W
Oil Volume Fraction
Tem
pera
ture
/ °C
(a) W O
S
Temp.
25
monolayernormalbilayer
reversebilayer
(b)0 0.2 0.4 0.6 0.8 1
20
30
35
40
M+O
M+W
MLam Lam
M+O
M+W
Oil Volume Fraction
Tem
pera
ture
/ °C
(a) W O
S
Temp.(a) W O
S
Temp.
25
monolayernormalbilayer
reversebilayer
90

Figure 3.11 Pseudo-binary phase diagram in ternary microemulsion systems formed with the anionic surfactant Aerosol-OT (AOT) in various straight-chain alkane solvents. The water–to–surfactant molar ratio, w, is plotted versus temperature at constant surfactant concentration and pressure. Alkane carbon numbers are indicated; ringed numbers correspond to the lower temperature (solubilisation) boundary, TL, and un-ringed numbers to the upper temperature (haze) boundary, TU. The single phase microemulsion region is located between TL and TU. Below TL the system consists of a microemulsion phase in equilibrium with excess water (WII type), and above TU the single microemulsion phase separates into a surfactant-rich phase and an oil phase. After Fletcher et al. [16].
100
50
00 15 30 45
T / °C
w
56
7
89
10
11
567
8
9
12
100
50
00 15 30 45
T / °C
w
56
7
89
10
11
556677
88
99
12
91
REFERENCES
1. Danielsson, I.; Lindman, B. Colloids Surf. A 1981, 3, 391.
2. Sjöblom, J.; Lindberg, R.; Friberg, S. E. Adv. Colloid Interface Sci. 1996,
125.
3. Schulman, J. H.; Stoeckenius, W.; Prince, M. J. Phys. Chem. 1959, 63,
1677.
4. Shinoda, K.; Friberg, S. Adv. Colloid Interface Sci. 1975, 4, 281.
5. Adamson, A. W. J. Colloid Interface Sci. 1969, 29, 261.3.
6. Friberg, S. E.; Mandell, L.; Larsson, M. J. Colloid Interface Sci. 1969, 29,
155.
7. Shah, D. O., Ed. ‘Surface Phenomena in Enhanced Recovery’ Plenum Press,
1981, New York.
8. Overbeek, J. Th. G. Faraday Discuss. Chem. Soc. 1978, 65, 7.
9. Tadros, Th. F.; Vincent, B. in ‘Encyclopaedia of Emulsion Technology’
Becher, P. Ed., Vol. 1, Marcel Dekker, 1980, New York.
10. Kunieda, H.; Shinoda, K. J. Colloid Interface Sci. 1980, 75, 601.
11. Chen, S. J.; Evans, F. D.; Ninham, B. W. J. Phys. Chem. 1984, 88, 1631.
12. Kahlweit, M.; Strey, R.; Busse, G. J. Phys. Chem. 1990, 94, 3881.
13. Hunter, R. J. ‘Introduction to Modern Colloid Science’ Oxford University
Press, 1994, Oxford.
14. Lekkerkerker, H. N. W.; Kegel, W. K.; Overbeek, J. Th. G. Ber. Bunsenges
Phys. Chem. 1996, 100, 206.
15. Ruckenstein, E.; Chi, J. C. J. Chem. Soc. Faraday Trans. 1975, 71, 1690.
16. Fletcher, P. D. I.; Howe, A. M.; Robinson, B. H. J. Chem. Soc. Faraday
Trans. 1 1987, 83, 985.
17. Fletcher, P. D. I.; Clarke, S.; Ye, X. Langmuir 1990, 6, 1301.
18. Biais, J.; Bothorel, P.; Clin, B.; Lalanne, P. J. Colloid Interface Sci. 1981, 80,
136.
19. Friberg, S.; Mandell, L.; Larson, M. J. Colloid Interface Sci. 1969, 29, 155.
20. Fletcher, P. D. I.; Horsup, D. I. J. Chem. Soc. Faraday Trans. 1 1992, 88,
855.
92

21. Winsor, P. A. Trans. Faraday Soc. 1948, 44, 376.
22. Bellocq, A. M.; Biais, J.; Bothorel, P.; Clin, B.; Fourche, G.; Lalanne, P.;
Lemaire, B.; Lemanceau, B.; Roux, D. Adv. Colloid Interface Sci. 1984, 20,
167.
23. Bancroft, W. D. J. Phys. Chem. 1913, 17, 501.
24. Clowes, G. H. A. J. Phys. Chem. 1916, 20, 407.
25. Adamson, A. W. ‘Physical Chemistry of Surfaces’ Interscience, 1960, p 393.
26. Bourrel, M.; Schechter, R. S. ‘Microemulsions and Related Systems’ Marcel
Dekker, 1988, New York.
27. Israelachvili, J. N.; Mitchell, D. J.; Ninham, B. W. J. Chem. Soc. Faraday
Trans. 2 1976, 72, 1525.
28. Griffin, W. C. J. Cosmetics Chemists 1949, 1, 311.
29. Griffin, W. C. J. Cosmetics Chemists 1954, 5, 249.
30. Davies, J. T. Proc. 2nd Int. Congr. Surface Act. Vol. 1 Butterworths, 1959,
London.
31. Israelachvili, J. N. Colloids Surf. A 1994, 91, 1.
32. Shinoda, K.; Saito, H. J. Colloid Interface Sci. 1969, 34, 238.
33. Shinoda, K.; Kunieda, H. in ‘Encyclopaedia of Emulsion Technology’ Becher,
P. Ed., Vol. 1, Marcel Dekker, 1983, New York.
34. Aveyard, R.; Binks, B. P.; Clarke, S.; Mead, J. J. Chem. Soc. Faraday Trans.
1 1986, 82, 125.
35. Aveyard, R.; Binks, B. P.; Mead, J. J. Chem. Soc. Faraday Trans. 1 1986,
82, 1755.
36. Aveyard, R.; Binks, B. P.; Fletcher, P. D. I. Langmuir 1989, 5, 1210.
37. Sottmann, T.; Strey, R. Ber. Bunsenges Phys. Chem. 1996, 100, 237.
38. Langevin, D., Ed. ‘Light Scattering by Liquid Surfaces and Complementary
Techniques’ Marcel Dekker, 1992, New York.
39. Hyde, S.; Andersson, K.; Larsson, K.; Blum, Z.; Landh, S.; Ninham, B. W.
‘The Language of Shape’ Elsevier, 1997, Amsterdam.
40. Eastoe, J.; Dong, J.; Hetherington, K. J.; Steytler, D. C.; Heenan, R. K. J.
Chem. Soc. Faraday Trans. 1996, 92, 65.
93

41. Eastoe, J.; Hetherington, K. J.; Sharpe, D.; Dong, J.; Heenan, R. K.;
Steytler, D. C. Langmuir 1996, 12, 3876.
42. Eastoe, J.; Hetherington, K. J.; Sharpe, D.; Dong, J.; Heenan, R. K.;
Steytler, D. C. Colloids Surf. A 1997, 128, 209.
43. Eastoe, J.; Hetherington, K. J.; Sharpe, D.; Steytler, D. C.; Egelhaaf, S.;
Heenan, R. K. Langmuir 1997, 13, 2490.
44. Bumajdad, A.; Eastoe, J.; Heenan, R. K.; Lu, J. R.; Steytler, D. C.; Egelhaaf,
S. J. Chem. Soc. Faraday Trans. 1998, 94, 2143.
45. Helfrich, W. Z. Naturforsch. 1973, 28c, 693.
46. Kellay, H.; Binks, B. P.; Hendrikx, Y.; Lee, L. T.; Meunier, J. Adv. Colloid
Interface Sci. 1994, 9, 85.
47. Safran, S. A.; Tlusty, T. Ber. Bunsenges. Phys. Chem. 1996, 100, 252.
48. Szleifer, I.; Kramer, D.; Ben-Shaul, A.; Gelbart, W. M.; Safran, S. J. Chem.
Phys. 1990, 92, 6800.
49. Winterhalter, M.; Helfrich, W. J. Phys. Chem. 1992, 96, 327.
50. Gradzielski, M.; Langevin, D.; Farago, B. Phys. Rev. E 1996, 53, 3900.
51. Safran, S. A. in ‘Structure and Dynamics of Strongly Interacting Colloids and
Supramolecular Aggregates in Solution’ Vol. 369 of NATO Advanced Study
Institute, Series C: Mathematical and Physical Sciences, Chen, S. H.; Huang,
J. S.; Tartaglia, P. Ed.; Kluwer, Dortrecht, 1992.
52. Meunier, J.; Lee, L. T. Langmuir 1991, 46, 1855.
53. Kegel, W. K.; Bodnar, I.; Lekkerkerker, H. N. W. J. Phys. Chem. 1995, 99,
3272.
54. Sicoli, F.; Langevin, D.; Lee, L. T. J. Chem. Phys. 1993, 99, 4759.
55. De Gennes, P. G.; Taupin, C. J. Phys. Chem. 1982, 86, 2294.
56. Daillant, J.; Bosio, L.; Benattar, J. J.; Meunier, J. Europhys. Lett. 1989, 8,
453.
57. Shneider, M. B.; Jenkins, J. T.; Webb, W. W. Biophys. J. 1984, 45, 891.
58. Engelhardt, H; Duwe, H. P.; Sackmann, E. J. Phys. Lett. 1985, 46, 395.
59. Bivas, I.; Hanusse, P.; Botherel, P.; Lalanne, J.; Aguerre-Chariol, O. J.
Physique 1987, 48, 855.
60. Di Meglio, J. M.; Dvolaitzky, M. Taupin, C. J. Phys. Chem. 1985, 89, 871.
94

61. Farago, B.; Huang, J. S.; Richter, D.; Safran, S. A.; Milner, S. T. Progr.
Colloid Polym. Sci. 1990, 81, 60.
62. Safran, S. A. J. Chem. Phys. 1983, 78, 2073.
63. Milner, S. T.; Safran, S. A. Phys. Rev. A 1987, 36, 4371.
64. Eastoe, J.; Sharpe, D.; Heenan, R. K.; Egelhaaf, S. J. Phys. Chem. B 1997,
101, 944.
65. Gradzielski, M.; Langevin, D. J. Mol. Struct. 1996, 383, 145.
66. Eastoe, J.; Sharpe, D. Langmuir 1997, 13, 3289.
67. Rock, P. A. ‘Chemical Thermodynamics’ MacMillan, 1969, London.
68. Olsson, U.; Wennerström, H. Adv. Colloid Interface Sci. 1994, 49, 113.
95