3 exports and imports
TRANSCRIPT

3 EXPORTS AND IMPORTS
FOREIGN T R A D E HITS A L L - T I M E HIGH Export rise has continued
during the first months of this year, except for the shipping strike period
VIRGINIA KINNARD, Chemical and Rubber Division, BDSA, Washington, D.C.
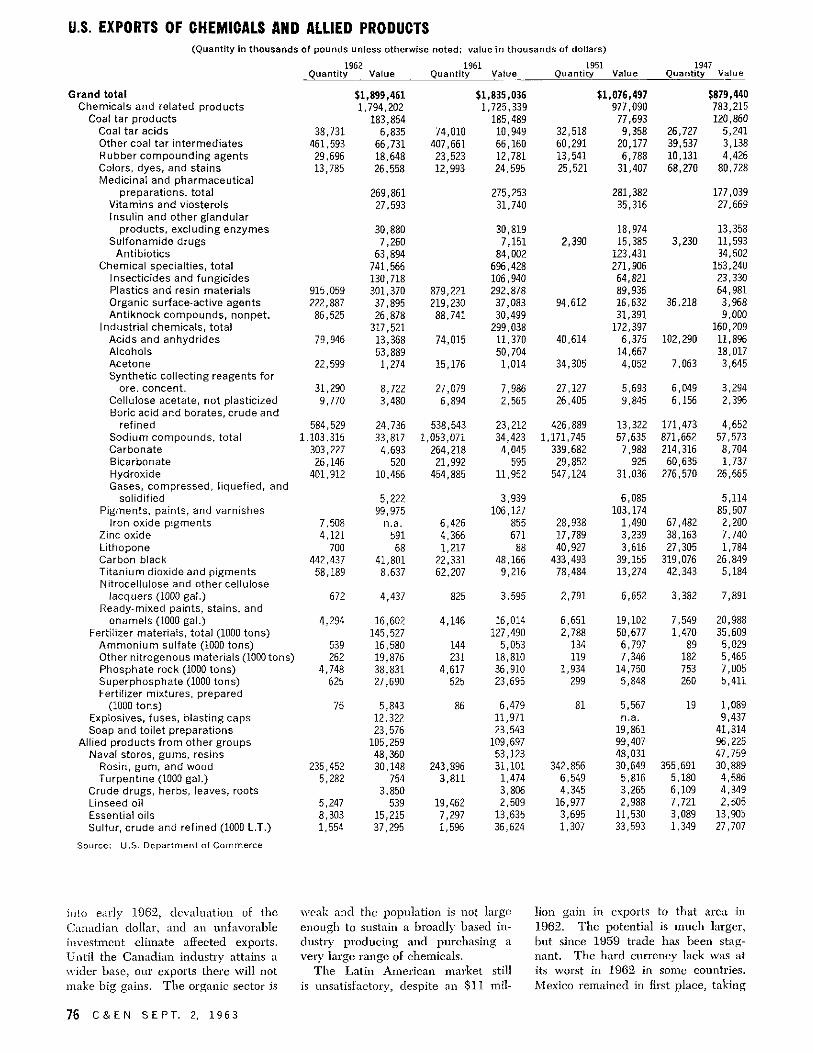
U.S. foreign trade in chemicals and allied products reached an all-time high of $2.471 billion in 1962, 4% greater than 1961's $2.376 billion. Exports of chemicals and allied products, at a new peak of $1.899 billion, barely missed the $2 billion mark and were 3.5% greater than in 1961. Exports of chemicals and related products (Group 8) , $1.794 billion, were 4 .1% higher than in 1961 and again the percentage increase was higher than that for all U.S. exports. Imports of chemicals and allied products, $572 million, were up 5.7%, but those of chemicals and related products (Group 8) , $417 million, were up 6.9%. Imports followed a more even monthly pattern than exports.
Exports of chemicals and related products in the first five months of 1963 were well ahead of monthly totals in the 1962 period except in January when the shipping strike reduced the total sharply. Shipments of coal tar and other cyclic products are rising and so are those of industrial chemicals.
Exports to most major countries rose, although some of the gains were smaller than anticipated, owing partly to a slackening of European production, tight money in Japan, and exchange and inflation problems in Latin America. Europe has no dollar shortages but Latin America and Asia do.
Geographic Areas
Among regional groups, West Europe retained first place by a considerable margin, exports to that area totaling $600 million, a 3.5% increase. The European Economic Community (EEC) took $390 million, up 1.6%. Exports to the European Free Trade Association (EFTA), $172.7 million, were up 6.6%. All leading West European purchasers maintained their 1961 ranking. The Netherlands with $112 million was again first, taking $11.4 million more than in 1961. Chemical specialties and industrial chemicals had the big gains there.
The U.K. retained second place, but the increase was very small,
$200,000. The chemical industry was affected by the general sluggishness of the British economy and a highly competitive export market. Italy retained third place with a gain of $2.7 million. For the second year, exports to Germany were down, the loss being considerably larger than in 1961, $7.7 million against $2.1 million. Competition was heavy from EEC countries and the U.K.
Belgium-Luxembourg was the only other leading West European customer to take less in 1962. Belgium's relatively small chemical firms felt considerable pressure in 1962. France, which upped its purchases $10 million in 1961, took only $1.6 million more in 1962. Coal tar products, which had a large increase in 1961, were down almost $4 million.
Trade with Canada, more important than with any other country, still lacks real momentum. Exports were up only $2.3 million above 1961, chemical specialties having the only substantial gain, $3.5 million. An economic slowdown which continued
EXPORTS AND IMPORTS
Chemicals and Allied Products
Millions of Dollars
Exports
Imports
Source: U. S. Department of Commerce
1800
1600
1400
1200
1000
800
600
1 I II I I 400
200
1950 1951 1952 1953 1954 1955 1956 1957 1958 1959 1960 1961 1962
S E P T . 2, 1963 C & E N 75
U.S. EXPORTS OF CHEMICALS AND ALLIED PRODUCTS (Quantity in thousands of pounds unless otherwise noted; value in thousands of dollars)
1962 1961 1951 1947 Quantity Value Quantity Value Quantity Value Quantity Value
Grand total $1,899,461 $1,835,036 $1,076,497 $879,440 Chemicals and related products 1,794,202 1,725,339 977,090 783,215
Coal tar products 183,854 185,489 77,693 120,860 Coal tar acids 38,731 6,835 74,010 10,949 32,518 9,358 26,727 5,241 Other coal tar intermediates 461,593 66,731 407,661 66,160 60,291 20,177 39,537 3,138 Rubber compounding agents 29,696 18,648 23,523 12,781 13,541 6,788 10,131 4,426 Colors, dyes, and stains 13,785 26,558 12,993 24,595 25,521 31,407 68,270 80,728 Medicinal and pharmaceutical
preparations, total 269,861 275,253 281,382 177,039 Vitamins and viosterols 27,593 31,740 35,316 27,669 Insulin and other glandular
products, excluding enzymes 30,880 30,819 18,974 13,358 Sulfonamide drugs 7,260 7,151 2,390 15,385 3,230 11,593
Antibiotics 63,894 84,002 123,431 34,502 Chemical specialties, total 741,566 696,428 271,906 153,240
Insecticides and fungicides 130,718 106,940 64,821 23,330 Plastics and resin materials 915,059 301,370 879,221 292,878 89,936 64,981 Organic surface-active agents 222,887 37,895 219,230 37,083 94,612 16,632 36,218 3,968 Antiknock compounds, nonpet. 86,525 26,878 88,741 30,499 31,391 9,000
Industrial chemicals, total 317,521 299,038 172,397 160,209 Acids and anhydrides 79,946 13,368 74,015 11,370 40,614 6,375 102,290 11,896 Alcohols 53,889 50,704 14,667 18,017 Acetone 22,599 1,274 15,176 1,014 34,305 4,052 7,063 3,645 Synthetic collecting reagents for
ore. concent. 31,290 8,722 27,079 7,986 27,127 5,693 6,049 3,294 Cellulose acetate, not plasticized 9,770 3,480 6,894 2,565 26,405 9,845 6,156 2,396 Boric acid and borates, crude and
refined 584,529 24,736 538,543 23,212 426,889 13,322 171,473 4,652 Sodium compounds, total 1,103,315 33,817 1,053,071 34,423 1,171,745 57,635 871,662 57,573 Carbonate 303,227 4,693 264,218 4,045 339,682 7,988 214,316 8,704 Bicarbonate 26,146 520 21,992 595 29,852 925 60,635 1,737 Hydroxide 401,912 10,466 454,885 11,952 547,124 31,036 276,570 26,665 Gases, compressed, liquefied, and
solidified 5,222 3,939 6,086 5,114 Pigments, paints, and varnishes 99,975 106,127 103,174 85,507
Iron oxide pigments 7,508 n.a. 6,426 855 28,938 1,490 67,482 2,200 Zinc oxide 4,121 591 4,366 671 17,789 3,239 38,163 7,740 Lithopone 700 68 1,217 88 40,927 3,616 27,305 1,784 Carbon black 442,437 41,801 22,331 48,166 433,493 39,155 319,076 26,849 Titanium dioxide and pigments 58,189 8,637 62,207 9,216 78,484 13,274 42,343 5,184 Nitrocellulose and other cellulose
lacquers (1000 gal.) 672 4,437 825 3,595 2,791 6,652 3,382 7,891 Ready-mixed paints, stains, and
enamels (1000 gal.) 4,294 16,602 4,146 16,014 6,651 19,102 7,549 20,988 Fertilizer materials, total (1000 tons) 145,527 127,490 2,788 50,677 1,470 35,609
Ammonium sulfate (1000 tons) 539 16,580 144 5,053 134 6,797 89 5,029 Other nitrogenous materials (1000 tons) 262 19,876 231 18,810 119 7,346 182 5,465 Phosphate rock (1000 tons) 4,748 38,831 4,617 36,910 1,934 14,750 753 7,005 Superphosphate (1000 tons) 625 27,690 525 23,695 299 5,848 260 5,411 Fertilizer mixtures, prepared
(1000 tons) 75 5,843 86 6,479 81 5,567 19 1,089 Explosives, fuses, blasting caps 12,322 11,971 n.a. 9,437 Soap and toilet preparations 23,576 23,543 19,861 41,314
Allied products from other groups 105,259 109,697 99,407 96,225 Naval stores, gums, resins 48,360 53,123 48,031 47,759
Rosin, gum, and wood 235,452 30,148 243,896 31,101 342,856 30,649 355,691 30,889 Turpentine (1000 gal.) 5,282 754 3,811 1,474 6,549 5,816 5,180 4,586
Crude drugs, herbs, leaves, roots 3,850 3,806 4,345 3,265 6,109 4,349 Linseed oil 5,247 539 19,462 2,509 16,977 2,988 7,721 2,505 Essential oils 8,303 15,215 7,297 13,635 3,695 11,530 3,089 13,905 Sulfur, crude and refined (1000 L.T.) 1,554 37,295 1,596 36,624 1,307 33,593 1,349 27,707
Source: U.S. Department of Commerce
into early 1962, devaluation of the Canadian dollar, and an unfavorable investment climate affected exports. Until the Canadian industry attains a wider base, our exports there will not make big gains. The organic sector is
weak and the population is not large enough to sustain a broadly based industry producing and purchasing a very large range of chemicals,
The Latin American market still is unsatisfactory, despite an $11 mil
lion gain in exports to that area in 1962. The potential is much larger, but since 1959 trade has been stagnant. The hard currency lack was at its worst in 1962 in some countries. Mexico remained in first place, taking
76 C & E N S E P T . 2, 1963

U.S. IMPORTS OF CHEMICALS AND ALLIED PRODUCTS (Quantity in thousands of pounds unless otherwise noted; value in thousands of dollars)
1962 1961 1951 1947 Quantity Value Quantity Value Quantity Value Quantity Value
Grand total 571,781 541,386 521,191 285,509 Chemicals and related products 417,370 389,999 300,432 105,148
Coal tar products, total 78,320 76,297 53,791 11,514 Crude coal tar products, total 15,692 25,816 43,120 8,492
Dead or creosote oil (1000 gal.) 29,482 5,772 33,911 6,732 49,499 8,143 34,498 5,776 Benzene (1000 gal.) 22,997 4,928 19,355 5,476 68,540 25,115 1,055 161 Naphthalene 38,929 2,031 101,772 10,620 73,554 5,083 2,139 133
Intermediate coal tar products 26,787 26,186 20,385 18,594 8,722 2,574 2,224 592 Colors, dyes, and stains 5,650 16,728 5,253 15,159 3,368 6,982 809 2,188
Medicinal and pharmaceutical preparations, total 37,158 35,095 11,823 7,459
Menthol, synthetic and natural 1,601 7,227 1,474 9,100 733 7,223 368 2,629 Industrial chemicals, total 137,538 125,286 120,045 34,501
Acetic acid 2,049 138 7,034 461 42,499 2,164 10,598 583 Arsenic trioxide 31,516 1,077 38,966 1,422 29,037 1,582 27,880 1,145 Ethyl alcohol (1000 gal.) 4,513 1,012 19,910 4,229 125,044 60,217 21,501 14,840 Cobalt oxide 978 943 681 663 437 604 816 813 Glycerol, crude and refined6 11,577 1,094 8,475 2,326 17,643 6,858 3,646 1,557 Iodine, crude 3,026 2,841 3,017 2,852 852 1,320 2,261 2,757 Potassium compounds 20,935 2,773 14,023 1,940 29,344 3,502 6,458 588 Sodium carbonate, calcined 141 2 56,781 1,231 1,356 58 Sodium cyanide 19,728 2,492 18,060 2,377 137,832 6,428 83,432 3,329
Pigments, paints, and varnishes 16,145 15,276 5,326 1,553 Fertilizers and fertilizer materials 127,204 117,761 101,923 43,453
Ammonium sulfate (1000 tons) 241 6,780 243 8,159 216 9,491 114 4,149 Ammonium nitrate and mixtures (1000 tons) 338 15,680 249 12,617 343 18,757 99 5,024 Calcium cyanamide (1000 tons) 37 1,990 42 2,434 68 3,503 154 5,242 Sodium nitrate (1000 tons) 435 14,208 494 15,862 726 27,025 557 15,154 Ammonium phosphate (1000 tons) 84 4,972 113 7,471 135 8,451 105 5,203 Potash fertilizer materials (1000 tons) 613 19,052 438 14,296 560 15,041 48 1,888
Potassium chloride, crude (1000 tons) 463 13,170 332 10,053 493 12,697 35 1,321 Peat moss, fertilizer grade (1000 tons) 261 12,448 244 12,620 114 3,722 46 1,450
Explosives, fireworks, and ammunition 6,810 6,009 1,677 1,935 Soap and toilet preparations 14,195 14,275 5,847 4,733
Allied products 154,411 151,387 220,759 180,361 Casein and lactarene 95,576 17,284 101,827 18,063 43,386 13,575 20,887 6,240 Lac, crude, seed, button, and stick 25,462 3,361 20,668 4,177 25,453 8,286 19,062 6,883 Shellac, bleached and unbleached 6,215 1,772 6,259 2,086 18,119 8,051 21,636 10,546 Chicle, crude 5,711 4,399 6,311 4,436 5,926 3,531 13,761 11,839 Gums and resins, n.e.s. 99,711 19,009 88,457 16,457 70,215 13,976 61,857 13,039 Drugs, herbs, leaves, roots, etc. 20,274 21,683 30,914 29,159
Pyrethrum or insect flowers 2,061 772 4,116 1,606 5,886 2,517 8,082 2,399 Licorice root, crude 38,359 1,477 43,219 1,723 40,947 1,371 55,922 2,530 Opium, crude 292 2,122 408 2,640 763 5,319 386 3,541
Tung oil 21,219 6,707 26,894 6,091 29,706 9,421 121,564 35,358 Coconut, palm, babassu-nut, and castor oils,
inedible 409,705 41,050 337,387 35,831 334,195 57,779 95,113 15,762 Vegetable waxes, total 14,661 6,778 17,634 10,008 24,921 20,082 23,737 18,082
Carnauba 9,623 4,702 12,750 7,783 16,016 14,874 11,836 13,653 Essential and distilled oils 22,624 20,560 23,069 12,962 Dyeing and tanning materials 11,153 11,673 32,075 20,491
Quebracho extract 92,278 5,479 109,662 5,612 273,158 23,173 215,548 15,387
« Imports for consumption. b Crude only for 1962. Source: U.S. Department of Commerce
$6.3 million more after a $6 million drop in 1961. An economy operating
at high levels and an expanding chem
ical industry ofiFer good prospects for 1963. Exports to Brazil were up, but the political situation, inflation, and
reduced foreign investment cloud the outlook. Our exports to Argentina
decreased $4 million, affected by exchange and other economic problems.
Exports to Venezuela and Colombia also were down, and restrictions hurt
sales to Chile.
Exports to the Far East were up only $2 million, owing principally to a steep drop of $24 million in ship
ments to Japan, our second largest
single customer. Japanese government policies to brake the booming economy were a large factor in the
decrease, which was greatest in spe
cialties. A $9 million increase to India helped to offset the loss to Japan. Renewed pressure on exchange and a
commodity situation which lends itself to bilateral trade affect exports to
India. Korea took substantially more,
largely because of a $12 million in
crease in fertilizer shipments made
under the Agency for International De
velopment. Exports to Pakistan were
double the 1961 figure, but those to
the Philippines were down $6 million.
Africa increased its purchases $6
million, the Republic of South Africa
accounting for $2 million of the in
crease, which was mostly in the
specialties group. Egypt also bought
more in that group, especially pesti-
S E P T . 2, 1963 C & E N 77
cides. Results in other African areas fell short of expectations, but exports to many of them did increase. The African market needs more vigorous promotion, particularly in new products. Australia took $9 million more than in 1961, mainly in medicinals and industrial chemicals. Demand for chemical raw materials and intermediates is growing. The Near East upped its chemical purchases $8 million in 1962, following a $9 million gain in 1961. This also is an area which needs greater attention.
As in 1961, exports grew to smaller and developing countries. Some of the increases were small, but the trend was upward and world-wide despite some losses, especially in Southeast Asia. Industry in developing countries is minimal, which holds back trade, but these areas are gaining buying power and beginning manufacture in chemical-consuming industries so that exports to them will trend upward, although not rapidly.
There were sizable increases in exports to Greece, whose chemical industry is slated for considerable expansion, and to Spain, where liberalizing influences in the economy open up
new opportunities. Turkey also is beginning an upturn, and chemical exports were up $4.2 million.
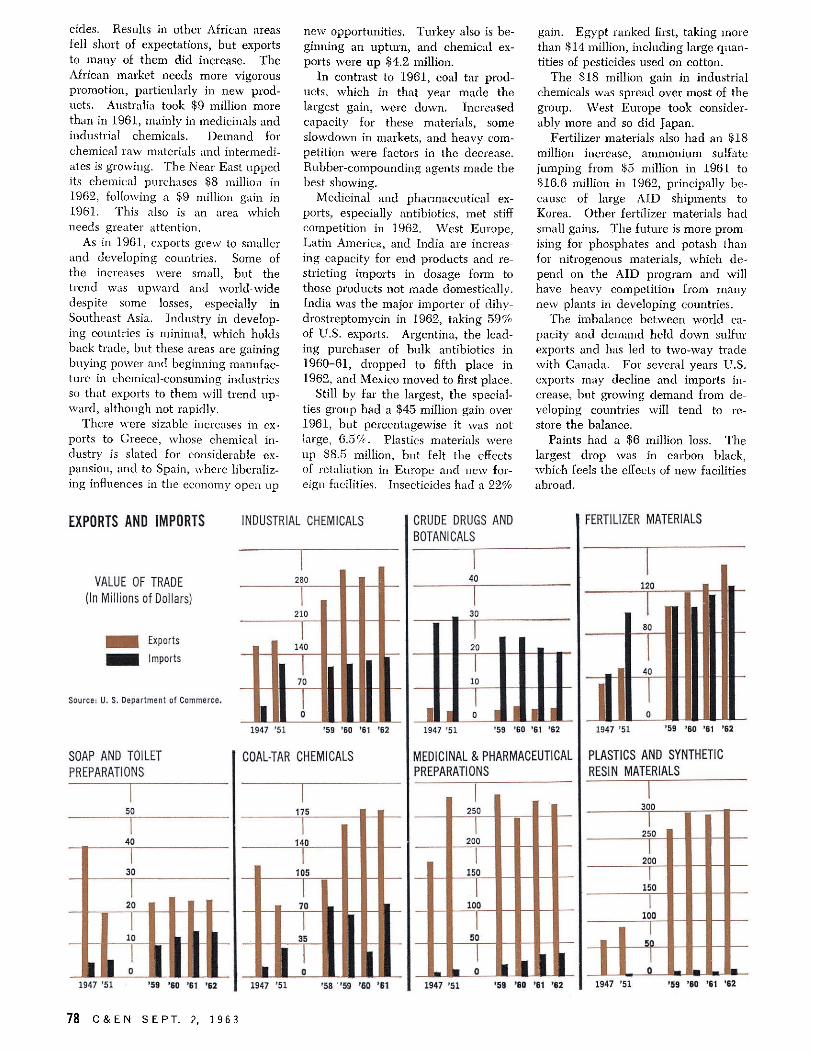
In contrast to 1961, coal tar products, which in that year made the largest gain, were down. Increased capacity for these materials, some slowdown in markets, and heavy competition were factors in the decrease. Rubber-compounding agents made the best showing.
Medicinal and pharmaceutical exports, especially antibiotics, met stiff competition in 1962. West Europe, Latin America, and India are increasing capacity for end products and restricting imports in dosage form to those products not made domestically. India was the major importer of dihy-drostreptomycin in 1962, taking 59% of U.S. exports. Argentina, the leading purchaser of bulk antibiotics in 1960-61, dropped to fifth place in 1962, and Mexico moved to first place.
Still by far the largest, the specialties group had a $45 million gain over 1961, but percentagewise it was not large, 6.5%. Plastics materials were up $8.5 million, but felt the effects of retaliation in Europe and new foreign facilities. Insecticides had a 22%
gain. Egypt ranked first, taking more than $14 million, including large quantities of pesticides used on cotton.
The $18 million gain in industrial chemicals was spread over most of the group. West Europe took considerably more and so did Japan.
Fertilizer materials also had an $18 million increase, ammonium sulfate jumping from $5 million in 1961 to $16.6 million in 1962, principally because of large AID shipments to Korea. Other fertilizer materials had small gains. The future is more promising for phosphates and potash than for nitrogenous materials, which depend on the AID program and will have heavy competition from many new plants in developing countries.
The imbalance between world capacity and demand held down sulfur exports and has led to two-way trade with Canada. For several years U.S. exports may decline and imports increase, but growing demand from developing countries will tend to restore the balance.
Paints had a $6 million loss. The largest drop was in carbon black, which feels the effects of new facilities abroad.
EXPORTS AND IMPORTS
VALUE OF TRADE (In Millions of Dollars)
Exports
Imports
Source: U. S. Department of Commerce.
SOAP AND TOILET PREPARATIONS
INDUSTRIAL CHEMICALS
280 1 1 | 1 210 J 1
ι i 4 ° 1 1 1 1 1 III 1 1
1947 '51 '59 »60 '61 '62
1947 '51 '59 '60 '61 '62
COAL-TAR CHEMICALS
1947 '51 '58 '59 '60 '61
CRUDE DRUGS AND BOTANICALS
40
1947 '51 '59 '60 '61 '62
MEDICINAL & PHARMACEUTICAL PREPARATIONS
1947 '51 »59 »60 '61 '62
FERTILIZER MATERIALS
1947 '51 '59 '60 '61 '62
PLASTICS AND SYNTHETIC RESIN MATERIALS
I 300 I
250 |
1 200 1 1
150 1 1 100
• 1 5P JJJJ 1947 '51 '59 '60 '61 '62
78 C & E N S E P T . 2, 1963
CHEMICAL
NEWS Allied Chemical
d e v e l o p m e n t a l c h e m i c a l s ^ ^
p o i n t t o i m p r o v e d
c o a t i n g s , p h a r m a c e u t i c a l s ,
d y e s , d e t e r g e n t s a n d r e s i n s .
from

D e t e r m i n i n g t h e s p e c t r a
o f f I uo r o k e t o nes .
A l l i e d C h e m i c a l ' s
d i v e r s i f i e d r e s e a r c h
p r o g r a m . . . a t b o t h
i t s c e n t r a l a n d
d i v i s i o n l a b o r a t o r i e s
. . . is c o n s t a n t l y
d e v e l o p i n g n e w
c o m p o u n d s a n d
e x p l o r i n g t h e i r
p o t e n t i a l i t i e s . S o m e
e x a m p l e s a r e
d e s c r i b e d on t h e
f o l l o w i n g p a g e s .
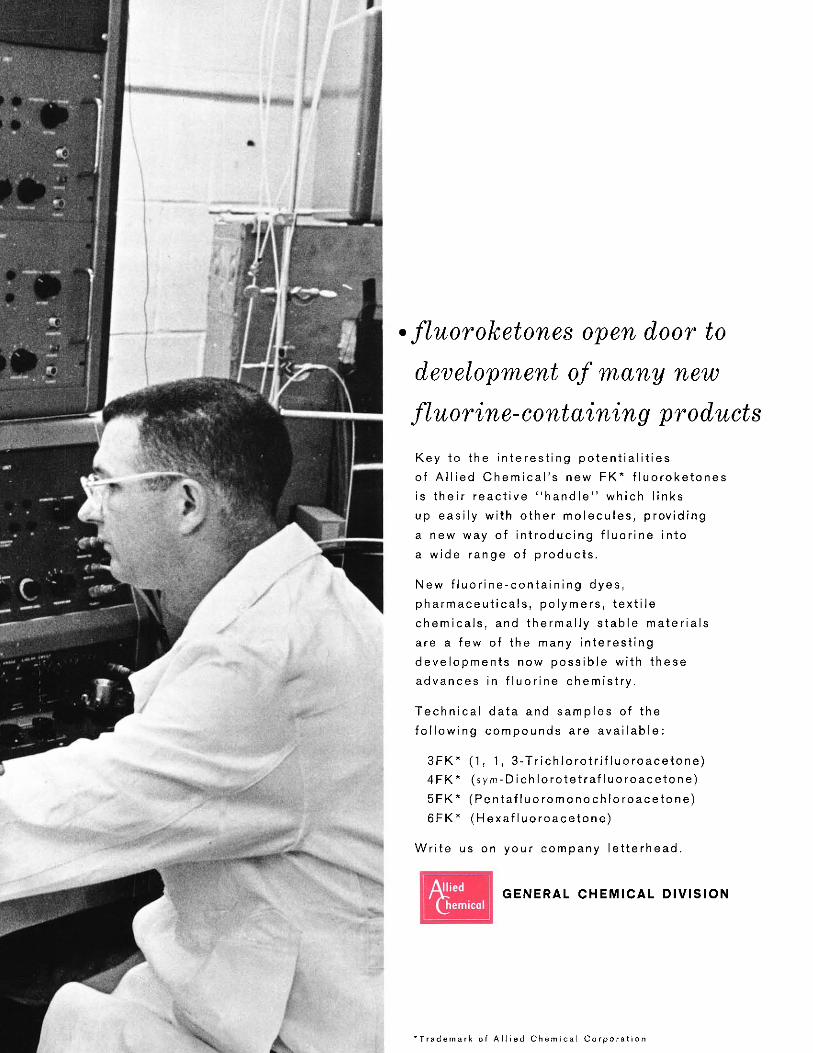
• fluoroketones open door to
development of many new
fluorine-containing products Key to the i n te res t i ng p o t e n t i a l i t i e s
of A l l i e d Chemica l ' s new FK* f l u o r o k e t o n e s
is the i r reac t i ve ' ' h a n d l e " which l inks
up easi ly w i th o ther mo lecu les , p rov id ing
a new way of i n t r oduc ing f l uo r i ne into
a wide range of p roduc t s .
New f l u o r i n e - c o n t a i n i n g dyes,
pha rmaceu t i ca l s , po lymers , t ex t i l e
chemica ls , and the rma l l y s tab le mater ia ls
are a few of the many i n te res t i ng
deve lopmen ts now poss ib le wi th these
advances in f l uo r ine chemis t ry .
Techn i ca l data and samples of the
f o l l ow ing compounds are ava i l ab l e :
3FK* ( 1 , 1, 3 - T r i c h l o r o t r i f l u o r o a c e t o n e )
4FK* ( sym-D ich lo ro te t ra f l uo roace tone )
5FK* ( P e n t a f l u o r o m o n o c h l o r o a c e t o n e )
6FK* (Hexa f l uo roace tone )
Wr i t e us on your company l e t t e r h e a d .
GENERAL CHEMICAL D I V I S I O N
" T r a d e m a r k o f A l l i e d C h e m i c a l C o r p o r a t i o n
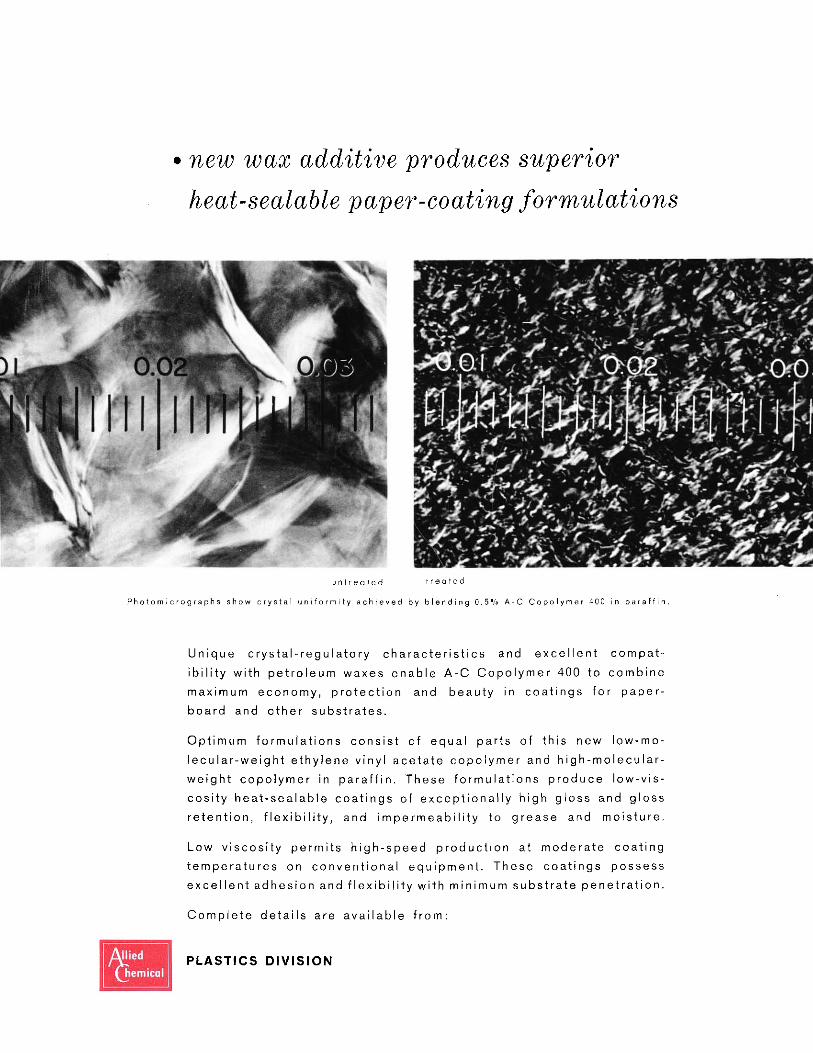
u n t r e a t e d t r e a t e d
P h o t o m i c r o g r a p h s s h o w c r y s t a l u n i f o r m i t y a c h i e v e d by b l e n d i n g 0 . 5 % A - C C o p o l y m e r 400 in p a r a f f i n .
U n i q u e c r y s t a l - r e g u l a t o r y c h a r a c t e r i s t i c s a n d e x c e l l e n t c o m p a t
i b i l i t y w i t h p e t r o l e u m w a x e s e n a b l e A - C C o p o l y m e r 400 t o c o m b i n e
m a x i m u m e c o n o m y , p r o t e c t i o n a n d b e a u t y in c o a t i n g s f o r p a p e r -
b o a r d a n d o t h e r s u b s t r a t e s .
O p t i m u m f o r m u l a t i o n s c o n s i s t o f e q u a l p a r t s o f t h i s n e w l o w - m o
l e c u l a r - w e i g h t e t h y l e n e v i n y l a c e t a t e c o p o l y m e r a n d h i g h - m o l e c u l a r -
w e i g h t c o p o l y m e r in p a r a f f i n . T h e s e f o r m u l a t i o n s p r o d u c e l o w - v i s
c o s i t y h e a t - s e a l a b l e c o a t i n g s o f e x c e p t i o n a l l y h i g h g l o s s a n d g l o s s
r e t e n t i o n , f l e x i b i l i t y , a n d i m p e r m e a b i l i t y t o g r e a s e a n d m o i s t u r e .
L o w v i s c o s i t y p e r m i t s h i g h - s p e e d p r o d u c t i o n a t m o d e r a t e c o a t i n g
t e m p e r a t u r e s on c o n v e n t i o n a l e q u i p m e n t . T h e s e c o a t i n g s p o s s e s s
e x c e l l e n t a d h e s i o n a n d f l e x i b i l i t y w i t h m i n i m u m s u b s t r a t e p e n e t r a t i o n .
C o m p l e t e d e t a i l s a r e a v a i l a b l e f r o m :
PLASTICS D I V I S I O N
• new wax additive produces superior
heat-sealable paper-coating formulations
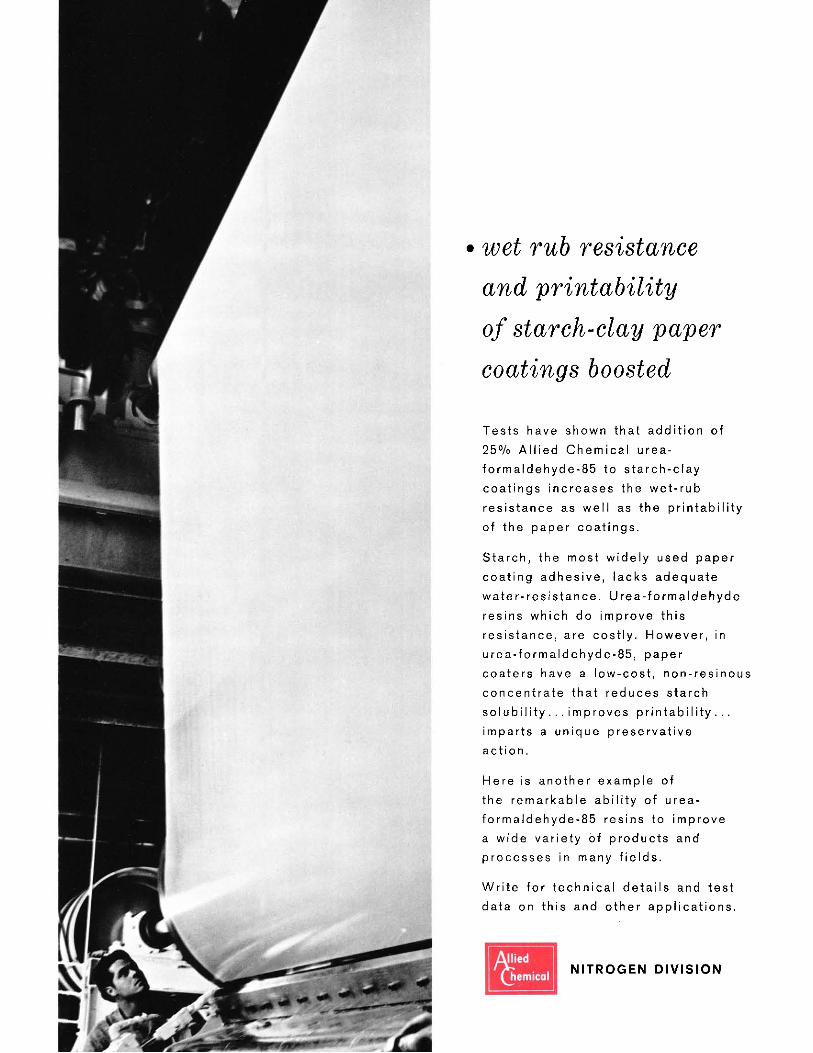
• wet rub resistance
and printability
of starch-clay paper
coatings boosted
Tests have shown that add i t i on of
25% A l l i ed Chemica l urea-
fo rma ldehyde-85 to s ta rch -c lay
coa t ings inc reases the we t - rub
res is tance as we l l as the p r i n tab i l i t y
of the paper coa t i ngs .
S ta rch , the most w ide ly used paper
coa t ing adhes ive , lacks adequate
w a t e r - r e s i s t a n c e . U rea - fo rma ldehyde
resins which do improve th is
res i s tance , are cos t l y . However , in
u rea - fo rma ldehyde-85 , paper
coa te rs have a low-cos t , non- res inous
concen t ra te that reduces s tarch
s o l u b i l i t y . . . improves p r i n t a b i l i t y . . .
impar ts a unique p rese rva t i ve
ac t i on .
Here is another example of
the remarkab le ab i l i t y of urea-
fo rma ldehyde-85 resins to improve
a wide var ie ty of p roduc ts and
p rocesses in many f i e l ds .
Wr i t e for t e c h n i c a l de ta i l s and tes t
data on th is and other a p p l i c a t i o n s .
N ITROGEN D I V I S I O N
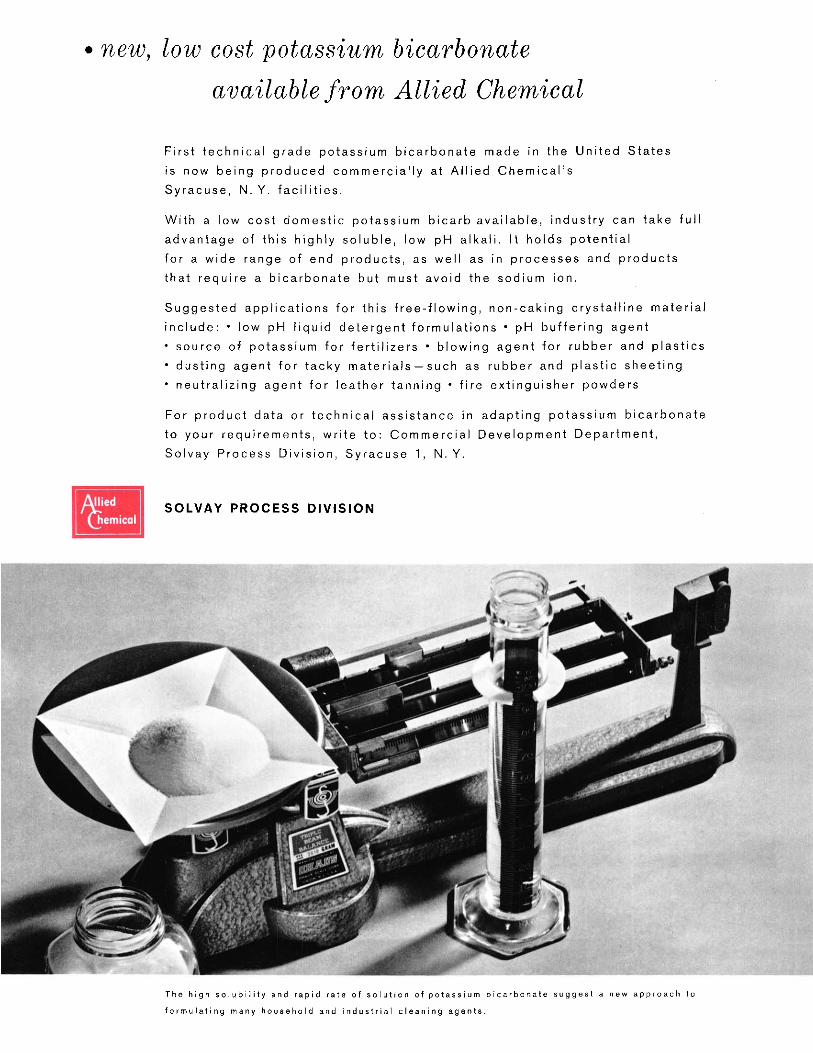
First t echn i ca l grade potass ium b i ca rbona te made in the Un i ted Sta tes
is now being p roduced commerc ia l l y at A l l i ed Chemica l ' s
Syracuse , N.Y. f a c i l i t i e s .
Wi th a low cost domest i c potass ium b ica rb ava i l ab le , indust ry can take fu l l
advantage of th is h igh ly so lub le , low pH a l ka l i . It ho lds po ten t i a l
for a wide range of end p roduc t s , as wel l as in p rocesses and p roduc ts
that requ i re a b i ca rbona te but must avoid the sodium ion.
Sugges ted app l i ca t i ons for th is f r e e - f l o w i n g , non-cak ing c rys ta l l i ne mater ia l
i n c l u d e : · low pH l iqu id de te rgen t f o rmu la t i ons · pH bu f fe r i ng agent
• source of potass ium for f e r t i l i ze r s · b low ing agent for rubber and p las t i cs
• dus t ing agent for tacky mater ia ls — such as rubber and p las t i c shee t ing
• neu t ra l i z ing agent for lea ther tann ing · f i re ex t i ngu isher powders
For p roduc t data or t echn i ca l ass is tance in adap t ing potass ium b i ca rbona te
to your requ i remen ts , wr i te t o : Commerc ia l Deve lopmen t Depar tmen t ,
Solvay Process D iv i s ion , Syracuse 1, N.Y.
SOLVAY PROCESS D I V I S I O N
T h e h i g h s o l u b i l i t y a n d r a p i d r a t e o f s o l u t i o n of p o t a s s i u m b i c a r b o n a t e s u g g e s t a new a p p r o a c h to
f o r m u l a t i n g m a n y h o u s e h o l d a n d i n d u s t r i a l c l e a n i n g a g e n t s .
• new, low cost potassium bicarbonate
available from Allied Chemical

• interested in the potentialities of
cyclohexanone as an intermediate?
T h e e v e r - i n c r e a s i n g i m p o r t a n c e
o f N A D O N E ® c y c l o h e x a n o n e as an
i n t e r m e d i a t e — as w e l l as a
s o l v e n t — is s t r e s s e d in an
a u t h o r i t a t i v e n e w s t u d y o f i t s
p r o p e r t i e s a n d p o t e n t i a l i t i e s ,
n o w on t h e p r e s s .
T h i s v e r s a t i l e c h e m i c a l p l a y s an
i m p o r t a n t p a r t in t h e p r e p a r a t i o n
o f m a n y s y n t h e t i c r e s i n s . O t h e r
a p p l i c a t i o n s as an i n t e r m e d i a t e
i n c l u d e : a d h e s i v e s , s u c h as
i n d u s t r i a l c e m e n t s b a s e d on
s y n t h e t i c r u b b e r ; p l a s t i c i z e r s ;
s t a b i l i z e r s t h a t i n h i b i t l i g h t a n d
h e a t d e c o m p o s i t i o n , a g i n g , e t c . ,
in r e s i n s a n d r u b b e r p r o d u c t s ;
i n s e c t i c i d e s , f u n g i c i d e s , a n d
h e r b i c i d e s ; d y e s ; p h a r m a c e u t i c a l s .
T h e c o m p l e t e l y r e v i s e d 6 4 - p a g e
b u l l e t i n d e s c r i b e s t h e s e a n d
a h o s t of o t h e r i n t e r e s t i n g
a p p l i c a t i o n s in c o n s i d e r a b l e d e t a i l
— g i v e s c o m p l e t e p r o p e r t y a n d
r e a c t i o n d a t a , a n d o t h e r t e c h n i c a l
i n f o r m a t i o n on N A D O N E
c y c l o h e x a n o n e . P l e a s e r e q u e s t
y o u r c o p y on c o m p a n y l e t t e r h e a d .
N A T I O N A L A N I L I N E D I V I S I O N

m principal products for industry: BARRETT D I V I S I O N - B u i l d i n g M a t e r i a l s : ce i l i ng t i l e ,
gypsum, i nsu la t i on , p ro tec t i ve coa t ings , roo f ing and
roof i nsu la t ions , shea th ing , s i d i ng , ure thane insu la
t i ons , v iny l bu i l d ing pane ls ; Pav ing M a t e r i a l s : b i t um i
nous conc re te , pav ing sea le rs , road tars and aspha l ts ,
s tone , sand and grave l agg rega tes , u re thane expan
sion j o i n t .
G E N E R A L C H E M I C A L Dl V I S I ON - su l fu r i c and other
commerc ia l ac ids , a lums, phospha tes , f l uo r i ne and so
dium compounds ; BAKER & A D A M S O N reagents and
f ine c h e m i c a l s ; GENETRON re f r i ge ran t s , aeroso l p ro-
pe l l an ts , u re thane foam b low ing agen ts ; GENESOLV
so l ven ts ; ACLAR and CAPRAN spec ia l t y f i l m s ; ag r i
cu l tu ra l i n s e c t i c i d e s , weed k i l l e rs and s p e c i a l t i e s .
BASIC TO AMERICA'S PROGRESS
For more information, write Allied Chemical Corporation, 61 Broadway, New York 6, N.Y.
I N T E R N A T I O N A L D I V I S I O N - se l l i ng A l l i e d Chemica l
p roduc ts for expor t marke ts .
NAT IONAL A N I L I N E D I V I S I O N - NAT IONAL dyes, cer
t i f i e d co lo rs , b i o l o g i c a l s ta ins and i nd i ca to r s , o rgan ic
chemica ls , i n t e rmed ia tes , pha rmaceu t i ca l chemica l s ,
N A C C O N O L de te rgen t s , N A C C O N A T E d i i socyana tes ,
A C T O L po lye the rs for u re thanes , CAPROLAN nylon
f i be r , HARMON COLORS (organ ic p igments ) .
N ITROGEN D I V I S I O N - A R C A D I A N f e r t i l i z e r s , n i t rogen
so lu t i ons , PROCADIAN feed mix tu res , ammonia, urea,
e t h y l e n e o x i d e , e t h y l e n e and p o l y e t h y l e n e g l y c o l s ,
e thano lamines , me lamines .
In Canada: Allied Chemical Canada, Ltd., 1155 Dorchester Boulevard West, Montreal 2, Quebec.
Inquiries from abroad: Allied Chemical International, J+0 Rector St., New York 6, N.Y.
P L A S T I C S D I V I S I O N - c o a l - t a r chem ica l s ; PLASKON
mold ing compounds , f l u o r o c a r b o n , i ndus t r ia l and coat
ing res ins ; A-C p o l y e t h y l e n e ; indus t r ia l tar p roduc ts ,
including creosote oils, pitches, coatings, pipeline enamels.
SEMET-SOLVAY D I V I S I O N - c o k e and by-products; VVÎL-
PUTTE by -p roduc t coke ovens and coal chemica ls p lants
and eng inee r i ng se rv i ces .
SOLVAY PROCESS D I V I S I O N - soda ash, caus t ic soda,
potass ium ca rbona te , potass ium b i ca rbona te , caus t ic
po tash , ch lo r i ne , ch lo romethanes and benzenes, hydro
gen p e r o x i d e ; ca l c ium, a luminum, ammonium c h l o r i d e s ;
c lean ing compounds ; v iny l c h l o r i d e ; MUTUAL chro
mâtes.
UNION TEXAS PETROLEUM D I V I S I O N - c rude o i l , na tu
ral gas, natura l gas condensa te , e thane, p ropane , bu
tanes, natura l gaso l i ne , pe t r ochem ica l feed s tocks .
I t e m s a b o v e a p p e a r i n g in l i g h t f a c e c a p i t a l l e t t e r s a re A l l i e d C h e m i c a l r e g i s t e r e d t r a d e m a r k s . P r i n t e d in U. S. A .
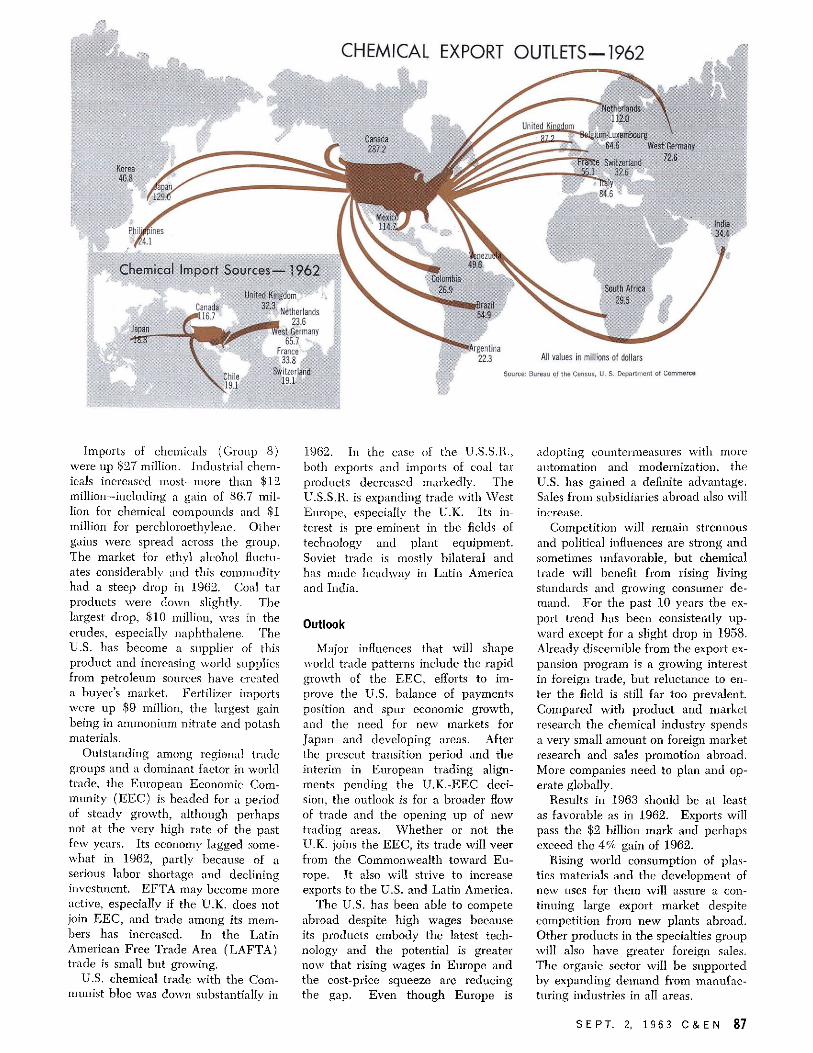
CHEMICAL EXPORT OUTLETS-1962
Chemical Import Sources—1962
United Kingdom
***' Netherlands 23.6
est-Germany 65.7
France 33.8
Switzerland 19.1
'Argentina 22.3 All values in millions of dollars
Source: Bureau of the Census, U. S. Department of Commerce
Imports of chemicals (Group 8) were up $27 million. Industrial chemicals increased most—more than $12 million—including a gain of $6.7 million for chemical compounds and $1 million for perchloroethylene. Other gains were spread across the group. The market for ethyl alcohol fluctuates considerably and this commodity had a steep drop in 1962. Coal tar products were down slightly. The largest drop, $10 million, was in the crudes, especially naphthalene. The U.S. has become a supplier of this product and increasing world supplies from petroleum sources have created a buyer's market. Fertilizer imports were up $9 million, the largest gain being in ammonium nitrate and potash materials.
Outstanding among regional trade groups and a dominant factor in world trade, the European Economic Community (EEC) is headed for a period of steady growth, although perhaps not at the very high rate of the past few years. Its economy lagged somewhat in 1962, partly because of a serious labor shortage and declining investment. EFTA may become more active, especially if the U.K. does not join EEC, and trade among its members has increased. In the Latin American Free Trade Area (LAFTA) trade is small but growing.
U.S. chemical trade with the Communist bloc was down substantially in
1962. In the case of the U.S.S.R., both exports and imports of coal tar products decreased markedly. The U.S.S.R. is expanding trade with West Europe, especially the U.K. Its interest is pre-eminent in the fields of technology and plant equipment. Soviet trade is mostly bilateral and has made headway in Latin America and India.
Outlook
Major influences that will shape world trade patterns include the rapid growth of the EEC, efforts to improve the U.S. balance of payments position and spur economic growth, and the need for new markets for Japan and developing areas. After the present transition period and the interim in European trading alignments pending the U.K.-EEC decision, the outlook is for a broader flow of trade and the opening up of new trading areas. Whether or not the U.K. joins the EEC, its trade will veer from the Commonwealth toward Europe. It also will strive to increase exports to the U.S. and Latin America.
The U.S. has been able to compete abroad despite high wages because its products embody the latest technology and the potential is greater now that rising wages in Europe and the cost-price squeeze are reducing the gap. Even though Europe is
adopting countermeasures with more automation and modernization, the U.S. has gained a definite advantage. Sales from subsidiaries abroad also will increase.
Competition will remain strenuous and political influences are strong and sometimes unfavorable, but chemical trade will benefit from rising living standards and growing consumer demand. For the past 10 years the export trend has been consistently upward except for a slight drop in 1958. Already discernible from the export expansion program is a growing interest in foreign trade, but reluctance to enter the field is still far too prevalent. Compared with product and market research the chemical industry spends a very small amount on foreign market research and sales promotion abroad. More companies need to plan and operate globally.
Results in 1963 should be at least as favorable as in 1962. Exports will pass the $2 billion mark and perhaps exceed the 4% gain of 1962.
Rising world consumption of plastics materials and the development of new uses for them will assure a continuing large export market despite competition from new plants abroad. Other products in the specialties group will also have greater foreign sales. The organic sector will be supported by expanding demand from manufacturing industries in all areas.
S E P T . 2, 1963 C & E N 87
COAL TAR IMPORTS
COAL TAR PRODUCT IMPORTS INCREASE Quantity was higher, and value was 2 .1% greater in 1962
DANIEL F. MCCARTHY, Senior Commodity Analyst, Chemical Division, U.S. Tariff Commission, Washington, D.C.
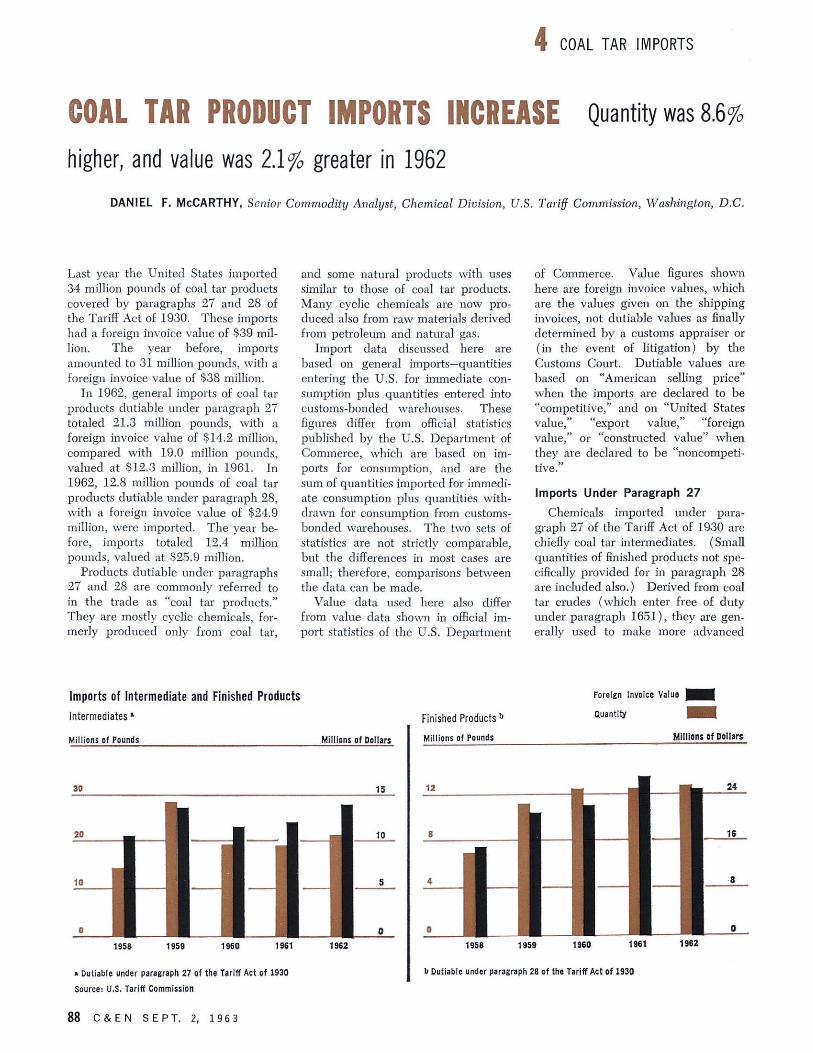
Last year the United States imported 34 million pounds of coal tar products covered by paragraphs 27 and 28 of the Tariff Act of 1930. These imports had a foreign invoice value of $39 million. The year before, imports amounted to 31 million pounds, with a foreign invoice value of $38 million.
In 1962, general imports of coal tar products dutiable under paragraph 27 totaled 21.3 million pounds, with a foreign invoice value of $14.2 million, compared with 19.0 million pounds, valued at $12.3 million, in 1961. In 1962, 12.8 million pounds of coal tar products dutiable under paragraph 28, with a foreign invoice value of $24.9 million, were imported. The year before, imports totaled 12.4 million pounds, valued at $25.9 million.
Products dutiable under paragraphs 27 and 28 are commonly referred to in the trade as "coal tar products." They are mostly cyclic chemicals, formerly produced only from coal tar,
and some natural products with uses similar to those of coal tar products. Many cyclic chemicals are now produced also from raw materials derived from petroleum and natural gas.
Import data discussed here are based on general imports—quantities entering the U.S. for immediate consumption plus quantities entered into customs-bonded warehouses. These figures differ from official statistics published by the U.S. Department of Commerce, which are based on imports for consumption, and are the sum of quantities imported for immediate consumption plus quantities withdrawn for consumption from customs-bonded warehouses. The two sets of statistics are not strictly comparable, but the differences in most cases are small; therefore, comparisons between the data can be made.
Value data used here also differ from value data shown in official import statistics of the U.S. Department
of Commerce. Value figures shown here are foreign invoice values, which are the values given on the shipping invoices, not dutiable values as finally determined by a customs appraiser or (in the event of litigation) by the Customs Court. Dutiable values are based on "American selling price" when the imports are declared to be "competitive," and on "United States value," "export value," "foreign value," or "constructed value" when they are declared to be "noncompetitive."
Imports Under Paragraph 27
Chemicals imported under paragraph 27 of the Tariff Act of 1930 are chiefly coal tar intermediates. (Small quantities of finished products not specifically provided for in paragraph 28 are included also.) Derived from coal tar crudes (which enter free of duty under paragraph 1651), they are generally used to make more advanced
Imports of Intermediate and Finished Products Intermediates*
Millions of Pounds Millions of Dollars
33 15
1958 1959 1960 1961 1962
* Dutiable under paragraph 27 of the Tariff Act of 1930
Source: U.S. Tariff Commission
Finished Products b
Millions of Pounds
Foreign Invoice Value |
Quantity Β
Millions of Dollars
1958 1959 1960 1961
b Dutiable under paragraph 28 of the Tariff Act of 1930
1962
88 C & E N S E P T . 2, 1963
8.6%
4

products. The small quantities of finished products that enter under paragraph 27 include such items as coal tar insecticides and fungicides, surface-active agents, rubber-processing chemicals, moth and mosquito repellents, plant hormones, flotation reagents, and seed disinfectants.
In 1962, imports of competitive products dutiable under paragraph 27 totaled 15.9 million pounds, with a foreign invoice value of $9.0 million, or 75% of the total quantity of imports under paragraph 27, and 63% of the total value. Noncompetitive imports (duty based chiefly on "Foreign or Export Value") totaled 5.3 million pounds, with a foreign invoice value of $5.2 million. The competitive status of 53,000 pounds of intermediates is not available.
In quantity, about 54% of all intermediates imported in 1962 came from West Germany. Imports from West Germany in that year totaled 11.5 million pounds, compared with 8.5 million pounds imported in 1961, and 7.6 million pounds imported in 1960.
In 1962, imports from the United Kingdom amounted to 3.0 million pounds compared with 2.1 million pounds in 1961. Imports from Switzerland totaled 1.9 million pounds in 1962, about the same as the amount imported in 1961. Imports from Japan amounted to 1.6 million pounds in 1962, or about 36% less than 1961?s 2.6 million pounds.
Imports of products dutiable under paragraph 27 increased approximately 12% in quantity and 15% in value in 1962 compared with 1961. The most important individual intermediates imported in 1962 were caprolactam, phthalic anhydride, refined anthracene, adipic acid, and acetoacetanilide. In
Ί 9 6 2 , imports of caprolactam, which totaled 1.4 million pounds, all came from West Germany. Imports of phthalic anhydride, which came from Japan, Italy, West Germany, and France, totaled 1.1 million pounds. Imports of refined anthracene, which came from West Germany and Switzerland, totaled 1.0 million pounds. Imports of adipic acid, all of which came from West Germany, totaled 985,000 pounds. Acetoacetanilide imports, 718,000 pounds, came from the United Kingdom, Switzerland, and West Germany.
Among the other important individual chemicals imported: 2,4-Toluyl-enediamine came from West Germany;
U.S. IMPORTS—Products Dutiable Under Paragraph 27,1961 and 1962
Caprolactam Phthalic anhydride
Anthracene, refined
Adipic acid Pesticides and other organic
agricultural chemicals
Textile assistants, total
Acetoacetanilide
2,4-Toluylenediamine H-acid
Gamma acid
All other intermediates"
1961 1962
Quantity Quantity (1000 (1000 Principal Sources
pounds) pounds)
0 1,425 West Germany 4,887 1,141 Japan, Italy, West Ger
many, Switzerland 45 1,041 West Germany, Switzer
land 496 985 West Germany
722 946 Denmark, France, West Germany
643 796 West Germany, Switzerland, United Kingdom
745 718 United Kingdom, Switzerland, West Germany
226 661 West Germany 235 496 West Germany, Nether
lands, Italy 393 442 Italy, West Germany,
Netherlands 10,637 12,650 Various
Total—quantity Total—foreign invoice value
(in thousands of dollars)
1961
19,029 1962
21,300
$12,339 $14,193
Changes in 1962 from 1961
+11.9%
+15.0% α Includes surface-active agents, fuel-oil additives, rust inhibitors, ultraviolet light absorbers,
and miscellaneous chemicals. Source: Compiled by the U.S. Tariff Commission from the records of the U.S. Bureau of Cus
toms
U.S. IMPORTS—Coal Tar Intermediates and Finished Coal Tar Products 1960 1961 1962
Foreign Foreign Foreign Product Quantity Invoice
Value Quantity Invoice Value Quantity invoice
Value
ÏÔÔÔ 1000 1000 1000 ÏÔÔÔ 1000 pounds dollars pounds dollars pounds dollars
Intermediates" 19,806 11,491 19,029 12,339 21,300 14,193 Finished coal tar products,
total 12,299 22,209 12,393 25,950 12,823 24,908 Dyes, total 4,053 7,619 5,152 11,060 5,416 10,997
Acid 1,135 2,471 1,314 2,938 1,545 3,227 Azoic compositions 11 20 5 12 5 9 Basic 379 599 439 812 403 831 Direct 769 1,692 771 1,640 1,014 2,254 Disperse 124 312 177 403 183 426 Fiber-reactive 265 736 1,003 2,716 373 1,004 Fluorescent brighten
ing agents 296 454 424 936 439 1,183 Ingrain 6 20 20 125 5 26 Mordant 194 336 112 238 241 489 Solvent 28 82 55 172 85 253 Sulfur 11 8 4 3 319 296 Vat 809 874 702 845 769 970 All other 26 17 127 220 • 36 30
Synthetic organic pigments (Toners and lakes) 203 561 278 802 402 1,058
Medicinals and pharmaceuticals 2,106 10,350 2,579 10,885 2,988 8,839
Flavor and perfume materials 749 1,226 779 1,339 1,368 2,206
All other 5,118 2,452 3,606 1,863 1 2,649 1,809 a Includes small quantities of organic pesticides and agricultural chemicals, rubber-processing
chemicals, and surface-active agents. Source: Compiled by the U.S. Tariff Commission from the records of the U.S. Bureau of Cus
toms
S E P T . 2, 1963 C & E N 89
Η-acid came from West Germany, the Netherlands, and Italy; and gamma acid from Italy, West Germany, and the Netherlands.
Imports Under Paragraph 28
All the chemicals provided for in paragraph 28 of the Tariff Act of 1930 are "finished" coal tar products derived chiefly from coal tar crudes and intermediates. They include dyes, synthetic organic pigments, medici-nals and pharmaceuticals, flavor and perfume materials, synthetic resins, explosives, photographic chemicals, and synthetic tanning materials. In 1962, two groups of products accounted for 79% of the total value of imports under paragraph 28: coal tar dyes, 44%; coal tar medicinals and pharmaceuticals, 35%.
Imports in 1962 of all finished coal tar products that are dutiable under paragraph 28 comprised 1903 items with a total weight of 12.8 million pounds and a foreign invoice value of $24.9 million. In 1961, 2027 items were imported with a total weight of 12.4 million pounds and a foreign invoice value of $25.9 million. In 1960, imports of 1770 items had a total weight of 12.3 million pounds and a foreign invoice value of $22.2 million.
Coal Tar Dyes
Imports of coal tar dyes were 5.1% larger in 1962 than in 1961, and 33.6% larger than in 1960. In 1962, imports of dyes (excluding synthetic organic pigments) were valued at $11.0 million (foreign invoice value), or 44% of the total imports under paragraph 28. Imports of dyes (excluding synthetic organic pigments) in 1961 were valued at $11.1 million, or 42.6% of total imports under paragraph 28. About two thirds of last year's imports of coal tar dyes were noncompetitive.
The total weight of coal tar dyes imported last year into the U.S. (excluding synthetic organic pigments) was 5.4 million pounds, valued at $11.0 million (foreign invoice value). The year before, imports totaled 5.2 million pounds, valued at $11.1 million. Thus imports increased 5.1% in quantity but decreased 0.6% in value in 1962 compared with 1961.
Four classes of dyes accounted for about 70% of all the coal tar dyes imported in 1962. Imports of acid dyes in 1962 totaled 1.5 million pounds, valued at $3.2 million, compared with 1.3 million pounds, valued
at $2.9 million, in 1961. Imports of direct dyes in 1962 totaled 1.0 million pounds, valued at $2.3 million, compared with 771,000 pounds, valued at $1.6 million, in 1961. Imports of vat dyes in 1962 totaled 769,000 pounds, valued at $970,000, compared with 702,000 pounds, valued at $845,000, in 1961. Imports of fluorescent brightening agents in 1962 amounted to 439,000 pounds, valued at $1.2 million, compared with 424,000 pounds, valued at $936,000, in 1961.
Of the remaining important classes of dyes, imports in 1962 of basic dyes totaled 403,000 pounds, or 7.4% of all dyes imported that year. Imports of sulfur dyes amounted to 319,000 pounds (5.9% of total dye imports); imports of fiber-reactive dyes amounted to 373,000 pounds (6.9% of total dye imports ) .
Imports of coal tar medicinals and pharmaceuticals, the next most important group of products entered under paragraph 28, of 3.0 million pounds in 1962 had a foreign invoice value of $8.8 million. Imports in 1961 totaled 2.6 million pounds, valued at $10.9 million. Imports of 2.1 million pounds in 1960 were valued at $10.4 million. Of the 219 items imported in 1962, 113 were "noncompetitive" (duty based on foreign or export value); 26 were "noncompetitive" (duty based on "United States value"); and 76 were "competitive" (duty based on "American selling price"). The competitive status of four items is not available. In terms of quantity, competitive imports accounted for 82.9% of the total quantity of medicinals and pharmaceuticals imported in 1962 but only for 34.4% of the total value.
Principal sources of U.S. imports of coal tar medicinals and pharmaceuticals in 1962 were: West Germany, 900,000 pounds; Poland, 468,-000 pounds; Switzerland, 354,000 pounds; Italy, 323,000 pounds; the United Kingdom, 220,000 pounds; Sweden, 219,000 pounds; Denmark, 185,000 pounds; and France, 164,000 pounds.
Last year, imports of synthetic organic pigments totaled 402,000 pounds, with a foreign invoice value of $1.1 million; in 1961, imports of 278,000 pounds had a foreign invoice value of $802,000.
Of the 147 items imported in 1962, 104 were "noncompetitive" (duty based on "United States value"); 3 were "noncompetitive" (duty based
on foreign or export value); and 29 were "competitive" (duty based on "American selling price"). Competitive imports accounted for only 29.5% of the quantity and 39.0% of the value of all pigments imported into this country.
Imports of coal tar flavor and perfume materials that entered under paragraph 28 in 1962 consisted chiefly of competitive items ( duty on "American selling price"); they totaled 1.4 million pounds, with a foreign invoice value of $2.2 million. Imports in 1961 amounted to 779,000 pounds, valued at $1.3 million; in 1960, imports of 749,000 pounds were valued at $1.2 million.
In terms of quantity, Canada, Japan, the United Kingdom, and the Netherlands were the countries in which most of the U.S. imports of materials of this category originated. Smaller quantities came from France, Switzerland, Korea, and West Germany.
Miscellaneous Finished Coal Tar Products
Imports in 1962 of miscellaneous finished coal tar products that entered under paragraph 28 consisted principally of noncompetitive items and totaled 2.6 million pounds, valued at $1.8 million (foreign invoice value). Imports in 1961 amounted to 3.6 million pounds, valued at $1.9 million.
In 1962, as in earlier years, the synthetic resins were the most important class of items in this group. Imports of synthetic resins amounted to 2.2 million pounds in 1962, compared with 2.5 million pounds in 1961. West Germany, France, and Canada were the principal sources of imports in 1962; smaller quantities came from the United Kingdom, Switzerland, the Netherlands, Italy, Japan, and Belgium. In terms of quantity, 44.4% of synthetic resins imported in 1962 were "competitive" (duty based on "American selling price").
In 1962, imports of polyamide resins, some of which are "competitive," amounted to 1.0 million pounds. Imports of photographic chemicals amounted to 204,000 pounds, compared with 178,000 pounds in 1961. Imports of photographic chemicals in 1962 were primarily "noncompetitive"; Belgium and West Germany were by far the principal suppliers of these chemicals.
90 C&EN SEPT. 2, 1963