3. construction scheduling file(pert). –line of balance (lob). scheduling tools. ٣ ٥...
TRANSCRIPT
١
Dr. Khaled HyariDepartment of Civil Engineering
Hashemite University
3. Construction Scheduling
Construction Project Management (CE 110401346)
• There is a significant difference between “planning” and “scheduling”– The planning portion of a construction project
relates to developing the logic of how a project will be constructed
– Scheduling consists of integrating thatplan with a calendar or specific time frame
– Scheduling consists of determining the time needed for each of the planned tasks and the overall length of the project schedule
• Scheduling can never be performed effectively without planning
Planning and Scheduling I

٢
• What is Project Scheduling?– Scheduling: Planning + Time– Project Schedule: the planned dates for performing
schedule activities and the planned dates for meeting schedule milestones
• It Establishes:– Project duration & finish time.– Activity start & finish times.– Activity floats.– Critical activities.– Used in resource scheduling.
Project Scheduling: What?
• Scheduling Tools:
– Bar Chart.
– Critical Path Method (CPM).
– Precedence Diagram Method (PDM).
– Program Evaluation & Review Technique (PERT).
– Line of Balance (LOB).
Scheduling Tools

٣
٥
• Developed early in the 1900s (Henry Gantt) • Advantages:
– Easily read and understood.– Effective communication between engineer &
foreman.– Useful in identifying required resources.
Bar Charts I
Bar Charts II
٤
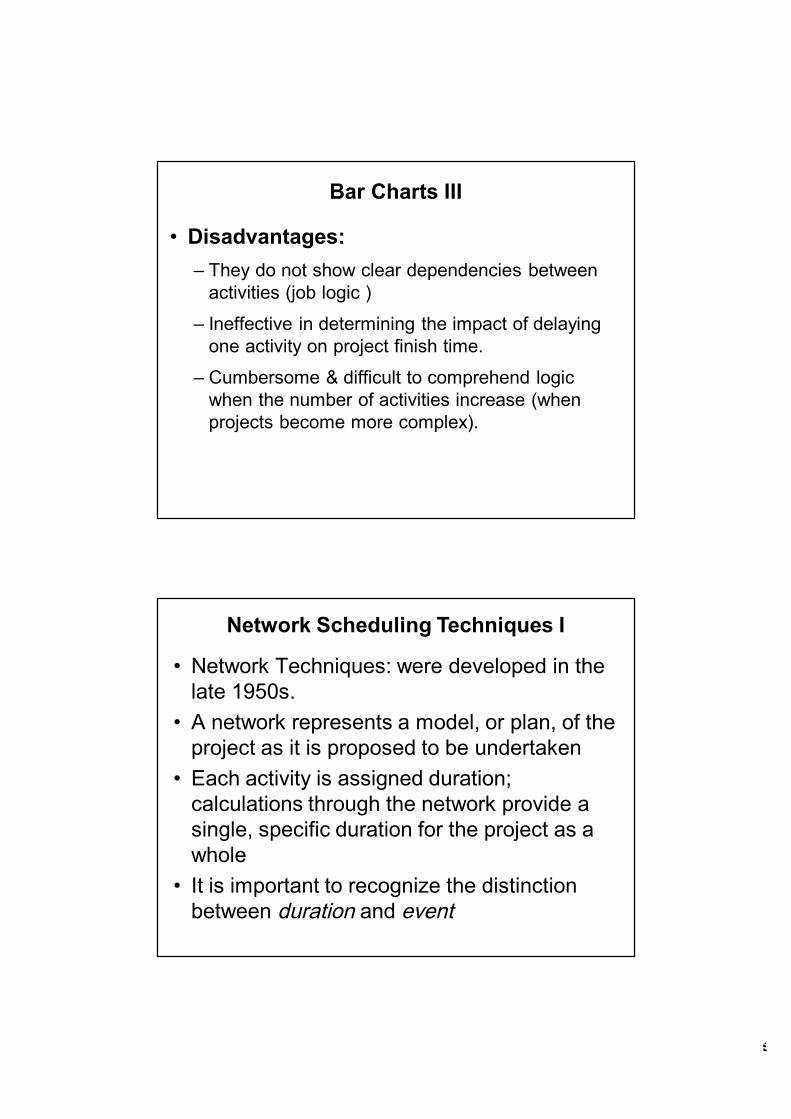
• Disadvantages:– They do not show clear dependencies between
activities (job logic )
– Ineffective in determining the impact of delaying one activity on project finish time.
– Cumbersome & difficult to comprehend logic when the number of activities increase (when projects become more complex).
Bar Charts III
• Network Techniques: were developed in the late 1950s.
• A network represents a model, or plan, of the project as it is proposed to be undertaken
• Each activity is assigned duration; calculations through the network provide a single, specific duration for the project as a whole
• It is important to recognize the distinction between duration and event
Network Scheduling Techniques I

٥
• An event is the point in time, or an instant at which the status of completion of a project or activity can be defined
• The duration of an activity is the time that will be consumed in completing a task
• Types of Network Scheduling:– Activity on Arrow (AOA) or Critical Path Method
(CPM)– Activity on Node (AON) or Precedence Diagram
Method (PDM).
Network Scheduling Techniques II
Network Scheduling Techniques III• Activity on Arrow (AOA): Activities are
represented as arrows or lines – Activity on Node (AON): Activities are
represented as nodes
٦
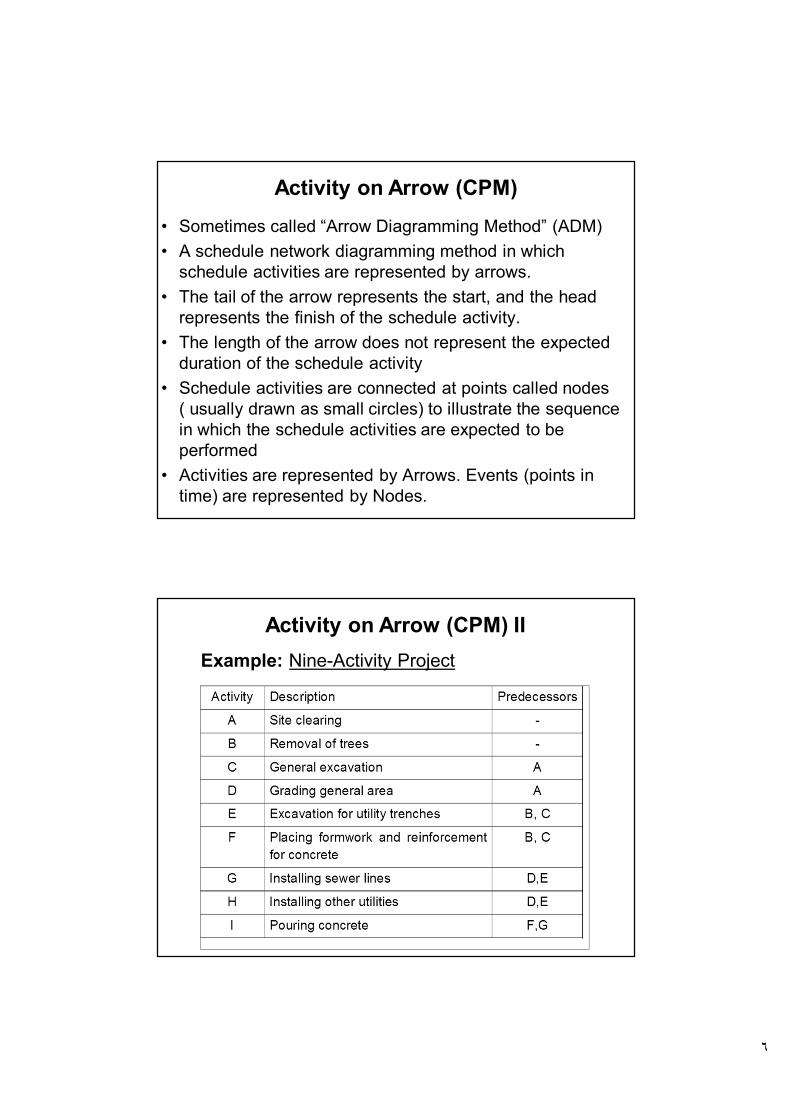
• Sometimes called “Arrow Diagramming Method” (ADM)• A schedule network diagramming method in which
schedule activities are represented by arrows.• The tail of the arrow represents the start, and the head
represents the finish of the schedule activity.• The length of the arrow does not represent the expected
duration of the schedule activity• Schedule activities are connected at points called nodes
( usually drawn as small circles) to illustrate the sequence in which the schedule activities are expected to be performed
• Activities are represented by Arrows. Events (points in time) are represented by Nodes.
Activity on Arrow (CPM)
Activity on Arrow (CPM) II Example: Nine-Activity Project
٧
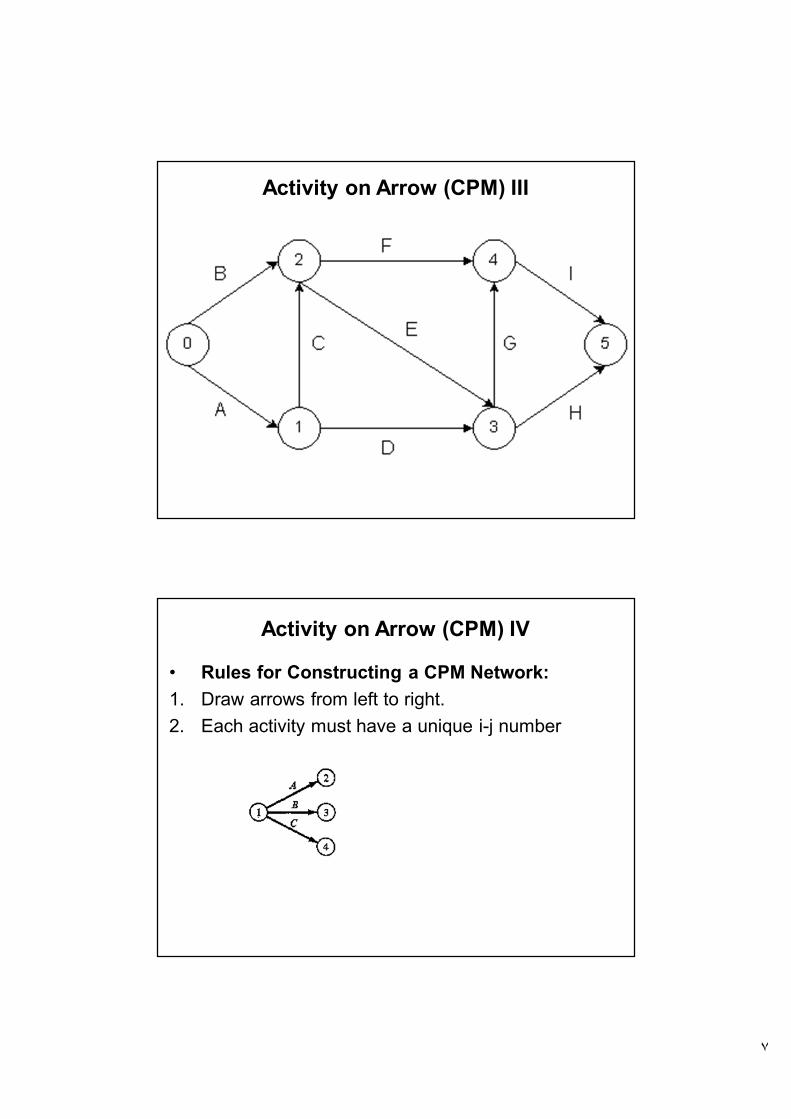
Activity on Arrow (CPM) III
• Rules for Constructing a CPM Network:1. Draw arrows from left to right.2. Each activity must have a unique i-j number
Activity on Arrow (CPM) IV
٨
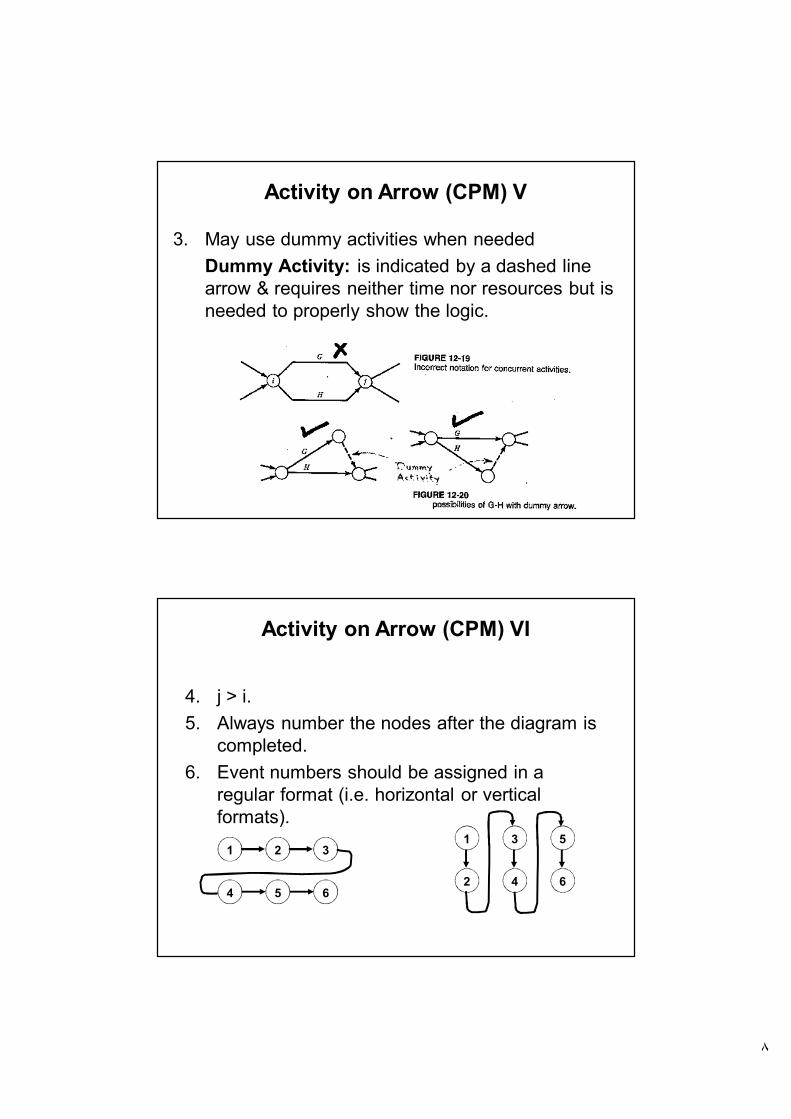
3. May use dummy activities when needed Dummy Activity: is indicated by a dashed line arrow & requires neither time nor resources but is needed to properly show the logic.
Activity on Arrow (CPM) V
4. j > i.5. Always number the nodes after the diagram is
completed.6. Event numbers should be assigned in a
regular format (i.e. horizontal or vertical formats).
1 2 3
4 5 6
1
2 4 6
3 5
Activity on Arrow (CPM) VI

٩
7. Avoid illogical loops.
8. Minimize crossovers whenever possible.
1
2 4
3
Activity on Arrow (CPM) VII
• Example:
Activity on Arrow (CPM) VIII
١٠
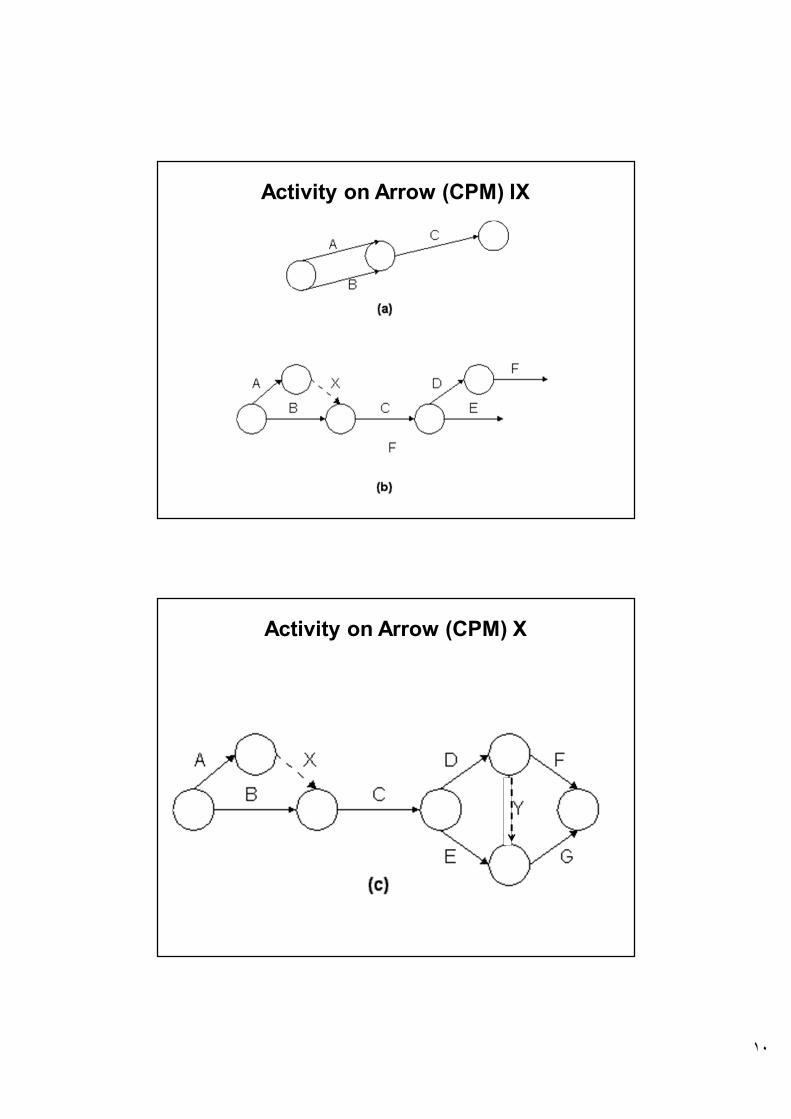
Activity on Arrow (CPM) IX
Activity on Arrow (CPM) X
١١
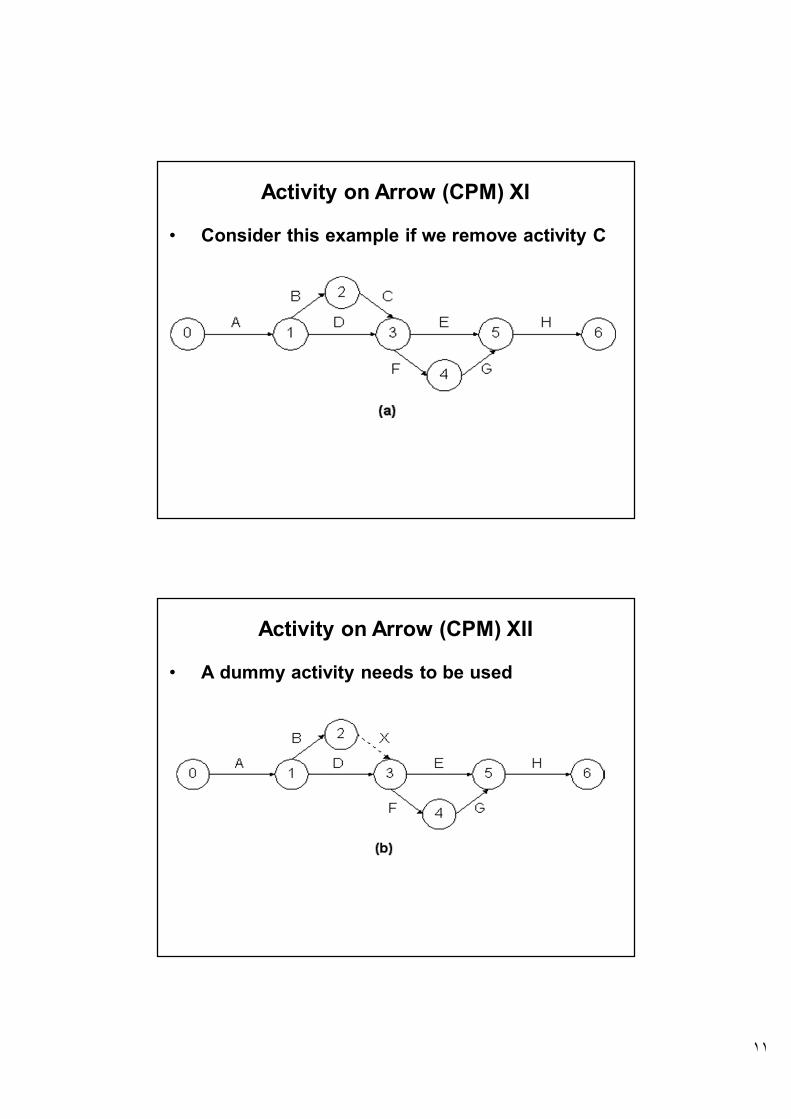
• Consider this example if we remove activity C
Activity on Arrow (CPM) XI
• A dummy activity needs to be used
Activity on Arrow (CPM) XII
١٢
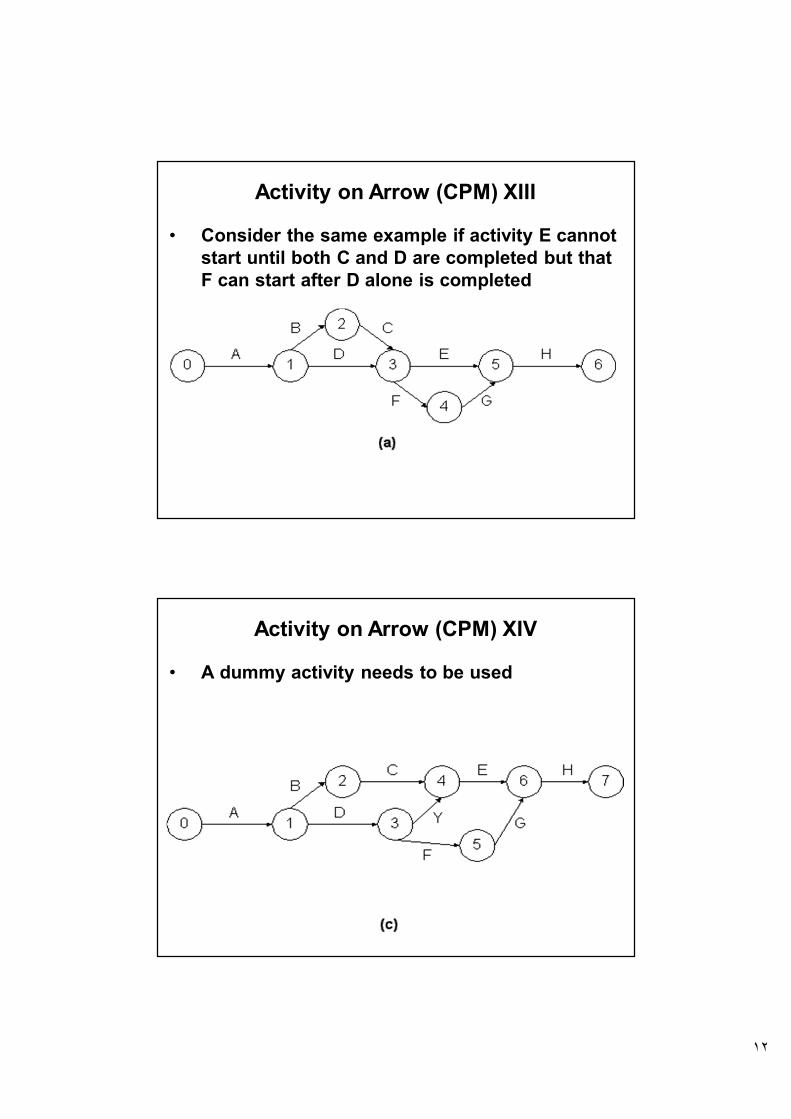
• Consider the same example if activity E cannot start until both C and D are completed but that F can start after D alone is completed
Activity on Arrow (CPM) XIII
• A dummy activity needs to be used
Activity on Arrow (CPM) XIV

١٣
• The most common type of network schedule in use today is the precedence diagram– A series of nodes with lines (links) connecting
them to illustrate activities
– Activities are represented by nodes,drawn in any desired shape
– Lines represent “Activity links,” used torepresent dependencies between activities
– The precedence diagram is “read” from left to right
Precedence Diagram I
• Simple Example of a Precedence Diagram for Erecting a Concrete Wall
Precedence Diagram II
١٤
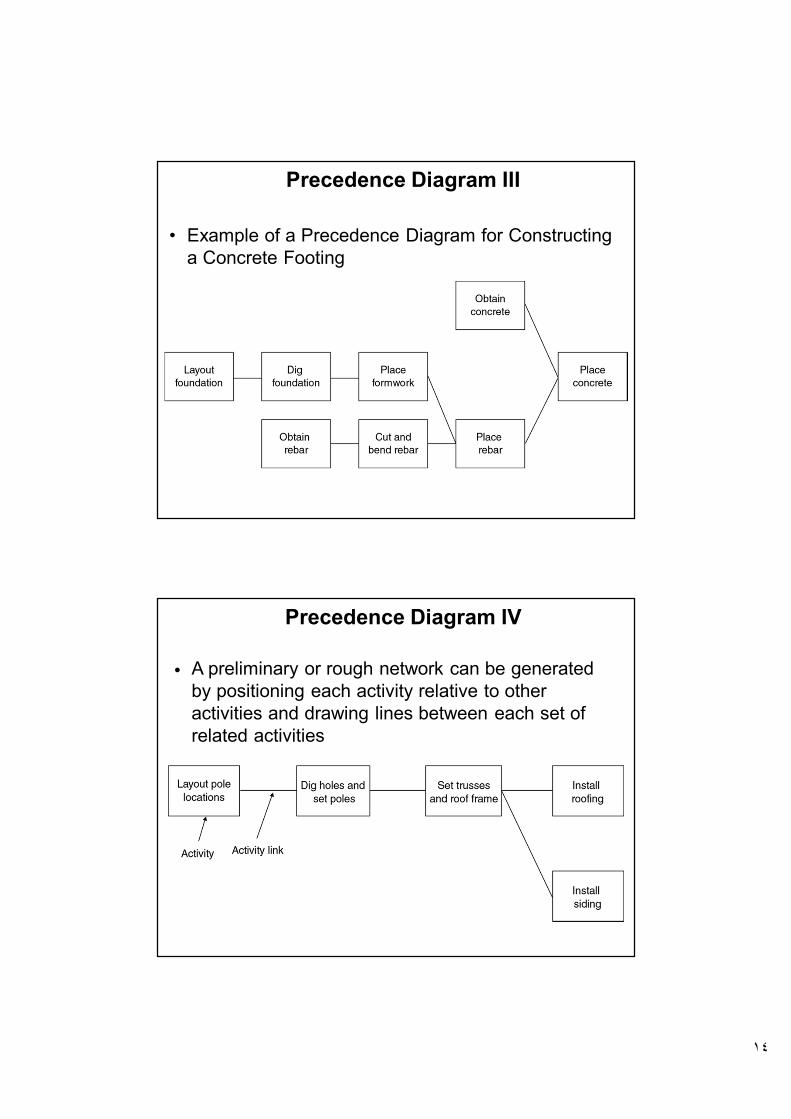
• Example of a Precedence Diagram for Constructing a Concrete Footing
Precedence Diagram III
Precedence Diagram IV
• A preliminary or rough network can be generated by positioning each activity relative to other activities and drawing lines between each set of related activities
١٥
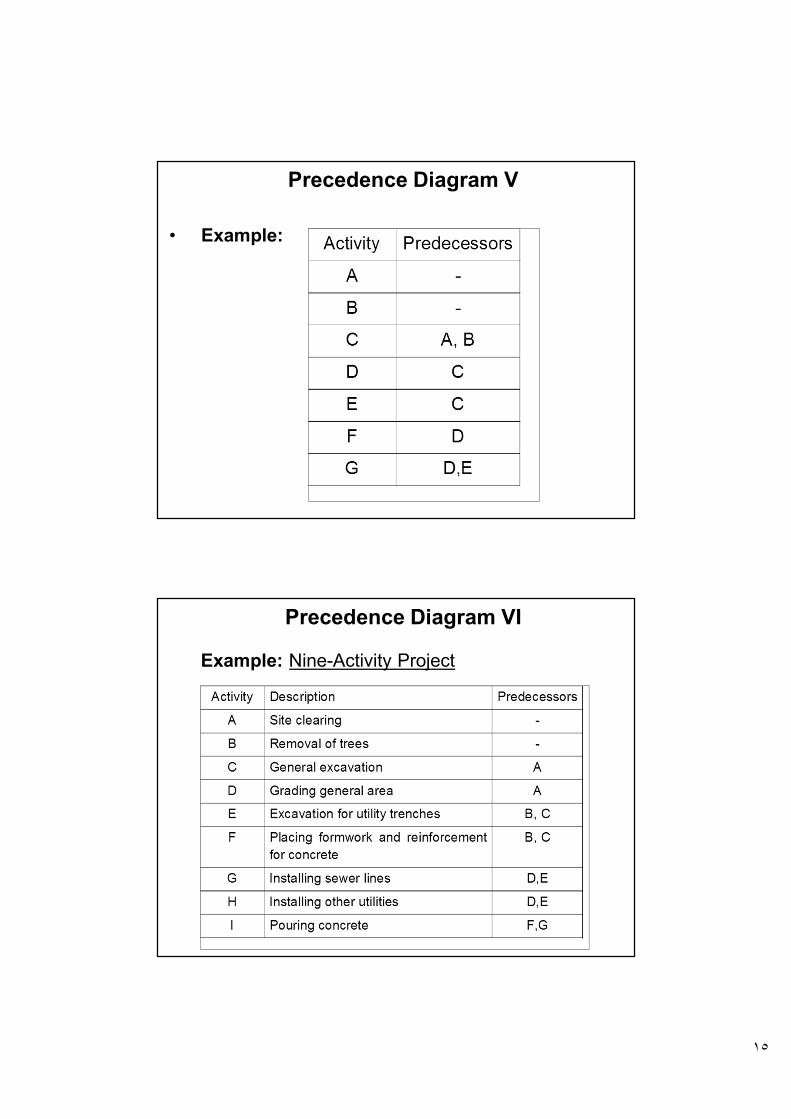
• Example:
Precedence Diagram V
Example: Nine-Activity Project
Precedence Diagram VI
١٦
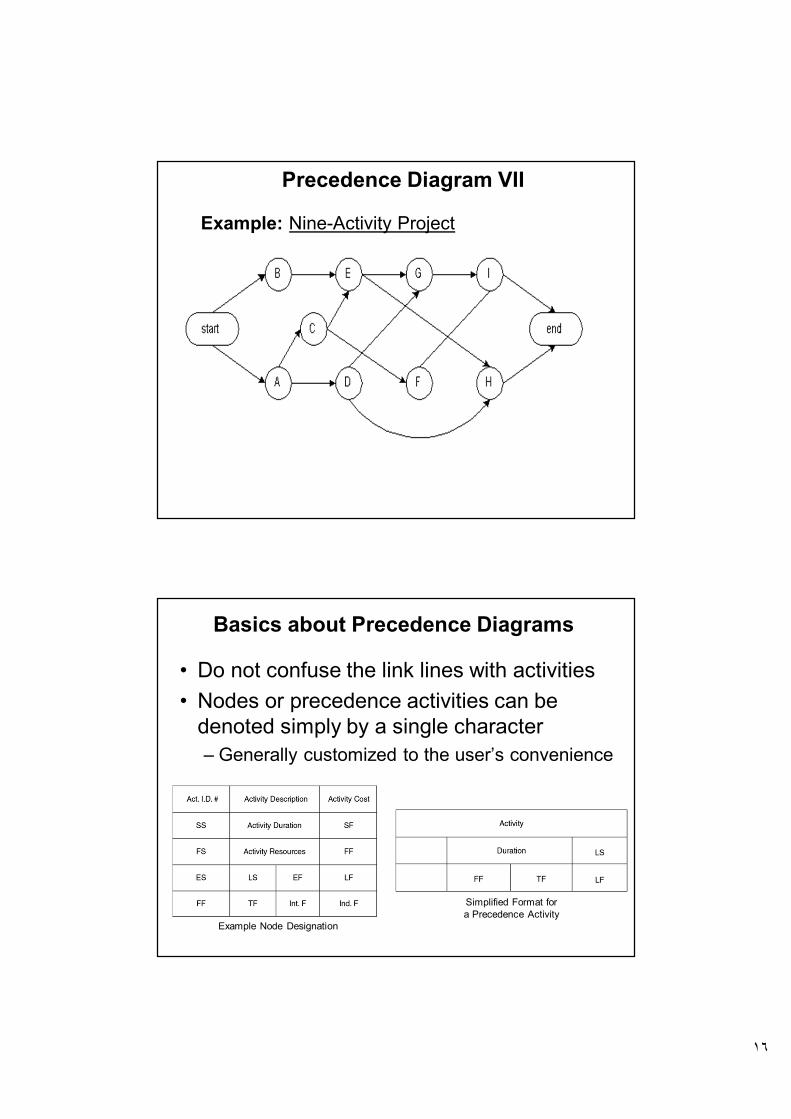
Example: Nine-Activity Project
Precedence Diagram VII
• Do not confuse the link lines with activities• Nodes or precedence activities can be
denoted simply by a single character– Generally customized to the user’s convenience
Example Node Designation
Simplified Format fora Precedence Activity
Basics about Precedence Diagrams
١٧
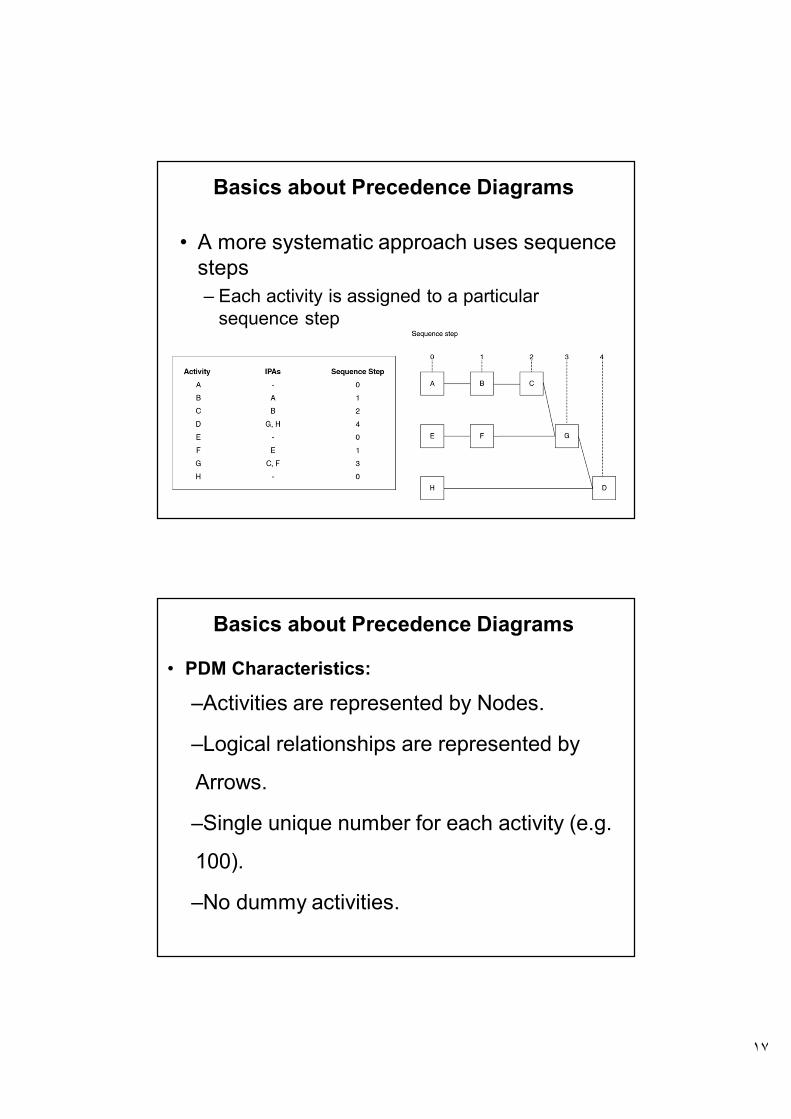
• A more systematic approach uses sequence steps– Each activity is assigned to a particular
sequence step
Basics about Precedence Diagrams
• PDM Characteristics:
–Activities are represented by Nodes.
–Logical relationships are represented by
Arrows.
–Single unique number for each activity (e.g.
100).
–No dummy activities.
Basics about Precedence Diagrams