2producing reports 2 - isp.asg.com · pdf file11 2 2producing reports this chapter describes...
TRANSCRIPT

2
2Producing ReportsThis chapter describes the sample reports supplied with TMON for CICS TS. It provides specific customization options for each report as well as information on:
• General reporting techniques you can apply to all reports to obtain different perspectives on data
• Summarization parameters and intervals
• Summarizing nonquantitative data.
This chapter contains these topics:
Topic Page
Reporting Techniques 12
Summarization Parameters 14
Summarizing Nonquantitative Data 15
Distributed Sample Reports 16
Sample Report Descriptions 19
RWTA01 - Transaction Resource Utilization 20
RWTA02 - Access Method/File Summary 24
RWTA03 - VOLSER Analysis 28
RWTA04 - Access Method Summary 32
RWTA05 - MRO Remote System Overview 35
RWTA06 - Transaction Summary 38
RWTA07 - Terminal Usage Report 42
RWTA08 - Transaction Rate Report 46
RWTA09 - Cost Distribution by Transaction 48
RWTA10 - Cost Factoring by Transaction 51
11

ASG-TMON for CICS TS for z/OS Report Writer Guide
1
Reporting TechniquesTo pinpoint areas of interest for a report, you should understand two important concepts: scope and level of summarization.
Scope is defined as the amount of data selected for a report by Report Writer control statements. It can be explicitly defined through the SELECT or EXCLUDE statements or implicitly defined through the use of data fields that limit Report Writer to certain record types. Level of summarization is defined as the lowest level summary parameter, for example:
RWTA11 - Application Total Page 54
RWTB01 - Display of End of Sample Interval Stats 58
RWTB02 - Display of All Behavior Observations 60
RWTB03 - All Observations by Job 63
RWTB04 - Outlier Event Report from Behavior Data 66
RWTB05 - Population to Sample Stats Comparison 69
RWTB06 - Threshold Recommendations 72
RWTI01 - Response Time Distribution 75
RWTI02 - CPU Time Overview 79
RWTI03 - Transaction Response Time Summary 82
RWTI04 - I/O Summary 86
RWTI06 - Hourly Paging Summary 88
RWTI07 - System vs Application CPU Utilization 91
RWTI08 - System Total Page 94
RWTI09 - Online History Comparison by Date 98
Topic Page
2

2 Producing Reports
A report may be generated as a summarization of all transactions for the entire day, or as a summarization of all transactions by an hourly interval, which provides a higher level of summarization). All the sample reports have the same scope (the number of days’ records) and level of summarization (the system ID).
Controlling scope and level of summarization is similar to using a telescope. By choosing a wider scope or field of vision, you may notice an area that is different from the general topography. By narrowing your scope and zooming in on that area (that is, increasing the level of magnification), you may be able to determine why the area is different. Because there are advantages to both perspectives, Report Writer provides you with the flexibility to adjust the scope and level of summarization for your reports, for example:
If a report with a high level of summarization shows a CICS system with high average response time for a particular day, your first step is to narrow the scope by limiting the report to that particular CICS region and day. This reduces the amount of data selected for the subsequent reports. You then can increase the magnification by lowering the level of summarization to an hourly interval for that day. Control of scope is achieved through the SELECT statement on the day and system ID, and level of summarization is controlled using the LMRKTIME field in the SUMF parameter of the REPORT statement.
After rerunning the report with the new control statements, you may notice an isolated time period when the response time climbs sharply upward. You can narrow the scope again to select only records from that time period. You then can zoom in on the problem, by lowering the level of summarization, to identify only those intervals with high response times and ignore those that do not exhibit the problem.
This process can be repeated until you are viewing detail data without any summarization. To lower the level of summarization to 10-minute intervals, specify LMRKTIME(0010000000) in the SUMF parameter of the REPORT statement. Specify LMRKTIME(0005000000) for 5-minute intervals. The more you narrow the scope and lower the level of summarization, the more you are able to focus on problem areas.
Suppose your monthly report contains unnecessary data, displaying activity for weekends and weekday off-hours along with normal business hours. The extraneous data makes it difficult to determine normal system performance. In this case, you need to reduce the amount of data selected (that is, narrow your scope), for example:
SELECT FDATA DATE 030104 TDATA DATE 033104 DRANGE MONDAY FRIDAY TRANGE 080000 170000
13

ASG-TMON for CICS TS for z/OS Report Writer Guide
1
These FDATA and TDATA parameters limit the data to prime shift (8 A.M. to 5 P.M.), Monday through Friday, for March 2004. The DRANGE and TRANGE parameters specify selection criteria to be applied to every record being considered for the report. These parameters let you specify a range of days of the week (DRANGE) and a range of time for each day (TRANGE) to be covered in the report.
You can apply the process of narrowing the scope and lowering the level of summarization to most of the sample reports included with TMON for CICS TS. This reporting technique should prove very effective in helping you identify problem areas in your CICS systems. You also can reverse the order of the summary parameters to help explain particular performance trends or alert you to problem areas. When several days are input to Report Writer, switching the summary parameters provides different perspectives on the definition of normal system performance.
Another important technique is the use of Report Writer LINE functions. When a report displays a field with an apparently unusual average, a good procedure is to run another report with the same summarization parameters, but only for the one field that seems unusual. Specify the field five times, and use the minimum (M), maximum (X), average (A), total (T), and standard deviation (S) LINE functions. Also specify the AVERAGE BY field. (For transaction data, the AVERAGE BY field is transaction count, TATRANCT). The report helps to establish how the average was determined.
The reporting techniques, discussed in this section, are further explored in the later discussions of the individual TMON for CICS TS sample reports. Using these techniques, appropriate examples have been created for each sample report. See the customization section of each report discussion for explicit examples.
Summarization ParametersYou summarize data to present it in a condensed form. You then can view the data without being overwhelmed by its volume. The SUMF statement drives the summarization process, and the LINE statement determines what information is presented on the report, for example:
These control statements tell Report Writer to summarize by transaction ID within system ID:
LINE TASYSID TAPTRAN TARSPTM TACPURTM TAIOCT TAIOTMSUMF TASYSID TAPTRAN
The resulting report would contain the fields specified on the LINE statement.
4

2 Producing Reports
Although some data types lend themselves to summarization better than others, almost any type—date, character, flag byte, time stamp, or time value—can be used as a summarization parameter. The most common data types used for summarization are date and character fields. Transaction start date, system ID, transaction ID, and terminal ID often are used as summarization parameters. Time values, time stamps, and other numeric values, however, also can be used. Because these values are generally unique, it is best to choose an interval when summarizing by time or other numeric values.
The Report Writer lets you specify an interval value for each numeric or time-oriented field you specify in the SUMF statement. For instance, you could produce a report showing how many of which transactions had a response time within user-defined limits. Or, you could reverse the summarization parameters and show the number of instances for each transaction that fell into user-defined limits of response time.
Another unlikely summarization parameter is a flag byte. Flag bytes can be dealt with in a number of ways, for example:
In the Access Method Summary report (member RWTA04), you convert the flag byte into character data. The access method type flag byte is converted into a 4-byte character field through a UFLD statement. Use the defined UFLD field to summarize the data. You also can handle flag bytes with different bit settings for different events by using the PROC parameter of the SELECT or REPORT command to select the bit settings in which you are interested. If a PROC expression references a 1-byte hexadecimal field, it treats the field as a flag byte. Refer to Chapter 3 in ASG-TMON Products for OS/390 & z/OS TMON Report Writer Guide for more information.
A limitation to summarization fields is that they cannot contain line functions (M, X, A, T, P, or S). (Line functions are calculated when the control breaks are reached, and the control breaks cannot be reached until a line function is calculated.)
When using Report Writer, it is important to keep in mind all the possible ways of slicing the data by using different summarization parameters. This technique provides you with a large repertoire of approaches to examine not only problems in your CICS systems, but also normal system performance and operation using the same small base of reports.
Summarizing Nonquantitative DataThe effects of summarization are obvious for time and numerical values, but not so obvious for other data types (such as character, time stamps, and flag bytes). The effects of summarizing nonquantitative fields can easily lead to mistakes.
15

ASG-TMON for CICS TS for z/OS Report Writer Guide
1
Report Writer always chooses the last occurrence of a character data field when character data is summarized. Often a character field can slip into a report in which a SUMF statement has been added. The only significance of the character field is that it was extracted from the last record out of the sort.
Time stamps are stored in the same format in which time values are stored. A time stamp also is treated the same as a time value; that is, it is calculated as an average, totaled, or calculated as a percent. A time stamp field that has been altered in that manner has no meaning and may cause incorrect operation of the program, such as abends (overflows) and excessive run time (recovering from abends). Do not include a time stamp in the LINE statement unless it also is specified in the SUMF statement.
Flag bytes are unique because they are ORed together to produce a composite flag byte that may or may not be representative of the input data, for example:
Eight records, each containing a different bit set in the same flag byte, would produce a summary line showing FF. In a report, this value might suggest 1,000 transactions had CI splits, CA splits, and string and buffer waits, and then abended, invoking Dynamic Transaction Backout. Most likely, only a few transactions had CI splits and string and buffer waits, and only one or two transactions had a CA split or abended. The flag byte is a composite of all the summarized records, not a representation of the average record.
Distributed Sample ReportsThis table lists the name of each member in the TMON for CICS TS distributed installation library that contains Report Writer control statements you use to create TMON for CICS TS reports:
Member Name Report Title
RWT260 DB2 Statistics Summary Report
RWT261 DB2 Thread Analysis Report
RWT262 DB2 Task Analysis Report
RWTA01 Transaction Resource Utilization
RWTA02 Access Method/File Summary
RWTA03 VOLSER Analysis
RWTA04 Access Method Summary
6

2 Producing Reports
RWTA05 MRO Remote System Overview
RWTA06 Transaction Summary
RWTA07 Terminal Usage Report
RWTA08 Transaction Rate Report
RWTA09 Cost Distribution by Transaction
RWTA10 Cost Factoring by Transaction
RWTA11 Application Total Page
RWTA12 Transaction Resource Wait Analysis
RWTA13 Transaction Resource Request Analysis
RWTA14 Transaction Dispatch - TCB Usage
RWTA15 Transaction MRO/ISC Connections
RWTB01 Display of End of Sample Interval Stats
RWTB02 Display of All Behavior Observations
RWTB03 All Observations by Job
RWTB04 Outlier Event Report from Behavior Data
RWTB05 Population to Sample Stats Comparison
RWTB06 Threshold Recommendations
RWTD60 TD Queue Summary Report
RWTD61 TD Queue Detail Analysis Report
RWTF60 File Statistics Summary Report
RWTF61 Data Tables Statistics Summary Report
RWTF62 File Statistics Detail Report
RWTF63 Data Tables Statistics Detail Report
RWTI01 Response Time Distribution
Member Name Report Title
17

ASG-TMON for CICS TS for z/OS Report Writer Guide
1
JCL ConsiderationsFor your JCL, use TMCE as the 4-character product identifier and 020 as the 3-character release number. Chapter 2 in ASG-TMON Products for OS/390 & z/OS TMON Report Writer Guide provides a JCL model for running Report Writer.
RWTI02 CPU Time Overview
RWTI03 Transaction Response Time Summary
RWTI04 I/O Summary
RWTI06 Hourly Paging Summary
RWTI07 System vs Application CPU Utilization
RWTI08 System Total Page
RWTI09 Online History Comparison by Date
RWTL60 Alert Messages Report
RWTM60 Global MRO/ISC Connection Summary
RWTM61 Detail MRO/ISC Connection Report
RWTP60 Global Program Statistics Report
RWTP61 Detail Program Statistics Report
RWTR60 DSA Detail Report
RWTS60 Global TS Queue Analysis Report
RWTS61 Detail TS Queue Statistics Report
RWTT60 Detail Terminal Statistics Report
RWTW60 Detail Supertrace Report
RWTX60 Transaction Summary Report
RWTX61 Detail Transaction Statistics Report
Member Name Report Title
8

2 Producing Reports
Sample Report DescriptionsThe remainder of this chapter looks at a sampling (25) of the TMON for CICS TS sample reports. Each report is designed as a 1-page overview of a different facet of system performance. You can easily customize most of the reports to quickly pinpoint areas of interest. All the sample reports are summarized across date and system ID.
You can produce all the TMON for CICS TS sample reports using control statements and JCL provided in the TMON for CICS TS distributed installation library. You can tailor the library report members to produce reports that meet the needs of your site.
This information is provided for each documented report:
Section Description
Purpose The purpose of the report.
Report Data A list of all fields, including computed fields, used to create the report. (Computed fields are those fields created through UFLD statements.)
Control Statements The control statements used to create the report. For detailed information about a specific control statement, see Chapter 3 in ASG-TMON Products for OS/390 & z/OS TMON Report Writer Guide.
Customization Report-specific examples of methods to customize the report. The scenarios of customization discussed in this section are only examples; you are not limited to these techniques.
19

ASG-TMON for CICS TS for z/OS Report Writer Guide
2
RWTA01 - Transaction Resource Utilization
PurposeThe Transaction Resource Utilization report provides an overview of the average and total data for transactions on a given system for a given day. It calculates z/OS usage and total paging counts.
Report DataThis report uses the transaction performance (TA) records. The table lists the report fields. The TMON for CICS TS or user-defined (for UFLD statements) field name is enclosed in brackets.
DATE: 04/27/04 A S G - T M O N f o r C I C S T S PAGE: 1TIME: 12:09:23 T R A N S A C T I O N R E S O U R C E U T I L I Z A T I O N
DATA IS FROM 03/02/04 AT 17:42 TO 04/10/04 AT 17:47
CICS END RESPONSE TASK DISP TASK MULTI PGM MULTI PGM % TRAN I/O PAGINGSYSID DATE TIME TIME CPU TIME <----100.0----> COUNT COUNT COUNT
AVG TOT TOT % TOT TOT TOT
B4HD 03/16/04 0.0512 1:01.9246 3.1541 94.9 ============== 2,329 0 84303/17/04 1:35.8130 12:02.2164 13.3621 98.1 =============== 3,636 28 5,78303/19/04 0.0714 3:03.5577 6.2773 96.6 ============== 4,341 1 2,13803/20/04 7:20.2592 1:13.4697 18.8262 74.4 =========== 1,374 0 2,14903/21/04 0.0217 1:24.9863 16.5739 80.5 ============ 11,511 0 54303/22/04 4:40.9470 10:24.0381 1:04.3032 89.7 ============= 6,464 0 2,66403/23/04 0.0822 3:45.5579 8.6398 96.2 ============== 5,874 0 3,05403/24/04 3:22.4389 1:53:34.4128 45.3086 99.3 =============== 6,039 0 69,43903/25/04 0.0223 16.4131 2.7361 83.3 ============ 1,940 0 8003/26/04 1:18.4122 39:26.0170 1:02.7775 97.3 =============== 18,576 0 25,68403/27/04 1:36:55.6115 14:23.2821 1:04.7267 92.5 ============== 416 0 22,18003/31/04 0.0517 3:07.3520 16.9202 91.0 ============== 11,394 14,580 41704/01/04 4:41.3438 4:05.1657 32.0155 86.9 ============= 3,609 0 1,22704/03/04 0.0283 1:38.3690 14.0005 85.8 ============= 9,969 0 81304/04/04 7:16.9402 5:59.6844 48.1702 86.6 ============= 4,154 0 3,019
B4HD ******** 1:56.7817 3:35:26.4467 6:57.7919 96.8 =============== 91,626 14,609 140,033
04HD 03/22/04 0.0133 1.3243 0.0208 98.4 =============== 107 0 5503/23/04 8:31:19.2363 7.5312 5.6769 24.6 ==== 12 0 70003/24/04 13:59:56.8886 20.9640 9.3515 55.4 ======== 12 0 95703/25/04 16:48:08.8962 6.9190 9.4617 36.7- ===== 10 0 1,69703/26/04 1:13:16.5567 7:29.7182 37.6611 91.6 ============== 384 0 4,33603/27/04 3:37:01.7168 25.1676 19.9858 20.6 === 96 0 35203/28/04 2.6734 2:07.2160 5.3613 95.8 ============== 168 0 71203/29/04 3:21:04.9623 9:12.5334 48.5202 91.2 ============== 224 0 5,52004/07/04 4:25:07.6934 3.5559 8.4432 137.3- ================= 36 0 3304/08/04 13:59:52.4357 19.6332 27.0371 37.6- ===== 36 0 22504/09/04 16:48:00.0945 9.7280 27.3984 181.5- ================= 30 0 174
04HD ******** 2:50:42.4885 20:24.2909 3:18.9181 83.8 ============= 1,115 0 14,761
TOTALS 3:58.5203 3:55:50.7376 10:16.7100 95.6 ============== 92,741 14,609 154,794
Field Description
CICS SYSID [TASYSID] Displays the system identifier.
END DATE [LMRKDATE] Displays the date the record was written.
0

2 Producing Reports
Control StatementsThese control statements, used to produce this report, are in the installation library in member RWTA01:
UFLDNAME MVSMPFTYPE TIMEPERCENT TATSKDTMHEAD1 ‘MULTI PGM’PROC MVSMPF = TATSKDTM - TACPURTM
REPORTLINE = TASYSID LMRKDATE TARSPTM TATSKDTM(T) TACPURTM(T)
MVSMPF(P) TATRANCT(T) TAIOCT(T) TAPGETCT(T)SUMF = TASYSID LMRKDATESFORM = TAPGETCTGRAPHS = MVSMPF(1000)TITLE = ‘TRANSACTION RESOURCE UTILIZATION’WIDTH = 132COVER = NO
I/O COUNT TOT [TAIOCT] Displays the total number of input and output requests.
MULTI PGM % [UFLD MVSMPF] Displays and graphs the CPU wait time, defined through a UFLD statement as TATSKDTM minus TACPURTM.
PAGING COUNT TOT [TAPGETCT]
Displays the total number of page-in and page-out operations.
RESPONSE TIME AVG [TARSPTM]
Displays the average transaction response time.
TASK CPU TIME TOT [TACPURTM]
Displays the total transaction CPU time.
TASK DISP TIME TOT [TATSKDTM]
Displays the total transaction dispatch time.
TRAN COUNT TOT [TATRANCT] Displays the total transaction count.
Field Description
21

ASG-TMON for CICS TS for z/OS Report Writer Guide
2
CustomizationIf the Transaction Resource Utilization report shows that resource consumption is unsatisfactory, you can redirect the report to pinpoint the areas of abnormally high or low resource usage by modifying the control statements. For example:
Suppose that after examining the Transaction Resource Utilization report, you want to focus on average response time and average dispatch time for system ID 04HD, particularly on April 9, 2004. Since the report does not show that paging and I/O are high, which would account for high response time, you want to examine the average transaction execution to determine why the response time appears higher than that reported for other days. To exclude all unnecessary data, add this SELECT statement to the control statements used to produce this report:
SELECT FDATA DATE 040904 TIME 000000 TDATA DATE 040904 TIME 180000 PROC WHEN TASYSID EQ ‘04HD’ THEN ACCEPT
The SELECT statement tells Report Writer to include all data from April 9, 2004, between the hours of 12 A.M. and 6 P.M., for system ID 04HD. The SELECT statement lets you process only that data in which you are interested.
Note:You can specify only one PROC parameter in the SELECT statement, and it must be the last parameter specified in the statement.
Change the SUMF statement to help you pinpoint the transaction ID causing high response time. Change the SUMF statement to:
SUMF TAPTRAN
Change the LINE statement to include TAPTRAN (CICS primary transaction ID) as the first field displayed on the report. Because you want only data generated within SYSID 04HD on April 9, 2004, remove the TASYSID and LMRKDATE fields from the LINE statement.
A control break occurs every time the transaction ID changes. An average line is displayed for each transaction ID. The new report can help you to determine the cause of high response and dispatch times.
Often, simply reorganizing the data on an existing report (by changing the way data is summarized through the SUMF statement) can sufficiently provide the information that you require, for example:
2

2 Producing Reports
Suppose you want to display daily totals of all activity on all CICS address spaces, instead of weekly totals for individual CICS address spaces. To obtain daily totals of all activity, reverse the order of the TASYSID and LMRKDATE fields on the SUMF and LINE statements. Change the SUMF statement to:
SUMF LMRKDATE TASYSID
The SUMF statement tells Report Writer to force a control break every time the date changes and within date every time the SYSID changes. The SYSID line is a subset of each day. The totals from each SYSID are accumulated at each LMRKDATE control break to provide a daily total of all activity, as shown in this report:
DATE: 04/28/04 A S G - T M O N f o r C I C S T S PAGE: 1TIME: 11:22:10 T R A N S A C T I O N R E S O U R C E U T I L I Z A T I O N
DATA IS FROM 04/01/04 AT 00:00 TO 04/04/04 AT 17:47
END CICS RESPONSE TASK DISP TASK MULTI PGM MULTI PGM % TRAN I/O PAGINGDATE SYSID TIME TIME CPU TIME <----100.0----> COUNT COUNT COUNT
AVG TOT TOT % TOT TOT TOT
04/01/04 B4HD 4:41.3438 4:05.1657 32.0155 86.9 ============= 3,609 0 1,22704/01/04 **** 4:41.3438 4:05.1657 32.0155 86.9 ============= 3,609 0 1,227
04/03/04 B4HD 0.0283 1:38.3690 14.0005 85.8 ============= 9,969 0 81304/03/04 **** 0.0283 1:38.3690 14.0005 85.8 ============= 9,969 0 813
04/04/04 B4HD 7:16.9402 5:59.6844 48.1702 86.6 ============= 4,154 0 3,01904/04/04 **** 7:16.9402 5:59.6844 48.1702 86.6 ============= 4,154 0 3,019
TOTALS 2:39.6380 11:43.2190 1:34.1862 86.6 ============= 17,732 0 5,059
23

ASG-TMON for CICS TS for z/OS Report Writer Guide
2
RWTA02 - Access Method/File Summary
PurposeThe Access Method/File Summary report provides a summary of file statistics by access methods. The number of I/Os and the function of those I/Os are displayed against each file in the system, presenting the traffic against each file.
Report DataThis report uses the transaction performance (TA) records. The table lists the report fields. The TMON for CICS TS or user-defined (for UFLD statements) field name is enclosed in brackets.
DATE: 04/10/04 A S G - T M O N f o r C I C S T S PAGE: 1TIME: 13:33:45 A C C E S S M E T H O D / F I L E S U M M A R Y
DATA IS FROM 03/22/04 AT 10:46 TO 03/29/04 AT 14:02
END CICS ACCESS FILE UCB VOLUME FILE ACCESS FILE ACCESS FILE FILE DEL FILE GET FILE BRW FILE ADD FILE UPDDATE SYSID METHOD NAME ADDRESS SERIAL TIME COUNT EXC REQ COUNT REQ COUNT REQ COUNT REQ COUNT REQ COUNT
NUMBER TOT TOT CONDS TOT TOT TOT TOT TOT
03/22/04 A2A1 DL/I DI21PART 0000 DBCT .0000 7 00 0 1 6 0 0DI21PART .0000 7 ** 0 1 6 0 0
DL/I ******** .0000 7 ** 0 1 6 0 0
RMTE FILEA 0000 D2A1 9.0570 17 00 1 2 12 1 1FILEA 9.0570 17 ** 1 2 12 1 1
FILEB 0000 D2A1 3.2620 1 00 0 1 0 0 0FILEB 3.2620 1 ** 0 1 0 0 0
FILEC 0000 D2A1 7.2226 1 00 0 1 0 0 0FILEC 7.2226 1 ** 0 1 0 0 0
FILET 0000 D2A1 1.7733 1 00 0 1 0 0 0FILET 1.7733 1 ** 0 1 0 0 0
RMTE ******** 21.3149 20 ** 1 5 12 1 1
VSAM DFHCMACD 1C66 TMONDV 8.3652 1 00 0 1 0 0 0DFHCMACD 8.3652 1 ** 0 1 0 0 0
VSAM ******** 8.3652 1 ** 0 1 0 0 0
A2A1 **** ******** 29.6802 28 ** 1 7 18 1 1
Field Description
ACCESS METHOD [UFLD AMTYPE]
Displays the access method type, defined through a UFLD statement.
CICS SYSID [TASYSID] Displays the system identifier.
END DATE [LMRKDATE] Displays the date the record was written.
4

2 Producing Reports
Control StatementsThese control statements, used to produce this report, are in the installation library in member RWTA02:
UFLD NAME AMTYPE TYPE CHAR HEAD1 ‘ACCESS’ HEAD2 ‘METHOD’ LENGTH 4 PROC WHEN TAFILACM = 80 THEN AMTYPE = ‘ISAM’ WHEN TAFILACM = 40 THEN AMTYPE = ‘BDAM’ WHEN TAFILACM = 20 THEN AMTYPE = ‘VSAM’ WHEN TAFILACM = 10 THEN AMTYPE = ‘QSAM’
FILE ACCESS COUNT TOT [TAFILECT]
Displays the total file request count.
FILE ACCESS TIME TOT [TAFILETI]
Displays the elapsed time for file requests.
FILE ADD REQ COUNT TOT [TAFILADD]
Displays the file add count.
FILE BRW REQ COUNT TOT [TAFILBRW]
Displays the file browse count.
FILE DEL REQ COUNT TOT [TAFILDEL]
Displays the file delete count.
FILE EXC CONDS [TAFILEXC] Displays the code of any file exception conditions observed.
FILE GET REQ COUNT TOT [TAFILGET]
Displays the file get count.
FILE NAME [TAFILID] Displays the file name.
FILE UPD REQ COUNT TOT [TAFILUPD]
Displays the file update count.
UCB ADDRESS [TAFILUCB] Displays the file UCB channel/unit address.
VOLUME SERIAL NUMBER [TAFILVOL]
Displays the volume serial number.
Field Description
25

ASG-TMON for CICS TS for z/OS Report Writer Guide
2
WHEN TAFILACM = 08 THEN AMTYPE = ‘RMTE’ WHEN TAFILACM = 04 THEN AMTYPE = ‘DL/I’ WHEN TAFILACM = 02 THEN AMTYPE = ‘DB2 ’ WHEN TAFILACM = 01 THEN AMTYPE = ‘USER’ REPORT LINE LMRKDATE TASYSID AMTYPE TAFILID TAFILUCB TAFILVOL TAFILETI TAFILECT(T) TAFILEXC TAFILDEL(T) TAFILGET(T) TAFILBRW(T) TAFILADD(T) TAFILUPD(T) PROC WHEN TAFILID{1,1} = ‘ ’ THEN REJECT SUMF LMRKDATE TASYSID AMTYPE TAFILID TAFILEXC SFORM TAFILUCB TAFILVOL TAFILETI TAFILECT TAFILDEL TAFILGET TAFILBRW TAFILADD TAFILUPD WIDTH 132 TITLE ‘ACCESS METHOD/FILE SUMMARY’ COVER NO
CustomizationReversing the order of the summary parameters for a report can help explain particular performance trends or alert you to problem areas. To switch the order of summary parameters, you must modify the SUMF statement. (You also would need to modify the LINE statement to follow the SUMF statement order.) Since the Access Method/File Summary report uses four levels of control breaks (LMRKDATE, TASYSID, AMTYPE, and TAFILID), switching or removing summary parameters can help you to see interesting trends and relationships, for example:
Suppose you change the SUMF statement to:
SUMF AMTYPE TAFILID LMRKDATE
6

2 Producing Reports
This SUMF statement causes summarization of file performance within file type across systems, within date. This type of summarization lets you check the files’ performance trends, as shown in this report:
Changing the SUMF statement to:
SUMF AMTYPE LMRKDATE TAFILID
lets you look at performance for each day, as shown in this report:
DATE: 04/28/04 A S G - T M O N f o r C I C S T S PAGE: 1TIME: 12:03:10 A C C E S S M E T H O D / F I L E S U M M A R Y
DATA IS FROM 03/25/04 AT 00:01 TO 03/25/04 AT 10:40
ACCESS FILE END CICS UCB VOLUME FILE ACCESS FILE ACCESS FILE FILE DEL FILE GET FILE BRW FILE ADD FILE UPDMETHOD NAME DATE SYSID ADDRESS SERIAL TIME COUNT EXC REQ COUNT REQ COUNT REQ COUNT REQ COUNT REQ COUNT
NUMBER AVG TOT CONDS TOT TOT TOT TOT TOT
RMTE F100MFA 03/25/04 MFA 0000 MFAF 0.0201 83 00 0 83 0 0 0F100MFA ******** 0.0201 83 0 83 0 0 0
VIEWFILE 03/25/04 MFA 0000 DTV1 0.2566 4 00 0 4 0 0 0VIEWFILE ******** 0.2566 4 0 4 0 0 0
VIEWLOG 03/25/04 MFA 0000 DTV1 0.0057 4 00 0 0 0 4 0VIEWLOG ******** 0.0057 4 0 0 0 4 0
RMTE ******** ******** 0.0299 91 0 87 0 4 0
VSAM BATCNTL 03/25/04 MFA 7039 M4DV9D 0.0020 3,816 00 0 3,816 0 0 0BATCNTL ******** 0.0020 3,816 0 3,816 0 0 0
VIPSFILE 03/25/04 MFA 0000 0.0549 39 00 0 39 0 0 0VIPSFILE ******** 0.0549 39 0 39 0 0 0
VSAM ******** ******** 0.0026 3,855 0 3,855 0 0 0
TOTALS 0.0032 3,946 0 3,942 0 4 0
DATE: 04/28/04 A S G - T M O N f o r C I C S T S PAGE: 1TIME: 12:11:57 A C C E S S M E T H O D / F I L E S U M M A R Y
DATA IS FROM 03/25/04 AT 00:01 TO 03/25/04 AT 10:40
ACCESS END FILE CICS UCB VOLUME FILE ACCESS FILE ACCESS FILE FILE DEL FILE GET FILE BRW FILE ADD FILE UPDMETHOD DATE NAME SYSID ADDRESS SERIAL TIME COUNT EXC REQ COUNT REQ COUNT REQ COUNT REQ COUNT REQ COUNT
NUMBER AVG TOT CONDS TOT TOT TOT TOT TOT
RMTE 03/25/04 F100MFA MFA 0000 MFAF 0.0201 83 00 0 83 0 0 0VIEWFILE MFA 0000 DTV1 0.2566 4 00 0 4 0 0 0VIEWLOG MFA 0000 DTV1 0.0057 4 00 0 0 0 4 0
03/25/04 ******** 0.0299 91 0 87 0 4 0
RMTE ******** ******** 0.0299 91 0 87 0 4 0
VSAM 03/25/04 BATCNTL MFA 7039 M4DV9D 0.0020 3,816 00 0 3,816 0 0 0VIPSFILE MFA 0000 0.0549 39 00 0 39 0 0 0
03/25/04 ******** 0.0026 3,855 0 3,855 0 0 0
VSAM ******** ******** 0.0026 3,855 0 3,855 0 0 0
TOTALS 0.0032 3,946 0 3,942 0 4 0
27

ASG-TMON for CICS TS for z/OS Report Writer Guide
2
RWTA03 - VOLSER Analysis
PurposeThe VOLSER Analysis report provides volume usage information by date and system ID. It is similar to RWTA02, but describes volumes rather than files. Use this report to identify heavily used DASD.
Report DataThis report uses the transaction performance (TA) records. The table lists the report fields. The TMON for CICS TS or user-defined (for UFLD statements) field name is enclosed in brackets.
DATE: 04/10/04 A S G - T M O N f o r C I C S T S PAGE: 1TIME: 13:38:48 V O L S E R A N A L Y S I S
DATA IS FROM 03/22/04 AT 10:46 TO 03/29/04 AT 14:02
END CICS VOLUME UCB FILE ACCESS FILE ACCESS FILE FILE EXCEPTION FILE DEL FILE GET FILE BRW FILE ADD FILE UPDDATE SYSID SERIAL ADDRESS TIME COUNT EXC INDICATOR REQ COUNT REQ COUNT REQ COUNT REQ COUNT REQ COUNT
NUMBER TOT TOT CONDS TOT TOT TOT TOT TOT
03/22/04 A2A1 DBCT 0000 .0000 7 00 0 1 6 0 0DBCT .0000 7 ** 0 1 6 0 0
D2A1 0000 21.3149 20 00 1 5 12 1 1D2A1 21.3149 20 ** 1 5 12 1 1
TMONDV 1C66 8.3652 1 00 0 1 0 0 0TMONDV 8.3652 1 ** 0 1 0 0 0
A2A1 ****** 29.6802 28 ** 1 7 18 1 1
D2A1 0000 1.7587 1 00 0 1 0 0 01.7587 1 ** 0 1 0 0 0
AMX001 1C6C 16.6239 19 00 1 4 12 1 1AMX001 16.6239 19 ** 1 4 12 1 1
Field Description
CICS SYSID [TASYSID] Displays the system identifier.
END DATE [LMRKDATE] Displays the date the record was written.
FILE ACCESS COUNT TOT [TAFILECT]
Displays the total file request count.
FILE ACCESS TIME TOT [TAFILETI]
Displays the elapsed time for file requests.
FILE ADD REQ COUNT TOT [TAFILADD]
Displays the file add count.
8

2 Producing Reports
Control StatementsThese control statements, used to produce this report, are in the installation library in member RWTA03:
OPTION PLEFTUFLD NAME EXCPIND TYPE CHAR LENGTH 15 HEAD1 ‘FILE EXCEPTION’ HEAD2 ‘ INDICATOR ’ PROC WHEN TAFILEXC = 80 THEN EXCPIND = ‘VSAM STRNG WAIT’ WHEN TAFILEXC = 40 THEN EXCPIND = ‘LSR BUFFER WAIT’ WHEN TAFILEXC = 20 THEN EXCPIND = ‘VSAM CI SPLIT’ WHEN TAFILEXC = 10 THEN EXCPIND = ‘VSAM CA SPLIT’ WHEN TAFILEXC = 08 THEN EXCPIND = ‘DB2 POOL OVRFLW’ WHEN TAFILEXC = 04 THEN EXCPIND = ‘DB2 THREAD WAIT’ WHEN TAFILEXC = 02 THEN EXCPIND = ‘LSR STRING WAIT’REPORT LINE LMRKDATE TASYSID TAFILVOL TAFILUCB TAFILETI TAFILECT(T) TAFILEXC EXCPIND FILDELS(A) FILGETS(A) FILBRWS(A) FILADDS(A) FILUPDS(A) PROC WHEN TAFILID{1,1} = ‘ ’ THEN REJECT SUMF LMRKDATE TASYSID TAFILVOL TAFILEXC
FILE BRW REQ COUNT TOT [TAFILBRW]
Displays the file browse count.
FILE DEL REQ COUNT TOT [TAFILDEL]
Displays the file delete count.
FILE EXC CONDS [TAFILEXC] Displays the code of any file exception conditions observed.
FILE EXCEPTION INDICATOR [UFLD EXCPIND]
Displays the file exception name, defined through a UFLD statement.
FILE GET REQ COUNT TOT [TAFILGET]
Displays the file get count.
FILE UPD REQ COUNT TOT [TAFILUPD]
Displays the file update count.
UCB ADDRESS [TAFILUCB] Displays the file UCB channel/unit address.
VOLUME SERIAL NUMBER [TAFILVOL]
Displays the volume serial number.
Field Description
29

ASG-TMON for CICS TS for z/OS Report Writer Guide
3
SFORM TAFILUCB TAFILVOL TAFILETI TAFILECT TAFILEXC TAFILDEL TAFILGET TAFILBRW TAFILADD TAFILUPD TITLE ‘VOLSER ANALYSIS’ WIDTH 132 COVER NO
CustomizationThe VOLSER Analysis report displays file delete, get, add, browse, and update requests for every volume displayed on the report. These requests may be more useful to you if they are displayed as averages. You then can detect the average number of requests per transaction. You can compute an average for each request field by using these UFLD statements:
OPTION PLEFTUFLD /* (creates DEL REQ as an average) NAME FILDELS TYPE COUNT AVERAGE TATRANCT PRECISION 4 PROC FILDELS = TAFILDELUFLD /* (creates GET REQ as an average) NAME FILGETS TYPE COUNT AVERAGE TATRANCT PRECISION 4 PROC FILGETS = TAFILGETUFLD /* (creates BROWSE REQ as an average) NAME FILBRWS TYPE COUNT AVERAGE TATRANCT PRECISION 4 PROC FILBRWS = TAFILBRWUFLD /* (creates ADD REQ as an average) NAME FILADDS TYPE COUNT AVERAGE TATRANCT PRECISION 4 PROC FILADDS = TAFILADDUFLD /* (creates UPDATE REQ as an average) NAME FILUPDS TYPE COUNT AVERAGE TATRANCT PRECISION 4 PROC FILUPDS = TAFILUPDREPORT LINE LMRKDATE TASYSID TAFILVOL TAFILETI TAFILECT(T) TAFILEXC FILDELS(A) FILGETS(A) FILBRWS(A) FILADDS(A) FILUPDS(A)
0

2 Producing Reports
PROC WHEN TAFILID{1,1} = ' ' THEN REJECT SUMF LMRKDATE TASYSID TAFILVOL TAFILEXC SFORM LMRKDATE TAFILVOL TAFILETI TAFILECT TAFILEXC TITLE 'VOLSER ANALYSIS' WIDTH 132 COVER NO
31

ASG-TMON for CICS TS for z/OS Report Writer Guide
3
RWTA04 - Access Method Summary
PurposeThe Access Method Summary report provides a summary of file statistics by access method type within date and system ID. This report is similar to RWTA02 and RWTA03, except that it describes access methods. Use this report to track the transition from older to newer access methods.
Report DataThis report uses the transaction performance (TA) records. The table lists the report fields. The TMON for CICS TS or user-defined (for UFLD statements) field name is enclosed in brackets.
DATE: 04/29/04 A S G - T M O N f o r C I C S T S PAGE: 1TIME: 09:59:03 A C C E S S M E T H O D S U M M A R Y
DATA IS FROM 04/25/04 AT 00:01 TO 04/25/04 AT 18:00
END CICS ACCESS FILE ACCESS FILE ACCESS FILE FILE DEL FILE GET FILE BRW FILE ADD FILE UPDDATE SYSID METHOD TIME COUNT EXC REQ COUNT REQ COUNT REQ COUNT REQ COUNT REQ COUNT
AVG TOT CONDS TOT TOT TOT TOT TOT
04/25/04 MFA RMTE 0.0299 91 00 0 87 0 4 0RMTE 0.0299 91 ** 0 87 0 4 0
VSAM 0.0026 3,855 00 0 3,855 0 0 0VSAM 0.0026 3,855 ** 0 3,855 0 0 0
MFA **** 0.0032 3,946 ** 0 3,942 0 4 0
04/25/04 **** **** 0.0032 3,946 ** 0 3,942 0 4 0
TOTALS 0.0032 3,946 0 3,942 0 4 0
Field Description
ACCESS METHOD [UFLD AMTYPE]
Displays the access method type, defined through a UFLD statement.
CICS SYSID [TASYSID] Displays the system identifier.
END DATE [LMRKDATE] Displays the date the record was written.
FILE ACCESS COUNT TOT [TAFILECT]
Displays the total file request count.
FILE ACCESS TIME TOT [TAFILETI]
Displays the elapsed time for file requests.
FILE ADD REQ COUNT TOT [TAFILADD]
Displays the file add count.
2

2 Producing Reports
Control StatementsThese control statements, used to produce this report, are in the installation library in member RWTA04:
OPTION PLEFTUFLD NAME EXCPIND TYPE CHAR LENGTH 15 HEAD1 ‘FILE EXCEPTION’ HEAD2 ‘ INDICATOR ’ PROC WHEN TAFILEXC = 80 THEN EXCPIND = ‘VSAM STRNG WAIT’ WHEN TAFILEXC = 40 THEN EXCPIND = ‘LSR BUFFER WAIT’ WHEN TAFILEXC = 20 THEN EXCPIND = ‘VSAM CI SPLIT’ WHEN TAFILEXC = 10 THEN EXCPIND = ‘VSAM CA SPLIT’ WHEN TAFILEXC = 08 THEN EXCPIND = ‘DB2 POOL OVRFLW’ WHEN TAFILEXC = 04 THEN EXCPIND = ‘DB2 THREAD WAIT’ WHEN TAFILEXC = 02 THEN EXCPIND = ‘LSR STRING WAIT’UFLD NAME AMTYPE TYPE CHAR LENGTH 4 HEAD1 ‘ACCESS’ HEAD2 ‘METHOD’ PROC WHEN TAFILACM = 80 THEN AMTYPE = ‘ISAM’ WHEN TAFILACM = 40 THEN AMTYPE = ‘BDAM’ WHEN TAFILACM = 20 THEN AMTYPE = ‘VSAM’ WHEN TAFILACM = 10 THEN AMTYPE = ‘QSAM’ WHEN TAFILACM = 08 THEN AMTYPE = ‘RMTE’ WHEN TAFILACM = 04 THEN AMTYPE = ‘DL/I’ WHEN TAFILACM = 02 THEN AMTYPE = ‘DB2 ’ WHEN TAFILACM = 01 THEN AMTYPE = ‘USER’
FILE BRW REQ COUNT TOT [TAFILBRW]
Displays the file browse count.
FILE DEL REQ COUNT TOT [TAFILDEL]
Displays the file delete count.
FILE EXC CONDS [TAFILEXC] Displays the code of any file exception conditions observed.
FILE GET REQ COUNT TOT [TAFILGET]
Displays the file get count.
FILE UPD REQ COUNT TOT [TAFILUPD]
Displays the file update count.
Field Description
33

ASG-TMON for CICS TS for z/OS Report Writer Guide
3
REPORT LINE LMRKDATE TASYSID AMTYPE TAFILETI TAFILECT(T) TAFILEXC TAFILDEL(T) TAFILGET(T) TAFILBRW(T) TAFILADD(T) TAFILUPD(T) PROC WHEN TAFILID{1,1} = ‘ ’ THEN REJECT SUMF LMRKDATE TASYSID AMTYPE TAFILEXC SFORM TAFILETI TAFILECT TAFILEXC TAFILDEL TAFILGET TAFILBRW TAFILADD TAFILUPDTITLE ‘ACCESS METHOD SUMMARY’COVER NO
CustomizationYou might want to focus on particular hours of the day, instead of reporting on the entire day’s activity for April 25, 2004. To limit the reported activity only to that data between the hours of 2 P.M. and 4 P.M., code this SELECT statement:
SELECT FDATA DATE 042504 TDATA DATE 042504 TRANGE 140000 160000
Suppose you want to report the standard deviation for file access time. You could add field TAFILETI(S) to the LINE statement. Standard deviation is computed using the conventional statistical formula using the sum, the sum of the squares, and the average calculated for the interval. It helps you to determine if one or more transactions are creating an extremely high or extremely low, inaccurate average or if much of the data is actually in the vicinity of the value represented as the average. If the latter is true, you can assume the average shown on the report accurately represents the median.
4

2 Producing Reports
RWTA05 - MRO Remote System Overview
PurposeThe MRO Remote System Overview report provides information on remote system usage by date, system ID, and remote system ID.
Report DataThis report uses the transaction performance (TA) records. The table lists the report fields. The TMON for CICS TS or user-defined (for UFLD statements) field name is enclosed in brackets.
DATE: 04/08/04 A S G - T M O N f o r C I C S T S PAGE: 1TIME: 16:14:44 M R O R E M O T E S Y S T E M O V E R V I E W
DATA IS FROM 03/20/04 AT 13:51 TO 03/24/04 AT 11:35 END CICS TARGET TARGET MRO/ISC MRO/ISC DATE SYSID SYSTEM SYSTEM EVENT COUNT ELAPSED TIME SYSID APPLID TOT AVG 03/20/04 53D0 XAOR BCEA53A0 8 0.3799 53D0 **** 8 0.3799 53T0 IAOR BCEA53A0 8 0.4695 53T0 **** 8 0.4695 03/20/04 **** **** 16 0.4247 03/21/04 41T0 62T0 BCEA62T0 8 0.2846 41T0 **** 8 0.2846 52T0 62T0 BCEA62T0 7 0.0604 52T0 **** 7 0.0604 53T0 62T0 BCEA62T0 9 0.0642 53T0 **** 9 0.0642 03/21/04 **** **** 24 0.1366 03/24/04 53A0 ITOR BCEA53T0 8 0.0478 XDOR BCEA53D0 8 0.4096 53T0 BCEA53T0 44 0.0000 53A0 **** 60 0.0610 53D0 XAOR BCEA53A0 8 0.2168 53D0 **** 8 0.2168 53T0 IAOR BCEA53A0 8 0.0112 53A0 BCEA53A0 46 0.3889 53T0 **** 54 0.3329 03/24/04 **** **** 122 0.1916 TOTALS 162 0.2064
Field Description
CICS SYSID [TASYSID] Displays the system identifier.
END DATE [LMRKDATE] Displays the date the record was written.
35

ASG-TMON for CICS TS for z/OS Report Writer Guide
3
Control StatementsThese control statements, used to produce this report, are in the installation library in member RWTA05:
OPTION PLEFT SELECT PROC WHEN TATARECT > 0 THEN ACCEPT REPORT LINE LMRKDATE TASYSID TATARSID TATARAID TATARECT TATARETM SUMF LMRKDATE TASYSID TATARSID TITLE ‘MRO REMOTE SYSTEM OVERVIEW’ COVER NO
CustomizationYou might want to see more detailed information about remote system usage, specifically transaction volume between regions. By adding the TAPTRAN (CICS primary transaction ID) and TATRANCT (transaction count) fields, you can create a report of transaction summary.
Change the LINE and SUMF statements to:
REPORTLINE LMRKDATE TASYSID TATARSID TAPTRAN TATARAID TATARECT TATARETMTATRANCTSUMF LMRKDATE TASYSID TATARSID TAPTRAN
MRO/ISC ELAPSED TIME AVG [TATARETM]
Displays the average elapsed time for requests issued across the MRO/ISC link.
MRO/ISC EVENT COUNT TOT [TATARECT]
Displays the total number of MRO/ISC requests.
TARGET SYSTEM APPLID [TATARAID]
Displays the multiregion operation (MRO) application identifier.
TARGET SYSTEM SYSID [TATARSID]
Displays the multiregion operation (MRO) system identifier of the target region.
Field Description
6

2 Producing Reports
The new SUMF statement causes summarization of transaction ID within the MRO system ID, as shown in this report.
DATE: 04/29/04 A S G - T M O N f o r C I C S T S PAGE: 1TIME: 16:12:59 M R O R E M O T E S Y S T E M O V E R V I E W
DATA IS FROM 03/20/04 AT 13:51 TO 03/21/04 AT 11:35 END CICS TARGET PRIMARY TARGET MRO/ISC MRO/ISC TRAN DATE SYSID SYSTEM TRANID SYSTEM EVENT COUNT ELASED TIME COUNT SYSID APPLID TOT AVG TOT 03/20/04 53D0 XAOR CLQ2 BCEA53A0 4 0.0727 1 CLR2 BCEA53A0 4 0.6871 1 XAOR ******** 8 0.3799 2 53D0 **** ******** 8 0.3799 2 53T0 IAOR CLQ2 BCEA53A0 4 0.0978 1 CLR2 BCEA53A0 4 0.8412 1 IAOR ******** 8 0.4695 2 53T0 **** ******** 8 0.4695 2 03/20/04 **** **** ******** 16 0.4247 4 03/21/04 41T0 62T0 CEMT BCEA62T0 2 0.0574 1 CRTE BCEA62T0 5 0.4325 2 CSSF BCEA62T0 1 0.0000 1 62T0 ******** 8 0.2846 4 41T0 **** ******** 8 0.2846 4 52T0 62T0 CEMT BCEA62T0 2 0.0577 1 CRTE BCEA62T0 4 0.0768 2 CSSF BCEA62T0 1 0.0000 1 62T0 ******** 7 0.0604 4 52T0 **** ******** 7 0.0604 4 53T0 62T0 CEMT BCEA62T0 4 0.0496 2 CRTE BCEA62T0 4 0.0948 2 CSSF BCEA62T0 1 0.0000 1 62T0 ******** 9 0.0642 5 53T0 **** ******** 9 0.0642 5 03/21/04 **** **** ******** 24 0.1366 13
37
ASG-TMON for CICS TS for z/OS Report Writer Guide
3
RWTA06 - Transaction Summary
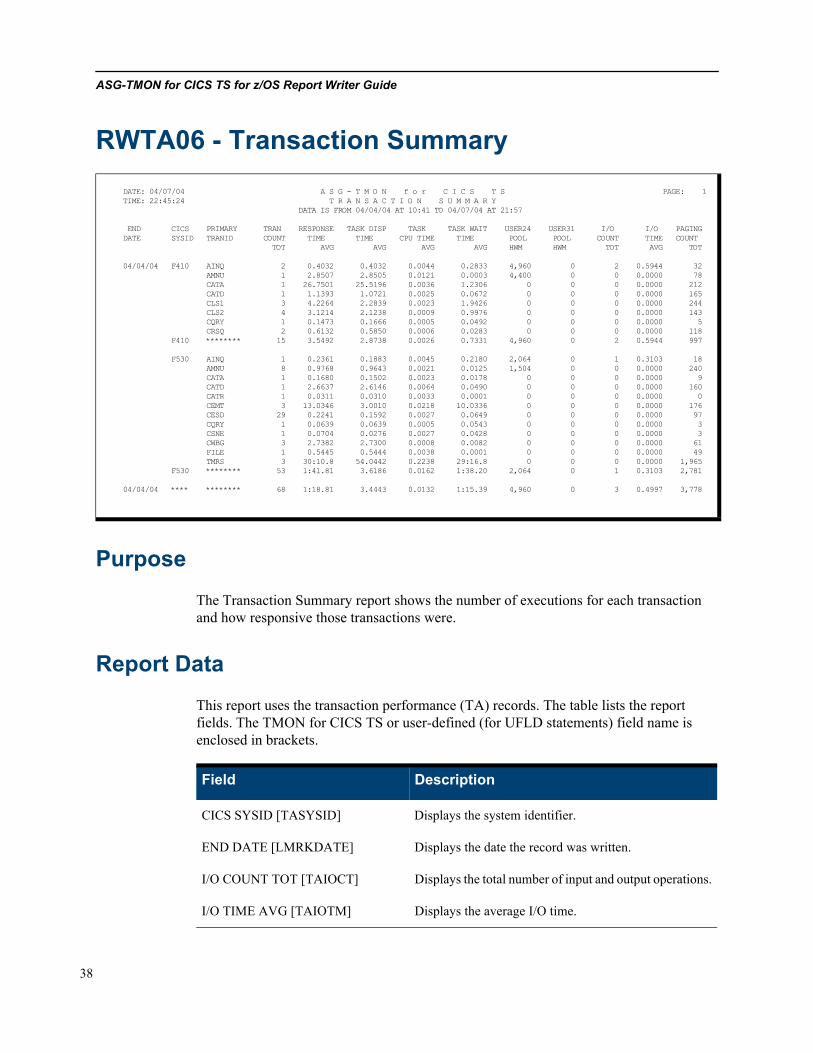
PurposeThe Transaction Summary report shows the number of executions for each transaction and how responsive those transactions were.
Report DataThis report uses the transaction performance (TA) records. The table lists the report fields. The TMON for CICS TS or user-defined (for UFLD statements) field name is enclosed in brackets.
DATE: 04/07/04 A S G - T M O N f o r C I C S T S PAGE: 1TIME: 22:45:24 T R A N S A C T I O N S U M M A R Y
DATA IS FROM 04/04/04 AT 10:41 TO 04/07/04 AT 21:57
END CICS PRIMARY TRAN RESPONSE TASK DISP TASK TASK WAIT USER24 USER31 I/O I/O PAGINGDATE SYSID TRANID COUNT TIME TIME CPU TIME TIME POOL POOL COUNT TIME COUNT
TOT AVG AVG AVG AVG HWM HWM TOT AVG TOT
04/04/04 F410 AINQ 2 0.4032 0.4032 0.0044 0.2833 4,960 0 2 0.5944 32AMNU 1 2.8507 2.8505 0.0121 0.0003 4,400 0 0 0.0000 78CATA 1 26.7501 25.5196 0.0036 1.2306 0 0 0 0.0000 212CATD 1 1.1393 1.0721 0.0025 0.0672 0 0 0 0.0000 165CLS1 3 4.2264 2.2839 0.0023 1.9426 0 0 0 0.0000 244CLS2 4 3.1214 2.1238 0.0009 0.9976 0 0 0 0.0000 143CQRY 1 0.1473 0.1666 0.0005 0.0492 0 0 0 0.0000 5CRSQ 2 0.6132 0.5850 0.0006 0.0283 0 0 0 0.0000 118
F410 ******** 15 3.5492 2.8738 0.0026 0.7331 4,960 0 2 0.5944 997
F530 AINQ 1 0.2361 0.1883 0.0045 0.2180 2,064 0 1 0.3103 18AMNU 8 0.9768 0.9643 0.0021 0.0125 1,504 0 0 0.0000 240CATA 1 0.1680 0.1502 0.0023 0.0178 0 0 0 0.0000 9CATD 1 2.6637 2.6146 0.0064 0.0490 0 0 0 0.0000 160CATR 1 0.0311 0.0310 0.0033 0.0001 0 0 0 0.0000 0CEMT 3 13.0346 3.0010 0.0218 10.0336 0 0 0 0.0000 176CESD 29 0.2241 0.1592 0.0027 0.0649 0 0 0 0.0000 97CQRY 1 0.0639 0.0639 0.0005 0.0543 0 0 0 0.0000 3CSNE 1 0.0704 0.0276 0.0027 0.0428 0 0 0 0.0000 3CWBG 3 2.7382 2.7300 0.0008 0.0082 0 0 0 0.0000 61FILE 1 0.5445 0.5444 0.0038 0.0001 0 0 0 0.0000 49TMRS 3 30:10.8 54.0442 0.2238 29:16.8 0 0 0 0.0000 1,965
F530 ******** 53 1:41.81 3.6186 0.0162 1:38.20 2,064 0 1 0.3103 2,781
04/04/04 **** ******** 68 1:18.81 3.4443 0.0132 1:15.39 4,960 0 3 0.4997 3,778
Field Description
CICS SYSID [TASYSID] Displays the system identifier.
END DATE [LMRKDATE] Displays the date the record was written.
I/O COUNT TOT [TAIOCT] Displays the total number of input and output operations.
I/O TIME AVG [TAIOTM] Displays the average I/O time.
8

2 Producing Reports
Control StatementsThese control statements, used to produce this report, are in the installation library in member RWTA06:
OPTION PLEFTREPORT LINE LMRKDATE TASYSID TAPTRAN TATRANCT TARSPTM TATSKDTM TACPURTM TATSKWTM TAU24HWM(X) TAU31HWM(X) TAIOCT TAIOTM TAPGETCT SUMF LMRKDATE TASYSID TAPTRAN SFORM TATRANCT TARSPTM TATSKDTM TACPURTM TATSKWTM TAU24HWM TAU31HWM TAIOCT TAIOTM TAPGETCT TITLE ‘TRANSACTION SUMMARY’ WIDTH 132 COVER NO
PAGING COUNT TOT [TAPGECT] Displays the total number of page-in and page-out operations.
PRIMARY TRANID [TAPTRAN] Displays the CICS primary transaction ID.
RESPONSE TIME AVG [TARSPTM]
Displays the transaction response time.
TASK CPU TIME AVG [TACPURTM]
Displays the average transaction CPU time.
TASK DISP TIME AVG [TATSKDTM]
Displays the average transaction dispatch time.
TASK WAIT TIME AVG [TATSKWTM]
Displays the average transaction wait time.
TRAN COUNT TOT [TATRANCT] Displays the transaction count.
USER24 POOL HWM [TAU24HWM]
Displays the transaction high DSA storage usage (below the 16M line).
USER31 POOL HWM [TAU31HWM]
Displays the transaction high XA storage usage.
Field Description
39

ASG-TMON for CICS TS for z/OS Report Writer Guide
4
CustomizationAfter examining the Transaction Summary report, you may want to focus on specific transaction activity for a particular SYSID, for example:
Suppose you want to examine each transaction that executed within system ID F530 on April 4, 2004, by hourly intervals. You need to add a SELECT statement and change the existing SUMF statement:
SELECT FDATA DATE 040404 TDATA DATE 040404 PROC WHEN TASYSID = 'F530' THEN ACCEPTREPORT LINE TAPTRAN LMRKTIME TARSPTM TATSKDTM(T) TACPURTM(T) TATSKWTM(T) TAU24HWM(T) TAU31HWM(T) TAIOCT(T) TAIOTM(T) TAPGETCT(T) SUMF TAPTRAN LMRKTIME(0100000000) WIDTH = 137
The SELECT statement limits the scope of the report to a particular date (April 4, 2004) and system ID (F530). The LMRKTIME field specified in the SUMF statement lowers the level of summarization to the start time of a transaction at hourly intervals.
Note:You can specify only one PROC parameter in the SELECT statement, and it must be the last parameter specified in the statement.
Switching the order of the fields on the SUMF statement and removing the TASYSID field also helps to limit the scope of the data, as shown in this report:
0

2 Producing Reports
DATE: 04/07/04 A S G - T M O N f o r C I C S T S PAGE: 1TIME: 23:00:50 T R A N S A C T I O N S U M M A R Y
DATA IS FROM 04/04/04 AT 10:41 TO 04/04/04 AT 14:54 PRIMARY END RESPONSE TASK DISP TASK TASK WAIT USER24 USER31 I/O I/O PAGINGTRANID TIME TIME TIME CPU TIME TIME POOL POOL COUNT TIME COUNT
AVG TOT TOT TOT HWM HWM TOT TOT TOT AINQ 11:00 0.2361 0.5649 0.0045 0.6539 2,064 0 1 0.3103 18 AINQ ***** 0.2361 0.5649 0.0045 0.6539 2,064 0 1 0.3103 18
AMNU 11:00 1.6809 3.2647 0.0048 0.0972 1,504 0 0 0.0000 107
13:00 1.5232 12.0829 0.0071 0.1025 6,016 0 0 0.0000 133 14:00 0.0136 0.0814 0.0048 0.0002 4,512 0 0 0.0000 0
AMNU ***** 0.9768 15.4290 0.0166 0.1999 12,032 0 0 0.0000 240 CATA 15:00 0.1680 0.3004 0.0023 0.0355 0 0 0 0.0000 9 CATA ***** 0.1680 0.3004 0.0023 0.0355 0 0 0 0.0000 9
CATD 15:00 2.6637 5.2293 0.0064 0.0981 0 0 0 0.0000 160 CATD ***** 2.6637 5.2293 0.0064 0.0981 0 0 0 0.0000 160
CATR 14:00 0.0311 0.0620 0.0033 0.0001 0 0 0 0.0000 0CATR ***** 0.0311 0.0620 0.0033 0.0001 0 0 0 0.0000 0
CEMT 11:00 1.7159 2.0151 0.0202 1.4167 0 0 0 0.0000 42 13:00 21.9839 14.2664 0.0239 29.7014 0 0 0 0.0000 102 15:00 15.4039 1.7244 0.0213 29.0834 0 0 0 0.0000 32
CEMT ***** 13.0346 18.0059 0.0654 1:00.2015 0 0 0 0.0000 176
CESD 11:00 0.8910 1.1880 0.0056 0.5940 0 0 0 0.0000 14 13:00 0.2381 4.1388 0.0396 2.5283 0 0 0 0.0000 42 15:00 0.1624 3.9057 0.0328 0.6412 0 0 0 0.0000 41
CESD ***** 0.2241 9.2325 0.0780 3.7635 0 0 0 0.0000 97
41

ASG-TMON for CICS TS for z/OS Report Writer Guide
4
RWTA07 - Terminal Usage Report
PurposeThe Terminal Usage Report provides a daily log of terminal usage. Use this report to identify the terminals used most frequently.
Report DataThis report uses the transaction performance (TA) records. The table lists the report fields. The TMON for CICS TS or user-defined (for UFLD statements) field name is enclosed in brackets.
DATE: 04/29/04 A S G - T M O N f o r C I C S T S PAGE: 1TIME: 17:38:57 T E R M I N A L U S A G E R E P O R T
DATA IS FROM 03/25/04 AT 07:18 TO 03/25/04 AT 10:38
END JOB TERM INITIAL END RESPONSE TRAN TRAN COUNT LOGON IDLE DATE NAME ID TIME TIME TIME COUNT <--200---> DURATION TIME AVG TOT TOT TOT
03/25/04 CICSMFA <AAA 9:18:40.7448 9:24:11.8658 0.7874 4 5:31.1210 5:27.9714<AE0 7:42:31.5369 10:07:07.3938 0.0564 22 = 2:24:35.8569 2:24:34.6166<AHS 7:43:48.3524 10:37:53.1851 0.0578 28 = 2:54:04.8326 2:54:03.2147$C01 7:20:19.5770 10:38:19.1663 0.0777 76 ==== 3:17:59.5893 3:17:53.6827-A90 8:16:44.2776 8:17:03.0451 1.2339 2 18.7675 16.2996-A91 8:10:01.4977 10:18:12.5784 0.2015 676 =========+ 2:08:11.0807 2:05:54.8340-BBB 8:05:09.0607 8:05:14.0984 2.5188 2 5.0377 0.00015GKA 8:07:27.3921 8:07:36.1425 0.0446 2 8.7504 8.66135GLI 10:20:54.1363 10:20:57.6710 0.0262 2 3.5347 3.48235GPM 8:51:55.5736 8:51:59.1105 0.1946 2 3.5369 3.14775OAI 7:18:32.1440 9:51:46.2225 0.0619 2,055 =========+ 2:33:14.0785 2:31:06.85245O9T 7:21:15.0656 8:41:06.2879 0.0715 408 =========+ 1:19:51.2223 1:19:22.06425O9U 7:21:18.9571 7:44:26.9518 0.0890 159 ======== 23:07.9947 22:53.83745O9V 7:21:22.8799 7:45:56.1932 0.1062 206 =========+ 24:33.3133 24:11.42765O9W 7:43:40.6869 7:45:13.1942 0.0936 267 =========+ 1:32.5073 1:07.52455SU6 10:01:13.8737 10:06:45.3318 0.5283 16 = 5:31.4582 5:23.00535SVO 8:36:30.0582 8:37:42.8058 0.4146 13 = 1:12.7476 1:07.35775SW7 7:29:09.9128 7:31:18.1656 0.1738 50 === 2:08.2528 1:59.56495UNP 9:07:42.6246 9:25:39.5706 0.2079 96 ===== 17:56.9460 17:36.98945UOL 9:07:44.8945 9:43:34.3135 0.1137 36 == 35:49.4190 35:45.32495UOP 10:30:23.3535 10:31:11.9253 0.6112 9 48.5718 43.07136EMM 10:37:03.4833 10:37:07.6861 0.0042 2 4.2028 4.19446VCT 8:23:47.3225 8:45:23.6902 0.0963 14 = 21:36.3677 21:35.01896VC0 8:43:13.1819 10:33:02.2039 0.0912 32 == 1:49:49.0220 1:49:46.10386V8X 7:51:38.4460 8:29:28.0571 0.0848 92 ===== 37:49.6111 37:41.81367BPR 9:07:03.3190 9:28:18.9996 0.1782 10 = 21:15.6806 21:13.89897BPZ 8:42:12.1777 9:13:37.8505 0.4352 38 == 31:25.6728 31:09.13667BQC 8:38:42.0001 8:41:59.1388 0.0200 13 = 3:17.1387 3:16.87897BTN 9:02:35.4771 10:03:06.3478 0.2360 55 === 1:00:30.8708 1:00:17.89097BT1 9:19:50.5714 9:47:22.3740 0.1659 14 = 27:31.8026 27:29.47947BUS 9:57:32.0840 10:37:53.1966 0.0610 22 = 40:21.1126 40:19.77077C0K 8:22:20.3064 9:01:59.6673 0.5925 40 == 39:39.3609 39:15.65957FPF 9:31:56.8804 10:37:39.1139 0.1625 245 =========+ 1:05:42.2335 1:05:02.41657FP0 9:08:03.8899 9:23:07.8774 0.0183 12 = 15:03.9875 15:03.76827K4R 10:06:27.2464 10:30:32.6826 0.6867 85 ==== 24:05.4362 23:07.06607K68 8:48:25.9117 8:52:59.4454 0.0697 13 = 4:33.5337 4:32.62717V6T 9:56:34.3735 10:05:42.2387 0.0868 17 = 9:07.8652 9:06.3888
CICSMFA **** 9:56:34.3735 10:05:42.2387 0.1236 4,835 =========+ 9:07.8652 49.610503/25/04 ******** **** 9:56:34.3735 10:05:42.2387 0.1236 4,835 =========+ 9:07.8652 49.6105
TOTALS 9:56:34.3735 10:05:42.2387 0.1236 4,835 =========+ 9:07.8652 49.6105
2

2 Producing Reports
Control StatementsThese control statements, used to produce this report, are in the installation library in member RWTA07:
OPTION PLEFT UFLD NAME LOGONTM HEAD1 = ‘ LOGON ’ HEAD2 = ‘DURATION’ TYPE TIME UFLD NAME FIRSTTM HEAD1 ‘INITIAL’ HEAD2 ‘ TIME ’ TYPE TIMEP UFLD NAME IDLETIME HEAD1 ‘ IDLE ’ HEAD2 ‘ TIME ’ TYPE TIME
Field Description
END DATE [LMRKDATE] Displays the date the record was written.
END TIME [UFLD ENDTIME] Displays the transaction stop time, defined through a UFLD statement.
IDLE TIME TOT [UFLD IDLETIME]
Displays the time a terminal was idle, defined through a UFLD statement.
INITIAL TIME [UFLD FIRSTTM]
Displays the transaction start time, defined through a UFLD statement.
JOB NAME [LMRKJOBN] Displays the name of the CICS job. This value is obtained from the TIOT control block.
LOGON DURATION TOT [UFLD LOGONTM]
Displays the time a terminal was logged onto CICS, defined through a UFLD statement.
RESPONSE TIME AVG [TARSPTM]
Displays the response time.
TERM ID [TATERID] Displays the terminal ID.
TRAN COUNT TOT [TATRANCT] Displays and graphs the transaction count.
43

ASG-TMON for CICS TS for z/OS Report Writer Guide
4
UFLD NAME ENDTIME HEAD1 ‘END ’ HEAD2 ‘TIME’ TYPE TIMEP UFLD NAME BLANKTER TYPE HEX LENGTH 4 PROC BLANKTER = ‘40404040’UFLD NAME NULLTERM TYPE HEX LENGTH 4 PROC BLANKTER = ‘00000000’SELECT PROC WHEN TATERID = BLANKTER OR TATERID = NULLTERM THEN REJECTREPORT LINE LMRKDATE LMRKJOBN TATERID FIRSTTM ENDTIME TARSPTM TATRANCT LOGONTM IDLETIME SFORM TATRANCT SORTF LMRKDATE LMRKJOBN TASTRTOD SUMF LMRKDATE LMRKJOBN TATERID TITLE ‘TERMINAL USAGE REPORT’ GRAPHS = TATRANCT(200) AT FIRST TATERID FIRSTTM = TASTRTOD AT LAST TATERID ENDTIME = TAENDTOD AT PRINT TATERID LOGONTM = ENDTIME - FIRSTTM IDLETIME = LOGONTM - TARSPTM WIDTH 133 COVER NO
CustomizationSuppose you are more interested in logging the monthly activity of a particular terminal ID than a daily usage account of all terminal IDs. To obtain a list of the activity for each terminal ID, by terminal ID, change the SUMF statement to:
SUMF TATERID LMRKDATE
Change the LINE statement to:
LINE TATERID LMRKDATE TASTRTOD LMRKTIME TARSPTM TATRANCT LOGONTM IDLETIME
The SUMF statement forces a control break every time the terminal ID changes. Report Writer prints a detail line for each day TMON for CICS TS logs that the terminal ID is in use.
The new LINE statement tells Report Writer to print these fields, in order:
4

2 Producing Reports
Terminal IDEnd dateInitial (start) timeEnd timeResponse timeLogon durationIdle time
as shown in this report:
.
DATE: 04/29/04 A S G - T M O N f o r C I C S T S PAGE: 1TIME: 18:22:30 T E R M I N A L U S A G E R E P O R T
DATA IS FROM 03/25/04 AT 07:18 TO 03/25/04 AT 10:38
TERM END START END RESPONSE TRAN TRAN COUNT TOT LOGON IDLEID DATE TIME TIME TIME COUNT <-----200------> DURATION TIME
AVG TOT TOT TOT
<AAA 03/25/04 9:24:11.7811 9:24:11.8658 0.7874 4 0.0000 0.0000<AAA ******** 9:24:11.7811 9:24:11.8658 0.7874 4 5:31.1210 5:27.9714
<AE0 03/25/04 10:07:07.3933 10:07:07.3938 0.0564 22 == 0.0000 0.0000<AE0 ******** 10:07:07.3933 10:07:07.3938 0.0564 22 == 10:07:07.3938 10:07:06.1535
<AHS 03/25/04 10:37:53.1846 10:37:53.1852 0.0578 28 == 0.0000 0.0000<AHS ******** 10:37:53.1846 10:37:53.1852 0.0578 28 == 10:37:53.1851 10:37:51.5672
$C01 03/25/04 10:38:19.1416 10:38:19.1715 0.0777 76 ====== 0.0000 0.0000$C01 ******** 10:38:19.1416 10:38:19.1715 0.0777 76 ====== 10:38:19.1663 10:38:13.2597
-A90 03/25/04 8:17:03.0106 8:17:03.0452 1.2339 2 0.0000 0.0000-A90 ******** 8:17:03.0106 8:17:03.0452 1.2339 2 8:17:03.0451 8:17:00.5773
-A91 03/25/04 10:18:12.5692 10:18:12.5784 0.2015 676 ===============+ 0.0000 0.0000-A91 ******** 10:18:12.5692 10:18:12.5784 0.2015 676 ===============+ 10:18:12.5784 10:15:56.3317
-BBB 03/25/04 8:05:13.4519 8:05:14.0984 2.5188 2 0.0000 0.0000-BBB ******** 8:05:13.4519 8:05:14.0984 2.5188 2 8:05:14.0984 8:05:09.0608
5GKA 03/25/04 8:07:36.0945 8:07:36.1427 0.0446 2 0.0000 0.00005GKA ******** 8:07:36.0945 8:07:36.1427 0.0446 2 8:07:36.1425 8:07:36.0533
5GLI 03/25/04 10:20:57.6454 10:20:57.6710 0.0262 2 0.0000 0.00005GLI ******** 10:20:57.6454 10:20:57.6710 0.0262 2 10:20:57.6710 10:20:57.6186
5GPM 03/25/04 8:51:58.7733 8:51:59.1106 0.1946 2 0.0000 0.00005GPM ******** 8:51:58.7733 8:51:59.1106 0.1946 2 8:51:59.1105 8:51:58.7214
5OAI 03/25/04 9:51:46.2128 9:51:46.2237 0.0619 2,055 ===============+ 0.0000 0.00005OAI ******** 9:51:46.2128 9:51:46.2237 0.0619 2,055 ===============+ 9:51:46.2225 9:49:38.9964
5O9T 03/25/04 8:41:06.2819 8:41:06.2879 0.0715 408 ===============+ 0.0000 0.00005O9T ******** 8:41:06.2819 8:41:06.2879 0.0715 408 ===============+ 8:41:06.2879 8:40:37.1298
5O9U 03/25/04 7:44:26.9488 7:44:26.9518 0.0890 159 ============= 0.0000 0.00005O9U ******** 7:44:26.9488 7:44:26.9518 0.0890 159 ============= 7:44:26.9518 7:44:12.7945
5O9V 03/25/04 7:45:56.1117 7:45:56.1932 0.1062 206 ===============+ 0.0000 0.00005O9V ******** 7:45:56.1117 7:45:56.1932 0.1062 206 ===============+ 7:45:56.1932 7:45:34.3075
5O9W 03/25/04 7:45:13.1914 7:45:13.1942 0.0936 267 ===============+ 0.0000 0.00005O9W ******** 7:45:13.1914 7:45:13.1942 0.0936 267 ===============+ 7:45:13.1942 7:44:48.2114
5SU6 03/25/04 10:06:44.9437 10:06:45.3319 0.5283 16 = 0.0000 0.00005SU6 ******** 10:06:44.9437 10:06:45.3319 0.5283 16 = 10:06:45.3318 10:06:36.8790
TOTALS 10:05:42.2045 10:05:42.2387 0.1236 4,835 ===============+ 47:01.4939 37:04.0182
45

ASG-TMON for CICS TS for z/OS Report Writer Guide
4
RWTA08 - Transaction Rate Report
PurposeThe Transaction Rate Report shows statistics on transaction response time and number of transaction executions by the hour. Use this report to determine the busiest time of day for transaction executions.
Report DataThis report uses the transaction performance (TA) records. The table lists the report fields. The TMON for CICS TS or user-defined (for UFLD statements) field name is enclosed in brackets.
DATE: 04/07/04 A S G - T M O N f o r C I C S T S PAGE: 1TIME: 09:25:22 T R A N S A C T I O N R A T E R E P O R T
DATA IS FROM 03/25/04 AT 00:01 TO 03/25/04 AT 10:40
END CICS END TRAN TRANS RATE RESPONSE RESPONSE RESPONSE RESPONSEDATE SYSID TIME COUNT PER MINUTE TIME TIME TIME TIME
TOT TOT AVG MIN MAX STD
03/25/04 MFA 1:00 136 2 0.0039 0.0006 0.0128 0.00182:00 135 2 0.0043 0.0006 0.0517 0.00463:00 137 2 0.0040 0.0005 0.0162 0.00204:00 136 2 0.0051 0.0006 0.1069 0.00955:00 135 2 0.0041 0.0006 0.0417 0.00386:00 136 2 0.0036 0.0007 0.0254 0.00207:00 135 2 0.0039 0.0006 0.0145 0.00188:00 3,034 51 0.0615 0.0003 6.0367 0.25559:00 1,001 17 0.1520 0.0005 12.8411 0.577410:00 1,071 18 0.1841 0.0003 10.1480 0.617411:00 381 6 0.2694 0.0004 17.1414 1.0374
MFA ***** 6,437 107 0.0998 0.0003 17.1414 0.4635
03/25/04 **** ***** 6,437 107 0.0998 0.0003 17.1414 0.4635
TOTALS 6,437 107 0.0998 0.0003 17.1414 0.4635
Field Description
CICS SYSID [TASYSID] Displays the system identifier.
END DATE [LMRKDATE] Displays the date the record was written.
END TIME [LMRKTIME] Displays the time the record was written.
RESPONSE TIME AVG [TARSPTM] Displays the average response time.
RESPONSE TIME MAX [TARSPTM]
Displays the maximum response time.
RESPONSE TIME MIN [TARSPTM] Displays the minimum response time.
6

2 Producing Reports
Control StatementsThese control statements, used to produce this report, are in the installation library in member RWTA08:
OPTION PLEFTUFLD NAME TRANRATE HEAD1 = ‘TRANS RATE’ HEAD2 = ‘PER MINUTE’ TYPE COUNT REPORT LINE LMRKDATE TASYSID LMRKTIME TATRANCT TRANRATE TARSPTM TARSPTM(M) TARSPTM(X) TARSPTM(S) SUMF LMRKDATE TASYSID LMRKTIME(100000000) TITLE ‘TRANSACTION RATE REPORT’ AT PRINT LMRKTIME TRANRATE = TATRANCT / 60 WIDTH 132 COVER NO
CustomizationIf you notice heavy transaction activity within a specific hour displayed on the report, you may want to narrow the scope of the report to select only the time period of interest and lower the level of summarization from hourly intervals to 5- or 10-minute intervals. This may reveal normal response time for most intervals with only a few intervals showing longer response times. This process can be repeated until you are viewing detail data without any summarization. To lower the level of summarization to 10-minute intervals, change the SUMF statement to:
SUMF LMRKDATE TASYSID LMRKTIME(0010000000)
The more you narrow the scope and lower the level of summarization, the more you are able to focus on problem areas.
RESPONSE TIME STD [TARSPTM] Displays the standard deviation for response time.
TRAN COUNT TOT [TATRANCT] Displays the transaction count.
TRANS RATE PER MINUTE TOT [UFLD TRANRATE]
Displays the number of transactions per minute, defined through a UFLD statement.
Field Description
47

ASG-TMON for CICS TS for z/OS Report Writer Guide
4
RWTA09 - Cost Distribution by Transaction
PurposeThe Cost Distribution by Transaction report shows you how to use the TCOST and COSTF statements. It supplies the cost breakdown of CPU, storage utilization, and I/O for each transaction, based on a total cost of $10,000.00. The total cost, to be recovered from users, is distributed evenly among those resource consumption fields to which cost units were assigned. This report lets you see how much each cost unit is worth in dollars. Your actual cost distribution reports should be evaluated to meet your site’s specific needs.
Report DataThis report uses the transaction performance (TA) records. The table lists the report fields. The TMON for CICS TS or user-defined (for UFLD statements) field name is enclosed in brackets.
DATE: 04/07/04 A S G - T M O N f o r C I C S T S PAGE: 1TIME: 09:27:35 C O S T D I S T R I B U T I O N B Y T R A N S A C T I O N
DATA IS FROM 03/25/04 AT 00:01 TO 03/25/04 AT 10:40
END CICS PRIMARY TRAN TASK TASK TRANS TRANS I/O I/O TOTALDATE SYSID TRANID COUNT CPU TIME CPU TIME STORAGE STORAGE COUNT COUNT COST
TOT TOT COST MAX COST TOT COST
03/25/04 MFA ABN1 11 0.0257 2.92 0 .00 0 .00 2.92ABN2 76 0.0348 3.96 3,776 16.31 0 .00 20.27ABN5 76 0.0987 11.23 161,504 697.80 0 .00 709.03A001 427 0.3470 39.45 0 .00 0 .00 39.45A002 9 0.0088 1.00 0 .00 0 .00 1.00A003 1 0.0010 .12 0 .00 0 .00 .12BMTP 1,272 1.3729 156.10 4,096 296.20 3,816 21.69 473.99CATA 39 0.0898 10.21 0 .00 39 .22 10.43CATD 34 0.0732 8.32 0 .00 0 .00 8.32CESC 2 0.0039 .44 0 .00 0 .00 .44CESF 4 0.0051 .58 0 .00 0 .00 .58CLQ2 2 0.0012 .14 0 .00 0 .00 .14CLS1 1 0.0021 .24 0 .00 0 .00 .24CLS2 3 0.0034 .39 0 .00 0 .00 .39CRMF 1 0.0006 .07 0 .00 0 .00 .07CRSQ 1 0.0004 .05 0 .00 0 .00 .05CRSR 39 0.0180 2.05 0 .00 0 .00 2.05CSAC 4 0.0028 .32 0 .00 0 .00 .32CSKP 3 0.0078 .89 0 .00 0 .00 .89CSMI 15 0.0116 1.32 2,688 1.29 0 .00 2.61CSM3 10 0.0184 2.09 1,536 .87 0 .00 2.96CVMI 12 0.0167 1.89 48,592 33.15 0 .00 35.04CWBG 42 0.0251 2.86 0 .00 0 .00 2.86DTK 1 0.0031 .35 0 .00 0 .00 .35G085 38 0.0408 4.64 0 .00 0 .00 4.64G092 24 0.0240 2.73 0 .00 0 .00 2.73G105 57 0.0547 6.22 0 .00 0 .00 6.22G158 29 0.0299 3.40 0 .00 0 .00 3.40
Field Description
CICS SYSID [TASYSID] Displays the CICS system identifier.
8

2 Producing Reports
Control StatementsThese control statements, used to produce this report, are in the installation library in member RWTA09:
OPTION PLEFTUFLD NAME STORAGE TYPE COUNT HEAD1 ‘ TRANS ’ HEAD2 ‘STORAGE’ PROC STORAGE = TAU24HWM + TAU31HWMREPORT LINE LMRKDATE TASYSID TAPTRAN TATRANCT TACPURTM STORAGE(X) TAIOCT LMRKCOST SUMF LMRKDATE TASYSID TAPTRAN COSTF TACPURTM 5000 10 COSTF STORAGE 100000 1 COSTF TAIOCT 1000 1 TCOST 1000000 TITLE ‘COST DISTRIBUTION BY TRANSACTION’
END DATE [LMRKDATE] Displays the date the record was written.
I/O COUNT COST Displays the I/O count cost, calculated through the COSTF statement for TAIOCT.
I/O COUNT TOT [TAIOCT] Displays the total number of input and output operations.
PRIMARY TRANID [TAPTRAN] Displays the CICS primary transaction ID.
TASK CPU TIME COST Displays the CPU time cost, calculated through the COSTF statement for TACPURTM.
TASK CPU TIME TOT [TACPURTM]
Displays the total CPU time.
TOTAL COST [LMRKCOST] Displays the sum of all the COSTF calculations.
TRAN COUNT TOT [TATRANCT] Displays the transaction count.
TRANS STORAGE COST Displays the DSA and EDSA storage usage cost, calculated through the COSTF statement for UFLD STORAGE.
TRANS STORAGE MAX [UFLD STORAGE]
Displays the total high DSA and EDSA storage usage.
Field Description
49
ASG-TMON for CICS TS for z/OS Report Writer Guide
5
WIDTH 132 COVER NO
CustomizationThe TCOST statement coded for this report represents a total cost of $10,000.00 to be recovered. To customize this report, you should change this value relative to the number of days input to the report.
The COSTF statements assign a cost-unit value to four areas of resource consumption. Each COSTF statement translates an amount of resource into a number of cost units. The total cost units are then divided into the TCOST value, and each resource field is assigned a monetary value. If you change the first value in the COSTF statement, you adjust the resource amount. If you change the second value, you adjust the cost units equated to the resource consumption.
The Cost Distribution by Transaction report uses the amount specified in the TCOST statement and divides it by the total number of cost units calculated. The result is the monetary value of the cost unit. The monetary value is then multiplied by the number of cost units for each resource specified in a COSTF statement to determine the actual monetary value that the resource usage represents. The multiplication occurs on each line printed for the number of cost units for each resource specified in a COSTF statement.
As each record is read in, the number of cost units for each resource is calculated based on the COSTF statements. At end of file, the total cost (in the TCOST statement) is divided by the total number of cost units calculated during input. At output, the data is sorted, and at each control break summary, the cost units are accumulated. The total amount of cost units is multiplied by the cost-unit monetary value to determine the cost of the resource usage.
0

2 Producing Reports
RWTA10 - Cost Factoring by Transaction
PurposeThe Cost Factoring by Transaction report supplies the cost breakdown of CPU, storage utilization, and I/O for each transaction. Because cost is based only on utilization, the sum of the individual costs is not equal to any fixed amount.
Report DataThis report uses the transaction performance (TA) records. The table lists the report fields. The TMON for CICS TS or user-defined (for UFLD statements) field name is enclosed in brackets.
DATE: 04/08/04 A S G - T M O N f o r C I C S T S PAGE: 1TIME: 16:18:26 C O S T F A C T O R I N G B Y T R A N S A C T I O N
DATA IS FROM 03/14/04 AT 17:23 TO 03/25/04 AT 10:50 END CICS PRIMARY TRAN TASK TASK TRANS TRANS I/O I/O TOTAL DATE SYSID TRANID COUNT CPU TIME CPU TIME STORAGE STORAGE COUNT COUNT COST TOT TOT COST MAX COST TOT COST 03/21/04 41T0 CATA 1 0.0067 .00 0 .00 0 .00 .00 CATD 1 0.0043 .00 0 .00 0 .00 .00 CATR 1 0.0023 .00 0 .00 0 .00 .00 CEMT 2 0.0202 .00 0 .00 0 .00 .00 CGRP 1 0.0021 .00 0 .00 0 .00 .00 CITS 1 0.0030 .00 0 .00 0 .00 .00 CLS1 5 0.0087 .00 0 .00 0 .00 .00 CLS2 4 0.0056 .00 0 .00 0 .00 .00 CQRY 1 0.0021 .00 0 .00 0 .00 .00 CRSQ 1 0.0016 .00 0 .00 0 .00 .00 CRTE 5 0.0084 .00 0 .00 0 .00 .00 CSFU 1 0.0014 .00 0 .00 0 .00 .00 CSNE 1 0.0172 .00 0 .00 0 .00 .00 CSSF 1 0.0019 .00 0 .00 0 .00 .00 CSSY 16 0.9208 .18 1,552 .00 0 .00 .18 CSTP 1 0.0263 .00 0 .00 0 .00 .00 CSZI 1 0.0114 .00 0 .00 0 .00 .00 CXRE 1 0.0031 .00 0 .00 0 .00 .00 TMRS 1 2.9553 .59 0 .00 0 .00 .59 41T0 ******** 46 4.0026 .80 1,552 .00 0 .00 .80 52T0 CATA 1 0.0056 .00 0 .00 0 .00 .00 CATD 1 0.0044 .00 0 .00 0 .00 .00 CATR 1 0.0033 .00 0 .00 0 .00 .00 CEMT 2 0.0206 .00 0 .00 0 .00 .00 CESD 1 0.0046 .00 0 .00 0 .00 .00 CGRP 1 0.0019 .00 0 .00 0 .00 .00 CITS 1 0.0034 .00 0 .00 0 .00 .00
Field Description
CICS SYSID [TASYSID] Displays the CICS system identifier.
END DATE [LMRKDATE] Displays the date the record was written.
I/O COUNT COST Displays the I/O count cost, calculated through the COSTF statement for TAIOCT.
51

ASG-TMON for CICS TS for z/OS Report Writer Guide
5
Control StatementsThese control statements, used to produce this report, are in the installation library in member RWTA10:
OPTION PLEFTUFLD NAME STORAGE TYPE COUNT HEAD1 ‘ TRANS ’ HEAD2 ‘STORAGE’ PROC STORAGE = TAU24HWM + TAU31HWMREPORT LINE LMRKDATE TASYSID TAPTRAN TATRANCT TACPURTM STORAGE(X) TAIOCT LMRKCOST SUMF LMRKDATE TASYSID TAPTRAN COSTF TACPURTM 5000 10 COSTF STORAGE 100000 1 COSTF TAIOCT 1000 1 TITLE ‘COST FACTORING BY TRANSACTION’ WIDTH 132 COVER NO
I/O COUNT TOT [TAIOCT] Displays the total number of input and output operations.
PRIMARY TRANID [TAPTRAN] Displays the CICS primary transaction ID.
TASK CPU TIME COST Displays the CPU time cost, calculated through the COSTF statement for TACPURTM.
TASK CPU TIME TOT [TACPURTM]
Displays the total CPU time.
TOTAL COST [LMRKCOST] Displays the sum of all the COSTF calculations.
TRAN COUNT TOT [TATRANCT] Displays the transaction count.
TRANS STORAGE COST Displays the DSA and EDSA storage usage cost, calculated through the COSTF statement for UFLD STORAGE.
TRANS STORAGE MAX [UFLD STORAGE]
Displays the total high DSA and EDSA storage usage.
Field Description
2

2 Producing Reports
CustomizationThe COSTF statements assign a monetary value to each resource and then calculates the cost of each resource. Where the Cost Distribution by Transaction report reduced all resources to a common denominator, this report charges each resource. This type of cost report is useful when the MIS budget is formed by charging users, and you want to show a profit.
53

ASG-TMON for CICS TS for z/OS Report Writer Guide
5
RWTA11 - Application Total Page
PurposeThe Application Total Page report summarizes and presents information from the transaction performance (TA) records on one page.
DATE: 04/22/04 A S G - T M O N f o r C I C S T S PAGE: 1TIME: 15:26:39 APPLICATION TOTAL PAGE
DATA IS FROM 03/06/04 AT 11:26 TO 04/06/04 AT 13:49
RESPONSE TIME DISTRIBUTION RESPONSE TIME ANALYSISRESPONSE TXNS PCT CUM % 0 1 2 3 4 5 6 7 8 9 0 AVG PERCENT 0 1 2 3 4 5 6 7 8 9 00.0-0.5 SEC 1,538 27.7% 27.7% %%%%%% RESPONSE TIME 38.5587 100.0% %%%%%%%%%%%%%%%%%%%%%0.5-1.0 SEC 178 3.2% 30.9% DISPATCH TIME .3611 .9%1.0-1.5 SEC 160 2.8% 33.7% WAIT TIME 38.2978 99.3% %%%%%%%%%%%%%%%%%%%%1.5-2.0 SEC 102 1.8% 35.6% REDISPATCH TIME .0063 .4%2.0-2.5 SEC 512 9.2% 44.8% %% QUEUE TIME .0036 .0%2.5-3.0 SEC 122 2.1% 47.0% CPU/DISPATCH .0083 1.1%3.0-3.5 SEC 70 1.2% 48.3% FILE WAIT 9.7536 6.2% %%3.5-4.0 SEC 34 .6% 48.9% DL/I WAIT .0880 .0%4.0-4.5 SEC 74 1.3% 50.2% DB2 WAIT 30.9303 3.4%4.5-5.0 SEC 14 .2% 50.5% TD WAIT .0000 .0%5.0 +++ SEC 2,748 49.4% 100.0% %%%%%%%%%% TS WAIT .0159 .0%TOTAL TRANSACTIONS NOT REJECTED 2,739 JOURNAL WAIT .0158 .0%
USER DATA BASE .0000 .0%PROGRAM FETCH .0043 .0%
APPLICATION PROFILE MRO/ISC TIME 21.0980 5.5% %%AVG CPU TIME .0083 EIP WAIT 4.2711 23.9% %%%%%AVG PAGEINS 0 GDS WAIT .0000 .0%AVG PAGEOUTS 0 SUSPEND TIME 1.1556 19.1% %%%%AVG GETMAINS 2AVG HI STORAGE 1,568 FILE ACTIVITY DISTRIBUTIONHI AREAS HELD 0 REQUESTS VOLUME PCT CUM % 0 1 2 3 4 5 6 7 8 9 0TERM IN SIZE 1 ZERO 1,864 68.0 68.0% %%%%%%%%%%%%%%TERM OUT SIZE 18 1 - 2 267 9.7 77.8% %%AVG FLE/DB CT 0 3 - 5 206 7.5 85.3% %%AVG FLE/DB TM 4.9029 6 - 10 14 .5 85.8%WAS SUSPENDED 2 .0% 11 - 20 69 2.5 88.3%USED ENQUEUE 192 7.0% 21 - 30 3 .1 88.4%ACCESSED FILES 278 10.1% OVER 30 316 11.5 100.0% %%%ACCESSED DL/I 0 .0%ACCESSED DB2 2 .0%ACCESSED USR DB 1 .0% DB CALL ACTIVITY DISTRIBUTIONACCESSED JOUR 1 .0% REQUESTS VOLUME PCT CUM % 0 1 2 3 4 5 6 7 8 9 0
ZERO 2,736 99.8 99.8% %%%%%%%%%%%%%%%%%%%%1 - 2 0 .0 99.8%
EXCEPTIONAL CONDITIONS 1ST 2ND 3RD 3 - 5 2 .0 99.9%DESCRIPTION COUNT DATE AND TIME OF OCCURRENCE 6 - 10 0 .0 99.9%TIMES @ MAX TASK 1,103 0806 13:15 0806 13:30 0806 13:45 11 - 20 1 .0 100.0%SHORT ON STG 4 0806 13:45 21 - 30 0 .0 100.0%STG VIOLATIONS 0 OVER 30 0 .0 100.0%MAX ACTIVE TASK 0TASK ABENDS 10 0806 13:30 0806 13:45VSAM LSR STR WT 0 STORAGE USAGE DISTRIBUTIONVSAM NLSR STR WT 22 0806 13:30 STORAGE VOLUME PCT CUM % 0 1 2 3 4 5 6 7 8 9 0VSAM CI SPLIT 0 0 - 25K 2,736 99.9 99.9% %%%%%%%%%%%%%%%%%%%%VSAM CA SPLIT 0 26 - 50K 2 .0 100.0%DL/I THREAD WAIT 0 51 - 75K 0 .0 100.0%DB2 PLAN OVRFLOW 0 76 - 100K 0 .0 100.0%DB2 ATTACH WAIT 0 101 - 150K 0 .0 100.0%
151 - 200K 0 .0 100.0%OVER 200K 1 .0 100.0%
4

2 Producing Reports
Report DataThe Application Total Page report displays standard fields. It is a 1-page report for all selected input data. The selected data determines the period covered by the report. In the absence of other selection criteria, the report contains data from 00:00:00 to 23:59:59. Refer to “Customization” on page 57 for information on how to run the Application Total Page report for each CICS address space and/or each selected day (24 hours or less).
The Application Total Page report has seven sections that show:
• Response time distributions
• An application profile
• Exceptional conditions
• Response time analysis
• File activity distribution
• Database call activity distribution
• Storage usage distribution.
The placement of each frame is controlled by the WIDTH parameter of the REPORT statement.
Application Profile
This section shows various statistics on transaction activity, such as:
• Averages for CPU time consumed, page-ins, page-outs, file requests, GETMAINs issued, and the highest amount of storage used
• The amount of time transactions were suspended due to waits
• The total number of DL/I, DB2, and file requests made by the selected transactions.
DB Call Activity Distribution
This section shows seven ranges (from ZERO to OVER 30) that represent the number of database calls issued by a transaction. The corresponding VOLUME field indicates the number of transactions that fall into each range. The PERCENT field displays and graphs the number of transactions for each range as a percent of total transactions. The CUM % field displays a cumulative percent, which is calculated at each range.
55
ASG-TMON for CICS TS for z/OS Report Writer Guide
5
Exceptional Conditions
This section informs you of any unusual occurrences during the interval reported. It shows you how many times the condition transpired and the date and time of the first, second, and third occurrences, if any. The date is displayed in MMDD format. The time is displayed in HH:MM format and is rounded to the nearest quarter hour, for example:
2:12 P.M. is rounded to 2:15 P.M.
File Activity Distribution
Shows seven ranges (from ZERO to OVER 30) that represent the number of file requests issued by a transaction. The corresponding VOLUME field indicates the number of transactions that fall into each range. The PERCENT field displays and graphs the transactions for each range as a percent of total transactions. The CUM % field displays a cumulative percent, which is calculated at each range.
Response Time Analysis
This section provides an overview of transaction response time. It allows you to determine if all components of response time are at acceptable levels.
The AVG field shows the average of the field, while the PERCENT field displays and graphs each listed response time component as a percent of total response time.
Response Time Distribution
This section shows you statistics about transactions and their associated response times, specifically:
• The number of transactions in the TXNS field with response times that fall into one of 11 categories in the RESPONSE field.
• The number of transactions within each bucket as a percent of total transaction count in the PERCENT field. Each percent is graphed.
• The cumulative percent of transactions, calculated at each response time bucket in the CUM % field.
6

2 Producing Reports
Storage Usage Distribution
This section shows you the range of storage used by each transaction. The total number of transactions that fall into each range is provided in the VOLUME field. The PERCENT field displays and graphs the number of transactions within each range as a percent of total transactions. The CUM % field displays a cumulative percent, which is calculated at each range.
Control StatementsThese control statements, used to produce this report, are in the installation library in member RWTA11:
REPORT TPAGE WIDTH 132 COVER NO
CustomizationTo create the Application Total Page report, you must code the TPAGE parameter of the REPORT statement. No subparameters are associated with TPAGE.
Customization of the Application Total Page report is limited to data selection and exclusion. You can use the SELECT and EXCLUDE statements to limit the data input to the report, for example:
To limit the Application Total Page report to March 6, 2004, for CICS SYSID F530, code these control statements:
SELECT FDATA DATE 030604 TDATA DATE 030604 PROC WHEN TASYSID = ‘F530’ THEN ACCEPTREPORT TPAGE WIDTH 132 COVER NO
Note:Only one Application Total Page report should be requested in a single execution of Report Writer. When requesting this report with reports other than the System Total Page (SPAGE) report, code the TPAGE REPORT statement first.
57

ASG-TMON for CICS TS for z/OS Report Writer Guide
5
RWTB01 - Display of End of Sample Interval Stats
PurposeThe Display of End of Sample Interval Stats report displays the aveage and standard deviation observed at the end of the sample interval for each active evaluated target. The interval is the cycle time multiplied by the number of samples, as specified in the target definitions.
Report DataThis report uses the SmartTarget behavior (TB) records. The table lists the report fields. The TMON for CICS TS or user-defined (for UFLD statements) field name is enclosed in brackets.
DATE: 04/21/04 A S G - T M O N f o r C I C S T S PAGE: 1TIME: 13:44:47 D I S P L A Y O F E N D O F S A M P L E I N T E R V A L S T A T S
DATA IS FROM 04/19/04
JOB END END IMAGE TARGET ITEM OBS STD DEVNAME DATE TIME NAME APPLID TITLE MEAN
EYUMAS1A 04/19/04 16:20:56.0303 SYSA EYUMAS1A EVAL ENDED TRANS .080 .250SCE2041A 04/19/04 16:20:56.3071 SYSA SCE2AC41 EVAL ENDED TRANS .000 .000TCICS420 04/19/04 16:21:06.7032 SYSA TMOND911 EVAL ENDED TRANS .000 .000TCICS420 04/19/04 16:23:44.3156 SYSA TMOND911 EVAL ENDED TRANS .000 .000TCICS420 04/19/04 16:26:21.0566 SYSA TMOND911 EVAL ENDED TRANS .000 .000TCICS420 04/19/04 16:28:59.1082 SYSA TMOND911 EVAL ENDED TRANS .000 .000TCICS420 04/19/04 16:31:36.5848 SYSA TMOND911 EVAL ENDED TRANS .000 .000TCICS420 04/19/04 16:34:13.2236 SYSA TMOND911 EVAL ENDED TRANS .000 .000TCICS420 04/19/04 16:36:49.5108 SYSA TMOND911 EVAL ENDED TRANS .000 .000TCICS420 04/19/04 16:25:18.3329 SYSA TMOND911 EVAL TASK RESPONSE .000 .000TCICS420 04/19/04 16:29:41.5985 SYSA TMOND911 EVAL TASK RESPONSE .000 .000TCICS420 04/19/04 16:34:02.9400 SYSA TMOND911 EVAL TASK RESPONSE .000 .000
Field Description
END DATE [LMRKDATE] Displays the date the record was written.
END TIME [LMRKTIME] Displays the time the record was written. This time corresponds with the last interval of the record.
IMAGE NAME [TBSYSN] Displays the name of the OS/390 image (CVTSNAME) on which the CICS job was running at the time of data collection.
ITEM TITLE [TBITMTTL] Displays the title of the evaluated target.
JOB NAME [LMRKJOBN] Displays the name of the started task or batch job for the CICS region being monitored.
8

2 Producing Reports
Control StatementsThese control statements, used to produce this report, are in the installation library in member RWTB01:
REPORT SORTF TBITEM LMRKTIME LINE LMRKJOBN LMRKDATE LMRKTIME TBSYSN TBAPPL TBITMTTL TBAMEAN TBASTDV WIDTH 132 TITLE = ‘DISPLAY OF END OF SAMPLE INTERVAL STATS’ COVER NO
CustomizationYou can customize this report by modifying the sort and selection criteria. RWTB01 includes a list of target numbers and their titles along with a sample SELECT statement to allow you to easily modify the report to select specific targets for analysis.
OBS MEAN [TBAMEAN] Displays the target’s average for the set of observations in the record.
STD DEV [TBASTDV] Displays the target’s standard deviation for the set of observations in the record.
TARGET APPLID [TBAPPL] Displays the VTAM APPLID of the CICS region being monitored.
Field Description
59

ASG-TMON for CICS TS for z/OS Report Writer Guide
6
RWTB02 - Display of All Behavior Observations
PurposeThe Display of All Behavior Observations report provides a summary of all the jobs reporting the same evaluated target. It displays, for all monitored CICS jobs, the detail observations along with the running average and standard deviation, in time sequence and by evaluated target ID. The statistics displayed are the running statistics sampled at the time of collection for the sample size set of preceding observations.
Report DataThis report uses the SmartTarget behavior (TB) records. The table lists the report fields. The TMON for CICS TS or user-defined (for UFLD statements) field name is enclosed in brackets.
DATE: 04/21/04 A S G - T M O N f o r C I C S T S PAGE: 1TIME: 13:44:56 D I S P L A Y O F A L L B E H A V I O R O B S E R V A T I O N S
DATA IS FROM 04/19/04
JOB END END IMAGE TARGET TARGET ITEM OBS STD DEV MEAN TIME OFNAME DATE TIME NAME APPLID ITEM TITLE VALUE AFTER AFTER OBS
TOT
SCE2041A 04/19/04 16:20:56.3073 SYSA SCE2AC41 209 EVAL CPU / MINUTE .035 .002 .035 15:57:59EYUMAS1A 04/19/04 16:20:56.0305 SYSA EYUMAS1A 209 EVAL CPU / MINUTE .033 .003 .033 15:59:03SCE2041A 04/19/04 16:20:56.3073 SYSA SCE2AC41 209 EVAL CPU / MINUTE .036 .002 .035 15:59:03EYUMAS1A 04/19/04 16:20:56.0305 SYSA EYUMAS1A 209 EVAL CPU / MINUTE .033 .003 .033 16:00:05SCE2041A 04/19/04 16:20:56.3073 SYSA SCE2AC41 209 EVAL CPU / MINUTE .034 .001 .035 16:00:05EYUMAS1A 04/19/04 16:20:56.0305 SYSA EYUMAS1A 209 EVAL CPU / MINUTE .033 .002 .033 16:01:08SCE2041A 04/19/04 16:20:56.3073 SYSA SCE2AC41 209 EVAL CPU / MINUTE .036 .001 .035 16:01:08EYUMAS1A 04/19/04 16:20:56.0305 SYSA EYUMAS1A 209 EVAL CPU / MINUTE .033 .002 .033 16:02:10SCE2041A 04/19/04 16:20:56.3073 SYSA SCE2AC41 209 EVAL CPU / MINUTE .039 .003 .035 16:02:11EYUMAS1A 04/19/04 16:20:56.0305 SYSA EYUMAS1A 209 EVAL CPU / MINUTE .033 .001 .033 16:03:13SCE2041A 04/19/04 16:20:56.3073 SYSA SCE2AC41 209 EVAL CPU / MINUTE .057 .004 .036 16:03:13EYUMAS1A 04/19/04 16:20:56.0305 SYSA EYUMAS1A 209 EVAL CPU / MINUTE .033 .001 .033 16:04:15SCE2041A 04/19/04 16:20:56.3073 SYSA SCE2AC41 209 EVAL CPU / MINUTE .038 .005 .036 16:04:15EYUMAS1A 04/19/04 16:20:56.0305 SYSA EYUMAS1A 209 EVAL CPU / MINUTE .036 .001 .033 16:05:17SCE2041A 04/19/04 16:20:56.3073 SYSA SCE2AC41 209 EVAL CPU / MINUTE .036 .005 .036 16:05:18
Field Description
END DATE [LMRKDATE] Displays the date the record was written.
END TIME [LMRKTIME] Displays the time the record was written. This time corresponds with the last interval of the record.
IMAGE NAME [TBSYSN] Displays the name of the OS/390 image (CVTSNAME) on which the CICS job was running at the time of data collection.
ITEM TITLE [TBITMTTL] Displays the title for the evaluated target.
0

2 Producing Reports
Control StatementsThese control statements, used to produce this report, are in the installation library in member RWTB02:
REPORT SORTF TBITEM TBOBSSTK LINE LMRKJOBN LMRKDATE LMRKTIME TBSYSN TBAPPL TBITEM TBITMTTL
TBOBSDTA TBOBSSTD TBOBSMEA TBOBSSTK WIDTH 132 TITLE = ‘DISPLAY OF ALL BEHAVIOR OBSERVATIONS’ COVER NO
JOB NAME [LMRKJOBN] Displays the name of the started task or batch job for the CICS region being monitored.
MEAN AFTER [TBOBSMEA] Displays the target’s average for the preceding set of observations at the time of this observation. The current observation is included in this calculation.
OBS VALUE TOT [TBOBSDTA] Displays the target value at the time of the observation. This value can be displayed up to three decimal places. It can be a ratio of measurements, a utilization rate, an event rate, an occupancy value, or a count. For any given target, the values are normalized so they can be compared statistically.
STD DEV AFTER [TBOBSSTD] Displays the standard deviation of the preceding set of observations for the CICS region. The smaller the standard deviation relative to the same observation’s average, the greater likelihood that the average accurately represents a large percent of the observations from which it is calculated.
TARGET APPLID [TBAPPL] Displays the VTAM APPLID of the CICS region being monitored.
TARGET ITEM [TBITEM] Displays the 3-digit identifier of the evaluated target.
TIME OF OBS [TBOBSSTK] Displays the time of each observation.
Field Description
61

ASG-TMON for CICS TS for z/OS Report Writer Guide
6
CustomizationYou can customize this report by modifying the sort criteria and display order to help you analyze specific CICS systems. You also can select specific targets and time ranges to research specific periods for behavior events.
2

2 Producing Reports
RWTB03 - All Observations by Job
PurposeThe All Observations by Job report displays, for each evaluated target, the detail observations and the running average and standard deviation, in time sequence and by monitored CICS job. This report is similar to RWTB02; however, this format allows you to identify metrics that behave in a similar manner to varying conditions. When multiple targets show the same type of behavior under similar changing conditions, you may be able to reduce the number of active targets.
Report DataThis report uses the SmartTarget behavior (TB) records. The table lists the report fields. The TMON for CICS TS or user-defined (for UFLD statements) field name is enclosed in brackets.
DATE: 04/21/04 A S G - T M O N f o r C I C S T S PAGE: 1TIME: 13:45:09 A L L O B S E R V A T I O N S B Y J O B
DATA IS FROM 04/19/04
JOB END END IMAGE TARGET TARGET ITEM OBS STD DEV MEAN TIME OFNAME DATE TIME NAME APPLID ITEM TITLE VALUE AFTER AFTER OBS
TOT
EYUMAS1A 04/19/04 16:30:23.7465 SYSA EYUMAS1A 305 EVAL TERMTASK IOS 32.000 15.620 14.630 16:26:10EYUMAS1A 04/19/04 16:30:23.7465 SYSA EYUMAS1A 305 EVAL TERMTASK IOS 32.000 15.680 15.700 16:27:14EYUMAS1A 04/19/04 16:30:23.7465 SYSA EYUMAS1A 305 EVAL TERMTASK IOS 32.000 15.660 16.770 16:28:18EYUMAS1A 04/19/04 16:30:23.7465 SYSA EYUMAS1A 305 EVAL TERMTASK IOS 32.000 15.580 17.830 16:29:20EYUMAS1A 04/19/04 16:30:23.7465 SYSA EYUMAS1A 305 EVAL TERMTASK IOS 32.000 15.410 18.900 16:30:24EYUMAS1A 04/19/04 16:30:23.7467 SYSA EYUMAS1A 308 EVAL TERMTASK PAGES .000 .000 .000 16:00:05EYUMAS1A 04/19/04 16:30:23.7467 SYSA EYUMAS1A 308 EVAL TERMTASK PAGES .000 .000 .000 16:01:08EYUMAS1A 04/19/04 16:30:23.7467 SYSA EYUMAS1A 308 EVAL TERMTASK PAGES .000 .000 .000 16:02:10EYUMAS1A 04/19/04 16:30:23.7467 SYSA EYUMAS1A 308 EVAL TERMTASK PAGES .000 .000 .000 16:03:13EYUMAS1A 04/19/04 16:30:23.7467 SYSA EYUMAS1A 308 EVAL TERMTASK PAGES .000 .000 .000 16:04:15EYUMAS1A 04/19/04 16:30:23.7467 SYSA EYUMAS1A 308 EVAL TERMTASK PAGES .000 .000 .000 16:05:17EYUMAS1A 04/19/04 16:30:23.7467 SYSA EYUMAS1A 308 EVAL TERMTASK PAGES .000 .000 .000 16:06:20EYUMAS1A 04/19/04 16:30:23.7467 SYSA EYUMAS1A 308 EVAL TERMTASK PAGES .000 .000 .000 16:07:23EYUMAS1A 04/19/04 16:30:23.7467 SYSA EYUMAS1A 308 EVAL TERMTASK PAGES .000 .000 .000 16:08:23
Field Description
END DATE [LMRKDATE] Displays the date the record was written.
END TIME [LMRKTIME] Displays the time the record was written. This time corresponds with the last interval time of the record.
IMAGE NAME [TBSYSN] Displays the name of the OS/390 image (CVTSNAME) on which the CICS job was running at the time of data collection.
ITEM TITLE [TBITMTTL] Displays the title of the evaluated target.
63

ASG-TMON for CICS TS for z/OS Report Writer Guide
6
Control StatementsThese control statements, used to produce this report, are in the installation library in member RWTB03:
REPORT SORTF TBAPPL TBITEM TBOBSSTK LINE LMRKJOBN LMRKDATE LMRKTIME TBSYSN TBAPPL TBITEM TBITMTTL
TBOBSDTA TBOBSSTD TBOBSMEA TBOBSSTK WIDTH 132 TITLE = ‘ALL OBSERVATIONS BY JOB’ COVER NO
JOB NAME [LMRKJOBN] Displays the name of the started task or batch job for the CICS region being monitored.
MEAN AFTER [TBOBSMEA] Displays the target’s average for the preceding set of observations at the time of this observation. The current observation is included in this calculation.
OBS VALUE TOT [TBOBSDTA] Displays the target value at the time of the observation. This value can be displayed up to three decimal places. It can be a ratio of measurements, a utilization rate, an event rate, an occupancy value, or a count. For any given target, the values are normalized so they can be compared statistically.
STD DEV AFTER [TBOBSSTD] Displays the standard deviation of the preceding set of observations for the CICS region. The smaller the standard deviation relative to the same observation’s average, the greater likelihood that the average accurately represents a large percent of the observations from which it is calculated.
TARGET APPLID [TBAPPL] Displays the VTAM APPLID of the CICS region being monitored.
TARGET ITEM [TBITEM] Displays the 3-digit identifier of the evaluated target.
TIME OF OBS [TBOBSSTK] Displays the time of each observation.
Field Description
4

2 Producing Reports
CustomizationYou can modify the sort criteria and display order to help you analyze specific CICS systems. You also can select specific targets and time ranges to research specific periods for behavior events.
65

ASG-TMON for CICS TS for z/OS Report Writer Guide
6
RWTB04 - Outlier Event Report from Behavior Data
PurposeThe Outlier Event Report from Behavior Data displays all the observations that are more than three current standard deviations from the current average at the time of the observations. You can use this report to help establish maximum and minimum thresholds for the Problem/Alert and Performance Monitors.
Report DataThis report uses the SmartTarget behavior (TB) records. The table lists the report fields. The TMON for CICS TS or user-defined (for UFLD statements) field name is enclosed in brackets.
DATE: 04/21/04 A S G - T M O N f o r C I C S T S PAGE: 1TIME: 13:45:20 O U T L I E R E V E N T R E P O R T F R O M B E H A V I O R D A T A
DATA IS FROM 04/19/04
END IMAGE TARGET TARGET ITEM OBS STD DEV MEAN TIME OFDATE NAME APPLID ITEM TITLE VALUE BEFORE BEFORE OBS
TOT
04/19/04 SYSA SCE2AC41 209 EVAL CPU / MINUTE .039 .001 .035 16:02:1104/19/04 SYSA SCE2AC41 209 EVAL CPU / MINUTE .057 .003 .035 16:03:1304/19/04 SYSA EYUMAS1A 203 EVAL ENDED TRANS .940 .180 .040 16:11:3304/19/04 SYSA EYUMAS1A 209 EVAL CPU / MINUTE .196 .001 .033 16:11:3304/19/04 SYSA EYUMAS1A 212 EVAL PAGE / MINUTE 176.140 15.120 2.840 16:11:3304/19/04 SYSA EYUMAS1A 305 EVAL TERMTASK IOS 26.000 .180 .030 16:12:3604/19/04 SYSA EYUMAS1A 311 EVAL TERMTASK STRG 21.000 3.410 .630 16:12:3604/19/04 SYSA EYUMAS1A 314 EVAL TERMTASK CPU .044 .007 .001 16:12:3604/19/04 SYSA EYUMAS1A 317 EVAL TERMTASK DISP 1.615 .279 .052 16:12:3604/19/04 SYSA EYUMAS1A 203 EVAL ENDED TRANS .960 .250 .080 16:13:3804/19/04 SYSA EYUMAS1A 209 EVAL CPU / MINUTE .176 .031 .041 16:13:3804/19/04 SYSA EYUMAS1A 305 EVAL TERMTASK IOS 28.000 4.660 .900 16:13:3804/19/04 SYSA EYUMAS1A 311 EVAL TERMTASK STRG 21.000 4.990 1.330 16:13:3804/19/04 SYSA EYUMAS1A 305 EVAL TERMTASK IOS 32.000 6.730 1.830 16:14:4104/19/04 SYSA EYUMAS1A 311 EVAL TERMTASK STRG 21.000 6.100 2.030 16:14:4104/19/04 SYSA EYUMAS1A 305 EVAL TERMTASK IOS 32.000 8.620 2.900 16:15:4404/19/04 SYSA TMOND911 209 EVAL CPU / MINUTE .198 .015 .066 16:21:1704/19/04 SYSA SCE2AC41 212 EVAL PAGE / MINUTE 11.570 3.210 1.040 16:29:2004/19/04 SYSA SCE2AC41 221 EVAL PGS / CPUSEC 308.890 89.860 29.160 16:29:2004/19/04 SYSA TMOND911 209 EVAL CPU / MINUTE .163 .007 .068 16:30:2304/19/04 SYSA EYUMAS1A 221 EVAL PGS / CPUSEC 829.400 189.730 67.030 16:30:2404/19/04 SYSA EYUMAS1A 417 EVAL NON-TERM DISP 444.180 79.298 14.730 16:30:24
Field Description
END DATE [LMRKDATE] Displays the date the record was written.
IMAGE NAME [TBSYSN] Displays the name of the OS/390 image (CVTSNAME) on which the CICS job was running at the time of data collection.
ITEM TITLE [TBITMTTL] Displays the title of the evaluated target.
6

2 Producing Reports
Control StatementsThese control statements, used to produce this report, are in the installation library in member RWTB04:
UFLD NAME STDRG PRECISION 3 TYPE COUNT PROC STDRG = TBOBBSTD + TBOBBSTD + TBOBBSTD UFLD NAME UPLIM PRECISION 3 TYPE COUNT PROC UPLIM = TBOBBMEA + STDRG UFLD NAME LOLIM PRECISION 3 TYPE COUNT PROC LOLIM = TBOBBMEA - STDRG SELECT PROC WHEN TBOBBSTD EQ 0 THEN REJECT
MEAN BEFORE [TBOBBMEA] Displays the target’s average for the preceding set of observations at the time of this observation. The current observation is not included in this calculation.
OBS VALUE TOT [TBOBSDTA] Displays the target value at the time of the observation. This value can be displayed up to three decimal places. It can be a ratio of measurements, a utilization rate, an event rate, an occupancy value, or a count. For any given target, the values are normalized so they can be compared statistically.
STD DEV BEFORE [TBOBBSTD] Displays the standard deviation of the preceding set of observations for the CICS region. The smaller the standard deviation relative to the same observation’s average, the greater likelihood that the average accurately represents a large percent of the observations from which it is calculated.
TARGET APPLID [TBAPPL] Displays the VTAM APPLID of the CICS region being monitored.
TARGET ITEM [TBITEM] Displays the 3-digit identifier of the evaluated target.
TIME OF OBS [TBOBSSTK] Displays the time of each observation.
Field Description
67

ASG-TMON for CICS TS for z/OS Report Writer Guide
6
REPORT PROC WHEN TBOBSDTA GT UPLIM OR TBOBSDTA LT LOLIM THEN ACCEPT SORTF TBOBSSTK LINE LMRKDATE TBSYSN TBAPPL TBITEM TBITMTTL TBOBSDTA TBOBBSTD TBOBBMEA TBOBSSTK WIDTH 132 TITLE = ‘OUTLIER EVENT REPORT FROM BEHAVIOR DATA’ COVER NO
CustomizationThis report is similar to RWTB02 and RWTB03; however, in this report, the standard deviation and average values are represented by the events before the current observation is added. Any observation more than three standard deviations of the preceding event from the average of the preceding event is considered an outlier. An outlier may occur:
• During transitional periods for a target ID
• When an exceptional event occurs in the CICS region
• Due to oversampling the system.
You can customize this report to select date and time ranges expected to be similar. During these periods, outliers may identify a pattern of activity that helps you to identify the source.
See Chapter 7 in ASG-TMON for CICS TS for z/OS Data Guide for more information on outliers.
8

2 Producing Reports
RWTB05 - Population to Sample Stats Comparison
PurposeThe Population to Sample Stats Comparison report computes the average and standard deviation for each target as a population sample over the set of data selected. It then compares that data to the largest average and standard deviation values of the sampled data. This report provides an additional perspective on the effect of the sample size on sample time statistics.
Report DataThis report uses the SmartTarget behavior (TB) records. The table lists the report fields. The TMON for CICS TS or user-defined (for UFLD statements) field name is enclosed in brackets.
DATE: 04/05/04 A S G - T M O N f o r C I C S T S PAGE: 1TIME: 20:09:12 P O P U L A T I O N T O S A M P L E S T A T S C O M P A R I S O N
DATA IS FROM 03/15/04 AT 16:17 TO 03/16/04 AT 23:36
END TARGET TARGET NUMBER RAW RAW MEAN STD DEV TIME OFDATE APPLID ITEM OF OBS OBS OBS AFTER AFTER OBS
TOT AVG STD MAX MAX
03/16/04 TCE2041B 203 1,875 .000 .000 .000 .000 22:42:0203/16/04 206 1,875 .000 .000 .000 .000 23:31:0803/16/04 209 1,875 .021 .008 .024 .016 2:56:1803/16/04 212 1,830 7.513 44.540 123.580 210.010 3:20:2003/16/04 215 1,875 6.009 1.263 6.740 3.520 17:15:4003/16/04 218 1,875 288.906 53.370 312.900 131.810 9:05:4403/16/04 221 1,860 435.751 3,328.820 11,451.670 19,716.740 17:34:4303/16/04 224 1,875 .000 .000 .000 .000 8:41:3403/16/04 227 1,875 .000 .000 .000 .000 20:10:5203/16/04 230 1,875 .000 .000 .000 .000 15:09:3203/16/04 233 1,875 .000 .000 .000 .000 11:26:2903/16/04 236 1,875 .000 .000 .000 .000 9:06:4403/16/04 239 1,875 .000 .000 .000 .000 22:16:0003/16/04 242 1,875 .000 .000 .000 .000 8:15:4203/16/04 245 1,875 .000 .000 .000 .000 10:50:2003/16/04 248 1,875 10.005 .072 10.200 .400 9:05:4403/16/04 251 1,875 9.388 .239 10.000 1.210 19:45:4803/16/04 254 1,875 .000 .000 .000 .000 8:14:4203/16/04 257 1,875 25.000 .000 25.000 .000 21:21:5803/16/04 260 1,875 25.000 .000 25.000 .000 11:19:2803/16/04 263 1,875 1,280.000 .000 1,280.000 .000 18:55:4403/16/04 266 1,875 5,120.000 .000 5,120.000 .000 11:40:3303/16/04 302 1,875 .000 .000 .000 .000 18:55:4403/16/04 305 1,860 .000 .000 .000 .000 23:28:0703/16/04 308 1,860 .000 .000 .000 .000 22:06:0003/16/04 311 1,860 .000 .000 .000 .000 23:36:0803/16/04 314 1,860 .000 .000 .000 .000 20:05:5103/16/04 317 1,860 .000 .000 .000 .000 23:34:08
69

ASG-TMON for CICS TS for z/OS Report Writer Guide
7
Control StatementsThese control statements, used to produce this report, are in the installation library in member RWTB05:
UFLD NAME AVGCT TYPE COUNT HEAD1 ‘NUMBER’ HEAD2 ‘OF OBS’ PROC AVGCT = TBOBSSTK / TBOBSSTK UFLD NAME AVGDTA
Field Description
END DATE [LMRKDATE] Displays the date the records was written.
MEAN AFTER MAX [TBOBSMEA] Displays the maximum average calculated against the samples at data collection time. This value should be similar to the value displayed in the RAW OBS AVG field.
NUMBER OF OBS TOT [UFLD AVGCT]
Displays the total number of observations (the evaluated target’s scale) used to establish the sample standard deviation and average, defined through a UFLD statement.
RAW OBS AVG [UFLD AVGDTA]
Displays the average for the population of this target, defined through a UFLD statement. This value is the total of the observations divided by the total number of observations.
RAW OBS STD [UFLD AVGDTA]
Displays the standard deviation for the population of this target, defined through a UFLD statement. This value is the standard deviation calculated against all included observations.
STD DEV AFTER MAX [TBOBSSTD]
Displays the maximum standard deviation calculated against the current sample at data collection time. This value should be similar to the value displayed in the RAW OBS STD value.
TARGET APPLID [TBAPPL] Displays the VTAM APPLID of the target CICS region.
TARGET ITEM [TBITEM] Displays the 3-digit identifier of the target.
TIME OF OBS [TBOBSSTK] Displays the time of the last observation processed for the target.
0

2 Producing Reports
TYPE COUNT PRECISION 3 HEAD1 ‘RAW’ HEAD2 ‘OBS’ AVERAGE AVGCT PROC AVGDTA = TBOBSDTA REPORT SFORM AVGCT(R) SORTF TBAPPL TBITEM SUMF TBAPPL TBITEM LINE LMRKDATE TBAPPL TBITEM AVGCT(T) AVGDTA(A) AVGDTA(S) TBOBSMEA(X) TBOBSSTD(X) TBOBSSTK WIDTH 132 TITLE = ‘POPULATION TO SAMPLE STATS COMPARISON’ COVER NO
CustomizationYou can use this report to ensure that the sample count and cycle time are producing a reasonable representation of the entire system. The sample count (the SCALE field) and the cycle time (the CYCLE field) are specified on the Threshold Alerts screen (Option 10.3.2), described in Chapter 15 in ASG-TMON for CICS TS for z/OS Reference Guide. You may want to select specific time ranges to ensure that data is computed for the population statistics in a way similar to the way data was computed for the base comparison with the sampled statistics recorded in the behavior data.
71

ASG-TMON for CICS TS for z/OS Report Writer Guide
7
RWTB06 - Threshold Recommendations
PurposeThe Threshold Recommendations report computes and displays, for each job, the maximum and minimum boundaries for each target in the selected data. The minimum boundary is computed as the current average minus three times the current standard deviation (or 0 if the result is negative). When the minimum boundary is 0, no minimum threshold is recommended. The maximum boundary is computed as the current average plus three times the current standard deviation.
The target item number of the corresponding minimum target is the evaluated target item number minus 1. The target item number of the corresponding maximum target is the evaluated target item number minus 2, for example:
The evaluated, minimum, and maximum file request (FC AVG RESP) target item numbers are 227, 226, and 225, respectively.
Report DataThis report uses the SmartTarget behavior (TB) records. The table lists the report fields. The TMON for CICS TS or user-defined (for UFLD statements) field name is enclosed in brackets.
DATE: 04/07/04 A S G - T M O N f o r C I C S T S PAGE: 1 TIME: 09:15:24 T H R E S H O L D R E C O M M E N D A T I O N S DATA IS FROM 03/15/04 AT 16:17 TO 03/16/04 AT 23:36 IMAGE TARGET TARGET ITEM LOWER UPPER NAME APPLID ITEM TITLE LIMIT LIMIT MIN MAX SYSA TCE2041B 203 EVAL ENDED TRANS .000 .000 SYSA 206 EVAL TASK RESPONSE .000 .000 SYSA 209 EVAL CPU / MINUTE .000 .071 SYSA 212 EVAL PAGE / MINUTE .000 708.460 SYSA 215 EVAL I-O / MINUTE .920 16.640 SYSA 218 EVAL I-O / CPUSEC 71.610 634.130 SYSA 221 EVAL PGS / CPUSEC .000 67,171.560 SYSA 224 EVAL FC REQ / MINUT .000 .000 SYSA 227 EVAL FC AVG RESP .000 .000 SYSA 230 EVAL DLI REQ / MINU .000 .000 SYSA 233 EVAL DLI AVG RESP .000 .000 SYSA 236 EVAL DB2 REQ / MINU .000 .000 SYSA 239 EVAL DB2 AVG RESP .000 .000 SYSA 242 EVAL UDB REQ / MINU .000 .000 SYSA 245 EVAL UDB AVG RESP .000 .000 SYSA 248 EVAL INFLIGHT TASKS 9.160 11.080 SYSA 251 EVAL MXT TASKS / MX 6.840 12.660 SYSA 254 EVAL MXT LIMIT .000 .000 SYSA 257 EVAL DSA/DSALIMIT 25.000 25.000 SYSA 260 EVAL EDSA/EDSALIMIT 25.000 25.000 SYSA 263 EVAL DSA USED 1,280.000 1,280.000 SYSA 266 EVAL EDSA USED 5,120.000 5,120.000 SYSA 302 EVAL TERMINAL TASKS .000 .000 SYSA 305 EVAL TERMTASK IOS .000 .000 SYSA 308 EVAL TERMTASK PAGES .000 .000 SYSA 311 EVAL TERMTASK STRG .000 .000 SYSA 314 EVAL TERMTASK CPU .000 .000 SYSA 317 EVAL TERMTASK DISP .000 .000
2

2 Producing Reports
Control StatementsThese control statements, used to produce this report, are in the installation library in member RWTB06:
UFLD NAME STDRG PRECISION 3 TYPE COUNT PROC STDRG = TBOBBSTD + TBOBBSTD + TBOBBSTDUFLD NAME UPLIM PRECISION 3 TYPE COUNT HEAD1 ‘UPPER’ HEAD2 ‘LIMIT’ PROC UPLIM = TBOBBMEA + STDRGUFLD NAME LOLIM PRECISION 3 TYPE COUNT HEAD1 ‘LOWER’
Field Description
IMAGE NAME [TBSYSN] Displays the name of the OS/390 image (CVTSNAME) on which the CICS job was running at the time of data collection.
ITEM TITLE [TBITMTTL] Displays the title of the evaluated target. The maximum and minimum targets have similar titles to the evaluated target.
LOWER LIMIT MIN [UFLD LOLIM]
Displays the computed maximum recommended value for the minimum threshold based on the data observed, as defined through a UFLD statement. A negative number implies that no minimum recommendation exists.
TARGET APPLID [TBAPPL] Displays the VTAM APPLID of the CICS region being monitored.
TARGET ITEM [TBITEM] Displays the 3-digit identifier for the evaluated target. The target item number of the maximum threshold target related to this evaluated target is this item number minus two. The target item number of the minimum threshold target related to this evaluated target is this item number minus one.
UPPER LIMIT MAX [UFLD UPLIM]
Displays the computed minimum recommended value for the maximum threshold based on the data observed.
73

ASG-TMON for CICS TS for z/OS Report Writer Guide
7
HEAD2 ‘LIMIT’ PROC LOLIM = TBOBBMEA - STDRG WHEN LOLIM < 0 THEN LOLIM = 0REPORT SORTF TBAPPL TBITEM SUMF TBAPPL TBITEM LINE TBSYSN TBAPPL TBITEM TBITMTTL LOLIM(M) UPLIM(X) WIDTH 132 TITLE = ‘THRESHOLD RECOMMENDATIONS’ COVER NO
CustomizationThis report provides a starting point for setting monitoring thresholds for a CICS region. If the supplied data represents the typical behavior of the CICS region, you should expect at least a 1 percent occurrence of threshold alerts. This amount may be excessive and require additional adjustment. You can select specific time ranges for maximum and minimum evaluations.
4

2 Producing Reports
RWTI01 - Response Time Distribution
PurposeThe Response Time Distribution report shows a daily count of transactions and the percent of those transactions that fell into various response time intervals for each system.
Report DataThis report uses the transaction performance history (TI) subtype-1 and subtype-2 records. The table lists the report fields. If applicable, the TMON for CICS TS or user-defined (for UFLD statements) field name is enclosed in brackets.
DATE: 04/08/04 A S G - T M O N f o r C I C S T S PAGE: 1TIME: 16:18:41 R E S P O N S E T I M E D I S T R I B U T I O N
DATA IS FROM 03/14/04 AT 17:00 TO 03/25/04 AT 11:00
END CICS END ENDED RESP 0-1 RESP 0-1 % RESP 1-2 RESP 1-2 % RESP 2-3 RESP 2-3 % RESP 3-5 RESP 3-5 % RESP >5 RESP >5 %DATE SYSID TIME TRANS <--100.0--> <--100.0--> <--100.0--> <--100.0--> <--100.0-->
TOT % % % % %
03/20/04 53D0 14:00 42 57.1 ====== 23.8 === .0 .0 19.0 ==15:00 70 100.0 =========== .0 .0 .0 .016:00 2 100.0 =========== .0 .0 .0 .017:00 0 .0 .0 .0 .0 .0
53D0 ***** 114 84.2 ========= 8.8 = .0 .0 7.0 =
53T0 14:00 8 25.0 === 50.0 ====== 25.0 === .0 .015:00 38 100.0 =========== .0 .0 .0 .016:00 4 50.0 ====== 50.0 ====== .0 .0 .017:00 0 .0 .0 .0 .0 .0
53T0 ***** 50 84.0 ========= 12.0 = 4.0 .0 .0
03/20/04 **** ***** 164 84.1 ========= 9.8 = 1.2 .0 4.9 =
03/21/04 41T0 11:00 29 100.0 =========== .0 .0 .0 .012:00 6 33.3 ==== 33.3 ==== 33.3 ==== .0 .013:00 0 .0 .0 .0 .0 .014:00 0 .0 .0 .0 .0 .015:00 0 .0 .0 .0 .0 .016:00 20 .0 .0 .0 10.0 = 90.0 ==========
41T0 ***** 55 56.4 ====== 3.6 3.6 3.6 32.7 ====
52T0 11:00 28 92.9 ========== .0 .0 .0 7.1 =12:00 14 28.6 === 28.6 === .0 28.6 === 14.3 ==13:00 0 .0 .0 .0 .0 .014:00 0 .0 .0 .0 .0 .015:00 0 .0 .0 .0 .0 .016:00 14 .0 .0 .0 .0 100.0 ===========
52T0 ***** 56 53.6 ====== 7.1 = .0 7.1 = 32.1 ====
Field Description
CICS SYSID [TISYSID] Displays the system identifier.
END DATE [LMRKDATE] Displays the date the record was written.
END TIME [LMRKTIME] Displays the time the record was written.
75

ASG-TMON for CICS TS for z/OS Report Writer Guide
7
Control StatementsThese control statements, used to produce this report, are in the installation library in member RWTI01:
UFLD NAME TOTRANS TYPE COUNT HEAD1 ‘ENDED’ HEAD2 ‘TRANS’ PROC TOTRANS = TIRSPCTUFLD NAME RESP1 TYPE COUNT PERCENT TOTRANS HEAD1 ‘RESP 0-1’ PROC RESP1 = TIRPS01UFLD NAME RESP2 TYPE COUNT PERCENT TOTRANS HEAD1 ‘RESP 1-2’ PROC RESP2 = TIRPS12
ENDED TRANS TOT [UFLD TOTRANS]
Displays the total transaction count, defined through a UFLD statement as TITRANCT minus TITRNXCT.
RESP 0-1 % [UFLD RESP1] Displays and graphs the percent of transactions with a response time between zero and one second, defined through a UFLD statement.
RESP 1-2 % [UFLD RESP2] Displays and graphs the percent of transactions with a response time between one and two seconds, defined through a UFLD statement.
RESP 2-3 % [UFLD RESP3] Displays and graphs the percent of transactions with a response time between two and three seconds, defined through a UFLD statement.
RESP 3-5 % [UFLD RESP4&5] Displays and graphs the percent of transactions with a response time between three and five seconds, defined through a UFLD statement.
RESP > 5 % [UFLD RESPO5] Displays and graphs the percent of transactions with a response time five seconds or greater, defined through a UFLD statement.
Field Description
6

2 Producing Reports
UFLD NAME RESP3 TYPE COUNT PERCENT TOTRANS HEAD1 ‘RESP 2-3’ PROC RESP3 = TIRPS23UFLD NAME RESP4&5 TYPE COUNT PERCENT TOTRANS HEAD1 ‘RESP 3-5’ PROC RESP4&5 = TIRPS34 + TIRPS45UFLD NAME RESPO5 TYPE COUNT PERCENT TOTRANS HEAD1 ‘RESP > 5’ PROC RESPO5 = TIRPSO5REPORT LINE = LMRKDATE TISYSID LMRKTIME TOTRANS(T) RESP1(P) RESP2(P) RESP3(P) RESP4&5(P) RESPO5(P) SUMF = LMRKDATE TISYSID LMRKTIME(0100000000) GRAPHS = RESP1(100) RESP2(100) RESP3(100) RESP4&5(100) RESPO5(100) SFORM = RESP1 RESP2 RESP3 RESP4&5 RESPO5 TOTRANS WIDTH = 150 TITLE = ‘RESPONSE TIME DISTRIBUTION’ COVER = NO
CustomizationYou can narrow the data provided by this report to determine when high response time peaks occur, for example:
Suppose that you want to learn why 32.7 percent of the transactions on March 21, 2004, possess a response time greater than five seconds. You could add this SELECT statement to the control statements for this report:
SELECT FDATA DATE 032104 TIME 130000 TDATA DATE 032104 TIME 150000 PROC WHEN TISYSID EQ ‘41T0’ THEN ACCEPT
The SELECT statement tells Report Writer to include all data from March 21, 2004, between the hours of 1 P.M. and 3 P.M., but only for system ID 41T0. It eliminates unnecessary data and lets you view only data that is relevant to determining the cause of high resource usage.
77

ASG-TMON for CICS TS for z/OS Report Writer Guide
7
Note:You can specify only one PROC parameter in the SELECT statement, and it must be the last parameter specified in the statement.
Change the SUMF statement to determine the transaction(s) responsible for the high response time. Change the SUMF statement to:
SUMF TIHRSTID
Change the LINE statement to include TIHRSTID (transaction with highest response time) and TIRSPTM(T) (total response time). Because you want only data generated within SYSID 41T0 on March 21, 2004, remove the TISYSID and LMRKDATE fields from the LINE statement. Replace the response time bucket fields with useful transaction resource usage statistics.
A control break occurs every time the transaction ID changes. The detail line displays for each transaction execution. The new report can help you pinpoint the specific transactions maintaining high response times.
8

2 Producing Reports
RWTI02 - CPU Time Overview
PurposeThe CPU Time Overview report provides the amount of CPU time used by TMON for CICS TS. CPU time is broken down into SRB CPU time, application CPU time, subtask TCB time, and CPU time across waits.
Report DataThis report uses the transaction performance history (TI) subtype-1 and subtype-2 records. The table lists the report fields. The TMON for CICS TS or user-defined (for UFLD statements) field name is enclosed in brackets.
DATE: 04/07/04 A S G - T M O N f o r C I C S T S PAGE: 1TIME: 09:36:24 C P U T I M E O V E R V I E W
DATA IS FROM 03/25/04 AT 00:01 TO 03/25/04 AT 10:39
END CICS SRB CPU APPL CICS OVHD SUBTASK TMON SUBTSK REGION TASK CPUDATE SYSID TIME CPU TIME CPU TIME CPU TIME CPU TIME CPU TIME TIME
TOT TOT TOT TOT TOT TOT AVG
03/25/04 MFA 3.4140 18.5266 1.6734 1.0206 2.5275 22.0747 0.001303/25/04 **** 3.4140 18.5266 1.6734 1.0206 2.5275 22.0747 0.0013
TOTALS 3.4140 18.5266 1.6734 1.0206 2.5275 22.0747 0.0013
Field Description
APPL CPU TIME TOT [TIAPLCTM] Displays the total application CPU time.
CICS OVHD CPU TIME TOT [TILSTCPU]
Displays the total CICS overhead CPU time.
CICS SYSID [TISYSID] Displays the system identifier.
END DATE [LMRKDATE] Displays the date the record was written.
REGION CPU TIME TOT [TITCBCTM]
Displays the total CPU time consumed by the CICS region.
SRB CPU TIME TOT [TISRBCTM] Displays the total SRB CPU time.
SUBTASK CPU TIME TOT [TISUBTTM]
Displays the total subtask TCB time.
79

ASG-TMON for CICS TS for z/OS Report Writer Guide
8
Control StatementsThese control statements, used to produce this report, are in the installation library in member RWTI02:
OPTION PLEFT REPORT LINE LMRKDATE TISYSID TISRBCTM(T) TIAPLCTM(T) TILSTCPU(T) TISUBTTM(T) TIMONTTM(T) TITCBCTM TICPURTM SUMF LMRKDATE TISYSID WIDTH 132 TITLE = ‘CPU TIME OVERVIEW’
CustomizationThe CPU Time Overview report shows, for each type of CPU time, the total amount of CPU time used. Suppose, however, you want each distinct type of CPU time to represent a percent of the total of all CPU times. You could create a UFLD statement to define total CPU time and a UFLD statement for each CPU time field. Each CPU time field would represent a percent of total CPU time, for example:
This UFLD statement creates a field for the total of CPU time on which to base the percent of each type of CPU time:
UFLD NAME TOTCPU TYPE TIME PROC TOTCPU = TISRBCTM + TIAPLCTM + TILSTCPU + TISUBTTM + TIMONTTM + TITCBCTM + TICPURTM
The UFLDs for each type of CPU time, calculated in these control statements, replace the corresponding fields on the LINE statement:
TASK CPU TIME TOT [TICPURTM]
Displays the total transaction CPU time.
TMON SUBTSK CPU TIME TOT [TIMONTTM]
Displays the total TMON for CICS TS subtask TCB time.
Field Description
0

2 Producing Reports
UFLD /* (creates SRB CPU TIME as a % of total CPU time) NAME SRBCPU TYPE TIME PERCENT TOTCPU PROC SRBCPU = TISRBCTMUFLD /* (creates APPL CPU TIME as a % of total CPU time) NAME APLCPU TYPE TIME PERCENT TOTCPU PROC APLCPU = TIAPLCTMUFLD /* (creates CICS OVHD CPU TIME as a % of total CPU time) NAME OVHCPU TYPE TIME PERCENT TOTCPU PROC OVHCPU = TILSTCPUUFLD /* (creates SUBTASK CPU TIME as a % of total CPU time) NAME SUBCPU TYPE TIME PERCENT TOTCPU PROC SUBCPU = TISUBTTMUFLD /* (creates TMON SUBTASK CPU TIME as a % of total CPU time) NAME MONCPU TYPE TIME PERCENT TOTCPU PROC MONCPU = TIMONTTMUFLD /* (creates REGION CPU TIME as a % of total CPU time) NAME RGNCPU TYPE TIME PERCENT TOTCPU PROC RGNCPU = TITCBCTMUFLD /* (creates TASK CPU TIME as a % of total CPU time) NAME TSKCPU TYPE TIME PERCENT TOTCPU PROC TSKCPU = TICPURTM
Each CPU time field prints as a percent of total CPU time.
81

ASG-TMON for CICS TS for z/OS Report Writer Guide
8
RWTI03 - Transaction Response Time Summary
PurposeThe Transaction Response Time Summary report provides a daily summary by date and system for various response time-related data for the transactions on the system.
Report DataThis report uses the transaction performance history (TI) subtype-1 and subtype-2 records. The table lists the report fields. The TMON for CICS TS or user-defined (for UFLD statements) field name is enclosed in brackets.
DATE: 04/13/04 A S G - T M O N f o r C I C S T S PAGE: 1TIME: 13:11:33 T R A N S A C T I O N R E S P O N S E T I M E S U M M A R Y
DATA IS FROM 03/22/04 AT 10:15 TO 03/29/04 AT 14:07
END CICS TMON TRAN TRANS USER EXCL TASK DISPDATE SYSID VERSION COUNT EXCLUDED RESP TIME TIME
TOT TOT AVG AVG
03/22/04 A2A1 21 73 0 .0000 .9987D2A1 21 44 0 .0000 1.3178T2A1 21 73 0 .0000 1.1879
03/22/04 **** 21 190 0 .0000 1.1453
03/29/04 A2A1 21 124 0 .0000 .5726D2A1 21 72 0 .0000 .7946T2A1 21 126 0 .0000 .5210
03/29/04 **** 21 322 0 .0000 .6021
TOTALS 21 512 0 .0000 .8036
Field Description
CICS SYSID [TISYSID] Displays the system identifier.
END DATE [LMRKDATE] Displays the date the record was written.
TASK DISP TIME AVG [TITSKDTM]
Displays the average transaction dispatch time.
TMON VERSION [TIMONVER] Displays the TMON for CICS TS version.
TRAN COUNT TOT [TITRANCT] Displays the total transaction count.
TRANS EXCLUDED TOT [TITRNXCT]
Displays the total transactions excluded.
USER EXCL RESP TIME AVG [TITRNXTM]
Displays the average response time for excluded transactions.
2

2 Producing Reports
Control StatementsThese control statements, used to produce this report, are in the installation library in member RWTI03:
OPTION PLEFTREPORT LINE LMRKDATE TISYSID TIMONVER TITRANCT(T) TITRNXCT(T) TITRNXTM TITSKDTM SUMF LMRKDATE TISYSID WIDTH 132 TITLE = ‘TRANSACTION RESPONSE TIME SUMMARY’ COVER NO
CustomizationSuppose you want to create this report for March 22, 2004, covering only the prime shift. You could add this SELECT statement to the control statements used to create this report:
SELECT FDATA DATE 032204 TDATA DATE 032204 TRANGE 080000 170000
The TRANGE parameter specifies selection criteria to be applied to every record being considered for the report. It specifies a time range for each day (in this example, 8 A.M. to 5 P.M.):
The more you restrict the amount of data, the more useful your report, for example:
DATE: 04/13/04 A S G - T M O N f o r C I C S T S PAGE: 1TIME: 13:36:31 T R A N S A C T I O N R E S P O N S E T I M E S U M M A R Y
DATA IS FROM 03/22/04 AT 8:00 TO 03/22/04 AT 17:00
END CICS TMON TRAN TRANS USER EXCL TASK DISPDATE SYSID VERSION COUNT EXCLUDED RESP TIME TIME
TOT TOT AVG AVG
03/22/04 A2A1 21 51 0 .0000 .9987D2A1 21 22 0 .0000 1.3178T2A1 21 51 0 .0000 1.1879
03/22/04 **** 21 124 0 .0000 1.1453
TOTALS 21 124 0 .0000 1.1453
83

ASG-TMON for CICS TS for z/OS Report Writer Guide
8
Suppose the existing Transaction Response Time Summary report indicates that transaction response times are unusually high for all CICS regions except SYSID A2A1. You may want to break down the report into hourly intervals to pinpoint particular problem hours, for example:
SELECT PROC WHEN TISYSID EQ ‘A2A1’ THEN REJECTSUMF LMRKDATE TISYSID LMRKTIME(0100000000)
Note:You can specify only one PROC parameter in the SELECT statement, and it must be the last parameter specified in the statement.
The SELECT statement tells Report Writer to exclude any data resulting from transaction executions within SYSID A2A1. The SUMF statement tells Report Writer to summarize by date, SYSID, and hour, as shown in this report:
Note:In this example, you also would need to modify the LINE statement to include the LMRKTIME field.
Perhaps you simply want to change the way data is summarized on the Transaction Response Time Summary report. You may want individual totals for each CICS address space instead of daily totals of all CICS address spaces. Reverse the order of the fields on the SUMF statement. Change the SUMF statement to:
SUMF TISYSID LMRKDATE
DATE: 04/28/04 A S G - T M O N f o r C I C S T S PAGE: 1TIME: 12:40:39 T R A N S A C T I O N R E S P O N S E T I M E S U M M A R Y
DATA IS FROM 03/22/04 AT 10:15 TO 03/29/04 AT 14:07
END CICS END TMON TRAN TRANS USER EXCL TASK DISPDATE SYSID TIME VERSION COUNT EXCLUDED RESP TIME TIME
TOT TOT AVG AVG
03/22/04 D2A1 11:00 21 44 0 .0000 1.3178D2A1 ***** 21 44 0 .0000 1.3178
T2A1 11:00 21 73 0 .0000 1.1879T2A1 ***** 21 73 0 .0000 1.1879
03/22/04 **** ***** 21 117 0 .0000 1.2367
03/29/04 D2A1 11:00 21 27 0 .0000 .334314:00 21 25 0 .0000 1.281315:00 21 20 0 .0000 .8075
D2A1 ***** 21 72 0 .0000 .7946
T2A1 11:00 21 56 0 .0000 .307614:00 21 32 0 .0000 1.246715:00 21 38 0 .0000 .2244
T2A1 ***** 21 126 0 .0000 .5210
03/29/04 **** ***** 21 198 0 .0000 .6205
TOTALS 21 315 0 .0000 .8494
4

2 Producing Reports
The new SUMF statement tells Report Writer to force a control break every time the CICS SYSID changes. (In this example, you also would need to modify the LINE statement to follow the SUMF statement order.) The detail line displays for each day of activity within the SYSID. The individual totals for each SYSID are provided at the control break, as shown in this report:
DATE: 04/28/04 A S G - T M O N f o r C I C S T S PAGE: 1TIME: 12:31:57 T R A N S A C T I O N R E S P O N S E T I M E S U M M A R Y
DATA IS FROM 03/22/04 AT 10:15 TO 03/29/04 AT 14:07
CICS END TMON TRAN TRANS USER EXCL TASK DISPSYSID DATE VERSION COUNT EXCLUDED RESP TIME TIME
TOT TOT AVG AVG
A2A1 03/22/04 21 73 0 .0000 .998703/29/04 21 124 0 .0000 .5726
A2A1 ******** 21 197 0 .0000 .7305
D2A1 03/22/04 21 44 0 .0000 1.317803/29/04 21 72 0 .0000 .7946
D2A1 ******** 21 116 0 .0000 .9930
T2A1 03/22/04 21 73 0 .0000 1.187903/29/04 21 126 0 .0000 .5210
T2A1 ******** 21 199 0 .0000 .7656
TOTALS 21 512 0 .0000 .8036
85

ASG-TMON for CICS TS for z/OS Report Writer Guide
8
RWTI04 - I/O Summary
PurposeThe I/O Summary report provides an overview of I/O activity by date and system, which indicates the amount of I/O used by various CICS functions.
Report DataThis report uses the transaction performance history (TI) subtype-1 and subtype-2 records. The table lists the report fields. The TMON for CICS TS or user-defined (for UFLD statements) field name is enclosed in brackets.
DATE: 04/13/04 A S G - T M O N f o r C I C S T S PAGE: 1TIME: 13:40:44 I / O S U M M A R Y
DATA IS FROM 03/22/04 AT 10:15 TO 03/29/04 AT 14:07
END CICS TRAN FILE REQ FILE REQ DL/1 REQ DL/1 REQ DB2 SQL DB2 SQL DB2 DB2 DB2 WAIT DB2 WAIT UDB REQ UDB REQDATE SYSID COUNT COUNT TIME COUNT TIME COUNT TIME NON-SQL CT NON-SQL TM COUNT TIME COUNT TIME
TOT TOT AVG TOT AVG TOT AVG TOT AVG TOT AVG TOT AVG
03/22/04 A2A1 73 21 1.4133 7 .0000 44 ++++++++ 0 .0000 44 .0500 0 .0000D2A1 44 20 .9191 0 .0000 0 .0000 0 .0000 0 .0000 0 .0000T2A1 73 0 .0000 0 .0000 0 .0000 0 .0000 0 .0000 0 .0000
03/22/04 **** 190 41 1.1723 7 .0000 44 ++++++++ 0 .0000 44 .0192 0 .0000
03/29/04 A2A1 124 42 1.7614 14 .0000 88 ++++++++ 0 .0000 88 .2258 0 .0000D2A1 72 40 1.4087 0 .0000 0 .0000 0 .0000 0 .0000 0 .0000T2A1 126 0 .0000 0 .0000 0 .0000 0 .0000 0 .0000 0 .0000
03/29/04 **** 322 82 1.5894 14 .0000 88 ++++++++ 0 .0000 88 .0869 0 .0000
TOTALS 512 123 1.4503 21 .0000 132 ++++++++ 0 .0000 132 .0618 0 .0000
Field Description
CICS SYSID [TISYSID] Displays the system identifier.
DB2 NON-SQL CT TOT [TISQLCTM]
Displays the total number of DB2 non-SQL requests.
DB2 NON-SQL TM AVG [TISQLCTM]
Displays the average DB2 non-SQL time.
DB2 SQL COUNT TOT [TISQLCTM]
Displays the total number of DB2 SQL requests.
DB2 SQL TIME AVG [TISQLCTM] Displays the average DB2 SQL time.
DB2 WAIT COUNT TOT [TISQLCTM]
Displays the total number of DB2 wait requests.
6

2 Producing Reports
Control StatementsThese control statements, used to produce this report, are in the installation library in member RWTI04:
REPORT LINE LMRKDATE TISYSID TITRANCT(T) TIFCPRCT(T) TIFCPRTM TIDLIRCT(T) TIDLIRTM TISQLCCT(T) TISQLCTM TINSQCCT(T) TINSQCTM TIDB2WCT(T) TIDB2WTM TIUDBRCT(T) TIUDBRTM SFORM TIFCPRCT TIFCPRTM TIDLIRCT TIDLIRTM TITRANCT TISQLCCT TISQLCTM TINSQCCT TINSQCTM TIDB2WCT TIDB2WTM TIUDBRCT TIUDBRTM SUMF LMRKDATE TISYSID TITLE ‘I/O SUMMARY’ WIDTH 132 COVER NO
DB2 WAIT TIME AVG [TISQLCTM]
Displays the average DB2 wait time.
DL/1 REQ COUNT TOT [TIDLIRCT]
Displays the total number of DL/I requests.
DL/1 REQ TIME AVG [TIDLIRTM] Displays the average DL/I request time.
END DATE [LMRKDATE] Displays the date the record was written.
FILE REQ COUNT TOT [TIFCPRCT]
Displays the total number of file requests.
FILE REQ TIME AVG [TIFCPRTM] Displays the average file request time.
TRAN COUNT TOT [TITRANCT] Displays the total transaction count.
UDB REQ COUNT TOT [TIDLIRTM]
Displays the total number of user database requests.
UDB REQ TIME AVG [TIDLIRCT] Displays the average user database request time.
Field Description
87

ASG-TMON for CICS TS for z/OS Report Writer Guide
8
RWTI06 - Hourly Paging Summary
PurposeThe Hourly Paging Summary report provides an hourly summary of storage and paging statistics by date and system ID. Use this report to find paging activity in your system relative to other system activity.
Report DataThis report uses the transaction performance history (TI) subtype-1 and subtype-2 records. The table lists the report fields. The TMON for CICS TS or user-defined (for UFLD statements) field name is enclosed in brackets.
DATE: 04/07/04 A S G - T M O N f o r C I C S T S PAGE: 1TIME: 09:43:37 H O U R L Y P A G I N G S U M M A R Y
DATA IS FROM 03/25/04 AT 00:01 TO 03/25/04 AT 10:39
END CICS END PAGE IN PAGE OUT PAGING PAGE IN PAGE OUT PAGING PAGE IN PAGE OUT PAGING PAGE IN PAGE OUT PAGINGDATE SYSID TIME COUNT COUNT COUNT COUNT COUNT COUNT COUNT COUNT COUNT COUNT COUNT COUNT
TOT TOT TOT MIN MIN MIN MAX MAX MAX TOT TOT TOT
03/25/04 MFA 1:00 0 0 0 0 0 0 0 0 0 0 0 02:00 0 0 0 0 0 0 0 0 0 0 0 03:00 0 0 0 0 0 0 0 0 0 0 0 04:00 0 0 0 0 0 0 0 0 0 0 0 05:00 0 0 0 0 0 0 0 0 0 0 0 06:00 0 0 0 0 0 0 0 0 0 0 0 07:00 0 0 0 0 0 0 0 0 0 0 0 08:00 353 0 353 4 0 4 71 0 71 353 0 3539:00 597 4 601 0 0 0 94 4 94 597 4 60110:00 1,124 0 1,124 0 0 0 355 0 355 1,124 0 1,12411:00 31 0 31 0 0 0 11 0 11 31 0 31
MFA ***** 2,105 4 2,109 0 0 0 355 4 355 2,105 4 2,109
03/25/04 **** ***** 2,105 4 2,109 0 0 0 355 4 355 2,105 4 2,109
TOTALS 2,105 4 2,109 0 0 0 355 4 355 2,105 4 2,109
Field Description
CICS SYSID [TISYSID] Displays the system identifier.
END DATE [LMRKDATE] Displays the date the record was written.
END TIME [LMRKTIME] Displays the time the record was written.
PAGE IN COUNT AVG [TIPGEICT] Displays the average number of page-in operations.
PAGE IN COUNT MAX [TIPGEICT]
Displays the maximum number of page-in operations.
PAGE IN COUNT MIN [TIPGEICT] Displays the minimum number of page-in operations.
8

2 Producing Reports
Control StatementsThese control statements, used to produce this report, are in the installation library in member RWTI06:
OPTION PLEFT REPORT LINE LMRKDATE TISYSID LMRKTIME TIPGEICT(A) TIPGEOCT(A) TIPGETCT(A TIPGEICT(M) TIPGEOCT(M) TIPGETCT(M) TIPGEICT(X) TIPGEOCT(X) TIPGETCT(X) TIPGEICT(T) TIPGEOCT(T) TIPGETCT(T) SFORM TIPGEICT TIPGEOCT TIPGETCT SUMF LMRKDATE TISYSID LMRKTIME(0100000000) TITLE ‘HOURLY PAGING SUMMARY’
PAGE IN COUNT TOT [TIPGEICT] Displays the total number of page-in operations.
PAGE OUT COUNT AVG [TIPGEICT]
Displays the average number of page-out operations.
PAGE OUT COUNT MAX [TIPGEICT]
Displays the maximum number of page-out operations.
PAGE OUT COUNT MIN [TIPGEICT]
Displays the minimum number of page-out operations.
PAGE OUT COUNT TOT [TIPGEICT]
Displays the total number of page-out operations.
PAGING COUNT AVG [TIPGETCT]
Displays the average number of page-in and page-out operations.
PAGING COUNT MAX [TIPGETCT]
Displays the maximum number of page-in and page-out operations.
PAGING COUNT MIN [TIPGETCT] Displays the minimum number of page-in and page-out operations.
PAGING COUNT TOT [TIPGETCT] Displays the total number of page-in and page-out operations.
Field Description
89

ASG-TMON for CICS TS for z/OS Report Writer Guide
9
CustomizationYou can change the existing control statements to summarize data by date and system ID to obtain a daily paging summary report. Change the SUMF statement to:
SUMF LMRKDATE TISYSID
0

2 Producing Reports
RWTI07 - System vs Application CPU Utilization
PurposeThe System vs Application CPU Utilization report compares system CPU utilization to application CPU utilization.
Report DataThis report uses the transaction performance history (TI) subtype-1 and subtype-2 records. The table lists the report fields. The TMON for CICS TS or user-defined (for UFLD statements) field name is enclosed in brackets.
DATE: 04/07/04 A S G - T M O N f o r C I C S T S PAGE: 1
TIME: 22:31:21 S Y S T E M V S A P P L I C A T I O N C P U U T I L I Z A T I O N DATA IS FROM 03/04/04 AT 07:12 TO 04/03/04 AT 22:31 END CICS DFHSIP DFHSIP DISPATCH DFHSIP DFHSIP CPU TOT APPL TO SYS APPL TO SYS RAT APPL DATE SYSID DISPATCH <1:00:00.0000-> CPU <1:00:00.0000-> RATIO <-----100-----> CPU TIME TOT TOT TOT TOT 03/21/04 F410 1.1987 13.0195 0 0.0129 03/21/04 **** 1.1987 13.0195 0 0.0129 03/22/04 F410 52:43.1225 ============= 16.1542 0 0.0000 03/22/04 **** 52:43.1225 ============= 16.1542 0 0.0000 03/23/04 F410 8:52.8638 == 20.0701 0 0.0000 03/23/04 **** 8:52.8638 == 20.0701 0 0.0000 03/24/04 F410 1:22:21.8846 ==============+ 20.7266 0 0.0118 03/24/04 **** 1:22:21.8846 ==============+ 20.7266 0 0.0118 03/25/04 F410 11:44.8022 === 15.9278 0 0.0000 F530 1:57.3774 19.7175 0 0.0505 03/25/04 **** 13:42.1797 === 35.6453 0 0.0505 03/26/04 F410 1.1166 13.9380 0 0.0108 F530 23.2615 10.0995 0 0.0206 03/26/04 **** 24.3782 24.0375 0 0.0314 03/27/04 F410 5:35.6482 = 15.5280 0 0.0000 F530 5:33.3864 = 9.4804 0 0.0000 03/27/04 **** 11:09.0346 === 25.0084 0 0.0000
Field Description
APPL TO SYS RATIO TOT [UFLD APLRATIO]
Displays the ratio of application CPU time to system CPU time, defined through a UFLD statement.
CICS SYSID [TISYSID] Displays the system identifier.
DFHSIP CPU TOT [UFLD TOTCPU]
Displays the total CICS CPU time, defined through a UFLD statement.
91

ASG-TMON for CICS TS for z/OS Report Writer Guide
9
Control StatementsThese control statements, used to produce this report, are in the installation library in member RWTI07:
OPTION PLEFTUFLD NAME TOTCPU TYPE TIME HEAD1 ‘DFHSIP’ HEAD2 ‘ CPU ’ PROC TOTCPU = TITCBCTMUFLD NAME TOTDISP TYPE TIME HEAD1 ‘ DFHSIP ’ HEAD2 ‘DISPATCH’ PROC TOTDISP = TITSKDTMUFLD NAME APLRATIO TYPE COUNT HEAD1 ‘APPL TO SYS’ HEAD2 ‘ RATIO ’REPORT LINE LMRKDATE TISYSID TOTDISP(T) TOTCPU(T) APLRATIO TIAPLCTM SUMF LMRKDATE TISYSID GRAPHS TOTCPU(100000000) GRAPHS TOTDISP(100000000) GRAPHS APLRATIO(100) WIDTH 132 AT PRINT TISYSID WHEN TOTCPU > 0 THEN APLRATIO = (TIAPLCTM * 100) / TOTCPU ELSE APLRATIO = 0 TITLE ‘SYSTEM VS APPLICATION CPU UTILIZATION’ COVER NO
DFHSIP DISPATCH TOT [UFLD TOTDISP]
Displays the total CICS dispatch time, defined through a UFLD statement.
END DATE [LMRKDATE] Displays the date the record was written.
Field Description
2

2 Producing Reports
CustomizationSuppose you want to create this report for March 2004, covering only prime shift on weekdays. You could add this SELECT statement to the control statements used to create this report:
SELECT FDATA DATE 030104 TDATA DATE 033104 DRANGE MONDAY FRIDAY TRANGE 080000 170000
These FDATA and TDATA parameters tell Report Writer to include all data from the month of March 2004, beginning with the first record of March 1, 2004, and ending with the last record of March 31, 2004. The DRANGE and TRANGE parameters specify selection criteria to be applied to every record being considered for the report. The DRANGE parameter specifies a range of days of the week for reporting (e.g., Monday through Friday), while the TRANGE parameter specifies a time range for each day in the report (e.g., 8 A.M. to 5 P.M.).
The more you restrict the amount of data, the more useful your report, for example:
Suppose the existing System vs Application CPU Utilization report indicates that CPU utilization is unusually high for all CICS regions except SYSID CICS. You may want to break down the report into hourly intervals to pinpoint particular problem hours.
93

ASG-TMON for CICS TS for z/OS Report Writer Guide
9
RWTI08 - System Total Page
PurposeThe System Total Page report summarizes and presents information from the transaction performance history (TI) subtype-1 and region interval (TR) records on one page.
Report DataThe System Total Page report displays standard fields. A single-page System Total Page report is created for each day and includes all CICS address spaces. The selected data determines the period covered by the System Total Page report. In the absence of other selection criteria, the report contains data from 00:00:00 to 23:59:59.
DATE: 04/14/04 TMON Report Writer PAGE: 1TIME: 15:27:40 SYSTEM TOTAL PAGE FOR SYSA ON 05/06/04
DATA IS FROM 04/06/04 AT 11:30 TO 04/06/04 AT 13:49
CICS SYSTEM ACTIVITY CPU ANALYSIS CPU TIME TOTAL DISPATCH
RESPONSE TIME DISTRIBUTION TOTAL ADDRESS SPACE CPU 18.5328..TCB 16.4923
RESPONSE TXNS PCT CUM % 0 1 2 3 4 5 6 7 8 9 0 ..SRB 2.0405
0.0-1.0 SEC 651 15.9% 15.9% %%%% SUBTASKS CPU 16.43611.0-2.0 SEC 72 1.7% 17.7% ..DBCTL CONTROL TASK CPU .00002.0-3.0 SEC 580 14.2% 31.9% %%% ..DBCTL THREAD .00203.0-4.0 SEC 96 2.3% 34.3% ..TMON SUBTASK .01404.0-5.0 SEC 68 1.6% 36.0% ..OTHER SUBTASKS 16.42005.0 +++ SEC 2,606 63.9% 100.0% %%%%%%%%%%%%%
APPLICATION TASKS CPU/DISP .0562 6:50.5310TOTAL TRANSACTIONS EXECUTED 2,034TRANSACTIONS EXCLUDED FROM HIGH TASK 30ENDED TRANSACTIONS 2,004
I/O ACTIVITY COUNT AVG TIME TOTAL TIME
CICS SYSTEM AVAILABILITY FILE REQUESTS 398 33.7158 3:43:38.9019PROGRAM LOADS 21 .0321 .6755
SYSTEM AVAILABILITY PERCENTAGE 10.6% JOURNAL REQUESTS 1 .1471 .1471TD REQUESTS 338 .0013 .4458
FROM TIME 00:00:00 DL/I CALLS 0 .0000 .0000TO TIME 24:00:00 DL/I WAITS 18 .0783 1.4109SYSTEM OUTAGE 21:27:17 SQL CALLS TO DB2 17 .3209 5.4561
NON-SQL CALLS TO DB2 2 .1585 .3171START TIME END TIME DURATION USER DATA BASE CALLS 3 1.4260 4.278012:15:02 13:49:24 01:34:22 DB2 WAIT W/O THREAD 0 * NA * * NA *13:11:01 13:12:10 00:01:09 DB2 PLAN OVERFLOW 0 * NA * * NA *13:16:01 13:16:10 00:00:0913:20:03 13:49:34 00:29:3013:20:05 13:47:36 00:27:30
STORAGE ANALYSIS
HIGH WATER MARK INFORMATION DSA NAME SIZE IN USE SOS STG VIOLSCDSA 4,096K 412K 1 0
CATEGORY TIME TRANID ECDSA 10,240K 3,784K 1 0FILE WAIT .0000 V8FC ERDSA 9,216K 8,348K 0 0
ESDSA 1,024K 40K 0 0CATEGORY POOL SIZE TRANID EUDSA 6,144K 5,504K 1 0USER24 3,794K SOSU RDSA 512K 444K 0 0USER31 5,503K SOSU SDSA 256K 64K 0 0CICS24 4,039K SOSC UDSA 3,840K 40K 1 0CICS31 6,853K SOSC
HIGHEST PAGING RATE PER SEC 456HIGHEST WORKING SET (PAGE FRAMES) 0HIGHEST OPSYS STORAGE LEVEL 0
4

2 Producing Reports
The report has six sections that show:
• CICS system activity
• CICS system availability
• High-water mark information
• CPU analysis
• I/O activity
• Storage analysis.
The placement of each section is controlled by the WIDTH parameter of the REPORT statement.
CICS System Activity
This section shows you statistics about the transactions and their associated response times, specifically:
• The number of transactions in the TXNS field with response times that fall into one of six categories in the RESPONSE field.
• The number of transactions within each bucket as a percent of total transaction count in the PERCENT field. Each percent is graphed.
• The cumulative percent of transactions, calculated at each response time bucket in the CUM % field.
• The number of terminated, excluded transactions.
• The total number of transactions not transferred to TMON Log File Services as a result of being rejected by the WRITE RECORD user exit during the interval reported.
CICS System Availability
This section provides system-related statistics, such as:
• The beginning and ending time stamps for the interval reported
• The amount of system down time during the interval reported
• The start and end times of all periods when the system was operational during the interval reported and the duration of each.
95

ASG-TMON for CICS TS for z/OS Report Writer Guide
9
CPU Analysis
This section shows you the total amount of dispatch time and CPU time used. Both dispatch and CPU time are broken down into distinct types including SRB, application, and subtask TCB.
High Water Mark Information
This section displays the highest levels of file waits and various pool storage usage for the reporting interval. The TRANID identifies the task associated with these high-water marks.
I/O Activity
This section displays the number of requests issued during the interval reported in the VOLUME field and the total elapsed time for the requests issued in the TOTAL TIME field. The time stamp shown in the TOTAL TIME field is measured from the issuance of the request until subsequent dispatch of the transaction upon completion of the request. The AVG TIME field shows the average elapsed time for each time of the request.
Storage Analysis
This section displays various storage statistics such as:
• The name and size (in units of 1K) of each CICS dynamic storage area (DSA)
• The total amount of each DSA in use at the end of the interval reported
• The number of times each DSA has encountered a short-on-storage (SOS) condition
• The number of CICS storage violations that occurred in each DSA.
Control StatementsThese control statements, used to produce this report, are in the installation library in member RWTI08:
REPORT SPAGE WIDTH 132
6

2 Producing Reports
CustomizationTo create the System Total Page report, you must code the SPAGE parameter of the REPORT statement. No subparameters are associated with SPAGE.
Customization of the System Total Page report is limited to data selection and exclusion. You can use the SELECT and EXCLUDE statements to limit the data input to the report.
You should request only one System Total Page report in a single execution of Report Writer. When requesting this report with reports other than the Application Total Page (TPAGE) report, code the SPAGE REPORT statement first.
To request a System Total Page report for individual CICS address spaces, use these control statements:
REPORT SPAGE WIDTH 132SELECT PROC WHEN TIEGAPLD EQ ‘CICSAPLD’ THEN ACCEPT
97

ASG-TMON for CICS TS for z/OS Report Writer Guide
9
RWTI09 - Online History Comparison by Date
PurposeThe Online History Comparison by Date report displays history records from the online history file for a specific date. It is equivalent to the Online History screen (Option 6.TI), when summarized by date.
Report DataThis report uses the transaction performance history (TI) subtype-1 and subtype-2 records. The table lists the report fields. The TMON for CICS TS or user-defined (for UFLD statements) field name is enclosed in brackets.
DATE: 04/07/04 A S G - T M O N f o r C I C S T S PAGE: 1TIME: 09:48:01 O N L I N E H I S T O R Y C O M P A R I S O N B Y D A T E
DATA IS FROM 03/25/04 AT 00:01 TO 03/25/04 AT 10:39
JOB END ENDED RESPONSE EIP REQ TASK CPU PAGING I/ONAME DATE TRANS TIME TIME TIME COUNT COUNT
TOT AVG AVG TOT TOT TOT
CICSMFA 03/25/04 4,835 0.1236 0.0309 8.5723 2,109 9,590
TOTALS 4,835 0.1236 0.0309 8.5723 2,109 9,590
Field Description
EIP REQ TIME AVG [UFLD EIPRSP]
Displays the average EIP request time, defined through a UFLD statement.
END DATE [LMRKDATE] Displays the date the record was written.
ENDED TRANS TOT [UFLD TRANSX]
Displays the number of transactions that ended on the specified date, defined through a UFLD statement.
I/O COUNT TOT [TIIOCT] Displays the total number of input and output operations.
JOB NAME [LMRKJOBN] Displays the CICS jobname.
PAGING COUNT TOT [TIPGETCT] Displays the total number of page-in and page-out operations.
RESPONSE TIME AVG [TIRSPTM] Displays the response time for transactions that ended on the specified date.
TASK CPU TIME TOT [TICPURTM]
Displays the total CPU time used by the transactions.
8

2 Producing Reports
Control StatementsThese control statements, used to produce this report, are in the installation library in member RWTI09:
OPTION PLEFTUFLD NAME TRANSX TYPE COUNT HEAD1 ‘ENDED’ HEAD2 ‘TRANS’ PROC TRANSX = TITRANCT - TITRNXCTUFLD NAME EIPRSP TYPE TIME AVERAGE TRANSX HEAD1 ‘EIP REQ’ HEAD2 ‘ TIME’ PROC EIPRSP = TIEIPRTMREPORT LINE LMRKJOBN LMRKDATE TRANSX(T) TIRSPTM EIPRSP(A) TICPURTM(T) TIPGETCT(T) TIIOCT(T) SUMF = LMRKJOBN TITLE ‘ONLINE HISTORY COMPARISON BY DATE’ WIDTH = 132 COVER NO
CustomizationBecause the purpose of the Online History Comparison by Date report is so specific (that is, to replicate the Online History screen when summarized by date), customizing it would defeat its purpose. Therefore, we have not offered any suggestions for report customization.
99

ASG-TMON for CICS TS for z/OS Report Writer Guide
1
00