2d information visualization svg and html5 -...
TRANSCRIPT
2D Information VisualizationSVG and HTML5
Version of 20 May 2011
Christian KantnerAlbert LeimullerEvgenia PopovaMichael Steurer
Abstract
There are many different solutions and technologies to create a web-based 2D information visualization. Themost common are Java Applets, JavaScript and Ajax, Flash, SVG and since 2008 HTML5 with the Canvaselement. In this paper a brief overview of these technologies and short introduction by example in SVG andHTML5 Canvas architectures is conducted. A few libraries which enable the use of high quality 2D informationvisualizations like Protovis, RGrapgh, Google Chart Tool and the Jit is demonstrated in this work and finally aperformance benchmarking of the introduced technologies which allows to judge upon technologies’ potential.

Contents
1 Introduction 11.1 HTML . . . . . . . . . . . . . . . . . . . . . . . . . . . . . . . . . . . . . . . . . . . . . . . 1
1.1.1 Idea . . . . . . . . . . . . . . . . . . . . . . . . . . . . . . . . . . . . . . . . . . . . 11.1.2 Markup languages . . . . . . . . . . . . . . . . . . . . . . . . . . . . . . . . . . . . 11.1.3 JavaScript . . . . . . . . . . . . . . . . . . . . . . . . . . . . . . . . . . . . . . . . . 2
1.2 Java Applet, Adobe Flash . . . . . . . . . . . . . . . . . . . . . . . . . . . . . . . . . . . . . 21.3 JSON . . . . . . . . . . . . . . . . . . . . . . . . . . . . . . . . . . . . . . . . . . . . . . . 31.4 Overview 2D Graphics . . . . . . . . . . . . . . . . . . . . . . . . . . . . . . . . . . . . . . 3
1.4.1 SVG . . . . . . . . . . . . . . . . . . . . . . . . . . . . . . . . . . . . . . . . . . . . 31.4.2 HTML5 Canvas Element . . . . . . . . . . . . . . . . . . . . . . . . . . . . . . . . . 3
2 Scalable Vector Graphics 52.1 About SVG . . . . . . . . . . . . . . . . . . . . . . . . . . . . . . . . . . . . . . . . . . . . 52.2 History of SVG . . . . . . . . . . . . . . . . . . . . . . . . . . . . . . . . . . . . . . . . . . 52.3 SVG and HTML5 . . . . . . . . . . . . . . . . . . . . . . . . . . . . . . . . . . . . . . . . . 52.4 Embedding SVG in HTML5 documents . . . . . . . . . . . . . . . . . . . . . . . . . . . . . 62.5 SVG Elements and Functions . . . . . . . . . . . . . . . . . . . . . . . . . . . . . . . . . . . 62.6 Styling, Scripting and Animations with SVG using CSS and JavaScript . . . . . . . . . . . . . 72.7 The Google Chart Tools . . . . . . . . . . . . . . . . . . . . . . . . . . . . . . . . . . . . . . 82.8 SVG in Action: Protovis . . . . . . . . . . . . . . . . . . . . . . . . . . . . . . . . . . . . . 10
3 HTML5 133.1 An Introduction to the Standard . . . . . . . . . . . . . . . . . . . . . . . . . . . . . . . . . 133.2 Feature Space . . . . . . . . . . . . . . . . . . . . . . . . . . . . . . . . . . . . . . . . . . . 133.3 Canvas HTML5 API . . . . . . . . . . . . . . . . . . . . . . . . . . . . . . . . . . . . . . . 14
3.3.1 The Canvas element . . . . . . . . . . . . . . . . . . . . . . . . . . . . . . . . . . . 143.4 Existing Frameworks . . . . . . . . . . . . . . . . . . . . . . . . . . . . . . . . . . . . . . . 16
3.4.1 JavaScript InfoVis Toolkit . . . . . . . . . . . . . . . . . . . . . . . . . . . . . . . . 163.4.2 jQuery Sparklines . . . . . . . . . . . . . . . . . . . . . . . . . . . . . . . . . . . . . 163.4.3 Flot . . . . . . . . . . . . . . . . . . . . . . . . . . . . . . . . . . . . . . . . . . . . 163.4.4 jqPlot . . . . . . . . . . . . . . . . . . . . . . . . . . . . . . . . . . . . . . . . . . . 173.4.5 RGraph . . . . . . . . . . . . . . . . . . . . . . . . . . . . . . . . . . . . . . . . . . 17
4 Conclusion 194.1 Studies on Performance . . . . . . . . . . . . . . . . . . . . . . . . . . . . . . . . . . . . . . 194.2 Results . . . . . . . . . . . . . . . . . . . . . . . . . . . . . . . . . . . . . . . . . . . . . . . 204.3 Conclusions . . . . . . . . . . . . . . . . . . . . . . . . . . . . . . . . . . . . . . . . . . . . 22
i

ii
Chapter 1
Introduction
1.1 HTML
1.1.1 Idea
HTML, in short HyperText Markup Language, is a markup language that was invented in 1989 by Tim Berners-Lee. The basic idea behind HTML is to connect related content by means of hyperlinks. Hyperlinks enablejumping from one content to another even if the latter is located far away. This web of information is createdby the world wide web. The information itself is then shared by HTML. Raggett [1998]
Another basic idea behind the web is to reduce information replication, which is another reason why linksare so important. Tim Berners-Lee could hardly foresee what potential his idea would have in the future. Oneimportant aspect of his work and its wide appreciation was the fact that he invented HTML based on SGML.SGML (Standard Generalized Markup Language) is an ISO standardized language that uses markup to describea text by adding tags to point out what kind of content it is.
In 1995 the second version of HTML was published, HTML 2.0. HTML 3.2 was released in early 1997and in the end of 1997 HTML 4.0 came up in three different versions (strict, transitional and frame-set). Afurther release of HTML 4 was already in the making when the W3C decided to stop any further developmenton HTML 4 and created another version of HTML, XHTML. XHTML 1.0 was released in 2000 and broughtsome new features and a closer implementation to XML. In 2008 HTML5 was finally published as a first draft.HTML5 is a major step and brought many new tags and possibilities like the canvas element and the svg tag.Even video is supported natively. Lubbers [2010]
1.1.2 Markup languages
HTML is one of many markup languages. It uses a list of given tags to divide the content of a web page indifferent types of elements like a header, paragraph or a hyperlink. Basically an opening tag for a paragraphlooks like <p> and a closing tag of a paragraph like </p>.
Below is a simple markup language example. In this case the used language is XML. The tags indicate thetype of content. <book> is the opening tag and </book> the closing tag. In these opening and closing tags isthe content which can also include tags and further content. The example shows how a book could be dividedin chapter, title and content elements.
1 <? xml v e r s i o n =” 1 . 0 ” e n c o d i n g =”ISO−8859−1” ?>2 <book>3 <c h a p t e r>4 < t i t l e>First Chapter< / t i t l e>5 <c o n t e n t>Some text .< / c o n t e n t>6 < / c h a p t e r>7 <c h a p t e r>
1

2 CHAPTER 1. INTRODUCTION
8 < t i t l e>Second Chapter< / t i t l e>9 <c o n t e n t>Even more text .< / c o n t e n t>
10 < / c h a p t e r>11 < / book>
1.1.3 JavaScript
JavaScript is an object-oriented scripting language that was published in 1995. It is mostly used in web browserswhere the JavaScript code is inserted directly into the HTML code. It enables interactivity that would not bepossible with the use of simple HTML which only generates a static web page. JavaScript is client-sided andcalculates independently from the server-side. So combining JavaScript with HTML and PHP the calculationcan be splitted up to the client-side and the server-side which increases the loading of a web page. Flanagan[2006]JavaScript is used in a wide variety of fields. Very simple examples include the validation of forms withoutreloading the web page. This would not be possible in a form simply written in PHP and HTML.Below is a simple example of how JavaScript can directly be added into the header of an HTML page usingscript tags.
1 <script type=” t e x t / j a v a s c r i p t ”>2 document .write ( ’ H e l l o World ! ’ ) ;3 </script>
Next to the JavaScript combination with HTML another technique became popular, AJAX. AJAX is anacronym for Asynchronous JavaScript and XML. The basic idea behind AJAX is to use already existing toolsand combine their strengths. It also takes advantage of the described above technique and uses a asynchronousprocess combining client-side and server-side calculation. These shared resources make it possible for clientbrowser to calculate while another calculation is done on the server and the result can be represented asyn-chronously in the web browser. The tools used next to JavaScript and PHP are HTML and CSS for presentation,DOM and the HTTPRequest. The HTTPRequest is used to further enhance the power of JavaScript so that itcan communicate directly with the server without reloading of a page.
1.2 Java Applet, Adobe Flash
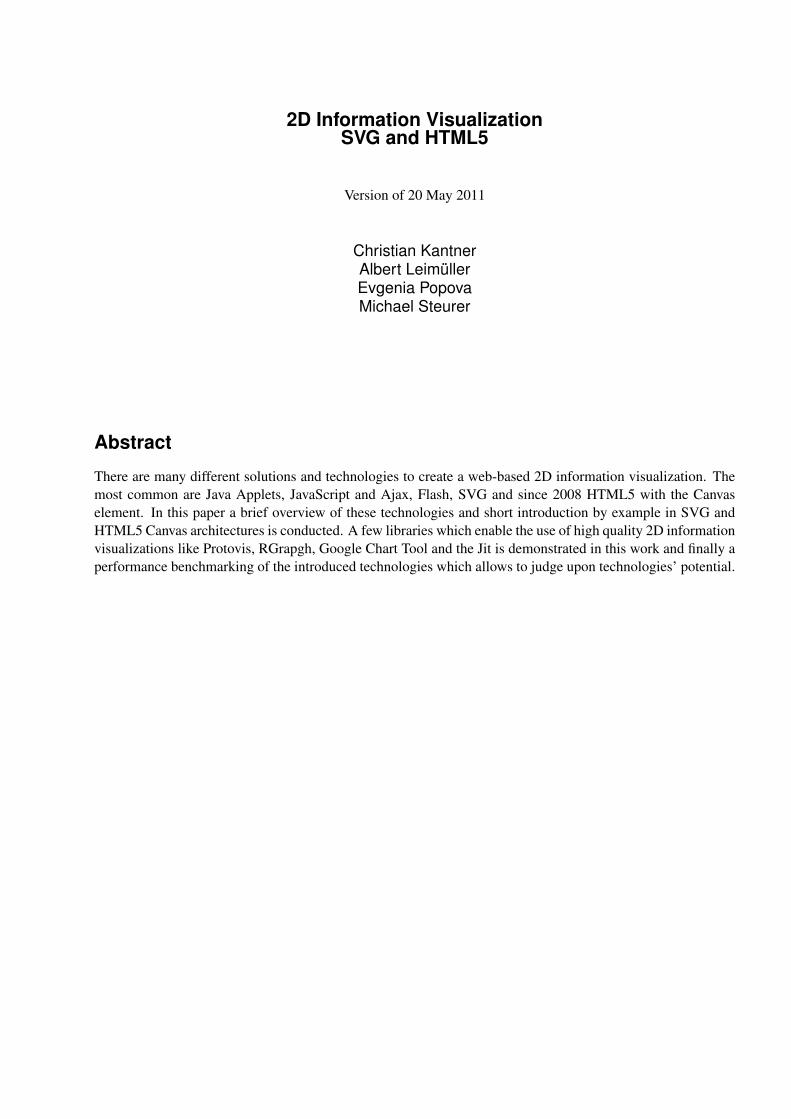
Another technology allowing the user to interact with a web page is the Java Applet.1 It was first introduced in1995 by Java Sun. Java Applets are programs written in Java or a programming language that compiles to Javabytecode like Jython, JRuby and Eiffel. The Java code is embedded in the HTML code. If a user opens a webpage including a Java Applet, the Java code is downloaded and run in the browsers virtual machine. It is alsopossible to run a Java Applet independently from a web browser in an Applet viewer. Java Applets run fasterthan JavaScript and are executable in many different operating systems. But a disadvantage of Java Applets isthat it works only if Java is installed. Figure 1.1 shows an animated implementation of a graph using a JavaApplet.2
Flash was developed by Adobe and is a multimedia platform to add all kinds of multimedia to web pages.It enables the use of videos, animations and interactivity. Flash software is written in a programming languagecalled ActionScript. Flash is featured on many web pages but in order to consume this content a Flash Playerhas to be installed on the user’s PC. The Flash Player is free but the software to develop Flash is not. Florio[2008]
1http://java.sun.com/applets/2http://java.sun.com/applets/jdk/1.4/demo/applets/GraphLayout/example1.html
1.3. JSON 3
Figure 1.1: Java Applet
1.3 JSON
JSON or JavaScript Object Notation is a data transfer format that is used in many different programminglanguages but mostly in JavaScript. It is similar to XML but there are some differences. XML uses tags toseparate data, JSON on the contrary uses key and value pairs. One of the main advantages of such data transferformats is that they are easy to read for for humans. The parsing by a computer is also very simple. JSON islanguage independent but bases it’s implementation on JavaScript. The two basic key structures of JSON arethat of a collection of name and value pairs and that of an ordered list like an array. Based on the fact that thesetwo structures are universal data structures almost all programming languages can handle JSON. Zakas [2010]
JSON consists of a few different forms. There are JSON objects, arrays, values, strings and numbers. Thebasic JSON object starts with an opening curly brace and ends with a closing curly brace. A JSON object canbe empty or consist of members. Members consist of one or more pairs. A pair is a string, a “:” and a value.A value can be a string, a number, an object, an array, true, false or null. That is basically the concept behindJSON. A very simple example of a JSON object: {"key" : "value"}.
1.4 Overview 2D Graphics
1.4.1 SVG
SVG is a graphic format and stands for scalable vector graphics. It is a W3C standard and can be used it togetherwith other standards of the W3C. Therefore the direct embedding of SVG graphics in a HTML page using theHTML5 svg tag is possible. SVG uses vector images which have a number of advantages over bitmap graphics.The scaling works well even if you zoom in very closely and the file size compared to that of a bitmap graphicis very good. Furthermore SVG renders colors more accurate on different machines than bitmap graphics. Afew other interesting points are that it is text based, written in XML and can even be animated. Pearlman [2003]
1.4.2 HTML5 Canvas Element
The Canvas element is a new feature in HTML5. It is a rectangular field that enables you to manipulate with itin a wide range of possibilities. Using JavaScript you can draw, add simple shapes, manipulate them and evencreate animations. HTML5 Canvas does not use vector graphics which means that zooming in and out like inSVG is not possible and the elements on the canvas are not part of the pages DOM. But it performs fast and theAPI provides a wide variety of features to work with. Lubbers [2010]

4 CHAPTER 1. INTRODUCTION
Chapter 2
Scalable Vector Graphics
2.1 About SVG
Scalable Vector Graphics abbreviated as SVG is a graphics format based on XML grammar. It has benn de-veloped by the World Wide Web Consortium (W3C) since the late 90’s. In SVG a markup language is used todescribe two-dimensional graphical objects. W3C [2011c,d]
In the context of SVG “scalable” means that it is possible to uniformly scale an SVG graphic to any desiredscreen resolution. “Vector” means that a series of geometric shapes is used to describe a picture or scene. InSVG it’s also possible to mix standard bitmap graphics and vector graphics thus the term “graphics” should givea hint on this feature, W3C [2011d]. SVG is based on XML which is the abbreviation for Extensible MarkupLanguage also developed by the W3C, W3C [2011a]. The SVG specification also permits the use of CascadingStyle Sheets (CSS) to be used for styling vector graphic elements, W3C [2011d].
2.2 History of SVG
In 1998 Adobe Systems and Sun Microsystems proposed a new vector graphics standard called PrecisionGraphics Markup Language (PGML). This standard defines an XML based language for representing vectorgraphics. It was submitted to the W3C but never got adopted as a recommendation, Wikipedia [2011a]. At thesame time Autodesk, Hewlett-Packard, Macromedia, Microsoft and Visio also proposed and submitted theirown standard for vector graphics called “Vector Markup Language”. VML is also an XML based language fordefining vector elements. It was also rejected by the W3C, Wikipedia [2011c]. Instead of accepting one of thosesuggested standards the W3C decided to create their own standard, SVG. The first recommendation SVG 1.0entered the final stage in September 2001. In 2003 an update to the standard was released. In that updated theprevious standard was modularized in order to allow implementers only to support a subset of features. Thosesubsets were called “Tiny”, “Basic” and “Full”. In 2008 SVG 1.2 reached the recommendation state. In 2010the second edition of SVG 1.1 was released. It did not contain any new features but instead many clarifications.Currently SVG 2.0 is in development, Wikipedia [2011b].
2.3 SVG and HTML5
The HTML5 standard permits the use of the <svg> - element which belongs to the SVG namespace. Ac-cording to the specification of HTML5 the <svg> element belongs to the family of tags containing embeddedcontent, W3C [2011b]. All tags of this family import resources into the document, Bruce Lawson [2011]. TheHTML5 specification does not contain any processing rules regarding to the way of handling SVG content.How SVG elements are inserted into the DOM tree and how they should be dealt with is part of the SVG spec-ification. With other words the entire semantic of the <svg> element is defined in the SVG specification and
5
6 CHAPTER 2. SCALABLE VECTOR GRAPHICS
not in the HTML5 specification W3C [2011b].
2.4 Embedding SVG in HTML5 documents
There are several tags available for embedding SVG graphics in HTML documents. In previous versions ofHTML there were 4 tags which provided this function. The <embed>, <object>, <img> and <iframe>tag. Each one has its advantages and disadvantages. The <embed> requires a plug-in to be installed and can notbe used if the target document needs to be XHTML conform. The use of the <object> tag does not require aplug-in and also does not break XHTML conformity but SVG graphics will not be displayed if the plug-in forthe <embed> tag is already installed (at least in Internet Explorer). The best way to embed SVG graphics inHTML4 documents is to use the <img> or <iframe> tag. This works in browsers which support SVG, W3C[2011e]. In HTML5 SVG can be embedded by in-lining the SVG XML code inside the HTML document. Thiscan be done with the help of the previously mentioned new <svg> tag. Documents which contain an <svg>- element must be considered valid even the browser does not support SVG graphics. Sub elements of <svg>must be declared to be part of the SVG namespace identified by “http://www.w3.org/2000/svg”.
The next code snippet shows how an HTML5 document with in-lined SVG may look:
1 <!DOCTYPE html>2 <html lang=”en”>3 <head>4 <meta charset=”utf−8” />5 <title>inline SVG in HTML5</title>6 </head>7 <body>8 <svg id=”svgelem”9 height=”220”
10 width=”220”11 xmlns=”http : / / www .w3 .org / 2 0 0 0 /svg”>12 <!−− . . . svg content goes here −−>13 </svg>14 </body>15 </html>
The <svg> element contains 4 attributes to tell the browser how to deal with the defined <svg> element.The id attribute assigns a document unique id to the <svg> element. The width and height attribute defines thedimensions of the SVG viewport and the xmlns attribute defines the namespace to use as default for all childelements of the <svg> element.
2.5 SVG Elements and Functions
In SVG geometric primitives and basic shapes are used to describe a picture. In this section the basic elementswill be explained and a practical examples of drawing them on the SVG viewport will be demonstrated. Allexamples in this section are taken from Watt [2011].
Primitives and basic shapes. One of the most basic elements is a simple line that connects a start-pointwith an end-point. The following code sample shows how to draw a line in SVG:
1 <line x1=”50” y1=”20” x2=”300” y2=”300”2 style=”stroke :black ;” / >
2.6. STYLING, SCRIPTING AND ANIMATIONS WITH SVG USING CSS AND JAVASCRIPT 7
The <line> - element contains attributes that define the start point (x1,y1), the endpoint (x2,y2) and astyle attribute to define the line style. Here only the color for the line is defined using the stroke keyword.Notice the x-axis is from left to right and the y-axis from top to bottom so the root point (0,0) is in the upperleft corner.Drawing a rectangle can be accomplished using 4 <line> elements but there is a simple <rect> elementwhich ease this job.
1 <rect x=”10” y=”10” width=”50” height=”25”2 style=”stroke :black ; fill :none ;” / >
In this example the <rect> element is used, the upper left corner of the rectangle is defined with (x,y), thedimensions of the rectangle are set using the “width” and “height” attributes. The “style” attribute defines theline color using the keyword “stroke” and with keyword “fill” the rectangle is defined to be empty, the only thesurrounding line is displayed.Drawing a triangle can be accomplished in several ways. The naıve way would be to use 3 <line> elements.But there is also a <polyline> element which can be used.
1 <polyline points=”50 ,50 100 ,100 0 ,100 50 ,50”2 style=”stroke :black ; fill :none ;” / >
The “points” attribute contains a series of coordinate tuples which represent the points that should be con-nected. The line that is drawn starts at the first point and is connected with the next point in the series and soon. Again the “style” attribute defines line color and prevents to fill the resulting surface with the default color.A second way to draw a triangles using the <polygon> element.
1 <polygon points=”50 ,50 100 ,100 0 ,100”2 style=”stroke :black ; fill :none ;” / >
The difference between these two approaches is that the <polyline> element requires 4 points, the<polygon> element only three because the shape is automatically closed. In the series of coordinates the lastpoint is automatically connected with the start point again.
There are several other elements which are available to draw basic shapes for example <circle>,<ellipse> or <path> element.
2.6 Styling, Scripting and Animations with SVG using CSS and JavaScript
One way of styling shapes is the “style” attribute that has been used in previous examples. Another way ofstyling elements is to use cascading style sheet (CSS) definitions that can be defined in the header of the HTMLdocument or in an external CSS file and referenced using a <link> element. The following code snippetshows an example of using CSS to style an element Watt [2011]:
1 <style type=”text /css”>2 blackTriangle { stroke : black ; fill : none ;}3 </style>4 <polygon id=” blackTriangle ” points=”50 ,50 100 ,100 0 ,100”/ >
Here an “id” was assigned to the <polygon> element. Using id’s makes it possible to use JavaScriptto obtain SVG elements using the document.getElementById() - function. Further it is possible tochange certain style attributes using JavaScript. It is also possible to register event listeners directly on an SVGelement, shown in the next code sample, Watt [2011]:
1 <polygon points=”50 ,50 100 ,100 0 ,100”2 style=”stroke : black ; ”
8 CHAPTER 2. SCALABLE VECTOR GRAPHICS
3 onclick=”alert ( ’you clicked me ’ ) ;” / >
Running this sample code and clicking on the triangle will pop up a message box. Other listeners likemouse over, mouse out and others can be registered as well. In combination with the setTimeout JavaScriptfunction also animations can be implemented. Watt [2011]
For information visualization in the web browser there exists various frameworks based on SVG andJavaScript. In this document a glimpse on two of them is given. The Google Chart Tools framework which is anopen source framework developed and maintained by Google and the Protovis framework which is developedand maintained by the Stanford Visualization Group. Other frameworks like Highcharts JS or Raphael are alsobased on SVG and JavaScript but are not discussed in this paper.
2.7 The Google Chart Tools
The Google Chart Tools provides an API for visualizing data on web sites. It uses the SVG tag provided byHTML5 and VML for older Internet Explorer versions. It works on mobile devices like iPhone and iPad aswell as on devices based on Android without any plug-ins. The look and feel of all charts can be customizedusing CSS. Different types of data sources can be used to obtain data that should be visualized.
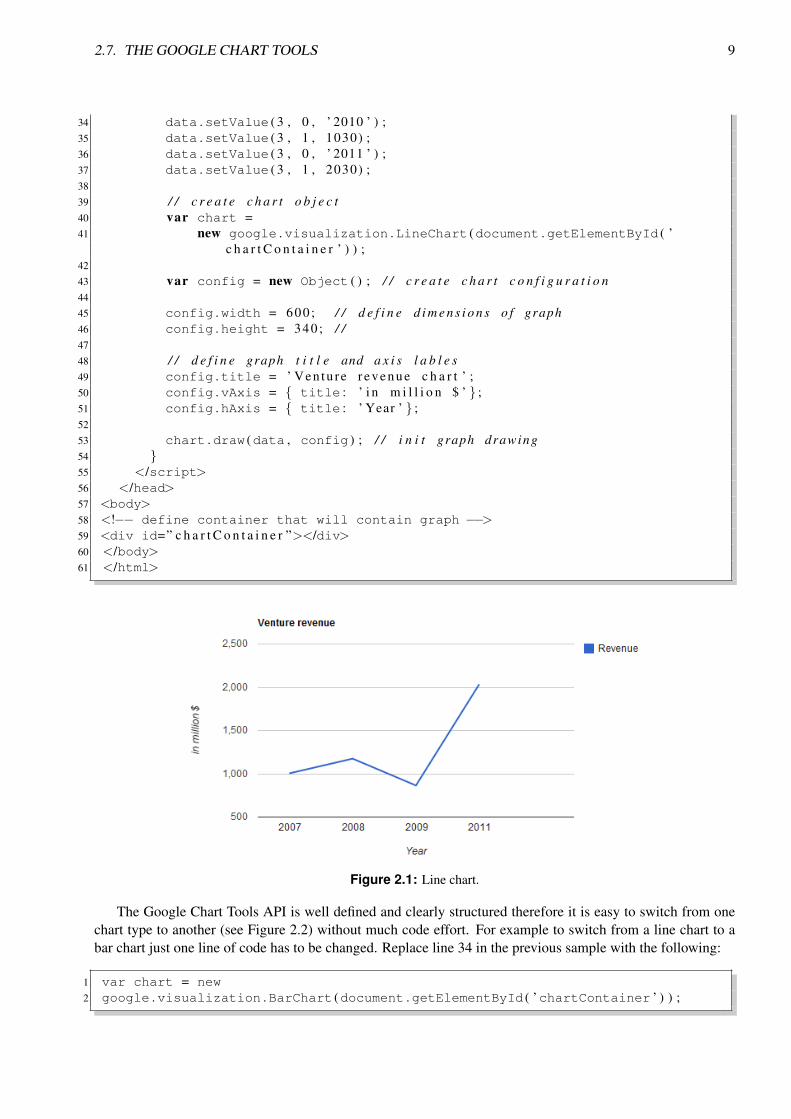
Simple example of a Line Chart created with Google Chart Tools. The following code demon-strates how to use the Google Chart Tools to display a simple line chart (see Figure 2.1):
1 <!DOCTYPE html>2 <html lang=” en ”>3 <head>4 <meta charset=” u t f −8” />5 <!−− include Google APi −−>6 <script type=” t e x t / j a v a s c r i p t ”7 src=” h t t p s : / / www. goo g l e . com / j s a p i ”></script>8 <script type=” t e x t / j a v a s c r i p t ”>9
10 / / l oad v i s u a l i z a t i o n module11 google .load ( ” v i s u a l i z a t i o n ” , ” 1 ” , {packages : [ ” c o r e c h a r t ” ] } ) ;1213 / / r e g i s t e r e v e n t l i s t e n e r , c a t c h e s page load e v e n t14 google .setOnLoadCallback (drawChart ) ;1516 / / d e f i n e s e v e n t l i s t e n e r17 f u n c t i o n drawChart ( ) {18 / / c r e a t e s b a s i c da ta s o u r c e19 var data = new google .visualization .DataTable ( ) ;2021 data .addColumn ( ’ s t r i n g ’ , ’ Year ’ ) ; / / d e f i n e column o f t a b l e22 data .addColumn ( ’ number ’ , ’ Revenue ’ ) ; / /2324 data .addRows ( 5 ) ; / / d e f i n e c o u n t o f da ta rows2526 / / add da ta p o i n t s t o da ta t a b l e27 / / p a r a m a t e r s : row , c e l l , v a l u e28 data .setValue ( 0 , 0 , ’ 2007 ’ ) ;29 data .setValue ( 0 , 1 , 1000) ;30 data .setValue ( 1 , 0 , ’ 2008 ’ ) ;31 data .setValue ( 1 , 1 , 1170) ;32 data .setValue ( 2 , 0 , ’ 2009 ’ ) ;33 data .setValue ( 2 , 1 , 860) ;
2.7. THE GOOGLE CHART TOOLS 9
34 data .setValue ( 3 , 0 , ’ 2010 ’ ) ;35 data .setValue ( 3 , 1 , 1030) ;36 data .setValue ( 3 , 0 , ’ 2011 ’ ) ;37 data .setValue ( 3 , 1 , 2030) ;3839 / / c r e a t e c h a r t o b j e c t40 var chart =41 new google .visualization .LineChart (document .getElementById ( ’
c h a r t C o n t a i n e r ’ ) ) ;4243 var config = new Object ( ) ; / / c r e a t e c h a r t c o n f i g u r a t i o n4445 config .width = 600 ; / / d e f i n e d i m e n s i o n s o f graph46 config .height = 340 ; / /4748 / / d e f i n e graph t i t l e and a x i s l a b l e s49 config .title = ’ Ven tu re r e v e n u e c h a r t ’ ;50 config .vAxis = { title : ’ i n m i l l i o n $ ’ } ;51 config .hAxis = { title : ’ Year ’ } ;5253 chart .draw (data , config ) ; / / i n i t graph drawing54 }55 </script>56 </head>57 <body>58 <!−− define container that will contain graph −−>59 <div id=” c h a r t C o n t a i n e r ”></div>60 </body>61 </html>
Figure 2.1: Line chart.
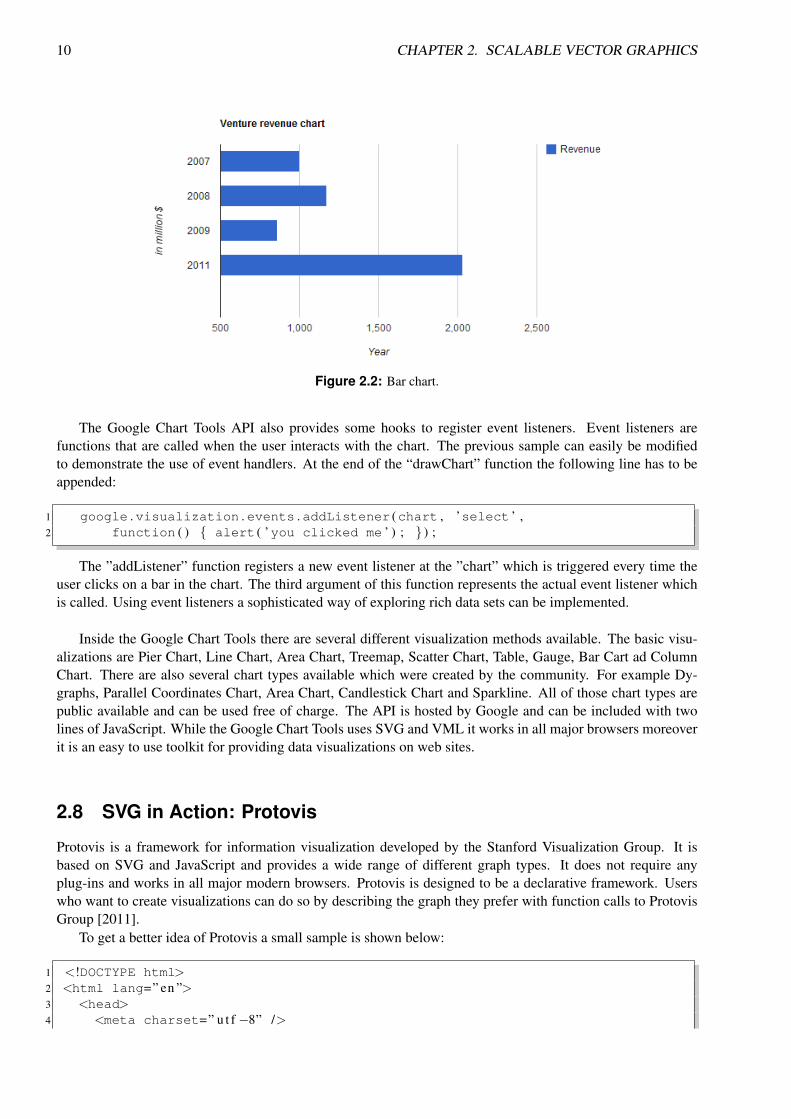
The Google Chart Tools API is well defined and clearly structured therefore it is easy to switch from onechart type to another (see Figure 2.2) without much code effort. For example to switch from a line chart to abar chart just one line of code has to be changed. Replace line 34 in the previous sample with the following:
1 var chart = new2 google .visualization .BarChart (document .getElementById ( ’chartContainer ’ ) ) ;
10 CHAPTER 2. SCALABLE VECTOR GRAPHICS
Figure 2.2: Bar chart.
The Google Chart Tools API also provides some hooks to register event listeners. Event listeners arefunctions that are called when the user interacts with the chart. The previous sample can easily be modifiedto demonstrate the use of event handlers. At the end of the “drawChart” function the following line has to beappended:
1 google .visualization .events .addListener (chart , ’select ’ ,2 function ( ) { alert ( ’you clicked me ’ ) ; } ) ;
The ”addListener” function registers a new event listener at the ”chart” which is triggered every time theuser clicks on a bar in the chart. The third argument of this function represents the actual event listener whichis called. Using event listeners a sophisticated way of exploring rich data sets can be implemented.
Inside the Google Chart Tools there are several different visualization methods available. The basic visu-alizations are Pier Chart, Line Chart, Area Chart, Treemap, Scatter Chart, Table, Gauge, Bar Cart ad ColumnChart. There are also several chart types available which were created by the community. For example Dy-graphs, Parallel Coordinates Chart, Area Chart, Candlestick Chart and Sparkline. All of those chart types arepublic available and can be used free of charge. The API is hosted by Google and can be included with twolines of JavaScript. While the Google Chart Tools uses SVG and VML it works in all major browsers moreoverit is an easy to use toolkit for providing data visualizations on web sites.
2.8 SVG in Action: Protovis
Protovis is a framework for information visualization developed by the Stanford Visualization Group. It isbased on SVG and JavaScript and provides a wide range of different graph types. It does not require anyplug-ins and works in all major modern browsers. Protovis is designed to be a declarative framework. Userswho want to create visualizations can do so by describing the graph they prefer with function calls to ProtovisGroup [2011].
To get a better idea of Protovis a small sample is shown below:
1 <!DOCTYPE html>2 <html lang=” en ”>3 <head>4 <meta charset=” u t f −8” />
2.8. SVG IN ACTION: PROTOVIS 11
5 <script type=” t e x t / j a v a s c r i p t ” src=” p r o t o v i s−r3 . 2 . j s ”></script>6 </head>7 <body>89 <script>
1011 / / c r e a t e a new p a n e l which w i l l c o n t a i n t h e graph12 var vis = new pv .Panel ( )13 .width ( 3 0 0 )14 .height ( 2 5 0 ) ;1516 / / add v e r t i c a l a x i s l a b e l s17 vis .add (pv .Rule )18 / / s t a r t a t 0 up t o 3 i n s t e p o f . 519 .data (pv .range ( 0 , 3 , . 5 ) )20 .bottom ( f u n c t i o n (d ) { re turn d * 80 + . 5 ; } )21 .add (pv .Label ) ;2223 / / add bar ’ s24 vis .add (pv .Bar )25 / / add da ta p o i n t s26 .data ( [ 1 , 2 , 1 . 5 , 2 , 2 , 1 ] )27 .width ( 4 0 ) / / w i d t h o f bar28 / / d e f i n e f u n c t i o n t o c a l c u l a t e h e i g h t o f bar29 .height ( f u n c t i o n (d ) { re turn d * 8 0 ; } )30 / / bo t tom o f f s e t o f each bar31 .bottom ( 0 )32 / / l o c a t i o n o f lower− l e f t p o i n t o f each bar33 .left ( f u n c t i o n ( ) { re turn t h i s .index * 45 + 25 } )34 / / a s s i g n some n i c e c o l o r ’ s . . .35 .fillStyle (pv .Colors .category20 ( ) .by (pv .index ) ) ;3637 / / add char l a b e l38 vis .add (pv .Label )39 .left ( 1 2 0 ) / / 120 px from l e f t bo rd er40 .top ( 2 4 ) / / 24 px from t o p bo rd er41 .textAlign ( ” c e n t e r ” ) / / c e n t e r t e x t42 .font ( ” 20 px sans−s e r i f ” ) / / f o n t s t y l e43 / / c o n t e n t o f t e x t l a b e l44 .text ( ” Revenue i n m i l l i o n ” ) ;4546 / / r e n d e r and d i s p l a y t h e graph47 vis .render ( ) ;4849 </script>5051 </body>52 </html>
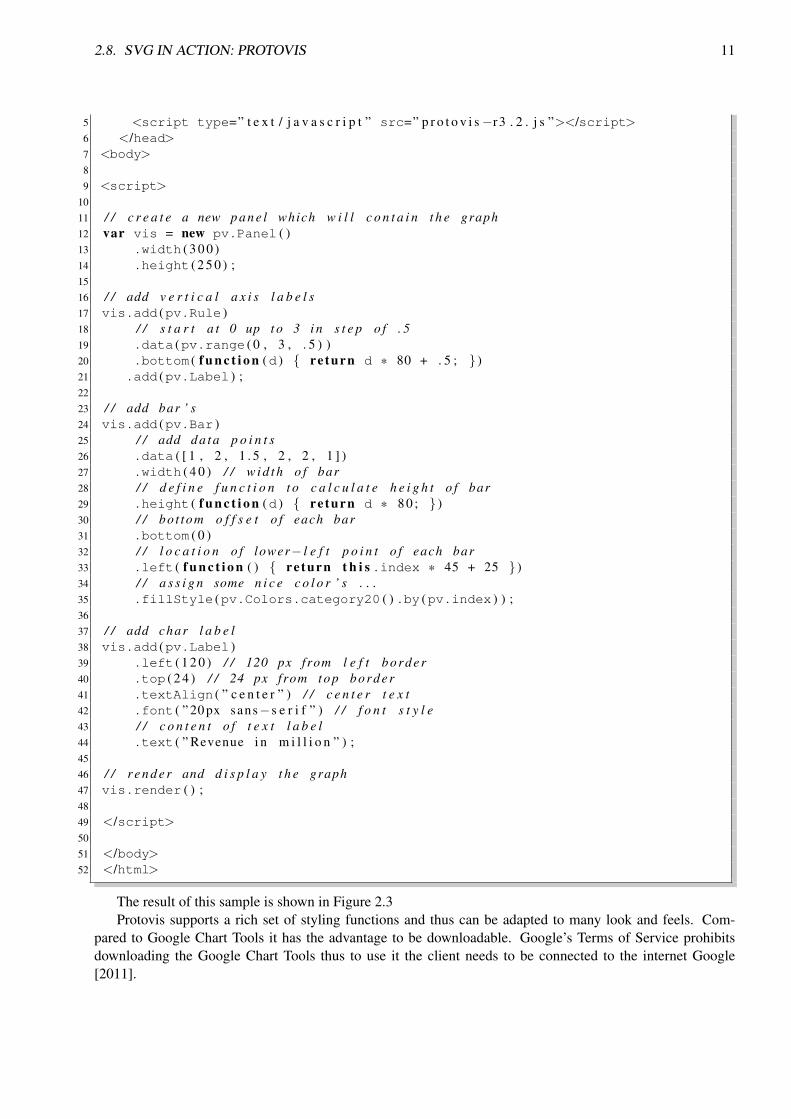
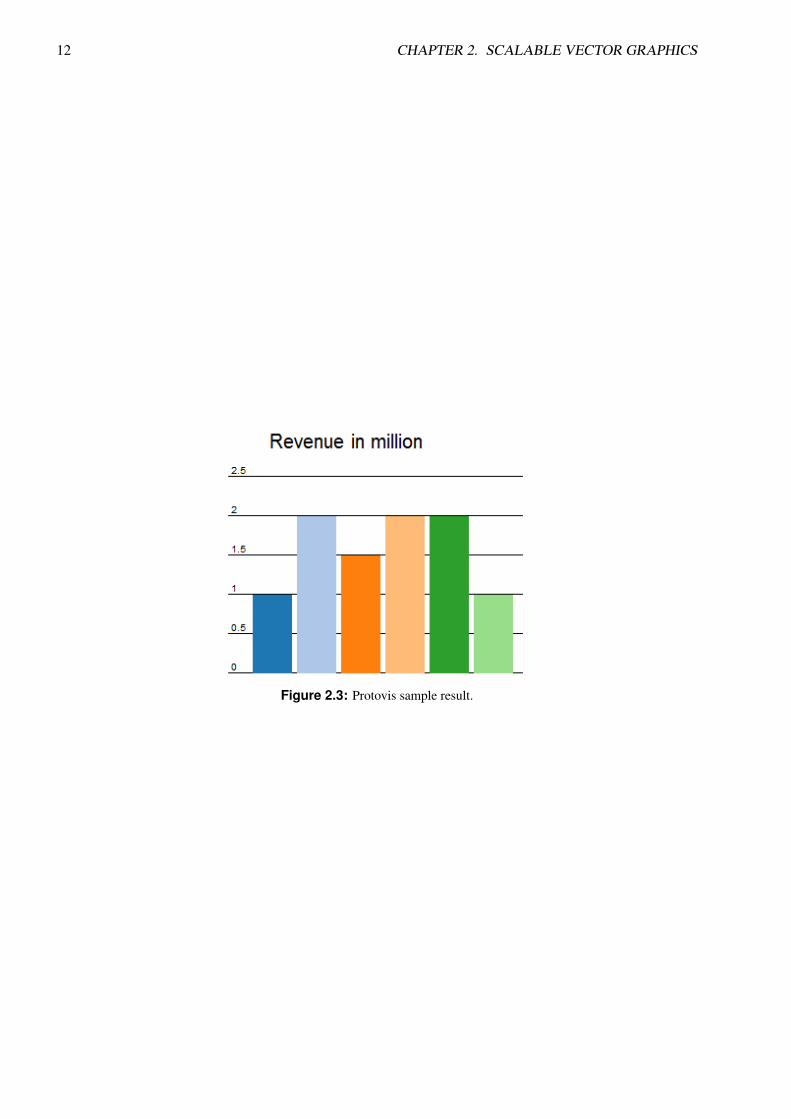
The result of this sample is shown in Figure 2.3Protovis supports a rich set of styling functions and thus can be adapted to many look and feels. Com-
pared to Google Chart Tools it has the advantage to be downloadable. Google’s Terms of Service prohibitsdownloading the Google Chart Tools thus to use it the client needs to be connected to the internet Google[2011].
12 CHAPTER 2. SCALABLE VECTOR GRAPHICS
Figure 2.3: Protovis sample result.
Chapter 3
HTML5
3.1 An Introduction to the Standard
By now the HTML5 standard is not more than a draft but in 2012 there is a first candidate recommendation witha complete specification. Although the draft will be released in over a year, browser vendors already add thenew HTML5 functionality to their browsers. There are two major organisations working on the standard. First,the Web Hypertext Application Technology Working Group (WHATWG) which is a group of all major browservendors and the World Wide Web Consortium (W3C) as international standardisation group for the World WideWeb.
HTML5 should not be a revolution but an evolution and so it is not necessary to reinvent the wheel butmake a better wheel instead. For instance, HTML4 lacks of security in several points and HTML5 tries to bringsecurity already from the starting point. Nevertheless, programmers are responsible to prevent from cross sitescripting (XSS) attacks and other code injections.
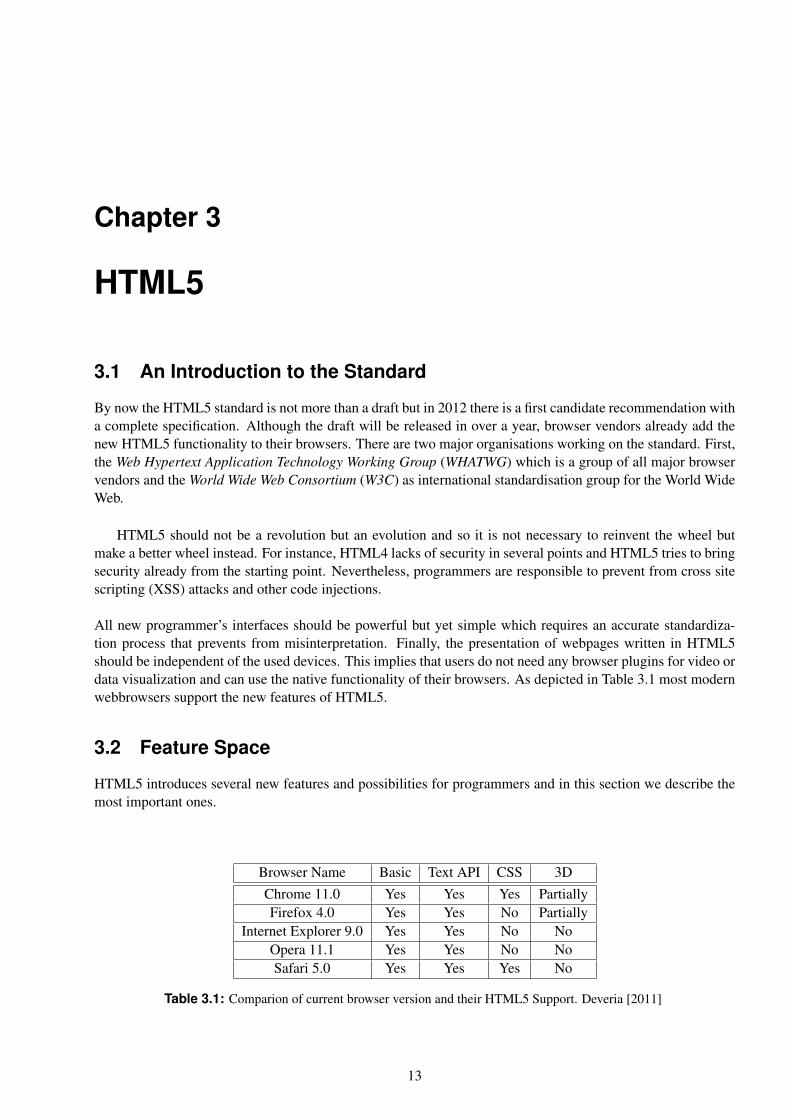
All new programmer’s interfaces should be powerful but yet simple which requires an accurate standardiza-tion process that prevents from misinterpretation. Finally, the presentation of webpages written in HTML5should be independent of the used devices. This implies that users do not need any browser plugins for video ordata visualization and can use the native functionality of their browsers. As depicted in Table 3.1 most modernwebbrowsers support the new features of HTML5.
3.2 Feature Space
HTML5 introduces several new features and possibilities for programmers and in this section we describe themost important ones.
Browser Name Basic Text API CSS 3DChrome 11.0 Yes Yes Yes PartiallyFirefox 4.0 Yes Yes No Partially
Internet Explorer 9.0 Yes Yes No NoOpera 11.1 Yes Yes No NoSafari 5.0 Yes Yes Yes No
Table 3.1: Comparion of current browser version and their HTML5 Support. Deveria [2011]
13
14 CHAPTER 3. HTML5
Video tag. The new video tag supports a native display of non-proprietary video-formats in a webpage. Anearlier version of the standard draft states Ogg-Theora as video format but due to problems with licensing theactual format of the video tag is not specified any more, Pfeiffer and Parker [2009]. Possible other formats areH.264, MPEG4 and WebM.
Geo location. To support location-based web applications the HTML5 standard introduces a geo-locationAPI that allows programmers to determine the actual geo-spatical location of a client. This can be used to pro-vide additional services to customers based on their geo-spatial location, Vaughan-Nichols [2010]. In contrastto mobile devices with a GPS sensor on-board for home computers only the IP address of the machine can beused to determine a user’s region. To refine this location the web browser can send a list with all available WIFInetworks to a special service. If the geo-location of one of these WIFI Networks can be identified, the accurateposition of the user’s computer can be determined, Netzwelt.de [2011].
Offline applications. By now most web applications require a permanent connection to the Internetwhereas HTML5 allows programmers to write applications for offline use. The user is required to have aninternet connection only during the start of the application but can use the service even if there is no inter-net connection available any more. Meanwhile, data is either stored in a client-sided SQL database or simplecaching mechanisms are used. As soon as the user is online again all data is synchronized with the web server.Examples for this new features are mail-clients or web-based office applications. Vaughan-Nichols [2010]
Canvas tag. One of the most important features of HTML5 is a new element that allows programmers topresent graphics, images, and text-elements to their users. All rendering and computation is done on the clientand therefore does not consume computational power on the server side, Vaughan-Nichols [2010].
3.3 Canvas HTML5 API
3.3.1 The Canvas element
There are several popular visualization frameworks like Microsoft’s Silverlight or Adobe’s Flash. Although,these solutions are powerful have an important disadvantage as they require browser plugins which are probablynot available on some platforms like mobile devices. In most cases these plugins are proprietary solutions andthe performance of the visualization highly depends on the vendor’s implementation on a certain platform. Thecanvas tag in the HTML5 standard aims at providing all visualization features of existing solutions in a nativeway without any browser extensions or plugins. As mentioned in Section 3.1 the specification of HTML5 andin particular the Canvas tag is still a working draft but most of modern web-browsers support basic features ofthe canvas element.Compared to SVG (see Chapter 2) Canvas is a bitmap image because elements are not part of the DocumentObject Model (DOM) tree. The objects within a Canvas element are final and so resizing is not seamless butrequires a recomputation of the entire element. On the one hand this implies that simple objects like lines orrectangles are not selectable but on the other hand processing is in general faster. Lubbers et al. [2010]
The access to the new HTML5 programming interfaces should be as simple as possible and so programmerscan easily create and modify an element by using HTML and JavaScript. The Canvas element is part of theDOM tree of an HTML document and is identified by a unique ID.
1 <!DOCTYPE html>2 <html lang=”en”>3 <head>4 < t i t l e >Canvas Demo</ t i t l e >5 </head>6
3.3. CANVAS HTML5 API 15
7 <body>8 <canvas id=”sampleCanvas” style=”border : 3px solid”> </ canvas>9 </body>
In order to modify the element with id sampleCanvas and draw simple objects, i.e. rectangles, onto itprogrammers have to use JavaScript. In the following code snippet the 2D context is extracted from the Canvaselement by using the functions getElementByID(...) and getContext(’2d’). Now, the methods of the contextclass can be used to actually draw primitive shapes like lines or circles, other images, or even text.In the code snippet we use the method rect(...) to create a rectangle and finally stroke(...)) to draw it onto thecanvas.
1 <script type=” t e x t / j a v a s c r i p t ”>2 var canvas = document .getElementById ( ” sampleCanvas ” ) ;3 var context = canvas .getContext ( ’ 2d ’ ) ;45 context .rect ( 2 5 0 , 50 , 100 , 100) ; / / Draw a r e c t a n g l e6 context .stroke ( ) ;7 </script>
HTML5 does not allow to register handlers with particular objects but only with the Canvas element. Theseobject listeners can be registered with the addEventListener(...) method where mousemove is theevent name and mouseMoveEvent is the name of the JavaScript function triggered upon the event. An examplethat traces the mouse movement and draws the trace of the mouse pointer is presented below.
1 <script type=” t e x t / j a v a s c r i p t ”>2 var canvas = document .getElementById ( ” sampleCanvas ” ) ;3 canvas .addEventListener ( ” mousemove ” , mouseMoveEvent , f a l s e ) ;45 f u n c t i o n mouseMoveEvent (e ) {6 context .lineTo (e .pageX , e .pageY ) ;7 context .stroke ( ) ;8 }9 </script>
The full reference with all methods of the canvas element can be found in http://www.whatwg.org/specs/web-apps/current-work/multipage/the-canvas-element.html but here is an overview of the mostimportant commands.
• Stroke and fill styles. The stroke style of primitive elements can be modified by using Cascading StyleSheets, CSS. This includes the line width, the color, and the shape of a line joining. Further, one cancolor closed shapes with either solid color or even with a color gradient.
• Complex Shapes. Besides primitive shapes one can create groups of objects, referred to as paths. Withinthe context of paths, quadratic- and cubic bezier curves, arcs, and lines can be created.
• Images and background. Simple images can be added to the canvas element with the method can-vas.drawImage(...).
• Canvas transformations. Objects of a path can be rotated, sheered, and scaled with linear matrix manip-ulations.
• Text. Text objects can be added to the canvas element with the method filltext(...) and parameters for theactual text and the coordinates of the text within the canvas element. There are limited ways of formattingthe text by using the methods font(...), fillStyle(...), and textAlign(...).
16 CHAPTER 3. HTML5
• Shadow. The Canvas API provides functions to add shadow to the objects by using shadowColor(...)that specifies the color, shadowOffsetX(...) and shadowOffsetY(...) for the orientation of the shadow, andfinally shadowBlur(..) to blur the shadow.
3.4 Existing Frameworks
The HTML5 canvas element was designed as a simple but powerful API that allows creating simple and com-plex objects, images, and even text without external libraries or browser extensions. Programmers do not needto reinvent the wheel to visualize the data but can use existing frameworks that abstract functions to creatediagrams and well known data representations. In this section the most popular ones will be described andcompared upon their functionality.
3.4.1 JavaScript InfoVis Toolkit
This JavaScript framework focuses on information visualization and is written by Nicolas Garcia Belmontefrom SenchaLabs. It provides an easy-to-use interface for the most common visualization graphs like area-,pie-, bar-, sunburst-charts, tree maps, hyper trees, and space trees. Programmers can easily create charts byinstantiating the required diagram and load JSON data to be represented. SenchaLabs [2011]
1 var areaChart = new $jit .AreaChart ({injectInto : ’ i d o f a n a r b i t r a r y d i v ’ } ) ;2 areaChart .loadJSON (jsonData ) ;
This basic diagram can be modified and customized with additional parameters. The customization optionsinclude color, line style, labels, and tips and simple user interaction.
3.4.2 jQuery Sparklines
Is is a free-of-charge plugin for the JavaScript Framework jQuery to create simple visualization diagrams. Itcomprises line diagrams, bar charts, box plots, pie charts, and bullet charts. The framework is easy-to-use anddiagrams can be created with only a few lines of code. Inc. [2011]
1 var data = [ 1 0 , 8 , 5 , 7 , 4 , 4 , 1 ] ;2 $ ( ’ i d o f a n a r b i t r a r y d i v ’ ) .sparkline (data , {type : ’ b a r ’ } ) ;
A programmer can specify the layout of the chart, change fill colors and line colors, and automaticallyupdate the chart. The created diagrams are not interactive but can only be shown to the users statically.
3.4.3 Flot
A visualization library released under the MIT license based on the jQuery JavaScript library. It only supportsline digrams, point diagrams and bar charts. Although the range of diagrams is very limited users can turn onand off data series, zoom into the diagrams, interact with datapoints, and track the curves with crosshair. Dueto the simplicity of the solution programmers can plot data with a few lines of JavaScript code. Laursen [2011]
1 var data = [ [ 0 , 3 ] , [ 4 , 8 ] , [ 8 , 5 ] , [ 9 , 1 3 ] ] ;2 $ .plot ($ ( ” # i d o f a n a r b i t r a r y d i v ” ) , data ) ;
Flot is mainly developed by Ole Laursen but supported by the community.
3.4. EXISTING FRAMEWORKS 17
Figure 3.1: A line diagram created by RGraph.
3.4.4 jqPlot
This visualization tool is implemented as a plugin for the jQuery library and supports different types of diagramslike line charts, bar charts, pie- and donut charts, and bubble plots. The programming interface is easy-to-useand diagrams can be created with a few lines of code. Leonello [2011]
1 var data = [ [ 3 , 7 , 9 , 1 , 4 , 6 , 8 , 2 , 5 ] ] ;2 var plot1 = $ .jqplot ( ’ i d o f a n a r b i t r a r y d i v ’ , data ) ;
jqPlot is an open source project by Chris Leonello and enhances pure display of data with trendlines,dragging and dropping of datapoints and log-scales.
3.4.5 RGraph
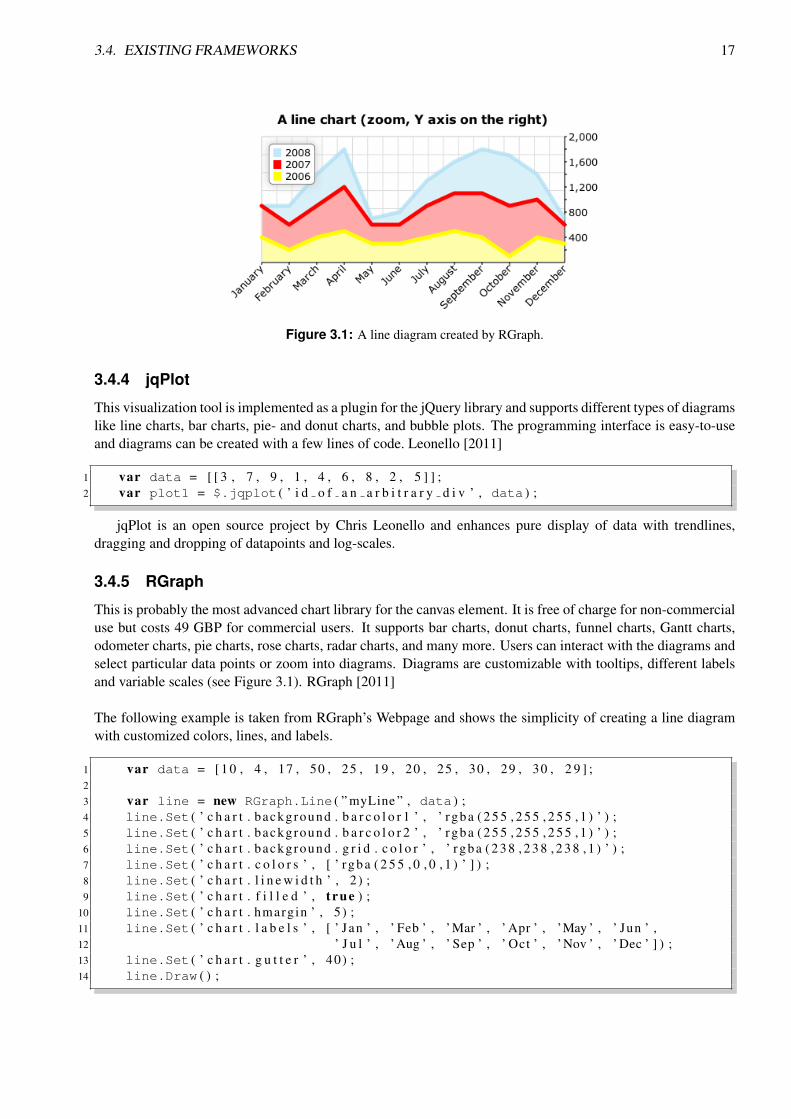
This is probably the most advanced chart library for the canvas element. It is free of charge for non-commercialuse but costs 49 GBP for commercial users. It supports bar charts, donut charts, funnel charts, Gantt charts,odometer charts, pie charts, rose charts, radar charts, and many more. Users can interact with the diagrams andselect particular data points or zoom into diagrams. Diagrams are customizable with tooltips, different labelsand variable scales (see Figure 3.1). RGraph [2011]
The following example is taken from RGraph’s Webpage and shows the simplicity of creating a line diagramwith customized colors, lines, and labels.
1 var data = [ 1 0 , 4 , 17 , 50 , 25 , 19 , 20 , 25 , 30 , 29 , 30 , 2 9 ] ;23 var line = new RGraph .Line ( ” myLine ” , data ) ;4 line .Set ( ’ c h a r t . background . b a r c o l o r 1 ’ , ’ r gba ( 2 5 5 , 2 5 5 , 2 5 5 , 1 ) ’ ) ;5 line .Set ( ’ c h a r t . background . b a r c o l o r 2 ’ , ’ r gba ( 2 5 5 , 2 5 5 , 2 5 5 , 1 ) ’ ) ;6 line .Set ( ’ c h a r t . background . g r i d . c o l o r ’ , ’ r gba ( 2 3 8 , 2 3 8 , 2 3 8 , 1 ) ’ ) ;7 line .Set ( ’ c h a r t . c o l o r s ’ , [ ’ r gba ( 2 5 5 , 0 , 0 , 1 ) ’ ] ) ;8 line .Set ( ’ c h a r t . l i n e w i d t h ’ , 2 ) ;9 line .Set ( ’ c h a r t . f i l l e d ’ , t rue ) ;
10 line .Set ( ’ c h a r t . hmargin ’ , 5 ) ;11 line .Set ( ’ c h a r t . l a b e l s ’ , [ ’ Jan ’ , ’ Feb ’ , ’Mar ’ , ’ Apr ’ , ’May ’ , ’ Jun ’ ,12 ’ J u l ’ , ’Aug ’ , ’ Sep ’ , ’ Oct ’ , ’Nov ’ , ’ Dec ’ ] ) ;13 line .Set ( ’ c h a r t . g u t t e r ’ , 40) ;14 line .Draw ( ) ;

18 CHAPTER 3. HTML5
Chapter 4
Conclusion
It this chapter the performance of the two above discussed web-based visualization technologies will be com-pared.
4.1 Studies on Performance
In order to complete this task two different studies will be considered. One of them has been done at Missis-sippi State University and has enumerated the strengths and weaknesses of web-native information visualizationtechnologies such as SVG, HTML5, and pure HTML and compared their performance to the web-embeddedJava application, Johnson and Jankun-Kelly [2008]. Another study has been performed by a volunteer fromAustralia with the aim to benchmark performance of different technologies for animation. Although this studycannot be called scientific, it is still important for this comparison since smooth-moving, nice animated infor-mation visualization becomes more and more interesting and performance of web-native and web-embeddedtechnologies in aspect animation is an essential factor in the technology choice. Moreover, this is an indepen-dent study with available source code to download. The animation study has compared performance of SVG,HTML5, pure HTML and Java, Adams [2010]. It is also important to mention that the study of MississippiUniversity has been implemented on Mac OS X 10.5.2 and Windows Vista using Firefox 2.0.0.12 and Safari3.0.4, whereas the volunteer study has been carried out on Mac OS X and Windows XP using browsers Safari4.0.3, Firefox 3.6, Chrome 4.0.249.89 and Internet Explorer 8.
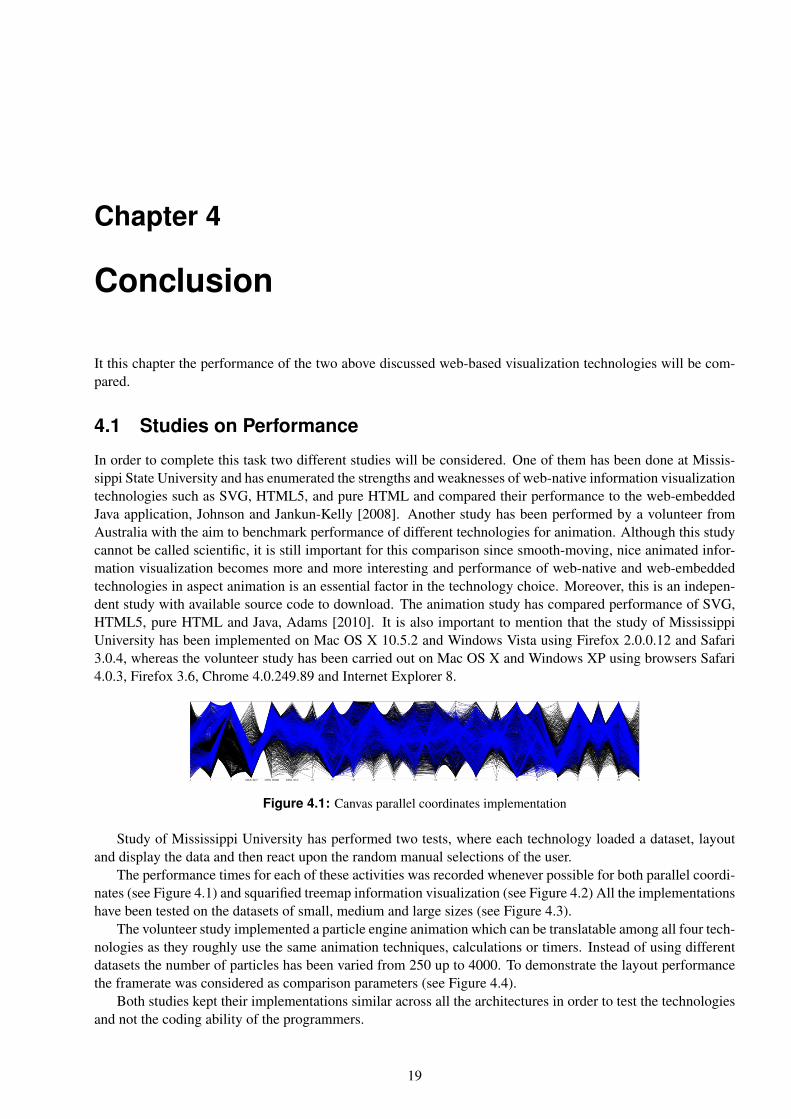
Figure 4.1: Canvas parallel coordinates implementation
Study of Mississippi University has performed two tests, where each technology loaded a dataset, layoutand display the data and then react upon the random manual selections of the user.
The performance times for each of these activities was recorded whenever possible for both parallel coordi-nates (see Figure 4.1) and squarified treemap information visualization (see Figure 4.2) All the implementationshave been tested on the datasets of small, medium and large sizes (see Figure 4.3).
The volunteer study implemented a particle engine animation which can be translatable among all four tech-nologies as they roughly use the same animation techniques, calculations or timers. Instead of using differentdatasets the number of particles has been varied from 250 up to 4000. To demonstrate the layout performancethe framerate was considered as comparison parameters (see Figure 4.4).
Both studies kept their implementations similar across all the architectures in order to test the technologiesand not the coding ability of the programmers.
19
20 CHAPTER 4. CONCLUSION
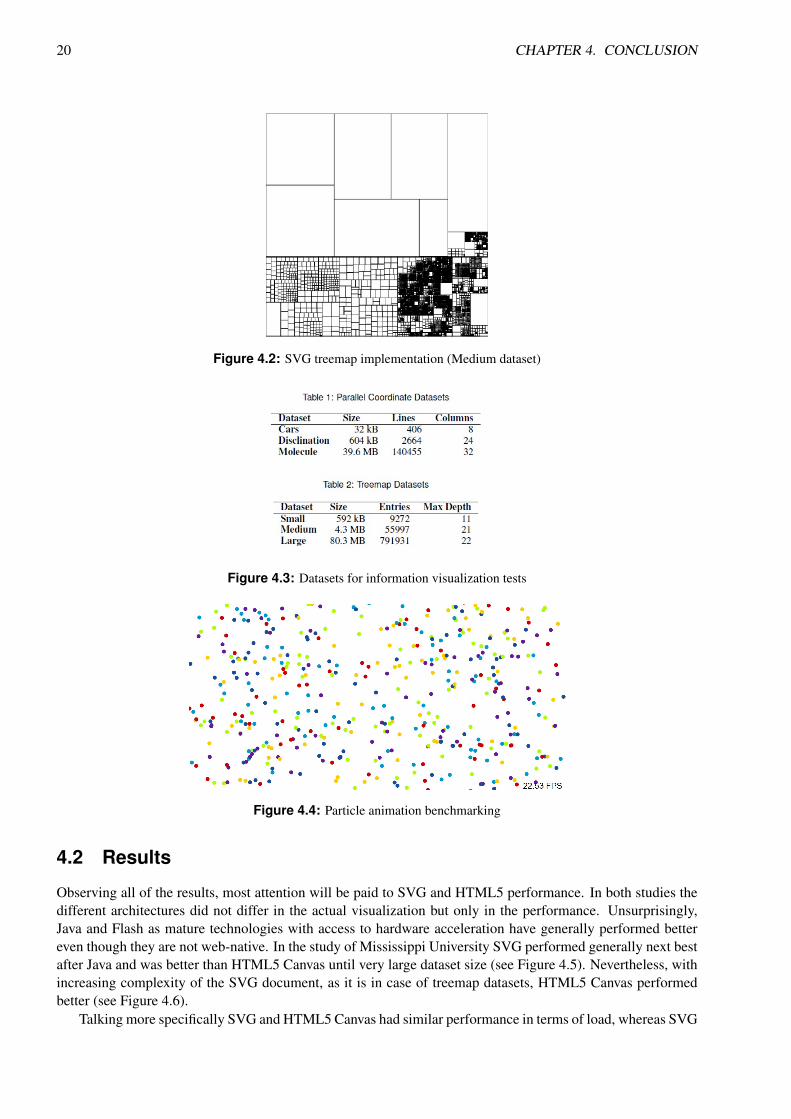
Figure 4.2: SVG treemap implementation (Medium dataset)
Figure 4.3: Datasets for information visualization tests
Figure 4.4: Particle animation benchmarking
4.2 Results
Observing all of the results, most attention will be paid to SVG and HTML5 performance. In both studies thedifferent architectures did not differ in the actual visualization but only in the performance. Unsurprisingly,Java and Flash as mature technologies with access to hardware acceleration have generally performed bettereven though they are not web-native. In the study of Mississippi University SVG performed generally next bestafter Java and was better than HTML5 Canvas until very large dataset size (see Figure 4.5). Nevertheless, withincreasing complexity of the SVG document, as it is in case of treemap datasets, HTML5 Canvas performedbetter (see Figure 4.6).
Talking more specifically SVG and HTML5 Canvas had similar performance in terms of load, whereas SVG
4.2. RESULTS 21
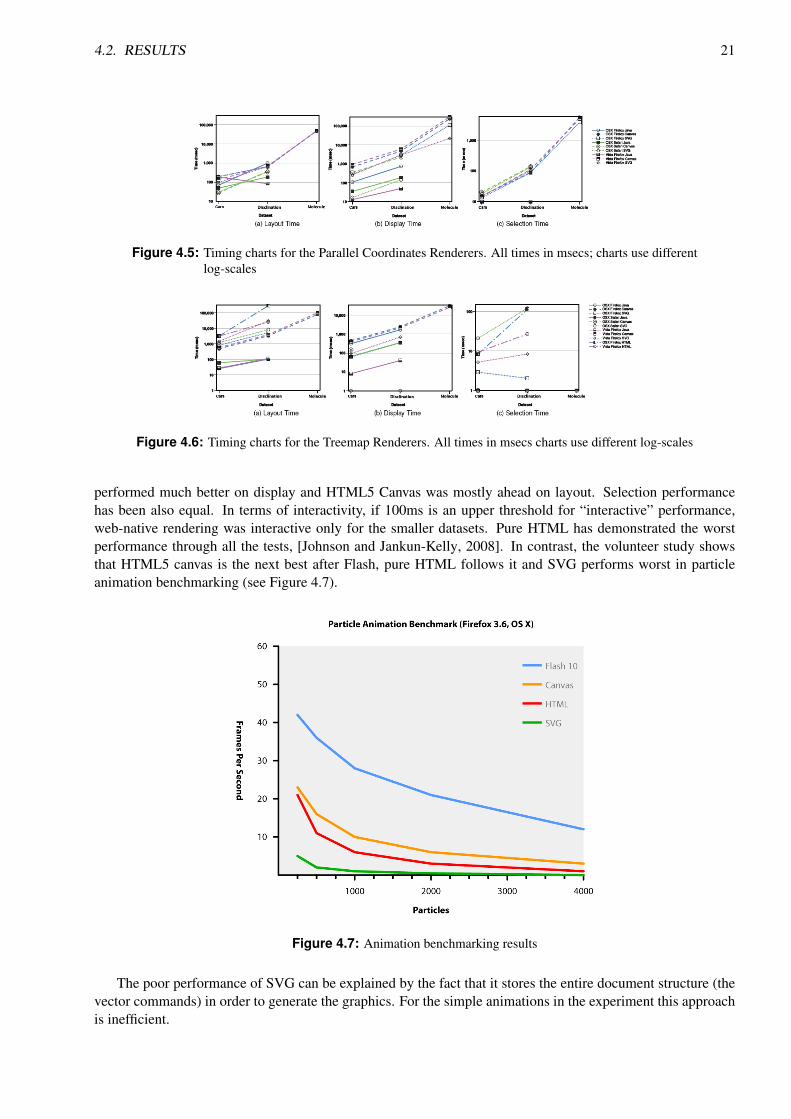
Figure 4.5: Timing charts for the Parallel Coordinates Renderers. All times in msecs; charts use differentlog-scales
Figure 4.6: Timing charts for the Treemap Renderers. All times in msecs charts use different log-scales
performed much better on display and HTML5 Canvas was mostly ahead on layout. Selection performancehas been also equal. In terms of interactivity, if 100ms is an upper threshold for “interactive” performance,web-native rendering was interactive only for the smaller datasets. Pure HTML has demonstrated the worstperformance through all the tests, [Johnson and Jankun-Kelly, 2008]. In contrast, the volunteer study showsthat HTML5 canvas is the next best after Flash, pure HTML follows it and SVG performs worst in particleanimation benchmarking (see Figure 4.7).
Figure 4.7: Animation benchmarking results
The poor performance of SVG can be explained by the fact that it stores the entire document structure (thevector commands) in order to generate the graphics. For the simple animations in the experiment this approachis inefficient.

22 CHAPTER 4. CONCLUSION
4.3 Conclusions
Web-native display technology has the potential to expand the impact of visualization to the areas where pro-gram applets in Java and Flash are not available. Nevertheless, the limitations of these technologies must befully understood. While web-embedded technologies have the best performance, SVG has an adequate interac-tivity for medium or smaller datasets. However, neither SVG nor Canvas are perfect if large data visualizationare combined with interactive performance.
References
Adams, Cameron [2010]. HTML5 versus Flash: Animation Benchmarking. http://www.themaninblue.com/writing/perspective/2010/03/22/.
Bruce Lawson, Remy Sharp [2011]. Introducing HTML5.
Deveria, Alexis [2011]. When Can I Use. http://caniuse.com.
Flanagan, David [2006]. JavaScript, The Definitive Guide. First Edition. O’Reilly, 1–9 pages.
Florio, Chris [2008]. ActionScript 3.0 for Adobe Flash CS4 Professional Classroom in a Book. First Edition.Adobe Press, 9–10 pages.
Google [2011]. Google Chart Tools - Frequently Asked Questions. http://code.google.com/apis/
chart/interactive/faq.html#localdownload.
Group, Stanford Visualization [2011]. Protovis - a graphical approach to visualization. http://vis.
stanford.edu/protovis/.
Inc., Splunk [2011]. jQuery Sparklines. http://omnipotent.net/jquery.sparkline/.
Johnson, Donald W. and T.J. Jankun-Kelly [2008]. A Scalability Study of Web-Native Information Visualization.http://portal.acm.org/citation.cfm?id=1375743.
Laursen, Ole [2011]. Attractive Javascript plotting for jQuery. http://code.google.com/p/flot/.
Leonello, Chris [2011]. Pure JavaScript Plotting. http://www.jqplot.com/index.php.
Lubbers, Peter [2010]. Pro HTML5, Powerful APIs for Richer Internet Application Development. First Edition.Apress, 1–2,25–26 pages.
Lubbers, Peter, Brian Albers, Ric Smith, and Frank Salim [2010]. Pro HTML5 Programming: PowerfulAPIs for Richer Internet Application Development. 1st Edition. Apress, Berkely, CA, USA. 1430227907,9781430227908.
Netzwelt.de [2011]. Location Based Services: Wenn der eigene Standort mit dem Netz verknA¼pft wird.http://www.netzwelt.de/news/84819_2-location-based-services-eigene-standort-
netz-verknuepft.html.
Pearlman, Ellen [2003]. SVG for Web Developers. First Edition. Prentice Hall, 1–9 pages.
Pfeiffer, Silvia and Conrad Parker [2009]. Accessibility for the HTML5 video element. In Proceedings ofthe 2009 International Cross-Disciplinary Conference on Web Accessibililty (W4A), pages 98–100. W4A’09, ACM, New York, NY, USA. 978-1-60558-561-1. doi:http://doi.acm.org/10.1145/1535654.1535679.http://doi.acm.org/10.1145/1535654.1535679.
Raggett, Dave [1998]. Raggett on HTML4. Second Edition. Addison-Wesley, 17–19 pages.
23
24 REFERENCES
RGraph [2011]. RGraph: HTML5 canvas graph library. http://www.rgraph.net/.
SenchaLabs [2011]. JavaScript InfoVis Toolkit. http://thejit.org/.
Vaughan-Nichols, S.J. [2010]. Will HTML 5 Restandardize the Web? Computer, 43(4), pages 13 –15. ISSN0018-9162. doi:10.1109/MC.2010.119.
W3C [2011a]. Extensible Markup Language (XML). http://www.w3.org/XML/.
W3C [2011b]. HTML5 - A vocabulary and associated APIs for HTML and XHTML. http://dev.w3.org/html5/spec/Overview.html.
W3C [2011c]. SCALABLE VECTOR GRAPHICS (SVG). http://www.w3.org/Graphics/SVG/.
W3C [2011d]. SVG 1.1 (Second Edition). http://www.w3.org/TR/SVG/concepts.html.
W3C [2011e]. SVG In HTML Pages. http://www.w3schools.com/svg/svg_inhtml.asp.
Watt, Andrew H. [2011]. Designing SVG Web Graphics.
Wikipedia [2011a]. Precision Graphics Markup Language. http://en.wikipedia.org/wiki/
Precision_Graphics_Markup_Language.
Wikipedia [2011b]. Scalable Vector Graphics. http://en.wikipedia.org/wiki/Scalable_Vector_
Graphics.
Wikipedia [2011c]. Vector Markup Language. http://en.wikipedia.org/wiki/Vector_Markup_
Language.
Zakas, Nicholas C. [2010]. High Performance JavaScript. First Edition. O’Reilly, 137–140 pages.