28 juni, 2019 - miraeasset.co.id filept adaro energy tbk (adro, anggota indeks kompas100) tengah...
TRANSCRIPT
To subscribe to our Daily Focus, please contact us at [email protected]
Mirae Asset Sekuritas Indonesia
28 Juni, 2019
Market Index
Last Trade Chg (%) MoM YoY
JCI 6,352.7 0.7 4.6 11.3
MSCI Indonesia 26.0 1.3 7.1 14.7
MSCI EM 1,054.9 0.7 6.0 0.1
HANG SENG 28,621.4 1.4 3.0 -1.0
KOSPI 2,134.3 0.0 4.2 -7.8
FTSE 7,402.3 0 2.0 -2.6
DJIA 26,526.6 0.0 4.7 9.6
NASDAQ 7,967.8 0.7 4.0 5.4
2018F P/E (x) P/B (x) ROE (%)
JCI 15.7 2.3 17.4
Key Rates
Last Trade Chg (bps) MoM YoY
BI 7-Day RR 6.00 0 25 -100
3yr 6.89 -7 -47 -85
10yr 7.41 -3 -57 -49
FX
Last Trade Chg (%) MoM YoY
USD/IDR 14,140.0 -0.3 -1.4 0.0
USD/KRW 1,158.1 0.1 -2.4 3.0
USD/JPY 107.8 0.0 -1.5 -2.4
USD/CNY 6.9 0.0 -0.3 4.1
Commodities
Last Trade Chg (%) MoM YoY
WTI 59.4 0.1 0.5 13.4
Gold 1,409.8 0.1 10.2 12.9
Coal 71.0 0.1 -15.1 -37.9
Palm Oil 1,880.0 -1.9 -5.4 -18.4
Rubber 166.1 -0.2 12.7 36.1
Nickel 12,710.0 1.8 2.9 -14.6
Copper 5,989.0 0.0 0.5 -9.6
Tin 18,850.0 0.4 -2.7 -5.4
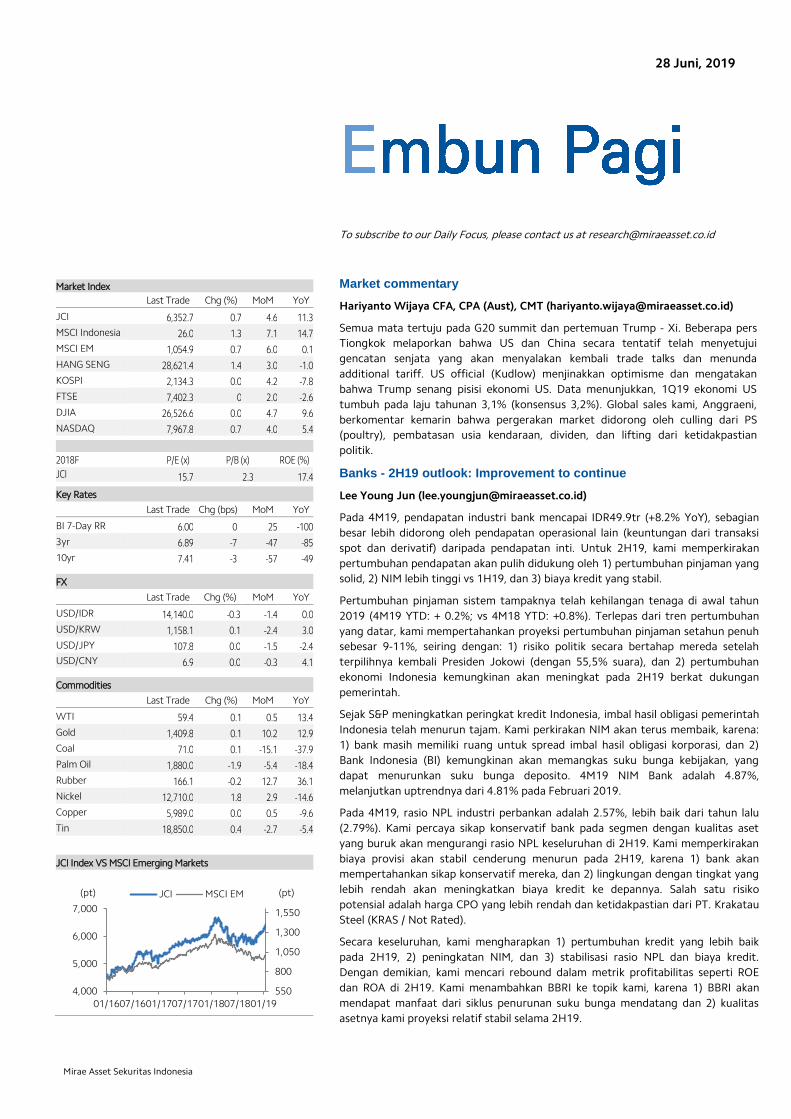
JCI Index VS MSCI Emerging Markets
Market commentary
Hariyanto Wijaya CFA, CPA (Aust), CMT ([email protected])
Semua mata tertuju pada G20 summit dan pertemuan Trump - Xi. Beberapa pers
Tiongkok melaporkan bahwa US dan China secara tentatif telah menyetujui
gencatan senjata yang akan menyalakan kembali trade talks dan menunda
additional tariff. US official (Kudlow) menjinakkan optimisme dan mengatakan
bahwa Trump senang pisisi ekonomi US. Data menunjukkan, 1Q19 ekonomi US
tumbuh pada laju tahunan 3,1% (konsensus 3,2%). Global sales kami, Anggraeni,
berkomentar kemarin bahwa pergerakan market didorong oleh culling dari PS
(poultry), pembatasan usia kendaraan, dividen, dan lifting dari ketidakpastian
politik.
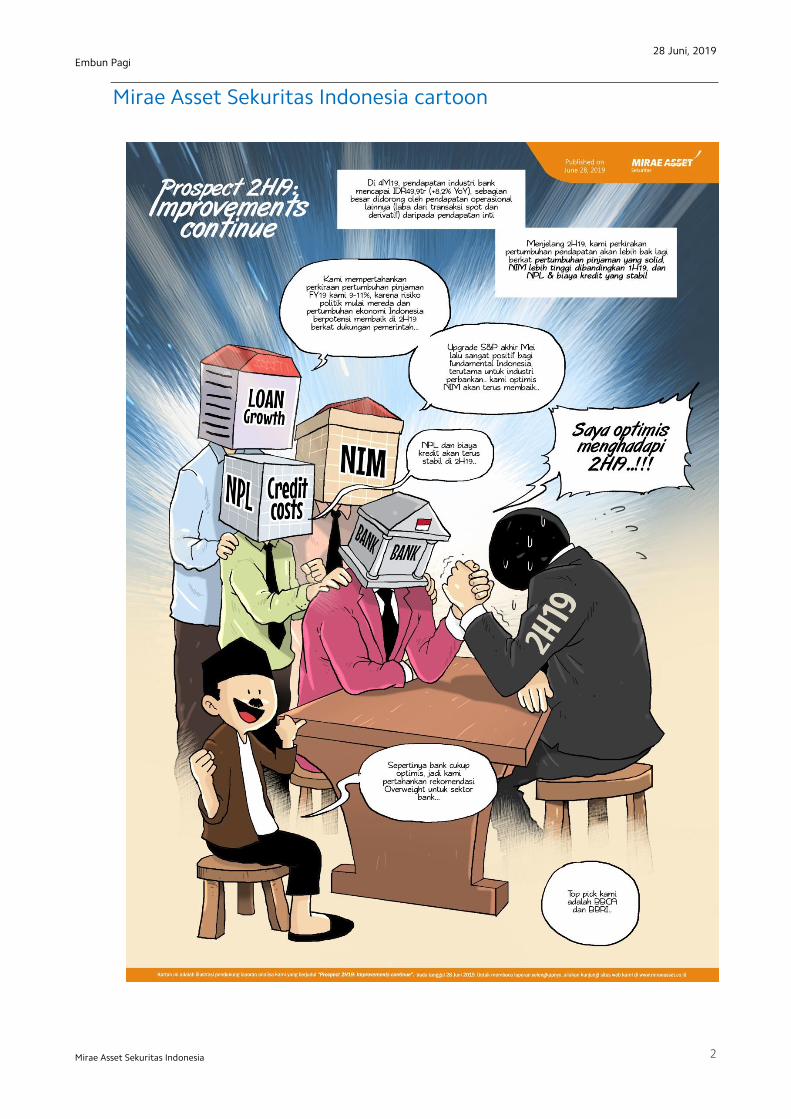
Banks - 2H19 outlook: Improvement to continue
Lee Young Jun ([email protected])
Pada 4M19, pendapatan industri bank mencapai IDR49.9tr (+8.2% YoY), sebagian
besar lebih didorong oleh pendapatan operasional lain (keuntungan dari transaksi
spot dan derivatif) daripada pendapatan inti. Untuk 2H19, kami memperkirakan
pertumbuhan pendapatan akan pulih didukung oleh 1) pertumbuhan pinjaman yang
solid, 2) NIM lebih tinggi vs 1H19, dan 3) biaya kredit yang stabil.
Pertumbuhan pinjaman sistem tampaknya telah kehilangan tenaga di awal tahun
2019 (4M19 YTD: + 0.2%; vs 4M18 YTD: +0.8%). Terlepas dari tren pertumbuhan
yang datar, kami mempertahankan proyeksi pertumbuhan pinjaman setahun penuh
sebesar 9-11%, seiring dengan: 1) risiko politik secara bertahap mereda setelah
terpilihnya kembali Presiden Jokowi (dengan 55,5% suara), dan 2) pertumbuhan
ekonomi Indonesia kemungkinan akan meningkat pada 2H19 berkat dukungan
pemerintah.
Sejak S&P meningkatkan peringkat kredit Indonesia, imbal hasil obligasi pemerintah
Indonesia telah menurun tajam. Kami perkirakan NIM akan terus membaik, karena:
1) bank masih memiliki ruang untuk spread imbal hasil obligasi korporasi, dan 2)
Bank Indonesia (BI) kemungkinan akan memangkas suku bunga kebijakan, yang
dapat menurunkan suku bunga deposito. 4M19 NIM Bank adalah 4.87%,
melanjutkan uptrendnya dari 4.81% pada Februari 2019.
Pada 4M19, rasio NPL industri perbankan adalah 2.57%, lebih baik dari tahun lalu
(2.79%). Kami percaya sikap konservatif bank pada segmen dengan kualitas aset
yang buruk akan mengurangi rasio NPL keseluruhan di 2H19. Kami memperkirakan
biaya provisi akan stabil cenderung menurun pada 2H19, karena 1) bank akan
mempertahankan sikap konservatif mereka, dan 2) lingkungan dengan tingkat yang
lebih rendah akan meningkatkan biaya kredit ke depannya. Salah satu risiko
potensial adalah harga CPO yang lebih rendah dan ketidakpastian dari PT. Krakatau
Steel (KRAS / Not Rated).
Secara keseluruhan, kami mengharapkan 1) pertumbuhan kredit yang lebih baik
pada 2H19, 2) peningkatan NIM, dan 3) stabilisasi rasio NPL dan biaya kredit.
Dengan demikian, kami mencari rebound dalam metrik profitabilitas seperti ROE
dan ROA di 2H19. Kami menambahkan BBRI ke topik kami, karena 1) BBRI akan
mendapat manfaat dari siklus penurunan suku bunga mendatang dan 2) kualitas
asetnya kami proyeksi relatif stabil selama 2H19.
550
800
1,050
1,300
1,550
4,000
5,000
6,000
7,000
01/1607/1601/1707/1701/1807/1801/19
JCI MSCI EM (pt) (pt)
28 Juni, 2019
2
Embun Pagi
Mirae Asset Sekuritas Indonesia
Mirae Asset Sekuritas Indonesia cartoon
28 Juni, 2019
3
Embun Pagi
Mirae Asset Sekuritas Indonesia
Local flashes
ADRO: Genjot diversifikasi, Adaro Energy (ADRO) pacu lini bisnis listrik dan air. PT Adaro
Energy Tbk (ADRO, anggota indeks Kompas100) tengah memacu lini bisnis non-batubara.
Salah satu pilar bisnis yang akan dikembangkan ADRO ini adalah bisnis kelistrikan dan air
melalui PT Adaro Power dan PT Adaro Tirta Mandiri. Wakil Presiden Direktur Adaro Power
dan Adaro Tirta Mandiri Dharma Djojonegoro mengatakan, selain menyelesaikan proyek
pembangkit listrik tenaga uap (PLTU), dalam dua tahun terakhir ini pihaknya secara intensif
melakukan studi untuk pengembangan listrik dari energi terbarukan. Untuk tahap awal, kata
Dharma, pihaknya fokus melakukan uji coba pada proyek pembangkit listrik tenaga surya
(PLTS).(Kontan)
BATA: Strategi Sepatu Bata (BATA) siap lawan kompetisi merk global. PT Sepatu Bata Tbk
(BATA) menganggarkan belanja modal sebesar Rp 60 miliar di tahun 2019. Rencananya dana
tersebut akan digunakan untuk ekspansi ritel dan juga pemeliharaan mesin. Untuk
menghadapi tantantangan dunia retail, Bata juga mengadaptasi strategi global baru
diluncurkan di seluruh dunia yakni New Arrival Every Friday. Bata menjanjikan ketersediaan
kolesi baru setiap minggunya yang sesuai dengan kebutuhan konsumen. Mulai dari sandal,
sepatu casual, sepatu kerja hingga sepatu anak.(Kontan)
FREN:FREN prediksi masih rugi tahun ini. PT Smartfren Telecom Tbk (FREN) menargetkan
realistis kinerja bisnisnya tahun ini. Pasalnya kendati kinerja sejak tahun lalu mengalami
perbaikan, namun manajemen belum bisa mencatatkan hasil positif. Merza Fachys, Presiden
Direktur FREN menjelaskan tahun lalu manajemen mencatat pertumbuhan pelanggan 6%.
Sedangkan untuk ARPU tumbuh 28%, pendapatan naik 18% dan EBITDA bertumbuh 47%.
Namun dari sisi bottom line manajemen. Tahun ini masih akan rugi, karena kami harapkan
break even kalau pelanggan kami sudah dua kali lipat dari jumlah pelanggan kemarin,"
ujarnya di Jakarta, Kamis (27/6). (Kontan)
RUIS: Radiant Utama (RUIS) sudah pegang kontrak Rp 4,5 triliun pada kuartal I-2019. PT
Radiant Utama Interinsco Tbk (RUIS) optimis mampu melanjutkan kinerja yang cerah pada
semester dua tahun ini. Direktur Utama RUIS, Sofwan Farisyi menyampaikan sampai
kuartal pertama tahun ini total kontrak mereka sebesar Rp 4,5 triliun, yang mana 56%
kontrak untuk operation support, 36% dari agency and offshore support, dan 7% dari
inpection. (Kontan)
POLY: Asia Pacific Fibers (POLY) mengambil celah peluang dari perang dagang AS-China.
PT Asia Pacific Fibers Tbk (POLY) mengaku mengambil peluang dari perang dagang Amerika
Serikat (AS) dengan China saat ini. Terutama untuk penetrasi pasar ke negeri Paman Sam
tersebut."Kami fokus pada AS karena sedikit banyaknya sisi baik dari perang dagang ialah
Amerika menjadi pasar yang sedikit terbuka sekarang. Kita mau mencoba masuk ke situ,"
ujar Head of Corporate Communication and Public Relation POLY Prama Yudha Amdan,
Kamis (27/6).(Kontan)
CSAP:Catur Sentosa Adiprana (CSAP) targetkan penjualan naik 13%. Perusahaan distribusi
dan ritel modern bahan bangunan, PT Catur Sentosa Adiprana Tbk, menargetkan
penjualanya naik 13% menjadi Rp 12,3 triliun."Segmen distribusi ditargetkan tumbuh 10%
dan segmen modern ritel tumbuh 20%," kata Sekertaris Perusahaan PT Catur Sentosa
Adiprana Tbk Idrus Widjajakusuma dalam pemaparan publik di Hotel Menara Peninsula,
Kamis (27/6).(Kontan)
28 Juni, 2019
4
Embun Pagi
Mirae Asset Sekuritas Indonesia
Technical analysis
Tasrul +62-21-515-1140 [email protected]
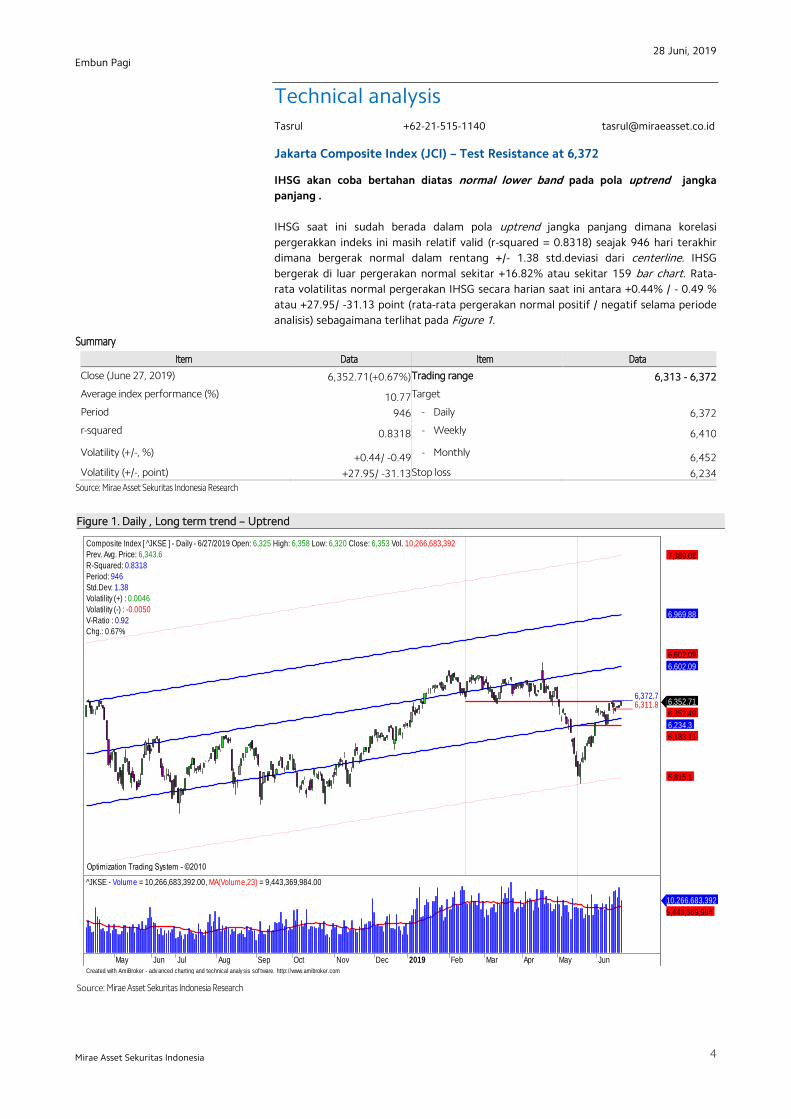
Jakarta Composite Index (JCI) – Test Resistance at 6,372
IHSG akan coba bertahan diatas normal lower band pada pola uptrend jangka
panjang .
IHSG saat ini sudah berada dalam pola uptrend jangka panjang dimana korelasi
pergerakkan indeks ini masih relatif valid (r-squared = 0.8318) seajak 946 hari terakhir
dimana bergerak normal dalam rentang +/- 1.38 std.deviasi dari centerline. IHSG
bergerak di luar pergerakan normal sekitar +16.82% atau sekitar 159 bar chart. Rata-
rata volatilitas normal pergerakan IHSG secara harian saat ini antara +0.44% / - 0.49 %
atau +27.95/ -31.13 point (rata-rata pergerakan normal positif / negatif selama periode
analisis) sebagaimana terlihat pada Figure 1.
Summary
Item Data Item Data
Close (June 27, 2019) 6,352.71(+0.67%) Trading range 6,313 - 6,372
Average index performance (%) 10.77 Target
Period 946 - Daily 6,372
r-squared 0.8318 - Weekly 6,410
Volatility (+/-, %) +0.44/ -0.49 - Monthly 6,452
Volatility (+/-, point) +27.95/ -31.13 Stop loss 6,234
Source: Mirae Asset Sekuritas Indonesia Research
Figure 1. Daily , Long term trend – Uptrend
4 - 6,161 Source: Mirae Asset Sekuritas Indonesia Research
Created with AmiBroker - adv anced charting and technical analy sis sof tware. http://www.amibroker.com
_____ 6,372.7_____ 6,311.8
Optimization Trading System - ©2010 Optimization Trading System - ©2010 Optimization Trading System - ©2010 Optimization Trading System - ©2010
Composite Index [ ^JKSE ] - Daily - 6/27/2019 Open: 6,325 High: 6,358 Low: 6,320 Close: 6,353 Vol. 10,266,683,392
Prev. Avg. Price: 6,343.6
R-Squared: 0.8318
Period: 946
Std.Dev: 1.38
Volatility (+) : 0.0046
Volatility (-) : -0.0050
V-Ratio : 0.92
Chg.: 0.67%
6,352.71
6,352.49
6,234.3
6,183.11
5,815.1
6,602.09
6,602.09
6,969.88
7,389.08
May Jun Jul Aug Sep Oct Nov Dec 2019 Feb Mar Apr May Jun
^JKSE - Volume = 10,266,683,392.00, MA(Volume,23) = 9,443,369,984.00
10,266,683,392
9,443,369,984
28 Juni, 2019
5
Embun Pagi
Mirae Asset Sekuritas Indonesia
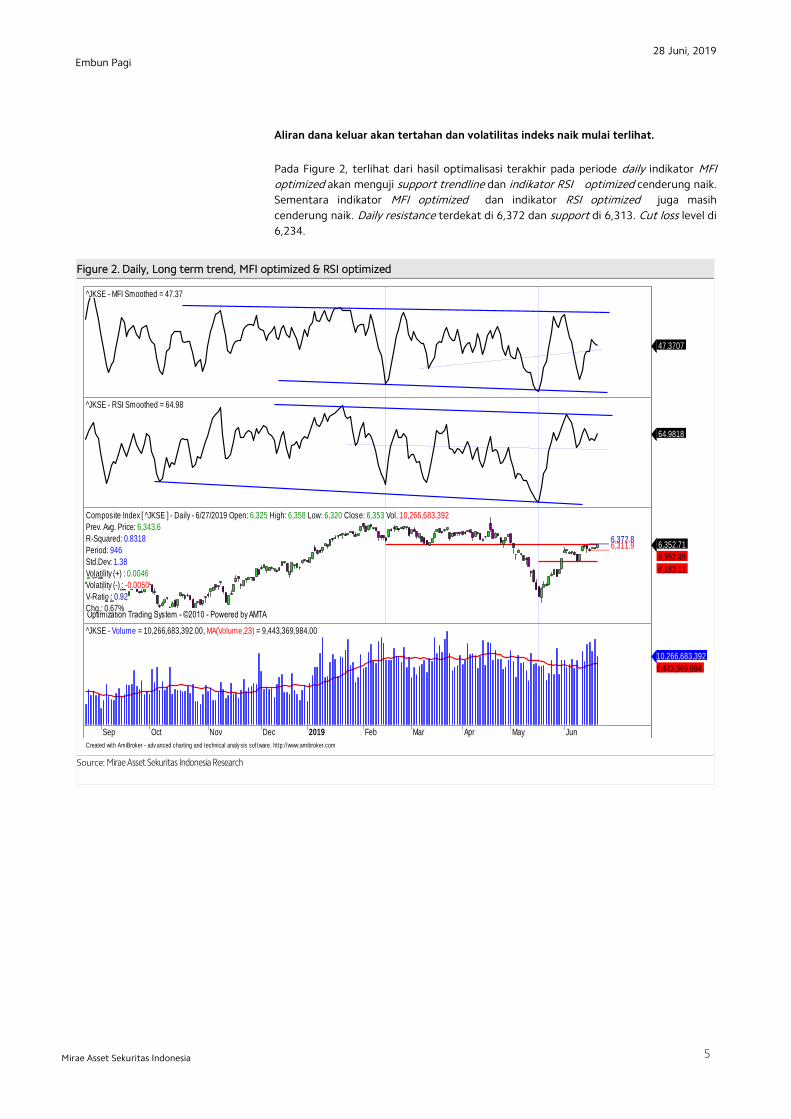
Aliran dana keluar akan tertahan dan volatilitas indeks naik mulai terlihat.
Pada Figure 2, terlihat dari hasil optimalisasi terakhir pada periode daily indikator MFI
optimized akan menguji support trendline dan indikator RSI optimized cenderung naik.
Sementara indikator MFI optimized dan indikator RSI optimized juga masih
cenderung naik. Daily resistance terdekat di 6,372 dan support di 6,313. Cut loss level di
6,234.
Figure 2. Daily, Long term trend, MFI optimized & RSI optimized
X` x`x`
Source: Mirae Asset Sekuritas Indonesia Research
Created with AmiBroker - adv anced charting and technical analy sis sof tware. http://www.amibroker.com
^JKSE - MFI Smoothed = 47.37
47.3707
^JKSE - RSI Smoothed = 64.98
64.9818
_____ 6,372.8_____ 6,311.9
Optimization Trading System - ©2010 - Powered by AMTA Optimization Trading System - ©2010 - Powered by AMTA
Composite Index [ ^JKSE ] - Daily - 6/27/2019 Open: 6,325 High: 6,358 Low: 6,320 Close: 6,353 Vol. 10,266,683,392
Prev. Avg. Price: 6,343.6
R-Squared: 0.8318
Period: 946
Std.Dev: 1.38
Volatility (+) : 0.0046
Volatility (-) : -0.0050
V-Ratio : 0.92
Chg.: 0.67%
6,352.71
6,352.49
6,183.11
Sep Oct Nov Dec 2019 Feb Mar Apr May Jun
^JKSE - Volume = 10,266,683,392.00, MA(Volume,23) = 9,443,369,984.00
10,266,683,392
9,443,369,984
28 Juni, 2019
6
Embun Pagi
Mirae Asset Sekuritas Indonesia
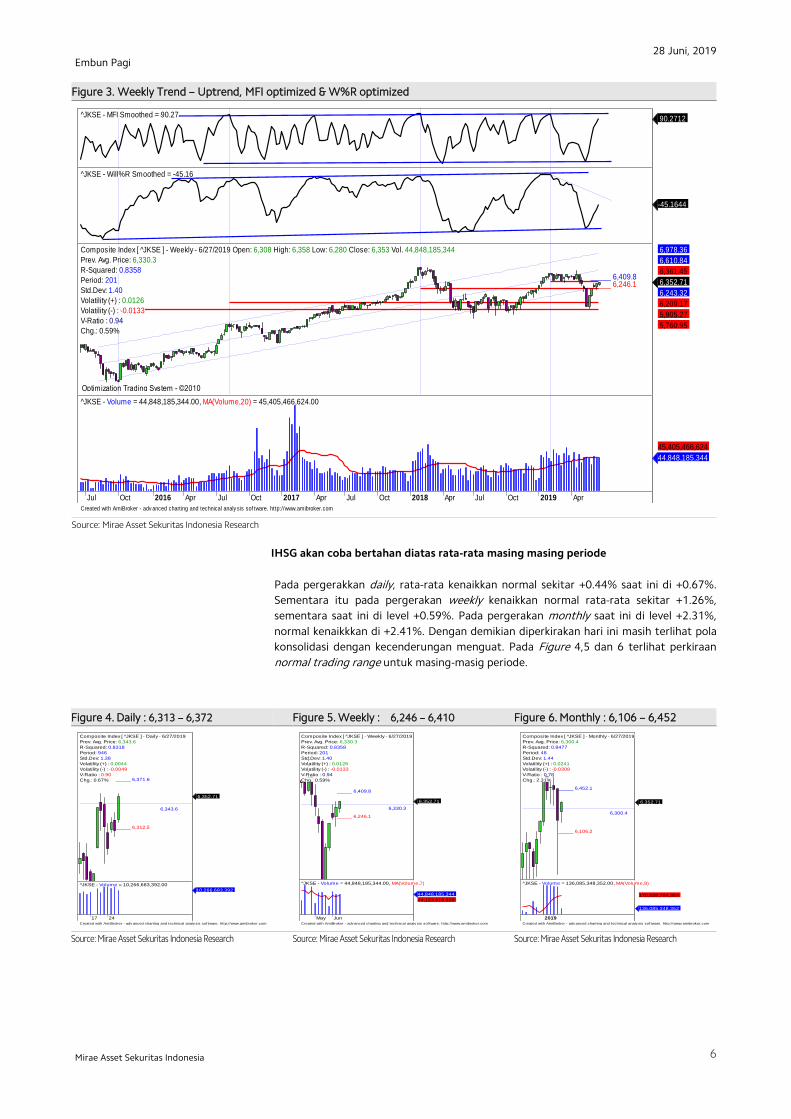
Figure 3. Weekly Trend – Uptrend, MFI optimized & W%R optimized
A
Source: Mirae Asset Sekuritas Indonesia Research
IHSG akan coba bertahan diatas rata-rata masing masing periode
Pada pergerakkan daily, rata-rata kenaikkan normal sekitar +0.44% saat ini di +0.67%.
Sementara itu pada pergerakan weekly kenaikkan normal rata-rata sekitar +1.26%,
sementara saat ini di level +0.59%. Pada pergerakan monthly saat ini di level +2.31%,
normal kenaikkkan di +2.41%. Dengan demikian diperkirakan hari ini masih terlihat pola
konsolidasi dengan kecenderungan menguat. Pada Figure 4,5 dan 6 terlihat perkiraan
normal trading range untuk masing-masig periode.
Figure 4. Daily : 6,313 – 6,372 Figure 5. Weekly : 6,246 – 6,410 Figure 6. Monthly : 6,106 – 6,452
x
x x`
Source: Mirae Asset Sekuritas Indonesia Research
Source: Mirae Asset Sekuritas Indonesia Research
Source: Mirae Asset Sekuritas Indonesia Research
Created with AmiBroker - adv anced charting and technical analy sis sof tware. http://www.amibroker.com
^JKSE - MFI Smoothed = 90.27 90.2712
^JKSE - Will%R Smoothed = -45.16
-45.1644
_____ 6,409.8_____ 6,246.1
Optimization Trading System - ©2010 Optimization Trading System - ©2010 Optimization Trading System - ©2010 Optimization Trading System - ©2010 Optimization Trading System - ©2010
Composite Index [ ^JKSE ] - Weekly - 6/27/2019 Open: 6,308 High: 6,358 Low: 6,280 Close: 6,353 Vol. 44,848,185,344
Prev. Avg. Price: 6,330.3
R-Squared: 0.8358
Period: 201
Std.Dev: 1.40
Volatility (+) : 0.0126
Volatility (-) : -0.0133
V-Ratio : 0.94
Chg.: 0.59%
6,352.71
6,243.32
6,209.17
5,905.27
5,760.95
6,361.45
6,610.84
6,978.36
Jul Oct 2016 Apr Jul Oct 2017 Apr Jul Oct 2018 Apr Jul Oct 2019 Apr
^JKSE - Volume = 44,848,185,344.00, MA(Volume,20) = 45,405,466,624.00
44,848,185,344
45,405,466,624
Created with AmiBroker - adv anced charting and technical analy sis sof tware. http://www.amibroker.com
_____ 6,371.6
_____ 6,312.5
6,343.6
Composite Index [ ^JKSE ] - Daily - 6/27/2019
Prev. Avg. Price: 6,343.6
R-Squared: 0.8318
Period: 946
Std.Dev: 1.38
Volatility (+) : 0.0044
Volatility (-) : -0.0049
V-Ratio : 0.90
Chg.: 0.67%
6,352.71
17 24
^JKSE - Volume = 10,266,683,392.00
10,266,683,392
Created with AmiBroker - adv anced charting and technical analy sis sof tware. http://www.amibroker.com
_____ 6,409.8
_____ 6,246.1
6,330.3
Composite Index [ ^JKSE ] - Weekly - 6/27/2019
Prev. Avg. Price: 6,330.3
R-Squared: 0.8358
Period: 201
Std.Dev: 1.40
Volatility (+) : 0.0126
Volatility (-) : -0.0133
V-Ratio : 0.94
Chg.: 0.59%
6,352.71
May Jun
^JKSE - Volume = 44,848,185,344.00, MA(Volume,7)
44,848,185,344
44,123,619,328
Created with AmiBroker - adv anced charting and technical analy sis sof tware. http://www.amibroker.com
_____ 6,452.1
_____ 6,106.2
6,300.4
Composite Index [ ^JKSE ] - Monthly - 6/27/2019
Prev. Avg. Price: 6,300.4
R-Squared: 0.8477
Period: 48
Std.Dev: 1.44
Volatility (+) : 0.0241
Volatility (-) : -0.0308
V-Ratio : 0.78
Chg.: 2.31%
6,352.71
Oct 2019
^JKSE - Volume = 136,085,348,352.00, MA(Volume,9)
136,085,348,352
170,528,784,384
28 Juni, 2019
7
Embun Pagi
Mirae Asset Sekuritas Indonesia
Stocks on our focus list
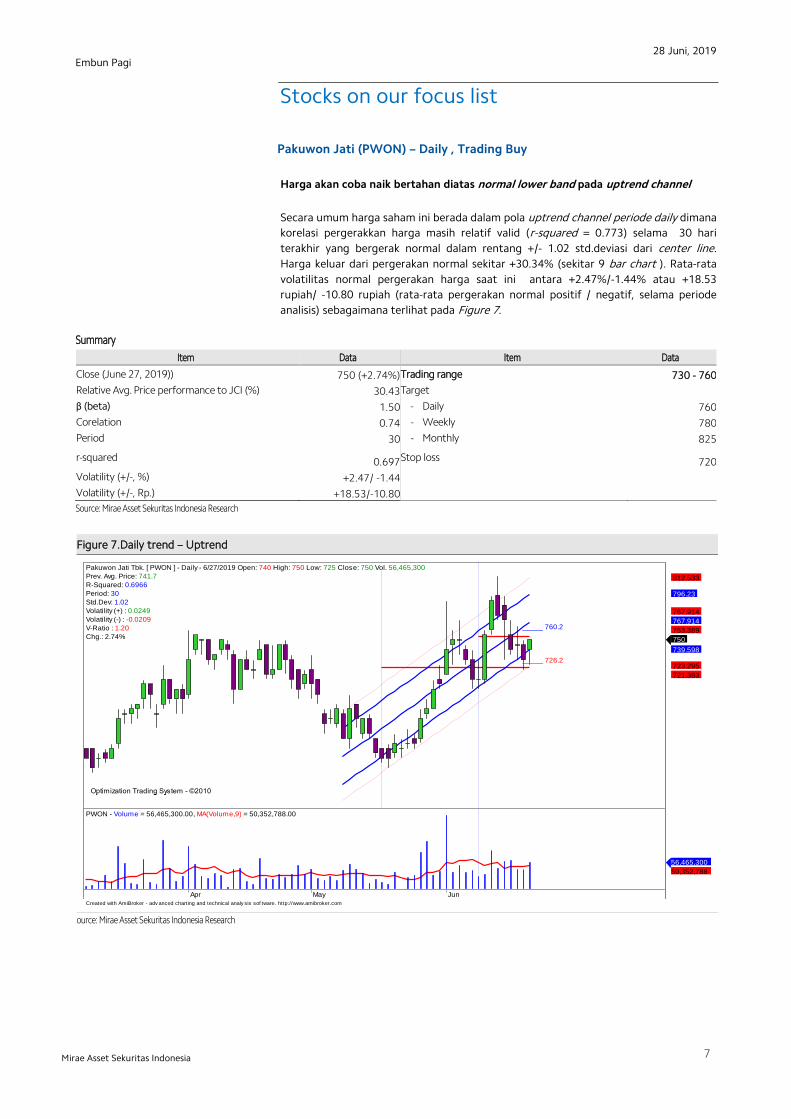
Pakuwon Jati (PWON) – Daily , Trading Buy
Harga akan coba naik bertahan diatas normal lower band pada uptrend channel
Secara umum harga saham ini berada dalam pola uptrend channel periode daily dimana
korelasi pergerakkan harga masih relatif valid (r-squared = 0.773) selama 30 hari
terakhir yang bergerak normal dalam rentang +/- 1.02 std.deviasi dari center line.
Harga keluar dari pergerakan normal sekitar +30.34% (sekitar 9 bar chart ). Rata-rata
volatilitas normal pergerakan harga saat ini antara +2.47%/-1.44% atau +18.53
rupiah/ -10.80 rupiah (rata-rata pergerakan normal positif / negatif, selama periode
analisis) sebagaimana terlihat pada Figure 7.
Summary
Item Data Item Data
Close (June 27, 2019)) 750 (+2.74%) Trading range 730 - 760
Relative Avg. Price performance to JCI (%) 30.43 Target
β (beta) 1.50 - Daily 760
Corelation 0.74 - Weekly 780
Period 30 - Monthly 825
r-squared 0.697 Stop loss 720
Volatility (+/-, %) +2.47/ -1.44
Volatility (+/-, Rp.) +18.53/-10.80
Source: Mirae Asset Sekuritas Indonesia Research
Figure 7.Daily trend – Uptrend
ource: Mirae Asset Sekuritas Indonesia Research
Created with AmiBroker - adv anced charting and technical analy sis sof tware. http://www.amibroker.com
_____ 760.2
_____ 726.2
Optimization Trading System - ©2010 Optimization Trading System - ©2010 Optimization Trading System - ©2010 Optimization Trading System - ©2010
Pakuwon Jati Tbk. [ PWON ] - Daily - 6/27/2019 Open: 740 High: 750 Low: 725 Close: 750 Vol. 56,465,300
Prev. Avg. Price: 741.7
R-Squared: 0.6966
Period: 30
Std.Dev: 1.02
Volatility (+) : 0.0249
Volatility (-) : -0.0209
V-Ratio : 1.20
Chg.: 2.74% 750
739.598
723.295
721.383
753.389
767.914
767.914
796.23
812.533
Apr May Jun
PWON - Volume = 56,465,300.00, MA(Volume,9) = 50,352,788.00
56,465,300
50,352,788
28 Juni, 2019
8
Embun Pagi
Mirae Asset Sekuritas Indonesia
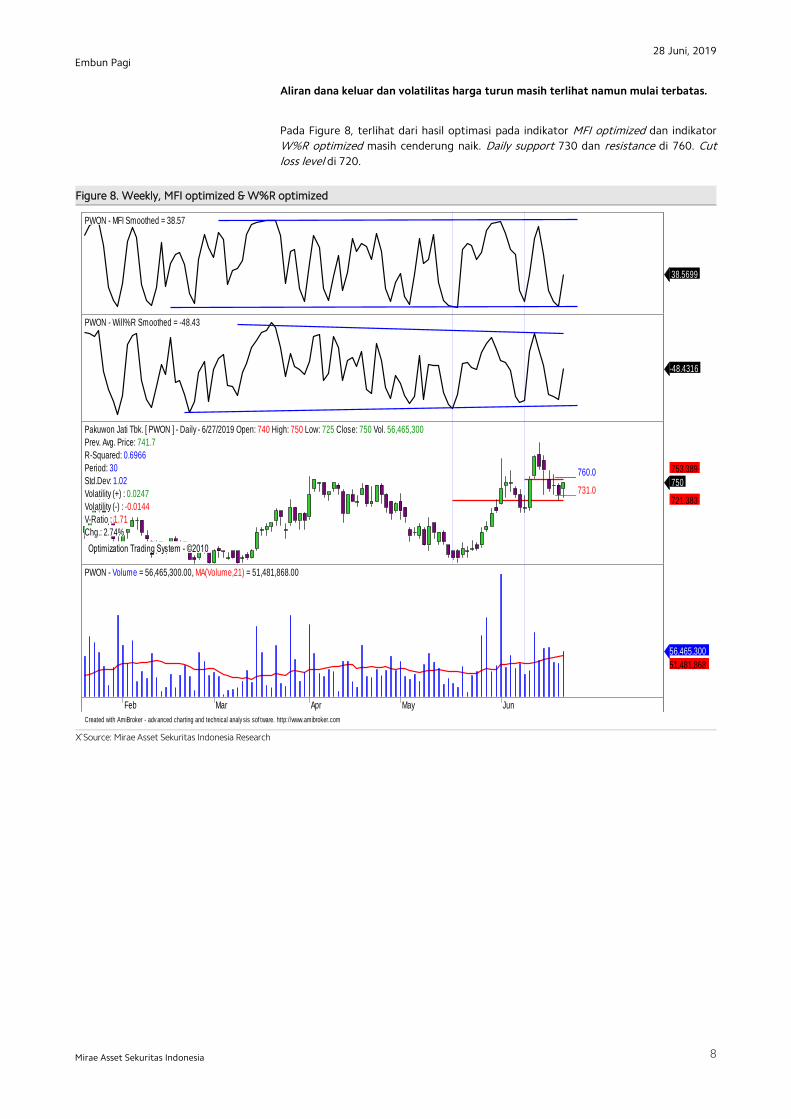
Aliran dana keluar dan volatilitas harga turun masih terlihat namun mulai terbatas.
Pada Figure 8, terlihat dari hasil optimasi pada indikator MFI optimized dan indikator
W%R optimized masih cenderung naik. Daily support 730 dan resistance di 760. Cut
loss level di 720.
Figure 8. Weekly, MFI optimized & W%R optimized
X`Source: Mirae Asset Sekuritas Indonesia Research
Created with AmiBroker - adv anced charting and technical analy sis sof tware. http://www.amibroker.com
PWON - MFI Smoothed = 38.57
38.5699
PWON - Will%R Smoothed = -48.43
-48.4316
_____ 760.0
_____ 731.0
Optimization Trading System - ©2010 Optimization Trading System - ©2010
Pakuwon Jati Tbk. [ PWON ] - Daily - 6/27/2019 Open: 740 High: 750 Low: 725 Close: 750 Vol. 56,465,300
Prev. Avg. Price: 741.7
R-Squared: 0.6966
Period: 30
Std.Dev: 1.02
Volatility (+) : 0.0247
Volatility (-) : -0.0144
V-Ratio : 1.71
Chg.: 2.74%
750
721.383
753.389
Feb Mar Apr May Jun
PWON - Volume = 56,465,300.00, MA(Volume,21) = 51,481,868.00
56,465,300
51,481,868
28 Juni, 2019
9
Embun Pagi
Mirae Asset Sekuritas Indonesia
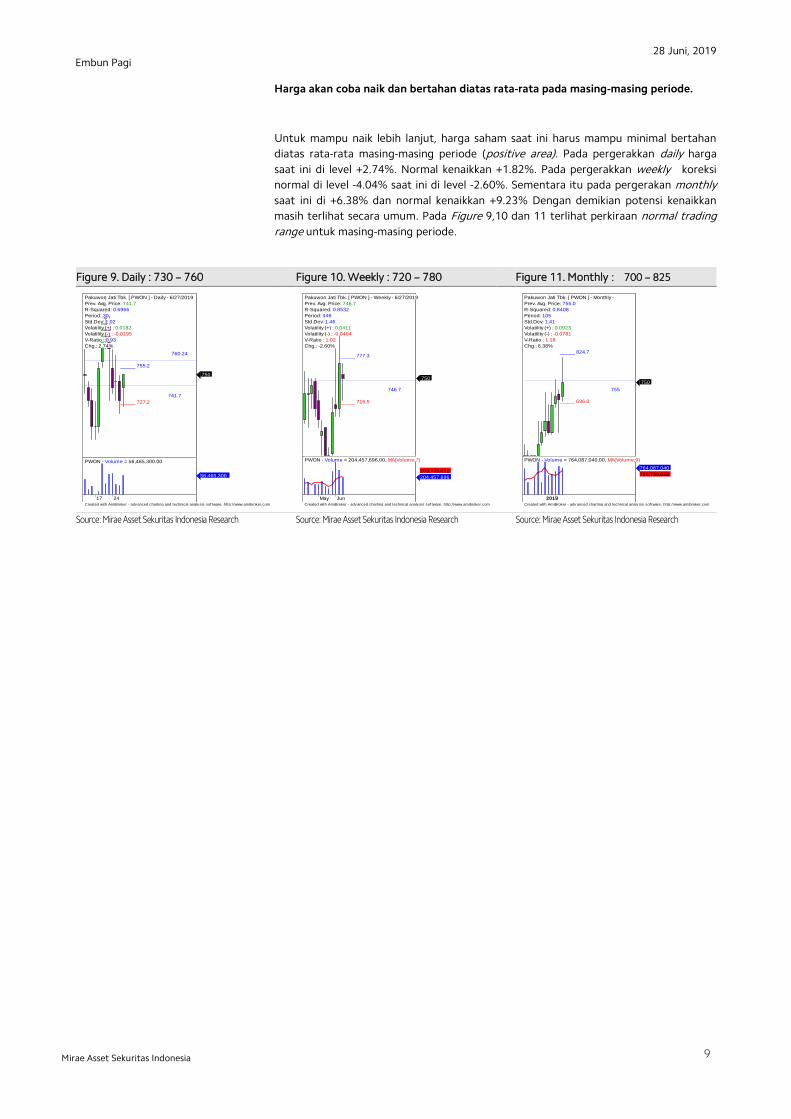
Harga akan coba naik dan bertahan diatas rata-rata pada masing-masing periode.
Untuk mampu naik lebih lanjut, harga saham saat ini harus mampu minimal bertahan
diatas rata-rata masing-masing periode (positive area). Pada pergerakkan daily harga
saat ini di level +2.74%. Normal kenaikkan +1.82%. Pada pergerakkan weekly koreksi
normal di level -4.04% saat ini di level -2.60%. Sementara itu pada pergerakan monthly
saat ini di +6.38% dan normal kenaikkan +9.23% Dengan demikian potensi kenaikkan
masih terlihat secara umum. Pada Figure 9,10 dan 11 terlihat perkiraan normal trading
range untuk masing-masing periode.
Figure 9. Daily : 730 – 760 Figure 10. Weekly : 720 – 780 Figure 11. Monthly : 700 – 825
x`x`
Source: Mirae Asset Sekuritas Indonesia Research
Source: Mirae Asset Sekuritas Indonesia Research
Source: Mirae Asset Sekuritas Indonesia Research
Created with AmiBroker - adv anced charting and technical analy sis sof tware. http://www.amibroker.com
_____ 777.3
_____ 716.5
746.7
Pakuwon Jati Tbk. [ PWON ] - Weekly - 6/27/2019
Prev. Avg. Price: 746.7
R-Squared: 0.8532
Period: 446
Std.Dev: 1.46
Volatility (+) : 0.0411
Volatility (-) : -0.0404
V-Ratio : 1.02
Chg.: -2.60%
750
May Jun
PWON - Volume = 204,457,696.00, MA(Volume,7)
204,457,696
209,746,032
Created with AmiBroker - adv anced charting and technical analy sis sof tware. http://www.amibroker.com
_____ 824.7
_____ 696.0
755
Pakuwon Jati Tbk. [ PWON ] - Monthly -
Prev. Avg. Price: 755.0
R-Squared: 0.8408
Period: 105
Std.Dev: 1.41
Volatility (+) : 0.0923
Volatility (-) : -0.0781
V-Ratio : 1.18
Chg.: 6.38%
750
Oct 2019
PWON - Volume = 764,087,040.00, MA(Volume,9)
764,087,040
726,739,648
Created with AmiBroker - adv anced charting and technical analy sis sof tware. http://www.amibroker.com
_____ 755.2
_____ 727.2
741.7
760.24
Pakuwon Jati Tbk. [ PWON ] - Daily - 6/27/2019
Prev. Avg. Price: 741.7
R-Squared: 0.6966
Period: 30
Std.Dev: 1.02
Volatility (+) : 0.0182
Volatility (-) : -0.0195
V-Ratio : 0.93
Chg.: 2.74%
750
17 24
PWON - Volume = 56,465,300.00
56,465,300
28 Juni, 2019
10
Embun Pagi
Mirae Asset Sekuritas Indonesia
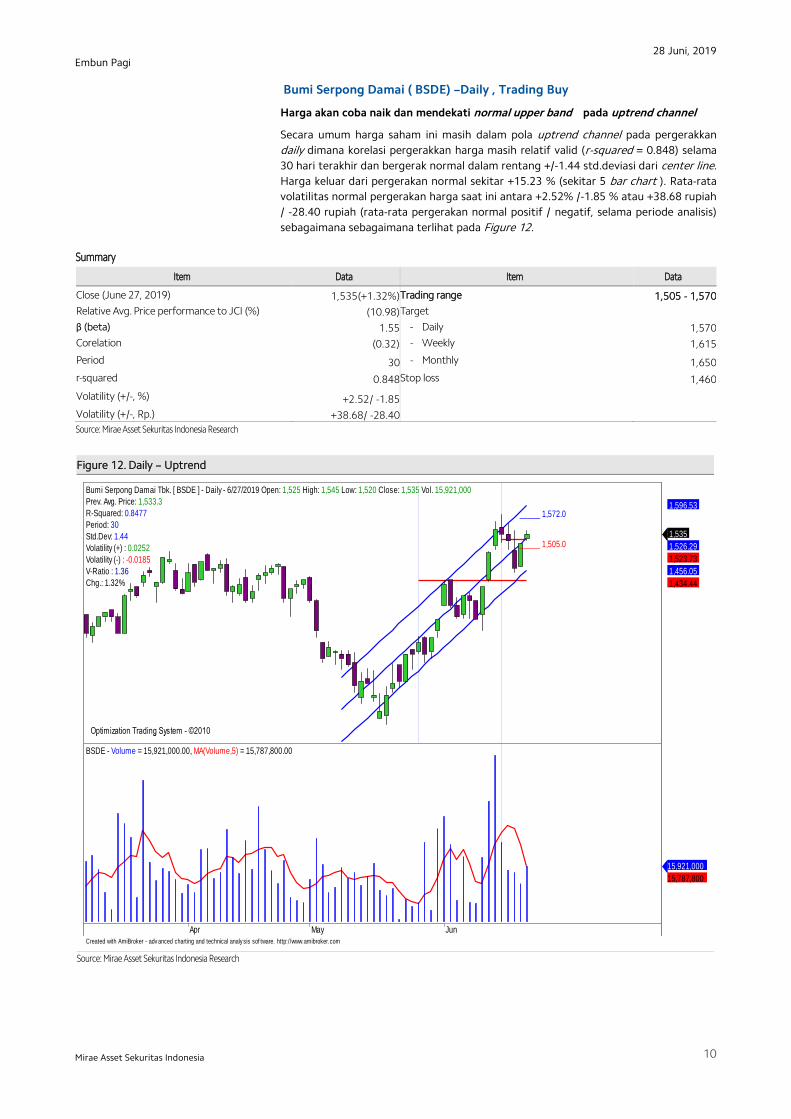
Bumi Serpong Damai ( BSDE) –Daily , Trading Buy
Harga akan coba naik dan mendekati normal upper band pada uptrend channel
Secara umum harga saham ini masih dalam pola uptrend channel pada pergerakkan
daily dimana korelasi pergerakkan harga masih relatif valid (r-squared = 0.848) selama
30 hari terakhir dan bergerak normal dalam rentang +/-1.44 std.deviasi dari center line.
Harga keluar dari pergerakan normal sekitar +15.23 % (sekitar 5 bar chart ). Rata-rata
volatilitas normal pergerakan harga saat ini antara +2.52% /-1.85 % atau +38.68 rupiah
/ -28.40 rupiah (rata-rata pergerakan normal positif / negatif, selama periode analisis)
sebagaimana sebagaimana terlihat pada Figure 12.
Summary
Item Data Item Data
Close (June 27, 2019) 1,535(+1.32%) Trading range 1,505 - 1,570
Relative Avg. Price performance to JCI (%) (10.98) Target
β (beta) 1.55 - Daily 1,570
Corelation (0.32) - Weekly 1,615
Period 30 - Monthly 1,650
r-squared 0.848 Stop loss 1,460
Volatility (+/-, %) +2.52/ -1.85
Volatility (+/-, Rp.) +38.68/ -28.40
Source: Mirae Asset Sekuritas Indonesia Research
Figure 12. Daily – Uptrend
x`
Source: Mirae Asset Sekuritas Indonesia Research
,
Created with AmiBroker - adv anced charting and technical analy sis sof tware. http://www.amibroker.com
_____ 1,572.0
_____ 1,505.0
Optimization Trading System - ©2010 Optimization Trading System - ©2010 Optimization Trading System - ©2010
Bumi Serpong Damai Tbk. [ BSDE ] - Daily - 6/27/2019 Open: 1,525 High: 1,545 Low: 1,520 Close: 1,535 Vol. 15,921,000
Prev. Avg. Price: 1,533.3
R-Squared: 0.8477
Period: 30
Std.Dev: 1.44
Volatility (+) : 0.0252
Volatility (-) : -0.0185
V-Ratio : 1.36
Chg.: 1.32%
1,535
1,526.29
1,523.73
1,456.05
1,434.44
1,596.53
Apr May Jun
BSDE - Volume = 15,921,000.00, MA(Volume,5) = 15,787,800.00
15,921,000
15,787,800
28 Juni, 2019
11
Embun Pagi
Mirae Asset Sekuritas Indonesia
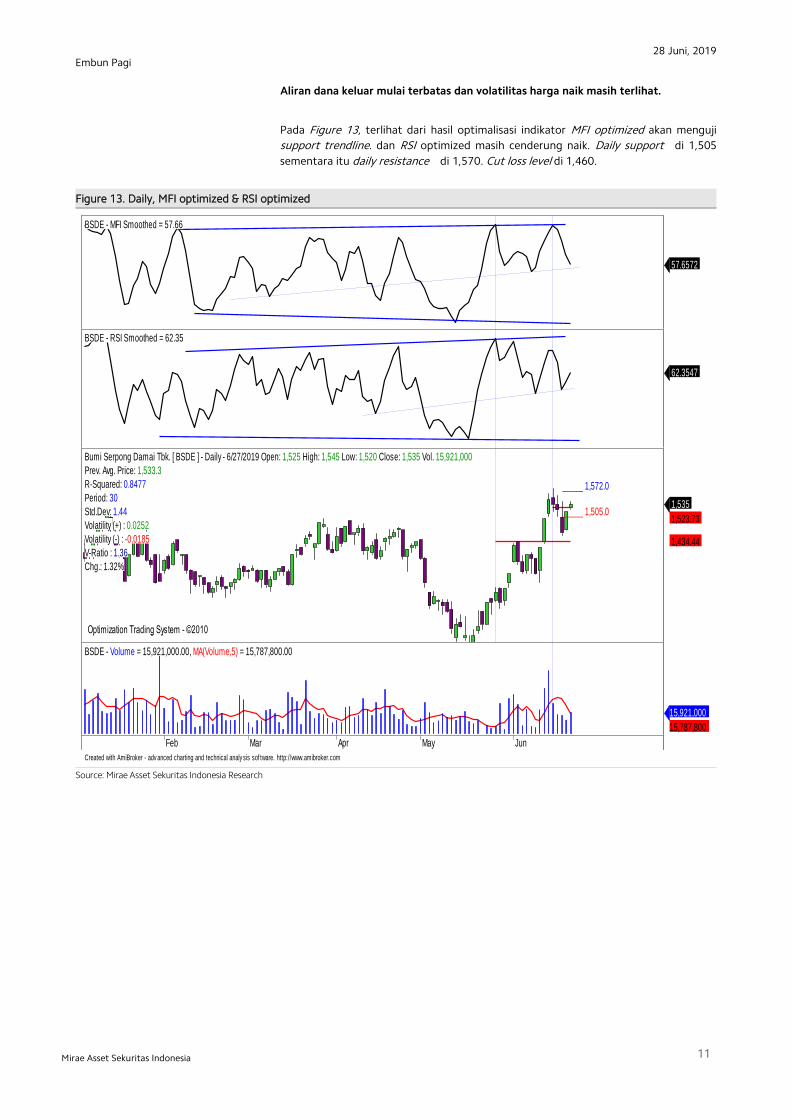
Aliran dana keluar mulai terbatas dan volatilitas harga naik masih terlihat.
Pada Figure 13, terlihat dari hasil optimalisasi indikator MFI optimized akan menguji
support trendline. dan RSI optimized masih cenderung naik. Daily support di 1,505
sementara itu daily resistance di 1,570. Cut loss level di 1,460.
Figure 13. Daily, MFI optimized & RSI optimized
,
Source: Mirae Asset Sekuritas Indonesia Research
Created with AmiBroker - adv anced charting and technical analy sis sof tware. http://www.amibroker.com
BSDE - MFI Smoothed = 57.66
57.6572
BSDE - RSI Smoothed = 62.35
62.3547
_____ 1,572.0
_____ 1,505.0
Optimization Trading System - ©2010 Optimization Trading System - ©2010
Bumi Serpong Damai Tbk. [ BSDE ] - Daily - 6/27/2019 Open: 1,525 High: 1,545 Low: 1,520 Close: 1,535 Vol. 15,921,000
Prev. Avg. Price: 1,533.3
R-Squared: 0.8477
Period: 30
Std.Dev: 1.44
Volatility (+) : 0.0252
Volatility (-) : -0.0185
V-Ratio : 1.36
Chg.: 1.32%
1,535
1,523.73
1,434.44
Feb Mar Apr May Jun
BSDE - Volume = 15,921,000.00, MA(Volume,5) = 15,787,800.00
15,921,000
15,787,800
28 Juni, 2019
12
Embun Pagi
Mirae Asset Sekuritas Indonesia
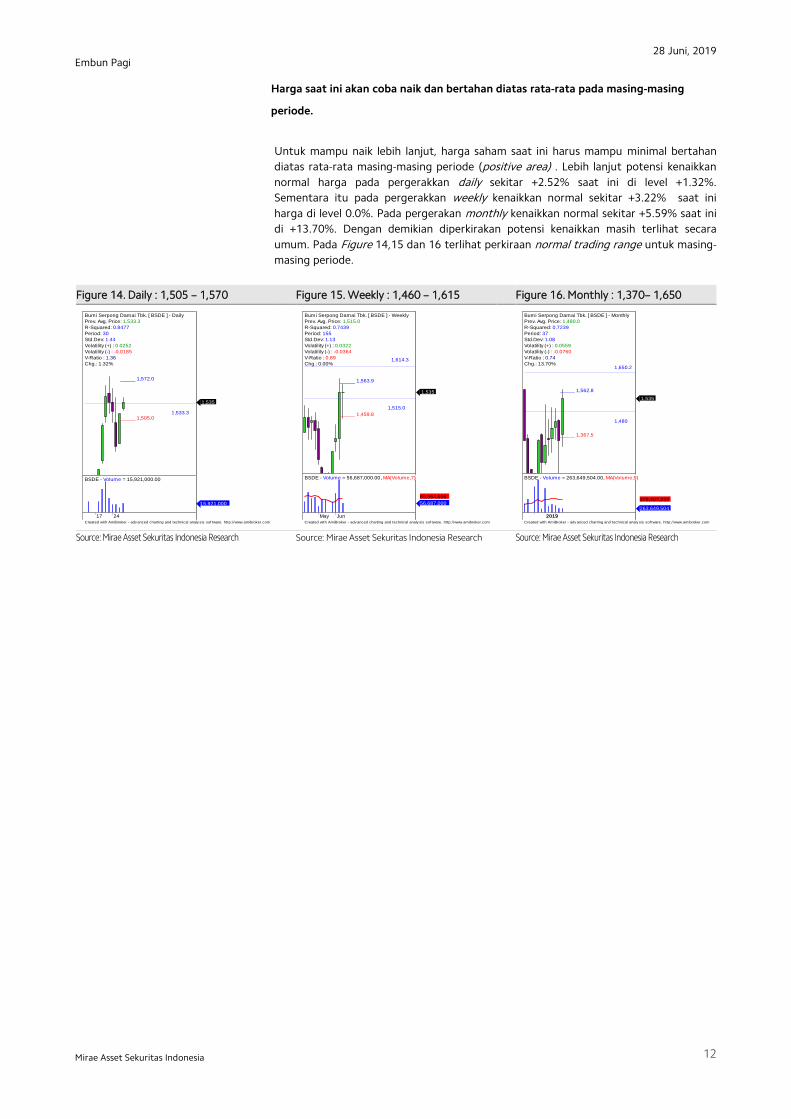
Harga saat ini akan coba naik dan bertahan diatas rata-rata pada masing-masing
periode.
Untuk mampu naik lebih lanjut, harga saham saat ini harus mampu minimal bertahan
diatas rata-rata masing-masing periode (positive area) . Lebih lanjut potensi kenaikkan
normal harga pada pergerakkan daily sekitar +2.52% saat ini di level +1.32%.
Sementara itu pada pergerakkan weekly kenaikkan normal sekitar +3.22% saat ini
harga di level 0.0%. Pada pergerakan monthly kenaikkan normal sekitar +5.59% saat ini
di +13.70%. Dengan demikian diperkirakan potensi kenaikkan masih terlihat secara
umum. Pada Figure 14,15 dan 16 terlihat perkiraan normal trading range untuk masing-
masing periode.
Figure 14. Daily : 1,505 – 1,570 Figure 15. Weekly : 1,460 – 1,615 Figure 16. Monthly : 1,370– 1,650
, x`
x
Source: Mirae Asset Sekuritas Indonesia Research
Source: Mirae Asset Sekuritas Indonesia Research
Source: Mirae Asset Sekuritas Indonesia Research
Created with AmiBroker - adv anced charting and technical analy sis sof tware. http://www.amibroker.com
_____ 1,572.0
_____ 1,505.01,533.3
Bumi Serpong Damai Tbk. [ BSDE ] - Daily
Prev. Avg. Price: 1,533.3
R-Squared: 0.8477
Period: 30
Std.Dev: 1.44
Volatility (+) : 0.0252
Volatility (-) : -0.0185
V-Ratio : 1.36
Chg.: 1.32%
1,535
17 24
BSDE - Volume = 15,921,000.00
15,921,000
Created with AmiBroker - adv anced charting and technical analy sis sof tware. http://www.amibroker.com
_____ 1,563.9
_____ 1,459.8
1,515.0
1,614.3
Bumi Serpong Damai Tbk. [ BSDE ] - Weekly
Prev. Avg. Price: 1,515.0
R-Squared: 0.7439
Period: 155
Std.Dev: 1.13
Volatility (+) : 0.0322
Volatility (-) : -0.0364
V-Ratio : 0.89
Chg.: 0.00%
1,535
May Jun
BSDE - Volume = 56,687,000.00, MA(Volume,7)
56,687,000
69,554,696
Created with AmiBroker - adv anced charting and technical analy sis sof tware. http://www.amibroker.com
_____ 1,562.8
_____ 1,367.5
1,480
1,650.2
Bumi Serpong Damai Tbk. [ BSDE ] - Monthly
Prev. Avg. Price: 1,480.0
R-Squared: 0.7239
Period: 37
Std.Dev: 1.08
Volatility (+) : 0.0559
Volatility (-) : -0.0760
V-Ratio : 0.74
Chg.: 13.70%
1,535
Oct 2019
BSDE - Volume = 263,649,504.00, MA(Volume,9)
263,649,504
378,407,232
28 Juni, 2019
13
Embun Pagi
Mirae Asset Sekuritas Indonesia
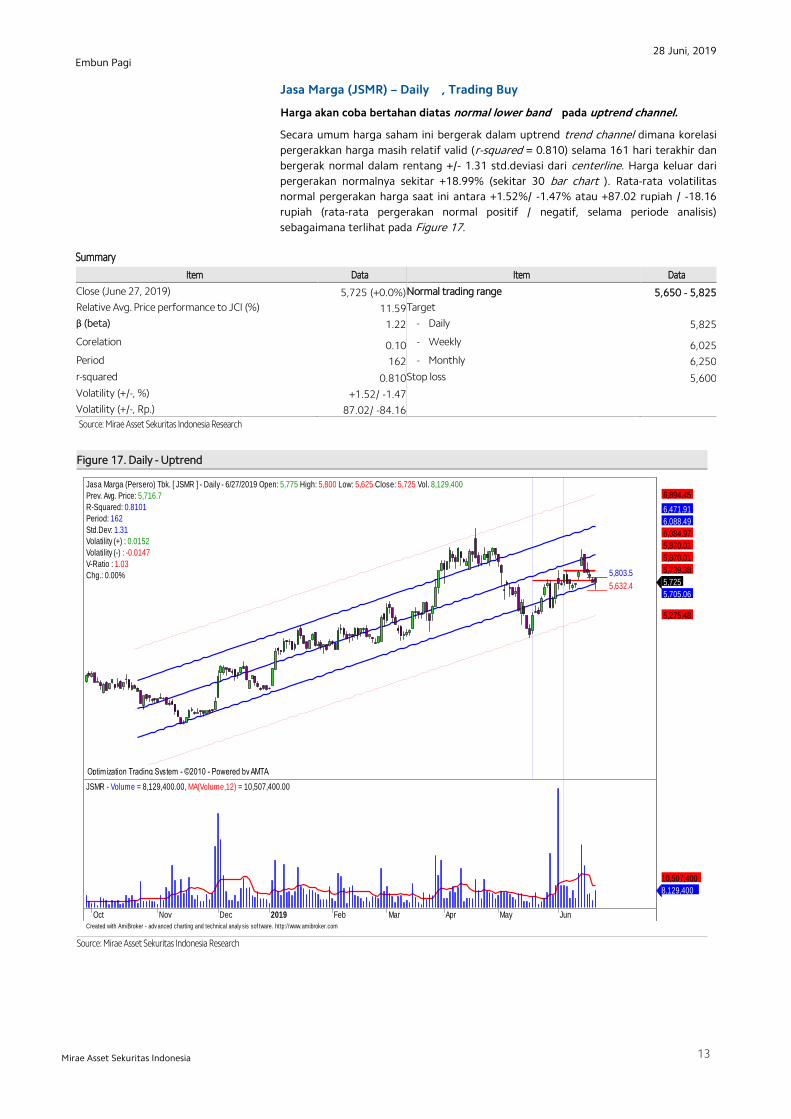
Jasa Marga (JSMR) – Daily , Trading Buy
Harga akan coba bertahan diatas normal lower band pada uptrend channel.
Secara umum harga saham ini bergerak dalam uptrend trend channel dimana korelasi
pergerakkan harga masih relatif valid (r-squared = 0.810) selama 161 hari terakhir dan
bergerak normal dalam rentang +/- 1.31 std.deviasi dari centerline. Harga keluar dari
pergerakan normalnya sekitar +18.99% (sekitar 30 bar chart ). Rata-rata volatilitas
normal pergerakan harga saat ini antara +1.52%/ -1.47% atau +87.02 rupiah / -18.16
rupiah (rata-rata pergerakan normal positif / negatif, selama periode analisis)
sebagaimana terlihat pada Figure 17.
Summary
Item Data Item Data
Close (June 27, 2019) 5,725 (+0.0%) Normal trading range 5,650 - 5,825
Relative Avg. Price performance to JCI (%) 11.59 Target
β (beta) 1.22 - Daily 5,825
Corelation 0.10 - Weekly 6,025
Period 162 - Monthly 6,250
r-squared 0.810 Stop loss 5,600
Volatility (+/-, %) +1.52/ -1.47
Volatility (+/-, Rp.) 87.02/ -84.16
Source: Mirae Asset Sekuritas Indonesia Research
Figure 17. Daily - Uptrend
Source: Mirae Asset Sekuritas Indonesia Research
,
Created with AmiBroker - adv anced charting and technical analy sis sof tware. http://www.amibroker.com
_____ 5,803.5
_____ 5,632.4
Optimization Trading System - ©2010 - Powered by AMTA Optimization Trading System - ©2010 - Powered by AMTA Optimization Trading System - ©2010 - Powered by AMTA Optimization Trading System - ©2010 - Powered by AMTA Optimization Trading System - ©2010 - Powered by AMTA
Jasa Marga (Persero) Tbk. [ JSMR ] - Daily - 6/27/2019 Open: 5,775 High: 5,800 Low: 5,625 Close: 5,725 Vol. 8,129,400
Prev. Avg. Price: 5,716.7
R-Squared: 0.8101
Period: 162
Std.Dev: 1.31
Volatility (+) : 0.0152
Volatility (-) : -0.0147
V-Ratio : 1.03
Chg.: 0.00% 5,725
5,705.06
5,275.48
5,739.38
5,870.01
5,870.01
6,084.97
6,088.49
6,471.91
6,894.45
Oct Nov Dec 2019 Feb Mar Apr May Jun
JSMR - Volume = 8,129,400.00, MA(Volume,12) = 10,507,400.00
8,129,400
10,507,400
28 Juni, 2019
14
Embun Pagi
Mirae Asset Sekuritas Indonesia
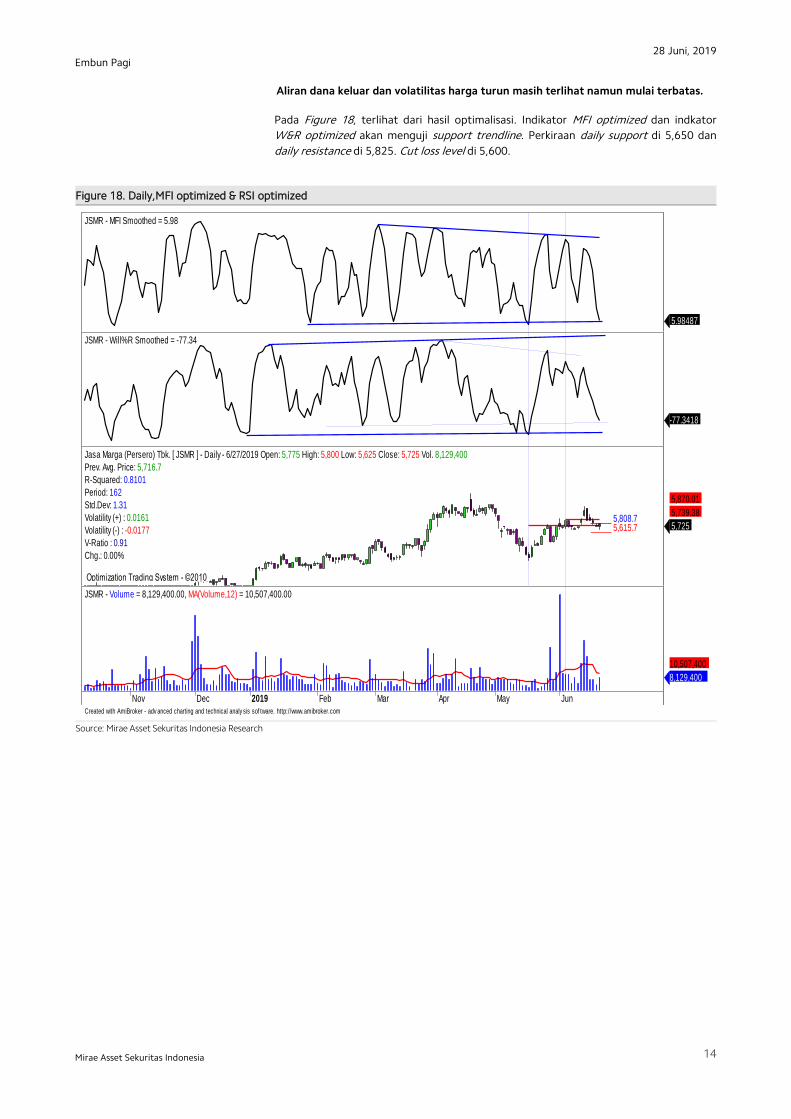
Aliran dana keluar dan volatilitas harga turun masih terlihat namun mulai terbatas.
Pada Figure 18, terlihat dari hasil optimalisasi. Indikator MFI optimized dan indkator
W&R optimized akan menguji support trendline. Perkiraan daily support di 5,650 dan
daily resistance di 5,825. Cut loss level di 5,600.
Figure 18. Daily,MFI optimized & RSI optimized
XXXXXXXXXXXXXXX
Source: Mirae Asset Sekuritas Indonesia Research
Created with AmiBroker - adv anced charting and technical analy sis sof tware. http://www.amibroker.com
JSMR - MFI Smoothed = 5.98
5.98487
JSMR - Will%R Smoothed = -77.34
-77.3418
_____ 5,808.7_____ 5,615.7
Optimization Trading System - ©2010 Optimization Trading System - ©2010
Jasa Marga (Persero) Tbk. [ JSMR ] - Daily - 6/27/2019 Open: 5,775 High: 5,800 Low: 5,625 Close: 5,725 Vol. 8,129,400
Prev. Avg. Price: 5,716.7
R-Squared: 0.8101
Period: 162
Std.Dev: 1.31
Volatility (+) : 0.0161
Volatility (-) : -0.0177
V-Ratio : 0.91
Chg.: 0.00%
5,725
5,739.38
5,870.01
Nov Dec 2019 Feb Mar Apr May Jun
JSMR - Volume = 8,129,400.00, MA(Volume,12) = 10,507,400.00
8,129,400
10,507,400
28 Juni, 2019
15
Embun Pagi
Mirae Asset Sekuritas Indonesia
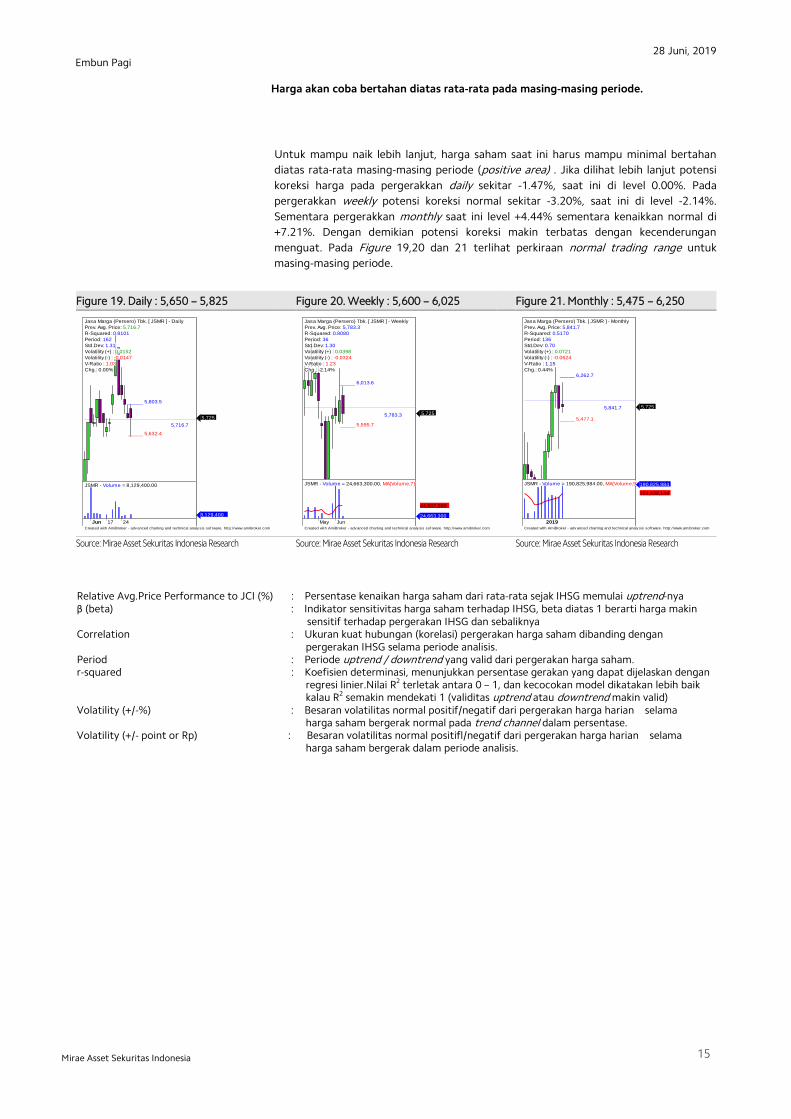
Harga akan coba bertahan diatas rata-rata pada masing-masing periode.
Untuk mampu naik lebih lanjut, harga saham saat ini harus mampu minimal bertahan
diatas rata-rata masing-masing periode (positive area) . Jika dilihat lebih lanjut potensi
koreksi harga pada pergerakkan daily sekitar -1.47%, saat ini di level 0.00%. Pada
pergerakkan weekly potensi koreksi normal sekitar -3.20%, saat ini di level -2.14%.
Sementara pergerakkan monthly saat ini level +4.44% sementara kenaikkan normal di
+7.21%. Dengan demikian potensi koreksi makin terbatas dengan kecenderungan
menguat. Pada Figure 19,20 dan 21 terlihat perkiraan normal trading range untuk
masing-masing periode.
Figure 19. Daily : 5,650 – 5,825 Figure 20. Weekly : 5,600 – 6,025 Figure 21. Monthly : 5,475 – 6,250
,,
x` x,
Source: Mirae Asset Sekuritas Indonesia Research
Source: Mirae Asset Sekuritas Indonesia Research
Source: Mirae Asset Sekuritas Indonesia Research
Relative Avg.Price Performance to JCI (%) : Persentase kenaikan harga saham dari rata-rata sejak IHSG memulai uptrend-nya β (beta) : Indikator sensitivitas harga saham terhadap IHSG, beta diatas 1 berarti harga makin sensitif terhadap pergerakan IHSG dan sebaliknya Correlation : Ukuran kuat hubungan (korelasi) pergerakan harga saham dibanding dengan pergerakan IHSG selama periode analisis. Period : Periode uptrend / downtrend yang valid dari pergerakan harga saham. r-squared : Koefisien determinasi, menunjukkan persentase gerakan yang dapat dijelaskan dengan regresi linier.Nilai R2 terletak antara 0 – 1, dan kecocokan model dikatakan lebih baik kalau R2 semakin mendekati 1 (validitas uptrend atau downtrend makin valid) Volatility (+/-%) : Besaran volatilitas normal positif/negatif dari pergerakan harga harian selama harga saham bergerak normal pada trend channel dalam persentase. Volatility (+/- point or Rp) : Besaran volatilitas normal positifl/negatif dari pergerakan harga harian selama harga saham bergerak dalam periode analisis.
Created with AmiBroker - adv anced charting and technical analy sis sof tware. http://www.amibroker.com
_____ 5,803.5
_____ 5,632.4
5,716.7
Jasa Marga (Persero) Tbk. [ JSMR ] - Daily
Prev. Avg. Price: 5,716.7
R-Squared: 0.8101
Period: 162
Std.Dev: 1.31
Volatility (+) : 0.0152
Volatility (-) : -0.0147
V-Ratio : 1.03
Chg.: 0.00%
5,725
Jun 17 24
JSMR - Volume = 8,129,400.00
8,129,400
Created with AmiBroker - adv anced charting and technical analy sis sof tware. http://www.amibroker.com
_____ 6,013.6
_____ 5,595.7
5,783.3
Jasa Marga (Persero) Tbk. [ JSMR ] - Weekly
Prev. Avg. Price: 5,783.3
R-Squared: 0.8080
Period: 36
Std.Dev: 1.30
Volatility (+) : 0.0398
Volatility (-) : -0.0324
V-Ratio : 1.23
Chg.: -2.14%
5,725
May Jun
JSMR - Volume = 24,663,300.00, MA(Volume,7)
24,663,300
44,667,500
Created with AmiBroker - adv anced charting and technical analy sis sof tware. http://www.amibroker.com
_____ 6,262.7
_____ 5,477.1
5,841.7
Jasa Marga (Persero) Tbk. [ JSMR ] - Monthly
Prev. Avg. Price: 5,841.7
R-Squared: 0.5170
Period: 136
Std.Dev: 0.70
Volatility (+) : 0.0721
Volatility (-) : -0.0624
V-Ratio : 1.15
Chg.: 0.44%
5,725
Oct 2019
JSMR - Volume = 190,825,984.00, MA(Volume,9) 190,825,984
154,432,144
28 Juni, 2019
16
Embun Pagi
Mirae Asset Sekuritas Indonesia
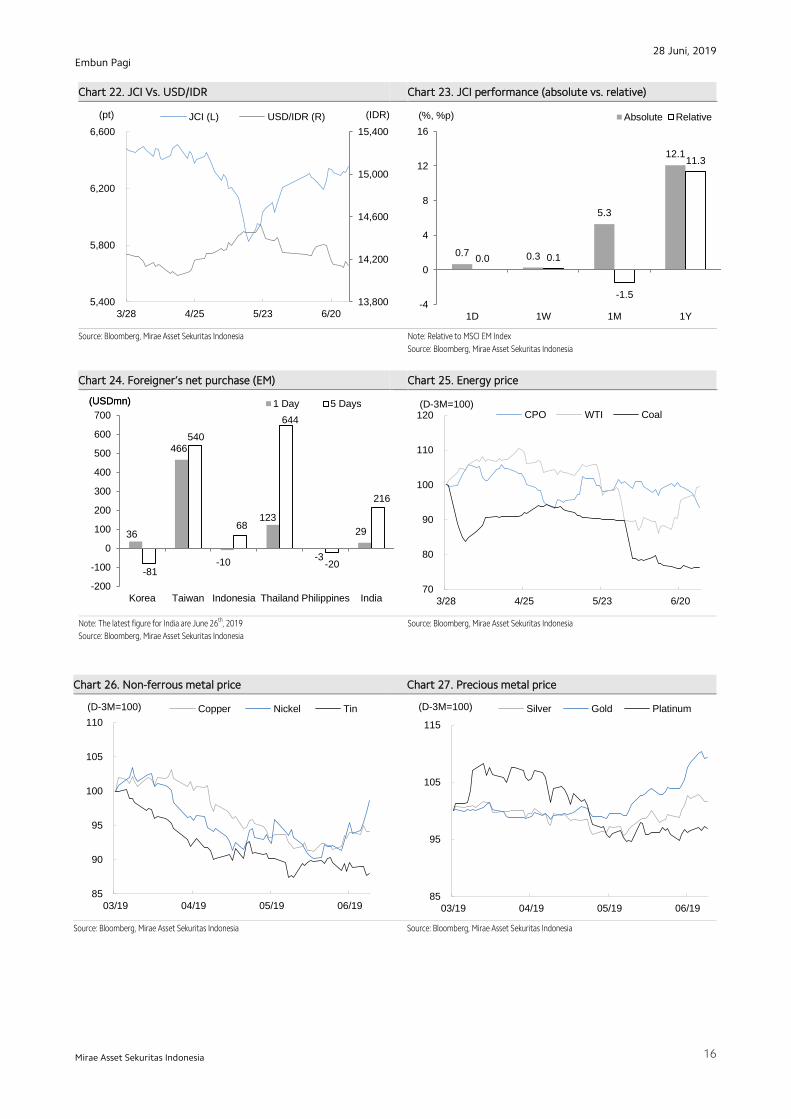
Chart 22. JCI Vs. USD/IDR Chart 23. JCI performance (absolute vs. relative)
Source: Bloomberg, Mirae Asset Sekuritas Indonesia
Note: Relative to MSCI EM Index
Source: Bloomberg, Mirae Asset Sekuritas Indonesia
Chart 24. Foreigner’s net purchase (EM) Chart 25. Energy price
V
Note: The latest figure for India are June 26th, 2019
Source: Bloomberg, Mirae Asset Sekuritas Indonesia
Source: Bloomberg, Mirae Asset Sekuritas Indonesia
Chart 26. Non-ferrous metal price Chart 27. Precious metal price
Source: Bloomberg, Mirae Asset Sekuritas Indonesia Source: Bloomberg, Mirae Asset Sekuritas Indonesia
13,800
14,200
14,600
15,000
15,400
5,400
5,800
6,200
6,600
3/28 4/25 5/23 6/20
(IDR) (pt) JCI (L) USD/IDR (R)
0.7 0.3
5.3
12.1
0.0 0.1
-1.5
11.3
-4
0
4
8
12
16
1D 1W 1M 1Y
Absolute Relative(%, %p)
36
466
-10
123
-3
29
-81
540
68
644
-20
216
-200
-100
0
100
200
300
400
500
600
700
Korea Taiwan Indonesia Thailand Philippines India
1 Day 5 Days (USDmn) (USDmn)
80
90
100
110
6/27 7/25 8/22 9/19
CPO WTI Coal(D-3M=100) (D-3M=100)
70
80
90
100
110
120
3/28 4/25 5/23 6/20
CPO WTI Coal(D-3M=100)
85
90
95
100
105
110
03/19 04/19 05/19 06/19
(D-3M=100) Copper Nickel Tin
85
95
105
115
03/19 04/19 05/19 06/19
(D-3M=100) Silver Gold Platinum
28 Juni, 2019
17
Embun Pagi
Mirae Asset Sekuritas Indonesia
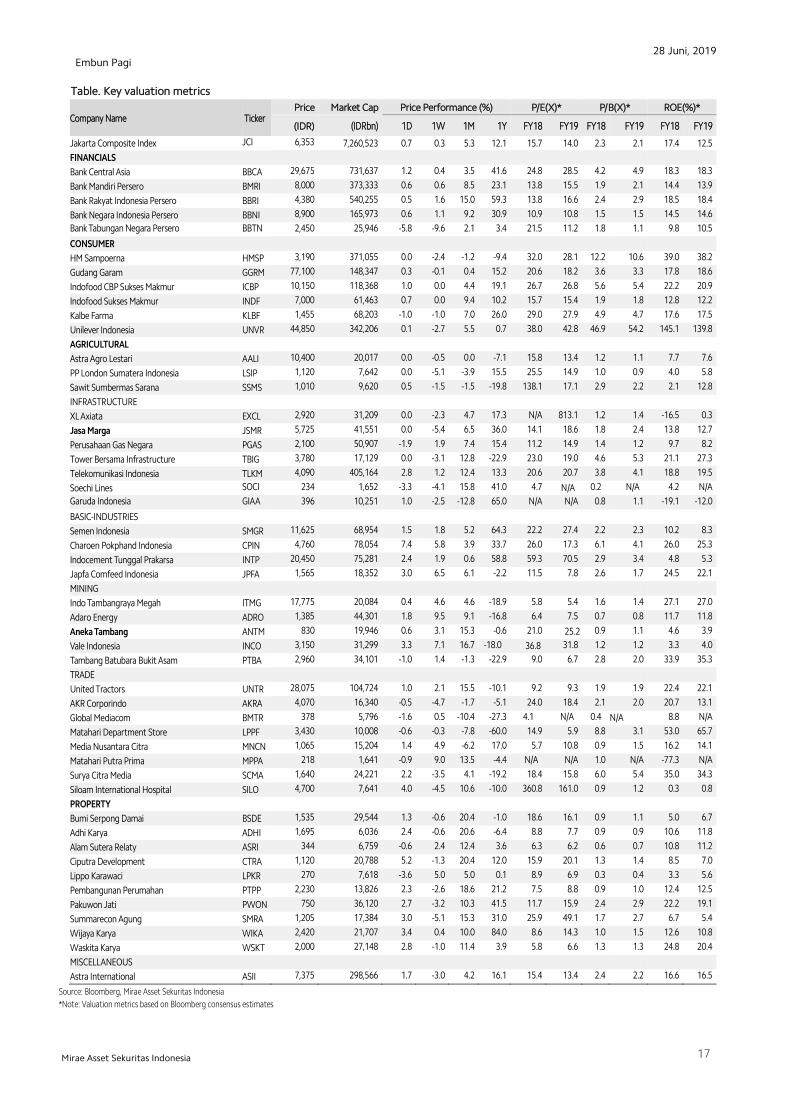
Table. Key valuation metrics
Company Name Ticker Price Market Cap Price Performance (%) P/E(X)* P/B(X)* ROE(%)*
(IDR) (IDRbn) 1D 1W 1M 1Y FY18 FY19 FY18 FY19 FY18 FY19
Jakarta Composite Index JCI 6,353 7,260,523 0.7 0.3 5.3 12.1 15.7 14.0 2.3 2.1 17.4 12.5
FINANCIALS
Bank Central Asia BBCA 29,675 731,637 1.2 0.4 3.5 41.6 24.8 28.5 4.2 4.9 18.3 18.3
Bank Mandiri Persero BMRI 8,000 373,333 0.6 0.6 8.5 23.1 13.8 15.5 1.9 2.1 14.4 13.9
Bank Rakyat Indonesia Persero BBRI 4,380 540,255 0.5 1.6 15.0 59.3 13.8 16.6 2.4 2.9 18.5 18.4
Bank Negara Indonesia Persero BBNI 8,900 165,973 0.6 1.1 9.2 30.9 10.9 10.8 1.5 1.5 14.5 14.6
Bank Tabungan Negara Persero BBTN 2,450 25,946 -5.8 -9.6 2.1 3.4 21.5 11.2 1.8 1.1 9.8 10.5
CONSUMER
HM Sampoerna HMSP 3,190 371,055 0.0 -2.4 -1.2 -9.4 32.0 28.1 12.2 10.6 39.0 38.2
Gudang Garam GGRM 77,100 148,347 0.3 -0.1 0.4 15.2 20.6 18.2 3.6 3.3 17.8 18.6
Indofood CBP Sukses Makmur ICBP 10,150 118,368 1.0 0.0 4.4 19.1 26.7 26.8 5.6 5.4 22.2 20.9
Indofood Sukses Makmur INDF 7,000 61,463 0.7 0.0 9.4 10.2 15.7 15.4 1.9 1.8 12.8 12.2
Kalbe Farma KLBF 1,455 68,203 -1.0 -1.0 7.0 26.0 29.0 27.9 4.9 4.7 17.6 17.5
Unilever Indonesia UNVR 44,850 342,206 0.1 -2.7 5.5 0.7 38.0 42.8 46.9 54.2 145.1 139.8
AGRICULTURAL
Astra Agro Lestari AALI 10,400 20,017 0.0 -0.5 0.0 -7.1 15.8 13.4 1.2 1.1 7.7 7.6
PP London Sumatera Indonesia LSIP 1,120 7,642 0.0 -5.1 -3.9 15.5 25.5 14.9 1.0 0.9 4.0 5.8
Sawit Sumbermas Sarana SSMS 1,010 9,620 0.5 -1.5 -1.5 -19.8 138.1 17.1 2.9 2.2 2.1 12.8
INFRASTRUCTURE
XL Axiata EXCL 2,920 31,209 0.0 -2.3 4.7 17.3 N/A 813.1 1.2 1.4 -16.5 0.3
Jasa Marga JSMR 5,725 41,551 0.0 -5.4 6.5 36.0 14.1 18.6 1.8 2.4 13.8 12.7
Perusahaan Gas Negara PGAS 2,100 50,907 -1.9 1.9 7.4 15.4 11.2 14.9 1.4 1.2 9.7 8.2
Tower Bersama Infrastructure TBIG 3,780 17,129 0.0 -3.1 12.8 -22.9 23.0 19.0 4.6 5.3 21.1 27.3
Telekomunikasi Indonesia TLKM 4,090 405,164 2.8 1.2 12.4 13.3 20.6 20.7 3.8 4.1 18.8 19.5
Soechi Lines SOCI 234 1,652 -3.3 -4.1 15.8 41.0 4.7 N/A 0.2 N/A 4.2 N/A
Garuda Indonesia GIAA 396 10,251 1.0 -2.5 -12.8 65.0 N/A N/A 0.8 1.1 -19.1 -12.0
BASIC-INDUSTRIES
Semen Indonesia SMGR 11,625 68,954 1.5 1.8 5.2 64.3 22.2 27.4 2.2 2.3 10.2 8.3
Charoen Pokphand Indonesia CPIN 4,760 78,054 7.4 5.8 3.9 33.7 26.0 17.3 6.1 4.1 26.0 25.3
Indocement Tunggal Prakarsa INTP 20,450 75,281 2.4 1.9 0.6 58.8 59.3 70.5 2.9 3.4 4.8 5.3
Japfa Comfeed Indonesia JPFA 1,565 18,352 3.0 6.5 6.1 -2.2 11.5 7.8 2.6 1.7 24.5 22.1
MINING
Indo Tambangraya Megah ITMG 17,775 20,084 0.4 4.6 4.6 -18.9 5.8 5.4 1.6 1.4 27.1 27.0
Adaro Energy ADRO 1,385 44,301 1.8 9.5 9.1 -16.8 6.4 7.5 0.7 0.8 11.7 11.8
Aneka Tambang ANTM 830 19,946 0.6 3.1 15.3 -0.6 21.0 25.2 0.9 1.1 4.6 3.9
Vale Indonesia INCO 3,150 31,299 3.3 7.1 16.7 -18.0 36.8 31.8 1.2 1.2 3.3 4.0
Tambang Batubara Bukit Asam PTBA 2,960 34,101 -1.0 1.4 -1.3 -22.9 9.0 6.7 2.8 2.0 33.9 35.3
TRADE
United Tractors UNTR 28,075 104,724 1.0 2.1 15.5 -10.1 9.2 9.3 1.9 1.9 22.4 22.1
AKR Corporindo AKRA 4,070 16,340 -0.5 -4.7 -1.7 -5.1 24.0 18.4 2.1 2.0 20.7 13.1
Global Mediacom BMTR 378 5,796 -1.6 0.5 -10.4 -27.3 4.1 N/A 0.4 N/A 8.8 N/A
Matahari Department Store LPPF 3,430 10,008 -0.6 -0.3 -7.8 -60.0 14.9 5.9 8.8 3.1 53.0 65.7
Media Nusantara Citra MNCN 1,065 15,204 1.4 4.9 -6.2 17.0 5.7 10.8 0.9 1.5 16.2 14.1
Matahari Putra Prima MPPA 218 1,641 -0.9 9.0 13.5 -4.4 N/A N/A 1.0 N/A -77.3 N/A
Surya Citra Media SCMA 1,640 24,221 2.2 -3.5 4.1 -19.2 18.4 15.8 6.0 5.4 35.0 34.3
Siloam International Hospital SILO 4,700 7,641 4.0 -4.5 10.6 -10.0 360.8 161.0 0.9 1.2 0.3 0.8
PROPERTY
Bumi Serpong Damai BSDE 1,535 29,544 1.3 -0.6 20.4 -1.0 18.6 16.1 0.9 1.1 5.0 6.7
Adhi Karya ADHI 1,695 6,036 2.4 -0.6 20.6 -6.4 8.8 7.7 0.9 0.9 10.6 11.8
Alam Sutera Relaty ASRI 344 6,759 -0.6 2.4 12.4 3.6 6.3 6.2 0.6 0.7 10.8 11.2
Ciputra Development CTRA 1,120 20,788 5.2 -1.3 20.4 12.0 15.9 20.1 1.3 1.4 8.5 7.0
Lippo Karawaci LPKR 270 7,618 -3.6 5.0 5.0 0.1 8.9 6.9 0.3 0.4 3.3 5.6
Pembangunan Perumahan PTPP 2,230 13,826 2.3 -2.6 18.6 21.2 7.5 8.8 0.9 1.0 12.4 12.5
Pakuwon Jati PWON 750 36,120 2.7 -3.2 10.3 41.5 11.7 15.9 2.4 2.9 22.2 19.1
Summarecon Agung SMRA 1,205 17,384 3.0 -5.1 15.3 31.0 25.9 49.1 1.7 2.7 6.7 5.4
Wijaya Karya WIKA 2,420 21,707 3.4 0.4 10.0 84.0 8.6 14.3 1.0 1.5 12.6 10.8
Waskita Karya WSKT 2,000 27,148 2.8 -1.0 11.4 3.9 5.8 6.6 1.3 1.3 24.8 20.4
MISCELLANEOUS
Astra International ASII 7,375 298,566 1.7 -3.0 4.2 16.1 15.4 13.4 2.4 2.2 16.6 16.5
Source: Bloomberg, Mirae Asset Sekuritas Indonesia
*Note: Valuation metrics based on Bloomberg consensus estimates
28 Juni, 2019
18
Embun Pagi
Mirae Asset Sekuritas Indonesia
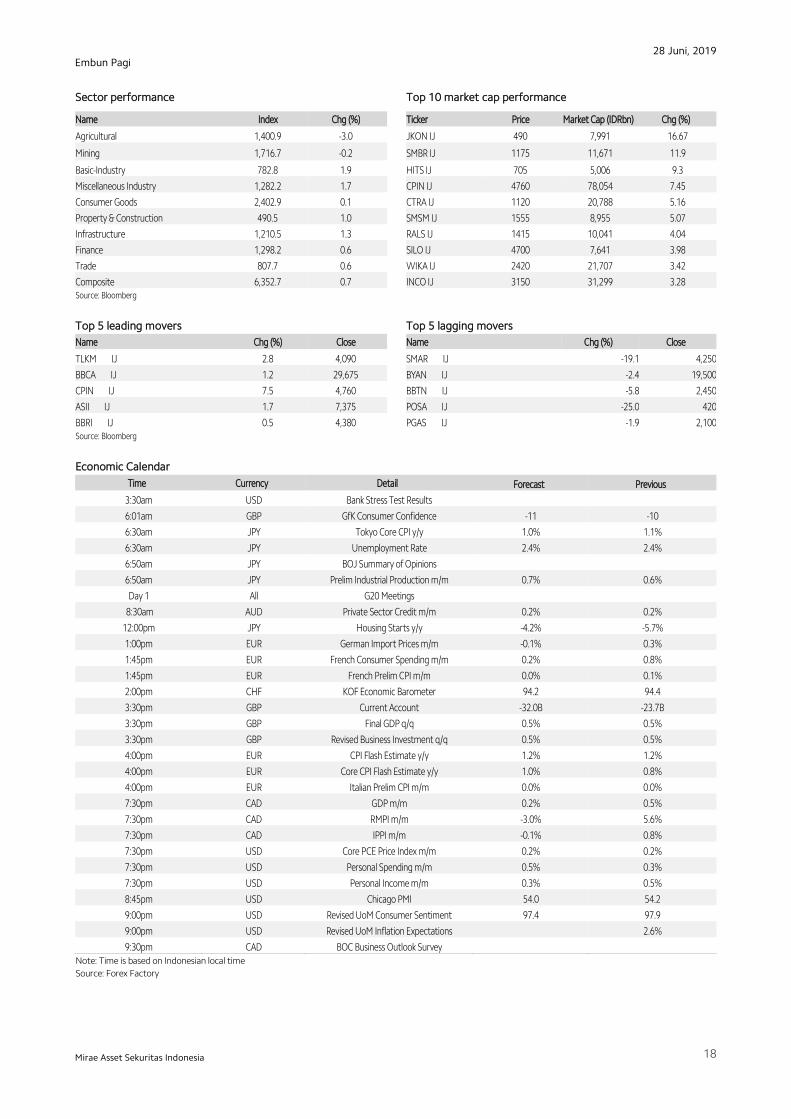
Sector performance Top 10 market cap performance
Name Index Chg (%) Ticker Price Market Cap (IDRbn) Chg (%)
Agricultural 1,400.9 -3.0 JKON IJ 490 7,991 16.67
Mining 1,716.7 -0.2
SMBR IJ 1175 11,671 11.9
Basic-Industry 782.8 1.9 HITS IJ 705 5,006 9.3
Miscellaneous Industry 1,282.2 1.7 CPIN IJ 4760 78,054 7.45
Consumer Goods 2,402.9 0.1 CTRA IJ 1120 20,788 5.16
Property & Construction 490.5 1.0
SMSM IJ 1555 8,955 5.07
Infrastructure 1,210.5 1.3 RALS IJ 1415 10,041 4.04
Finance 1,298.2 0.6 SILO IJ 4700 7,641 3.98
Trade 807.7 0.6 WIKA IJ 2420 21,707 3.42
Composite 6,352.7 0.7 INCO IJ 3150 31,299 3.28 Source: Bloomberg
Top 5 leading movers Top 5 lagging movers
Name Chg (%) Close Name Chg (%) Close
TLKM IJ 2.8 4,090 SMAR IJ -19.1 4,250
BBCA IJ 1.2 29,675 BYAN IJ -2.4 19,500
CPIN IJ 7.5 4,760 BBTN IJ -5.8 2,450
ASII IJ 1.7 7,375 POSA IJ -25.0 420
BBRI IJ 0.5 4,380 PGAS IJ -1.9 2,100 Source: Bloomberg
Economic Calendar
Time Currency Detail Forecast Previous
3:30am USD Bank Stress Test Results
6:01am GBP GfK Consumer Confidence -11 -10
6:30am JPY Tokyo Core CPI y/y 1.0% 1.1%
6:30am JPY Unemployment Rate 2.4% 2.4%
6:50am JPY BOJ Summary of Opinions
6:50am JPY Prelim Industrial Production m/m 0.7% 0.6%
Day 1 All G20 Meetings
8:30am AUD Private Sector Credit m/m 0.2% 0.2%
12:00pm JPY Housing Starts y/y -4.2% -5.7%
1:00pm EUR German Import Prices m/m -0.1% 0.3%
1:45pm EUR French Consumer Spending m/m 0.2% 0.8%
1:45pm EUR French Prelim CPI m/m 0.0% 0.1%
2:00pm CHF KOF Economic Barometer 94.2 94.4
3:30pm GBP Current Account -32.0B -23.7B
3:30pm GBP Final GDP q/q 0.5% 0.5%
3:30pm GBP Revised Business Investment q/q 0.5% 0.5%
4:00pm EUR CPI Flash Estimate y/y 1.2% 1.2%
4:00pm EUR Core CPI Flash Estimate y/y 1.0% 0.8%
4:00pm EUR Italian Prelim CPI m/m 0.0% 0.0%
7:30pm CAD GDP m/m 0.2% 0.5%
7:30pm CAD RMPI m/m -3.0% 5.6%
7:30pm CAD IPPI m/m -0.1% 0.8%
7:30pm USD Core PCE Price Index m/m 0.2% 0.2%
7:30pm USD Personal Spending m/m 0.5% 0.3%
7:30pm USD Personal Income m/m 0.3% 0.5%
8:45pm USD Chicago PMI 54.0 54.2
9:00pm USD Revised UoM Consumer Sentiment 97.4 97.9
9:00pm USD Revised UoM Inflation Expectations 2.6%
9:30pm CAD BOC Business Outlook Survey Note: Time is based on Indonesian local time
Source: Forex Factory
28 Juni, 2019
19
Embun Pagi
Mirae Asset Sekuritas Indonesia
Disclaimers
This report is prepared strictly for private circulation only to clients of PT Mirae Asset Sekuritas Indonesia (MASI). It is purposed only to person having
professional experience in matters relating to investments. The information contained in this report has been taken from sources which we deem reliable. No
warranty (express or implied) is made to the accuracy or completeness of the information. All opinions and estimates included in this report constitute our
judgments as of this date, without regards to its fairness, and are subject to change without notice. However, none of MASI and/or its affiliated companies
and/or their respective employees and/or agents makes any representation or warranty (express or implied) or accepts any responsibility or liability as to, or
in relation to, the accuracy or completeness of the information and opinions contained in this report or as to any information contained in this report or any
other such information or opinions remaining unchanged after the issue thereof. We expressly disclaim any responsibility or liability (express or implied) of
MASI, its affiliated companies and their respective employees and agents whatsoever and howsoever arising (including, without limitation for any claims,
proceedings, action, suits, losses, expenses, damages or costs) which may be brought against or suffered by any person as a results of acting in reliance upon
the whole or any part of the contents of this report and neither MASI, its affiliated companies or their respective employees or agents accepts liability for any
errors, omissions or misstatements, negligent or otherwise, in the report and any liability in respect of the report or any inaccuracy therein or omission there
from which might otherwise arise is hereby expresses disclaimed.
This document is not an offer to sell or a solicitation to buy any securities. This firms and its affiliates and their officers and employees may have a position,
make markets, act as principal or engage in transaction in securities or related investments of any company mentioned herein, may perform services for or
solicit business from any company mentioned herein, and may have acted upon or used any of the recommendations herein before they have been provided
to you. © PT Mirae Asset Sekuritas Indonesia 2016.