27 november 2014/media/... · merchandising, menu composition, pricing and promotions is showing...
TRANSCRIPT

27 November 2014
SSP GROUP PLC
Results for the year ended 30 September 2014
Good results with profit1 up 21%
SSP Group, a leading operator of food and beverage outlets in travel locations worldwide, announces its financial results for the year ended 30 September 2014.
Highlights:
• Operating profit¹ up 20.8% in constant currency; up 12.3% to £88.5m at actual exchange rates
• Revenue of £1,827.1m, up 4.0% on a constant currency basis; stable at actual exchange rates
• Like‐for‐like sales growth of 3.3%; strong performances in UK, North America and Asia Pacific
• Operating margin¹ up 50 basis points to 4.8%
• Operating cash flow³ generation of £83.3m, an increase of 24.3%
• Continued investment in the business with capital expenditure of £76.0m
• Balance sheet significantly strengthened with year‐end net debt of £371.1m (2.3x 2014 EBITDA)
• New contracts secured included Beijing, Dubai, Sacramento and Stansted airports
• Good early progress in embedding stronger retail disciplines and leveraging best practice and
international scale
Commenting on the results, Kate Swann CEO of SSP said:
“We delivered a good performance across the Group with profit up 21%, and strong sales growth and cash generation. We also strengthened our balance sheet, providing capacity for continued growth.
We made good progress on the implementation of our strategy and are particularly encouraged by the strong growth we achieved during the year in North America and Asia Pacific. We also began to deliver early results from our broad programme of initiatives to drive benefits from our international scale and are encouraged by the opportunities going forward.
We have started the financial year in line with our expectations and looking ahead, whilst a degree of uncertainty always exists around passenger numbers in the short‐term, we are well positioned to benefit from the underlying positive trends in our markets.”
1

Year on Year Change
2014(£m)
ConstantCurrency
Actual FX Rates
Revenue 1,827.1 +4.0% Flat
Like-for-like sales growth n/a +3.3% n/a
Operating profit 1 88.5 +20.8% +12.3%
Profit before tax 1 61.8 n/a +61.4%
Pro-forma profit before tax 1, 2 71.5 n/a +14.0%
Operating cash flow 3 83.3 n/a +24.3%
Net Debt 371.1 n/a -57.4% 1 Stated on an underlying basis, excluding exceptional items and amortisation of intangible assets arising on the acquisition of the Group by EQT in 2006. Please refer to the consolidated income statement for a reconciliation from the underlying to the statutory reported basis
2 Unaudited pro‐forma basis, assuming post IPO financing in place throughout both years 3 Stated on an underlying basis after capital expenditure and tax, and excluding exceptional items CONTACTS: Investor and analyst enquiries Charles King Director of Investor Relations, SSP Group plc On 27 November: +44 (0) 7908 710749 Thereafter: +44 (0) 203 714 5251 E‐mail: charles.king@ssp‐intl.com Media enquiries Jenni Wheller Head of Communications, SSP Group plc On 27 November: +44 (0) 7538 210699 Thereafter: +44 (0) 203 714 5245 E‐mail: jenni.wheller@ssp‐intl.com Katharine Tipper Head of External Communications, SSP Group plc On 27 November: +44 (0) 7947 627521 E‐mail: katharine.tipper@ssp‐intl.com Giles Sanderson / Rob Greening / Lisa Kavanagh Powerscourt +44 (0) 20 7250 1446 ssp@powerscourt‐group.com
2

NOTES TO EDITORS About SSP SSP is a leading operator of food and beverage outlets in travel locations, operating restaurants, bars, cafés, food courts, lounges and convenience stores in airports, train stations, motorway service stations and other leisure locations. With a heritage stretching back over 60 years, today SSP has nearly 30,000 employees, serving approximately a million customers every day. It has business at circa 130 airports and circa 270 rail stations, and operates approximately 2,000 units in 29 countries around the world. SSP operates an extensive portfolio of approximately 300 international, national, local and speciality brands. These include Upper Crust, Starbucks, Caffè Ritazza, Burger King, M&S Simply Food, Millie’s Cookies, O’Learys, Caviar House & Prunier, and leading Asian brands Ajisen Ramen and Saboten, as well as stunning bespoke concepts such as the Montreux Jazz Café in Geneva and the award winning Center Bar at Zurich. The Group’s shares were admitted to trading on the London Stock Exchange’s main market for listed securities on 15 July 2014. www.foodtravelexperts.com
3

Business review Overview This year, we delivered a good set of financial results driven by the early implementation of our strategy. We made solid progress in all regions and are particularly encouraged by the strong growth in North America and Asia Pacific. Good financial results The Group delivered good profit growth on all measures, with underlying operating profit increasing by 20.8% on a constant currency basis and by 12.3% to £88.5m at actual exchange rates. Our underlying operating margin increased by 0.5% to 4.8%, benefiting from higher gross margins and improved operational efficiency. This reflects the good early progress made in embedding stronger retail disciplines across the business and leveraging group‐wide best practice and international scale. Revenue increased by 4.0% on a constant currency basis. At actual exchange rates, given the strengthening of Sterling during the year, total revenue was unchanged at £1,827.1m. Like‐for‐like sales grew by 3.3%, with strong performances in the UK, North America and Asia Pacific, albeit trading conditions were more challenging in France, Germany and Egypt. Net contract gains were 0.7%, driven by growth in North America from new contract wins. We generated healthy cash flow, providing a platform for continued re‐investment in the business as well as enabling a further reduction in leverage. Underlying operating cash flow increased by 24.3% to £83.3m, and we continued to invest across the Group, particularly in North America and the Rest of the World, with capital expenditure of £76.0m. We have significantly strengthened our balance sheet during the year, with year‐end net debt down to £371.1m, reflecting both the proceeds received from the IPO and our strong operating cash flow. Strategy Our strategy is focused on creating long term sustainable value for our shareholders, delivered through five key levers. We have made progress on each of these levers in the year:
1. Driving our like‐for‐like sales growth We operate in the travel food and beverage market, which has a number of long‐term structural growth drivers, such as increasing passenger numbers, and we aim to capitalise on this underlying momentum by using our retail skills to drive profitable like‐for‐like sales growth. We saw solid sales growth in all of our major regions during the year, including strong growth in North America and Asia Pacific. Our increased focus on ‘retail basics’, including enhancing the customer offer through range management, merchandising, menu composition, pricing and promotions is showing encouraging early progress.
2. Growing profitable new space Net contract gains contributed 0.7% to sales growth during the year. We opened 48 net new units during the year, which included a substantial opening programme in North America, notably at Phoenix and JFK airports. The Group maintained its good track record of contract retention, securing the renewals of a number of important contracts, including those at Newcastle, Athens and Lyon airports. We also made progress in terms of business development, winning new contracts at Beijing, Dubai, Sacramento and Stansted airports.
4

Our contract wins and renewals were supported by the further enhancements we made to our brand and concept portfolio in the year. New partnerships have been secured, for example, with the global media brand CNN, and new concepts have been developed with a number of partners, for example James Martin, the popular British chef. We also strengthened our existing partnerships with a number of major brands, including introducing new and innovative versions of tried and tested brands such as “YO! To Go” and “M&S Food to Go”, and extending our international agreement with Starbucks for a further five years.
3. Optimising gross margins Gross margin improved by 0.1%, as we seek to maximise the opportunities that being a large international organisation presents. These opportunities relate not only to procurement, where we will continue to focus on simplification and rationalisation of recipes and ranges as we move increasingly from local to global purchasing deals, but also to the sharing of best practice across geographies, with a focus on investing in new point of sale and stock management systems to reduce waste and losses.
4. Running an efficient and effective organisation We aim to manage the business efficiently and effectively, maintaining the highest standards of operational execution. During the last twelve months we delivered material improvements in our efficiency, with a broad range of initiatives contributing to a 50 basis point operating margin improvement. As well as initiating projects in several countries aimed at improving our scheduling, we have continued to review overheads, including through the relocation of our Group head office and the increasing use of shared services across the business. During the year, we incurred exceptional redundancy and other restructuring costs of £9.5m in connection with this. We are increasingly using technology to reduce other local overheads, including through employing digital technology to capture customer feedback and the use of ‘smartsafes’ to more efficiently count cash at our larger locations.
5. Optimising investment utilising best practice and shared resource The final lever of our strategy is to put in place processes and resources to ensure that we optimise our returns on investments, utilising our global experience and adhering to best practice so that we procure more effectively and make better decisions. With this objective in mind, we have reinforced our central team during the year to provide stronger commercial support to the business, with the appointment of new senior managers with responsibility for group‐wide Marketing, Brands and Concepts, and Capital Projects. We have also invested in our systems to enable more effective benchmarking and sharing of information to facilitate more effective decision‐making. Summary and outlook SSP has had a good year, delivering profit up 21% and strong cash generation. We also strengthened our balance sheet, providing capacity for continued growth. We have started the financial year in line with our expectations and looking ahead, whilst a degree of uncertainty always exists around passenger numbers in the short‐term, we are well positioned to benefit from the underlying positive trends in our markets.
5
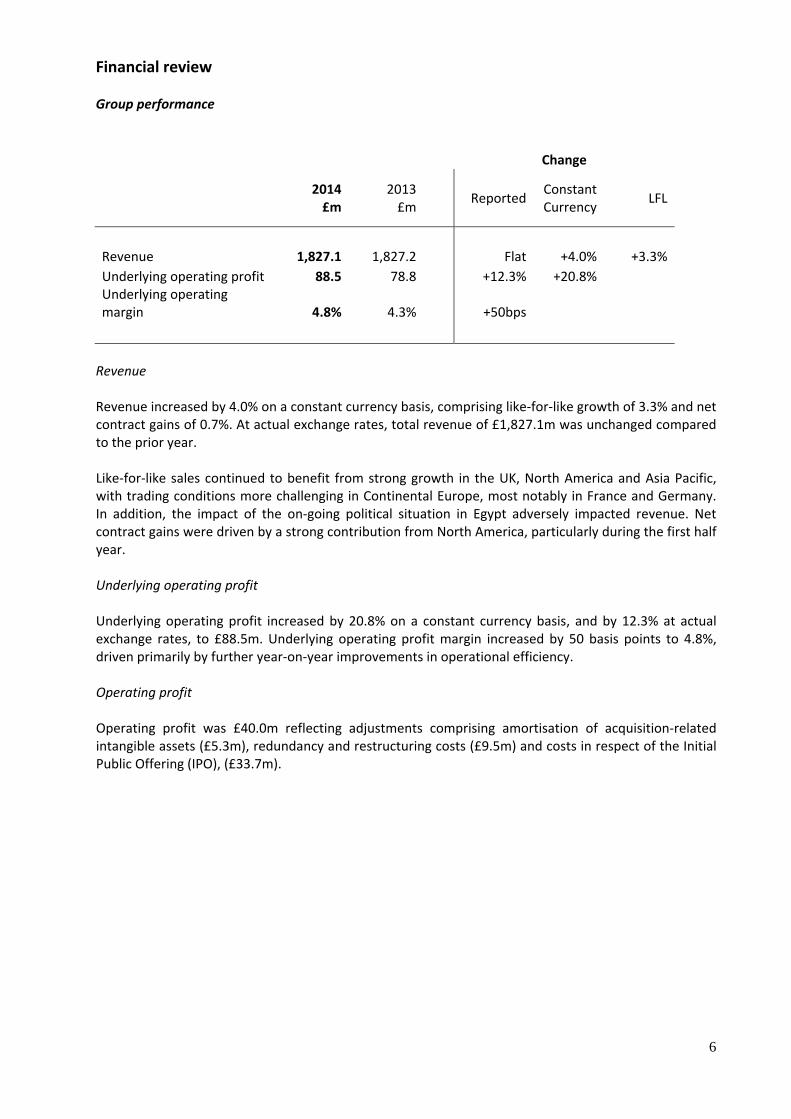
Financial review Group performance Change
2014£m
2013£m
Reported Constant
Currency LFL
Revenue 1,827.1 1,827.2 Flat +4.0% +3.3%Underlying operating profit 88.5 78.8 +12.3% +20.8% Underlying operating margin 4.8% 4.3% +50bps Revenue Revenue increased by 4.0% on a constant currency basis, comprising like‐for‐like growth of 3.3% and net contract gains of 0.7%. At actual exchange rates, total revenue of £1,827.1m was unchanged compared to the prior year. Like‐for‐like sales continued to benefit from strong growth in the UK, North America and Asia Pacific, with trading conditions more challenging in Continental Europe, most notably in France and Germany. In addition, the impact of the on‐going political situation in Egypt adversely impacted revenue. Net contract gains were driven by a strong contribution from North America, particularly during the first half year. Underlying operating profit Underlying operating profit increased by 20.8% on a constant currency basis, and by 12.3% at actual exchange rates, to £88.5m. Underlying operating profit margin increased by 50 basis points to 4.8%, driven primarily by further year‐on‐year improvements in operational efficiency. Operating profit Operating profit was £40.0m reflecting adjustments comprising amortisation of acquisition‐related intangible assets (£5.3m), redundancy and restructuring costs (£9.5m) and costs in respect of the Initial Public Offering (IPO), (£33.7m).
6

Regional performance UK
Change
2014 £m
2013 £m
Reported Constant
Currency LFL
Revenue 720.5 709.0 +1.6% +1.9% +4.1%Underlying operating profit 40.0 34.3 +16.6% +17.2% Underlying operating margin 5.6% 4.8% +80bps
N.B. UK division also includes Republic of Ireland
Revenue increased by 1.9% on a constant currency basis, comprising like‐for‐like growth of 4.1% and net contract losses of 2.2%. Like‐for‐like growth was particularly strong in the air sector, helped by the continued growth in UK airport passenger numbers over the last twelve months. The net contract losses were primarily a consequence of the loss of an on‐board rail contract during the year, together with the effect of the closure of a number of loss‐making or marginally profitable units. Underlying operating profit for the UK increased by 17.2% at constant currency and 16.6% at actual exchange rates to £40.0m, while underlying operating margin increased by 80 basis points to 5.6%. As our largest business, the UK has been an early beneficiary of a number of programmes initiated during 2014, which have been successful in improving gross margins and reducing our operating cost base. Continental Europe Change
2014
£m2013 £m
Reported Constant
Currency LFL
Revenue 803.5 833.9
‐3.6% +1.7% +1.1%Underlying operating profit 57.4 54.0 +6.3% +15.0% Underlying operating margin 7.1% 6.5% +60bps Revenue increased by 1.7% on a constant currency basis, comprising like‐for‐like growth of 1.1% and net contract gains of 0.6%. The like‐for‐like improvement included strong growth in Nordic and Spanish airports, offset by like‐for‐like revenue falls in France and Germany, primarily as a result of weaker consumer expenditure in both countries. At actual exchange rates, total revenue of £803.5m fell by 3.6%, reflecting the strengthening of Sterling against the Euro and Nordic currencies during the period. Underlying operating profit for Continental Europe increased by 15.0% on a constant currency basis and by 6.3% at actual exchange rates to £57.4m, and underlying operating margin increased by 60 basis points to 7.1%. Both France and Germany benefited from strategic initiatives which delivered good margin improvements, in the face of challenging passenger numbers and consumer spending trends.
7

North America Change
2014 £m
2013 £m
Reported Constant
Currency LFL
Revenue 168.0 151.6
+10.8% +19.8% +5.9%Underlying operating loss (0.1) (1.2) n/a n/a Underlying operating margin (0.1%) (0.8%) +70bps Revenue increased by 19.8% on a constant currency basis, comprising like‐for‐like growth of 5.9% and net contract gains of 13.9%. The like‐for‐like growth included a strong contribution from JFK Terminal 4 in New York, which benefited from additional passenger numbers following the extension to the terminal in May last year. Net contract gains were driven principally by the on‐going programme of unit openings at Phoenix and JFK. At actual exchange rates, total revenue of £168.0m grew by 10.8%, reflecting the strengthening of Sterling versus the US and Canadian dollars during the year. The underlying operating loss for North America was significantly reduced to £0.1m (compared with a loss of £1.2m in the prior year), and underlying operating margin improved by 70 basis points to ‐0.1%. Profit margins in North America continue to be impacted by start‐up costs, as new units in a number of major contracts were mobilised during the year. Rest of the World Change
2014 £m
2013 £m
Reported Constant
Currency LFL
Revenue 135.1 132.7
+1.8% +11.2% +8.8%Underlying operating profit 12.7 13.4 ‐5.2% +5.8% Underlying operating margin 9.4% 10.1% ‐70bps Revenue increased by 11.2% on a constant currency basis, comprising like‐for‐like growth of 8.8% and net contract gains of 2.4%. The like‐for‐like increase included particularly strong growth of 13.0% in the Asia Pacific region, which benefited from buoyant passenger numbers, and this offset the effect of a like‐for‐like revenue decline in Egypt as a result of the on‐going political situation there. At actual exchange rates, total revenue of £135.1m grew by 1.8% compared to the prior year.
Underlying operating profit for the Rest of the World increased by 5.8% on a constant currency basis, but fell by 5.2% at actual exchange rates to £12.7m. Underlying operating margin was 70 basis points lower at 9.4%, principally reflecting the on‐going investment in the development of our business in China.
8

Share of profit of associates
The Group’s share of profit of associates reduced by £0.9m to £1.5m (2013: £2.4m). This reduction primarily reflected the disposal of its minority shareholding in Momentum Services Ltd. Net finance costs Underlying net finance costs of £28.2m reduced by £14.7m (2013: £42.9m), due to lower average levels of net debt, primarily reflecting the significant repayment of borrowings following the IPO during July, and lower average interest costs due to the expiry of interest rate swaps during the prior year. Exceptional finance costs of £26.1m comprised adjustments of £22.1m arising from the refinancing which accompanied the IPO, including a £32.0m settlement of obligations arising under the Group’s previous financing structure and an exceptional credit of £14.5m relating to an effective interest rate adjustment on the pre‐IPO loans. They also included an exceptional charge of £4.0m in relation to terminating interest rate swap contracts. Taxation The Group’s underlying tax charge for the year was £17.9m (2013: £14.0m), equivalent to an effective tax rate of 29%. The Group’s post exceptional tax charge for the year was £14.3m (2013: £13.9m), reflecting a small benefit from tax relief on some exceptional costs. Earnings per share Underlying earnings per share, which excludes the impact of exceptional items and the amortisation of intangible assets arising on the acquisition of the Group by EQT in 2006, was 13.3 pence per share. This is based on the weighted average number of shares in issue during the year. Underlying earnings per share calculated using the post IPO number of shares in issue of 475.0m would have been 8.4 pence per share. Dividends A dividend has not been proposed (2013: £nil). As signalled at the time of the IPO, in the absence of unforeseen circumstances, the current intention of the Board is that the first dividend to be declared by the Company will be in respect of the six months ending 31 March 2015. If declared, this dividend would be paid during the second half of the 2015 financial year.
9
Cash flow
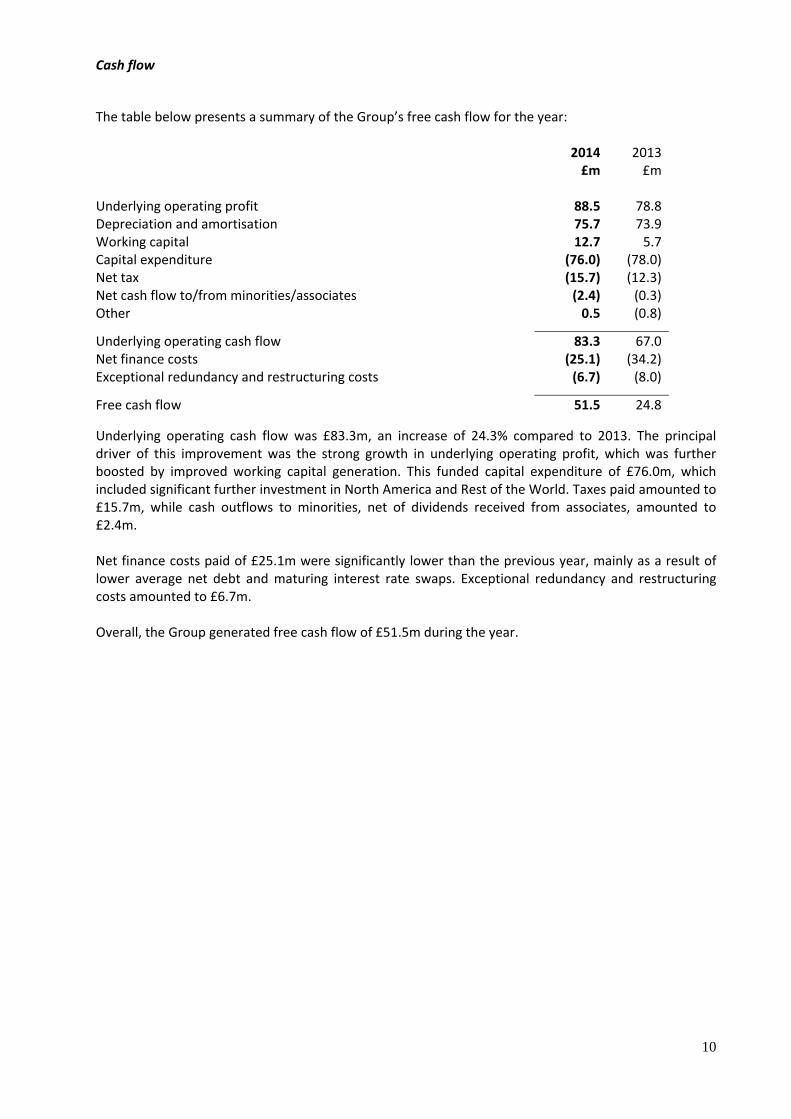
The table below presents a summary of the Group’s free cash flow for the year:
2014 2013 £m £m
Underlying operating profit 88.5 78.8 Depreciation and amortisation 75.7 73.9 Working capital 12.7 5.7 Capital expenditure (76.0) (78.0) Net tax (15.7) (12.3) Net cash flow to/from minorities/associates (2.4) (0.3) Other 0.5 (0.8)
Underlying operating cash flow 83.3 67.0 Net finance costs (25.1) (34.2) Exceptional redundancy and restructuring costs (6.7) (8.0)
Free cash flow 51.5 24.8
Underlying operating cash flow was £83.3m, an increase of 24.3% compared to 2013. The principal driver of this improvement was the strong growth in underlying operating profit, which was further boosted by improved working capital generation. This funded capital expenditure of £76.0m, which included significant further investment in North America and Rest of the World. Taxes paid amounted to £15.7m, while cash outflows to minorities, net of dividends received from associates, amounted to £2.4m. Net finance costs paid of £25.1m were significantly lower than the previous year, mainly as a result of lower average net debt and maturing interest rate swaps. Exceptional redundancy and restructuring costs amounted to £6.7m. Overall, the Group generated free cash flow of £51.5m during the year.
10

Balance sheet and net debt
The IPO, together with the Group’s cash generation, significantly strengthened the Group’s balance sheet, with year‐end net debt reducing to £371.1m (2013: £870.4m) and net assets increasing to £250.4m (2013: net liabilities of £195.1m). The table below explains the reduction in net debt during the year: £m £m Opening net debt (1 October 2013) (870.4) Free cash flow 51.5Net IPO proceeds to de‐lever:
‐ Gross issue proceeds 467.1 ‐ Less: settlement to B1 investors (32.0) ‐ Less: other transaction expenses (31.7)
403.4Impact of foreign exchange rates 43.9Other 0.5 Closing net debt (30 September 2014) (371.1) The gross IPO issue proceeds of £467.1m funded £63.7m of exceptional costs relating to the transaction and its associated refinancing. These exceptional costs included £32.0m paid in settlement of obligations to the Group’s former B1 lenders under its previous financing arrangements. The remaining IPO issue proceeds were used, in the main, to repay the borrowings of the Group’s non‐UK subsidiaries. Overall a combination of the net IPO proceeds of £403.4m, amounts borrowed under the new bank loans of £510.0m and existing cash on the balance sheet of £96.4m were used to repay the Group’s previous bank debt of £1,009.8m as at July 2014. In addition to the effect of the IPO, net debt was further reduced during the year by the free cash flow generation of £51.5m, together with £43.9m of foreign exchange gains, mainly arising on the proportion of the Group’s previous bank debt that was denominated in currencies other than Sterling. As a result of the Group’s strong cash generation during the final quarter, year‐end net debt was £371.1m, which represented leverage of 2.3x underlying EBITDA, approximately 0.5x lower than when the IPO completed in July. The Group’s new borrowing facilities, which mature in July 2019, comprise multi‐currency term loans totalling £508.3m at year end exchange rates, together with a committed Revolving Credit Facility (RCF) of £75.0m. The term loans accrue cash‐pay interest based on floating LIBOR (or equivalent benchmark rates), plus a margin. The RCF was undrawn at year end, and together with the cash on our balance sheet of £133.3m, will provide ample headroom to meet future development and funding needs. Our policy is to hedge the majority of our interest rate risk as we aim to have predictable borrowing costs. We therefore entered into new interest rate swap contracts during September 2014 which exchanged 90% of the Group’s interest rate exposure from floating to fixed rates for the next two years and 75% for the remaining term of our facilities.
11

Consolidated income statement for the year ended 30 September 2014 Notes 2014 2014 2014 2013 2013 2013
Underlying * Adjustments Total Underlying * Adjustments Total
£m £m £m £m £m £m Revenue 2 1,827.1 ‐ 1,827.1 1,827.2 ‐ 1,827.2Operating costs 4 (1,738.6) (48.5) (1,787.1) (1,748.4) (11.6) (1,760.0)
Operating profit 88.5 (48.5) 40.0 78.8 (11.6) 67.2
Share of profit of associates
1.5 ‐ 1.5 2.4 ‐ 2.4
Goodwill written off on closure of business units
‐ ‐ ‐ ‐ (10.5) (10.5)
Loss on disposal of business
‐ (0.7) (0.7) ‐ ‐ ‐
Finance income 5 0.8 ‐ 0.8 1.6 ‐ 1.6Finance expense 5 (29.0) (26.1) (55.1) (44.5) ‐ (44.5)
Profit / (loss) before tax
61.8 (75.3) (13.5) 38.3 (22.1) 16.2
Taxation 6 (17.9) 3.6 (14.3) (14.0) 0.1 (13.9)
Profit / (loss) for the year
43.9 (71.7) (27.8) 24.3 (22.0) 2.3
Profit / (loss) attributable to:
Equity holders of the parent 39.8 (71.7) (31.9) 20.8 (22.0) (1.2)
Non‐controlling interests
4.1 ‐ 4.1 3.5 ‐ 3.5
Profit / (loss) for the year
43.9 (71.7) (27.8) 24.3 (22.0) 2.3
Earnings / (loss) per share (pence):
‐ Basic 3 13.3 (10.7) 8.2 (0.5)
‐ Diluted 3 13.3 (10.7) 8.2 (0.5)
* Underlying operating profit and underlying profit / (loss) exclude items that are considered to be exceptional in nature. For the years reported above, these comprised redundancy and restructuring costs, costs in respect of the IPO and associated refinancing, a goodwill write off, and costs related to acquisitions and disposals of businesses. They also excluded non‐cash accounting adjustments relating to amortisation of intangible assets arising on acquisition of the Group by EQT in 2006
.
12

Consolidated statement of other comprehensive income for the year ended 30 September 2014
2014 2013£m £m
Other comprehensive income / (expense)
Items that will never be reclassified to the income statement
Remeasurements on defined benefit pension schemes (3.9) (1.1)
Items that are or may be reclassified subsequently to the income statement
Net gain / (loss) on hedge of net investment in foreign operations 22.2 (9.0)Other foreign exchange translation differences (15.7) (7.0)Effective portion of changes in fair value of cash flow hedges (2.6) (0.1)Cash flow hedges ‐ reclassifed to profit and loss 7.0 6.8Income tax relating to items that have or may be reclassified (0.9) ‐
Other comprehensive income / (expense) for the year 6.1 (10.4)(Loss) / profit for the year (27.8) 2.3
Total comprehensive expense for the year (21.7) (8.1)
Total comprehensive (expense) / income attributable to:Equity holders of the parent (24.6) (11.4)Non‐controlling interests 2.9 3.3
Total comprehensive expense for the year (21.7) (8.1)
13

Consolidated balance sheet As at 30 September 2014
Note 2014 2013£m £m
Non‐current assets Property, plant and equipment 201.9 210.0Goodwill and intangible assets 659.0 694.8Investments in associates 4.6 5.3Deferred tax assets 2.5 3.0Other receivables 27.9 24.2
895.9 937.3Current assets Inventories 24.4 24.8Tax receivable 0.5 0.2Trade and other receivables 89.1 86.7Cash and cash equivalents 133.3 182.1
247.3 293.8
Total assets 1,143.2 1,231.1
Current liabilities Short term borrowings 7 (29.8) (1.4)Trade and other payables (340.8) (321.5)Tax payable (9.2) (12.5)
(379.8) (335.4)Non‐current liabilities Long term borrowings 7 (474.6) (1,051.1)Other payables ‐ (0.4)Post employment benefit obligations (17.9) (15.0)Provisions (11.6) (12.8)Derivative financial liabilities (0.9) (5.4)Deferred tax liabilities (8.0) (6.1)
(513.0) (1,090.8)
Total liabilities (892.8) (1,426.2)
Net assets / (liabilities) 250.4 (195.1)
Equity Share capital 8 5.9 5.4Share premium 8 461.2 642.9Translation reserve 6.5 (0.3)Cash flow hedging reserve (0.9) (5.3)Retained earnings (241.4) (857.6)
Total equity shareholders’ funds 231.3 (214.9)Non‐controlling interests 19.1 19.8
Total equity 250.4 (195.1)
14

Consolidated statement of changes in equity for the year ended 30 September 2014
Share capital
Share premium
Translation reserve
Cash flow
hedging reserve
Retained earnings
Total parent equity
Non‐controlling interests
Total equity
£m £m £m £m £m £m £m £m
At 1 October 2012 5.4 642.8 15.5 (12.0) (855.3) (203.6) 10.2 (193.4)
(Loss) / profit for the year ‐ ‐ ‐ ‐ (1.2) (1.2) 3.5 2.3Other comprehensive (expense)/income for the year
‐ ‐ (15.8) 6.7 (1.1) (10.2) (0.2) (10.4)
Shares issued in the period ‐ 0.1 ‐ ‐ ‐ 0.1 ‐ 0.1
Dividends paid to minorities ‐ ‐ ‐ ‐ ‐ ‐ (2.5) (2.5)
Capital contribution from minorities ‐ ‐ ‐ ‐ ‐ ‐ 8.8 8.8
At 30 September 2013 5.4 642.9 (0.3) (5.3) (857.6) (214.9) 19.8 (195.1)
(Loss) / profit for the year ‐ ‐ ‐ ‐ (31.9) (31.9) 4.1 (27.8)Other comprehensive income/(expense) for the year
‐ ‐ 6.8 4.4 (3.9) 7.3 (1.2) 6.1
Capital reduction (note 8) (4.2) (642.9) ‐ ‐ 647.1 ‐ ‐ ‐Capital reorganisation (note 8) 2.5 ‐ ‐ ‐ (2.5) ‐ ‐ ‐
Shares issued in the period (note 8) 2.2 461.2 ‐ ‐ ‐ 463.4 ‐ 463.4
Dividends paid to minorities ‐ ‐ ‐ ‐ ‐ ‐ (3.6) (3.6)
Share‐based payments ‐ ‐ ‐ ‐ 7.4 7.4 ‐ 7.4
At 30 September 2014 5.9 461.2 6.5 (0.9) (241.4) 231.3 19.1 250.4
15
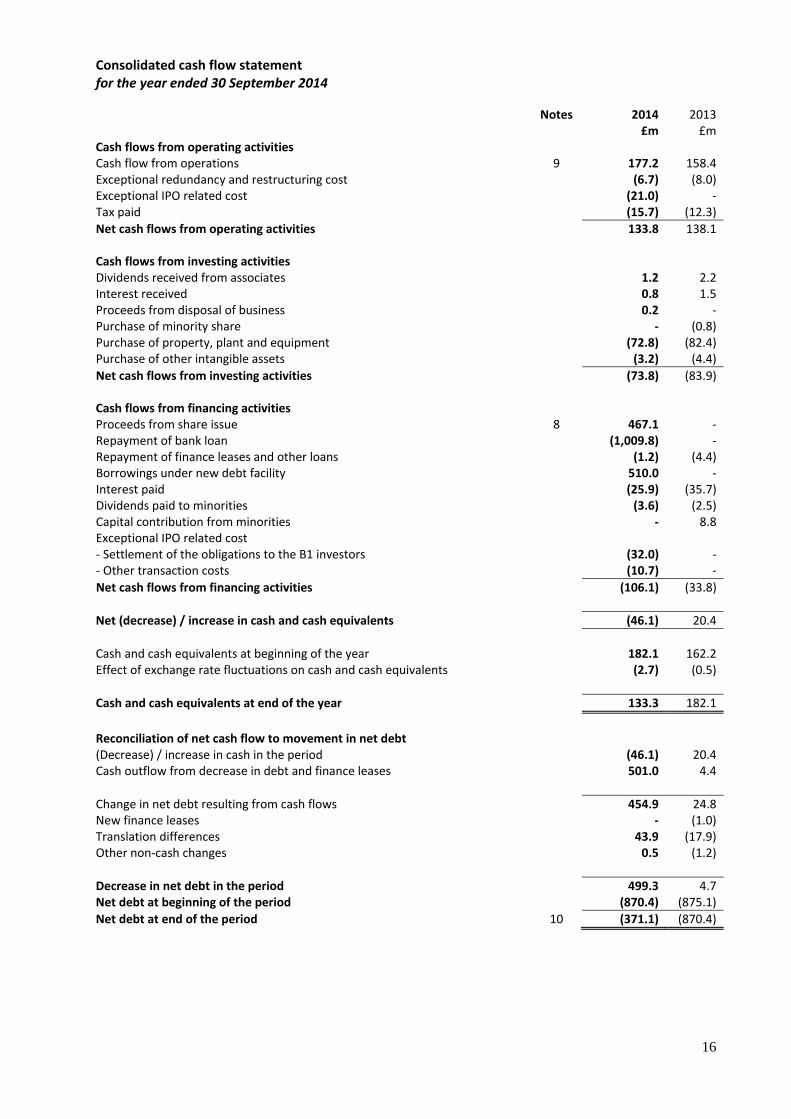
Consolidated cash flow statement for the year ended 30 September 2014
Notes 2014 2013 £m £m
Cash flows from operating activities Cash flow from operations 9 177.2 158.4Exceptional redundancy and restructuring cost (6.7) (8.0)Exceptional IPO related cost (21.0) ‐Tax paid (15.7) (12.3)Net cash flows from operating activities 133.8 138.1
Cash flows from investing activities Dividends received from associates 1.2 2.2Interest received 0.8 1.5Proceeds from disposal of business 0.2 ‐Purchase of minority share ‐ (0.8)Purchase of property, plant and equipment (72.8) (82.4)Purchase of other intangible assets (3.2) (4.4)Net cash flows from investing activities (73.8) (83.9)
Cash flows from financing activities Proceeds from share issue 8 467.1 ‐Repayment of bank loan (1,009.8) ‐Repayment of finance leases and other loans (1.2) (4.4)Borrowings under new debt facility 510.0 ‐Interest paid (25.9) (35.7)Dividends paid to minorities (3.6) (2.5)Capital contribution from minorities ‐ 8.8Exceptional IPO related cost ‐ Settlement of the obligations to the B1 investors (32.0) ‐‐ Other transaction costs (10.7) ‐Net cash flows from financing activities (106.1) (33.8)
Net (decrease) / increase in cash and cash equivalents (46.1) 20.4
Cash and cash equivalents at beginning of the year 182.1 162.2Effect of exchange rate fluctuations on cash and cash equivalents (2.7) (0.5)
Cash and cash equivalents at end of the year 133.3 182.1
Reconciliation of net cash flow to movement in net debt(Decrease) / increase in cash in the period (46.1) 20.4Cash outflow from decrease in debt and finance leases 501.0 4.4
Change in net debt resulting from cash flows 454.9 24.8New finance leases ‐ (1.0)Translation differences 43.9 (17.9)Other non‐cash changes 0.5 (1.2)
Decrease in net debt in the period 499.3 4.7Net debt at beginning of the period (870.4) (875.1)Net debt at end of the period 10 (371.1) (870.4)
16

Notes
1 Accounting policies
The consolidated financial statements of SSP Group plc have been prepared in accordance with International Financial Reporting Standards as adopted by the EU (“IFRS”) and the Companies Act 2006 applicable to companies reporting under IFRS. These financial statements are presented in Sterling and unless stated otherwise, rounded to the nearest £0.1 million. The financial statements are prepared on the historical cost basis except for the derivative financial instruments which are stated at their fair value.
IFRSs not yet applied
The following EU‐endorsed IFRSs have been issued but have not yet been adopted by the Group in preparing these financial statements. Their adoption is not expected to have a material effect on the financial statements unless otherwise indicated: • IFRS 10 Consolidated Financial Statements • IFRS 11 Joint Arrangements • IFRS 12 Disclosure of Interests in Other Entities • Offsetting Financial Assets and Financial Liabilities – Amendments to IAS 32 • Recoverable amount disclosures for non‐financial assets – Amendments to IAS 36
Changes in accounting policy and disclosures
The accounting policies adopted are consistent with those of the previous period except for the following new and amended IFRSs adopted as of 1 October 2013: • Defined Benefit Plans – Amendments to IAS 19 • IFRS 13 Fair Value Measurement
Post employment defined benefit plans
As a result of adopting IAS 19 (2011), the Group’s policy for calculating the income or expense relating to its post‐employment defined benefit plans has changed.
IAS 19 (2011) replaces interest cost on gross pension liabilities and expected return on gross pension assets with a net finance expense/(income) on the net defined benefit liability/(asset) calculated using the rate currently used to discount defined benefit pension liabilities. Previously the Group determined interest return on plan assets based on their long term rate of expected return.
Fair value measurement
IFRS 13 establishes a single framework for measuring fair value and making disclosures about fair value measurements when such measurements are required or permitted by other IFRSs. It unifies the definition of fair value as the price that would be received on the sale of an asset or paid to transfer a liability in an orderly transaction between market participants at the measurement date. It replaces and expands the disclosure requirements about fair value measurements in other IFRSs, including IFRS 7.
As a result the Group has included additional disclosures in this regard. In accordance with the transitional provisions of IFRS 13, the Group has applied the new fair value measurement guidance prospectively and has not provided any comparative information for the new disclosures.
The adoption of these accounting standards has not had a significant impact on the consolidated financial statements of the Group.
17
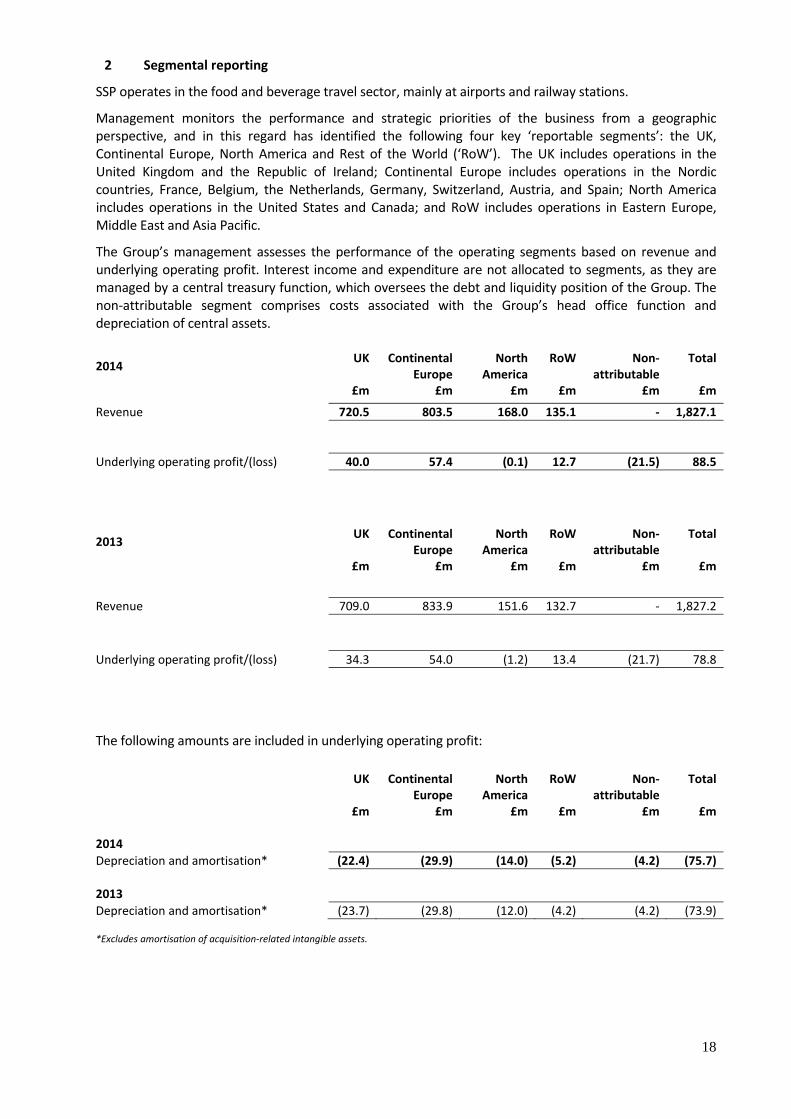
2 Segmental reporting
SSP operates in the food and beverage travel sector, mainly at airports and railway stations.
Management monitors the performance and strategic priorities of the business from a geographic perspective, and in this regard has identified the following four key ‘reportable segments’: the UK, Continental Europe, North America and Rest of the World (‘RoW’). The UK includes operations in the United Kingdom and the Republic of Ireland; Continental Europe includes operations in the Nordic countries, France, Belgium, the Netherlands, Germany, Switzerland, Austria, and Spain; North America includes operations in the United States and Canada; and RoW includes operations in Eastern Europe, Middle East and Asia Pacific.
The Group’s management assesses the performance of the operating segments based on revenue and underlying operating profit. Interest income and expenditure are not allocated to segments, as they are managed by a central treasury function, which oversees the debt and liquidity position of the Group. The non‐attributable segment comprises costs associated with the Group’s head office function and depreciation of central assets.
2014 UK Continental Europe
North America
RoW Non‐attributable
Total
£m £m £m £m £m £m
Revenue 720.5 803.5 168.0 135.1 ‐ 1,827.1
Underlying operating profit/(loss) 40.0 57.4 (0.1) 12.7 (21.5) 88.5
2013 UK Continental Europe
North America
RoW Non‐attributable
Total
£m £m £m £m £m £m
Revenue 709.0 833.9 151.6 132.7 ‐ 1,827.2
Underlying operating profit/(loss) 34.3 54.0 (1.2) 13.4 (21.7) 78.8
The following amounts are included in underlying operating profit:
UK Continental Europe
North America
RoW Non‐attributable
Total
£m £m £m £m £m £m 2014 Depreciation and amortisation* (22.4) (29.9) (14.0) (5.2) (4.2) (75.7) 2013 Depreciation and amortisation* (23.7) (29.8) (12.0) (4.2) (4.2) (73.9) *Excludes amortisation of acquisition‐related intangible assets.
18
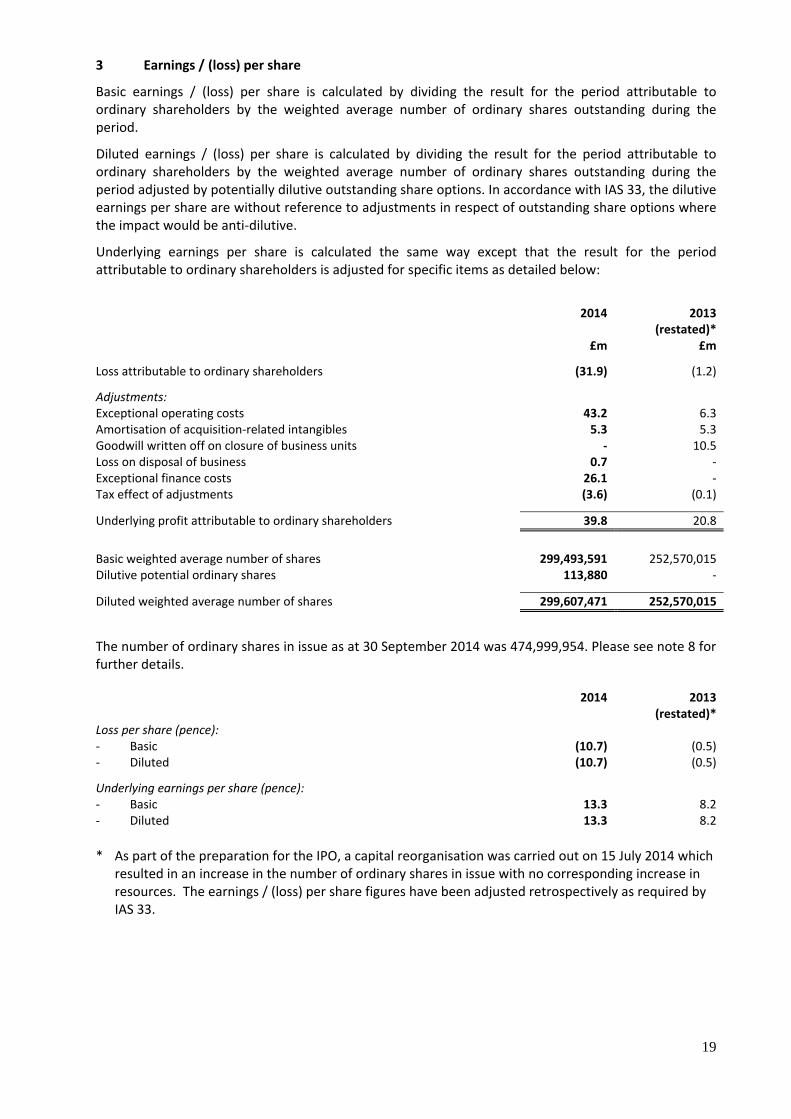
3 Earnings / (loss) per share
Basic earnings / (loss) per share is calculated by dividing the result for the period attributable to ordinary shareholders by the weighted average number of ordinary shares outstanding during the period.
Diluted earnings / (loss) per share is calculated by dividing the result for the period attributable to ordinary shareholders by the weighted average number of ordinary shares outstanding during the period adjusted by potentially dilutive outstanding share options. In accordance with IAS 33, the dilutive earnings per share are without reference to adjustments in respect of outstanding share options where the impact would be anti‐dilutive.
Underlying earnings per share is calculated the same way except that the result for the period attributable to ordinary shareholders is adjusted for specific items as detailed below:
2014 2013
(restated)* £m £m
Loss attributable to ordinary shareholders (31.9) (1.2)
Adjustments: Exceptional operating costs 43.2 6.3Amortisation of acquisition‐related intangibles 5.3 5.3Goodwill written off on closure of business units ‐ 10.5Loss on disposal of business 0.7 ‐ Exceptional finance costs 26.1 ‐ Tax effect of adjustments (3.6) (0.1)
Underlying profit attributable to ordinary shareholders 39.8 20.8
Basic weighted average number of shares 299,493,591 252,570,015Dilutive potential ordinary shares 113,880 ‐
Diluted weighted average number of shares 299,607,471 252,570,015
The number of ordinary shares in issue as at 30 September 2014 was 474,999,954. Please see note 8 for further details.
2014 2013
(restated)* Loss per share (pence): ‐ Basic (10.7) (0.5)‐ Diluted (10.7) (0.5)
Underlying earnings per share (pence): ‐ Basic 13.3 8.2‐ Diluted 13.3 8.2
* As part of the preparation for the IPO, a capital reorganisation was carried out on 15 July 2014 which resulted in an increase in the number of ordinary shares in issue with no corresponding increase in resources. The earnings / (loss) per share figures have been adjusted retrospectively as required by IAS 33.
19
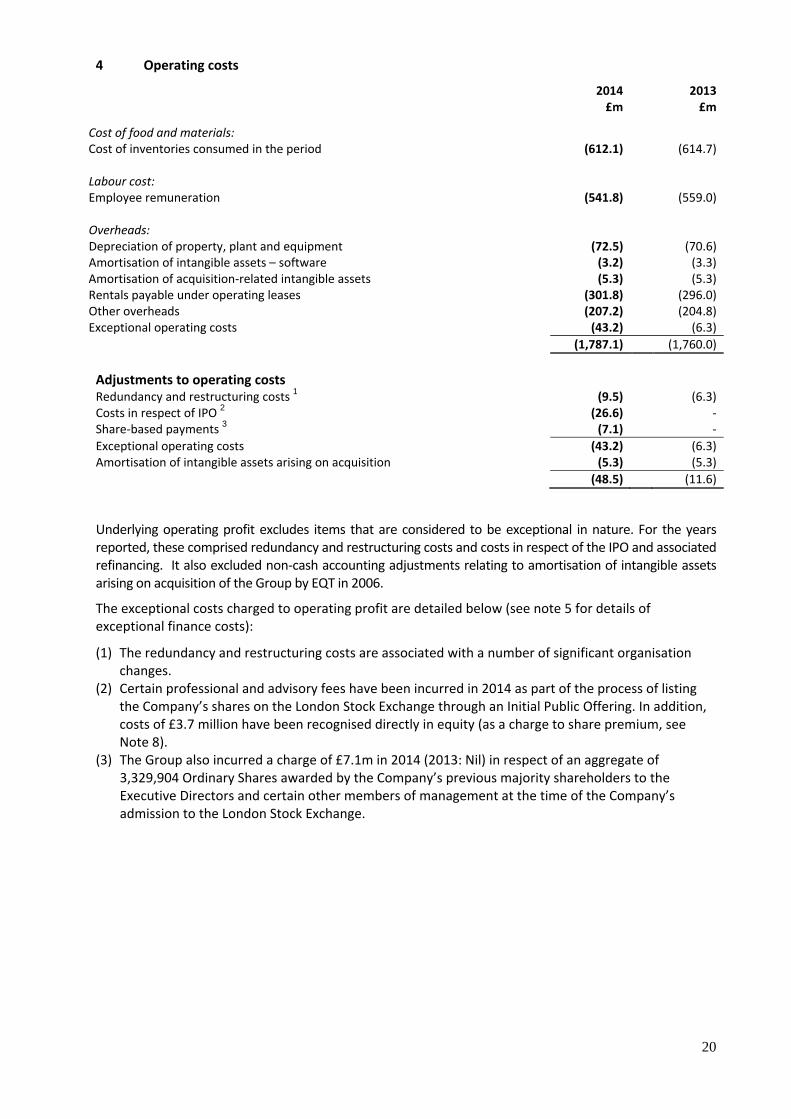
4 Operating costs
2014 2013£m £m
Cost of food and materials: Cost of inventories consumed in the period (612.1) (614.7) Labour cost: Employee remuneration (541.8) (559.0) Overheads: Depreciation of property, plant and equipment (72.5) (70.6)Amortisation of intangible assets – software (3.2) (3.3)Amortisation of acquisition‐related intangible assets (5.3) (5.3)Rentals payable under operating leases (301.8) (296.0)Other overheads (207.2) (204.8)Exceptional operating costs (43.2) (6.3) (1,787.1) (1,760.0) Adjustments to operating costs Redundancy and restructuring costs 1 (9.5) (6.3)Costs in respect of IPO 2 (26.6) ‐Share‐based payments 3 (7.1) ‐Exceptional operating costs (43.2) (6.3)Amortisation of intangible assets arising on acquisition (5.3) (5.3)
(48.5) (11.6)
Underlying operating profit excludes items that are considered to be exceptional in nature. For the years reported, these comprised redundancy and restructuring costs and costs in respect of the IPO and associated refinancing. It also excluded non‐cash accounting adjustments relating to amortisation of intangible assets arising on acquisition of the Group by EQT in 2006.
The exceptional costs charged to operating profit are detailed below (see note 5 for details of exceptional finance costs):
(1) The redundancy and restructuring costs are associated with a number of significant organisation changes.
(2) Certain professional and advisory fees have been incurred in 2014 as part of the process of listing the Company’s shares on the London Stock Exchange through an Initial Public Offering. In addition, costs of £3.7 million have been recognised directly in equity (as a charge to share premium, see Note 8).
(3) The Group also incurred a charge of £7.1m in 2014 (2013: Nil) in respect of an aggregate of 3,329,904 Ordinary Shares awarded by the Company’s previous majority shareholders to the Executive Directors and certain other members of management at the time of the Company’s admission to the London Stock Exchange.
20

5 Finance income and expense
2014 2013£m £m
Finance income
Interest income 0.8 1.5Net interest income on defined benefit pension obligations ‐ 0.1Total finance income 0.8 1.6
Finance expense
Total interest expense on financial liabilities measured at amortised cost 2 3 (44.9) (34.6)Net change in fair value of cash flow hedges utilised in the year (3.0) (6.8)Swap break costs 1 (4.0) ‐Unwind of discount on provisions (1.6) (1.6)Net interest expense on defined benefit pension obligations (0.6) ‐Net foreign exchange losses ‐ (0.5)Other (1.0) (1.0)Total finance expense (55.1) (44.5)
Adjustments to finance expense:
2014 2013£m £m
Swap break costs 1 (4.0) ‐Additional consideration payable to B1 investors 2 (32.0) ‐Other net interest credit 3 9.9 ‐
(26.1) ‐
As explained in note 7, the Company listed its shares on the London Stock Exchange on 15 July 2014 and on the same day restructured its debt facilities, resulting in the following items:
(1) Interest rate swaps were terminated resulting in an exceptional charge of £4.0m.
(2) The Company paid £32.0m additional consideration as settlement of its obligations to the B1 investors.
(3) Unamortised fees of £4.6m relating to the Group’s pre‐IPO financing arrangements were written off in full. In addition, interest accrued of £14.5m relating to an effective interest rate adjustment on the pre‐IPO loans was written back to the income statement.
21
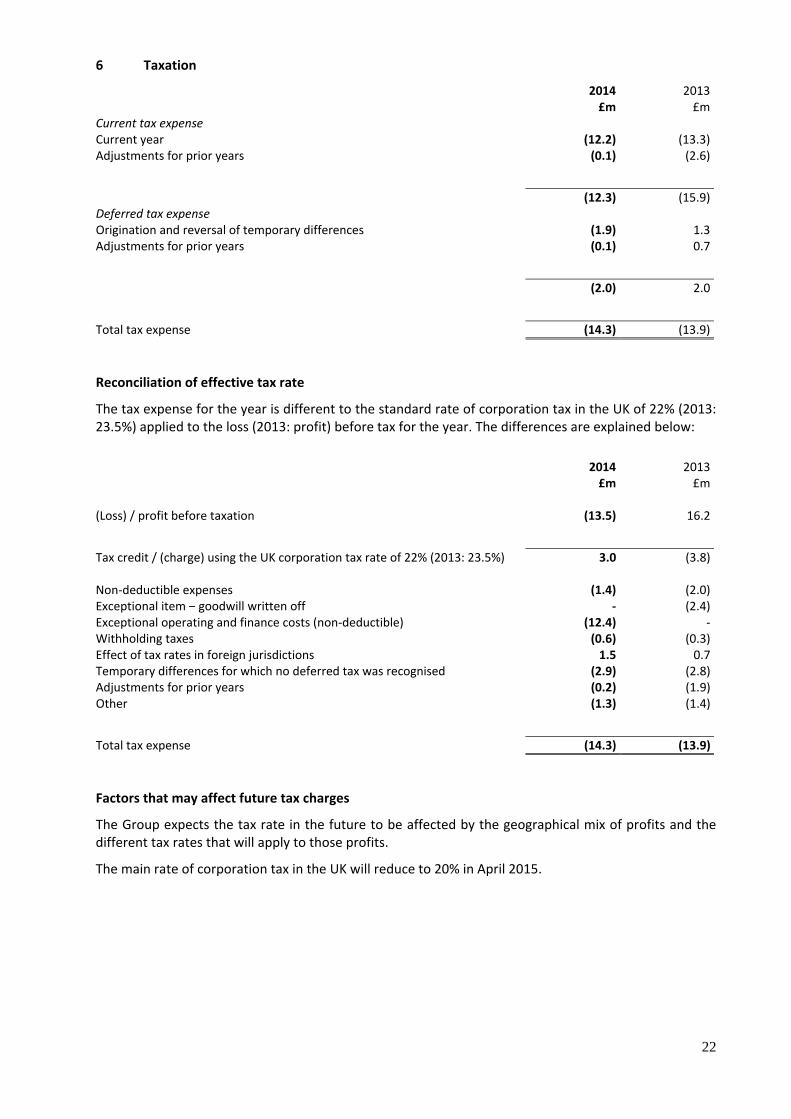
6 Taxation
2014 2013 £m £m
Current tax expense Current year (12.2) (13.3)Adjustments for prior years (0.1) (2.6)
(12.3) (15.9)Deferred tax expense Origination and reversal of temporary differences (1.9) 1.3Adjustments for prior years (0.1) 0.7
(2.0) 2.0
Total tax expense (14.3) (13.9)
Reconciliation of effective tax rate
The tax expense for the year is different to the standard rate of corporation tax in the UK of 22% (2013: 23.5%) applied to the loss (2013: profit) before tax for the year. The differences are explained below:
2014 2013 £m £m
(Loss) / profit before taxation (13.5) 16.2
Tax credit / (charge) using the UK corporation tax rate of 22% (2013: 23.5%) 3.0 (3.8) Non‐deductible expenses (1.4) (2.0)Exceptional item – goodwill written off ‐ (2.4)Exceptional operating and finance costs (non‐deductible) (12.4) ‐Withholding taxes (0.6) (0.3)Effect of tax rates in foreign jurisdictions 1.5 0.7Temporary differences for which no deferred tax was recognised (2.9) (2.8)Adjustments for prior years (0.2) (1.9)Other (1.3) (1.4)
Total tax expense (14.3) (13.9)
Factors that may affect future tax charges
The Group expects the tax rate in the future to be affected by the geographical mix of profits and the different tax rates that will apply to those profits.
The main rate of corporation tax in the UK will reduce to 20% in April 2015.
22
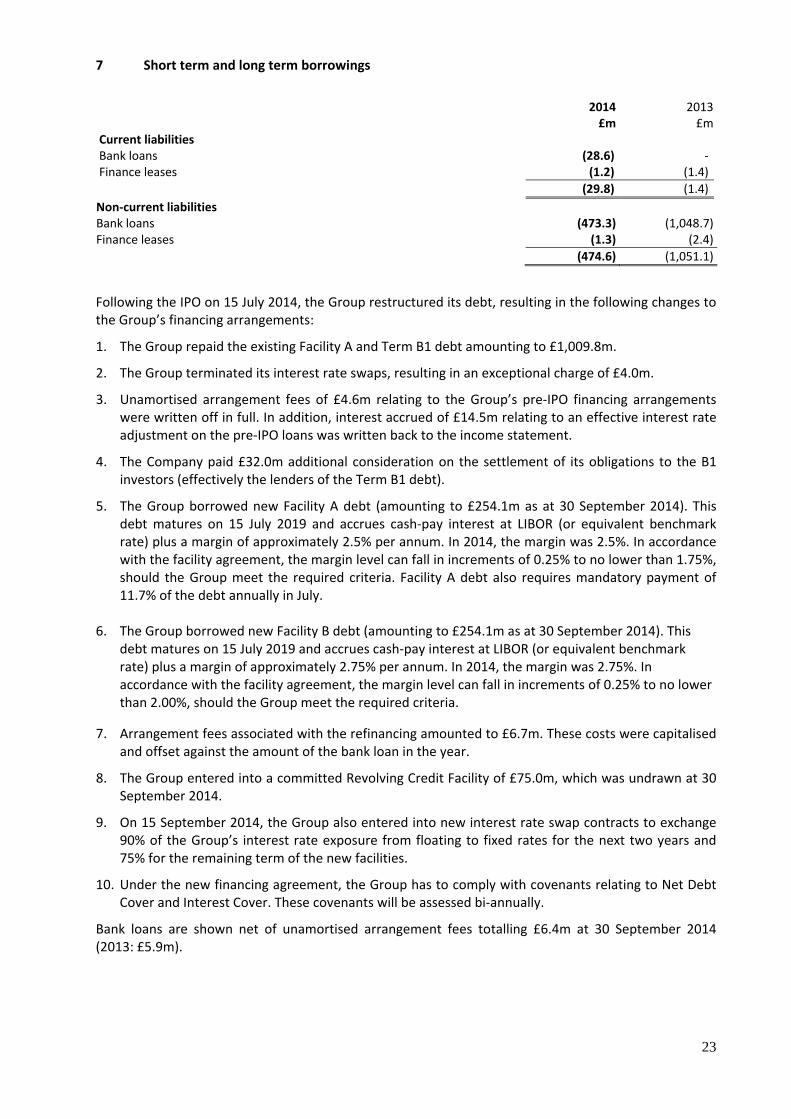
7 Short term and long term borrowings
2014 2013 £m £m
Current liabilities Bank loans (28.6) ‐Finance leases (1.2) (1.4) (29.8) (1.4)Non‐current liabilities Bank loans (473.3) (1,048.7)Finance leases (1.3) (2.4) (474.6) (1,051.1)
Following the IPO on 15 July 2014, the Group restructured its debt, resulting in the following changes to the Group’s financing arrangements:
1. The Group repaid the existing Facility A and Term B1 debt amounting to £1,009.8m.
2. The Group terminated its interest rate swaps, resulting in an exceptional charge of £4.0m.
3. Unamortised arrangement fees of £4.6m relating to the Group’s pre‐IPO financing arrangements were written off in full. In addition, interest accrued of £14.5m relating to an effective interest rate adjustment on the pre‐IPO loans was written back to the income statement.
4. The Company paid £32.0m additional consideration on the settlement of its obligations to the B1 investors (effectively the lenders of the Term B1 debt).
5. The Group borrowed new Facility A debt (amounting to £254.1m as at 30 September 2014). This debt matures on 15 July 2019 and accrues cash‐pay interest at LIBOR (or equivalent benchmark rate) plus a margin of approximately 2.5% per annum. In 2014, the margin was 2.5%. In accordance with the facility agreement, the margin level can fall in increments of 0.25% to no lower than 1.75%, should the Group meet the required criteria. Facility A debt also requires mandatory payment of 11.7% of the debt annually in July.
6. The Group borrowed new Facility B debt (amounting to £254.1m as at 30 September 2014). This debt matures on 15 July 2019 and accrues cash‐pay interest at LIBOR (or equivalent benchmark rate) plus a margin of approximately 2.75% per annum. In 2014, the margin was 2.75%. In accordance with the facility agreement, the margin level can fall in increments of 0.25% to no lower than 2.00%, should the Group meet the required criteria.
7. Arrangement fees associated with the refinancing amounted to £6.7m. These costs were capitalised and offset against the amount of the bank loan in the year.
8. The Group entered into a committed Revolving Credit Facility of £75.0m, which was undrawn at 30 September 2014.
9. On 15 September 2014, the Group also entered into new interest rate swap contracts to exchange 90% of the Group’s interest rate exposure from floating to fixed rates for the next two years and 75% for the remaining term of the new facilities.
10. Under the new financing agreement, the Group has to comply with covenants relating to Net Debt Cover and Interest Cover. These covenants will be assessed bi‐annually.
Bank loans are shown net of unamortised arrangement fees totalling £6.4m at 30 September 2014 (2013: £5.9m).
23
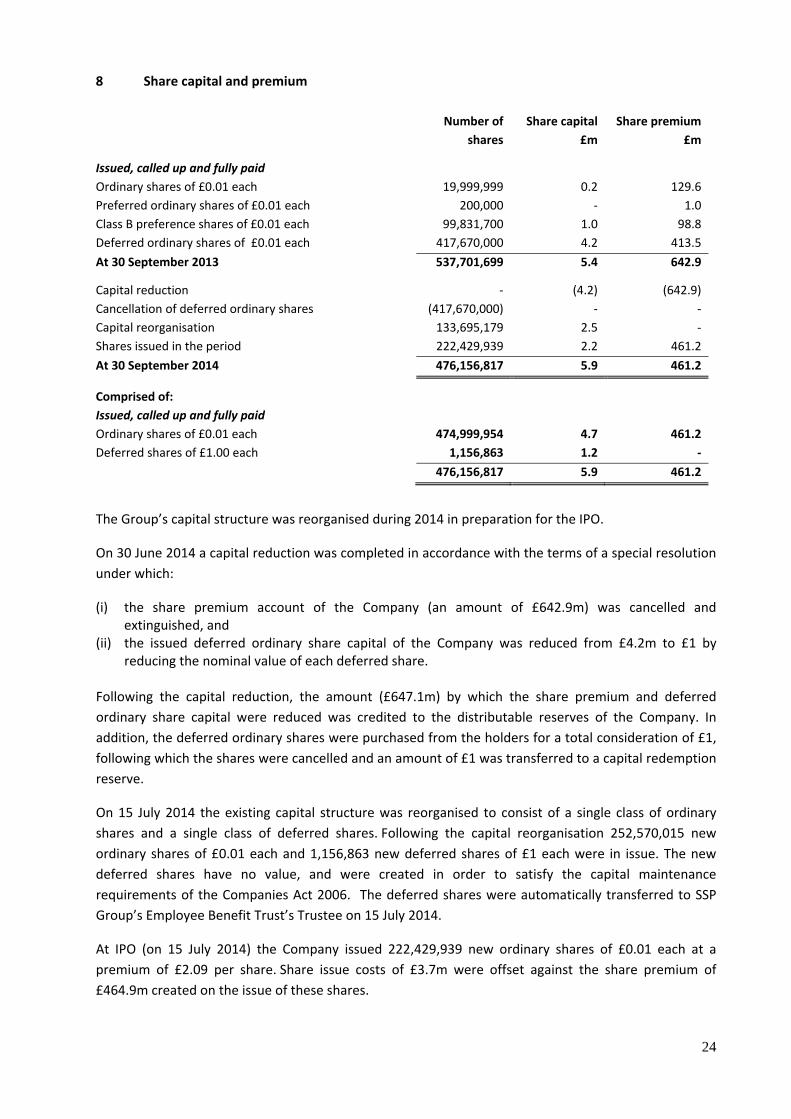
8 Share capital and premium
Number of
shares Share capital
£m Share premium
£m
Issued, called up and fully paid Ordinary shares of £0.01 each 19,999,999 0.2 129.6Preferred ordinary shares of £0.01 each 200,000 ‐ 1.0Class B preference shares of £0.01 each 99,831,700 1.0 98.8Deferred ordinary shares of £0.01 each 417,670,000 4.2 413.5At 30 September 2013 537,701,699 5.4 642.9
Capital reduction ‐ (4.2) (642.9)Cancellation of deferred ordinary shares (417,670,000) ‐ ‐Capital reorganisation 133,695,179 2.5 ‐Shares issued in the period 222,429,939 2.2 461.2At 30 September 2014 476,156,817 5.9 461.2
Comprised of: Issued, called up and fully paid Ordinary shares of £0.01 each 474,999,954 4.7 461.2Deferred shares of £1.00 each 1,156,863 1.2 ‐
476,156,817 5.9 461.2
The Group’s capital structure was reorganised during 2014 in preparation for the IPO.
On 30 June 2014 a capital reduction was completed in accordance with the terms of a special resolution under which:
(i) the share premium account of the Company (an amount of £642.9m) was cancelled and extinguished, and
(ii) the issued deferred ordinary share capital of the Company was reduced from £4.2m to £1 by reducing the nominal value of each deferred share.
Following the capital reduction, the amount (£647.1m) by which the share premium and deferred ordinary share capital were reduced was credited to the distributable reserves of the Company. In addition, the deferred ordinary shares were purchased from the holders for a total consideration of £1, following which the shares were cancelled and an amount of £1 was transferred to a capital redemption reserve.
On 15 July 2014 the existing capital structure was reorganised to consist of a single class of ordinary shares and a single class of deferred shares. Following the capital reorganisation 252,570,015 new ordinary shares of £0.01 each and 1,156,863 new deferred shares of £1 each were in issue. The new deferred shares have no value, and were created in order to satisfy the capital maintenance requirements of the Companies Act 2006. The deferred shares were automatically transferred to SSP Group’s Employee Benefit Trust’s Trustee on 15 July 2014.
At IPO (on 15 July 2014) the Company issued 222,429,939 new ordinary shares of £0.01 each at a premium of £2.09 per share. Share issue costs of £3.7m were offset against the share premium of £464.9m created on the issue of these shares.
24

9 Cash flow from operations
2014 2013 £m £m
(Loss) / profit for the year (27.8) 2.3Adjustments for: Depreciation 72.5 70.6Amortisation 8.5 8.6Goodwill written off on closure of business units ‐ 10.5Share‐based payments 0.3 ‐Loss on disposal of business 0.7 ‐Finance income (0.8) (1.6)Finance expense 29.0 44.5Share of profit of associates (1.5) (2.4)Exceptional costs before tax 69.3 6.3Taxation 14.3 13.9 164.5 152.7
Increase in trade and other receivables (6.1) (1.9)Decrease / (increase) in inventories 0.4 (0.1)Increase in trade and other payables, and in provisions 18.4 7.7
Cash flow from operations 177.2 158.4
10 Net debt
The following table shows the movement in net debt of the Group during the year:
At beginningof year
Cash flow
Non cash
changes
Translation differences
At end ofyear
£m £m £m £m £m Cash and cash equivalents 182.1 (46.1) ‐ (2.7) 133.3 Debt due within one year: Bank loans ‐ ‐ (28.6) ‐ (28.6)Finance leases (1.4) 1.2 (1.0) ‐ (1.2)
Debt due after one year: Bank loans (1,048.7) 499.8 29.1 46.5 (473.3)Finance leases (2.4) ‐ 1.0 0.1 (1.3)
Total (870.4) 454.9 0.5 43.9 (371.1)
25
26
11 Annual General Meeting
This year’s Annual General Meeting will be held on 3 March 2015. Details of the resolutions to be proposed at that meeting will be included in the notice of Annual General Meeting that will be sent to shareholders at the end of January 2015.
12 Other information
The financial information for the year ended 30 September 2014 contained in this preliminary announcement was approved by the Board on 26 November 2014. This announcement does not constitute statutory accounts of the Company within the meaning of section 435 of the Companies Act 2006, but is derived from those accounts.
Statutory accounts for the year ended 30 September 2013 have been delivered to the Registrar of Companies. Statutory accounts for the year ended 30 September 2014 will be delivered to the Registrar of Companies following the Company’s Annual General Meeting.
The auditors have reported on those accounts. Their reports were not qualified, did not include a reference to any matters to which the auditors drew attention by way of emphasis without qualifying their report, and did not contain a statement under section 498 (2) or (3) of the Companies Act 2006.
13 Forward looking statement
This announcement contains certain forward looking statements with respect to the operations, strategy, performance and the financial condition of the Group. By their nature, these statements involve uncertainty since future events and circumstances can cause results to differ from those anticipated. Nothing in this announcement should be construed as a profit forecast. Except where required to do so under applicable law or regulatory obligations, we undertake no obligation to update any forward looking statements whether as a result of new information, future events or otherwise.