27 j adhesion
DESCRIPTION
DocumTRANSCRIPT
Effect of Adhesive Type and Thickness on theLap Shear Strength
Lucas F. M. da SilvaT. N. S. S. RodriguesM. A. V. FigueiredoM. F. S. F. de MouraJ. A. G. ChousalDepartment of Mechanical Engineering and Industrial Management,Faculty of Engineering of the University of Porto, Portugal
The effect of the adhesive thickness on the bond strength of single-lap adhesivejoints is still not perfectly understood. The classical elastic analyses predict thatthe strength increases with the adhesive thickness, whereas experimental resultsshow the opposite. Various theories have been proposed to explain this discrepancy,but more experimental tests are necessary to understand all the variables.
The objective of the present study was to assess the effect of the adhesive thicknesson the strength of single-lap joints for different kinds of adhesives. Three differentadhesives were selected and tested in bulk. The strain to failure in tension rangedfrom 1.3% for the most brittle adhesive to 44% for the most ductile adhesive. Theadherend selected was a high-strength steel to keep the adherends in the elasticrange and simplify the analysis. Three thicknesses were studied for each adhesive:0.2, 0.5, and 1 mm.
A statistical analysis of the experimental results shows that the lap shear strengthincreases as the bondline gets thinner and the adhesive gets tougher.
Keywords: Adhesive thickness; Epoxy; Finite element analysis; Lap shear strength;Mechanical properties of adhesives; Statistical analysis
Received 21 January 2006; in final form 13 July 2006.Address correspondence to Lucas F. M. da Silva, Departamento de Engenharia
Mecanica e Gestao Industrial, Faculdade de Engenharia da Universidade do Porto,Rua Dr. Roberto Frias, 4200-465 Porto, Portugal. E-mail: [email protected]
The Journal of Adhesion, 82:1091–1115, 2006
Copyright # Taylor & Francis Group, LLC
ISSN: 0021-8464 print=1545-5823 online
DOI: 10.1080/00218460600948511
1091

1. INTRODUCTION
The effect of adhesive thickness on the strength of adhesively bondedjoints still needs investigation. Practice shows that the lap-jointstrength increases as the bondline gets thinner. The highest strengthis obtained for bondlines on the order of 0.05 to 0.5 mm. However, thisbroad observation is not applicable to all cases as there are other vari-ables involved, such as the type of loading (shear, peel, or cleavage),the adherend behaviour (elastic or plastic), and the type of adhesive(ductile or brittle). For example, for peel joints and ductile adhesives,the failure load increases as the bondline gets thicker because theadhesive is able to distribute the load over a larger area [1]. In the caseof adhesive joints used for the determination of fracture energy suchas the double cantilever beam or the compact tension, the effect ofbondline thickness varies. Lee et al. [2] state that as the bondlinethickness decreases, the fracture energy either decreases monotoni-cally or increases, peaks, and then decreases rapidly depending onthe adhesive ductility and crack path.
The single-lap joint is the most common type of joint, and it isimportant to quantify the effect of the adhesive thickness for designpurposes. The classical analytical analyses such as those of Volkersen[3] or Goland and Reissner [4] are not in accordance with the availableexperimental results. Other authors have proposed other theories.
Crocombe [5] shows that thicker single-lap joints have a lowerstrength considering the plasticity of the adhesive. An elastic analysisshows that the stress distribution of a thin bondline is more concen-trated at the ends of the overlap than a thicker bondline, which has amore uniform stress distribution. Therefore, a thin bondline will reachthe yielding stress at a lower load than a thick bondline. However, whenyielding does occur in a thicker joint, there is a less ‘‘elastic reserve’’ tosustain further loading, and thus, yielding spreads more quickly.
Another theory to explain the effect of the adhesive thickness on thestrength of single-lap joints was introduced by Gleich et al. in 2001 [6].They show with a finite element analysis that the interface stresses(peel and shear) increase as the bondline gets thicker. Supposing thatthe failure occurs close to the adhesive–adherend interface, a failurecriterion based on the interface stresses can explain why thin jointsare stronger than thick joints.
Another earlier theory proposed by Adams and Peppiatt [7] explainsthe discrepancy by saying that thicker bondlines contain more defectssuch as voids and microcracks. The theoretical and experimentalresults available in the literature are for typical structural adhesiveswith intermediate properties and do not consider the case of an
1092 L. F. M. da Silva et al.
extremely brittle adhesive and the case of a very ductile adhesive. It iswell known that a single-lap joint experiences high peel loading at theends of the overlap in addition to shear loading. The joint strength is afunction of the adhesive strength and ability to distribute the load overa large area and reduce the stress concentration.
In the present work, we investigated the type of adhesive that leadsto the highest load-bearing capacity in a single-lap joint and how thejoint strength is affected by the adhesive thickness. Three types ofadhesives (brittle, intermediate, and ductile) were selected based oninformation from suppliers. The adhesives were then tested in bulkto confirm the mechanical properties. Single-lap joints were manufac-tured and tested according to a plan based on the Taguchi method [8],and the experimental results were statistically treated to determinethe influence of the type of adhesive and the adhesive thickness. Afinite element analysis was also carried out to simulate the lap sheartests for a better theoretical understanding.
2. EXPERIMENTAL
Three adhesives were selected: a very ductile adhesive (Hysol EA 9361from Loctite, Munich, Germany), a very brittle adhesive (AralditeAV138=HV998 from Huntsman, Salt Lake City, UT, USA), and anintermediate adhesive (Hysol EA 9321 from Loctite). According toCrocombe’s proposition [5], a joint with a ductile adhesive should givea strength that increases with a decrease of the bondline thicknesswhile a brittle adhesive with no plasticity should give a strength thatincreases with the adhesive thickness.
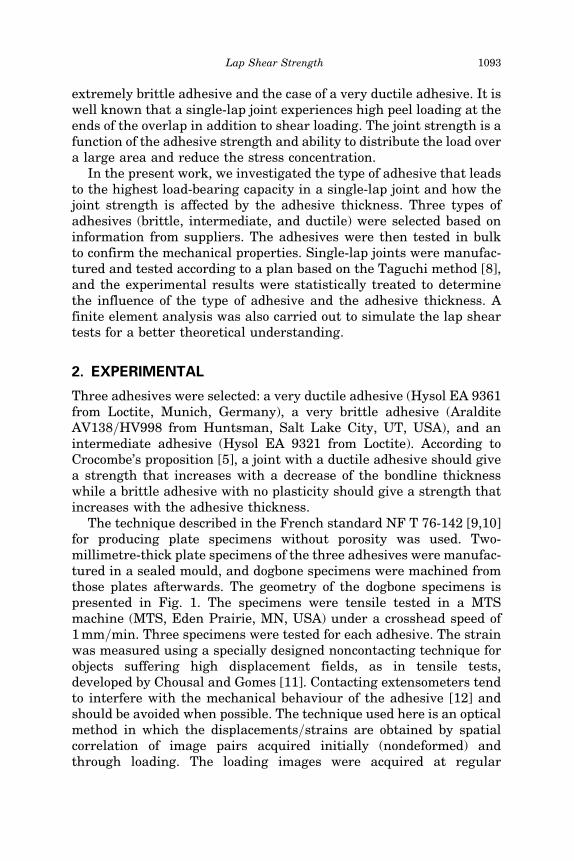
The technique described in the French standard NF T 76-142 [9,10]for producing plate specimens without porosity was used. Two-millimetre-thick plate specimens of the three adhesives were manufac-tured in a sealed mould, and dogbone specimens were machined fromthose plates afterwards. The geometry of the dogbone specimens ispresented in Fig. 1. The specimens were tensile tested in a MTSmachine (MTS, Eden Prairie, MN, USA) under a crosshead speed of1 mm=min. Three specimens were tested for each adhesive. The strainwas measured using a specially designed noncontacting technique forobjects suffering high displacement fields, as in tensile tests,developed by Chousal and Gomes [11]. Contacting extensometers tendto interfere with the mechanical behaviour of the adhesive [12] andshould be avoided when possible. The technique used here is an opticalmethod in which the displacements=strains are obtained by spatialcorrelation of image pairs acquired initially (nondeformed) andthrough loading. The loading images were acquired at regular
Lap Shear Strength 1093
intervals (generally every 5 s) from which an in-house computer pro-gramme calculated the corresponding displacements=strains. Thecamera had a resolution of 8 megapixels, and the images were takenwith an infrared remote control, ensuring the camera stability (seeFig. 2). One of the advantages of this technique is its ability to mea-sure displacements without the need of specimen surface marks,because the texture of the surface (speckle-like) is generally sufficientfor displacement tracking.
Typical stress–strain curves of the adhesives are shown in Fig. 3. Themechanical properties of the adhesives used are shown in Table 1.The brittle adhesive, AV138=HV998, presents more scatter than theother adhesives because it is more sensitive to defects. However, thefailure surface did not contain any noticeable voids. The yield strengthwas calculated for a plastic deformation of 0.2%. The area under thestress–strain curve (UT) is an approximate value of the toughness [13]:
UT ¼rya þ rr
2
� �ef ðductileÞ
UT ¼2
3rref ðbrittleÞ
ð1Þ
where rya is the yield strength of the adhesive, rr is the ultimate tensilestrength, and ef is the failure strain. To quantify separately the influ-ence of the adhesive thickness and the type of adhesive (toughness,UT) on the lap shear strength, the experimental design technique of
FIGURE 1 Dogbone specimen for tensile testing (dimensions in mm).
1094 L. F. M. da Silva et al.

FIGURE 2 Measurement of the tensile deformation by an optical method.
FIGURE 3 Tensile stress–strain curves of the various adhesives tested.
Lap Shear Strength 1095

Taguchi [14] was used. An experimental orthogonal array (L9) of threelevels with nine experimental runs was designed. After assigning thevariables (type of adhesive and adhesive thickness) to the columns ofthe L9 matrix and the respective values for each level, the experimentalplan presented in Table 2 was obtained and repeated six times. Theinfluence of each variable and the interactions among them wasassessed by the average response and the analysis of variance(ANOVA). The statistical software Statview (SAS Institute, Inc., Cary,NC, USA) was used.
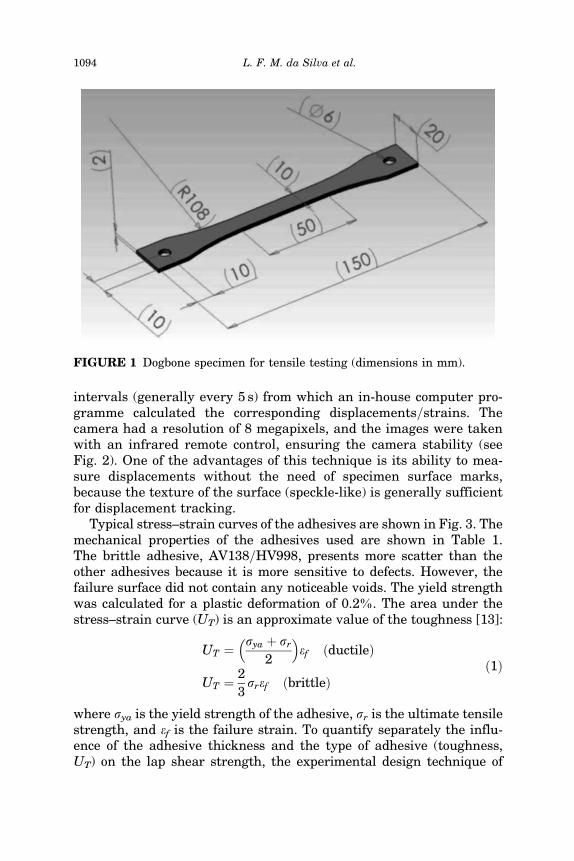
The single-lap joints (SLJs) had an overlap of 25 mm and a width of25 mm (see geometry in Fig. 4). To maintain the adherends in the elas-tic range, a high-strength steel was chosen (DIN C60, quenched in oil).The overlap length was chosen according to a simple methodology pro-posed by Adams and Davies [15]. The load corresponding to the totalplastic deformation of the adhesive is
Fa ¼ sy �w � l; ð2Þ
TABLE 2 Experimental Plan Based on TaguchiOrthogonal Array (L9)
Experimentalrun
Type ofadhesive
Adhesive thickness(mm)
1 AV138 0.22 AV138 0.53 AV138 14 EA 9321 0.25 EA 9321 0.56 EA 9321 17 EA 9361 0.28 EA 9361 0.59 EA 9361 1
TABLE 1 Adhesive Properties (Three Specimens Tested for Each Temperature)
Parameter Hysol EA 9361 Hysol EA 9321 AV138=HV998
Young’s modulus E (GPa) 0.67� 0.02 3.87� 0.15 4.59� 0.81Poisson’s ratioa n 0.4 0.36 0.35Yield strength rya (MPa) 4.23� 0.55 21.99� 2.16 36.49� 2.47Tensile strength rr (MPa) 7.99� 1.59 45.97� 0.09 41.01� 7.28Failure strain ef (%) 44.0� 12.3 3.8� 0.03 1.3� 0.44Toughness UT (MPa) 2.69 1.16 0.34
aManufacturer’s data.
1096 L. F. M. da Silva et al.
where Fa is the failure load of the adhesive, sy is the yield strength ofthe adhesive, w is the joint width, and l is the overlap length. Thedirect tensile stress (rt) acting in the adherend due to the applied loadF is
rt ¼F
wts; ð3Þ
where ts is the adherend thickness. The stress at the inner adherendsurface (rs) due to the bending moment M is
rs ¼6M
wt2s
; ð4Þ
where M ¼ kFts=2; according to Goland and Reissner [4]. The variablek is the bending moment factor, which reduces (from unity) as the laprotates under load. The stress acting in the adherend is the sum of thedirect stress and the bending stress. Thus, the maximum load that canbe carried that just creates adherend yield (Fs) is
Fs ¼ryswts
1þ 3k; ð5Þ
where rys is the yield strength of the adherend. For low loads and shortoverlaps, k is approximately 1. Therefore, for such a case,
Fs ¼ryswts
4: ð6Þ
However, for joints that are long compared to the adherend thickness,such that l=ts� 20, the value of k decreases and tends to zero. In thiscase, the whole of the cross-section yields and
Fs ¼ rys �w � ts: ð7Þ
The adherend will not yield if Fs > Fa. This condition (consideringthe adhesive that has the higher shear strength) means that the
FIGURE 4 Single-lap joints geometry (not to scale, dimensions in mm).
Lap Shear Strength 1097
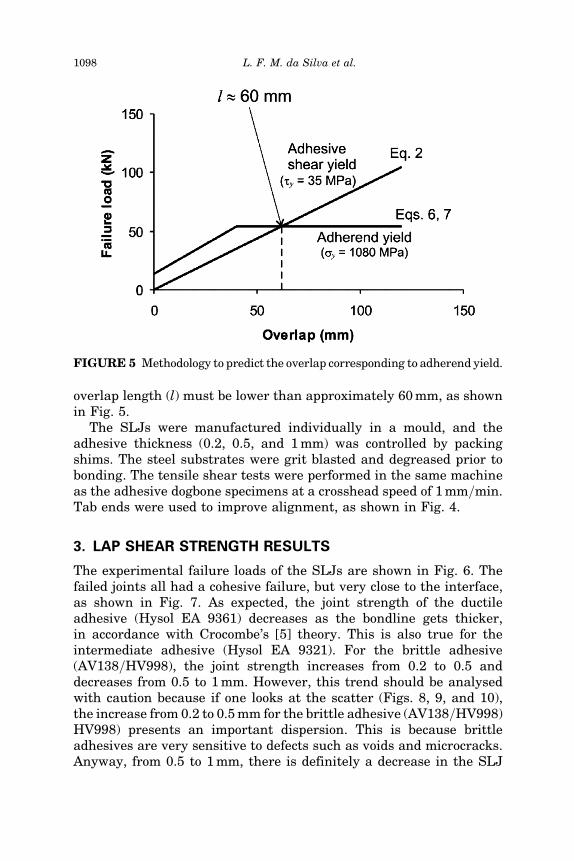
overlap length (l) must be lower than approximately 60 mm, as shownin Fig. 5.
The SLJs were manufactured individually in a mould, and theadhesive thickness (0.2, 0.5, and 1 mm) was controlled by packingshims. The steel substrates were grit blasted and degreased prior tobonding. The tensile shear tests were performed in the same machineas the adhesive dogbone specimens at a crosshead speed of 1 mm=min.Tab ends were used to improve alignment, as shown in Fig. 4.
3. LAP SHEAR STRENGTH RESULTS
The experimental failure loads of the SLJs are shown in Fig. 6. Thefailed joints all had a cohesive failure, but very close to the interface,as shown in Fig. 7. As expected, the joint strength of the ductileadhesive (Hysol EA 9361) decreases as the bondline gets thicker,in accordance with Crocombe’s [5] theory. This is also true for theintermediate adhesive (Hysol EA 9321). For the brittle adhesive(AV138=HV998), the joint strength increases from 0.2 to 0.5 anddecreases from 0.5 to 1 mm. However, this trend should be analysedwith caution because if one looks at the scatter (Figs. 8, 9, and 10),the increase from 0.2 to 0.5 mm for the brittle adhesive (AV138=HV998)HV998) presents an important dispersion. This is because brittleadhesives are very sensitive to defects such as voids and microcracks.Anyway, from 0.5 to 1 mm, there is definitely a decrease in the SLJ
FIGURE 5 Methodology to predict the overlap corresponding to adherend yield.
1098 L. F. M. da Silva et al.

FIGURE 6 SLJs’ failure load as a function of adhesive type and thickness.
FIGURE 7 Fracture surface of a SLJ.
Lap Shear Strength 1099
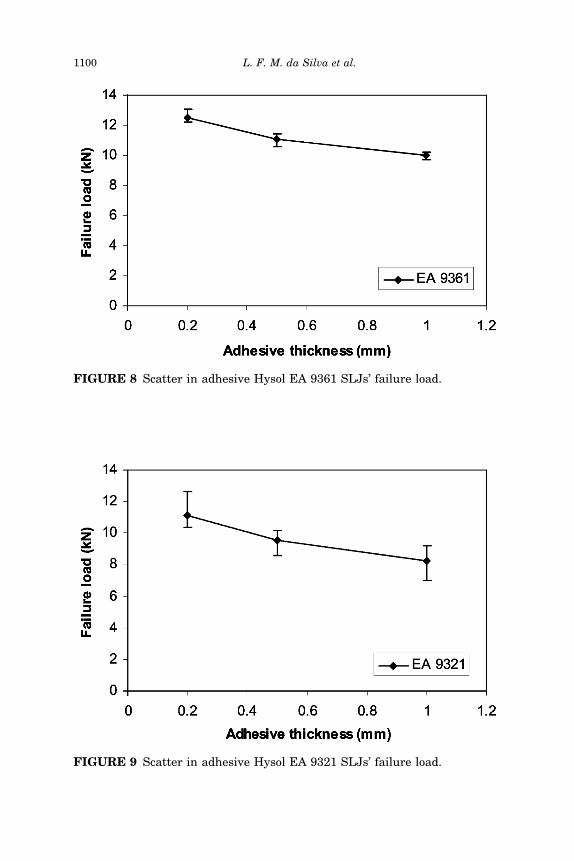
FIGURE 8 Scatter in adhesive Hysol EA 9361 SLJs’ failure load.
FIGURE 9 Scatter in adhesive Hysol EA 9321 SLJs’ failure load.
1100 L. F. M. da Silva et al.
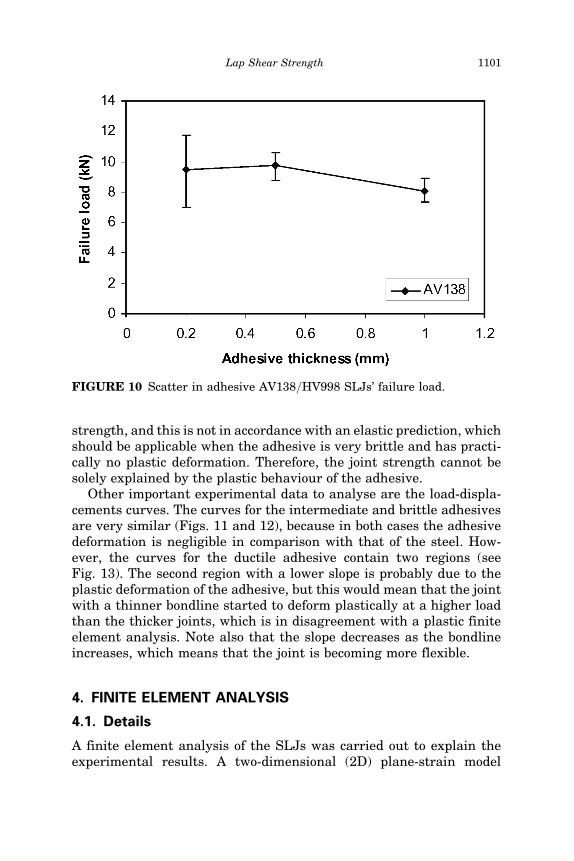
strength, and this is not in accordance with an elastic prediction, whichshould be applicable when the adhesive is very brittle and has practi-cally no plastic deformation. Therefore, the joint strength cannot besolely explained by the plastic behaviour of the adhesive.
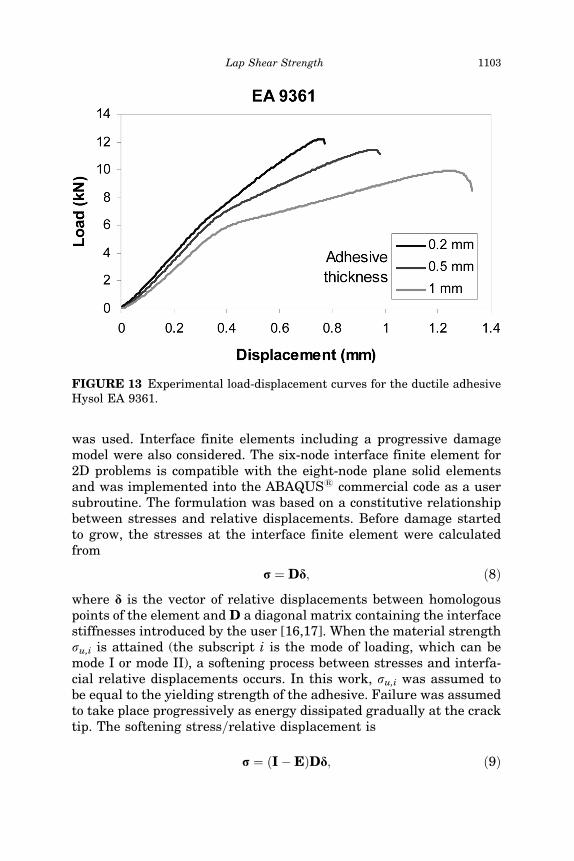
Other important experimental data to analyse are the load-displa-cements curves. The curves for the intermediate and brittle adhesivesare very similar (Figs. 11 and 12), because in both cases the adhesivedeformation is negligible in comparison with that of the steel. How-ever, the curves for the ductile adhesive contain two regions (seeFig. 13). The second region with a lower slope is probably due to theplastic deformation of the adhesive, but this would mean that the jointwith a thinner bondline started to deform plastically at a higher loadthan the thicker joints, which is in disagreement with a plastic finiteelement analysis. Note also that the slope decreases as the bondlineincreases, which means that the joint is becoming more flexible.
4. FINITE ELEMENT ANALYSIS
4.1. Details
A finite element analysis of the SLJs was carried out to explain theexperimental results. A two-dimensional (2D) plane-strain model
FIGURE 10 Scatter in adhesive AV138=HV998 SLJs’ failure load.
Lap Shear Strength 1101

FIGURE 12 Load-displacement curves for the intermediate adhesive HysolEA 9321.
FIGURE 11 Load-displacement curves for the brittle adhesive AV138=HV998.
1102 L. F. M. da Silva et al.
was used. Interface finite elements including a progressive damagemodel were also considered. The six-node interface finite element for2D problems is compatible with the eight-node plane solid elementsand was implemented into the ABAQUS1 commercial code as a usersubroutine. The formulation was based on a constitutive relationshipbetween stresses and relative displacements. Before damage startedto grow, the stresses at the interface finite element were calculatedfrom
r ¼ Dd; ð8Þ
where d is the vector of relative displacements between homologouspoints of the element and D a diagonal matrix containing the interfacestiffnesses introduced by the user [16,17]. When the material strengthru,i is attained (the subscript i is the mode of loading, which can bemode I or mode II), a softening process between stresses and interfa-cial relative displacements occurs. In this work, ru,i was assumed tobe equal to the yielding strength of the adhesive. Failure was assumedto take place progressively as energy dissipated gradually at the cracktip. The softening stress=relative displacement is
r ¼ ðI�EÞDd; ð9Þ
FIGURE 13 Experimental load-displacement curves for the ductile adhesiveHysol EA 9361.
Lap Shear Strength 1103
where I is the identity matrix and E a diagonal matrix containing thedamage parameters defined by
ei ¼du;iðdi � do;iÞdiðdu;i � do;iÞ
; ð10Þ
where di is the current relative displacement in mode i and do,i the dis-placement corresponding to the onset of damage. In pure mode load-ing, the strength along other directions is abruptly cancelled. Themaximum relative displacement du,i, for which complete failure occurs,was obtained by equating the area under the softening curve to therespective critical fracture energy
Gic ¼1
2ru;idu;i: ð11Þ
In adhesive joints, a complex stress state is present, and damagepropagation occurs under mixed-mode loading (mode I and II). There-fore, a formulation for interface elements should include a mixed-modedamage model, which, in this case, is an extension of the pure modemodel described previously. Damage initiation was predicted by usinga quadratic stress criterion
rI
ru;I
� �2
þ rII
ru;II
� �2
¼ 1 if rI � 0;
rII ¼ ru;II if rI � 0;
ð12Þ
with the assumption that normal compressive stresses do not promotedamage. For damage propagation a linear energetic criterion wasconsidered:
GI
GIcþ GII
GIIc¼ 1: ð13Þ
The released energy in each mode at complete failure can be obtainedfrom the area of the minor triangle of Fig. 14:
Gi ¼1
2rum;idum;i: ð14Þ
From the relationships between stresses and relative displacements[Eq. (8)] and from the relationship between released energies andrelative displacements [Eqs. (14) and (11)], the problem can be imple-mented as a function of relative displacements. The relative displace-ments for each mode corresponding to damage onset, dom,i, and
1104 L. F. M. da Silva et al.

ultimate failure, dum,i, can be obtained from Eqs. (12) and (13), givingthe following expressions after some algebraic manipulation detailedelsewhere [17]:
dom;i ¼bidomffiffiffiffiffiffiffiffiffiffiffiffiffiffiffi1þ b2
II
q ; ð15Þ
dum;i ¼bidumffiffiffiffiffiffiffiffiffiffiffiffiffiffiffi1þ b2
II
q ; ð16Þ
where bi represent the mode ratios
bi ¼di
dIð17Þ
and dom, dum are the equivalent mixed-mode relative displacements
dom ¼ do;Ido;II
ffiffiffiffiffiffiffiffiffiffiffiffiffiffiffiffiffiffiffiffiffiffiffiffiffiffiffi1þ b2
II
d2o;II þ b2
IId2o;I
vuut ; ð18Þ
dum ¼1þ b2
II
dom½ðdo;Idu;IÞ�1 þ b2IIðdo;IIdu;IIÞ�1�
: ð19Þ
FIGURE 14 Pure and mixed-mode damage model.
Lap Shear Strength 1105

The damage parameter can now be obtained by substituting Eqs. (15)and (16) in Eq. (10).
As already mentioned, the failure occurred cohesively close to theadherend–adhesive interfaces. Consequently, the interface elementswere placed at adherend–adhesive interfaces, and the properties ofthe adhesive were considered in the damage model. A very refinedmesh was considered in the overlap region to simulate accuratelythe damage initiation and growth (see Fig. 15). The plane elementssimulating the adhesive behaviour had a length of 0.2 mm and a thick-ness of 0.1 mm. The numerical analysis was performed consideringapplied displacement, geometric nonlinearity, and an elastoplasticmaterial model for the adhesive. The adhesive plasticity included inthe continuum elements and the interface elements were both active.Therefore, the fracture energy of the adhesive will be greater than itscritical strain-energy release rate because the continuum will contrib-ute to energy dissipation. This may lead to unconservative failure pre-dictions. The values of strain-energy release rates were not measuredexperimentally. Typical values for the three adhesives were con-sidered (see Table 3). It should be emphasized that, in this model,the failure loads are mainly dictated by the limiting stress. The critical
FIGURE 15 Finite element model: a) boundary conditions and b) finiteelement mesh detail for 0.2-mm adhesive thickness.
TABLE 3 Adhesive Strain-Energy Release Rates (Typical Values)
Parameter AV138=HV998 Hysol EA 9321 Hysol EA 9361
GIc (N=mm) 0.3a 0.45b 2.61c
GIIc (N=mm) 0.6 0.9 5.22
aRef. [18].b,cRef. [19].
1106 L. F. M. da Silva et al.
strain-energy release rates play their part especially on the postpeakbehaviour of the load-displacement curve [20].
The plastic behaviour of the adhesive was modelled using theexponent Drucker–Prager criterion [21], which takes into accountthe hydrostatic stress. There are other models that include the firststress invariant such as the one of Raghava [22] and the one of Dolevand Ishai [23]. The Raghava and the exponent Drucker–Prager cri-teria are equivalent when the exponent parameter (b) is 2. The yieldcriterion can be expressed as
aqb � p ¼ pt ð20Þ
The terms that appear in Eq. (20) are defined as
a ¼ 1
3ðk� 1Þryt;
q ¼ffiffiffiffiffiffiffiffiffiffiffiffiffiffiffiffiffiffiffiffiffiffiffiffiffiffiffiffiffiffiffiffiffiffiffiffiffiffiffiffiffiffiffiffiffiffiffiffiffiffiffiffiffiffiffiffiffiffiffiffiffiffiffiffiffiffiffiffiffiffiffiffiffiffiffiffiffiffiffiffiffiffi1
2½ðr1 � r2Þ2 þ ðr2 � r3Þ2 þ ðr3 � r1Þ2�
r¼
ffiffiffiffiffiffiffiffi3J2
p;
b ¼ 2;
p ¼ � 1
3ðr1 þ r2 þ r3Þ ¼ �
1
3I1;
pt ¼kryt
3ðk� 1Þ ;
where k is the ratio of yield stress in compression to the yield stress intension, ri (i ¼ 1, 2, 3) are the principal stresses, ryt is the yield stressin tension, J2 is the second deviatoric stress invariant, and I1 is thefirst invariant of the stress tensor. Note that when k ¼ 1, the exponentDrucker–Prager model is equivalent to the von Mises criterion. Com-pression tests (ASTM D695-68T) were carried out to determine k (seeTable 4). To illustrate the importance of the hydrostatic stress on theyield, the von Mises and the exponent Drucker–Prager models wererepresented in a p–q plane as shown in Fig. 16; the horizontal axis(p) corresponds to the hydrostatic axis and the vertical axis (q) repre-sents the deviatoric stress. The plot is for the ductile adhesive (HysolEA 9361). The experimental data points obtained in tension, in
TABLE 4 Adhesives Ratio of Yield Stress in Compression to Yield Stress inTension ðkÞ (Measured Experimentally)
Parameter AV138=HV998 Hysol EA 9321 Hysol EA 9361
k 1.3 1.6 1.8
Lap Shear Strength 1107

compression, and in shear (notched-plate shear method) are alsorepresented, and these lie close to the exponent Drucker–Pragermodel given by Eq. (20). Figure 16 shows that the von Mises criterionoverestimates the yield when there is a high hydrostatic componentand these stresses are present in adhesive joints. Various studies haveproven [12,24] that the mechanical behaviour of adhesives is bettersimulated when the hydrostatic stress component is included,especially if the adhesive is very ductile.
4.2. Results
The predicted failure loads are reasonably close to the experimentalvalues, especially for the brittle and intermediate adhesives. Table 5compares the experimental and the predicted failure loads using theDrucker–Prager model and the interface elements. The predicted fail-ure loads show that the thinner the bondline, the stronger the joint,even for the brittle adhesive (AV138=HV998). This theoretical resultindicates that a failure criterion located at the interface gives goodpredictions and can explain the influence of the adhesive thickness,even though the fracture properties (GIc and GIIc) introduced in theinterface elements were not experimentally measured. The failed
FIGURE 16 Plot of yield models and yield stresses at an effective plasticstrain of 0.015 for the ductile adhesive (Hysol EA 9361) on the p–q plane.
1108 L. F. M. da Silva et al.
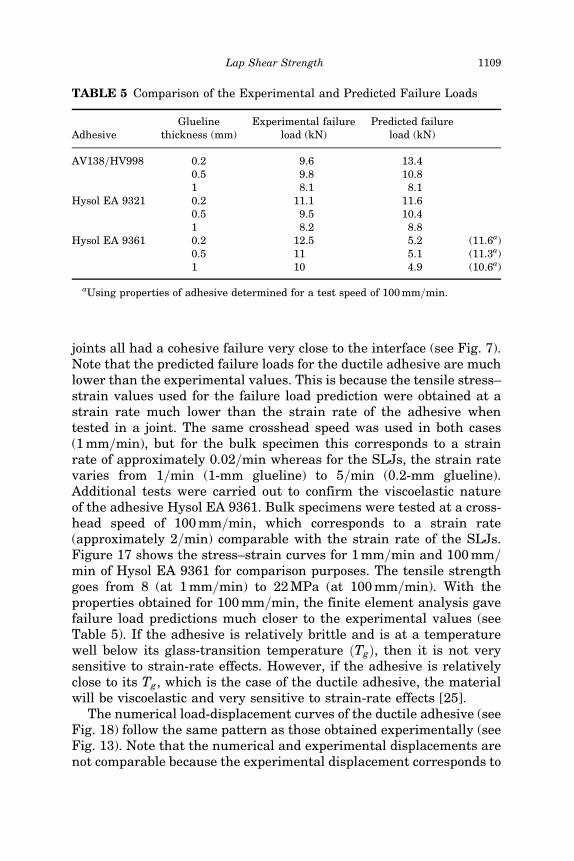
joints all had a cohesive failure very close to the interface (see Fig. 7).Note that the predicted failure loads for the ductile adhesive are muchlower than the experimental values. This is because the tensile stress–strain values used for the failure load prediction were obtained at astrain rate much lower than the strain rate of the adhesive whentested in a joint. The same crosshead speed was used in both cases(1 mm=min), but for the bulk specimen this corresponds to a strainrate of approximately 0.02=min whereas for the SLJs, the strain ratevaries from 1=min (1-mm glueline) to 5=min (0.2-mm glueline).Additional tests were carried out to confirm the viscoelastic natureof the adhesive Hysol EA 9361. Bulk specimens were tested at a cross-head speed of 100 mm=min, which corresponds to a strain rate(approximately 2=min) comparable with the strain rate of the SLJs.Figure 17 shows the stress–strain curves for 1 mm=min and 100 mm=min of Hysol EA 9361 for comparison purposes. The tensile strengthgoes from 8 (at 1 mm=min) to 22 MPa (at 100 mm=min). With theproperties obtained for 100 mm=min, the finite element analysis gavefailure load predictions much closer to the experimental values (seeTable 5). If the adhesive is relatively brittle and is at a temperaturewell below its glass-transition temperature ðTgÞ, then it is not verysensitive to strain-rate effects. However, if the adhesive is relativelyclose to its Tg, which is the case of the ductile adhesive, the materialwill be viscoelastic and very sensitive to strain-rate effects [25].
The numerical load-displacement curves of the ductile adhesive (seeFig. 18) follow the same pattern as those obtained experimentally (seeFig. 13). Note that the numerical and experimental displacements arenot comparable because the experimental displacement corresponds to
TABLE 5 Comparison of the Experimental and Predicted Failure Loads
AdhesiveGlueline
thickness (mm)Experimental failure
load (kN)Predicted failure
load (kN)
AV138=HV998 0.2 9.6 13.40.5 9.8 10.81 8.1 8.1
Hysol EA 9321 0.2 11.1 11.60.5 9.5 10.41 8.2 8.8
Hysol EA 9361 0.2 12.5 5.2 (11.6a)0.5 11 5.1 (11.3a)1 10 4.9 (10.6a)
aUsing properties of adhesive determined for a test speed of 100 mm=min.
Lap Shear Strength 1109
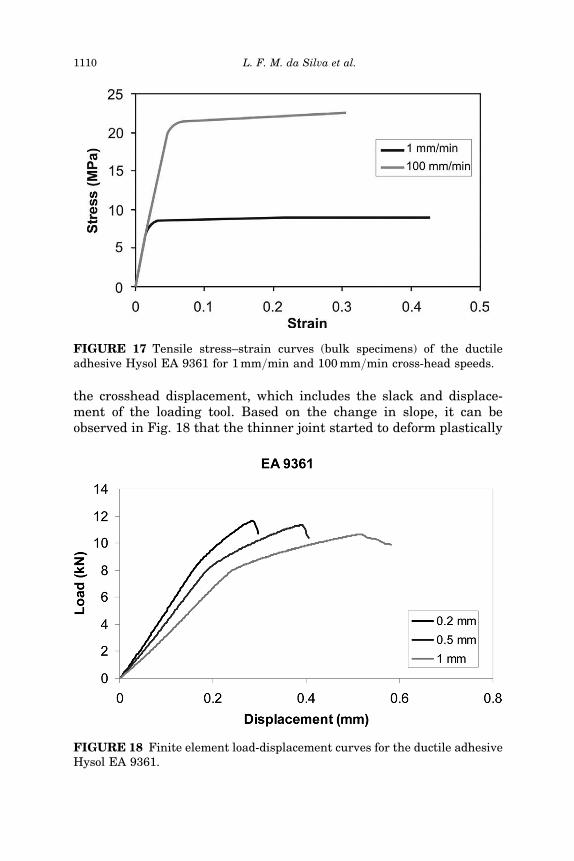
the crosshead displacement, which includes the slack and displace-ment of the loading tool. Based on the change in slope, it can beobserved in Fig. 18 that the thinner joint started to deform plastically
FIGURE 17 Tensile stress–strain curves (bulk specimens) of the ductileadhesive Hysol EA 9361 for 1 mm=min and 100 mm=min cross-head speeds.
FIGURE 18 Finite element load-displacement curves for the ductile adhesiveHysol EA 9361.
1110 L. F. M. da Silva et al.

at a higher load than the thicker one. However, it was verified thatthe localized plastic initiation of the adhesive that occurs at the endsof the overlap does not correspond to a change in slope, which isinduced by more extensive plastification. The localized plasticinitiation starts at a lower loading displacement and follows Cro-combe’s [5] predictions (i.e., the thinner the bondline the lower theplastic loading displacement).
5. STATISTICAL ANALYSIS
The experimental plan shown in Table 2, based on the Taguchimethod, permits one to assess the influence of the adhesive thicknessand the type of adhesive (toughness, UT) on the lap shear strength.The analysis of variance (ANOVA) (see Table 6) of the experimentalresults gives the relative importance of these two variables as wellas their interaction. The effect of the adhesive thickness is slightlymore important than the type of adhesive. The main effect of theadhesive thickness is shown in Fig. 19. It is practically linear. Toaccount for the effect of the type of adhesive, it was decided to useits toughness determined by the area under the stress–strain curve(see Table 1). This quantity best describes the type of adhesive becauseit includes the effect of the strength as well as the ductility. The maineffect of UT on the failure load is shown in Fig. 20. The relation is alsovery close to linearity. Note that the correlation obtained between thebulk adhesive toughness and the lap shear strength is valid only forthe test conditions used here.
Both effects (adhesive thickness and toughness) were included inthe prediction of the failure load according to Eq. (21) [26]:
FLpredict ¼M þ ðtai �MÞ þ ðUTi �MÞ; ð21Þ
where FLpredict is the failure load prediction, M is the average failureload, tai is the effect of the adhesive thickness at the level i, and UTi
is the effect of the type of adhesive (toughness, UT) at level i. The
TABLE 6 Analysis of Variance (ANOVA)
Source Mean square F value P value
Adhesive thickness (mm) 23.191 35.346 0.0001Type of adhesive 21.456 32.701 0.0001Interaction (adhesive thickness� type of adhesive) 1.875 2.858 0.0341Residual 0.656
Lap Shear Strength 1111

interaction (adhesive type� adhesive thickness) was not included inEq. (21) because the corresponding mean square (1.875, see Table 6)is small in comparison with the effect of adhesive type and adhesivethickness. Note, however, that the interaction effect is statistically
FIGURE 19 Average response graph with 95% error bars for the main effectof adhesive thickness.
FIGURE 20 Average response graph with 95% error bars for the main effectof the type of adhesive.
1112 L. F. M. da Silva et al.
valid for a level of significance of 95% because the P value is lowerthan 5% (0.0341; see Table 6). The values of tai and UTi can be determ-ined by the equation that best fits the points corresponding to the fail-ure load vs. adhesive thickness (see Fig. 19) and the failure load vs.adhesive toughness (see Fig. 20), respectively. By doing so, the follow-ing expression is obtained:
FLpredict ¼ 10:28� 2:81ta þ 0:91UT; ð22Þ
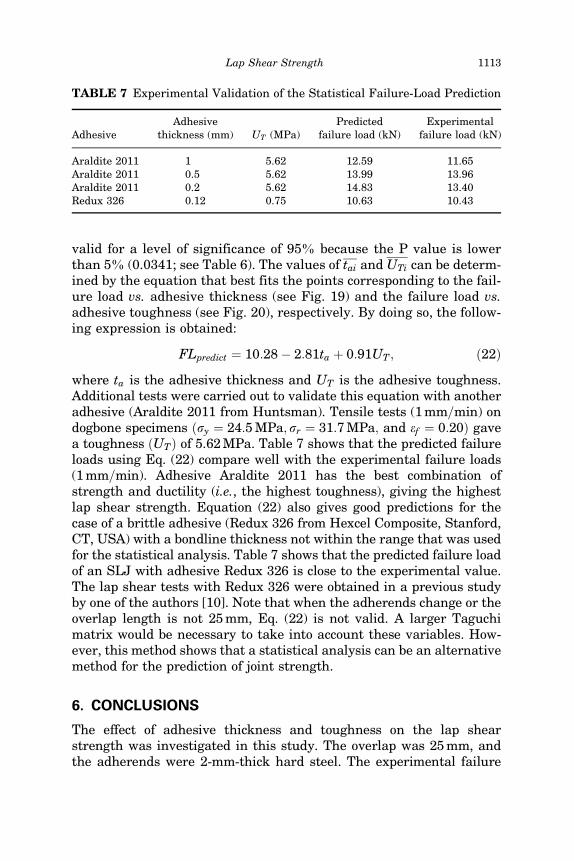
where ta is the adhesive thickness and UT is the adhesive toughness.Additional tests were carried out to validate this equation with anotheradhesive (Araldite 2011 from Huntsman). Tensile tests (1 mm=min) ondogbone specimens ðry ¼ 24:5 MPa; rr ¼ 31:7 MPa; and ef ¼ 0:20Þ gavea toughness ðUTÞ of 5.62 MPa. Table 7 shows that the predicted failureloads using Eq. (22) compare well with the experimental failure loads(1 mm=min). Adhesive Araldite 2011 has the best combination ofstrength and ductility (i.e., the highest toughness), giving the highestlap shear strength. Equation (22) also gives good predictions for thecase of a brittle adhesive (Redux 326 from Hexcel Composite, Stanford,CT, USA) with a bondline thickness not within the range that was usedfor the statistical analysis. Table 7 shows that the predicted failure loadof an SLJ with adhesive Redux 326 is close to the experimental value.The lap shear tests with Redux 326 were obtained in a previous studyby one of the authors [10]. Note that when the adherends change or theoverlap length is not 25 mm, Eq. (22) is not valid. A larger Taguchimatrix would be necessary to take into account these variables. How-ever, this method shows that a statistical analysis can be an alternativemethod for the prediction of joint strength.
6. CONCLUSIONS
The effect of adhesive thickness and toughness on the lap shearstrength was investigated in this study. The overlap was 25 mm, andthe adherends were 2-mm-thick hard steel. The experimental failure
TABLE 7 Experimental Validation of the Statistical Failure-Load Prediction
AdhesiveAdhesive
thickness (mm) UT (MPa)Predicted
failure load (kN)Experimental
failure load (kN)
Araldite 2011 1 5.62 12.59 11.65Araldite 2011 0.5 5.62 13.99 13.96Araldite 2011 0.2 5.62 14.83 13.40Redux 326 0.12 0.75 10.63 10.43
Lap Shear Strength 1113

loads were predicted by a finite element analysis considering interfacefinite elements and incorporating a progressive damage model. Theexperimental results were statistically treated to give a failure-load pre-dictive equation. The following conclusions can be drawn:
1. The lap shear strength increases as the adhesive thicknessdecreases.
2. The lap shear strength increases with the adhesive toughness ðUTÞ.3. The Taguchi method is a valid technique for prediction of lap shear
strength.4. The effect of adhesive thickness on the lap shear strength can be
explained by adhesive–adherend interface stresses.5. The interface elements, including a progressive damage model, are
a promising method for the failure load prediction.6. When predicting the joint failure load with the finite element
method, it is important to use the bulk adhesive properties determ-ined for a strain rate similar to the strain rate experienced by theadhesive in the joint.
REFERENCES
[1] Petrie, E. M., Handbook of Adhesives and Sealants (McGraw-Hill, New York, 2000),Chap. 4, pp. 151–156.
[2] Lee, D. B., Ikeda, T., Miyazaki, N., and Choi, N. S., Journal of Engineering Materi-als and Technology—Transactions of the ASME 126, 14–18 (2004).
[3] Volkersen, O., Luftfahrtforschung 15, 41–47 (1938).[4] Goland, M. and Reissner, E., J. Appl. Mech. 66, A17–A27 (1944).[5] Crocombe, A. D., Int. J. Adhes. Adhes. 9, 145–153 (1989).[6] Gleich, D. M., van Tooren, M. J. L., and Beukers, A., J. Adhes. Sci. Technol. 15,
1091–1101 (2001).[7] Adams, R. D. and Peppiatt, N. A., J. Strain Anal. 9, 185–196 (1974).[8] Taguchi, G., Chowdhury, S., and Taguchi, S., Robust Engineering (McGraw-Hill,
New York, 2000).[9] NF T 76-142, Methode de preparation de plaques d’adhesifs structuraux pour la
realisation d’eprouvettes d’essai de caracterisation, 1988.[10] Da Silva, L. F. M., Adams, R. D., and Gibbs, M., Int. J. Adhes. Adhes. 24, 69–83
(2004).[11] Chousal, J. A. and Gomes, J. F., Proceedings of M2D, Third International Confer-
ence on Mechanics and Materials in Design, S. A. Meguid (Ed.) (University ofToronto, 2000), pp. 269–270.
[12] Da Silva, L. F. M. and Adams, R. D., J. Adhes. Sci. Technol. 29, 109–142 (2005).[13] Dieter, G. E., Mechanical Metallurgy SI Metric Edition (McGraw-Hill, London,
1988), pp. 282–283.[14] Taguchi, G. and Konishi, S., Orthogonal Arrays and Linear Graphs (Asi Press,
Dearborn, MI, 1987), p. 36.
1114 L. F. M. da Silva et al.
[15] Adams, R. D. and Davies, R., Strength of lap shear joints, in The Mechanics ofAdhesion, D. A. Dillard and A. V. Pocius (Eds.) (Elsevier, Amsterdam, 2002),pp. 111–144.
[16] Goncalves, J. P. M., de Moura, M. F. S. F., Magalhaes, A. G., and de Castro, P. M. S. T.,Fatigue Fract. Eng. Mater. Struct. 26, 479–486 (2002).
[17] De Moura, M. F. S. F., Daniaud, R., and Magalhaes, A. G., Simulation of mechan-ical behaviour of composite bonded joints containing strip defects, Int. J. Adhes.Adhes. 26, 464–473 (2006).
[18] Fernlund, G. and Spelt, J. K., Int. J. Adhes. Adhes. 11, 221–227 (1991).[19] Tomczyk, A. J., MTS Adhesives Project 2: Report no. 5: Summary report:
Test methods for adhesive fracture properties, AEAT-0125 (AEA Technology,Oxfordshire, 1997).
[20] Bostrom, L., Method for determination of the softening behaviour of wood and theapplicability of a nonlinear fracture mechanics model, Ph.D. thesis, Srend Instituteof Technology, Report TVBM-1012, Lund, Sweden (1992).
[21] Drucker, D. C. and Prager, W., Quart. Appl. Math. 10, 157–165 (1952).[22] Raghava, R. S., Cadell, R., and Yeh, G. S. Y., J. Mater. Sci. 8, 225–232 (1973).[23] Dolev, G. and Ishai, O., J. Adhesion 12, 283–294 (1981).[24] Dean, G., Crocker, L., Read, B., and Wright, L., Int. J. Adhes. Adhes. 24, 295–306
(2004).[25] Ward, I. M., Mechanical Properties of Solid Polymers (John Wiley & Sons,
Chichester, UK, 1979), Chap. 12, pp. 368–370.[26] Fowlkes, W. Y. and Creveling, C. M., Engineering Methods for Robust Product
Design (Addison-Wesley, Reading, MA, 1995), Chap. 7, pp. 134–136.
Lap Shear Strength 1115