25 village of tarrytown - new york state energy … - village of tarrytown august 2016 notice the...
TRANSCRIPT

25 - Village of Tarrytown
August 2016

Notice
The opinions expressed in this report do not necessarily reflect those of the New York State Energy
Research and Development Authority (hereafter “NYSERDA”) or the State of New York, and reference
to any specific product, service, process, or method does not constitute an implied or expressed
recommendation or endorsement of it. Further, NYSERDA, the State of New York, and the contractor
make no warranties or representations, expressed or implied, as to the fitness for particular purpose or
merchantability of any product, apparatus, or service, or the usefulness, completeness, or accuracy of any
processes, methods, or other information contained, described, disclosed, or referred to in this report.
NYSERDA, the State of New York, and the contractor make no representation that the use of any
product, apparatus, process, method, or other information will not infringe privately owned rights and
will assume no liability for any loss, injury, or damage resulting from, or occurring in connection with,
the use of information contained, described, disclosed, or referred to in this report.
NYSERDA makes every effort to provide accurate information about copyright owners and related
matters in the reports we publish. Contractors are responsible for determining and satisfying copyright or
other use restrictions regarding the content of reports that they write, in compliance with NYSERDA’s
policies and federal law. If you are the copyright owner and believe a NYSERDA report has not properly
attributed your work to you or has used it without permission, please email [email protected]
ii


PON 3044 Final Report – Tarrytown
i
TableofContents
Executive Summary ....................................................................................................................................... 1
Task 1: Description of Microgrid Capabilities ............................................................................................... 3
Task 2: Develop Preliminary Technical Design Costs and Configuration ..................................................... 27
Sub Task 2.1 Proposed Microgrid Infrastructure and Operations .......................................................... 33
Sub Task 2.2 Load Characterization ........................................................................................................ 34
Sub Task 2.3 Distributed Energy Resources Characterization ................................................................ 43
Sub Task 2.4 Electrical and Thermal Infrastructure Characterization ..................................................... 50
Sub Task 2.5 Microgrid and Building Controls Characterization ............................................................ 64
Sub Task 2.6 Information Technology (IT)/Telecommunications Infrastructure Characterization ........ 70
Task 3: Assessment of the Community Microgrid’s Commercial and Financial Feasibility ........................ 74
Sub Task 3.1 Commercial Viability – Customers ..................................................................................... 74
Sub Task 3.2 Commercial Viability ‐ Value Proposition .......................................................................... 76
Sub Task 3.3 Commercial Viability ‐ Project Team .................................................................................. 82
Sub Task 3.4 Commercial Viability ‐ Creating and Delivering Value ....................................................... 83
Sub Task 3.5 Financial Viability ............................................................................................................... 88
Sub Task 3.6 Legal Viability ..................................................................................................................... 95
Task 4: Cost Benefit Analysis ....................................................................................................................... 97
Benefit‐Cost Analysis Summary Report ‐ Site 25 – Village of Tarrytown ................................................ 97
Disclaimer .............................................................................................................................................. 105
Acknowledgement .................................................................................................................................... 106
Appendix .............................................................................................................................................. 107
Tarrytown NY Prize Benefit‐Cost Analysis: Microgrid Questionnaire ................................................... 108
Tarrytown NY Prize Benefit‐Cost Analysis: Facility Questionnaire ....................................................... 122
Tables
Table 1. Total System Community Microgrid Existing and Proposed Overview .................................... 3
Table 2. Electrical Load Type .................................................................................................................. 7
Table 3. Tarrytown Critical Loads (Year 2014) ........................................................................................ 8
Table 4. Tarrytown Existing Backup Generators ................................................................................... 10
PON 3044 Final Report – Tarrytown
ii
Table 5. Distributed Energy Resources ................................................................................................. 11
Table 6. Continuous Investment Parameters ....................................................................................... 30
Table 7. Discrete Investment Parameters ............................................................................................ 30
Table 8. Electrical Load Type ................................................................................................................ 34
Table 9. Originally Considered Critical Facilities (Year 2014) ............................................................... 37
Table 10. Microgrid Cluster Breakdown ................................................................................................. 39
Table 11. Tarrytown Existing Backup Generators ................................................................................... 44
Table 12. Main Parameters of Existing Backup Generators ................................................................... 44
Table 13. Main Parameters of Candidate CHP units ............................................................................... 45
Table 14. The Annual Costs Savings by the Investment for Supplying the Facilities in Tarrytown with Islanding in Peak Load Season (July) ............................................................................... 55
Table 15. The Annual Costs Savings by the Investment for Supplying Power for Total System Critical Facilities with One Week Islanding in Peak Load Season (July) .................................. 61
Table 16. Serving Total System Critical Facilities with Islanding in Peak Load Season (July) ................. 62
Table 17. The Protection Devices and Operation Rules at Each Protection Level ................................. 64
Table 18. SWOT Analysis ......................................................................................................................... 77
Table 19. Stakeholder Value Proposition ............................................................................................... 81
Table 20. Microgrid Cluster Breakdown ................................................................................................. 86
Table 21. Illustrative Example of ConEd ICAP Revenues ........................................................................ 90
Table 22. Con Ed Ancillary Service Charges ............................................................................................ 90
Table 23. ConEd SC‐11 Contract Demand Charges ................................................................................. 93
Table 24. BCA Results (Assuming 7 Percent Discount Rate) ................................................................... 99
Table 25. Detailed BCA Results, Scenario 1 (No Major Power Outages; 7 Percent Discount Rate) ..... 101
Figures
Figure 1. Critical Facilities for the Tarrytown Community Microgrid ...................................................... 6
Figure 2. Sleepy Hollow Cluster ............................................................................................................. 13
Figure 3. Tarrytown Cluster 1 ................................................................................................................ 14
Figure 4. Tarrytown Cluster 2 ................................................................................................................ 15
Figure 5. Crossover Cluster 1 ................................................................................................................. 16
Figure 6. Crossover Cluster 2 ................................................................................................................. 17

PON 3044 Final Report – Tarrytown
iii
Figure 7. Objectives and Functions for the Control and Operation of the Tarrytown Community Microgrid ................................................................................................................................. 20
Figure 8. Architecture of Master Controller for Tarrytown Community Microgrid ............................... 21
Figure 9. Tarrytown Proposed LED Lighting Communications and Control Diagram ............................ 24
Figure 10. Village of Tarrytown (Below the line) and Village of Sleepy Hollow (Above the line) ........... 25
Figure 11. Critical Facilities Clusters ......................................................................................................... 26
Figure 12. Schematic of information flow in DER‐CAM ........................................................................... 29
Figure 13. Tarrytown Generation Simplified Equipment Layout Diagram .............................................. 33
Figure 14. Load Simplified Layout Diagram for the Tarrytown Community Microgrid ........................... 36
Figure 15. Total System Average Daily Load by Month ........................................................................... 41
Figure 16. Pre Investment Average Electricity Dispatch for Total System ............................................... 41
Figure 17. Pre Investment Average Heating Dispatch for Total System .................................................. 42
Figure 18. Post Investment Average Electricity Dispatch for Total System ............................................. 42
Figure 19. Post Investment Average Heating Dispatch for Cluster Total ................................................. 42
Figure 20. Proposed Generation for Microgrid Clusters in Tarrytown .................................................... 47
Figure 21. Total System Sensitivity Analysis Results for Natural Price .................................................... 49
Figure 22. Sleepy Hollow Cluster 1 .......................................................................................................... 51
Figure 23. Tarrytown Cluster 1 ................................................................................................................ 52
Figure 24. Crossover Cluster 1 ................................................................................................................. 53
Figure 25. Crossover Cluster 2 ................................................................................................................. 54
Figure 26. DER‐CAM Investment Results – Serving Total System Critical Facilities with One Week Island in July .................................................................................................................. 56
Figure 27. Total System Optimal Dispatch During Islanding Mode ......................................................... 57
Figure 28. Total System Optimal Dispatch in Grid‐Connected Mode ...................................................... 57
Figure 29. Proposed DER Capacity and Operation Cost for Serving 100% of Total System Critical Facilities ................................................................................................................................... 58
Figure 30. Proposed DER Capacity and Operation Cost for Serving 90% of Total System Critical Facilities ................................................................................................................................... 58
Figure 31. Proposed DER Capacity and Operation Cost for Serving 80% of Total System Critical Facilities ................................................................................................................................... 59
Figure 32. Proposed DER Capacity and Operation Cost for Serving 70% of Total System Critical Facilities ................................................................................................................................... 60

PON 3044 Final Report – Tarrytown
iv
Figure 33. Proposed DER Capacity and Operation Cost for Serving 60% of Total System Critical Facilities ................................................................................................................................... 60
Figure 34. Load Transfer Procedure ......................................................................................................... 62
Figure 35. Objectives and Functions for the Control and Operation of the Community Microgrid ........ 65
Figure 36. Architecture of Master Controller for theP Community Microgrid ........................................ 66
Figure 37. Master Controller for Microgrid Clusters................................................................................ 68
Figure 38. Tarrytown Proposed Wireless Mesh Network Communications and Control Diagram ......... 71
Figure 39. Network Equipment Simplified Layout Diagram..................................................................... 72
Figure 40. Sleepy Hollow Load Simplified Layout Diagram ...................................................................... 85
Figure 41. Tarrytown Load Simplified Layout Diagram ............................................................................ 85
Figure 42. Present Value Results, Scenario 1 (No Major Power Outages; 7 Percent Discount Rate) .... 100

PON 3044 Final Report – Tarrytown
1
Executive Summary
The Village of Tarrytown, located in Westchester County, New York, selected Willdan to perform a
community microgrid feasibility study in response to the NY Prize solicitation by NYSERDA. Tarrytown
and Sleepy Hollow, both Willdan NY Prize recipients, neighbor each other and share buildings, electrical
infrastructure, and a joint authority that operates and maintains the cities’ water resources along with
nearby Briarcliff Manor.
Willdan has worked closely with its technology partners, community stakeholders, and the electric and
gas utility, ConEd, to develop the best case microgrid application to address relatively high electricity
prices, around $11.55 cents/kWh, to harden the electric and water utilities with long term generation
resources, and to provide a robust solution for the communities in an emergency situation.
This study has resulted in the recommendation of 1,100 kW of natural gas fed generation resources
shared between the two communities, with 450 kW of that being Combined Heat and Power (CHP) to
provide electric backup and emergency heat to the communities’ critical facilities. The critical facilities
originally identified were separated based on their electric feeder configuration and utility
recommendations into four load clusters as well as additional facilities that would not be in any cluster,
but would be considered for behind the meter improvements.
The four clusters are: Sleepy Hollow Cluster 1, which includes Rescue Hose Fire Co, the Police, Village,
and Fire Department building, Union Hose Fire Co, and North Tarrytown Housing Authority, Tarrytown
Cluster 1, which includes the Police Department, Riverside Hose, and Tarrytown Municipal Housing
Authority, Crossover Cluster 1, which includes the sleepy Hollow High School and the John Paulding
School, and Crossover Cluster 2, which includes the three water pump stations for Sleepy Hollow,
Tarrytown, and Briarcliff Manor. The recommended resources, along with existing backup generators
and non-critical load shedding, prove technically and financially viable to support the clustered
community microgrid as detailed in the following report.
Recommendations
Technical
Phased Design Approach
1. Generation Assets: 1,100 kW Natural Gas Fed Generators
2. Load Control and Energy Conservation Measures: Smart Building and Sub-Building Controllers and
Energy Management System
3. Wiring Reconfiguration: Four Clustered Microgrids that Maximize Existing Electrical Infrastructure
4. Communication Connectivity: Fiber Optic Backbone, Wireless Mesh Network Deployment
5. Microgrid Master Controller: Connect and Optimize Every Device in the System, Operator Friendly
Interface

PON 3044 Final Report – Tarrytown
2
Operations and Maintenance
1. Utilize equipment vendor warranties
2. Setup automatic notifications, remote monitoring, automated reporting
3. Train Maintenance Personnel

PON 3044 Final Report – Tarrytown
3
Task 1: Description of Microgrid Capabilities
Willdan will demonstrate that the proposed microgrid has the minimum required capabilities:
Table 1. Total System Community Microgrid Existing and Proposed Overview1
1 Estimation of the costs and benefits at this stage of the NY prize competition (Feasibility) is likely to be accurate within +/- 30%. The emphasis at this stage of analysis is on establishing a reasonable basis for competing for funding for a detailed, audit-grade engineering and business case analysis at a subsequent stage of the NY Prize Community Grid Competition.
2 This number was obtained from the available information at the time; a reported 30 kW generator, 80 kW generator, and 175-200 kW generator (assumed to be 175 kW) and one confirmed generator with unreported capacity that was estimated to be 200 kW based on the ratio of the peak electric demand vs generator size of other buildings in Tarrytown.
Category Existing Resources Proposed/Suggested
Improvement Justification
Load
18 public Critical facilities
Over 1,670.6 kW coincident peak electrical demand
Over 141.52 Therms/Hr peak gas demand
Building Energy Efficiency
LED Street lighting Load Curtailment Peak Shaving
Resilience Cost Savings
Distributed Energy Resources (DERs)
At least 8 Backup Diesel Generators with capacity totaling over 655 kW2
2 backup Natural Gas Generators with capacity totaling 180 kW
150 kW Natural Gas Fired CHP for Sleepy Hollow Cluster 1
150kW Natural Gas Fired CHP for Tarrytown Cluster1
300kW Natural Gas Fired CHP for Crossover Cluster 1
500kW Natural Gas Fired Generator for Crossover Cluster 2
Demand Response Revenue
Resilience Renewable Sources
Electrical and Thermal
Infrastructure
13 kV Primary Feeder Underground
Secondary Network Network of Natural Gas
Mains
High Reliability Distribution System
Self-Healing
Resilience Reliability
Master Controller and Building
Controls
Limited Building Controls
Connected Master controller
Upgraded building controls
Resilience Optimal utilization of
Microgrid Assets
IT/Communication Infrastructure
Manual Meters Some System Level
Load metering
Advanced Metering Infrastructure (AMI)
900 MHz mesh network Fiber optic backbone Control interface for DER
Resilience Reliable real time
information Remote Control

PON 3044 Final Report – Tarrytown
4
Introduction
The Village of Tarrytown is proposing a feasibility study to implement a community microgrid
(“Tarrytown Community Microgrid”). Con Edison will act as the local electric distribution company and
the gas distribution company during this feasibility study and will be joined by the Village of Tarrytown
participating as the Local Government.
The Village of Tarrytown is an economically and culturally diverse community with a population of
11,000. Tarrytown shares a public school system with Sleepy Hollow (Public Schools of the Tarrytowns)
as well as water resources and a large community border. The Lower Hudson Valley has been
increasingly affected by severe weather with disruptions to basic services resulting from outages from
major storms such as Lee, Sandy, the October 2011 Winter Storm, and more localized severe weather
related problems such as the 2006 Westchester County tornado which cut power to 10,000 people in
the county. Willdan proposes community microgrid for the Village, which will enhance the overall
operational reliability of the electrical distribution system for all of the stakeholders, by providing a
master controller which has the ability to perform, in real-time, reconfiguration of the microgrid
functions, seamless islanding for economic, reliability, or resilience reasons, and optimization of
generation resources.
The Village’s critical loads will remain powered on while the microgrid is islanded. In addition to
providing resiliency for critical loads, Willdan’s proposed Community microgrid could provide economic
and reliability benefits for the Villages’ electric power customers including critical facilities such as fire
and police public safety services, medical services, and water treatment plants, as well as maintaining
power for public street lighting and security lighting all across Tarrytown while the microgrid is islanded
and during any prolonged period of loss of bulk power.
The existing technologies that support smart grid and microgrid capabilities will be screened for their
application to the Community microgrid. This involves appropriating the benefits to the specific wants
and needs of the stakeholders as well as thinning the list to the reasonable and applicable technologies
for the region. The remaining technologies, applications, and revenue streams are then evaluated based
on financial and technical feasibility in their application to the Community microgrid. This primarily
consists of detailed research into the existing infrastructure available and compatibility of the proposed
technology with this infrastructure and with the other resources available in the microgrid. Finally, the
passing technologies are studied in detail, with tools such as the Distributed Energy Resources Customer
Adoption Model (DER-CAM), to determine the range of acceptable capacity as well as the rough costs
and cost savings.
Community Microgrid
Willdan proposes a community microgrid for the Village of Tarrytown, which will enhance the overall
operational reliability of the electrical distribution system. By providing a master controller, the
Community Microgrid would be capable of seamless islanding and resynchronization for economic,
reliability, or resilience purposes. Seamless islanding and resynchronization is defined as automatic

PON 3044 Final Report – Tarrytown
5
separation from the grid on loss of utility power and automatic restoration of grid power after an outage
on the grid side is cleared.
Normal operating conditions would see reliability improvements, through infrastructure reconfiguration,
such as a High Reliability Distribution System (HRDS) which senses and clears faults with virtually no
impact on building loads, to a self-healing and more fault tolerant grid, reducing the number of single
points of failure by adding redundancy to the electrical and communications networks, and by adding
alternate sources of generation to serve critical and non-critical loads. In addition to increased reliability,
or a reduction in the frequency and/or duration of outages, the Community Microgrid would reap
economic benefits in the form of added revenue streams from demand response, alternate generation
sources, and energy efficiency measures to reduce overall energy costs. Additional revenue streams
could be realized by participating in ancillary service markets such as fast regulation and operating
reserve markets. Based on the price of electricity and availability of Distributed Energy Resources
(DERs), the master controller will optimally dispatch the units to provide the cheapest, cleanest, and
most reliable energy possible to the critical and non-critical microgrid facilities.
During emergency operating conditions, the Community Microgrid master controller would optimize
generation and load to provide uninterrupted power to critical loads, through the use of DERs and load
shedding schemes that ensure safe and reliable operation of the buildings that matter most in
emergency situations. Long term outages will be mitigated by large natural gas fed combined heat and
power (CHP) plant, which will maintain a black-start capability in the event the outage occurs when the
CHP facility is not active. These plant or plants will rely on robust natural gas pipelines and produce
enough power to serve all of the critical facilities, public street and security lighting, and some
residential load. This added resiliency will keep emergency responders and residents safe and provide
the Community Microgrid with heat and power when it needs it most.
Load
Tarrytown Existing Resources
The total population of Tarrytown’s electric service territory is approximately 11,000. During the winter
season, Tarrytown depends on natural gas for heating. Figure 141 shows the monthly average demand
for the load in Tarrytown and Sleepy Hollow. The locations of eight critical facilities plus one private
retail center are shown in Figure 1.
As Willdan is working closely with the community members and ConEd to acquire all of the necessary
information to successfully perform the feasibility study, Task 2 will see more detailed load information
for the critical facilities, and for the identified clusters, as well as specific analyses. To avoid additional
delays in Task 1, this information was temporarily left out and added into Task 2 and the final reports.
1 This is shown in figure 15 as it was included in Task 2 when more data was available at the recommendation of the NYSERDA project manager.
PON 3044 Final Report – Tarrytown
6
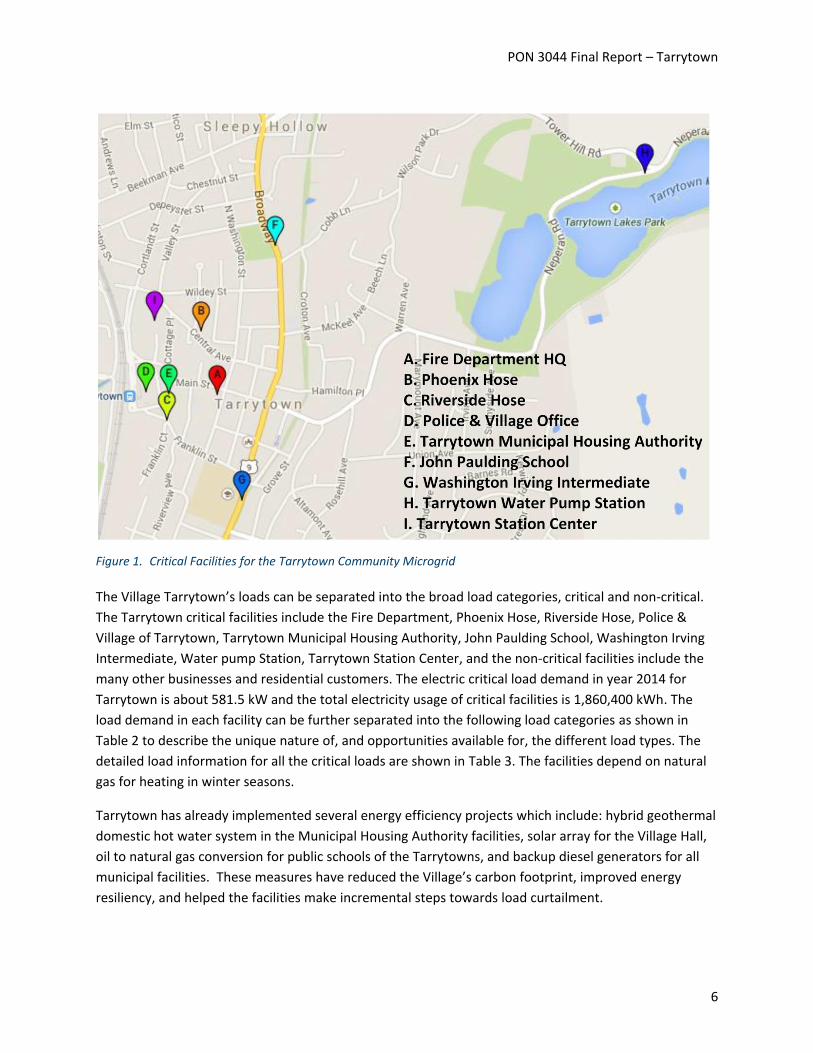
Figure 1. Critical Facilities for the Tarrytown Community Microgrid
The Village Tarrytown’s loads can be separated into the broad load categories, critical and non-critical.
The Tarrytown critical facilities include the Fire Department, Phoenix Hose, Riverside Hose, Police &
Village of Tarrytown, Tarrytown Municipal Housing Authority, John Paulding School, Washington Irving
Intermediate, Water pump Station, Tarrytown Station Center, and the non-critical facilities include the
many other businesses and residential customers. The electric critical load demand in year 2014 for
Tarrytown is about 581.5 kW and the total electricity usage of critical facilities is 1,860,400 kWh. The
load demand in each facility can be further separated into the following load categories as shown in
Table 2 to describe the unique nature of, and opportunities available for, the different load types. The
detailed load information for all the critical loads are shown in Table 3. The facilities depend on natural
gas for heating in winter seasons.
Tarrytown has already implemented several energy efficiency projects which include: hybrid geothermal
domestic hot water system in the Municipal Housing Authority facilities, solar array for the Village Hall,
oil to natural gas conversion for public schools of the Tarrytowns, and backup diesel generators for all
municipal facilities. These measures have reduced the Village’s carbon footprint, improved energy
resiliency, and helped the facilities make incremental steps towards load curtailment.

PON 3044 Final Report – Tarrytown
7
Table 2. Electrical Load Type
Type Description Opportunities
Lighting General, task, exits, and stairwells, decorative, parking lot, security, normal, and emergency.
Load curtailment
Transportation Elevators, dumbwaiters, conveyors, escalators, and moving walkways.
Critical Load
Appliances Business and copying machines, receptacles for vending machines, and general use
Load curtailment
Data processing Desktop computers, central processing and peripheral equipment, and uninterruptible power supply (UPS) systems, including related cooling
Critical Load
Space conditioning
Heating, cooling, cleaning, pumping, and air-
handling units
Short term Load curtailment and
shifting
Food preparation Cooling, cooking, special exhausts, dishwashing, disposing, and so forth
Load curtailment
Plumbing and sanitation
Water pumps, hot water heaters, sump and sewage pumps, incinerators, and waste handling
Short term load curtailment
Special loads For equipment and facilities in mercantile buildings, restaurants, theaters, recreation and sports complexes, religious buildings, health care facilities, laboratories, broad casting stations, and so forth
Critical load
Fire protection Fire detection, alarms, and pumps Critical Load
Miscellaneous loads
Security, central control systems, communications; audio-visual, snow-melting, recreational, or fitness equipment
Critical load
PON 3044 Final Report – Tarrytown
8
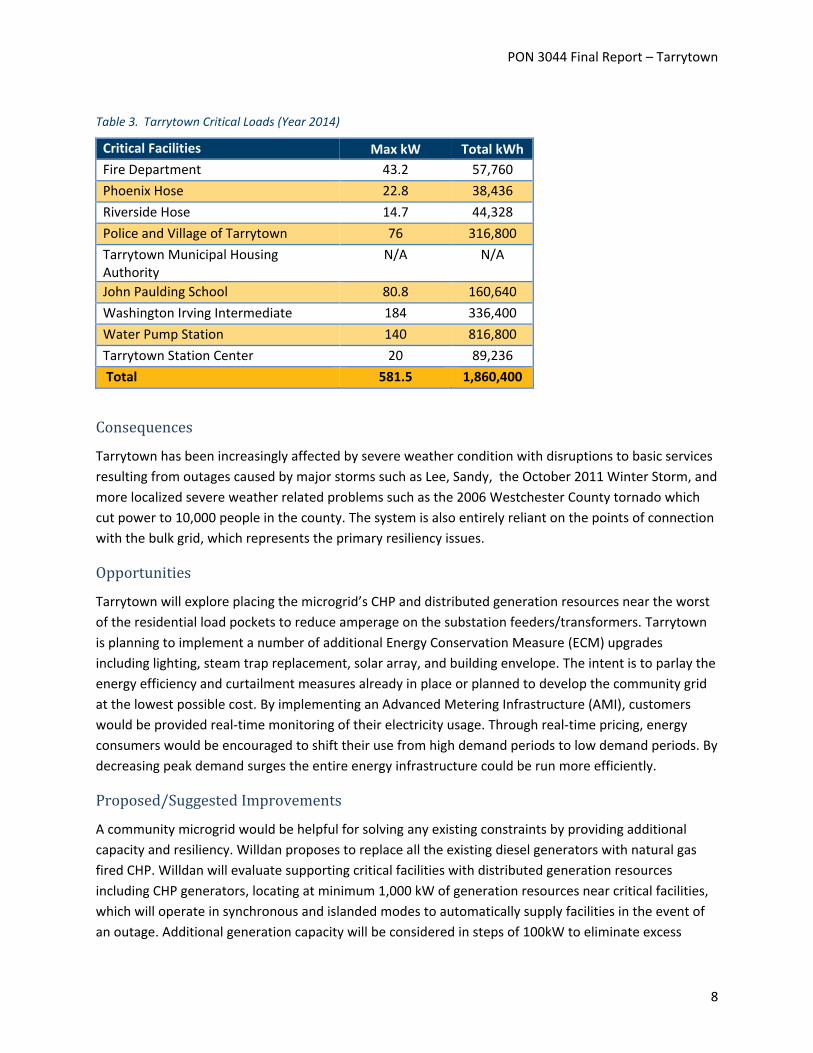
Table 3. Tarrytown Critical Loads (Year 2014)
Critical Facilities Max kW Total kWh
Fire Department 43.2 57,760
Phoenix Hose 22.8 38,436
Riverside Hose 14.7 44,328
Police and Village of Tarrytown 76 316,800
Tarrytown Municipal Housing Authority
N/A N/A
John Paulding School 80.8 160,640
Washington Irving Intermediate 184 336,400
Water Pump Station 140 816,800
Tarrytown Station Center 20 89,236
Total 581.5 1,860,400
Consequences
Tarrytown has been increasingly affected by severe weather condition with disruptions to basic services
resulting from outages caused by major storms such as Lee, Sandy, the October 2011 Winter Storm, and
more localized severe weather related problems such as the 2006 Westchester County tornado which
cut power to 10,000 people in the county. The system is also entirely reliant on the points of connection
with the bulk grid, which represents the primary resiliency issues.
Opportunities
Tarrytown will explore placing the microgrid’s CHP and distributed generation resources near the worst
of the residential load pockets to reduce amperage on the substation feeders/transformers. Tarrytown
is planning to implement a number of additional Energy Conservation Measure (ECM) upgrades
including lighting, steam trap replacement, solar array, and building envelope. The intent is to parlay the
energy efficiency and curtailment measures already in place or planned to develop the community grid
at the lowest possible cost. By implementing an Advanced Metering Infrastructure (AMI), customers
would be provided real-time monitoring of their electricity usage. Through real-time pricing, energy
consumers would be encouraged to shift their use from high demand periods to low demand periods. By
decreasing peak demand surges the entire energy infrastructure could be run more efficiently.
Proposed/Suggested Improvements
A community microgrid would be helpful for solving any existing constraints by providing additional
capacity and resiliency. Willdan proposes to replace all the existing diesel generators with natural gas
fired CHP. Willdan will evaluate supporting critical facilities with distributed generation resources
including CHP generators, locating at minimum 1,000 kW of generation resources near critical facilities,
which will operate in synchronous and islanded modes to automatically supply facilities in the event of
an outage. Additional generation capacity will be considered in steps of 100kW to eliminate excess

PON 3044 Final Report – Tarrytown
9
consumption for the residential and commercial load pockets near the critical facilities. Innovative
technologies and new generation sources including solar, wind, tidal, combined heat and power (CHP),
power and battery storage, and off-grid hybrid wind and solar LED lighting will also be studied for its
environmental and economic benefits. New CHP plants and demand response would help in mitigating
the reliance on power from utility grid. Willdan proposes to replace all the existing lighting with high
efficient LED (Light Emitting Diode) fixtures. By applying the latest building control technology in each
building, Sleepy Hollow would be able to have the direct control capability on the curtailable and shift-
able loads through a microgrid master controller. Willdan recommends educating the residential
customers to participate in peak-load demand response program.
Benefits
With a community microgrid, the Village would be able to provide more reliable electricity to its electric
customers. The critical facilities would remain powered on in emergency situations and when the power
supply from the utility grid is lost. The community microgrid would also help the Village to reduce the
high cost of purchasing power from the bulk provider. By using the more efficient and safe LEDs for
public street lighting and residential lighting, both commercial and residential customers can reduce
maintenance cost and electricity bills. With the capability of direct control of the loads, the Village would
not only be able to improve the reliability of the community distribution system, but would have the
potential to participate in ancillary service markets such as, frequency regulation, demand response, etc.
Electric customers would also have better quality of electricity service while reducing their electricity
bills.
Barriers
Implementing the community microgrid would require new investment in generation resources and
distribution equipment devices. A greater review of the exact equipment installed must be done to
determine any necessary reconfiguration of the existing distribution network and communication
system. It would also be necessary to educate the electric customers that would be involved in the
demand response program.
DERs
Existing Resources
The existing DERs located in the proposed Community microgrid are used primarily as backup
generators in the event that utility power is interrupted. The Village has already implemented several
ECMs which include backup diesel generators for all municipal facilities. Based on the most recent
review, many of the DERs located in the Village are Diesel Generators, distributed among the critical
facilities, and retain about a week of fuel. The existing DERs related to critical loads are shown in figure
1. The detailed location and capacity information of the existing DERS are listed in table 4.

PON 3044 Final Report – Tarrytown
10
Table 4. Tarrytown Existing Backup Generators
Location Capacity (kW) Fuel Type
Fire Department 100 Natural Gas
Phoenix Hose 80 Diesel
Riverside Hose 55 Natural Gas
Police and Village of Tarrytown
175 Diesel
Tarrytown Municipal Housing Authority
30 Diesel
John Paulding School 0 N/A
Washington Irving Intermediate
0 N/A
Water pump Station YES TBD
Tarrytown Station Center 0 N/A
Total 440 kW 155 kW NG
285 kW Diesel
Consequences
Based on the last available information, not all the critical facilities have backup generators to supply
power in the event of an emergency. Comparing table 3 with table 4, there is a disparity between the
generation available and the peak load of critical facilities. It can be seen that backup generation is not
available for John Paulding School, Washington Irving Intermediate, and Tarrytown Station Center . This
means that a number of vital critical facilities, including those that would be used as emergency shelters,
would be out of power in the event of an emergency, putting the entire county of Westchester in a
dangerous position. In addition, the community pays to maintain and test the backup generators, or
runs the risk of the generators not working when needed, and doesn’t see any value added beyond
emergency situations. Finally, it is worth noting that all the generation runs off of diesel fuel, which is a
relatively dirty fuel source that reduces the quality of the air and increases the carbon footprint of the
Village, and must be stored or shipped into the village in the event of an outage.
Opportunities
Tarrytown is considering innovative technologies and new generation sources which include solar, wind,
tidal, combined heat and power (CHP), battery storage, and off-grid hybrid wind and solar LED lighting.
Based on its close proximity to the Hudson River, Willdan intends to vet the use of “Tidal Electric” and
advanced hybrid solar wind technologies as well as solar, and wind. Tarrytown is exploring innovative
projects and smart grid circuit isolation to meet its demand and consumption needs such as using
combined heat and power (CHP) generation. The Village is interested in exploring an expansion of CHP
for a number of their critical facilities. This expansion would allow the Village to participate in Demand
Response programs and reduce their dependency on utility electric power purchases.

PON 3044 Final Report – Tarrytown
11
Proposed/Suggested Improvements
DER Technology
Table 5 includes the screened technologies and their barriers and opportunities specific to the Village.
Table 5. Distributed Energy Resources
Type Description Barriers Opportunities
Combined Heat and Power (CHP)
Natural Gas fired turbines used to generate electricity and provide heat to nearby buildings
Space, Capital Cost,
Cost of NG, Heating Infrastructure
Clean and Reliable,
Reduce winter peak load, Resiliency
Solar Renewable energy source powered by the sun
$/kW of solar is greater than electricity price
Clean, Reduce daytime peak load
Electric Storage Converts electrical energy to chemical or mechanical for rapid dispatch when needed
Space, Capital Cost Fast Regulation, Provides power during NG spool up
ICE Distributed Generation (ICE
DG) Backup generation
Cost, Range of use, Maintenance
Black Start for CHP, Provides power during NG spool up
Wind Renewable energy source powered by the wind
Space, Capital Cost, maintenance
Clean Source
Hydro Renewable energy source powered by the flow of water
Location, Cost, maintenance
Clean Source
Alternative Fuel Sources
Production of fuel from local processes (garbage dump, WWTP)
Supply Converts waste into electricity
Tidal Renewable energy source powered by the wave
Location, Cost, maintenance
Clean Source, Reliable, High Efficiency
A screening of the available DER technology available to the Community microgrid favors CHP, Batteries
as Energy Storage, Anaerobic Digestion as an Alternate Fuel Source, ICE DG1 as black start generators for
CHP, and solar. Based on initial analyses, Wind, Tidal and Hydro, are not justified economically or in
terms of resiliency, investment cost, or locations and do not merit further consideration.
Benefits
The addition of a range of DERs, including long term sources like CHP, small hydro, and short term
sources like Batteries, solar and ICE DG, would allow the Village to operate as a microgrid and to take
advantage of new revenue streams such as Demand Response and Fast Regulation Markets. The
planned generation capacity and distribution automation capabilities are expected to dramatically
increase available capacity for demand-response, increase resiliency through on-site generation, and
1 In Case of Emergency Distributed Generator.

PON 3044 Final Report – Tarrytown
12
reduce charges associated with high winter heating loads by utilizing generation near residential load
pockets. Distribution of these additional resources close to the school system, the fire department,
nursery facilities and other critical facilities, will ensure that critical facilities will remain powered on in
emergencies, providing the Village with peace of mind.
Barriers
Considering the utilization of equipment vendor warranties, plant managers for CHP will have to be
hired internally or externally and training will be required for maintenance and operators of the
proposed DERs.
Electrical and Thermal Infrastructure
Existing Resources
Consolidated Edison (ConEd) owns and operates the distribution system within the village to serve all
the electricity and natural gas customers. A number of clusters of critical facilities have been identified
as likely candidates for generation resources and their infrastructure can be seen in two groups,
Tarrytown clusters and Crossover clusters with critical facilities in both Tarrytown and Sleepy Hollow.
Sleepy Hollow Cluster
The identified Sleepy Hollow cluster, figure 2, includes the Rescue Hose and the Village Hall, Police, and
Fire department all fed off a 500 kVA transformer off of the Sleepy Hollow 13 kV primary feeder and the
Union Hose and the North Tarrytown Housing Authority, each fed off their own individual 500 kVA
transformer off the 13 kV primary feeder. There is available Natural Gas on Cortland Street and off of
Pocantico Street.

PON 3044 Final Report – Tarrytown
13
Figure 2. Sleepy Hollow Cluster
Tarrytown Clusters
Seen in figure 3 is Tarrytown Cluster 1, which includes the Tarrytown Police and Village Office, the
Riverside Hose, and the Tarrytown Municipal Housing Authority (TMHA), connected at the end of a
feeder spur. The Tarrytown Police and Village office is fed from a pad mount transformer and Riverside
Hose and the TMHA are fed by pole top transformers. There is a 12” medium pressure (MP) natural gas
(NG) main running up Franklin Street as well as an 8” MP NG main running down White Street, which is
used to heat the critical facilities. There are a number of commercial and residential customers between
the critical facilities identified that will be considered as microgrid customers.

PON 3044 Final Report – Tarrytown
14
Figure 3. Tarrytown Cluster 1
The identified Tarrytown Cluster 2 can be seen in figure 4. All of the shops of the Tarrytown Station
Center are fed from the underground secondary network. There are 12” low pressure (LP) NG main
running up Cortlandt Street and Wildey Street and 8” High Pressure (HP) NG main running down Central
Avenue. 130 Wildey Street through 140 Wildey Street are all fed from this secondary network and can
be isolated without affecting other customers.

PON 3044 Final Report – Tarrytown
15
Figure 4. Tarrytown Cluster 2
Crossover Clusters
The first of the identified crossover clusters, figure 5, includes both the Sleepy Hollow High and John
Paulding Schools which are fed from the underground secondary network. Sleepy Hollow High School
has a dedicated pad mount transformer fed from a primary riser. Both schools are directly next to each
other and no other customers would have to be recruited to isolate the schools. There is an 8” HP NG
main running down Depeyster Street and a 6” LP NG main running up Broadway.

PON 3044 Final Report – Tarrytown
16
Figure 5. Crossover Cluster 1
The second crossover cluster, figure 6, involves three somewhat remote Village pumping stations,
Briarcliff, and two for Tarrytown. Each of the three pumping stations is fed from a 500 KVA transformer
off of the ConEd open wire primary feeder.

PON 3044 Final Report – Tarrytown
17
Figure 6. Crossover Cluster 2
Consequences
Tarrytown has been increasingly affected by severe weather with disruptions to basic services resulting
from outages from major storms. 2006 Westchester County tornado cuts power to 10,000 people in the
county. Any failure at the points of connection would remove electric service to all of the Village’s
customers, including critical facilities such as fire and police public safety services, and water treatment
plants. The communities have long been concerned about the vulnerability to interruption of bulk
supply.
Opportunities
Tarrytown will explore placing the community grid’s CHP distributed generation resources near the
identified clusters of critical load, while supporting surrounding residential and commercial customers
that are interested in resiliency and economic benefits. Investment in a microgrid is a preferred path of
the Village to improve the community’s safety and resiliency. A community microgrid would solve any
constraints by providing additional capacity and resiliency to the electric system. The Village is also

PON 3044 Final Report – Tarrytown
18
looking forward to utilizing the heat produced from planned CHP for heating critical facilities and
surrounding buildings.
Proposed/Suggested
Willdan proposes a Loop-based community microgrid, where possible, for the critical facility clusters.
This new distribution network has a meshed structure which can operate as loop or radial, though it is
normally operated as radial (i.e., with no loop) so as to make the protection coordination easier
(upstream to downstream) and to make the distribution design easier. Also, the Automatic Transfer
Switch (ATS) is proposed to be deployed within the community microgrid, which has the capability of
network reconfiguration in case of emergency or outage.
Benefits
The community microgrid can operate in either grid-connected mode or island mode. The distribution
network can be easily reconfigured for reliability purpose and minimizing the system loss to 3 to 4 cycles
(~40ms). The critical loads can be served by multiple feeders. With the ATS, the community microgrid
would be able to automatically isolate those buildings or distribution cables affected by outage, instead
of spreading the outage to the whole distribution system.
Barriers
The existing or future distribution network will need further upgrades which may incur extra investment
costs. Also, automatic smart switches are needed for fast automatic switching.
Master Controller and Building Controls
Proposed/Suggested Improvements
A major element of the community microgrid is its master controller. With the master controller, the
community microgrid will be capable of fault tolerance, self-healing, emergency demand response,
islanding, and resynchronization. Various distributed generation and automation technologies for
enhancing the power grid economics and resiliency would be enabled. The master controller applies
hierarchical control via supervisory control and data acquisition (SCADA) software to ensure reliable and
economic operation of the community microgrid. It also coordinates the operation of on-site
generation, storage, and individual building controllers. Intelligent switching and advanced coordination
technologies of the master controller through communication systems facilitates rapid fault
assessments and isolations.
Figure 7 shows the community microgrid elements, functions, and control tasks associated with each
criterion. In particular, the tertiary control is the upper level of control system, which ensures the
optimal operation of community microgrid by determining the set points of generation and load. In
order to achieve the optimal economics, microgrids apply coordination with the utility grid and
economic demand response in island mode. The short-term reliability at load points would consider

PON 3044 Final Report – Tarrytown
19
microgrid islanding and resynchronization and apply emergency demand response and self-healing in
the case of outages. Functionally, three control levels are applied to the community microgrid:
Primary control which is based on droop control for sharing the microgrid load among Distributed
Energy Resource (DER) units.
Secondary control which performs corrective action to mitigate steady-state errors introduced by
droop control and procures the optimal dispatch of DER units in the microgrid.
Tertiary control which manages the power flow between the microgrid and the utility grid for
optimizing the grid-coordinated operation scheme.

PON 3044 Final Report – Tarrytown
20
Figure 7. Objectives and Functions for the Control and Operation of the Tarrytown Community Microgrid

PON 3044 Final Report – Tarrytown
21
(a) (b)
Figure 8. Architecture of Master Controller for Tarrytown Community Microgrid

PON 3044 Final Report – Tarrytown
22
The hierarchical secondary control approach would receive the information from loads and power
supply entities as well as the information on the status of distribution network and procure the optimal
solution via an hourly unit commitment and real-time economic dispatch for serving the load in the
normal operation mode and contingencies. Figure 7 shows the hierarchical framework of the Master
Controller proposed for the community microgrid projects. In figure 8, the monitoring signals provided
to the master controller indicate the status of DER and distribution components, while the master
controller signals provide set points for DER units and building controllers. Building controllers will
communicate with sub-building controllers and monitoring systems to achieve a device level rapid load
management.
The hierarchical protection configuration strategy for community microgrid mainly contains four-level
protection: load way, loop way, loop feeder way and microgrid level.
Clustered Microgrid
Due to the nature of the critical facilities being dispersed among ConEd’s electrical distribution system, a
fully connected and isolated Microgrid that incorporates all of the critical facilities is not possible. Similar
to the way that a master controller communicates with individual buildings and generation resources to
optimize the overall microgrid, each cluster would be individually controlled but also connected to the
overall clustered microgrid master controller. This level of control would allow the critical facilities’ to be
optimized at the same time as the benefit to the overall grid and local community is maximized. This
interconnection over isolation of the microgrids would have economic, reliability, and environmental
merits.
Benefits
The community microgrid master controller offers the opportunity to eliminate costly outages and
power disturbances, supply the hourly load profile, reduce daily peak loads, and mitigate greenhouse
gas production. The master controller will include the implementation of additional functions for load
shedding and coordinating demand response signals with the other controllers for peak demand
reduction. With the master controller, the community microgrid would be able to provide ancillary
services to the grid including the voltage support and frequency regulation, and the distribution system
restoration. In demand response mode, the utility master controller will shutoff loads according to
predetermined load priorities. Part of the load shedding will be accomplished by shutting off power to
entire buildings through smart switches and the rest will be accomplished by communicating directly
with specific loads distributed across the community via the SCADA network and building controllers.
Barriers
In order to implement the proposed community microgrid, the existing or future distribution network
might need a further upgrade which may incur extra investment cost, automatic smart switches are
needed for fast automatic switching. The functions of the community microgrid would depend highly on
the implementation of a reliable communication system.

PON 3044 Final Report – Tarrytown
23
IT/Communication Infrastructure
Any modern utility or system operator relies heavily on their communication infrastructure to monitor
and control their grid assets. For a microgrid master controller and microgrid operators, this architecture
enables real time control, rapid digestion of critical grid information, and historical data for analysis and
reporting. As part of a feasible microgrid, assessment and upgrade of the equipment and protocols used
in the microgrid area will be performed.
Existing Resources
Con Edison owns and operates all the substations and distribution lines serving local customers in
Tarrytown. A large majority of those customers are individually metered. Many of the distribution loops
and feeders have mechanical switches or automatic switches that are not remotely controlled. The
switches that are controllable are connected using fiber optic lines.
Consequences
A limited communications architecture can lead to increased frequency and duration of outages if
problems must occur and be reported rather than having symptoms trigger notifications to grid
operators of location and scope of the issue. Limited information and delay in this information leads to
man hours wasted and longer duration of customers without power, putting strain on residential
customers and potentially costing commercial customers significant amounts of money. Systems could
have telltale signs of issues for weeks, but operators may not discover these until they have caused
damage and outages to the electric grid or substations, costing the utility money and potentially
endangering employees and customers.
Opportunities
Tarrytown is considering an Advanced Metering Infrastructure (AMI) expansion, which would involve
adding wireless communication infrastructure throughout each meter in the Village to allow for
automatic and digital meter reads. The key advantage of this expansion would be the network addition,
which often utilizes the 900 MHz ISM band and relies on communication between integrated Network
Interface Cards (NICs) that form a mesh network, allowing signals to hop between any installed meters
to reach their ultimate destination and increases the propagation range of the signal in proportion to
the number and dispersion of integrated NIC Smart Meters. The integrated NICs are connected to a local
Access Point (AP) that transmits the metering and control signals for the meters over a cellular wireless
network back to the utility data center, where it can be fed into a Supervisory Control and Data
Acquisition (SCADA) platform for use in billing or monitoring the overall grid.
Village-controlled AMI would also provide opportunity for community demand response aggregation, in
which the microgrid owner will be able to remotely control non-critical loads at the customer level to
maximize economic benefit and/or reduce strain on the grid.
PON 3044 Final Report – Tarrytown
24
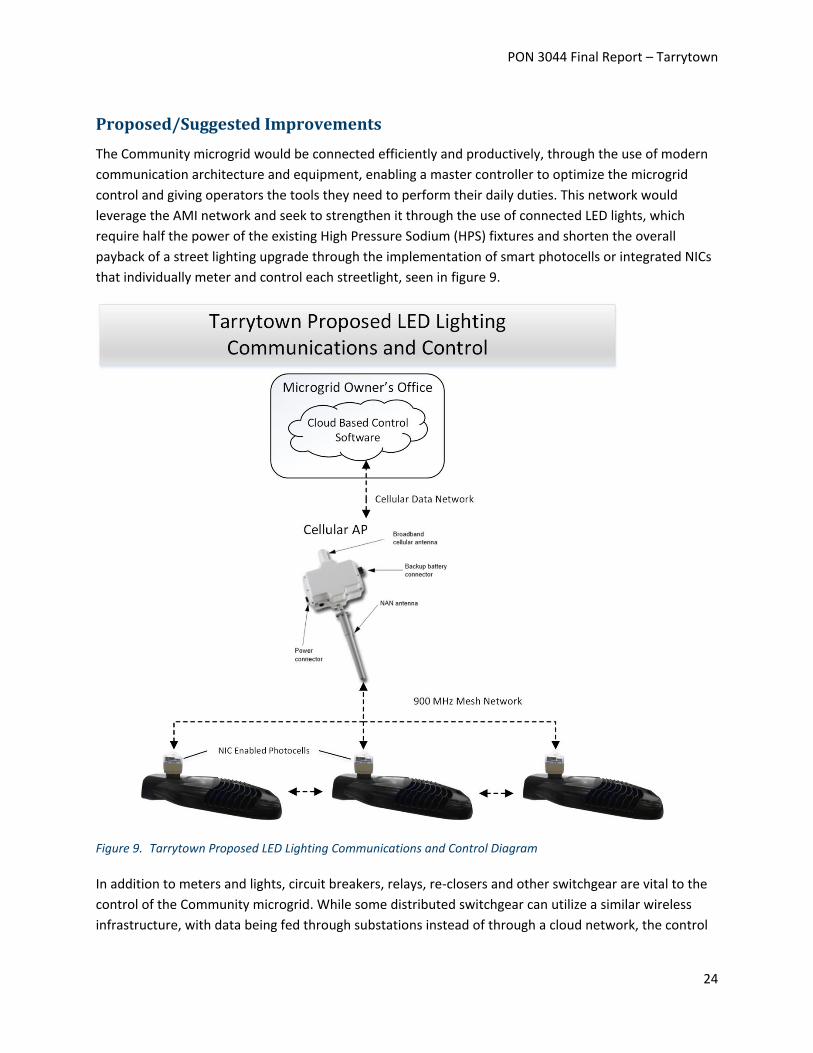
Proposed/Suggested Improvements
The Community microgrid would be connected efficiently and productively, through the use of modern
communication architecture and equipment, enabling a master controller to optimize the microgrid
control and giving operators the tools they need to perform their daily duties. This network would
leverage the AMI network and seek to strengthen it through the use of connected LED lights, which
require half the power of the existing High Pressure Sodium (HPS) fixtures and shorten the overall
payback of a street lighting upgrade through the implementation of smart photocells or integrated NICs
that individually meter and control each streetlight, seen in figure 9.
Figure 9. Tarrytown Proposed LED Lighting Communications and Control Diagram
In addition to meters and lights, circuit breakers, relays, re-closers and other switchgear are vital to the
control of the Community microgrid. While some distributed switchgear can utilize a similar wireless
infrastructure, with data being fed through substations instead of through a cloud network, the control

PON 3044 Final Report – Tarrytown
25
equipment is more vital to the safe operation of the microgrid and would ideally use a fiber optic
backbone between the data center and the substations. The substation relays may have to be upgraded
to communicate using the DNP3 protocol over TCP/IP, the de facto standard for modern utility
communications, which will be used to monitor and control the proposed DER as well.
Once in the data center, the data will be fed into an upgraded or added SCADA system to allow
operators to access, visualize, and control, all of the microgrid assets.
Benefits
Utilizing a fully connected microgrid, with every vital piece of equipment monitored and controlled
remotely, the master controller will be able to optimize load and generation automatically and in real
time, the microgrid operators will be able to view the status, create reports, and plan future
developments, and maintenance will be able to quickly assess and address any issues.
Barriers
A more extensive review of existing communications and control equipment needs to be performed to
determine the exact quantity and specification of the upgrade; RF testing will need to be performed to
determine the layout of the wireless network proposed. Training would have to be done on the SCADA
system and the newly implemented relays, and personal may need to be hired to maintain the network
and communications equipment. A review of costs of the current system, including streetlight usage and
maintenance data, current metering system costs and inaccuracies, and outage information will have to
be performed to determine exact cost savings of upgrading to the new system.
Clustered Community Microgrid
Figure 10. Village of Tarrytown (Below the line) and Village of Sleepy Hollow (Above the line)
PON 3044 Final Report – Tarrytown
26
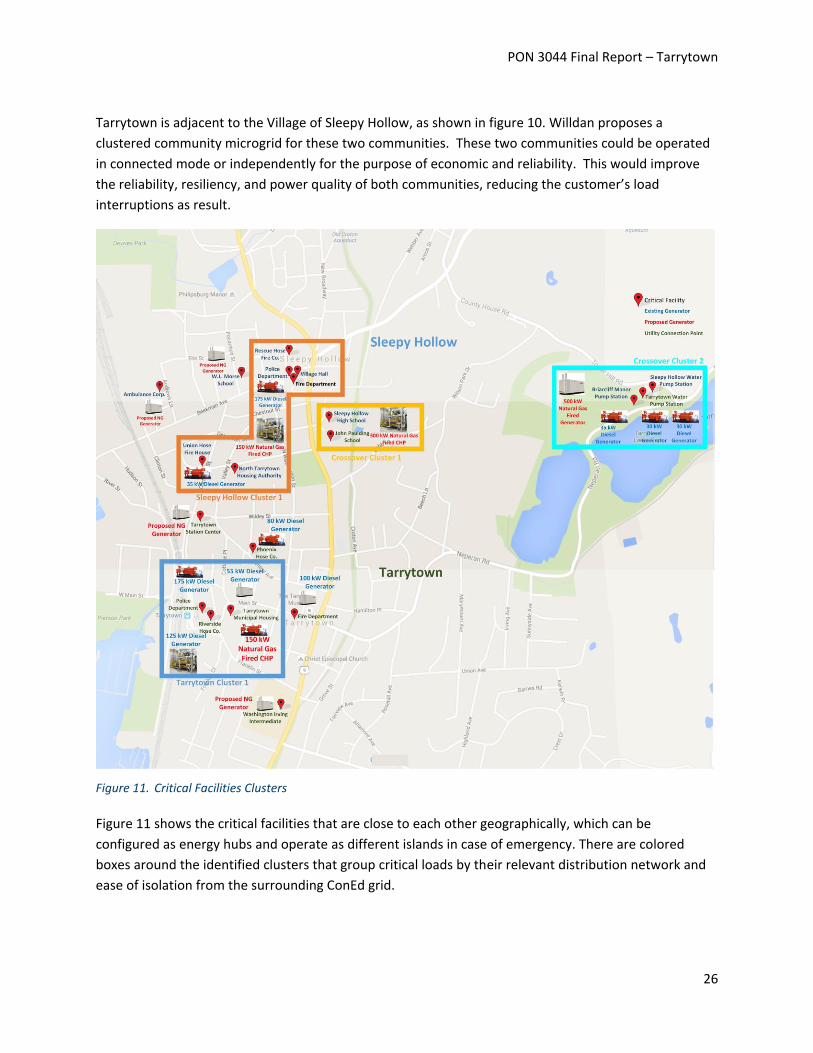
Tarrytown is adjacent to the Village of Sleepy Hollow, as shown in figure 10. Willdan proposes a
clustered community microgrid for these two communities. These two communities could be operated
in connected mode or independently for the purpose of economic and reliability. This would improve
the reliability, resiliency, and power quality of both communities, reducing the customer’s load
interruptions as result.
Figure 11. Critical Facilities Clusters
Figure 11 shows the critical facilities that are close to each other geographically, which can be
configured as energy hubs and operate as different islands in case of emergency. There are colored
boxes around the identified clusters that group critical loads by their relevant distribution network and
ease of isolation from the surrounding ConEd grid.

PON 3044 Final Report – Tarrytown
27
Task 2: Develop Preliminary Technical Design Costs and
Configuration
Willdan has conducted a preliminary assessment of the technical design and system configuration for
the proposed community microgrid in accordance with the following sub tasks:
Summary
Willdan was selected by the Village of Tarrytown and of Sleepy Hollow to perform a feasibility study for
a community microgrid in Westchester County, New York. The focus of the study is on relieving the
community from high electricity prices as well as providing advanced resiliency capabilities in the event
of a bulk power system outage.
Tarrytown and Sleepy Hollow share a border, buildings, public utility resources, such as water and
electric service, and the feasibility study performed by Willdan considers this and other neighboring
factors, while maintaining a clear priority for the customer in their respective study.
Willdan has worked with ConEd, the electric utility, as well as the community stakeholders to acquire all
available electrical, thermal, and other relevant data for the study. This data collection required a review
of the electrical distribution system in Westchester County, which has resulted in a shift in the study
from a standard community microgrid, with all of the critical facilities connected electrically and
surrounding residential and commercial loads also being served by the microgrid, to a concept of
independent clustered microgrids including one Sleepy Hollow cluster, one Tarrytown Cluster, and two
crossover clusters with a cumulative peak load of 1,268 kW all connected to a single master controller.
This is the best option in the communities as ConEd’s distribution system covers the village in a mix of
primary underground and overhead feeders as well as secondary underground networks that would be
extremely expensive to isolate all of the critical facilities.
Working closely with ConEd, Willdan has identified load clusters, Figure 13 and table 9, that can be
easily electrically isolated for resiliency and economic benefits. These clusters would each have a ‘peer’,
or equally weighted, master controller that would optimize generation and load within the cluster and
communicate with a single master controller that supervises and optimizes the entire system to provide
benefits to each other as well as the surrounding community and utility stakeholders.
Using detailed electric and heating load, the microgrid was simulated using the Distributed Energy
Resources Customer Adoption Model (DER-CAM) and Combined Heat and Power (CHP) was a favored
option based on the availability of natural gas at all critical locations, the price of electricity, and the cost
of generating electricity from Natural Gas as well as the benefit of using the heat produced in the
clusters. Simulations were run for each cluster to obtain individual capacity recommendations based on
existing backup generators and individual cluster loads. It was found that major benefits to the
community can also be obtained from implementation of common smart grid technology such as
automatic Switches, Advanced Metering, Intelligent LED Streetlights, connected with modern

PON 3044 Final Report – Tarrytown
28
communication practices and monitored by a Supervisory Control and Data Acquisition (SCADA)
software.
The results of the quantitative simulations and analysis as well as the qualitative analysis of available
Sleepy Hollow community information is presented in the following report based on NYSERDA’s sample
Scope of work (SOW) and broken down into the following sections; Microgrid operation, Load,
Distributed Energy Resources (DERs), Electrical and Thermal Infrastructure, microgrid and building
controls, and communications.
DER-CAM
DER-CAM is a tool that was developed by Lawrence Berkeley National Laboratory (LBNL) to help
optimize the selection and operation of distributed energy resources on a utility distribution system. The
DER-CAM tool has application in the design of microgrids and Willdan has used the tool extensively as a
key component of the qualitative microgrid analysis.
The main objective of DER-CAM is to minimize either the annual costs or the CO2 emissions of providing
energy services to the modeled site, including utility electricity and natural gas purchases, plus
amortized capital and maintenance costs for any distributed generation (DG) investments. The key
inputs into the model are the customer’s end-use energy loads, energy tariff structures and fuel prices,
and user-preferred equipment investment options, with extensive unit cost and operation parameters,
see tables 6 and 7 for technology and parameter inputs. The outputs include DER technologies and unit
sizing, optimal dispatch or utility purchase of electricity and thermal resources, and high level cost
estimation and cost benefit analysis. See figure 12 for more detail. Additional information is available on
BNL’s DER-CAM website1. In addition to DER-CAM simulations, additional modeling was performed using
the open GAMS System, the high level modeling system that DER-CAM is built off of. This was done
specifically for the resilience scenarios to allow for faster and more customized simulations.
1 https://building-microgrid.lbl.gov/projects/der-cam

PON 3044 Final Report – Tarrytown
29
Figure 12. Schematic of Information Flow in DER-CAM1
DER-CAM Input Data
Load profile
Accurate hourly load profiles are critical to DER-CAM simulations. The loads include electricity, space-
heating, water-heating, cooling, refrigeration, natural gas only (e.g. for cooking). However, electricity
and natural gas for space heating are the most important in terms of impact on the communities. Any
ConEd account under 500 kW demand in the Westchester area is manually metered on a monthly basis,
and does not have hourly load available. In the absence of Hourly load for the Sleepy Hollow or
Tarrytown facilities the hourly load profile of White Plains, NY2, a city in the same county, was scaled
based on the peak load of the facilities to obtain an estimated load profile. For heating load, monthly
usage was obtained from utility bills. Then, the average demand was estimated based on this monthly
usage for each month. Finally, the demand was applied to an hourly temperature curve in place of an
hourly heating demand curve to obtain a rough estimate of hourly heating load.
Utility tariff
NREL lists the average commercial price of electricity in Sleepy Hollow and in Tarrytown as 11.55
$/kWh3. This was checked against available demand and energy usage in critical facilities based on
ConEd’s Service Classification4 for large customers (over 10 kW demand) and was found to be within 4%
of the calculated average energy price for the participating facilities. The NREL electricity price was used
as it was likely based on a larger data set than 9 facilities.
1https://www.bnl.gov/SET/images/DER-CAM/DER-CAM-fig-0.png
2 http://en.openei.org/datasets/files/961/pub/
3 http://www.electricitylocal.com/states/new-york/sleepy-hollow/#ref
4 http://www.coned.com/documents/elecPSC10/SCs.pdf

PON 3044 Final Report – Tarrytown
30
The Natural Gas price is obtained from EIA1 and the average commercial natural gas price for New York
for 2015, based on available months, is used; 0.65 $/Therm.
Technologies investment
In addition to CHP, the impact of Electric Storage and PV was evaluated for the Community microgrid;
their investment parameters are shown in table 6. CHP, shown in table 7, was considered in step sizes of
500 kW, 250 kW, and 100 kW, to obtain precise simulation results. Costs were obtained from EIA2 and
from NREL3,4.
Table 6. Continuous Investment Parameters
Technology Fixed Cost ($) Variable Cost
($/kW) Lifetime (Years)
Fixed Maintenance
($/kW/Month)
Electric Storage
0 400 15 0.069167
PV 0 3,250 30 0.25
Table 7. Discrete Investment Parameters
Technology Max
Power (kW)
Lifetime (Years)
Capital Cost ($/kW)
Om variable ($/kWh)
Fuel Efficiency
Alpha (Heat to Power Ratio)
CHP Option 1 500 20 1,200 0.011 NG 0.32 1.4
CHP Option 2 250 20 1,200 0.011 NG 0.32 1.4
CHP Option 3 100 20 1,200 0.011 NG 0.32 1.4
Weather information
Hourly solar irradiance (Global Horizontal Irradiation (GHI)), hourly temperature, hourly wind speed
were obtained from NREL’s Solar Irradiance database5
Global setting
For this analysis, a 10 year maximum payback period was input to DER-CAM as a constraint, based on
the estimated 15-25 year lifetime of the microgrid. Minimizing energy cost was selected to maximize the
economic benefit.
1 https://www.eia.gov/dnav/ng/ng_pri_sum_dcu_SNY_m.htm
2 http://www.eia.gov/forecasts/capitalcost/pdf/updated_capcost.pdf
3 http://www.nrel.gov/docs/fy11osti/48595.pdf
4 http://www.nrel.gov/docs/fy13osti/56776.pdf
5 https://maps.nrel.gov/nsrdb-viewer

PON 3044 Final Report – Tarrytown
31
Simulations
For all of the NY Prize feasibility studies, Willdan considered all of the scenarios a typical community
microgrid could encounter. All of the analyses necessary to justify the integration of a community
microgrid into the Village were simulated as described by the following steps.
Step 1: A base case without any investment was simulated to obtain the reference cost. In this case
the annual cost, as well as optimal heat and electricity dispatch, were calculated using DER-
CAM, shown in section 2.2. The calculated annual operational cost was used for the following
steps as a reference cost.
Step 2: An investment case was simulated to see the economic and CO2 emissions benefits while
allowing DER-CAM to choose the best DERs based on their operational cost and amortized
capital cost. Results showed that the system should purchase all electricity and fuel for heat
from ConEd or the local fuel provider. It should be noted that for the base case with
investments, there were no DERs recommended for purely financial benefits. As a result of
this, a number of the simulations described below returned the same zero value for
suggested DER and were not included in the report, except as evidence for the
recommendation that DER is not feasible for purely financial reasons.
Then a series of simulations were run to simulate a microgrid in both Grid Connected and
Island mode operations. The goal of this step was to determine the optimal value of DER in
both modes of operation.
Grid Connected mode
In this mode, the optimal level of DERs was obtained to maximize reliability and economics.
Reliability simulations include:
1. Demand response at the point of common coupling (PCC) with different level (5%,
10%,15%,20%,25% of total load)
2. Direct Load Controlling (DLC) with different load reduction (5%,10%,15%,20%,25% of
total load)
Economics simulations include:
1. Sensitivity analysis to electricity price increase, from 0.11 $/kWh to 0.15 $/kWh
2. Sensitivity analysis to natural gas price increase, from $0.69 /Therm to $3.52 /Therm
3. Sensitivity analysis to load increase, from 5% to 25%
All simulations were designed to account for possible changes over the 15-25 year life of the
microgrid. The goal is to design a microgrid, which will be as tolerant as possible to electricity,
natural gas and load fluctuations. In addition, the analysis informs the potential microgrid
owner of risks in relying solely on the utility or any one type of DER.

PON 3044 Final Report – Tarrytown
32
Island mode
In this mode the goal was to maximize load recovery at the time of an outage, planned or
unplanned.
Load Recovery simulations include:
1. Outage for a period of hours (Summer and Winter off and on Peak)
2. Outage for a period of days (Summer and Winter off and on Peak)
3. Outage for a period of a week (Summer and Winter off and on Peak)
Simulations designed to account for likely and drastic outage scenarios and to see the effect
on the microgrid.
Step 3: Additional scenarios were created to account for all manner of resiliency situations the
microgrid might encounter, such as main backup generators being out of commission or not
shared by the microgrid, CHP being limited or being out of commission, etc.
These simulations were run for the overall Tarrytown clusters of load as well as for each
individual cluster load, to account for differences in installed backup generators as well as
existing natural gas usage. This resulted in simulations being run for the combination of
Sleepy Hollow cluster one, two crossover clusters, and Tarrytown Cluster one. Which have an
overall peak load of 1,531 MW, reflected in figure 13 as a higher average load, and overall
recommended generation, in addition to existing backup generation, of 1,100 kW, reflected
in the DER-CAM results shown in Sections 2.3 and 2.4. Results from the individual clusters
resulted in the recommendations throughout the report of individual generators for each
cluster, while the overall results, for both Tarrytown and Sleepy Hollow, were included in the
report to give the reader an understanding without having to include 3 repeated figures each
time with the individual results. These are marked as Total System.
The results of these simulations along with analysis of parameters outside of DER-CAM’s
array of options, such as Demand Response capacity credits, as well as qualitative additions
to the Community microgrid, to be accepted or denied during the cost benefit analysis stage
of the study, were analyzed and compiled in the following report based on technical and
preliminary financial feasibility.
PON 3044 Final Report – Tarrytown
33
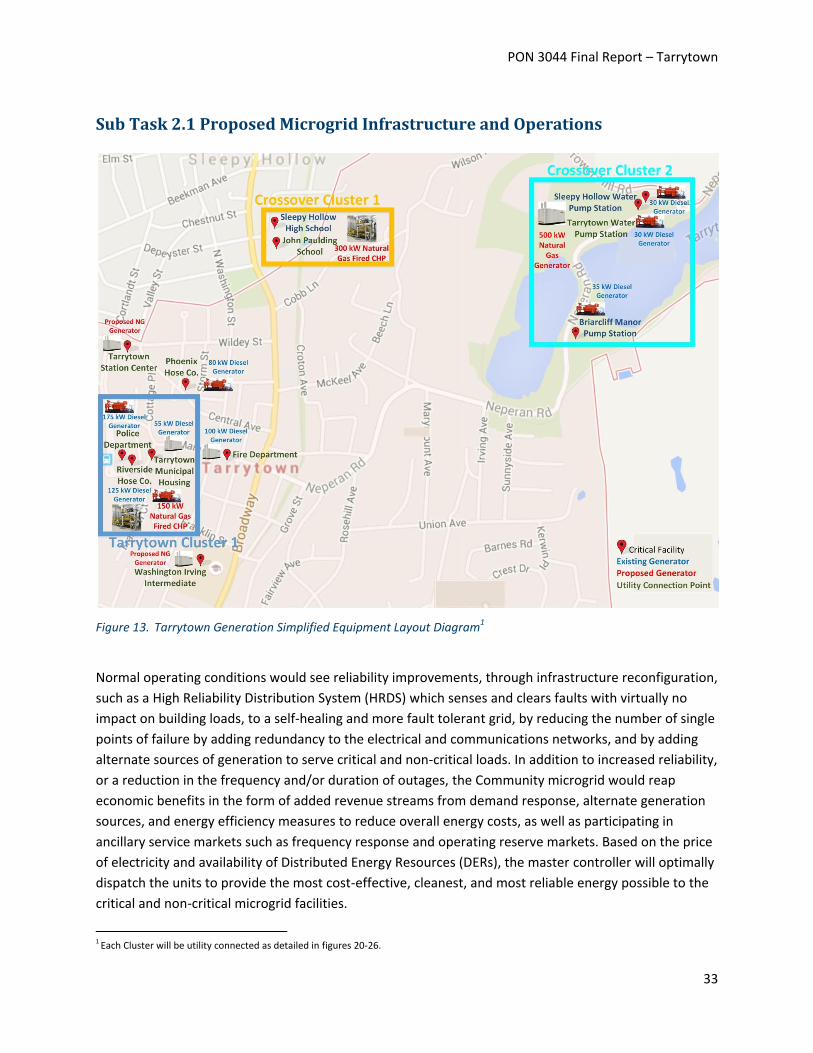
Sub Task 2.1 Proposed Microgrid Infrastructure and Operations
Figure 13. Tarrytown Generation Simplified Equipment Layout Diagram1
Normal operating conditions would see reliability improvements, through infrastructure reconfiguration,
such as a High Reliability Distribution System (HRDS) which senses and clears faults with virtually no
impact on building loads, to a self-healing and more fault tolerant grid, by reducing the number of single
points of failure by adding redundancy to the electrical and communications networks, and by adding
alternate sources of generation to serve critical and non-critical loads. In addition to increased reliability,
or a reduction in the frequency and/or duration of outages, the Community microgrid would reap
economic benefits in the form of added revenue streams from demand response, alternate generation
sources, and energy efficiency measures to reduce overall energy costs, as well as participating in
ancillary service markets such as frequency response and operating reserve markets. Based on the price
of electricity and availability of Distributed Energy Resources (DERs), the master controller will optimally
dispatch the units to provide the most cost-effective, cleanest, and most reliable energy possible to the
critical and non-critical microgrid facilities.
1
Each Cluster will be utility connected as detailed in figures 20-26.

PON 3044 Final Report – Tarrytown
34
During emergency operating conditions, the Community microgrid’s master controller would optimize
generation and load to provide uninterrupted power to critical loads, through the use of DERs and load
shedding schemes that ensure safe and reliable operation of the buildings that matter most in
emergency situations. Long term outages will be mitigated by natural gas fed combined heat and power
(CHP) plants and natural gas fired generators, which will maintain a black-start capability in the event
the outage occurs when the CHP facility is not active. These plant or plants will rely on robust natural gas
pipelines and produce adequate power to serve all of the critical facilities, public streets and security
lighting, and some residential load. This added resiliency will keep emergency responders and residents
safe and provide the Community microgrid with heat and power when it needs it most.
Sub Task 2.2 Load Characterization
Table 8. Electrical Load Type
Type Description Opportunities
Lighting General, task, exits and stairwells, decorative, parking lot
Load curtailment
Security and emergency Critical Load
Transportation Elevators, dumbwaiters, conveyors None – Critical Load
Appliances Business and copying machines, receptacles for vending machines, and general use
Load curtailment and shifting
Data processing
Desktop computers, central processing and peripheral equipment, and uninterruptible power supply (UPS) systems, including related cooling
None – Critical Load
Space conditioning
Heating, cooling, cleaning, pumping, and air-handling units
Short term Load curtailment and shifting
Food preparation
Cooling, cooking, special exhausts, dishwashing, disposing
Load curtailment
Plumbing and sanitation
Water pumps, hot water heaters, sump and sewage pumps, incinerators, and waste handling
Short term load curtailment and shifting
Special loads
For equipment and facilities in mercantile buildings, restaurants, theaters, recreation and sports complexes, religious buildings, health care facilities, laboratories, broad casting stations
None – Critical load
Fire protection Fire detection, alarms, and pumps None – Critical Load
Miscellaneous loads
Security, central control systems, communications; audio-visual, snow-melting, recreational, or fitness equipment
None – Critical load

PON 3044 Final Report – Tarrytown
35
Tarrytown Existing Resources
The total population of Tarrytown’s Electric service territory is approximately 11,000. During the winter
season, Tarrytown splits its buildings’ space heating load between natural gas and No. 2 Fuel Oil.
The locations, peak loads, and load clusters of nine critical facilities within Tarrytown and two Sleepy
Hollow critical facilities are shown in figure 14 and detailed in table 9 with electrical and thermal load.
Tarrytown Cluster 1 consists of the Tarrytown Police Department, Riverside Hose Co. and Tarrytown
Municipal Housing. Crossover Cluster 1 is on the border between Tarrytown and Sleepy Hollow and
includes the John Paulding School from Tarrytown’s critical facilities as well as the Sleepy Hollow High
School from Sleepy Hollow’s critical facilities. Crossover Cluster 2 is located northwest of Tarrytown
proper and includes the Tarrytown Water Pump Station, the Sleepy Hollow Water Pump Station, as well
as the Briarcliff Manor Water Pump Station.
Three identified critical facilities that, based on their electric wiring feasibility, are not included in a
proposed microgrid cluster are the Tarrytown Station Center, the Phoenix Hose Co., and the Washington
Irving Intermediate School, which have been studied instead as nano-grids, or buildings that are able to
isolate behind the meter to provide their own electricity through on-site generation resources and
building level load control, such as micro-CHP installations, energy efficiency improvements, etc. These
improvements and especially the financial feasibility of implementing a nano-grid will be investigated in
more detail in the cost benefit analysis phase of the study.
It should be noted that while the Task 1 report detailed the Tarrytown Station Center facility as a second
Tarrytown Cluster, detailed load information and analysis has resulted in the decision to move forward
without a cluster but instead with behind the meter improvements. The justification to isolate load in a
cluster, which involves the addition of expensive electrical equipment, including transformers and
medium voltage wiring, is to provide real benefits to the ‘load owner’, Tarrytown Station Center, as well
as the microgrid owner. Considering the fact that the Tarrytown Station Center consists of three
addresses with a range of commercial businesses that have a peak combined load of 20 kW, the real
benefits to both the microgrid owner, of added resiliency or dispatchable DERs, or to the load owner, of
financial security and added reliability, are minimized to the point where the investment in the electric
isolation project is not justified over behind the meter improvements without the addition of a
significant number of surrounding commercial facilities which are currently not involved in the project. A
detailed analysis for each cluster will be performed in the cost benefit analysis portion of the study. As
the project moves forward and additional customer load is added, further analysis of the clusters is
recommended.

PON 3044 Final Report – Tarrytown
36
Figure 14. Load Simplified Layout Diagram for the Tarrytown Community Microgrid

PON 3044 Final Report – Tarrytown
37
Table 9. Originally Considered Critical Facilities (Year 2014)
Critical Facilities Peak kW Total kWh Average Heating
Demand1 (Therms/Hr)
Fire Department 43 57,760 N/A
Phoenix Hose 22.8 38,436 1.6
Riverside Hose 15 44,328 1.39
Police & Village of Tarrytown 76 316,800 3.68
Tarrytown Municipal Housing Authority 172 N/A 31.57
John Paulding School 81 160,640 18.93
Washington Irving Intermediate 184 336,400 N/A
Tarrytown Water pump Station 208 816,800 0
Tarrytown Station Center 20 89,236 0.46
Total 822 1,860,400 57.63
The Village of Tarrytown’s loads can be separated into the broad load categories, critical and non-
critical, with critical facilities including the Fire Department, Phoenix Hose, Riverside Hose, Police &
Village of Tarrytown, Tarrytown Municipal Housing Authority, John Paulding School, Washington Irving
Intermediate, Water pump Station, Tarrytown Station Center, and non-critical facilities including the
many other businesses and residential customers. The load demand in each facility can be further
separated into the load categories shown in table 8 to describe the unique nature of, and opportunities
available for, the different load types. The peak critical facility demand in year 2014 is 822 kW and the
total electricity usage of the critical facilities is 1,860,400 kWh. The detailed load information for all the
Tarrytown critical facilities are shown in table 9. The facilities with natural gas demand depend on
natural gas for space heating in winter seasons, while the facilities with zero natural gas demand rely on
No. 2 Fuel Oil or have no heating demand.
Energy Efficiency Projects
Tarrytown has already implemented several energy efficiency projects which include: hybrid geothermal
domestic hot water system and lighting upgrade in Tarrytown Municipal Housing Authority facilities,
solar PV array for Tarrytown Village Hall, oil to natural gas boiler conversion for public schools of
Tarrytown and the TMHA, and backup diesel generators for all municipal facilities. These measures have
reduced the Village’s carbon footprint, improved energy resiliency, and helped the facilities make
incremental steps towards load curtailment.
1 These values based on ConEdBilling data and converted to hourly average values. Ratio of Therms/Hr to kW is 1:29.3.

PON 3044 Final Report – Tarrytown
38
The Village is seeking to increase energy efficiency of a number of facilities within the village including
the Village Hall, police HQ and Fire Stations, which are currently supported by backup diesel generators.
Willdan has commenced ASHRAE Level 2 Energy Audits at most of these facilities and potential energy
conservation measures currently under consideration include upgrades to the building envelope and
windows, HVAC system, and lighting system and the integration of solar. These measures are intended
to reduce the Village’s carbon footprint, improved energy resiliency, and help each facility make
incremental steps towards curtailment. The intent is to parlay the planned energy efficiency and
curtailment measures to develop the community grid at the lowest possible cost.
Consequences
Tarrytown has been increasingly affected by severe weather events with disruptions to basic services
resulting from outages from major storms such as Lee, Sandy, the October 2011 Winter Storm, and
more localized severe weather related problems such as the 2006 Westchester County tornado which
cut power to 10,000 people in the county. The system is also entirely reliant on the points of connection
with the bulk grid, which represents the primary resiliency issues.
Opportunities
Willdan, on behalf of the Village, is exploring placing the microgrid’s CHP and distributed generation
resources in the identified clusters to provide an alternative source of electricity to utility purchase as
well as meet the heat demand of the facilities. These resources could have the added benefit of
reducing load on the ConEd distribution system and substation feeders/transformers, which has the
potential to alleviate maintenance and engineering costs for ConEd, the utility stakeholder. The Village is
planning to implement a number of additional Energy Conservation Measure (ECM) upgrades including
lighting, steam trap replacement, solar array, and building envelope. The intent is to parlay the energy
efficiency and curtailment measures already in place, or planned, to develop the community grid at the
lowest possible cost, while reducing the required size of any added generation. In addition, the Village
aims to utilize any added DER to reduce peaks supplied by the bulk power supply and to participate in
ConEd or NYISO demand-response programs.
As the proposed microgrid consists of a relatively small number of facilities, more advanced cost benefit
analysis will need to be performed to determine the financial feasibility of an Advanced Metering
Infrastructure (AMI) expansion. By implementing an AMI, customers would be provided real-time
monitoring of their electricity usage and have the opportunity to participate in real time pricing.
Through real-time pricing, energy consumers would be encouraged to shift their use from high demand
periods to low demand periods by offering lower prices during these periods. By decreasing peak
demand surges the entire energy infrastructure could be run more efficiently and customers that
participate benefit from lower overall energy prices.
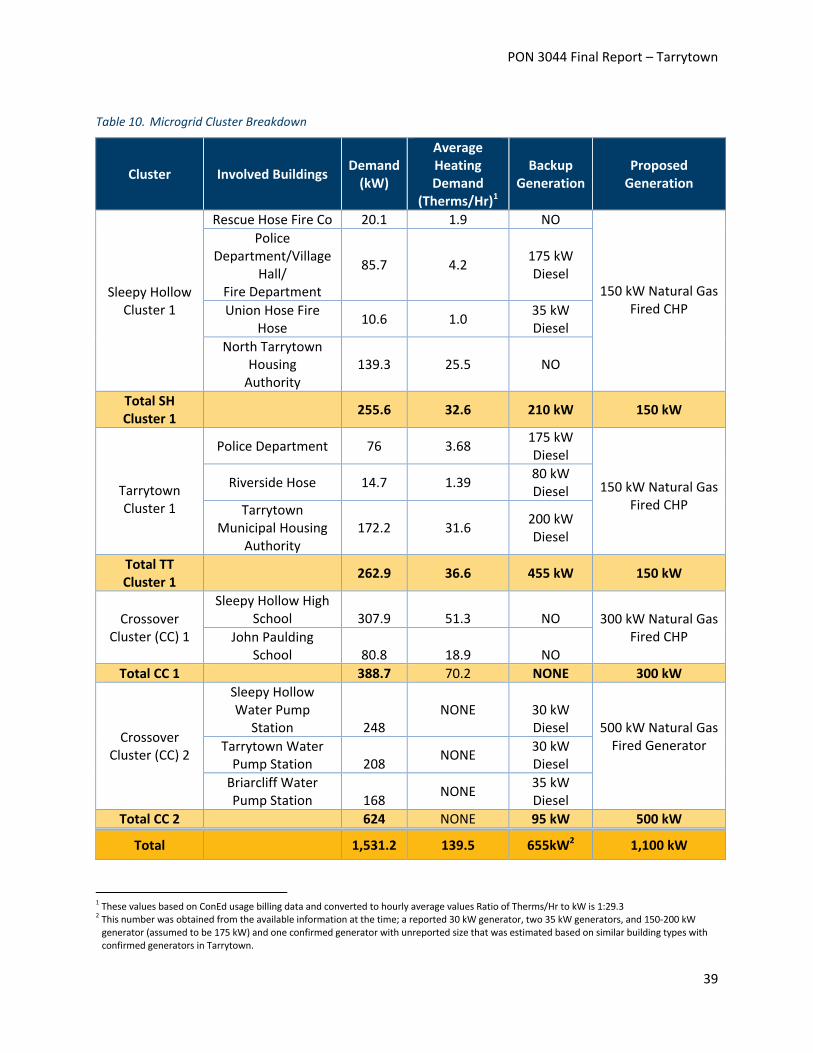
PON 3044 Final Report – Tarrytown
39
Table 10. Microgrid Cluster Breakdown
Cluster Involved Buildings Demand
(kW)
Average Heating Demand
(Therms/Hr)1
Backup Generation
Proposed Generation
Sleepy Hollow Cluster 1
Rescue Hose Fire Co 20.1 1.9 NO
150 kW Natural Gas Fired CHP
Police Department/Village
Hall/ Fire Department
85.7 4.2 175 kW Diesel
Union Hose Fire Hose
10.6 1.0 35 kW Diesel
North Tarrytown Housing
Authority 139.3 25.5 NO
Total SH Cluster 1
255.6 32.6 210 kW 150 kW
Tarrytown Cluster 1
Police Department 76 3.68 175 kW Diesel
150 kW Natural Gas Fired CHP
Riverside Hose 14.7 1.39 80 kW Diesel
Tarrytown Municipal Housing
Authority 172.2 31.6
200 kW Diesel
Total TT Cluster 1
262.9 36.6 455 kW 150 kW
Crossover Cluster (CC) 1
Sleepy Hollow High School 307.9 51.3 NO 300 kW Natural Gas
Fired CHP John Paulding School 80.8 18.9 NO
Total CC 1 388.7 70.2 NONE 300 kW
Crossover Cluster (CC) 2
Sleepy Hollow Water Pump
Station 248 NONE 30 kW
Diesel
500 kW Natural Gas Fired Generator Tarrytown Water
Pump Station 208 NONE
30 kW Diesel
Briarcliff Water Pump Station 168
NONE 35 kW Diesel
Total CC 2 624 NONE 95 kW 500 kW
Total
1,531.2 139.5 655kW2 1,100 kW
1 These values based on ConEd usage billing data and converted to hourly average values Ratio of Therms/Hr to kW is 1:29.3
2 This number was obtained from the available information at the time; a reported 30 kW generator, two 35 kW generators, and 150-200 kW generator (assumed to be 175 kW) and one confirmed generator with unreported size that was estimated based on similar building types with confirmed generators in Tarrytown.

PON 3044 Final Report – Tarrytown
40
Proposed/Suggested Improvements
A community microgrid would be helpful for solving the current problem in the Village of limited existing
backup generation providing additional capacity and therefore increasing the resiliency of the
community. Willdan proposes the addition of natural gas fired CHP in areas with significant heating load
and natural gas generators in areas with electric load only. Willdan has evaluated supporting critical
facilities with distributed generation resources including CHP generators, locating a total of 1,100 kW of
generation resources, based on DER-CAM simulation results seen in more detail in Section 2.3, in the
microgrid clusters, which will operate in synchronous and islanded modes to automatically supply
facilities in the event of an outage. Innovative technologies and new generation sources including solar,
wind, tidal, combined heat and power (CHP), power and battery storage, and off-grid hybrid wind and
solar LED lighting were also studied for their environmental and economic benefits.
New CHP or NG fired generating plants and demand response would help in mitigating the reliance on
power from utility grid. Willdan proposes to upgrade all the existing lighting that has not been upgrade
with high efficient LED (Light Emitting Diode) fixtures. By applying the latest building control technology
in each building, the Village would be able to have the direct load control capability on the curtailable
and shift-able loads through a microgrid master controller, see Section 2.5 for more detail on microgrid
control and master controller operation. Willdan recommends educating the residential customers to
participate in peak-load demand response program.
Benefits
With a community microgrid, the Village could provide more reliable and resilient electricity to their
electric customers. The critical facilities would remain powered on in emergency situations and when
the power supply from the utility grid is lost. The community microgrid would also help the Village to
reduce the high cost of purchasing power from the bulk provider. By using the more efficient and safe
LEDs for public street lighting and residential lighting, both commercial and residential customers can
reduce maintenance cost and electricity bills. With the capability of direct control of the loads, the
Village would not only be able to improve the reliability of the community distribution system, but
would have the potential to participate in ancillary service markets such as, frequency regulation,
demand response, etc. Microgrid facilities could also have better quality of electricity service while
reducing their electricity bills.
Load Visualization
Figure 15 shows the hourly load profile of the total system load that is served by the Community
microgrid. The hourly load is broken down by month to reflect the drastically different usage from
month to month. It can be seen that the electric air conditioning load in August causes the daily load
profile to be raised to significantly more than the levels of that in January, as is seen in many of the
other summer months versus winter months.

PON 3044 Final Report – Tarrytown
41
Figure 15. Total System Average Daily Load by Month1
The proposed Community microgrid focuses on providing electricity and heat for the identified clusters.
Total cluster demand is 1,531.2 kW (table 10). The installation of at least 1,100 kW of CHP would be able
to adequately serve the critical facilities, depending on the level of load shedding implemented;
however, as the Community microgrid would be organized as four individually operated microgrid
clusters, the load would be distributed electrically to four groups and need to be served by appropriately
sized generators.
Figure 16. Pre Investment Average Electricity Dispatch for Total System
1 In the absence of Hourly load for the Sleepy Hollow facilities the hourly load profile of White Plains, NY, a city in the same county, was scaled based on the peak load of the Sleepy Hollow facilities to obtain this estimated load profile.
0
200
400
600
800
1000
1200
1400
1600
1800
0 4 8 12 16 20 24
Ele
ctri
cal D
em
and
(kW
)
Hour
january
february
march
april
may
june
july
august
september
october
0
500
1000
1500
1 2 3 4 5 6 7 8 9 10 11 12 13 14 15 16 17 18 19 20 21 22 23 24
kW
Hours
Optimal Dispatch for Electricity Technologies (August-week)
UtilityPurchase
TotalOriginalElectricLoad

PON 3044 Final Report – Tarrytown
42
Figure 17. Pre Investment Average Heating Dispatch for Total System
Figure 18. Post Investment Average Electricity Dispatch for Total System
Figure 19. Post Investment Average Heating Dispatch for Cluster Total
Figures 16 and 17 show DER-CAM simulation results for the critical buildings in the Community
microgrid under normal base (interconnected mode) conditions with no added generation. It can be
seen that there are peaks around 9 am and around 7 pm due to industrial and residential customer’s
high electricity consumption, respectively. The entirely green graph in figure 16 indicates that all of the
electricity used before any added investment comes from the utility, while the gray in figure 17 indicates
0
1000
2000
3000
4000
1 2 3 4 5 6 7 8 9 10 11 12 13 14 15 16 17 18 19 20 21 22 23 24
kW (
the
rmal
)
Hours
Optimal Dispatch for Heating Technologies (January-week)
HeatCollectedfrom Fuels
OriginalTotal HeatLoad
0
500
1000
1500
1 2 3 4 5 6 7 8 9 10 11 12 13 14 15 16 17 18 19 20 21 22 23 24
kW
Hours
Optimal Dispatch for Electricity Technologies (August-week)
ConventionalDG & CHP forselfconsumption
UtilityPurchase
0
1000
2000
3000
4000
1 2 3 4 5 6 7 8 9 10 11 12 13 14 15 16 17 18 19 20 21 22 23 24
kW (
the
rmal
)
Hours
Optimal Dispatch for Heating Technologies (January-week)
HeatCollectedfrom DGHeatCollectedfrom FuelsOriginalTotal HeatLoad

PON 3044 Final Report – Tarrytown
43
that the entire natural gas space heating load comes directly from fuel. Figures 18 and 19 show the
same time period and load being served, but includes the proposed CHP being optimally dispatched
throughout the day. It can be seen that a portion of the heating load is served by heat collected from DG
(CHP) in figure 19 by noticing the red, or electricity produced by CHP. In addition, a portion of the
heating load is covered by heat collected from fuels. It should be noted that the ratio of electric power
produced to steam produced for heating purposes, or heat to power ratio, used in the simulations was
chosen as an average value based on available CHP units. Willdan recommends selecting CHP units with
a heat to power ratio that will not produce excess heat in summer months when heating demand is
significantly lower.
Proposed Energy Efficiency Improvements
Willdan proposes an energy efficiency program for the Community microgrid participants for the
purpose of economics and reliability. This program would focus on lighting, building envelope, energy
management system, heating, ventilating, and air conditioning (HVAC), and plug load management.
Based on energy audits of the proposed microgrid facilities, Willdan recommends steam trap
replacement, lighting retrofits, roof replacement, weatherization, and Solar PV for the MHA and other
applicable buildings. By applying a time of use (TOU) electricity price mechanism within the community,
customers can save both on energy cost and peak-demand charge by curtailing energy usage or shifting
their energy usage from peak load hours to off-peak load hours, and then reduce the amount of their
energy bill. By shifting the energy usage from peak load hours to off-peak load hours, any overload on
the distribution cables and substations would be mitigated and the reliability of the distribution system
could be improved.
Sub Task 2.3 Distributed Energy Resources Characterization
Existing Resources
There are a number of buildings in the Village which have generators but the detailed information was
not available when preparing this report. These generators are assumed as diesel backup generators
and the sizes are estimated based on the similar buildings in the Tarrytown area. All the DERs located in
Tarrytown, distributed among the critical facilities, and retaining about a week of fuel, are shown in
figure 13. The detailed location and capacity information of the existing DERs for Tarrytown are listed in
table 11. The characteristics of the existing DERs for DER-CAM simulations are assumed and listed in
table 12. The candidate CHP units which DER-CAM simulation could choose from are listed in table 13.

PON 3044 Final Report – Tarrytown
44
Table 11. Tarrytown Existing Backup Generators
Location Capacity (kW) Fuel Type Demand (kW)
Fire Department 100 Natural
Gas 43.2
Phoenix Hose 80 Natural
Gas 22.8
Riverside Hose 55 Diesel 14.7
Police and Village of Tarrytown 1751 Diesel 76
Tarrytown Municipal Housing Authority
125 Diesel 172
John Paulding School 0 N/A 80.8
Washington Irving Intermediate 0 N/A 184
Water pump Station 30* Diesel 208
Tarrytown Station Center 0 N/A 20
Total 565 822
Table 12. Main Parameters of Existing Backup Generators2
Location Capacity
(kW)
Capital Cost
($/kW)
Variable Operating and Maintenance
($/kWh)
Sprint Capacity
(kW) Efficiency
Backup Only
Briarcliff Manor Water Pump Station
30 865 0.015 30 0.32 Yes
Union Hose 35 865 0.015 35 0.32 Yes
Village Hall/Police/Fire Station
175 865 0.015 175 0.32 Yes
Sleepy Hollow Water Pump Station
30 865 0.015 30 0.32 Yes
1 Estimated based on similar buildings in the Tarrytown and Sleepy Hollow area
2 The parameters for each kind of generators are taken from DER-CAM database.

PON 3044 Final Report – Tarrytown
45
Table 13. Main Parameters of Candidate CHP Units1
Location Capacity
(kW)
Capital Cost
($/kW)
Variable Operating and Maintenance
($/kWh)
Sprint Capacity
(kW) Efficiency Alpha2
Backup Only
CHP Option 1 500 1200 0.011 500 0.32 1.4 No
CHP Option 2 250 1200 0.011 250 0.32 1.4 No
CHP Option 3 100 1200 0.011 100 0.32 1.4 No
Consequences
As shown in tables 10 and 11 and figures 13 and 14, not all the critical facilities have backup generators
to supply power in the event of an emergency (loss of power supply from utility due to weather or other
events). Comparing the existing DERs with load demands in table 11, there is a disparity between the
generation available and the peak load of critical facilities. It can be seen that backup generation is not
available for the John Paulding School, Washington Irving Intermediate, and Tarrytown Station Center.
This means that a number of vital critical facilities, including those that would be used as emergency
shelters, would be out of power in the event of loss the power supply from utility grid. In addition, the
community pays to maintain and test the backup generators, or runs the risk of the generators not
working when needed, and does not see any value added beyond emergency situations. Finally, it is
worth noting that all the generation runs off of diesel fuel, which is not considered a clean fuel source
that reduces the quality of the air and increases the carbon footprint of the communities, and must be
stored or shipped into the Village in the event of an outage. The diesel storage capacity information is
not available at this time but generally retain fuel for 48-96 hours, the diesel delivery delay and
unavailability may cause another resiliency issue during extreme weather conditions.
Opportunities
Since the average commercial electricity rate in the Village is 11.55Cent/kWh3,4, it is economical to
install CHP and use local DERs to serve the critical facilities. The Village is exploring innovative projects
and smart grid circuit isolation to meet its demand and consumption needs such as using combined heat
and power (CHP) generation. The additional heat capacity provided will be utilized to improve the year-
round efficiency of supplementing local facilities. The Village is interested in exploring an expansion of
CHP for a number of their critical facilities as well as adding a generation source to their schools. CHP
Plants, proposed to improve the grid resiliency, could cover the electricity needs of the currently
1 CHP was considered in step sizes of 500 kW, 250 kW, and 100 kW, to obtain precise simulation results and due to the fact that DER-CAM considers a maximum of six of each of the suggested technologies, allowing for a maximum of 5,100 kW of CHP to be suggested.
2 Alpha: Heat-to-power ratio for CHP, the overall efficiency of CHP can reach 0.768 which will satisfy the fuel conversion efficiency requirement (minimum 60%).
3 http://www.electricitylocal.com/states/new-york/sleepy-hollow/#ref
4 http://www.electricitylocal.com/states/new-york/tarrytown/

PON 3044 Final Report – Tarrytown
46
vulnerable critical facilities. The heat provided from the CHP plants could feed the high temperature hot
water (HTHW) loop in the winter and the domestic hot water (DHW) in the summer and potentially
alleviate the energy consumption. This expansion would also allow the Village to participate in NYISO
Ancillary Service Markets, such as demand response or frequency regulation, and reduce its dependency
to bulk electric power provider.
Proposed/Suggested Improvements
Tarrytown and Sleepy Hollow are neighboring communities and their critical facilities can be grouped
into different clusters which can each be treated as an individual microgrid, as shown in figure 20.
Willdan recommends and DER-CAM simulations support 1,100kW DERs for the microgrid clusters to
power on the critical facilities for seven days during utility grid outage in peak load season for the
community microgrid. In order to avoid the extra electrical and thermal infrastructure cost, the
suggested capacity of CHP is distributed to different load cluster shown in figure 20.

PON 3044 Final Report – Tarrytown
47
Figure 20. Proposed Generation for Microgrid Clusters in Tarrytown
In this report, DERs are proposed for the purpose of resilience since most of the existing backup
generators are diesel, which have a limited fuel reserve and their owners don’t necessarily want to share
their asset with the community microgrid, so Willdan proposed new DERs for the resilience and existing
backup generators are suggested to be kept. Based on the analysis of the available data, Tarrytown
mainly uses natural gas or oil boilers for heating in winter seasons. The heat produced by the proposed
CHP plants could be utilized for serving this heating demand as well as the year-round heating demands
of nearby buildings.
Benefits
The proposed installation of CHP would have both reliability and economic merits for the Village. The
added CHP would enable the community to have the capability to be isolated from utility grid. In
addition, the added CHP would lead to savings on electricity bills for the customer, 22.1% savings based
on the simulations, as the customers in the Village pay a relatively high electricity rate (11.5cent/kWh,

PON 3044 Final Report – Tarrytown
48
higher than the generation cost of 8.3cents/kWh from CHP1). Addition of a range of DERs, including long
term sources like CHP would allow the Village to operate as a microgrid and to take advantage of new
revenue streams such as Demand Response and Capacity Markets. Proposed generation capacity and
distribution automation capabilities are expected to dramatically increase available capacity for
demand-response, increase resiliency through on-site generation, and reduce charges. Distribution of
these additional resources close to the school system, water plant, and other critical facilities, will
ensure that critical facilities will remain powered on when there is a loss of power from the utility grid.
The CHP can operate in grid-connected mode and island mode. In grid-connected mode, the Master
controller adjusts P/Q set points via tertiary control. In island mode, the CHP will receive grid-forming
control signals (maintain frequency and voltage). CHP implements frequency and voltage signals through
primary and secondary functions. When the microgrid is operating in island mode, the secondary control
function will be responsible for maintaining the normal operation of microgrid, i.e., to maintain the
operating frequency and voltage magnitude at the rated values. In island mode, tertiary control is
applied for microgrid energy management, which is to determine the dispatch of DERs for the economic
operation of autonomous microgrid.
Each microgrid is able to initiate communication to its neighbor microgrids and requests generation
support through already installed community system or proposed express lines. In this case, this
microgrid acts as master and the requested microgrids act as slaves (acting as a generator) at the
tertiary level.
Barriers
Since the cost (purchase or leasing rate) of land used for CHP installation varies dramatically from
location to location and due to the unavailability of detailed network data (one-line diagram and
network model) to locate the exact location of CHP installation site at the time of preparing this report,
the land cost has not been taken into consideration in this feasibility study. This report provides a
general figure of the proposed community microgrid assuming that the space for the proposed CHP
installation is available. The exact size and capacity of the proposed units to ensure feasibility are
subject to financial and space constraints. Training will be required for maintenance and operation of
the proposed DERs.
As Natural Gas fed CHP is the most feasible option for the proposed Community Microgrid, the
microgrid will rely heavily on Natural gas pipelines to power the facilities. Pipelines are highly resilient to
inclement weather, but do have the potential to break down or be damaged. This would have to be
monitored closely to prevent any small issues from becoming major problems if there is an interruption
in natural gas supply. In order to fully utilize the heat produced by the CHP, either new heat
infrastructure needs to be added for building or the existing heat infrastructure needs to be upgraded,
which would cause extra investment cost.
1 http://www.enwaveseattle.com/documents/CHP%20as%20part%20of%20CES.pdf

PON 3044 Final Report – Tarrytown
49
Based on sensitivity analysis for the electricity rate and natural gas price, the proposed Community
Microgrid is not sensitive to the increases of Electricity price since the electricity rate in this area is
already higher than the generation cost of CHP, and it would mainly depend on the proposed CHP for
serving its critical facilities. While the proposed community microgrid is highly sensitive to the increase
of natural gas price since the increased natural gas price would cause the increase of CHP’s generation
cost. The increase of natural gas price would have more overall impact on the generation cost of local
natural gas fired DER than the overall electricity rate in the electricity market. As natural gas price
increases, it would be less expensive to purchase electricity from the grid or install other types of DERs
with lower generation cost such as solar instead of dispatching CHP for generating electricity. The
levelized cost of energy (LCOE) for solar is around 12.5 Cent/kWh in which the LCOE is calculated as
(Total life Cycle Cost/Total Lifetime Energy Production)1. The natural gas price in The Village shown in
figure 21 is much cheaper than the Solar’s LCOE, so the DER-CAM will prefer to install natural gas fired
CHP instead of Solar PV. As shown in figure 21, when natural gas price increases, the electricity rate is
still cheaper than the Solar’s LCOE, so the DER-CAM would still prefer to purchase electricity from grid
instead of installing Solar unit in high natural gas price scenarios.
Figure 21. Total System Sensitivity Analysis Results for Natural Price2
The proposed CHP would have the black-start capability and the black start can be initiated by the
master controller based on a pre-defined black start procedure. The proposed Community Microgrid
master controller would determine the optimal and reliable operation of the microgrid through optimal
generation dispatch and load signals. The generation dispatch signals are sent to dispatchable
1 http://solarcellcentral.com/cost_page.html
2 DER-CAM simulation results. DER-CAM utilizes kW or kWh for all its input and output data. Ratio of Therms/Hr to kW is 1:29.3
0
0.5
1
1.5
2
2.5
3
3.5
0
200
400
600
800
1000
1200
0.69 1.38 2.08 2.78 3.52
Syst
em
Op
era
tio
n C
ost
(M
illio
n $
)
Pro
po
sed
DER
Cap
acit
y (k
W)
Natural Gas Price ($/Therm)
Suggested CHP (kW)
Annual System Operational Cost (M$)

PON 3044 Final Report – Tarrytown
50
distributed energy resource (DER) units and the load signals are sent to building controllers. An
interactive grid-forming control would be used either in island or grid-connected mode. In island mode,
DERs apply this control scheme to share the load while in the grid-connected mode DERs apply this
control scheme to regulate the power exchange between the microgrid and the utility grid. In grid-
connected mode, the DER unit with grid-following control follows the microgrid voltage and frequency,
which is set by the utility grid in grid-connected mode and other DER units in island mode.
Sub Task 2.4 Electrical and Thermal Infrastructure Characterization
Electrical and Thermal Infrastructure
Consolidated Edison (ConEd) owns and operates the distribution system within the community to serve
all the electricity and natural gas customers. The identified clusters are shown in figure 20. The existing
underground distribution cable would be utilized for connecting the different microgrid clusters.
Furthermore, new connection cables installation between the microgrid clusters could be taken into
account if the existing distribution cables put any constraints on the energy exchange between the
clusters. The overall distribution system configuration and thermal infrastructure of the Village is not
available at the time of preparing this report. The detailed design within each cluster, provided by
ConEd, is as follows.
Sleepy Hollow Cluster 1
Existing The identified Sleepy Hollow cluster 1 shown in figure 20 includes the Rescue Hose and the
Village Hall, Police, and Fire department all fed off a 500 kVA transformer off of the Sleepy
Hollow 13 kV primary feeder and the Union Hose and the North Tarrytown Housing
Authority, each fed their own individual 500 kVA transformer off the 13 kV primary feeder.
There is available Natural Gas on Cortland Street and off of Pocantico Street.
Proposed To isolate the critical facilities from the existing underground 13 kV Primary, two manholes
with normally open SCADA switches will have to be installed, one on Beekman Avenue to
isolate the Rescue Hose and Village Hall, Police, and Fire department, and one on Cortland
or Valley St to isolate the Union Hose and North Tarrytown Housing Authority. These
switches will be connected by new underground cable and any additional customers
interested in being served by the microgrid that are along the route can be added with
additional manholes and cable. This configuration will allow a new generation resource to
be added anywhere along the new underground cable to electrically serve the entire
cluster, allowing a large range of options for a location of the new generation resource and
allowing flexibility for any thermal infrastructure, seen in figure 22 as the red line, that
must be installed to serve the Village Hall, Police, and Fire department. The proposed
generator, located anywhere along Cortland street or Pocantico street, would have an
available natural gas supply.

PON 3044 Final Report – Tarrytown
51
Figure 22. Sleepy Hollow Cluster 1
Tarrytown Cluster 1
Existing The identified Tarrytown Cluster 1 shown in figure 23 includes Tarrytown Police and Village
Office, the Riverside Hose, and the Tarrytown Municipal Housing Authority (TMHA),
connected at the end of a feeder spur. The Tarrytown Police and Village office is fed from a
pad mount transformer and Riverside Hose and the TMHA are fed by pole top
transformers. There is a 12” medium pressure (MP) natural gas (NG) main running up
Franklin Street as well as an 8” MP NG main running down White Street, which is used to
heat the critical facilities. There are a number of commercial and residential customers
between the critical facilities identified that will be considered as microgrid customers.
Proposed In order to isolate the critical facilities in Tarrytown Cluster 1 a new pole top SCADA switch
will be installed on Franklin Street to pick up the entire spur, or end section of the feeder,
that includes all of the cluster critical facilities. In order to do this, the additional customers
on the spur will have to agree to participate in the microgrid or be connected back to
ConEd’s distribution system. In addition, an S&C PME switch would need to be added to

PON 3044 Final Report – Tarrytown
52
the primary in order to connect a new generation resource, which would likely be located
along Depot Plaza. This would allow easy installation of new heat infrastructure, seen in
Figure 20 as the red line, to serve the heating load of the Tarrytown Police and Village
Office and any other chosen heating loads. As the new generation resource would be
located along Depot Plaza or Franklin St, it would likely be fed from the 12” MP NG main,
which runs along Franklin St.
Figure 23. Tarrytown Cluster 1
Crossover Clusters
Existing The first identified crossover clusters, shown in figure 24, includes both the Sleepy Hollow
and John Paulding Schools which are fed from the underground secondary network. Sleepy
Hollow High School has a dedicated pad mount transformer fed from a primary riser. Both
schools are directly next to each other and no other customers between would have to be
recruited to isolate the schools. There is an 8” HP NG main running down Depeyster Street
and a 6” LP NG main running up Broadway.
Proposed As the schools are fed via separate sources, with one on the secondary network and one on
the primary, it is recommended to install an S&C PME Switch fed by the existing primary
feeder. Connected to this would be the existing cable that runs to the Sleepy Hollow High
School’s existing pad mount transformer, while new cable and duct would need to be
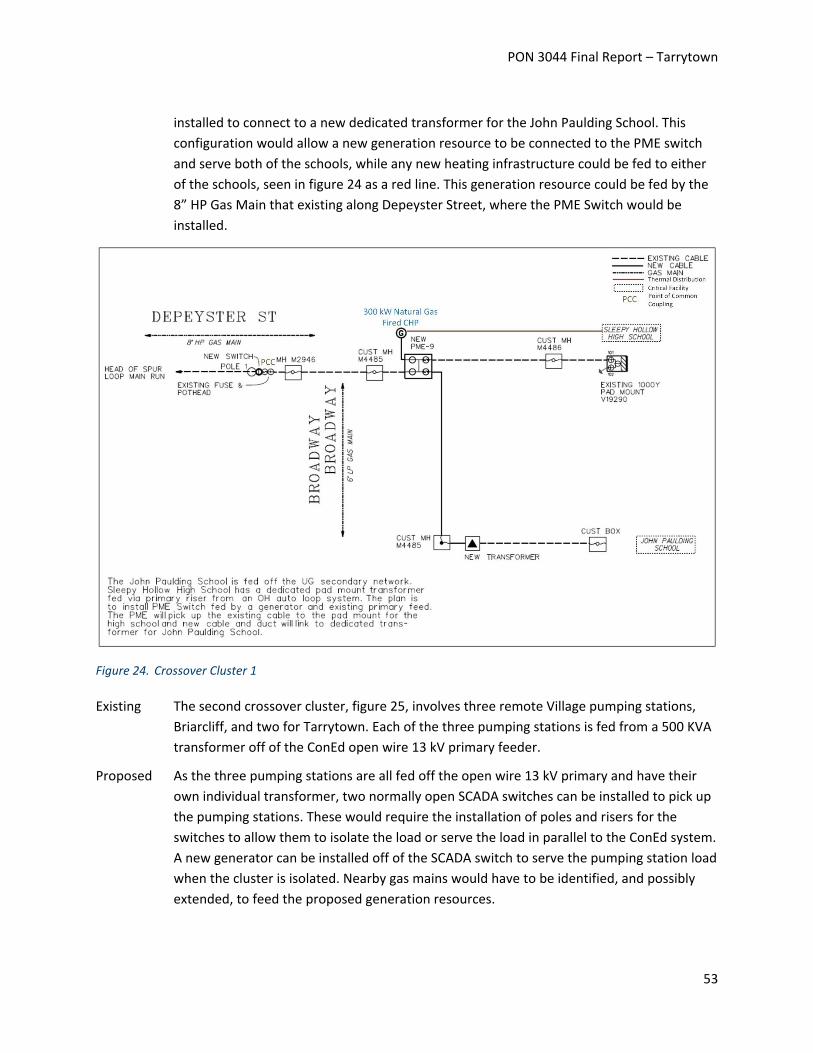
PON 3044 Final Report – Tarrytown
53
installed to connect to a new dedicated transformer for the John Paulding School. This
configuration would allow a new generation resource to be connected to the PME switch
and serve both of the schools, while any new heating infrastructure could be fed to either
of the schools, seen in figure 24 as a red line. This generation resource could be fed by the
8” HP Gas Main that existing along Depeyster Street, where the PME Switch would be
installed.
Figure 24. Crossover Cluster 1
Existing The second crossover cluster, figure 25, involves three remote Village pumping stations,
Briarcliff, and two for Tarrytown. Each of the three pumping stations is fed from a 500 KVA
transformer off of the ConEd open wire 13 kV primary feeder.
Proposed As the three pumping stations are all fed off the open wire 13 kV primary and have their
own individual transformer, two normally open SCADA switches can be installed to pick up
the pumping stations. These would require the installation of poles and risers for the
switches to allow them to isolate the load or serve the load in parallel to the ConEd system.
A new generator can be installed off of the SCADA switch to serve the pumping station load
when the cluster is isolated. Nearby gas mains would have to be identified, and possibly
extended, to feed the proposed generation resources.

PON 3044 Final Report – Tarrytown
54
Figure 25. Crossover Cluster 2
Resilience of the Electrical and Thermal Infrastructure
This failure at the points of connection would remove electric service to all of the customers in the
Village, including critical facilities such as fire and public safety services, and water treatment plants. The
communities have long been concerned about the vulnerability to interruption of bulk supply.
Resilience refers to the ability of a system or its components to adapt to changing conditions and
withstand and rapidly recover from disruptions, i.e., the ability to recover from a disturbance1. The
electrical and thermal infrastructure is vulnerable to many phenomena, such as, hurricanes,
earthquakes, drought, wildfire, flooding, and extreme temperatures, etc. Some extreme weather events
have become frequent and severe in recent years due to climate change. Snow storms and peak loads
in winter season could cause damages or outages on the over-head system in the Village. Also heat
waves in summer could affect distribution line conductor sags and any equipment that needs to be
1 Increasing the Resilience, Reliability, Safety, and Asset Security of TS&D Infrastructure. Available online: http://energy.gov/sites/prod/files/2015/04/f22/QER%20ch2%20final_1.pdf

PON 3044 Final Report – Tarrytown
55
cooled off, such as, transformers, etc. A wind gust could cause tower/pole and conductor faults due to
trees falling. It would be also necessary to upgrade designs and focus more on emergency planning and
restoration. For example, hurricane sandy occurred in 2012, which caused a widespread blackout of the
power system in the eastern seaboard and left millions of homes in the dark from a couple hours to a
few weeks. Natural gas disruptions are less likely than electricity disruptions, however, it is relatively
more difficult to recover from the natural gas system failure driven outages than electric systems
because of the difficulty to locate and repair the underground leakages. The extreme weather would
affect both individual equipment failure and system operations. The damage from such events can
impose large costs on distribution system as well as severe impact on the local economies. A community
microgrid would solve the constraints by providing additional capacity and resiliency to the Sleepy
Hollow Electric system.
In order to optimize the selection and operation of distributed energy resources, DER-CAM is applied
here for microgrid simulations. A case in which maintaining the critical facilities’ power with a one week
disruption of power supply from the utility grid is presented here to show the investment options for
addressing the system resilience. Table 14 and figures 26 and 27, present the DER-CAM simulation
results. DER-CAM suggested 1,100 kW CHP to supply power to all Tarrytown’s critical facilities where
even there are seven day’s outages in utility grid. Shown in figure 26, the proposed community would
mainly depend its own DERS (proposed and existing) to supply the load demand (left pie chart). The
middle pie chart in figure 24 shows the DER-CAM suggestions and right pie chart is the existing DERs as
the input data for DER-CAM simulations, all these pie charts are produced by DER-CAM automatically. It
can be seen from figure 25 that all the critical facilities can be satisfied by the new added DERs along
with the existing generation resources. The local DERs can also provide power to critical facilities during
grid-connected mode shown in figure 26 which would improve the energy resilience of the critical
facilities. It can be seen that the critical facilities would mainly be served by the proposed CHPs even in
grid-connected mode.
Table 14. The Annual Costs Savings by the Investment for Supplying the Facilities in Tarrytown with Islanding in Peak
Load Season (July)
Case Base Case
(no investment) Investment Case
(investment) Saving
Total Annual Energy Costs (K$)
1431.4 1,114.8 22.1%
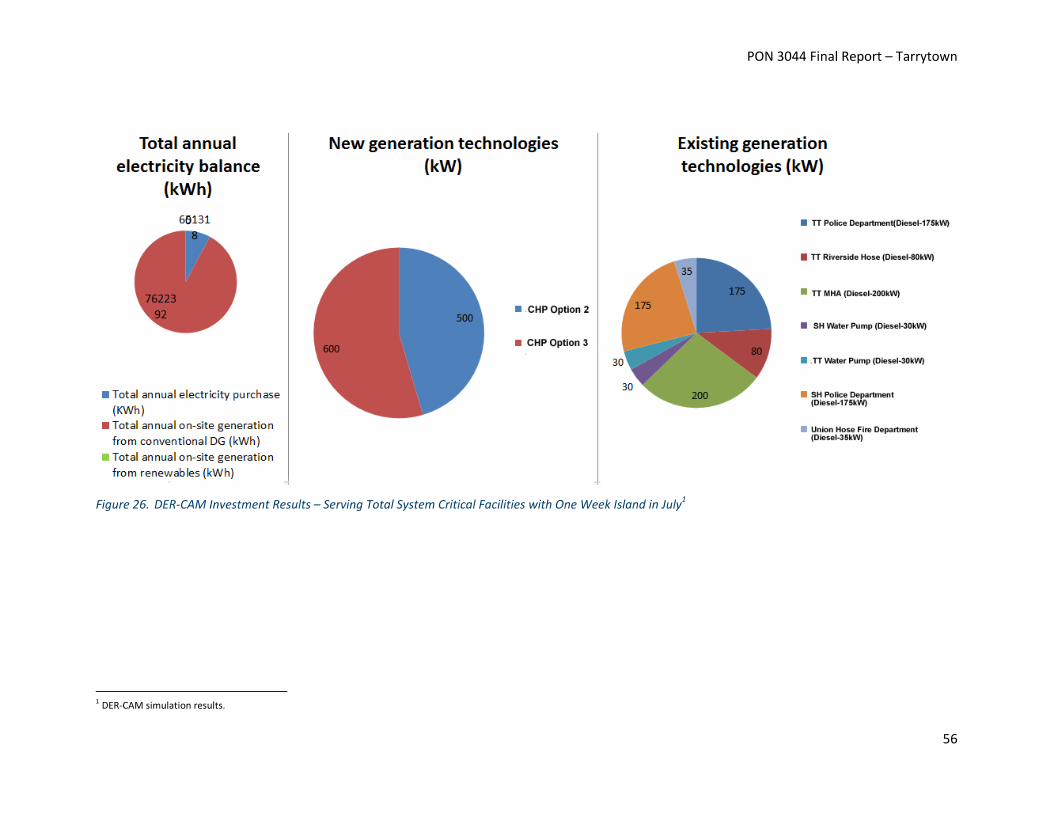
PON 3044 Final Report – Tarrytown
56
Figure 26. DER-CAM Investment Results – Serving Total System Critical Facilities with One Week Island in July1
1 DER-CAM simulation results.
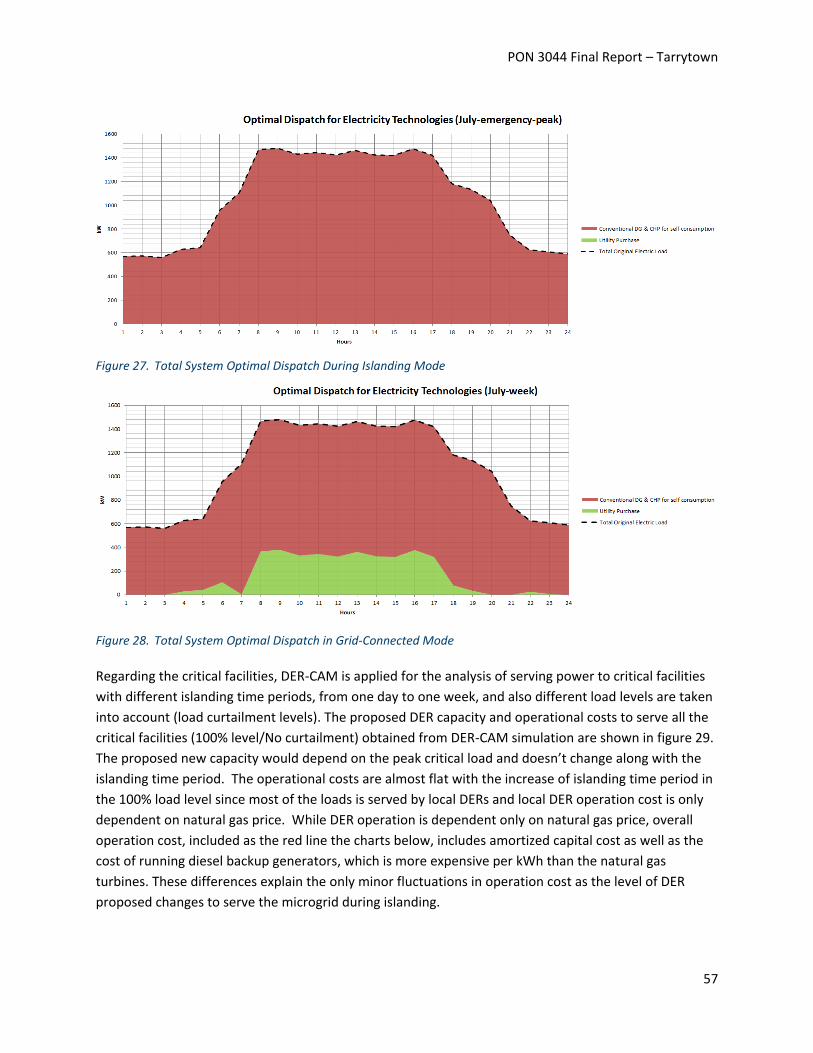
PON 3044 Final Report – Tarrytown
57
Figure 27. Total System Optimal Dispatch During Islanding Mode
Figure 28. Total System Optimal Dispatch in Grid-Connected Mode
Regarding the critical facilities, DER-CAM is applied for the analysis of serving power to critical facilities
with different islanding time periods, from one day to one week, and also different load levels are taken
into account (load curtailment levels). The proposed DER capacity and operational costs to serve all the
critical facilities (100% level/No curtailment) obtained from DER-CAM simulation are shown in figure 29.
The proposed new capacity would depend on the peak critical load and doesn’t change along with the
islanding time period. The operational costs are almost flat with the increase of islanding time period in
the 100% load level since most of the loads is served by local DERs and local DER operation cost is only
dependent on natural gas price. While DER operation is dependent only on natural gas price, overall
operation cost, included as the red line the charts below, includes amortized capital cost as well as the
cost of running diesel backup generators, which is more expensive per kWh than the natural gas
turbines. These differences explain the only minor fluctuations in operation cost as the level of DER
proposed changes to serve the microgrid during islanding.

PON 3044 Final Report – Tarrytown
58
Figure 29. Proposed DER Capacity and Operation Cost for Serving 100% of Total System Critical Facilities
Figures 30-33 show the simulation results with 10%-40% load curtailment of critical facilities (for serving
90%-60% of critical facilities’ loads), respectively.
Figure 30. Proposed DER Capacity and Operation Cost for Serving 90% of Total System Critical Facilities
0.1
0.3
0.5
0.7
0.9
1.1
1.3
400
500
600
700
800
900
1000
1100
1200
1300
1 2 3 4 5 6 7
Op
era
tio
n C
ost
($
M)
Pro
po
sed
DER
Cap
acit
y (k
W)
Island Time Period (Day)
100% Load Level Proposed DER Capacity (kW) Operation Cost ($M)
0.1
0.3
0.5
0.7
0.9
1.1
400
500
600
700
800
900
1000
1100
1200
1300
1 2 3 4 5 6 7
Op
era
tio
n C
ost
($
M)
Pro
po
sed
DER
Cap
acit
y (k
W)
Island Time Period (Day)
90% Load Level Proposed DER Capacity (kW) Operation Cost ($M)

PON 3044 Final Report – Tarrytown
59
In figure 29, as seen in this case the extra 10% reduction in peak load causes the de-commitment of
100kW unit compared with that in figure 28.
Figure 31. Proposed DER Capacity and Operation Cost for Serving 80% of Total System Critical Facilities
In figures 31 and 32, another 10% causes the de-commitment of another 100kW and 150kW unit,
respectively. It can be seen that lower investments would be needed as more load is curtailed, just as
the operational costs are reduced, which indicate that higher resilience of critical facilities can be
achieved through either load management or adding new generation resources. The new added CHP
would also help in reducing the operation cost.
0.1
0.2
0.3
0.4
0.5
0.6
0.7
0.8
0.9
1
1.1
400
500
600
700
800
900
1000
1100
1 2 3 4 5 6 7
Op
era
tio
n C
ost
($
M)
Pro
po
sed
DER
Cap
acit
y (k
W)
Island Time Period (Day)
80% Load Level
Proposed DER Capacity (kW) Operation Cost ($M)

PON 3044 Final Report – Tarrytown
60
Figure 32. Proposed DER Capacity and Operation Cost for Serving 70% of Total System Critical Facilities
Figure 33. Proposed DER Capacity and Operation Cost for Serving 60% of Total System Critical Facilities
The DER-CAM simulation results are also shown in table 15 and table 16 based on the order of resilience
in which we define that the capacity serving critical facilities without any disruption for seven days with
no critical load curtailment as 100% resiliency and the capacity of serving 60% critical load for one day as
10% resiliency.
0.1
0.2
0.3
0.4
0.5
0.6
0.7
0.8
0.9
1
400
500
600
700
800
900
1000
1 2 3 4 5 6 7
Op
era
tio
n C
ost
($
M)
Pro
po
sed
DER
Cap
acit
y (k
W)
Island Time Period (Day)
70% Load Level
Proposed DER Capacity (kW) Operation Cost ($M)
0.1
0.2
0.3
0.4
0.5
0.6
0.7
0.8
0.9
1
400
500
600
700
800
900
1000
1 2 3 4 5 6 7
Op
era
tio
n C
ost
($
M)
Pro
po
sed
DER
Cap
acit
y (k
W)
Island Time Period (Day)
60% Load Level Proposed DER Capacity (kW)
Operation Cost ($M)

PON 3044 Final Report – Tarrytown
61
Table 15. The annual costs savings by the investment for supplying power for total system critical facilities with one week islanding in peak load season (July)
Islanding Days
Load Curtailment (%)
Resilience (%)
Proposed DER Capacity(kW)
Operation Cost ($)
Investment Cost ($)
7
0 100% 1,100 1,114,785 1,321,000
10% 97.35% 1,100 1,045,618 1,321,000
20% 94.71% 1,000 981,923 1,201,000
30% 92.06% 900 918,824 1,081,000
40% 89.41% 750 852,782 901,000
6
0 86.76% 1,100 1,113,966 1,321,000
10% 84.12% 1,100 1,046,059 1,321,000
20% 81.47% 1,000 976,254 1,201,000
30% 78.82% 900 918,422 1,081,000
40% 76.18% 750 852,328 901,000
5
0 73.53% 1,100 1,113,759 1,321,000
10% 70.88% 1,100 1,045,867 1,321,000
20% 68.24% 1,000 975,877 1,201,000
30% 65.59% 850 913,039 1,021,000
40% 62.94% 750 853,717 901,000
4
0 60.29% 1,100 1,112,457 1,321,000
10% 57.65% 1,100 1,042,504 1,321,000
20% 55.00% 1,000 977,383 1,201,000
30% 52.35% 850 916,120 1,021,000
40% 49.71% 750 851,821 901,000
3
0 47.06% 1,100 1,112,318 1,321,000
10% 44.41% 1,100 1,043,993 1,321,000
20% 41.76% 1,000 977,077 1,201,000
30% 39.12% 850 912,962 1,021,000
40% 36.47% 750 851,524 901,000
2
0 33.82% 1,100 1,110,760 1,321,000
10% 31.18% 1,100 1,041,376 1,321,000
20% 28.53% 1,000 981,058 1,201,000
30% 25.88% 850 912,319 1,021,000
40% 23.24% 700 851,247 841,000
1
0 20.59% 1,100 1,110,259 1,321,000
10% 17.94% 1,100 1,043,330 1,321,000
20% 15.29% 1,000 980,566 1,201,000
30% 12.65% 800 911,017 961,000
40% 10.00% 700 851,116 841,000

PON 3044 Final Report – Tarrytown
62
Table 16. Serving Total System Critical Facilities with Islanding in Peak Load Season (July)
Islanding Days
Load Curtailment
(%)
Resilience Weight (%)1
Proposed DER Capacity(kW)
Operation Cost (K$)
Investment Cost (K$)
7 0-40% 100% - 89.41% 1, 100-750 1,114.8-852.8 1,321 – 901
6 0-40% 86.76% -76.18% 1,100-750 1,113.9-852.3 1,321 – 901
5 0-40% 73.53% - 62.94% 1,100-750 1,113.7-852.1 1,321 – 901
4 0-40% 49.71% - 73.53% 1,100-750 1,112.5-851.8 1,321 – 901
3 0-40% 47.06% - 36.47% 1,100-750 1,112.3-851.5 1,321 – 901
2 0-40% 33.82% - 23.24% 1,100-700 1,110.8-851.2 1,321 – 841
1 0-40% 20.59% - 10% 1,100-700 1,110.2-851.1 1,321 – 841
Willdan proposes a loop-based network which has the capability of supplying power to critical facilities
from two feeders in order to improve the energy resilience of critical facilities. In cases of extreme
weather events, if one feeder fails, the loads can be transferred to another feeder and will still receive
power feed. The load transfer procedure is shown in figure 34.
Pre-defined Load Transfer Procedure Executed to
transfer load to the other feeder
PCC Relays send close signal to the switch
between feeder 1 and feeder 2
PCC Relays Sense the loss of one feeder
Figure 34. Load Transfer Procedure
1 Resiliency weight is introduced based on the maximum number of days that critical facility capacity is being responded in the grid outage duration and maximum level of critical facility which can be served. We define that the capability of serving critical facilities with no curtailment for seven days (as customer’s requirement) is 100% resiliency and the capability of serving 60% critical facilities for one day is 10% resiliency.

PON 3044 Final Report – Tarrytown
63
Connecting the community microgrid with Grid and Microgrid Protection
The substation to which the 13kV primary feeders are connected in the proposed community could be
the point of common coupling (PCC) where the proposed community microgrid could be isolated from
the utility grid in order to operate in island mode in case of emergency, and resynchronize with the
utility grid in order to operate in grid-connected mode. In the case of the clusters, each one will have an
individual PCC with the surrounding primary feeders or secondary network.
Three phase power flow is integrated with the master controller which ensures stability and security of
the community microgrid in both grid-connected and islanded mode. A hierarchical protection
configuration strategy is proposed to for the Community microgrid protection which mainly contains
four-level protection: load way, loop way, loop feeder way and microgrid level. Each level is equipped
with protection devices. Also the four levels are coordinated. The protection devices and operational
rules in each level are summarized in table 17. The load-shedding and other control schemes could also
be implemented on the load-way protection level based on under/over-voltage and under/over-
frequency functions of these relays. The hierarchical strategy aims at addressing the challenges in
isolating various faults in time from loop based microgrids. The performances of microgrid protection
are as summarized as follows:
Detect and isolate of faults both inside and outside of microgrids,
Detect and isolate the faults inside the microgrid in both grid-connected and islanded mode
Detect and immediately isolate the faults of the loads and DGs,
Prime protection and backup protection for protective device malfunction
Compromise between selectivity and speed.

PON 3044 Final Report – Tarrytown
64
Table 17. The Protection Devices and Operation Rules at Each Protection Level1
Protection Level Protection Devices and Operation Rules in Grid-Connected and Island Modes
Load-way protection
Directional Overcurrent (DOC) digital relay with adaptive relay setting (responding to lower fault current in island mode): —Operates only in load-way faults (DOC and auto reclosing).
Loop protection
DOC digital relay with adaptive relay setting: —Operates in loop faults [primary and backup permissive overreach transfer trip
(POTT) Schemes —Backup protection for load-way protection.
Loop-feeder protection
Non-direction Overcurrent (OC) relay: —Operates to isolate the faulted loop only when the load-way and loop
protections have failed within the loop.
Microgrid-level protection
OC relay and PCC switch: In grid-connected mode: —Unintentional islanding operation due to external fault or disturbance based on
the signal from the MC —OC relay (backup protection for the entire microgrid) —Intentional islanding operation based on the islanding command from the MC. In island mode: —Resynchronization initiated by a command from the MC.
Sub Task 2.5 Microgrid and Building Controls Characterization
Community Microgrid Control Architecture
Figure 35 shows the community microgrid elements, functions, and control tasks associated with each
criterion. In particular, the tertiary control is the upper level of control system, which ensures the
optimal operation of community microgrid by determining the set points of generation and load. In
order to achieve the optimal economics, microgrids apply coordination with the utility grid and
economic demand response in island mode. The short-term reliability at load points would consider
microgrid islanding and resynchronization and apply emergency demand response and self-healing in
the case of outages. Functionally, three control levels are applied to the community microgrid:
Primary control which is based on droop control for sharing the microgrid load among DER units.
Secondary control which performs corrective action to mitigate steady-state errors introduced by
droop control and procures the optimal dispatch of DER units in the microgrid.
Tertiary control which manages the power flow between the microgrid and the utility grid for
optimizing the grid-coordinated operation scheme.
1 Adaptive Protection System for Microgrids: Protection practices of a functional microgrid system. http://ieeexplore.ieee.org/xpl/articleDetails.jsp?arnumber=6774516

PON 3044 Final Report – Tarrytown
65
Figure 35. Objectives and Functions for the Control and Operation of the Community Microgrid
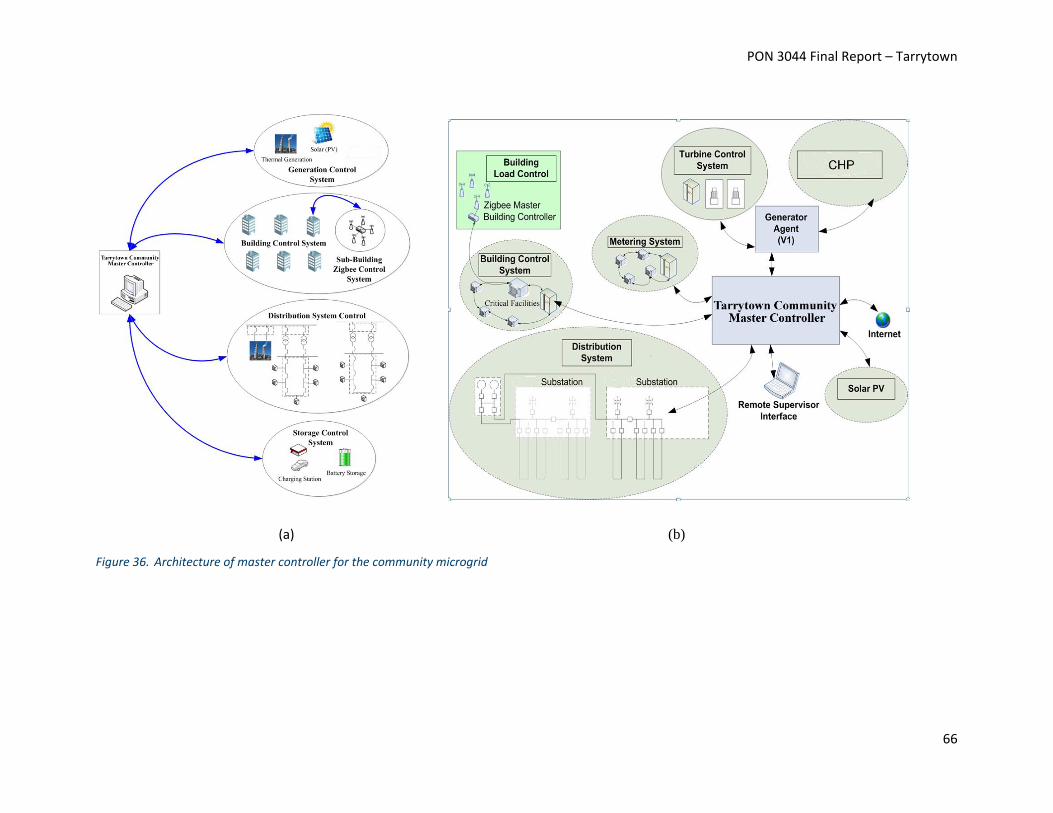
PON 3044 Final Report – Tarrytown
66
(a) (b)
Figure 36. Architecture of master controller for the community microgrid

PON 3044 Final Report – Tarrytown
67
A major element of the proposed community microgrid is its master controller. The control signals from
the master controller (MC) include the setpoints to adjust the CHP or other dispatchable DERs (grid-
forming elements for maintaining frequency and voltage if any), and the signals to open/close switches.
The master controller applies hierarchical control via supervisory control and data acquisition (SCADA)
software to ensure reliable and economic operation of the Community microgrid. It also coordinates the
operation of on-site generation, and individual building controllers. Intelligent switching and advanced
coordination technologies of master controller through communication systems facilitates rapid fault
assessments and isolations. In case of the failure of master controller, the primary control and
secondary control would keep maintaining the stability of voltage and frequency. The main functions of
the community microgrid master controller are as follows.
Communications and errors management – detection and or safe shutdown
P/Q control for generators
Point of Common Coupling (PCC) management - Power factor correction
PCC management - Peak shaving/smoothing
PCC management - Islanding and reconnection to grid
Following active power command and voltage management
Loss of communications safety
Power limits, both kW and kVAR
Loss of generation/storage asset management during grid-tied conditions
Loss of generation/storage asset management during islanded conditions
Unit commitment/availability
Load shedding/Shifting
Event logging
The hierarchical secondary control approach would receive the information from loads and power
supply entities as well as the information on the status of distribution network and procure the optimal
solution via an hourly unit commitment and real-time economic dispatch for serving the load in the
normal operation mode and contingencies. Figure 35 shows the hierarchical framework of the Master
Controller proposed for the Village’s community microgrid project. In figure 36, the monitoring signals
provided to the master controller indicate the status of DER and distribution components, while the
master controller signals provide set points for DER units and building controllers. Building controllers
will communicate with sub-building controllers and monitoring systems to achieve a device level rapid
load management.

PON 3044 Final Report – Tarrytown
68
Multiple microgrid clusters are proposed for the Villages. Figure 37 shows the structure of the cluster
master controller which coordinated all the microgrids by communicating with each of their master
controller. All the clusters can either operate together as one microgrid or as individual microgrid
simultaneously.
Master Controller of TT Cluster 1
Master Controller of TT Cluster 2
Cluster Master Controller
Master Controller of SH Cluster 1
Master Controller of Crossover
Cluster 1
Master Controller of Crossover
Cluster 2
Figure 37. Master Controller for Microgrid Clusters
With the master controller, the community microgrid would be able to provide ancillary services to the
grid including the voltage support and frequency regulation, and the distribution system restoration.
The master controller would collect the real-time information and send out set-point information
through SCADA. In most of the time, the master controller would operate in autonomy mode based on
predefined rules while keeping the reliability and economics of the whole community microgrid. In case
of emergency, the controller would utilize the master controller to isolate the community from the
utility grid and operate in island mode. Within the community microgrid, the non-critical load could be
curtailed or disconnected through smart meter or breaker, local distribution networks are reconfigured
so the local DERs can supply power to the critical facilities.
The proximity of power generation to microgrid consumptions could result in improved power quality,
lower power losses, better voltage stability, and higher reliability (fewer customer outages) by engaging
fewer components, and eliminating additional transmission services. With the added DERs, breaker and
other smart devices, the proposed community microgrid could significantly improve the reliability
indices which include the system average interruption frequency index (SAIFI), system average
interruption duration index (SAIDI), customer average interruption duration index (CAIDI), customer

PON 3044 Final Report – Tarrytown
69
average interruption frequency index (CAIFI), expected energy not supplied (EENS), and loss of load
expectation (LOLE). The main services and benefits which the proposed community microgrid could
provide are summarized as follows.
1. Increase Reliability and resiliency
The Community microgrid will be able to automatically island the electric system, energize critical
facilities, and allow a portion of the system to be energized in the event of a bulk system outage. A
CHP-driven microgrid will also introduce additional redundancy into the existing thermal system,
allowing the main boilers to be shut down in the summer for regular maintenance, which will
improve the reliability and resiliency of the overall system.
The Reliability would be improved in normal operating conditions through infrastructure
reconfiguration, such as a High Reliability Distribution System (HRDS) which senses and clears faults
with virtually no impact on building loads, to a self-healing and more fault tolerant grid, by reducing
the number of single points of failure by adding redundancy to the electrical and communications
networks, and by adding alternate sources of generation to serve critical and non-critical loads.
During emergency operating conditions, the Community microgrid would be able to provide
uninterrupted power to critical loads, through the use of DERs and load shedding schemes that
ensure safe and reliable operation of the buildings that matter most in emergency situations. Long
term outages will be mitigated by large natural gas fed combined heat and power (CHP) plant, which
will maintain a black-start capability in the event the outage occurs when the CHP facility is not
active. These plant or plants will rely on robust natural gas pipelines and produce enough power to
serve all of the critical facilities, public street and security lighting, and some residential load. This
added resiliency will keep emergency responders and residents safe and provide the Community
microgrid with heat and power when it needs it most.
2. Reduce energy cost uncertainties and exposure to market fluctuations
Additional heat generation electricity from a centrally located CHP plant, in each cluster that has
heating requirements, would allow the Village to meet their summer/winter heat load without the
expense of operating its main boiler or fuel purchase, resulting in a savings of over $1.7 million per
year. These savings would then be passed along to the many customers and members in the form of
lower energy bills and membership costs.
Community microgrid would reap economic benefits in the form of added revenue streams from
demand response, alternate generation sources, and energy efficiency measures to reduce overall
energy costs. In the case of distributed energy resources, the Village will evaluate various ownership
models to optimize the economic benefit to the system, including purchase, leasing and third-party
ownership.
3. Integrate distributed energy resources (DER) into system operations
The Village will analyze replacing some or all of the non-CHP backup generators with black-start
capable interconnected natural gas fired CHP generators strategically distributed at the critical

PON 3044 Final Report – Tarrytown
70
facilities, vacant or unused land. In any case, the heat load from the CHP would be utilized year
round, capitalizing on the communities’ existing or upgrades piping and distribution infrastructure to
deliver thermal loads.
4. Job creation
The operational requirement of a new CHP plant and microgrid system in the Village is expected to
require the creation of new professional-level jobs. Current evaluations estimate that eight new jobs
may be required to operate the CHP and microgrid systems proposed in this application.
Sub Task 2.6 Information Technology (IT)/Telecommunications
Infrastructure Characterization
Any modern utility or system operator relies heavily on their communication infrastructure to monitor
and control their grid assets. For a microgrid master controller and microgrid operators, this architecture
enables real time control, rapid digestion of critical grid information, and historical data for analysis and
reporting. As part of a feasible microgrid, assessment and upgrade of the equipment and protocols used
in the microgrid area will be performed.
Existing Resources
Con Edison owns and operates all the substations and distribution lines serving local customers in
Westchester County. A large majority of those customers are individually metered. Many of the
distribution loops and feeders have mechanical switches or automatic switches that are not remotely
controlled. The switches that are controllable are connected using fiber optic lines.
Consequences
A limited communications architecture can lead to increased frequency and duration of outages if
problems must occur and be reported rather than having symptoms trigger notifications to grid
operators of location and scope of the issue. Limited information and delay in this information leads to
man hours wasted and longer duration of customers without power, putting strain on residential
customers and potentially costing commercial customers significant amounts of money. Systems could
have telltale signs of issues for weeks, but operators may not discover these until they have caused
damage and outages to the electric grid or substations, costing the utility money and potentially
endangering employees and customers.
Opportunities
The Village is considering an Advanced Metering Infrastructure (AMI) expansion, which would involve
adding wireless communication infrastructure throughout each meter in the community to allow for
automatic and digital meter reads. The key advantage of this expansion would be the network addition,
which often utilizes the 900 MHz ISM band and relies on communication between integrated Network
Interface Cards (NICs) that form a mesh network, allowing signals to hop between any installed meters
to reach their ultimate destination and increases the propagation range of the signal in proportion to

PON 3044 Final Report – Tarrytown
71
the number and dispersion of integrated NIC Smart Meters. The integrated NICs are connected to a local
Access Point (AP) that transmits the metering and control signals for the lights over a cellular wireless
network back to the utility data center, where it can be fed into a Supervisory Control and Data
Acquisition (SCADA) platform for use in billing or monitoring the overall grid.
Village-controlled AMI would also provide opportunity for community demand response aggregation, in
which Sleepy Hollow will be able to remotely control non-critical loads at the customer level to
maximize economic benefit and/or reduce strain on the grid.
Figure 38. Tarrytown Proposed Wireless Mesh Network Communications and Control Diagram
Proposed/Suggested Improvements
The Community microgrid would be connected efficiently and productively, through the use of modern
communication architectures and equipment, enabling a master controller to optimize the microgrid
control and giving operators the tools they need to perform their daily duties. Exact upgrades or
additions to existing communications infrastructure will need to be determined in a Phase 2 design. This
network would leverage the AMI network and seek to strengthen it through the use of connected LED

PON 3044 Final Report – Tarrytown
72
streetlights, which require half the power of the existing High Pressure Sodium (HPS) fixtures and
shorten the overall payback of a street lighting upgrade through the implementation of smart photocells
or integrated NICs that individually meter and control each streetlight, seen in figure 39.
Figure 39.Network Equipment Simplified Layout Diagram1
In addition to meters and lights, circuit breakers, relays, reclosers, and other switchgear are vital to the
control of the Community microgrid. While some distributed switchgear can utilize a similar wireless
infrastructure, with data being fed through substations instead of through a cloud network, the control
equipment is more vital to the safe operation of the microgrid and would ideally use a fiber optic
backbone between the master controller and the substations. The substation relays may have to be
upgraded to communicate using the DNP3 protocol over TCP/IP, the de facto standard for modern utility
communications, which will be used to monitor and control the proposed DER as well.
Once collected locally, the data will be fed into an upgraded or added SCADA system to allow operators
to access, visualize, and control, all of the microgrid assets. 1
Each Cluster will be utility connected as detailed in figures 22-25.

PON 3044 Final Report – Tarrytown
73
Benefits
Utilizing a fully connected microgrid, with every vital piece of equipment monitored and controlled
remotely, the master controller will be able to optimize load and generation automatically and in real
time, the microgrid operators will be able to view the status, create reports, and plan future
developments, and maintenance will be able to quickly assess and address any issues.
Barriers
A more extensive review of existing communications and control equipment needs to be performed to
determine the exact quantity and specification of the upgrade, RF testing will need to be performed to
determine the layout of the wireless network proposed. Training would have to be done on the SCADA
system and the newly implemented relays, and personal may need to be hired to maintain the network
and communications equipment. A review of costs of the current system, including streetlight usage and
maintenance data, current metering system costs and inaccuracies, and outage information will have to
be performed to determine exact cost savings of upgrading to the new system.
As an owner/operator for the Community microgrid is chosen later in the study, the Master controller
location will need to be determined. The master controller would communicate with the field devices
such as the building controllers (BCs) and automatic generation controllers (AGCs) to connect to an
automatically operate the electric system. This means that any loss in communications that disrupts the
microgrid would need to be between building controllers and the master controller/utility data center
and that this loss would only prevent communication with one building, while the rest of the microgrid
would maintain normal operation.
Willdan’s proposed Community microgrid would rely heavily on the robust fiber optic backbone and the
900 MHz mesh network for monitoring and control. This system remains extremely resilient in the face
of inclement weather due to the fiber optic being underground and the mesh networked being formed
by above ground, but heavily redundant, mesh radios. Similar to the building controllers above, if one
smart meter or streetlight is unable to communicate, the rest of the lights and meters would remain on
the network and leverage each other to maintain a strong network connection.

PON 3044 Final Report – Tarrytown
74
Task 3: Assessment of the Community Microgrid’s Commercial
and Financial Feasibility
Sub Task 3.1 Commercial Viability – Customers
The critical services that would be supported by the microgrid clusters serve between 20,000 and 34,000
customers in the Westchester area; these include a fire station, ambulance corp., housing authority, and
public schools, and water plants. There is a countywide backup support system in place with the nearby
emergency services, including those of nearby Briarcliff Manor which is considering partnering with
Tarrytown and Sleepy Hollow on microgrid implementation.
Direct Services
In addition to increased reliability, or a reduction in the frequency and/or duration of outages, the
community microgrid would reap economic benefits in the form of: (i) potential revenue streams from
participating in demand response programs, ancillary service markets such as regulation and operating
reserve markets, as well as retail and wholesale generation sales; (ii) reduced consumption through
energy efficiency measures; and (iii) deferring system upgrades. Based on the price of electricity and
availability of Distributed Energy Resources (DERs), each individual cluster master controller will
optimally dispatch the generation assets to provide the cheapest, cleanest, and most reliable energy
possible to the critical and non-critical microgrid facilities. While no power can be directly shared
between clusters, the master controllers can communicate to aggregate load for demand response or to
coordinate the start-up of generators based on power quality or outage information in other clusters.
Indirect Services
Utilizing a fully connected microgrid, with every vital piece of equipment able to be remotely monitored
and controlled, the master controller will optimize load and generation automatically and in real time,
the microgrid owner/operators will be able to view the status, create reports, and plan future
developments, and maintenance personnel will be able to quickly assess and address any issues.
The community microgrid will be able to automatically island the electric system, energize and heat
critical facilities, and allow a portion of the system to be energized in the event of a bulk system outage.
System reliability would be improved in normal operating conditions through infrastructure
reconfiguration, such as a High Reliability Distribution System (HRDS) which autonomously senses and
clears faults with virtually no impact on building loads, creating a self-healing and more fault tolerant
grid by reducing the number of single points of failure by adding redundancy to the electrical and
communications networks, and by adding alternate sources of generation to serve critical and non-
critical loads.
During emergency operating conditions the community microgrid would be able to provide
uninterrupted power to a portion of critical loads through the use of DERs and load shedding schemes
that ensure safe and reliable operation of the buildings that matter most in emergency situations. Long

PON 3044 Final Report – Tarrytown
75
term outages will be mitigated by 1,100 kW of natural gas fed combined heat and power (CHP) plants,
which will maintain a black-start capability in the event the outage occurs when the CHP facility is not
active. These plants will rely on robust natural gas pipelines and produce enough power to serve all of
the critical facilities. This added resiliency can keep emergency responders and residents safe and
provide the community microgrid with heat and power when it needs it most.
Currently, it is expected that the community microgrid would likely be structured and operated as a
regional public project similar to the Tri-Party Agreement established in 2006 between the Village of
Tarrytown, Sleepy Hollow, and Briarcliff Manor for connecting to the Delaware Aqueduct. This regional
joint authority project will be structured to ensure that any financial obligations are met through public
guarantees of the three Villages.
The community microgrid would be the purchaser of power, as ConEd would remain the utility
electricity supplier during normal operating conditions. During islanding, the critical facilities would be
prioritized for power and payments would be worked out amongst the joint authority.
Each current account within the community microgrid is expected to continue purchasing power from
the microgrid in blue sky conditions. While in island mode, only critical facilities including the fire hall,
Police Station, and government facilities are guaranteed to be provided service, with additional capacity
to provide additional services where needed in order of importance. These lists are different because
the total amount of generation proposed under the microgrid is less than the total peak demand of the
community microgrid service area. The generation is sized to provide enough capacity to provide power
for all critical services in the event of a major outage event, or all facilities while implementing load
shedding of non-critical loads.
The joint authority will be responsible for registering additional customers to be served by the
microgrid; however, this must occur during the design phase to ensure proper sizing of the generation
sources. This is due to the fact that if additional priority customers are to be added then the authority
must take this into account and consider larger sized generation along with distribution upgrade
requirements.

PON 3044 Final Report – Tarrytown
76
Sub Task 3.2 Commercial Viability - Value Proposition
Utility Costs
Coned would not be faced with the initial investment costs of upgrading their electrical infrastructure to
a High Reliability Distribution System (HRDS) including Automatic Transfer Switches (ATS), Upgraded
Circuit Breakers and Relays, improved communication infrastructure including, fiber optic and wireless
RF, as well as the cost to train CHP plant operators or maintenance supervisors and network and
controls engineers to configure and manage the newly upgraded system. Overall the utility cost would
be lowered by moving all of these potential costs to upgrade and improve the system to the microgrid
owner. This could help the utility avoid upgrade and capacity improvement costs, as well as some
maintenance costs for the specific area, based on conversations with ConEd about one or more
proposed clusters.
Microgrid development will be funded through feasibility by NYSERDA grants. Development and
construction will be funded through available grants, private equity (where possible) and bond issuance.
An Engineering, Procurement, and Construction (EPC) contract will be used as a vehicle for performance
through the commercial operation date (COD). An operating contract will be executed to cover
operations and maintenance upon commercial in-service. Appropriate warranties will be obtained from
technology providers and cover each key component of the microgrid. Currently, it is expected that the
community microgrid would likely be structured and operated as a regional public project similar to the
Tri-Party Agreement established in 2006 between the Village of Tarrytown, Sleepy Hollow, and Briarcliff
Manor for connecting to the Delaware Aqueduct. This regional joint authority project will be structured
to ensure that any financial obligations are met through public guarantees of the three Villages.
Potential Project team members may include bond counsel, private equity advisors, DOE LGO, NYMPA,
EPC Contractor, Consulting Engineer, Operator, Permitting Consultant, Environmental Consultant,
ConEd, ratepayers, Village Council, stakeholders, and technology providers. Table 18 below presents the
SWOT analysis.
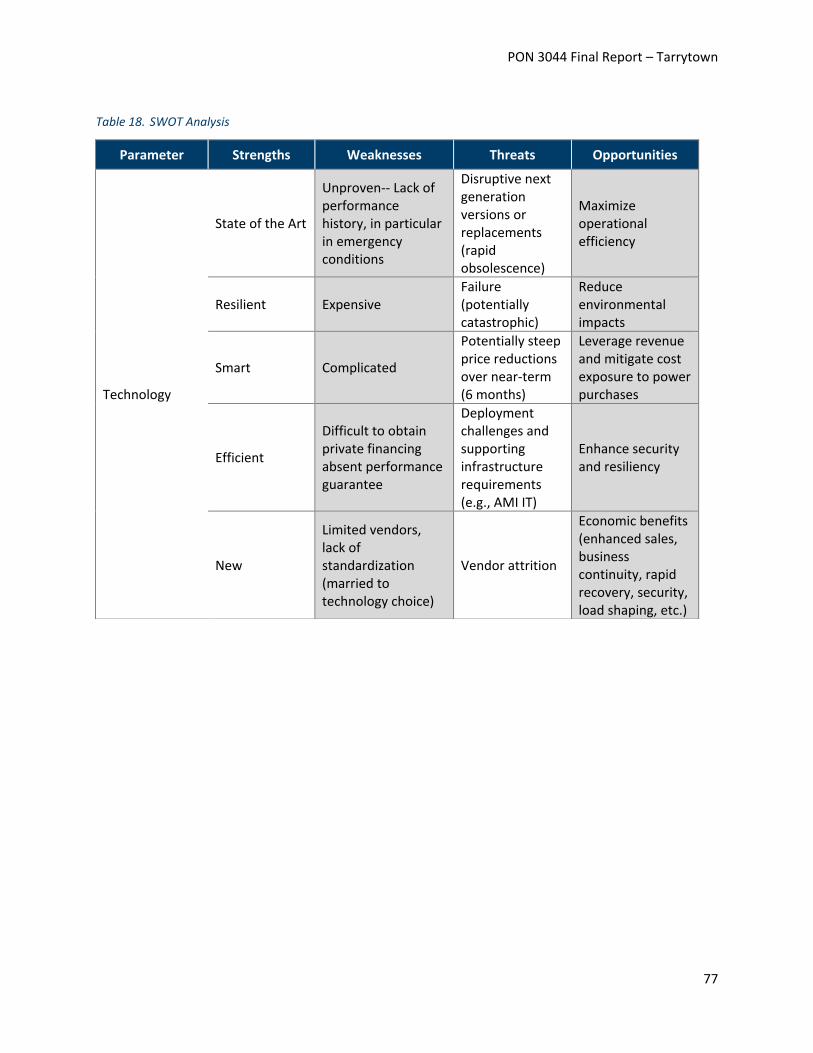
PON 3044 Final Report – Tarrytown
77
Table 18. SWOT Analysis
Parameter Strengths Weaknesses Threats Opportunities
Technology
State of the Art
Unproven-- Lack of performance history, in particular in emergency conditions
Disruptive next generation versions or replacements (rapid obsolescence)
Maximize operational efficiency
Resilient Expensive Failure (potentially catastrophic)
Reduce environmental impacts
Smart Complicated
Potentially steep price reductions over near-term (6 months)
Leverage revenue and mitigate cost exposure to power purchases
Efficient
Difficult to obtain private financing absent performance guarantee
Deployment challenges and supporting infrastructure requirements (e.g., AMI IT)
Enhance security and resiliency
New
Limited vendors, lack of standardization (married to technology choice)
Vendor attrition
Economic benefits (enhanced sales, business continuity, rapid recovery, security, load shaping, etc.)
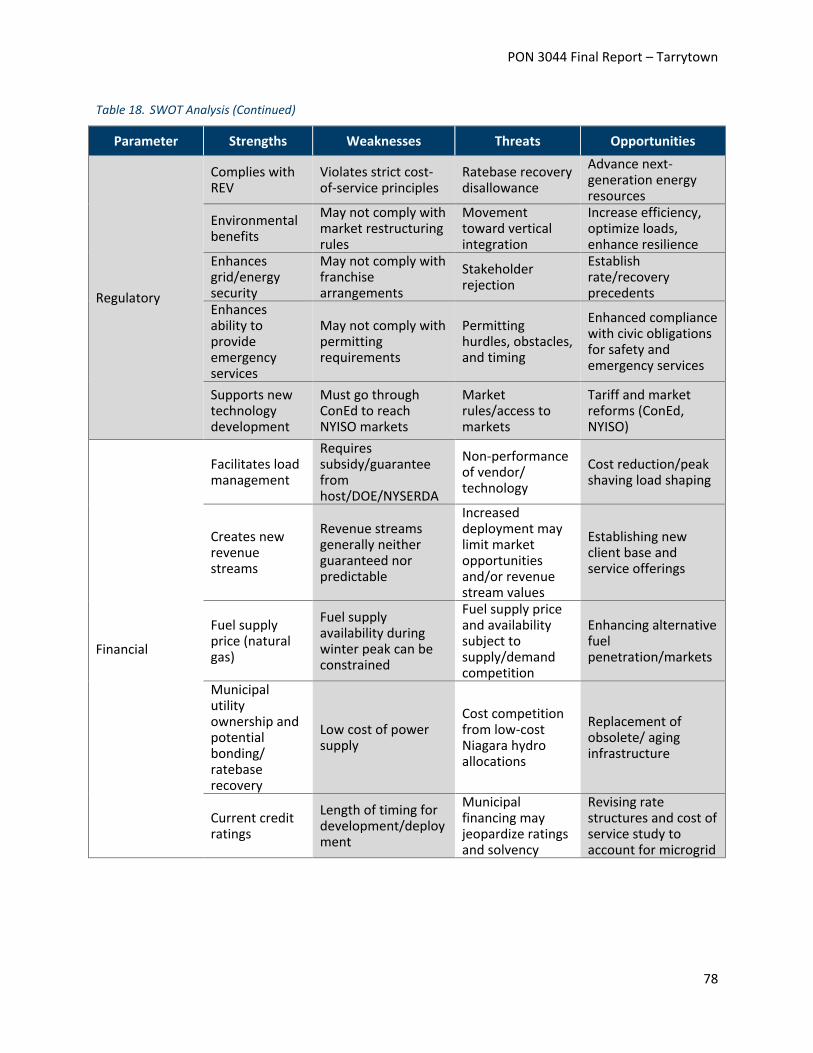
PON 3044 Final Report – Tarrytown
78
Table 18. SWOT Analysis (Continued)
Parameter Strengths Weaknesses Threats Opportunities
Regulatory
Complies with REV
Violates strict cost-of-service principles
Ratebase recovery disallowance
Advance next-generation energy resources
Environmental benefits
May not comply with market restructuring rules
Movement toward vertical integration
Increase efficiency, optimize loads, enhance resilience
Enhances grid/energy security
May not comply with franchise arrangements
Stakeholder rejection
Establish rate/recovery precedents
Enhances ability to provide emergency services
May not comply with permitting requirements
Permitting hurdles, obstacles, and timing
Enhanced compliance with civic obligations for safety and emergency services
Supports new technology development
Must go through ConEd to reach NYISO markets
Market rules/access to markets
Tariff and market reforms (ConEd, NYISO)
Financial
Facilitates load management
Requires subsidy/guarantee from host/DOE/NYSERDA
Non-performance of vendor/ technology
Cost reduction/peak shaving load shaping
Creates new revenue streams
Revenue streams generally neither guaranteed nor predictable
Increased deployment may limit market opportunities and/or revenue stream values
Establishing new client base and service offerings
Fuel supply price (natural gas)
Fuel supply availability during winter peak can be constrained
Fuel supply price and availability subject to supply/demand competition
Enhancing alternative fuel penetration/markets
Municipal utility ownership and potential bonding/ ratebase recovery
Low cost of power supply
Cost competition from low-cost Niagara hydro allocations
Replacement of obsolete/ aging infrastructure
Current credit ratings
Length of timing for development/deployment
Municipal financing may jeopardize ratings and solvency
Revising rate structures and cost of service study to account for microgrid

PON 3044 Final Report – Tarrytown
79
Table 18. SWOT Analysis (Continued)
Parameter Strengths Weaknesses Threats Opportunities
Financial (continued)
Enhanced metering accuracy for revenue recovery
Load management can reduce revenue
Data loss or hacking/privacy concerns
New customer service offering and market products
Construction/ Operation
EPC turnkey with performance guarantees
Unproven technology/ lack of operating history
Performance shortfalls or failures
Dynamic system optimization
Independent construction monitor/ engineer
Reliance on third parties
Delays in completion and COD
Enhancing/upgrading distribution infrastructure
Municipal ownership
Location (cheap power, grid dynamics)
Fuel supply interruption
Improved billing accuracy
Existing utility and associated infrastructure for metering and billing and distribution
Legacy systems may be old and obsolete
Technology training and additional infrastructure
Improved cost recovery
Enhanced services especially during emergencies
Stakeholder outreach and education
Compatibility with billing and existing systems
Enhanced customer service and interface

PON 3044 Final Report – Tarrytown
80
Working closely with ConEd, Willdan has identified load clusters, which can be easily electrically isolated
for resiliency and economic benefits. These clusters would each have a ‘peer’, or equally weighted,
master controller that would optimize generation and load within the cluster and communicate with a
single master controller that supervises and optimizes the entire system to provide benefits to each
other as well as the surrounding community and utility stakeholders. This approach provides the best
value to the customer in an area with a complex utility distribution network that does not necessarily
follow city, county, or municipal boundaries. In addition, this configuration provides benefits to the
surrounding area by acting as a demand response aggregator and by providing heat and power to
emergency services, such as the fire department and police stations equipped with CHP, when it would
not otherwise be available.
The community microgrid will be applicable to many communities. Willdan’s engineering team is leading
multiple microgrid feasibility studies for western and southern New York communities and will ensure
application of good ideas and best practices of microgrids playing a central role in transforming energy
services will propagate throughout the participating municipal and investor owned utilities. Willdan is
working closely with ConEd in the hopes that their support will open the option for communities around
New York to consider the microgrid option.
The price of electricity in the Village is high enough that the installation and operation of natural gas
fired CHP and generators will reduce the overall cost for the community microgrid’s customers when
considered alongside the avoided fuel costs for the provided heat.
Many of the existing facilities in the Village rely on No 2 Fuel Oil for space heating. These existing heat
sources would be phased out with the addition of the cleaner, more efficient, Natural Gas fired CHP and
thermal infrastructure to utilize the waste heat.
Willdan proposes a Loop-based community microgrid. This new distribution network has a meshed
structure which can operate as loop or radial, though it is normally operated as radial (i.e., with no loop)
so as to make the protection coordination easier (upstream to downstream) and to make the
distribution design easier. Also, the Automatic Transfer Switch (ATS) is proposed to be deployed within
the community microgrid, which has the capability of network reconfiguration in case of emergency or
outage.
Currently, there are no permanent generation resources anywhere in the community microgrid’s
system. Only just over 500 kW of backup generators are the only available as distributed energy
resources and do not provide sufficient capacity to support critical electric loads. As part of the
feasibility study, the community microgrid can replace some or all of the non-CHP backup generators
with black-start capable interconnected natural gas fired generators strategically distributed at the
critical facilities and load pockets. This will ensure that the communities will be more prepared to
weather power outages in emergency situations.
Each community microgrid Cluster would be served by generation sources, centralized within each
cluster, supplied by robust natural gas pipelines. The two clusters that have heating load would be

PON 3044 Final Report – Tarrytown
81
provided for by newly installed heating infrastructure from the CHP Plant to ensure heat and power
when it’s needed most.
Steam produced by the CHP plants installed throughout the microgrid will be transported and sold to
critical facilities and potentially to surrounding commercial or residential customers by way of newly
installed thermal transport infrastructure.
Based on the owner/operators chosen business model, the power purchasers, commercial, residential,
and Industrial customers, will have the unique opportunity to participate in a potential real-time pricing
program, encouraging electricity use off of peak hours and savings for willing participants.
NY REV seeks to transform the state's energy distribution system toward cleaner and more local power,
and will change its utilities' business model and regulatory framework. Although the target is investor
owned utilities, for now, this project helps ConEd to consider how microgrids, distributed generation
and increasing amounts of renewables might all fit together and help NY state to reach to its goals.
Table 19. Stakeholder Value Proposition
Stakeholder Value Proposition
Electricity Purchaser
The community microgrid will ensure a constant reliable source of heat and electricity to the communities critical facilities, ensuring that emergency shelters and police and fire stations remain fully operational in the event of an emergency while, at the same time, lowering the overall cost of electricity purchases by passing along savings from new sources of revenue and cost savings gained by the electric utility
Critical Facilities
In the event of an emergency the critical facilities would see uninterrupted flow of heat and electricity and maintenance of the full extent of the facility’s operation. During normal operation, the financial benefits to the critical facilities would increase the money available for other community improvements while lowering costs for the critical facilities
Utility
The Utility would have deferred upgrades due to the installation of the microgrid assets by the microgrid owner as well as additional capacity due to the microgrid load being served by DER. In addition, there would be some maintenance cost reduction due the microgrid owner being responsible for a small portion of their service area
Suppliers and Partners
The microgrid owner would purchase more Natural Gas from their NG Supplier that they would use for CHP for Heat and Power, provide safety and reliability to the residents of Westchester County, and build a stronger and more resilient community in New York
NY State
NYISO would benefit from having another Demand Response participant that it could call on in times of need with grid balancing, and finally the state of New York would prosper as a technically advanced and resilient community grows and develops under its guidance

PON 3044 Final Report – Tarrytown
82
Financially feasible, commercially viable, and more established or mature technology services or
components were primarily considered to allow more financing opportunities for the overall project
investments and to mitigate risk of emerging or early stage technologies being incorporated into the
community microgrid. With the exception of natural gas-fired CHP technology, each major component
proposed is a new (i.e., emerging or young) technology.
Sub Task 3.3 Commercial Viability - Project Team
Local community groups and the municipal government are existing stakeholders to the microgrid
project. The other aspects of the community microgrid have been brought to the community
stakeholders to refine the ideas and maintain their support. Most of the facilities are village owned,
facilitating their addition to the microgrid and the reconfiguration of their backup resources.
Currently, it is expected that the microgrid would likely be structured and operated as a regional public
project similar to the Tri-Party Agreement established in 2006 between the Village of Sleepy Hollow,
Tarrytown, and Briarcliff Manor for connecting to the Delaware Aqueduct. This regional joint authority
project will be structured to ensure that any financial obligations are met through public guarantees of
the three Villages. Potential Project team members may include bond counsel, private equity advisors,
DOE LGO, NYMPA, EPC Contractor, Consulting Engineer, Operator, Permitting Consultant, Environmental
Consultant, ConEd, ratepayers, Village Council, stakeholders, and technology providers. Willdan is
serving and the energy and engineering expertise, with additional team members added as needed to
support the construction and financing of the project
Consolidated Edison (ConEd) has been committed to the project and a key stakeholder whose input has
guided the scope in a way that provides real value to the customers as well as benefits to any utility
interested in integrating a microgrid or clustered microgrid in their service territory.
The Village of Tarrytown has a good financial record and low debt burden. The most recent rating
information for Tarrytown is a rating of AA2 from Moody’s in July of 2015 with a Stable Outlook.1
Briarcliff Manor’s is AA+ from Standard and Poor’s as of April 14, 2015 with $7.9M issuance of Public
Improvement Refunding Serial Bonds.
Willdan is a 51-year-old company that provides energy and engineering expertise and professional
services to thousands of municipalities across the country. Willdan has recently been awarded 8 NY
Prize awards and is a growing force in the microgrid market.
Microgrid development will be funded through feasibility by NYSERDA grants. Development and
construction will be funded through available grants, private equity (where possible) and bond issuance.
An Engineering, Procurement, and Construction (EPC) contract will be used as a vehicle for performance
through the commercial operation date (COD). An operating contract will be executed to cover
1 The Village of Tarrytown’s issuance of $7.1M of Serial Bonds was rated AA2 by Moody’s according to the 2015 Official Statement.

PON 3044 Final Report – Tarrytown
83
operations and maintenance upon commercial in-service. Appropriate warranties will be obtained from
technology providers and cover each key component of the microgrid.
As of now, the legal and regulatory support is being provided by subject experts within Willdan. Moving
forward additional support is being sought from NYSERDA, as well as other industry professionals to
support the development of this project. Willdan’s existing relationship with Brookhaven National
Laboratories has provided assistance in this area as well. Appropriate SMEs will be incorporated into the
team as appropriate in the next rounds.
Sub Task 3.4 Commercial Viability - Creating and Delivering Value
Selection Process
The existing technologies that may be considered to support smart grid and microgrid capabilities have
been screened for their application to the community microgrid. This involved appropriating the
benefits to the specific wants and needs of the stakeholders as well as refining the list to the reasonable
and applicable technologies for the region. The remaining technologies, applications, and revenue
streams were then evaluated based on financial and technical feasibility in their application to the
community microgrid. This primarily consisted of detailed research into the existing infrastructure
available and compatibility of the proposed technology with this infrastructure and with the other
resources which will be available in the microgrid. Finally, the passing technologies were studied in
detail to determine the range of acceptable capacity as well as the fit for the Microgrid
owner/operator’s requirements.
Benefits
The addition of a range of DERs, including long term sources like CHP and short term sources like ICE DG,
would allow the community microgrid to operate as a microgrid, take advantage of new revenue
streams generated by microgrid assets such as Demand Response and Fast Response Regulation
Markets, increase resiliency through on-site generation, and reduce charges associated with high winter
heating loads by utilizing generation in the microgrid clusters. Distribution of these additional resources
will ensure that critical facilities will remain powered on in emergencies, providing the Village with
greater resiliency to natural and macro-grid events.
Challenges
Additional modeling will be performed to determine the exact size, cost, benefits, and capacity of the
proposed units, to ensure that they are financially feasible and that the space and personnel
requirements are met. Plant managers for CHP will have to be hired internally or externally and training
will be required for maintenance personnel and operators of the proposed DERs.
As Natural Gas fed generators and CHP are the most feasible option for the community microgrid, the
microgrids will heavily rely on Natural gas pipelines to power the facilities. Pipelines are highly resilient
to inclement weather, but do have the potential to break down or be damaged. This would have to be

PON 3044 Final Report – Tarrytown
84
monitored closely by the partnership to prevent any small issues from leading to major problems if
there is an interruption in natural gas supply. However, since ConEd currently owns and operates the
gas distribution system with a high grade of reliability, there is not expected to be any additional burden
with regard to gas system maintenance.
Existing Resources
The total population of Tarrytown’s Electric service territory is approximately 11,000. During the winter
season, the Village splits its building’s space heating load between natural gas and No. 2 Fuel Oil.
The locations, peak loads, and load clusters of nine critical facilities within Tarrytown is shown in figure
40 and figure 41 and detailed in table 20 with electrical and thermal load, along with existing backup
generation. Sleepy Hollow Cluster 1 includes the Riverside Hose, Police, Village, and Fire Department
building, Union Hose, and the North Tarrytown Housing Authority. Tarrytown Cluster 1 consists of the
Tarrytown Police Department, Riverside Hose Co. and Tarrytown Municipal Housing. Crossover Cluster 1
is on the border between Tarrytown and Sleepy Hollow and includes the John Paulding School from
Tarrytown’s critical facilities as well as the Sleepy Hollow High School from Sleepy Hollow’s critical
facilities. Crossover Cluster 2 is located northwest of Tarrytown proper and includes the Tarrytown
Water Pump Station, the Sleepy Hollow Water Pump Station, as well as the Briarcliff Manor Water Pump
Station.
The current distribution infrastructure and especially the building management systems between the
buildings do not require a shared network infrastructure. This would have to be installed along with the
microgrid assets to allow for the connections necessary to efficiently operate the microgrid.
The community microgrid master controller would determine the optimal and reliable operation of
microgrid through optimal generation dispatch and load schedule signals. The generation dispatch
signals are sent to dispatchable distributed energy resource (DER) units and the load schedule signals
are sent to building controllers. An interactive grid-forming control would be used either in island or
grid-connected mode. In island mode, DERs apply this control scheme to share the load, while in the
grid-connected mode. DERs apply this control scheme to regulate the power exchange between the
microgrid and the utility grid. In the grid-connected mode, the DER unit, with grid-following control,
follows the microgrid voltage and frequency, which is set by the utility grid in grid-connected mode and
other DER units in island mode. The proposed generation will be located at Village owned buildings, on
the proposed network upgrades, with the master controller at a secure village owned location; ensuring
smooth operation of the microgrid.
Permits and permission may be required for the installation of additional DG though these are likely to
be similar for any project. Additional air or discharge permits may also be required, thought this will be
studied in greater detail in the next phase.
Willdan is leading the project development for the community stakeholders. The general process will
proceed from feasibility assessment to design and construction in phases beginning with the CHP

PON 3044 Final Report – Tarrytown
85
upgrade, followed by electrical infrastructure, and concluding with the master controller installation and
commissioning.
Figure 40. Sleepy Hollow Load Simplified Layout Diagram
Figure 41. Tarrytown Load Simplified Layout Diagram

PON 3044 Final Report – Tarrytown
86
Table 20. Microgrid Cluster Breakdown
Cluster Involved Buildings Demand
(kW)
Average Heating Demand
(Therms/Hr)1
Backup Generation
Proposed Generation
Sleepy Hollow Cluster 1
Rescue Hose Fire Co 20.1 1.9 NO
150 kW Natural Gas Fired CHP
Police Department/Village
Hall/ Fire Department
85.7 4.2 175 kW Diesel
Union Hose Fire Hose
10.6 1.0 35 kW Diesel
North Tarrytown Housing
Authority 139.3 25.5 NO
Total SH Cluster 1
255.6 32.6 210 kW 150 kW
Tarrytown Cluster 1
Police Department 76 3.68 175 kW Diesel
150 kW Natural Gas Fired CHP
Riverside Hose 14.7 1.39 80 kW Diesel
Tarrytown Municipal Housing
Authority 172.2 31.6
200 kW Diesel
Total TT Cluster 1
262.9 36.6 455 kW 150 kW
Crossover Cluster (CC) 1
Sleepy Hollow High School
307.9 51.3 NO 300 kW Natural Gas Fired CHP John Paulding
School 80.8 18.9 NO
Total CC 1
388.7 70.2 NONE 300 kW
Crossover Cluster (CC) 2
Sleepy Hollow Water Pump
Station 248 NONE
30 kW Diesel
500 kW Natural Gas Fired Generator
Tarrytown Water Pump Station
208 NONE 30 kW Diesel
Briarcliff Water Pump Station
168 NONE 35 kW Diesel
Total CC 2
624 NONE 95 kW 500 kW
Total
1,531.2 139.5 5152 kW 1,100 kW
1 These values based on ConEd usage billing data and converted to hourly average values Ratio of Therms/Hr to kW is 1:29.3
2 This number was obtained from the available information at the time; a reported 30 kW generator, two 35 kW generators, and 150-200 kW generator (assumed to be 175 kW) and one confirmed generator with unreported size that was estimated based on similar building types with confirmed generators in Tarrytown.

PON 3044 Final Report – Tarrytown
87
The community microgrid will ensure a constant reliable source of heat and electricity to the
community’s critical facilities, ensuring that emergency shelters and police and fire stations remain fully
operational in the event of an emergency, which may otherwise be disastrous with the absence of
power, while, at the same time, lowering the overall cost of electricity purchases by passing along
savings from new sources of revenue and cost savings gained by the electric utility. These include
economic dispatch to reduce the overall price of electricity, and DR aggregation for the clusters.
While customers could see short term increases in rates to realize some of the additional smart grid
benefits, over time, energy efficiency and intelligent management programs should enhance and
optimize consumption patterns to control costs while increasing resiliency and efficiency. These rate
increases are also unlikely, as the aggregated cluster load for each cluster will be considered one
customer to ConEd, because there will be a single electrical point of connection with the utility and each
cluster will have its own utility owned electric meter, and therefore, will qualify for a lower electricity
price as a higher class of service than individually metered buildings. The microgrid owner can decide to
pass this cost along to customers directly or consider the difference as a revenue stream.
All of the pieces of the microgrid generation, hardware and software are expected to come from on the-
market, proven solutions. In terms of the master controller, Willdan is evaluating potential options, with
preference being given to those solutions that have been previously installed and financed in existing
microgrids.
All final decisions and responsibilities lie with the owner/operator/developer of the project, the joint
community agreement. Willdan shall support the project development and performance guarantees,
backstops, and warranties will be sought out where necessary. Project development will proceed with
the microgrid owner selecting a Design firm followed by pursuing construction and financing support.
Willdan will support the decision making process with technical expertise and the project team will work
to ensure all processes proceed as expected.
As currently structured, the project would be a customer of ConEd and all financial transactions,
including electricity purchases, would flow through ConEd. As clusters of buildings would be aggregated,
new ConEd meters would have to be placed at the point of common coupling to individually meter each
cluster.
The project is municipal in nature, and while the project may be replicable across the State in other
municipalities, there are no additional commercialization plans for any piece of this project.
The community microgrid project is located in a congested area of NYISO and therefore offers benefits
to the grid as reflected in the potential revenue streams presented herein. The municipal model
presents the best option to overcome potential regulatory barriers and existing loan guarantee
programs to overcome financing barriers.

PON 3044 Final Report – Tarrytown
88
Sub Task 3.5 Financial Viability
Potential Revenue Streams
Potential revenue streams and/or savings will be highly dependent upon the final configuration of the
community microgrid, the ownership structure, factors affecting power prices in the New York
Independent System Operator’s (NYISO’s) markets, and natural gas markets, among other items.
Assuming the microgrid includes natural gas-fired CHP, potential revenue sources may include energy
sales to Consolidated Edison of New York, Inc., Demand Response related revenues and Ancillary
Services payments from NYISO, and potential revenues from other public authorities. Generation
technology would also potentially displace energy purchases during NYISO peak summer months.
General estimates of these costs follow. Should the community microgrid proceed to the next round,
detailed information on actual technology and detailed production cost modeling would be necessary to
quantify expected revenue streams.
Demand Response Revenues
Any generation associated with the community microgrid could potentially participate in demand
response programs offered by Consolidated Edison, Inc. (ConEd), the regional service provider and a
NYISO Market Participant. ConEd’s PSC No. 10, Schedule for Electricity Service—General Rules,
Regulations, Terms and Conditions under which Electric Service will be Supplied—currently applies to
the County of Westchester where the Village is located. Currently, ConEd offers demand response rates
under Rider U—Distribution Load Relief Program, Rider V—Emergency Demand Response Program, and
Rider W—Day Ahead Demand Reduction Program. ConEd designates eligible SCs for each type of
service. The community microgrid would most likely receive service under SC-11—Electric Buy-back.
SC-11 service requires a customer to be eligible for service under one of the following SCs: SC-5 (electric
traction systems), SC-8 (multiple dwellings-redistribution), SC-9 (general-large >10 kW), SC-12 (multiple
dwellings space heating), or SC-13 (bulk power high tension – housing developments). The applicable
payments and terms for each of these Riders follow.
Rider U is available between May 1 and September 30 to various SCs including SC-11. Under this Rider,
community microgrid would be required to provide at least 50 kW of Load Relief under either a
voluntary or reservation payment option as either an Aggregator of loads (in which case a minimum of
100 kW of Load Relief is required) or single account holder. Participants may be called upon to
participate in up to two testing events of up to one hour each.
Under the Voluntary option, for each event, ConEd pays $3.00/kWh for the average hourly kWh of Load
Relief times the number of event hours.
For Reservation participants, ConEd pays $6.00/kW-month for designated Tier 1 Networks and
$15.00/kW-month for designated Tier 2 Networks. In both cases payments are adjusted by a
Performance Factor based on historic performance (initially set at 1.0). A Bonus Payment of $5.00/kW-
month is paid at the end of the three year incentive period following initial participation. Additional
PON 3044 Final Report – Tarrytown
89
bonus payments are available for Load Relief provided during designated Bonus Hours or Bonus Periods.
Bonus periods apply for each participant event after the sixth Load Relief occurrence during the period
from May 1 to September 30. Payments consist of $2.00/kW-month up to the ninth occurrence and
$3.00/kW-month per event thereafter, in each case as adjusted by the Performance Factor.
Additionally, commencing on the fifth hour of a Load Relief event, a Bonus Hour payment of $3.00/kWh
is made. Finally, a Performance Payment of $1.00/kWh applies for each non-Bonus Hour and for each
testing event hour.
Rider V—Emergency Demand Response Program—payments are available to various SCs, including SC-8,
SC-9, SC-12, and SC-13. Participants can provide 100 kW or more of either Load Reduction or Load
Delivery during certain NYISO-declared emergencies. Payments under this Rider consist of 90% of the
greater of the real-time zonal Locational Based Marginal Price (LBMP) or $0.50/kWh, for a minimum of
four hours.
Rider W—Day Ahead Demand Reduction Program—payments are available to various SCs, including SC-
8, SC-9, SC-12, and SC-13. Program participants bid at least 100 kW of Load Curtailment in 100 kW
increments starting at $0.05/kWh.
SC-11 Revenues
SC-11—Electric Buy-back applies to the purchase of capacity and energy from certain classes of
customers including non-residential CHP DERs. This schedule provides capacity and energy payments to
certain designated generators like community microgrid.
Monthly capacity payments under SC-11 are based on the NYISO applicable capacity payments.
Under this schedule, energy payments to generators are based on the NYISO zonal LBMP. For
Generators delivering at secondary distribution, the price is increased by an adjustment of 1.066. Total
annual payments are estimated to be around $52,000.
Installed Capacity Revenues
The community microgrid may qualify for sales of Installed Capacity (ICAP) under ConEd’s PSC-10 Rider
P—Purchases of Installed Capacity. To be eligible, community microgrid must be a Full Service customer
of Con Ed under various rate schedules including those which would likely apply to the community
microgrid. ICAP sales are available to a customer who contracts to provide at least 100 kW (in multiples
of 100 kW) of curtailment through either Load Reduction or Load Delivery. Purchases of ICAP apply to
winter (November through April) and summer (May through October) capability periods.
Table 21 illustrates potential ICAP payments to the community microgrid. Customers can enroll based
on Summer (May-Oct) or Winter (Nov-Apr) participation. Based on these estimates, revenues of
approximately $52,000 would result from capacity payments for 12-months of participation.

PON 3044 Final Report – Tarrytown
90
Table 21. Illustrative Example of ConEd ICAP Revenues
May Jun Jul Aug Sep Oct Price ($/kW-Month)1 $10.50 $9.87 $9.08 $8.44 $8.40 $8.35
Capacity (MW) 0.95 0.95 0.95 0.95 0.95 0.95
ConEd ICAP Payment ($) $9,975.00 $9,376.50 $8,626.00 $8,018.00 $7,980.00 $7,932.50 Nov Dec Jan Feb Mar Apr Price ($/kW-Month)2 $3.78 $3.75 $3.80 $3.75 $3.74 $3.70
Capacity (MW) 0.95 0.95 0.95 0.95 0.95 0.95
ConEd ICAP Payment ($) $3,591.00 $3,562.50 $3,610.00 $3,562.50 $3,553.00 $3,515.00
TOTAL $51,908.00
Microgrid generation may potentially participate in other NYISO Ancillary Services Markets, however the
extent to which resources can take advantage of these potential revenue streams are dependent upon
ConEd tariffs. ConEd’s ancillary services charges provide a general estimate of potential revenues
available. Table 22 illustrates the ancillary service charges for the Westchester Zone (NYISO load zones
H and I) for 2015.
Table 22. Con Ed Ancillary Service Charges
Effective Date Westchester Zone
¢/kWh
1/13/2015 0.1507
2/12/2015 0.1570
3/16/2015 0.1376
4/14/2015 0.1379
5/13/2015 0.1786
6/12/2015 0.2481
7/14/2015 0.2401
8/12/2015 0.1748
9/11/2015 0.1894
10/13/2015 0.1528
11/10/2015 0.1930
12/14/2015 0.2413
1/13/2016 0.2038
The CHP units may be able to participate in the NYISO Demand-Side Ancillary Services Program (DSASP)
for which NYISO provides a minimum of $75/MWh. However, FERC is ruling on the eligibility of behind-
the-meter generation (Docket #EL13-74-000) and, according to NYISO’s recent semi-annual update,
1 NYISO, Summer 2015 Monthly Auction Results for UCAP, Auction Starting 05/2015, Posted Date: 04/14/2015 12:01 PM, G-J Locality. http://icap.nyiso.com/ucap/public.
2 NYISO, Winter 2015-2016 Monthly Auction Results for UCAP, Auction Starting 10/2015, Posted Date: 10/14/2015 12:03 PM, G-J Locality. http://icap.nyiso.com/ucap/public.

PON 3044 Final Report – Tarrytown
91
there has been no activity for the past several years.1 At this time revenue streams from this market
seem marginal.
Savings
The community microgrid may be eligible for ConEd’s Rider H—Non-Residential DG Gas Rate—for
purchased of natural gas. However, such purchases are predicated upon maintaining a 50% annual load
factor. Additional information is required to quantify potential savings under this Rider.
What other incentives will be required or preferred for this project to proceed? How does the timing of those incentives affect the development and deployment of this project?
Additional Infrastructure
Certain components of the microgrid will require upgrades to existing and installation of new
infrastructure (e.g., distribution system, natural gas pipelines, etc). The timing of these resources will
impact the microgrid, in particular potential permitting requirements. For example, the microgrid
requires deployment of Advanced Metering Infrastructure (AMI). Natural gas infrastructure would likely
require upgrades and installation of new assets.
Funding
Microgrid development will depend on access to financing and cost of capital. As with any capital
investment, the cost and availability of funding will reflect the risk profile of the venture. In the case of
microgrids, the Willdan Team expects first tier risks—that may drive financing terms, where available, or
under certain circumstances prevent access to capital markets—to include technology risk, regulatory
risk, lack of a proven track record, and market risk. The regulatory regime will affect microgrid projects
in three ways: rate recovery methodology/treatment, potential revenue streams (e.g., power pool
market rules, limitations on generation ownership, emissions limits, operating restrictions, technology
constraints), and project structure/ownership (for example prohibitions on distribution utilities owning
generation assets).
Project Guarantees/Financing Backstops
The microgrid may require additional guarantees to secure financing and rate recovery. The availability,
cost and timing of such guarantees may impact development. Microgrid technology is emerging and
unproven. It offers great possibility and, under the correct circumstances, should be highly attractive to
private equity. However, given the risks discussed above, any project’s access to private capital will
ultimately depend on the guarantor and or backstop underpinning the project. Put another way, with
unproven technology in an emerging market, private equity will seek to insulate investors from risk
assuming a worst-case scenario to offer capital at a reasonable price. Pension funds and other desirable
funding sources will require adequate de-risking of the venture.
1 New York Independent System Operator, Semi-Annual Reports on New Generation Projects and Demand Response Programs (Docket Nos.
ER03-647-000 and ER01-3001-000) dated June 1, 2015, Attachment II, page 1.

PON 3044 Final Report – Tarrytown
92
Classifying microgrid assets as Critical Infrastructure Protection assets under NERC or security assets
under Homeland Security may open avenues to external funding from state and federal sources and/or
facilitate use of these entities as backstops or ultimate guarantors. Additionally, on August 24, 2015,
President Obama announced that the Department of Energy’s Loan Programs Office issued guidance for
Distributed Energy Projects, making microgrids potentially eligible for DOE’s Loan Guarantees Program.
Due to the fees and costs associated with such guarantees, this program is typically cost effective for
projects of $25 M or more. The DOE would consider packaging projects together to create a cost-
effective critical mass. It is currently unclear the feasibility of such an approach, however the New York
Municipal Power Agency may be a potential vehicle for such consolidation. Additional research is
warranted in the next phase.
What are the categories and relative magnitudes of the capital and operating costs that will be incurred by the microgrid owner? Will they be fixed or variable?
The community microgrid will be subject to various charges depending on the class of service the
community microgrid qualifies for under ConEd’s PSC-10 Tariff.
ConEd SC-11 Charges
Such potential charges include Customer and Delivery Service Contract Demand Charges under SC-11.
Table 23 illustrated those charges based on SC group.

PON 3044 Final Report – Tarrytown
93
Table 23. ConEd SC-11 Contract Demand Charges
Contract Demand
Service Classification
Customer Charge
($/Month)
Delivery Service Contract Demand Charge ($/kW-month)
High Tension Service <138KV
Low Tension Service
Less Than
or Equal to
1500kW
SC-5 267.87 1.91 3.08
SC-8 323.61 6.72 7.17
SC-9 101.99 5.14 6.88
SC-12 147.74 5.15 5.56
Greater
Than
1500kW
SC-5 730.67 3.85 6.71
SC-8 1,255.85 6.41 6.80
SC-9 1,969.18 6.78 7.16
SC-12 821.68 5.48 5.59
SC-13 2,712.50 5.93 N/A
Greater
Than 138
KV Service
SC-5 639.52 1.43 N/A
SC-8 345.74 2.50 N/A
SC-9 606.31 2.71 N/A
SC-12 321.93 1.73 N/A
SC-13 2,241.79 2.29 N/A
In addition, interconnection related costs would apply for ConEd as described in ConEd’s SC-11 tariff.
Standby Service Charges
Depending on the final configuration of the community microgrid, it may or may not be subject to
Standby Service charges from ConEd. Customers who install DG and take Standby Service are subject to
ConEd’s Standby Service rates. Exceptions are made for DG installations that are eligible for Net
Metering, for generators that are used solely for emergency use or during Demand Response events, for
any residential or non-demand billed customers, for customers whose DG system supplies less than 15%
of the facility's peak demand, or for customers that install DG technologies that meet the Designated
Technologies criteria: (i) a DG system that exclusively uses a renewable fuel, (ii) fuel cell systems, or (iii)
small, efficient types of combined heat and power (CHP) that do not exceed 1 MW of capacity. It
therefore appears that the community microgrid may fall within the latter category and may not be
subject to these charges. As stated in the Standby Service Tariff:
“Customer With Designated Technologies” for purpose of this General Rule means a Customer
with a Contract Demand of 50 kW or greater whose on-site generation has a total nameplate
rating equal to more than 15 percent of the maximum potential demand from all sources
and:

PON 3044 Final Report – Tarrytown
94
a) exclusively uses fuel cells, wind, solar thermal, photovoltaics, sustainably-managed biomass, tidal, geothermal, and/or methane waste, and commences operation of its on-site generation facility between July 29, 2003 and May 31, 2019; or
b) uses Efficient CHP that does not exceed 1 MW of capacity in aggregate, and commences operation of its CHP generation facility between July 29, 2003 and May 31, 2019; or
c) uses Efficient CHP with an aggregated capacity greater than 1 MW, but no more than 15 MW, and commences operation of its CHP generation facility between May 31, 2015 and May 31, 2019; …
“Efficient CHP” for purposes of this General Rule means combined heat and power (“CHP”) generation
that meets eligibility criteria that were approved in the order of the New York State Public Service
Commission, dated January 23, 2004, in Case 02-E-0781.”1
Additional Charges
Depending on the ultimate configuration of the microgrid, additional capital and operating costs may
exist; primary components are outlined below.
Infrastructure upgrades to accommodate the microgrid;
O&M associated with infrastructure upgrades made to accommodate the microgrid;
AMI;
Master controller and communications infrastructure;
Natural gas system upgrades;
Natural Gas Cost
Permitting costs—need to consult experts regarding air permitting of new resources.
Profitability
Currently, it is expected that the community microgrid would likely be structured and operated as a
regional public project similar to the Tri-Party Agreement established in 2006 between the Village of
Tarrytown, Sleepy Hollow, and Briarcliff Manor for connecting to the Delaware Aqueduct. This regional
joint authority project will be structured to ensure that any financial obligations are met through public
guarantees of the three Villages. The special purpose entity created through this process would be the
customer receiving Full Service from ConEd.
Financing Structure
Microgrid development will be funded through feasibility by NYSERDA grants. Development and
construction will be funded through available grants, private equity (where possible) and bond issuance.
1 Consolidated Edison Company of New York, Inc., PSC NO: 10 – Electricity, GENERAL RULES, §20 Standby Service, §20.3 Customers Exempt from Standby Service Rates, §20.3.2 Customers With Designated Technologies.

PON 3044 Final Report – Tarrytown
95
An Engineering, Procurement, and Construction (EPC) contract will be used as a vehicle for performance
through the commercial operation date (COD). An operating contract will be executed to cover
operations and maintenance upon commercial in-service. Appropriate warranties will be obtained from
technology providers and cover each key component of the microgrid.
Sub Task 3.6 Legal Viability
Ownership Structure
Currently, it is expected that the community microgrid would likely be structured and operated as a
regional public project similar to the Tri-Party Agreement established in 2006 between the Village of
Tarrytown, Sleepy Hollow, and Briarcliff Manor for connecting to the Delaware Aqueduct. This regional
joint authority project will be structured to ensure that any financial obligations are met through public
guarantees of the three Villages. Potential Project team members may include bond counsel, private
equity advisors, DOE LGO, NYMPA, EPC Contractor, Consulting Engineer, Operator, Permitting
Consultant, Environmental Consultant, CNG, ConEd, ratepayers, Village Council, stakeholders, and
technology providers.
Currently, it is expected that the community microgrid would likely be structured and operated as a
regional public project similar to the Tri-Party Agreement established in 2006 between the Village of
Tarrytown, Sleepy Hollow, and Briarcliff Manor for connecting to the Delaware Aqueduct. This regional
joint authority project will be structured to ensure that any financial obligations are met through public
guarantees of the three Villages.
Certain potential sites are currently controlled by the Village. However additional rights-of-way and
sites may be required to fully accommodate the final microgrid configuration. Additional design
information that will be developed as part of the next phase is required to further identify these sites.
As currently structured, the project would be a customer of ConEd and all financial transactions,
including electricity purchases, would flow through ConEd. As clusters of buildings would be aggregated,
new ConEd meters would have to be placed at the point of common coupling to individually meter each
cluster.
The project is municipal in nature, and while the project may be replicable across the State in other
municipalities, there are no additional commercialization plans for any piece of this project.
The community microgrid project is located in a congested area of NYISO and therefore offers benefits
to the grid as reflected in the potential revenue streams presented herein. The municipal model
presents the best option to overcome potential regulatory barriers and existing loan guarantee
programs to overcome financing barriers.
Privacy
AMI infrastructure has the ability to protect customer privacy. Outcomes will be entirely dependent on
the technology chosen as well as the implementation and operation. It will be incumbent upon the

PON 3044 Final Report – Tarrytown
96
Village to ensure compliance with such requirements, though since the Village is the existing power
provider with an existing privacy protocol, continuing the protocol is expected to be straightforward.
Financial Strength
The Village of Tarrytown has a good financial record and low debt burden. The most recent rating
information for Tarrytown is a rating of AA2 from Moody’s in July of 2015 with a Stable Outlook.1
The Village of Sleepy Hollow has a good financial record and low debt burden. The most recent rating
information for Sleepy Hollow is a rating of AA from Standard and Poor’s in May of 2014 with a Stable
Outlook.2
Briarcliff Manor’s is AA+ from Standard and Poor’s as of April 14, 2015 with $7.9M issuance of Public
Improvement Refunding Serial Bonds.
1 The Village of Tarrytown’s issuance of $7.1M of Serial Bonds was rated AA2 by Moody’s according to the 2015 Official Statement.
2 The Village of Sleepy Hollow’s issuance of $3.325M of Serial Bonds was rated -AA by Standard and Poor’s according to the 2014 Official Statement.

PON 3044 Final Report – Tarrytown
97
Task 4: Cost Benefit Analysis
Benefit-Cost Analysis Summary Report - Site 25 – Village of Tarrytown
Project Overview
As part of NYSERDA’s NY Prize community microgrid competition, the Village of Tarrytown has proposed
development of a microgrid that would enhance the resiliency of electric service for five facilities in a
portion of Westchester County that otherwise lacks storm-related resiliency. The microgrid would serve
the following facilities:
The Tarrytown Village Hall, which includes administrative offices and a police station;
One volunteer fire department, the Riverside Hose Co.;
A large apartment building managed by the Tarrytown Municipal Housing Authority;
John Paulding School, a public school serving pre-kindergarten and kindergarten students; and
The Tarrytown Water Pump Station.
The microgrid would be powered by two new natural gas-fired combined heat and power (CHP)
generators (combined capacity: 450 kW), a new 500 kW natural gas generator, and four existing diesel
backup generators. The new CHP and natural gas generators would produce electricity for the grid
during periods of normal operation, while the existing backup generators would be used in islanded
mode solely during power outages. The system as designed would have sufficient generating capacity to
meet average demand for electricity from all included facilities during a major outage. The project’s
consultants also indicate that the system would be capable of providing frequency regulation and
reactive power support to the grid.
To assist with completion of the project’s NY Prize Stage 1 feasibility study, IEc conducted a screening-
level analysis of its potential costs and benefits. This report describes the results of that analysis, which
is based on the methodology outlined below.
Methodology and Assumptions
In discussing the economic viability of microgrids, a common understanding of the basic concepts of
benefit-cost analysis is essential. Chief among these are the following:
Costs represent the value of resources consumed (or benefits forgone) in the production of a good
or service.
Benefits are impacts that have value to a firm, a household, or society in general.
Net benefits are the difference between a project’s benefits and costs.

PON 3044 Final Report – Tarrytown
98
Both costs and benefits must be measured relative to a common baseline - for a microgrid, the “without
project” scenario - that describes the conditions that would prevail absent a project’s development. The
BCA considers only those costs and benefits that are incremental to the baseline.
This analysis relies on an Excel-based spreadsheet model developed for NYSERDA to analyze the costs
and benefits of developing microgrids in New York State. The model evaluates the economic viability of
a microgrid based on the user’s specification of project costs, the project’s design and operating
characteristics, and the facilities and services the project is designed to support. Of note, the model
analyzes a discrete operating scenario specified by the user; it does not identify an optimal project
design or operating strategy.
The BCA model is structured to analyze a project’s costs and benefits over a 20-year operating period.
The model applies conventional discounting techniques to calculate the present value of costs and
benefits, employing an annual discount rate that the user specifies – in this case, seven percent.1 It also
calculates an annualized estimate of costs and benefits based on the anticipated engineering lifespan of
the system’s equipment. Once a project’s cumulative benefits and costs have been adjusted to present
values, the model calculates both the project’s net benefits and the ratio of project benefits to project
costs. The model also calculates the project’s internal rate of return, which indicates the discount rate at
which the project’s costs and benefits would be equal. All monetized results are adjusted for inflation
and expressed in 2014 dollars.
With respect to public expenditures, the model’s purpose is to ensure that decisions to invest resources
in a particular project are cost-effective; i.e., that the benefits of the investment to society will exceed
its costs. Accordingly, the model examines impacts from the perspective of society as a whole and does
not identify the distribution of costs and benefits among individual stakeholders (e.g., customers,
utilities). When facing a choice among investments in multiple projects, the “societal cost test” guides
the decision toward the investment that produces the greatest net benefit.
The BCA considers costs and benefits for two scenarios:
Scenario 1: No major power outages over the assumed 20-year operating period (i.e., normal
operating conditions only).
1 The seven percent discount rate is consistent with the U.S. Office of Management and Budget’s current estimate of the opportunity cost of capital for private investments. One exception to the use of this rate is the calculation of environmental damages. Following the New York Public Service Commission’s (PSC) guidance for benefit-cost analysis, the model relies on temporal projections of the social cost of carbon (SCC), which were developed by the U.S. Environmental Protection Agency (EPA) using a three percent discount rate, to value CO2 emissions. As the PSC notes, “The SCC is distinguishable from other measures because it operates over a very long time frame, justifying use of a low discount rate specific to its long term effects.” The model also uses EPA’s temporal projections of social damage values for SO2, NOx, and PM2.5, and therefore also applies a three percent discount rate to the calculation of damages associated with each of those pollutants. [See: State of New York Public Service Commission. Case 14-M-0101, Proceeding on Motion of the Commission in Regard to Reforming the Energy Vision. Order Establishing the Benefit Cost Analysis Framework. January 21, 2016.]

PON 3044 Final Report – Tarrytown
99
Scenario 2: The average annual duration of major power outages required for project benefits to equal
costs, if benefits do not exceed costs under Scenario 1.1
Results
Table 24 summarizes the estimated net benefits, benefit-cost ratios, and internal rates of return for the
scenarios described above. The results indicate that even if there were no major power outages over the
20-year period analyzed (Scenario 1), the project’s benefits would exceed its costs by approximately 10
percent. As a result, the analysis does not evaluate Scenario 2. Consideration of Scenario 2 would
further increase the project’s already positive benefit-cost ratio.
The discussion that follows provides additional detail on these findings.
Table 24. BCA Results (Assuming 7 Percent Discount Rate)
Scenario 1
Figure 42 and table 25 present the detailed results of the Scenario 1 analysis.
1 The New York State Department of Public Service (DPS) requires utilities delivering electricity in New York State to collect and regularly submit information regarding electric service interruptions. The reporting system specifies 10 cause categories: major storms; tree contacts; overloads; operating errors; equipment failures; accidents; prearranged interruptions; customers equipment; lightning; and unknown (there are an additional seven cause codes used exclusively for Consolidated Edison’s underground network system). Reliability metrics can be calculated in two ways: including all outages, which indicates the actual experience of a utility’s customers; and excluding outages caused by major storms, which is more indicative of the frequency and duration of outages within the utility’s control. In estimating the reliability benefits of a microgrid, the BCA employs metrics that exclude outages caused by major storms. The BCA classifies outages caused by major storms or other events beyond a utility’s control as “major power outages,” and evaluates the benefits of avoiding such outages separately.
Economic Measure Assumed Average Duration Of Major Power Outages
Scenario 1: 0 Days/Year Scenario 2
Net Benefits - Present Value $2,420,000 Not Evaluated
Benefit-Cost Ratio 1.2 Not Evaluated
Internal Rate of Return 13.0% Not Evaluated
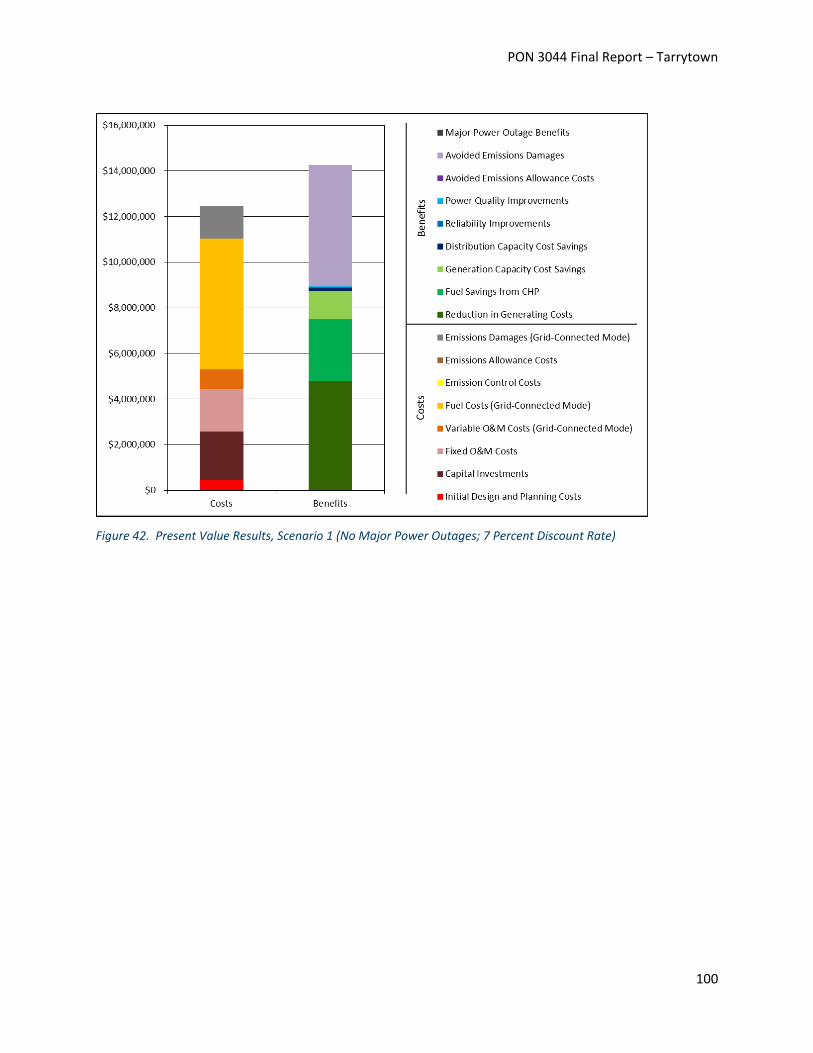
PON 3044 Final Report – Tarrytown
100
Figure 42. Present Value Results, Scenario 1 (No Major Power Outages; 7 Percent Discount Rate)

PON 3044 Final Report – Tarrytown
101
Table 25. Detailed BCA Results, Scenario 1 (No Major Power Outages; 7 Percent Discount Rate)
Cost or Benefit Category Present Value Over 20
Years (2014$) Annualized Value
(2014$)
Costs
Initial Design and Planning $448,000 $39,500
Capital Investments $2,130,000 $180,000
Fixed O&M $1,850,000 $163,000
Variable O&M (Grid-Connected Mode) $866,000 $76,400
Fuel (Grid-Connected Mode) $5,740,000 $506,000
Emission Control $0 $0
Emissions Allowances $0 $0
Emissions Damages (Grid-Connected Mode) $1,450,000 $94,400
Total Costs $12,500,000 Benefits
Reduction in Generating Costs $4,790,000 $422,000
Fuel Savings from CHP $2,720,000 $240,000
Generation Capacity Cost Savings $1,240,000 $110,000
Distribution Capacity Cost Savings $104,000 $9,130
Reliability Improvements $31,800 $2,810
Power Quality Improvements $45,400 $4,010
Avoided Emissions Allowance Costs $2,360 $208
Avoided Emissions Damages $5,310,000 $347,000
Major Power Outage Benefits $0 $0
Total Benefits $14,200,000
Net Benefits $1,770,000
Benefit/Cost Ratio 1.1
Internal Rate of Return 9.9%
Fixed Costs
The BCA relies on information provided by the project team to estimate the fixed costs of developing
the microgrid. The project team’s best estimate of initial design and planning costs is approximately
$448,000. The present value of the project’s capital costs is estimated at approximately $2.13 million,
including costs associated with the new CHP systems and natural gas generator; underground cables and
conduits; smart meters; and other system controls. The present value of the microgrid’s fixed operations
and maintenance (O&M) costs (i.e., O&M costs that do not vary with the amount of energy produced) is
estimated at approximately $1.85 million, or $163,000 annually.

PON 3044 Final Report – Tarrytown
102
Variable Costs
The most significant variable cost associated with the proposed project is the cost of natural gas to fuel
operation of the system’s new CHP and natural gas generators. To characterize these costs, the BCA
relies on estimates of fuel consumption provided by the project team and projections of fuel costs from
New York’s 2015 State Energy Plan (SEP), adjusted to reflect recent market prices.1 The present value of
the project’s fuel costs over a 20-year operating period is estimated to be approximately $5.74 million.
The BCA also considers the project team’s best estimate of the microgrid’s variable O&M costs (i.e.,
O&M costs that vary with the amount of energy produced). The present value of these costs is
estimated at approximately $866,000, or $11.00 per MWh.
In addition, the analysis of variable costs considers the environmental damages associated with
pollutant emissions from the distributed energy resources that serve the microgrid, based on the
operating scenario and emissions rates provided by the project team and the assumption that none of
the system’s generators would be subject to emissions allowance requirements. In this case, the
damages attributable to emissions from the microgrid’s natural gas generators are estimated at
approximately $94,400 annually. The majority of these damages are attributable to the emission of CO2.
Over a 20-year operating period, the present value of emissions damages is estimated at approximately
$1.45 million.2
Avoided Costs
The development and operation of a microgrid may avoid or reduce a number of costs that otherwise
would be incurred. These include generating cost savings resulting from a reduction in demand for
electricity from bulk energy suppliers. The BCA estimates the present value of these savings over a 20-
year operating period to be approximately $4.79 million; this estimate assumes the microgrid provides
base load power, consistent with the operating profile upon which the analysis is based. Additional
benefits would result from fuel savings due to the new CHP system; the BCA estimates the present value
of fuel savings over the 20-year operating period to be approximately $2.72 million. The reduction in
demand for electricity from bulk energy suppliers and for heating fuel would also avoid emissions of
CO2, SO2, NOx, and particulate matter, yielding emissions allowance cost savings with a present value of
approximately $2,360 and avoided emissions damages with a present value of approximately $5.31
million.3
1 The model adjusts the State Energy Plan’s natural gas and diesel price projections using fuel-specific multipliers calculated based on the average commercial natural gas price in New York State in October 2015 (the most recent month for which data were available) and the average West Texas Intermediate price of crude oil in 2015, as reported by the Energy Information Administration. The model applies the same price multiplier in each year of the analysis.
2 Because the project team is uncertain whether the microgrid would be subject to emissions allowance requirements, the BCA also considers the case in which allowances must be purchased. In this case, the present value of emissions allowance costs is estimated at less than $100 over the 20-year operating period, and the present value of emissions damages is estimated at approximately $1.43 million. The effect of this assumption is therefore minimal.
3 Following the New York Public Service Commission’s (PSC) guidance for benefit-cost analysis, the model values emissions of CO2 using the social cost of carbon (SCC) developed by the U.S. Environmental Protection Agency (EPA). [See: State of New York Public Service Commission. Case 14-M-0101, Proceeding on Motion of the Commission in Regard to Reforming the Energy Vision. Order Establishing the Benefit Cost

PON 3044 Final Report – Tarrytown
103
In addition to the savings noted above, development of a microgrid could yield cost savings by avoiding
or deferring the need to invest in expansion of the conventional grid’s energy generation or distribution
capacity.1 The project team estimates the capacity available for the provision of peak load support to be
approximately 950 kW per year, based on estimates of the new generators’ output during system peak.
Furthermore, the project team expects development of the microgrid to reduce the conventional grid’s
demand for generating capacity by an additional 138 kW each month (approximately 25 percent of the
microgrid’s peak demand) as a result of new demand response capabilities. Based on these figures, the
BCA estimates the present value of the project’s generating capacity benefits to be approximately $1.24
million over a 20-year operating period. The present value of the project’s potential distribution capacity
benefits – stemming from investments in underground distribution infrastructure and smart grid
controls – is estimated to be approximately $104,000.
The project team has indicated that the proposed microgrid would be designed to provide ancillary
services, in the form of frequency regulation and reactive power support, to the New York Independent
System Operator (NYISO). Whether NYISO would select the project to provide these services depends on
NYISO’s requirements and the ability of the project to provide support at a cost lower than that of
alternative sources. Based on discussions with NYISO, it is our understanding that the markets for
ancillary services are highly competitive, and that projects of this type would have a relatively small
chance of being selected to provide support to the grid. In light of this consideration, the analysis does
not attempt to quantify the potential benefits of providing these services.
Reliability Benefits
An additional benefit of the proposed microgrid would be to reduce customers’ susceptibility to power
outages by enabling a seamless transition from grid-connected mode to islanded mode. The analysis
estimates that development of a microgrid would yield reliability benefits of approximately $2,810 per
year, with a present value of $31,800 over a 20-year operating period. This estimate is developed using
the U.S. Department of Energy’s Interruption Cost Estimate (ICE) Calculator, and is based on the
following indicators of the likelihood and average duration of outages in the service area:2
System Average Interruption Frequency Index (SAIFI) – 0.11 events per year.
Customer Average Interruption Duration Index (CAIDI) – 181.2 minutes.3
The estimate takes into account the number of small and large commercial or industrial customers the
project would serve; the distribution of these customers by economic sector; average annual electricity
usage per customer, as provided by the project team; and the prevalence of backup generation among
these customers. It also takes into account the variable costs of operating existing backup generators,
Analysis Framework. January 21, 2016.] Because emissions of SO2 and NOx from bulk energy suppliers are capped and subject to emissions allowance requirements in New York, the model values these emissions based on projected allowance prices for each pollutant.
1 Impacts to transmission capacity are implicitly incorporated into the model’s estimates of avoided generation costs and generation capacity cost savings. As estimated by NYISO, generation costs and generating capacity costs vary by location to reflect costs imposed by location-specific transmission constraints.
2 www.icecalculator.com.
3 The analysis is based on DPS’s reported 2014 SAIFI and CAIDI values for Consolidated Edison.

PON 3044 Final Report – Tarrytown
104
both in the baseline and as an integrated component of a microgrid. Under baseline conditions, the
analysis assumes a 15 percent failure rate for backup generators.1 It assumes that establishment of a
microgrid would reduce the rate of failure to near zero.
It is important to note that the analysis of reliability benefits assumes that development of a microgrid
would insulate the facilities the project would serve from outages of the type captured in SAIFI and
CAIDI values. The distribution network within the microgrid is unlikely to be wholly invulnerable to such
interruptions in service. All else equal, this assumption will lead the BCA to overstate the reliability
benefits the project would provide.
Power Quality Benefits
The power quality benefits of a microgrid may include reductions in the frequency of voltage sags and
swells or reductions in the frequency of momentary outages (i.e., outages of less than five minutes,
which are not captured in the reliability indices described above). The analysis of power quality benefits
relies on the project team’s best estimate of the number of power quality events that development of
the microgrid would avoid each year. The Tarrytown team estimates that the facilities served by the
microgrid would avoid an average of approximately one such event annually. The model estimates the
present value of avoiding these events to be approximately $45,400 over a 20-year operating period.2 In
reality, some customers for whom power quality is important (e.g., the water pump station) may already
have systems in place to protect against voltage sags, swells, and momentary outages. If this is the case,
the BCA may overstate the power quality benefits the project would provide.
Summary
The analysis of Scenario 1 yields a benefit/cost ratio of 1.1; i.e., the estimate of project benefits is
approximately 10 percent greater than that of project costs. Accordingly, the analysis does not consider
the potential of the microgrid to mitigate the impact of major power outages in Scenario 2.
Consideration of such benefits would further increase the net benefits of the project’s development.
1 http://www.businessweek.com/articles/2012-12-04/how-to-keep-a-generator-running-when-you-lose-power#p1.
2 Importantly, the model relies on average costs per power quality event for customers across the United States, based on meta-analysis of data collected through 28 studies of electric utility customers between 1989 and 2005. These costs therefore incorporate assumptions about the distribution of customers across economic sectors and other key characteristics, such as the prevalence of backup generation and power conditioning, which may not reflect the characteristics of the proposed microgrid. This is likely to be the case for the Village of Tarrytown. Based on information provided by the site team, the proposed microgrid will not serve any customers in the construction, manufacturing, and financial/insurance/real estate sectors, which typically have the highest costs per power quality event. Instead, the proposed microgrid’s customers are more likely to fall into the public administration or services sectors, which typically have substantially lower costs of power quality events. [See: Sullivan, Michael J. et al. Estimated Value of Service Reliability for Electric Utility Customers in the United States. LBNL-2132E: June 2009.]

PON 3044 Final Report – Tarrytown
105
Disclaimer
The intent of this analysis report is to assess the technical, legal, and financial feasibility of community
microgrid and estimate energy savings and additional revenue generation associated with the
recommended upgrades to your facilities. Appropriate detail is included to help you make decisions
about building community microgrid. However, this report is not intended to serve as a detailed
engineering design document, as the improvement descriptions are diagrammatic in nature only, in
order to document the basis of cost estimates and savings and to demonstrate the feasibility of
constructing the improvements. Detailed design efforts may be required to fully understand the benefits
and challenges you may encounter and to implement several of the improvements evaluated as part of
this analysis.
While the recommendations in this report have been reviewed for technical accuracy, and we believe
they are reasonable and accurate, the findings are estimates and actual results may differ. As a result,
Willdan Energy Solutions is not liable if projected, estimated savings or economies are not actually
achieved. All savings and cost estimates in the report are for informational purposes and are not to be
construed as design documents or guarantees.
In no event will Willdan Energy Solutions be liable for the failure of the customer to achieve a specified
amount of savings, for the operation of customer’s facilities, or for any incidental or consequential
damages of any kind in connection with this report or the installation of the recommended measures.

PON 3044 Final Report – Tarrytown
106
Acknowledgement
This project is financially supported by the New York State Energy Research and Development Authority.
On behalf of the members of this project, Willdan would like to thank Jim Hastings, NYSERDA Project
Manager, for making this work possible. Willdan would also like to thank the Village of Tarrytown
project sponsors and staff as well as the Consolidated Edison staff that supported this project. The cost
benefit analysis portion of the project was completed by Industrial Economics Inc. The many tasks of this
work could not have been completed without the dedicated effort of Katie Zilka, Project Manager,
Patrick Burgess, Technical Project Manager, Dr. Wei Tian, Lead Engineer, Lisa Vedder, Financial and
Regulatory Lead, and Jim Quinn, Community Support.
Mehdi Ganji, PhD
Vice President, Willdan Energy Solutions
New York, NY 10013

PON 3044 Final Report – Tarrytown
107
Appendix
Tarrytown
NY Prize Benefit-Cost Analysis: Microgrid Questionnaire
This questionnaire solicits information on the community microgrid you are proposing for the NY Prize
competition. The information in this questionnaire will be used to develop a preliminary benefit-cost
analysis of the proposed microgrid. Please provide as much detail as possible. The questionnaire is
organized into the following sections:
A. Project Overview, Energy Production, and Fuel Use
B. Capacity Impacts
C. Project Costs
D. Environmental Impacts
E. Ancillary Services
F. Power Quality and Reliability
G. Other Information
If you have any questions regarding the information requested, please contact Industrial Economics,
Incorporated, either by email ([email protected]) or phone (929-445-7641).
Microgrid site: 25. Village of Tarrytown
Point of contact for this questionnaire:
Name: Kathryn Zilka
Address: 88 Pine Street, 18th Floor, New York, NY 10005
Telephone: 646-640-6571
Email: [email protected]
A. Project Overview, Energy Production, and Fuel Use
1. The table below is designed to gather background information on the facilities your
microgrid would serve. It includes two examples: one for Main Street Apartments, a
residential facility with multiple utility customers; and another for Main Street Grocery, a

PON 3044 Final Report – Tarrytown
108
commercial facility. Please follow these examples in providing the information specified
for each facility. Additional guidance is provided below.
Facility name: Please enter the name of each facility the microgrid would serve.
Note that a single facility may include multiple customers (e.g., individually-
metered apartments within a multi-family apartment building). When this is the
case, you do not need to list each customer individually; simply identify the
facility as a whole (see Table 1, “Main Street Apartments,” for an example).
Rate class: Select the appropriate rate class for the facility from the dropdown
list. Rate class options are residential, small commercial/industrial (defined as a
facility using less than 50 MWh of electricity per year), or large
commercial/industrial (defined as a facility using 50 or more MWh of electricity
per year).
Facility/customer description: Provide a brief description of the facility,
including the number of individual customers at the facility if it includes more
than one (e.g., individually-metered apartments within a multi-family apartment
building). For commercial and industrial facilities, please describe the type of
commercial/industrial activity conducted at the facility.
Economic sector: Select the appropriate economic sector for the facility from
the dropdown list.
Average annual usage: Specify the average annual electricity usage (in MWh)
per customer. Note that in the case of facilities with multiple, similar customers,
such as multi-family apartment buildings, this value will be different from
average annual usage for the facility as a whole.
Peak demand: Specify the peak electricity demand (in MW) per customer.
Note that in the case of facilities with multiple, similar customers, such as multi-
family apartment buildings, this value will be different from peak demand for the
facility as a whole.
Percent of average usage the microgrid could support in the event of a
major power outage: Specify the percent of each facility’s typical usage that
the microgrid would be designed to support in the event of a major power outage
(i.e., an outage lasting at least 24 hours that necessitates that the microgrid
operate in islanded mode). In many cases, this will be 100%. In some cases,
however, the microgrid may be designed to provide only enough energy to
support critical services (e.g., elevators but not lighting). In these cases, the
value you report should be less than 100%.
Hours of electricity supply required per day in the event of a major
power outage: Please indicate the number of hours per day that service to each
facility would be maintained by the microgrid in the event of a major outage.
Note that this value may be less than 24 hours for some facilities; for example,
some commercial facilities may only require electricity during business hours.
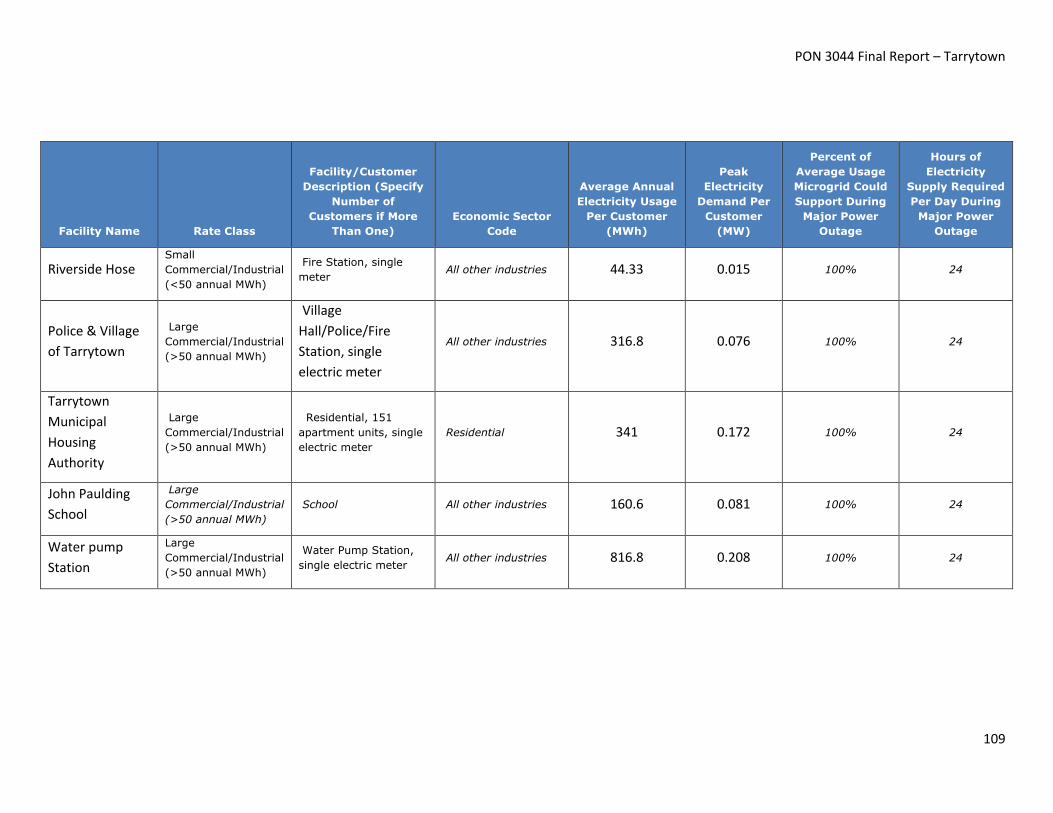
PON 3044 Final Report – Tarrytown
109
Facility Name Rate Class
Facility/Customer
Description (Specify
Number of
Customers if More
Than One)
Economic Sector
Code
Average Annual
Electricity Usage
Per Customer
(MWh)
Peak
Electricity
Demand Per
Customer
(MW)
Percent of
Average Usage
Microgrid Could
Support During
Major Power
Outage
Hours of
Electricity
Supply Required
Per Day During
Major Power
Outage
Riverside Hose Small
Commercial/Industrial
(<50 annual MWh)
Fire Station, single
meter All other industries 44.33 0.015 100% 24
Police & Village
of Tarrytown
Large
Commercial/Industrial
(>50 annual MWh)
Village
Hall/Police/Fire
Station, single
electric meter
All other industries 316.8 0.076 100% 24
Tarrytown
Municipal
Housing
Authority
Large
Commercial/Industrial
(>50 annual MWh)
Residential, 151
apartment units, single
electric meter
Residential 341 0.172 100% 24
John Paulding
School
Large
Commercial/Industrial
(>50 annual MWh)
School All other industries 160.6 0.081 100% 24
Water pump
Station
Large
Commercial/Industrial
(>50 annual MWh)
Water Pump Station,
single electric meter All other industries 816.8 0.208 100% 24

PON 3044 Final Report – Tarrytown
110
2. In the table below, please provide information on the distributed energy resources
the microgrid will incorporate. Use the two examples included in the table as a guide.
Distributed energy resource name: Please identify each distributed energy
resource with a brief description. In the event that a single facility has multiple
distributed energy resources of the same type (e.g., two diesel generators),
please use numbers to uniquely identify each (e.g., “Diesel generator 1” and
“Diesel generator 2”).
Facility name: Please specify the facility at which each distributed energy
resource is or would be based.
Energy source: Select the fuel/energy source used by each distributed energy
resource from the dropdown list. If you select “other,” please type in the energy
source used.
Nameplate capacity: Specify the total nameplate capacity (in MW) of each
distributed energy resource included in the microgrid.
Average annual production: Please estimate the amount of electricity (in
MWh) that each distributed energy resource is likely to produce each year, on
average, under normal operating conditions. The benefit-cost analysis will
separately estimate production in islanded mode in the event of an extended
power outage. If the distributed energy resource will operate only in the
event of an outage, please enter zero.
Average daily production in the event of a major power outage: Please
estimate the amount of electricity (in MWh per day) that each distributed energy
resource is likely to produce, on average, in the event of a major power
outage. In developing your estimate for each distributed energy resource, you
should consider the electricity requirements of the facilities the microgrid would
serve, as specified in your response to Question 1.
Fuel consumption per MWh: For each distributed energy resource, please
estimate the amount of fuel required to generate one MWh of energy. This
question does not apply to renewable energy resources, such as wind and solar.

PON 3044 Final Report – Tarrytown
111
Distributed
Energy
Resource
Name Facility Name
Energy
Source
Namepla
te
Capacity
(MW)
Average Annual
Production
Under Normal
Conditions
(MWh)
Average Daily
Production
During Major
Power Outage
(MWh)
Fuel Consumption per MWh
Quantity 1,2,3 Unit
CHP(Proposed) Tarrytown Cluster 1 Natural Gas 0.15 1,096.9 3.6 10.66 MMBtu/MWh
CHP(Proposed) Crossover Cluster 1 Natural Gas 0.3 2,193.8 7.2 10.66 MMBtu/MWh
Gas fired
Generator(Propo
sed)
Crossover Cluster 2 Natural Gas 0.5
3,656.4
12.00 10.66 MMBtu/MWh
Back-up Generator
(Existing) Phoenix Hose Natural Gas 0.08 0 1.92 10.66 MMBtu/MWh
Back-up Generator
(Existing) Riverside Hose Diesel 0.055 0 1.32 10.66 MMBtu/MWh
Back-up Generator
(Existing)
Police & Village of
Tarrytown Diesel 0.175 0 4.2 10.66 MMBtu/MWh
Back-up Generator
(Existing)
Tarrytown
Municipal Housing
Authority
Diesel 0.125 0 3 10.66 MMBtu/MWh
Back-up Generator Water pump Station Diesel 0.03 0 0.72 10.66 MMBtu/MWh
1 Source for Diesel Consumption: Cummins specifications and sizing chart www.cumminspower.com and http://www.dieselserviceandsupply.com/Diesel_Fuel_Consumption.aspx
2 Source for Natural Gas Consumption: http://www.dieselserviceandsupply.com/Natural_Gas_Fuel_Consumption.aspx.
3 Source for CHP Natural Gas Consumption: http://www.epa.gov/sites/production/files/2015-07/documents/fuel_and_carbon_dioxide_emissions_savings_calculation_methodology_for_combined_heat_and_power_systems.pdf

PON 3044 Final Report – Tarrytown
112
Distributed
Energy
Resource
Name Facility Name
Energy
Source
Namepla
te
Capacity
(MW)
Average Annual
Production
Under Normal
Conditions
(MWh)
Average Daily
Production
During Major
Power Outage
(MWh)
Fuel Consumption per MWh
Quantity 1,2,3 Unit
(Existing)

PON 3044 Final Report – Tarrytown
113
B. Capacity Impacts
3. Is development of the microgrid expected to reduce the need for bulk energy
suppliers to expand generating capacity, either by directly providing peak load
support or by enabling the microgrid’s customers to participate in a demand
response program?
☐ No – proceed to Question 6
☒ Yes, both by providing peak load support and by enabling participation in a
demand response program – proceed to Question 4
☐ Yes, by providing peak load support only – proceed to Question 4
☐ Yes, by enabling participation in a demand response program only – proceed to
Question 5
Provision of Peak Load Support
4. Please provide the following information for all distributed energy resources that
would be available to provide peak load support:
Available capacity: Please indicate the capacity of each distributed energy
resource that would be available to provide peak load support (in MW/year).
Current provision of peak load support, if any: Please indicate whether the
distributed energy resource currently provides peak load support.
Please use the same distributed energy resource and facility names from Question 2.
Distributed Energy Resource
Name Facility Name
Available
Capacity
(MW/year)
Does distributed
energy resource
currently provide
peak load support?
CHP Tarrytown Cluster 1 0.15 ☐ Yes
CHP Crossover Cluster 1 0.3 ☐ Yes
Gas fired Generator Crossover Cluster 2 0.5 ☐ Yes
If development of the microgrid is also expected to enable the microgrid’s customers to
participate in a demand response program, please proceed to Question 5. Otherwise, please
proceed to Question 6.
Participation in a Demand Response Program
5. Please provide the following information for each facility that is likely to participate in
a demand response program following development of the microgrid:
Available capacity: Please estimate the capacity that would be available to
participate in a demand response program (in MW/year) following development
of the microgrid.

PON 3044 Final Report – Tarrytown
114
Capacity currently participating in a demand response program, if any:
Please indicate the capacity (in MW/year), if any, that currently participates in a
demand response program.
Facility Name
Capacity Participating in Demand Response Program
(MW/year)
Following Development
of Microgrid Currently
Phoenix Hose 0.0057 0
Riverside Hose 0.003675 0
Police & Village of Tarrytown 0.019 0
Tarrytown Municipal Housing Authority 0.043 0
John Paulding School 0.0202 0
Washington Irving Intermediate School 0.046 0
Water pump Station 0.052 0
Tarrytown Station Center 0.005 0
6. Is development of the microgrid expected to enable utilities to avoid or defer
expansion of their transmission or distribution networks?
☒ Yes – proceed to Question 7
☐ No – proceed to Section C
7. Please estimate the impact of the microgrid on utilities’ transmission capacity
requirements. The following question will ask about the impact on distribution
capacity.
Impact of Microgrid on Utility
Transmission Capacity Unit
1.2 MW/year

PON 3044 Final Report – Tarrytown
115
Please estimate the impact of the microgrid on utilities’ distribution capacity requirements.
Impact of Microgrid on Utility
Distribution Capacity Unit
0.25MW MW/year
C. Project Costs
We are interested in developing a year-by-year profile of project costs over a 20-year operating period.
The following questions ask for information on specific categories of costs.
Capital Costs
8. In the table below, please estimate the fully installed cost and lifespan of all
equipment associated with the microgrid, including equipment or infrastructure
associated with power generation (including combined heat and power systems),
energy storage, energy distribution, and interconnection with the local utility.
Capital Component
Installed
Cost ($)
Component
Lifespan
(round to
nearest
year) Description of Component
CHP-150kW 395,400 20 CHP – Tarrytown Cluster 1, TT Cluster 1
CHP -300kW 790,800 20 CHP - Tarrytown Crossover Cluster 1
Gas fired Generator-
500kW 185,500 20
Gas fired Generator - Tarrytown Crossover Cluster
2
Back-up Generator-80kW 29,680 20 Exsiting Back-up Generator - Phoenix Hose
Back-up Generator-55kW 20,405 20 Exisiting Back-up Generator – Riverside Hose
Back-up Generator-
175kW 64,925 20
Existing Back-up Generator - Police & Village of
Tarrytown
Back-up Generator-
125kW 46,375 20
Existing Back-up Generator – Tarrytown Municipal
Existing Housing Authority
Back-up Generator-30kW 11,130 20 Existing Back-up Generator - Water pump Station
S&C Switch 18,500 20 Tarrytown Cluster 1, S&C PMH-9 Pad-Mounted Gear
150kVA Transformer 14,000 20 Tarrytown Cluster 1, Pole 19
225kVA Transformer 16,000 20 Tarrytown Cluster 1, Pole 3
1500kVA Transformer 43,000 20 Tarrytown Cluster 1, Pole 4

PON 3044 Final Report – Tarrytown
116
Capital Component
Installed
Cost ($)
Component
Lifespan
(round to
nearest
year) Description of Component
150kVA Transformer 14,000 20 Tarrytown Cluster 1, CP3
150kVA Transformer 14,000 20 Tarrytown Cluster 1, CP6
AutomatiC Transfer
Switch 18,000 20 Tarrytown Cluster 1, POLE 16
Underground Cable 1 162,000 40 Tarrytown Cluster 1 - Cabling
Buiilding Controller 3,000 20 $1000/each, TT Cluster 1
1500kVA Transformer 43,000 20 Crossover Cluster 1
S&C Switch 18,500 20 Crossover Cluster 1, S&C PMH-9 Pad-Mounted Gear
Automatci Transfer
Switch 18,000 20 Crossover Cluster 1, POLE 1
Building Controller 2,000 20 $1000/each, Crossover cluster 1
Underground Cable
and Conduit 1 220,000 40 Crossover Cluster 1 - Cable and Conduit
S&C Switch 18,500 20 Crossover Cluster 2
Pole (+Riser) 11,000 20 Crossover Cluster 2
Building Controller 3,000 20 $1000/each, Crossover Cluster 2
Smart Meters 8,000 15 Smart Meters for All Buildings
Wireless Access Point 2,500 15 System Access Point for Meters and Ebridges
E Bridge/Repeater 1,750 15 System E Bridge/Repeater to Build out Network
Automatic Generation
Controllers 7,524 20 System Automatic Generation Controllers
SCADA Software
100,000 25 System SCADA Software

PON 3044 Final Report – Tarrytown
117
Initial Planning and Design Costs
9. Please estimate initial planning and design costs. These costs should include costs
associated with project design, building and development permits, efforts to secure
financing, marketing the project, and negotiating contracts. Include only upfront
costs. Do not include costs associated with operation of the microgrid.
Initial Planning and Design
Costs ($)
What cost components are
included in this figure?
447,907.63 Design, Audit, Permit, Project
management and Finacing
Fixed O&M Costs
10. Fixed O&M costs are costs associated with operating and maintaining the microgrid
that are unlikely to vary with the amount of energy the system produces each year
(e.g., software licenses, technical support). Will there be any year-to-year variation
in these costs for other reasons (e.g., due to maintenance cycles)?
☒ No – proceed to Question 12
☐ Yes – proceed to Question 13
11. Please estimate any costs associated with operating and maintaining the microgrid
that are unlikely to vary with the amount of energy the system produces each year.
Fixed O&M Costs ($/year)
What cost components are included
in this figure?
162,875.5 Salaries, maintenance, indirect admin,
etc.
Please proceed to Question 14.
12. For each year over an assumed 20-year operating life, please estimate any costs
associated with operating and maintaining the microgrid that are unlikely to vary
with the amount of energy the system produces.
Year Fixed O&M Cost ($)
What cost components are
included in this figure?
Variable O&M Costs (Excluding Fuel Costs)
13. Please estimate any costs associated with operating and maintaining the microgrid
(excluding fuel costs) that are likely to vary with the amount of energy the system
produces each year. Please estimate these costs per unit of energy produced (e.g.,
$/MWh).

PON 3044 Final Report – Tarrytown
118
Variable O&M Costs ($/Unit of
Energy Produced) Unit
What cost components are
included in this figure?
$15 for Backup disel generators
$/MWh
Purchase power, demand charge,
and related utilities, lubricants,
consumable materials and supplies
$11
For CHP and natural gas fired
generators
$/MWh
Purchase power, demand charge,
and related utilities, lubricants,
consumable materials and supplies
Fuel Costs
14. In the table below, please provide information on the fuel use for each distributed
energy resource the microgrid will incorporate. Please use the same distributed
energy resource and facility names from Question 2.
Duration of design event: For each distributed energy resource, please indicate
the maximum period of time in days that the distributed energy resource would
be able to operate in islanded mode without replenishing its fuel supply (i.e., the
duration of the maximum power outage event for which the system is designed).
For renewable energy resources, your answer may be “indefinitely.”
Fuel consumption: For each distributed energy resource that requires fuel,
please specify the quantity of fuel the resource would consume if operated in
islanded mode for the assumed duration of the design event.
Distributed
Energy
Resource
Name Facility Name
Duration of
Design Event
(Days)
Quantity of Fuel
Needed to Operate in
Islanded Mode for
Duration of Design
Event Unit
CHP-150kW Tarrytown Cluster 1 7 263,437.28 Cubic feet
CHP -300kW Crossover Cluster 1 7 526,874.56 Cubic feet
Gas fired
Generator-
500kW Crossover Cluster 2 7
878,124.26 Cubic feet
Back-up
Generator-
80kW Phoenix Hose 7
140,499.88 Cubic feet
Back-up
Generator-
55kW Riverside Hose 7
708.82 Gallons
Back-up
Generator-
175kW
Police & Village of
Tarrytown 7
2,255.33 Gallons

PON 3044 Final Report – Tarrytown
119
Back-up
Generator-
125kW
Tarrytown Municipal
Housing Authority 7
1,610.95 Gallons
Back-up
Generator-
30kW
Water pump Station 7 386.63
Gallons
15. Will the project include development of a combined heat and power (CHP) system?
☒ Yes – proceed to Question 17
☐ No – proceed to Question 18
16. If the microgrid will include development of a CHP system, please indicate the type
of fuel that will be offset by use of the new CHP system and the annual energy
savings (relative to the current heating system) that the new system is expected to
provide.
Type of Fuel Offset by New
CHP System
Annual Energy Savings Relative
to Current Heating System Unit
No. 4 Fuel Oil 18,830.9 MMBtu
Emissions Control Costs
17. We anticipate that the costs of installing and operating emissions control equipment
will be incorporated into the capital and O&M cost estimates you provided in
response to the questions above. If this is not the case, please estimate these costs,
noting what cost components are included in these estimates. For capital costs,
please also estimate the engineering lifespan of each component.
Cost Category Costs ($)
Description of
Component(s)
Component
Lifespan(s) (round to
nearest year)
Capital Costs ($)
Annual O&M Costs
($/MWh)
Other Annual Costs
($/Year)
18. Will environmental regulations mandate the purchase of emissions allowances for the
microgrid (for example, due to system size thresholds)?
☐ Yes
☒ No

PON 3044 Final Report – Tarrytown
120
D. Environmental Impacts
19. For each pollutant listed below, what is the estimated emissions rate (e.g.,
tons/MWh) for the microgrid?
Emissions Type Emissions per MWh Unit
CO2 0.199609885 Short tons/MWh
SO2 1.70607E-06 Short tons/MWh
NOx 1.27955E-05 Short tons/MWh
PM 1.27119E-05 Short tons/MWh
E. Ancillary Services
20. Will the microgrid be designed to provide any of the following ancillary services? If
so, we may contact you for additional information.
Ancillary Service Yes No
Frequency or Real Power Support ☒ ☐
Voltage or Reactive Power Support ☒ ☐
Black Start or System Restoration Support ☐ ☒
F. Power Quality and Reliability
21. Will the microgrid improve power quality for the facilities it serves?
☒ Yes – proceed to Question 23
☐ No – proceed to Question 24
22. If the microgrid will result in power quality improvements, how many power quality
events (e.g., voltage sags, swells, momentary outages) will the microgrid avoid each
year, on average? Please also indicate which facilities will experience these
improvements.
Number of Power Quality Events
Avoided Each Year
Which facilities will experience
these improvements?
0.99
Riverside Hose
Police & Village of Tarrytown
Tarrytown Municipal Housing Authority
John Paulding School
Tarrytown Water pump Station

PON 3044 Final Report – Tarrytown
121
23. The benefit-cost analysis model will characterize the potential reliability benefits of a
microgrid based, in part, on standard estimates of the frequency and duration of
power outages for the local utility. In the table below, please estimate your local
utility’s average outage frequency per customer (system average interruption
frequency index, or SAIFI, in events per customer per year) and average outage
duration per customer (customer average interruption duration index, or CAIDI, in
hours per event per customer).
For reference, the values cited in the Department of Public Service’s 2014 Electric
Reliability Performance Report are provided on the following page. If your project
would be located in an area served by one of the utilities listed, please use the
values given for that utility. If your project would be located in an area served by a
utility that is not listed, please provide your best estimate of SAIFI and CAIDI values
for the utility that serves your area. In developing your estimate, please exclude
outages caused by major storms (a major storm is defined as any storm which
causes service interruptions of at least 10 percent of customers in an operating area,
and/or interruptions with duration of 24 hours or more). This will ensure that your
estimates are consistent with those provided for the utilities listed on the following
page.1
Estimated SAIFI Estimated CAIDI
0.11 3.09
SAIFI and CAIDI Values for 2014, as reported by DPS
Utility
SAIFI
(events per year per
customer)
CAIDI
(hours per event per
customer)
Central Hudson Gas & Electric 1.62 3.74
ConEdison 0.11 3.09
PSEG Long Island 0.76 1.42
National Grid 1.17 2.87
New York State Electric & Gas 1.34 2.97
1 The DPS service interruption reporting system specifies 10 cause categories: major storms; tree contacts;
overloads; operating errors; equipment failures; accidents; prearranged interruptions; customers equipment;
lightning; and unknown (there are an additional seven cause codes used exclusively for Con Edison’s underground
network system). SAIFI and CAIDI can be calculated in two ways: including all outages, which indicates the actual
experience of a utility’s customers; and excluding outages caused by major storms, which is more indicative of
the frequency and duration of outages within the utility’s contro. The BCA model treats the benefits of averting
lengthy outages caused by major storms as a separate category; therefore, the analysis of reliability benefits
focuses on the effect of a microgrid on SAIFI and CAIDI values that exclude outages caused by major storms.

PON 3044 Final Report – Tarrytown
122
Orange & Rockland 1.19 2.4
Rochester Gas & Electric 0.85 2.32
Statewide 0.68 2.7
Source: New York State Department of Public Service, Electric Distribution Systems Office of Electric,
Gas, and Water. June 2015. 2014 Electric Reliability Performance Report, accessed at:
http://www3.dps.ny.gov/W/PSCWeb.nsf/All/D82A200687D96D3985257687006F39CA?OpenDocument.
G. Other Information
24. If you would like to include any other information on the proposed microgrid, please
provide it here.
Click here to enter text.

PON 3044 Final Report – Tarrytown
123
Tarrytown
NY Prize Benefit-Cost Analysis: Facility Questionnaire
This questionnaire requests information needed to estimate the impact that a microgrid might have in
protecting the facilities it serves from the effects of a major power outage (i.e., an outage lasting at least
24 hours). The information in this questionnaire will be used to develop a preliminary benefit-cost
analysis of the community microgrid you are proposing for the NY Prize competition. Please provide as
much detail as possible.
For each facility that will be served by the microgrid, we are interested in information on:
I. Current backup generation capabilities.
II. The costs that would be incurred to maintain service during a power outage, both when
operating on its backup power system (if any) and when backup power is down or not available.
III. The types of services the facility provides.
If you have any questions regarding the information requested, please contact Industrial Economics,
Incorporated, either by email ([email protected]) or phone (929-445-7641).
Microgrid site: 25. Village of Tarrytown
Point of contact for this questionnaire:
Name: Kathryn Zilka
Address: 88 Pine Street, 18th Floor, New York, NY 10005
Telephone: 646-640-6571
Email: [email protected]
I. Backup Generation Capabilities
1. Do any of the facilities that would be served by the microgrid currently have backup
generation capabilities?
a. ☐ No - proceed to Question 4
b. ☒ Yes - proceed to Question 2

PON 3044 Final Report – Tarrytown
124
2. For each facility that is equipped with a backup generator, please complete the table
below, following the example provided. Please include the following information:
a. Facility name: For example, “Main Street Apartments.”
b. Identity of backup generator: For example, “Unit 1.”
c. Energy source: Select the fuel/energy source used by each backup generator
from the dropdown list. If you select “other,” please type in the energy source
used.
d. Nameplate capacity: Specify the nameplate capacity (in MW) of each backup
generator.
e. Standard operating capacity: Specify the percentage of nameplate capacity at
which the backup generator is likely to operate during an extended power
outage.
f. Average electricity production per day in the event of a major power
outage: Estimate the average daily electricity production (MWh per day) for the
generator in the event of a major power outage. In developing the estimate,
please consider the unit’s capacity, the daily demand at the facility it serves, and
the hours of service the facility requires.
g. Fuel consumption per day: Estimate the amount of fuel required per day (e.g.,
MMBtu per day) to generate the amount of electricity specified above. This
question does not apply to renewable energy resources, such as wind and solar.
h. One-time operating costs: Please identify any one-time costs (e.g., labor or
contract service costs) associated with connecting and starting the backup
generator.
i. Ongoing operating costs: Estimate the costs ($/day) (e.g., maintenance costs)
associated with operating the backup generator, excluding fuel costs.
Note that backup generators may also serve as distributed energy resources in the microgrid.
Therefore, there may be some overlap between the information provided in the table below
and the information provided for the distributed energy resource table (Question 2) in the
general Microgrid Data Collection Questionnaire.

PON 3044 Final Report – Tarrytown
125
Facilit
y N
am
e
Gen
erato
r I
D
En
erg
y S
ou
rce
Nam
ep
late
Cap
acit
y
(M
W)
Sta
nd
ard
Op
erati
ng
Cap
acit
y (
%)
Avg
. D
ail
y P
ro
du
cti
on
Du
rin
g P
ow
er O
uta
ge
(M
Wh
/D
ay)
Fuel Consumption
per Day
On
e-T
ime O
perati
ng
Costs
($
)
On
go
ing
Op
erati
ng
Costs
($
/D
ay)
Qu
an
tity
Un
it
Fire Department Unit 1 Natural Gas 0.1 100 2.4 25089.3 CF/day $300 $0
Riverside Hose Unit 1 Diesel 0.055 100 1.32 101.3 Gal/day $300 $0
Police & Village of
Tarrytown Unit 1 Diesel 0.175 100 4.2 322.2 Gal/day $300 $0
Tarrytown
Municipal Housing
Authority
Unit 1 Diesel 0.125 100 3 230.1 Gal/day $300 $0
Water pump
Station Unit 1 Diesel 0.03 100 0.72 55.2 Gal/day $300 $0
II. Costs of Emergency Measures Necessary to Maintain Service
We understand that facilities may have to take emergency measures during a power outage in order to
maintain operations, preserve property, and/or protect the health and safety of workers, residents, or
the general public. These measures may impose extraordinary costs, including both one-time
expenditures (e.g., the cost of evacuating and relocating residents) and ongoing costs (e.g., the daily
expense of renting a portable generator). The questions below address these costs. We begin by
requesting information on the costs facilities would be likely to incur when operating on backup power.
We then request information on the costs facilities would be likely to incur when backup power is not
available.

PON 3044 Final Report – Tarrytown
126
A. Cost of Maintaining Service while Operating on Backup Power
3. Please provide information in the table below for each facility the microgrid would
serve which is currently equipped with some form of backup power (e.g., an
emergency generator). For each facility, please describe the costs of any emergency
measures that would be necessary in the event of a widespread power outage (i.e., a
total loss of power in the area surrounding the facility lasting at least 24 hours). In
completing the table, please assume that the facility’s backup power system is fully
operational. In your response, please describe and estimate the costs for:
a. One-time emergency measures (total costs)
b. Ongoing emergency measures (costs per day)
Note that these measures do not include the costs associated with running the facility’s existing
backup power system, as estimated in the previous question.
In addition, for each emergency measure, please provide additional information related to when
the measure would be required. For example, measures undertaken for heating purposes may
only be required during winter months. As another example, some commercial facilities may
undertake emergency measures during the work week only.
As a guide, see the examples the table provides.
Facility Name
Type of Measure
(One-Time or
Ongoing) Description Costs Units
When would these
measures be
required?
Tarrytown Municipal
Housing Authority One-Time Measures
Evacuating and
moving residents $1500 $
Only necessary
during winter months
(October through
March) because
existing backup
generator is not able
to provide sufficient
heating
Tarrytown Municipal
Housing Authority Ongoing Measures
Housing residents at
alternative facilities $5000 $/day
Only necessary during
winter months
(October through
March) because
existing backup
generator is not able
to provide sufficient
heating

PON 3044 Final Report – Tarrytown
127
B. Cost of Maintaining Service while Backup Power is Not Available
4. Please provide information in the table below for each facility the microgrid would
serve. For each facility, please describe the costs of any emergency measures that
would be necessary in the event of a widespread power outage (i.e., a total loss of
power in the area surrounding the facility lasting at least 24 hours). In completing
the table, please assume that service from any backup generators currently on-site
is not available. In your response, please describe and estimate the costs for:
a. One-time emergency measures (total costs)
b. Ongoing emergency measures (costs per day)
In addition, for each emergency measure, please provide additional information related to when
the measure would be required. For example, measures undertaken for heating purposes may
only be required during winter months. As another example, some commercial facilities may
undertake emergency measures during the work week only.
As a guide, see the examples the table provides.
Facility Name
Type of Measure
(One-Time or
Ongoing) Description Costs Units
When would these
measures be
required?
Fire Department Ongoing Measures Renting additional
portable generator 0 $/day Year-round
Riverside Hose Ongoing Measures Renting additional
portable generator 0 $/day Year-round
Police & Village of
Tarrytown Ongoing Measures
Renting additional
portable generator 0 $/day
Year-round
Tarrytown
Municipal
Housing Authority
Ongoing Measures Renting additional
portable generator
940
$/day
Year-round
John Paulding
School Ongoing Measures
Renting additional
portable generator 1616 $/day
Year-round
Water pump
Station Ongoing Measures
Renting additional
portable generator 3560 $/day
Year-round
III. Services Provided
We are interested in the types of services provided by the facilities the microgrid would serve, as well as
the potential impact of a major power outage on these services. As specified below, the information of
interest includes some general information on all facilities, as well as more detailed information on

PON 3044 Final Report – Tarrytown
128
residential facilities and critical service providers (i.e., facilities that provide fire, police, hospital, water,
wastewater treatment, or emergency medical services (EMS)).
A. Questions for: All Facilities
5. During a power outage, is each facility able to provide the same level of service when
using backup generation as under normal operations? If not, please estimate the
percent loss in the services for each facility (e.g., 20% loss in services provided
during outage while on backup power). As a guide, see the example the table
provides.
Facility Name
Percent Loss in Services When Using
Backup Gen.
Fire Department 0%
Riverside Hose 0%
Police & Village of Tarrytown 0%
Tarrytown Municipal Housing Authority 0%
John Paulding School 22.8%
Tarrytown Water pump Station 4.6%
6. During a power outage, if backup generation is not available, is each facility able to
provide the same level of service as under normal operations? If not, please estimate
the percent loss in the services for each facility (e.g., 40% loss in services provided
during outage when backup power is not available). As a guide, see the example the
table provides.
Facility Name
Percent Loss in Services When Backup
Gen. is Not Available
Fire Department 100%
Phoenix Hose 100%
Riverside Hose 19.9%
Police & Village of Tarrytown 43%
Tarrytown Municipal Housing Authority
43%
John Paulding School 22.8%
Washington Irving Intermediate 100%
Tarrytown Water pump Station 19.9%

PON 3044 Final Report – Tarrytown
129
B. Questions for facilities that provide: Fire Services
7. What is the total population served by the facility?
8. Please estimate the percent increase in average response time for this facility during
a power outage:
9. What is the distance (in miles) to the nearest backup fire station or alternative fire
service provider?
C. Questions for facilities that provide: Emergency Medical Services (EMS)
10. What is the total population served by the facility?
11. Is the area served by the facility primarily (check one):
☐ Urban
☒ Suburban
☐ Rural
☐ Wilderness
12. Please estimate the percent increase in average response time for this facility during
a power outage:
13. What is the distance (in miles) to the next nearest alternative EMS provider?
11,000
Customer said because of backup generation no change
1.7 miles
11,000
Click here to enter text.
3.7 miles

PON 3044 Final Report – Tarrytown
130
D. Questions for facilities that provide: Hospital Services
14. What is the total population served by the facility?
15. What is the distance (in miles) to the nearest alternative hospital?
16. What is the population served by the nearest alternative hospital?
E. Questions for facilities that provide: Police Services
17. What is the total population served by the facility?
18. Is the facility located in a (check one):
☒ Metropolitan Statistical Area
☐ Non-Metropolitan City
☐ Non-Metropolitan County
19. Please estimate:
a. The number of police officers working at the station under normal operations.
b. The number of police officers working at the station during a power outage.
c. The percent reduction in service effectiveness during an outage.
N/A
Click here to enter text.
Click here to enter text.
11,000
13 in the day, 5 in the evening
Increased by 2-3 officers
10%

PON 3044 Final Report – Tarrytown
131
F. Questions for facilities that provide: Wastewater Services
20. What is the total population served by the facility?
21. Does the facility support (check one):
☐ Residential customers
☐ Businesses
☐ Both
G. Questions for facilities that provide: Water Services
22. What is the total population served by the facility?
23. Does the facility support (check one):
☐ Residential customers
☐ Businesses
☒ Both
H. Questions for: Residential Facilities
24. What types of housing does the facility provide (e.g., group housing, apartments,
nursing homes, assisted living facilities, etc.)?
25. Please estimate the number of residents that would be left without power during a
complete loss of power (i.e., when backup generators fail or are otherwise not
available).
N/A
Municipal Housing Authority
Unsure of number – roughly 80-100 units
14,000