24-hour food consumption intake ages 1-74 tape number …24-hour food consumption intake ages 1-74...
TRANSCRIPT
24-Hour Food Consumption intake Ages 1-74 Tape Number 4704 National Health and Nutrition Examination Survey, 1971-75
--.
U.S. DEPARTMENT OF HEALTH AND HUMAN SERVICES l Pub!ic Health Service l National Center for Health Statistics
Public Use Data TapeDocumentation24-Hour Food Consumption IntakeAges 1-74Tape Number 4704
National Health and Nutrition Examination Survev, 1971-75
U.S. DEPARTMENT OF HEALTH AND HUMAN SERVICES
Publlc Health .%rwce
Na~ional Center for Health Statistics
Hyattwille, Maryland
November 1985
The data compilation and documentation necessary to conform the 24-Hour
Food Consumption Intake Tape to the specifications of the Health and
Nutrition Examination Survey Data Tape Release program were done by
Margaret Carroll, Connie Dresser, Dale Hitchcock, Everette Collins,
Evelyn Stanton, and Rita Weinberger of the Division of Health Examination
Statistics, National Center for Health Statistics. A special note of
gratitude is due Eugene Sides who patiently typed and retyped this
material.
-,

CONTENTS
HANES 1971-1975
Description of Survey .......................................... 1
Target Population .............................................. 1
Data Collection .,... ........................................... 2
Use of HANES Data..... ............................................. 4
Errors in the Data Sets and Survey Differences ..................... 5
Variance Estimation. ............................................... 6
Tape Characteristics. .............................................. 7
General Notes
Demographic Information ........................................ 8
Dietary Information .............”.. ............................ 8
Tape Description Summary
Demographic Data ...............................................10
24-Hour Food Consumption Intake Data ...........................13
Tape Description
Demographic Data ...............................................14
24-Hour Food Consumption Intake Data ...........................31
Detailed Notes .....................................................36

24-HOUR FOOD CONSUMPTION INTAKE TAPE
Health and Nutrition Examination Survey, HANES I, 1971-1975
Description of Survey:
and operation of HANES
A detailed description of the design, content
I is provided in the following reports: Plan
and Operation of the Health and Nutrition Examination Survey, DHW
Pub. No. (HSM) 73-1310, Series 1, Nos. 10a and 10b, Public Health
Service, Washington, D. C., U. S. Government Printing Office, February
1973. Also provided is a draft report on the augmentation survey of
adults describing the relevant field work conducted between July 1974
and October 1975.
Target Population: HANES I was conducted on a nationwide probability
sample of approximately 52,000 persons, ages 1-74 years, from the
civilian, noninstitutionalized population of the coterminous United
States, excepting those persons residing on Indian reservations. The
survey started in April 1971 and for many survey components was completed
in June 1974. The I-L4NESI sample
groups thought to be at high risk
was selected so that certain population
of malnutrition (persons with low
incomes, preschool children, women of childbearing age and the elderly)
were oversampled at known rates. Adjusted sampling weights were then
computed within 60 age, sex and race categories in order to inflate
the sample in such a manner as to closely reflect
population, ages 1-74 years, of the United States
survey.
the noninstitutionalized
at the midpoint of the
-1-

Although the main emphasis of I-LANESI was on nutrition, a subset of
those sample persons aged 25-74 received a more detailed health
examination which was continued through October 1975. No particular
oversampling of subgroups of the population was done in this subsample
(e.g., women of childbearing age were not oversampled as they were
for the major nutrition component of HANES I). This subsample is also
representative of the United States population aged 25-74 during the
time of HANES I.
After the nutrition survey was completed, the detailed examination
given to the 25-74 age group was continued until the total number of
examined persons was approximately double the number of examinees who
received the detailed examination during the nutrition survey.
Data Collection: Information for all examined sample persons in lUINES I
was obtained by means of a household interview, a general medical
history, a 24–hour dietary intake recall interview, a food frequency
interview, a food program questionnaire, a general medical examination,
dental, dermatological and ophthalmological examinations, anthropometric
measurement, hand-wrist x-rays (of those ages 1-17 only) and 24
hematological, blood chemistry, and urological laboratory determinations.
In addition to the information received on all examined persons by
means of the above questionnaires, procedures and measurements, the
following data were gathered on the Subsample of adults aged 25-74:
a medical history supplement; supplementary questionnaires concerning
arthritis, respiratory and cardiovascular conditions (when applicable);
-2-

a health care needs questionnaire; a general well-being questionnaire;
an extended medical examination; x-rays of the chest and hip and knee
joints; audiometry, electrocardiography; goniometry; spirometry;
pulmonary diffusion and tuberculin tests; along with additional
laboratory determinations.
-3-

Use of HANES Data
With the goal of mutual benefit, NCHS requests the cooperation of
recipients of data tapes in certain actions related to their use:
A. Any published material derived from the data should
acknowledge the National Center for Health Statistics as
the original source. It should also include a disclaimer
which credits any analyses, interpretations,or conclusions
reached to the author (recipient of the tape) and not to
NCHS, which is responsible only for the initial data.
B. Consumers who wish to publish a technical description
of the data will make a reasonable effort to insure that
the description is not inconsistent with that published
by NCHS. This does not mean, however, that NCHS will
review such descriptions.
-4-

Errors in the Data Sets and Survey Differences
The data users’ tapes have been subjected to a great deal of careful
editing. However, due to the large volume of data in the series,
it is likely that a small number of errors or discrepancies remain
undetected. We would appreciate if any such errors are detected
that they be brought to our attention so that new corrected copies
of the tape can be created and errata sheets issued to previous
purchasers.
Some of the continuous data items have extremely high or low values
and we have verified that they do in fact appear that way on the
hard documents; that is, we have verified that the values have not
been incorrectly keyed.
In general, we have not attempted to resolve any differences that may
exist between estimates derived from the various subsamples of HANES I.
Nor have we made any comparisons between estimates from HANES I and
previous surveys conducted by the Division of Health Examination
Statistics.
-5-

Variance Estimation
Because the Health and Nutrition Examination Survey is based upon a complex
sample design, the assumptions of many statistical tests and routinely
available statistical programs are not met. For this reason, when estimates
of the variances of statistics from HANES are computed, the technique of
estimation must be based upon complex sampling theory. In order to provide
the user with the capability of estimating the complex sample variances, we
have provided Strata and Primary Sampling Unit (PSU) codes on the HANES
user tapes in tape positions 194-198. However, these codes are suitable
for making variance estimates only for examination locations 1-65 and 1-1OCI.
To compute variance estimates for examination locations 1-35 or 66-100, it
is necessary to recode the current Strata-PSU codes according to the
specifications that follow, The resultant recoded Strata-PSU codes should
be used only for locations 1-35 and 66-100,
One computer program that should be widely available sometime around the
summer of 1978 as part of the Statistical Analysis System (available from
the SAS Institute, Inc., Post Office Box 10066, Raleigh, North Carolina
27605) is capable of using the Strata-PSU codes provided for HANES to
compute complex sample variances. Other programs may also be available.
In those Strata, referred to as certainty or self-representing Strata,
the PSU codes are actually the segment numbers. Neither the Strata codes
nor the PSU codes are the original codes used in the formation of the HANE:S
sample design, but are none-the-less a unique recoding of the original
codes. For further discussion of the sample design of HJWES, the user
should consult the publications of the National Center for Health !5tatistics--
Seri.es1-Nos. 10a and 14 and the detailed n~te for tape positions 158-193.
-6-

Recode Specifications for Strata-PSU Codes
First.--Create a file with only those records in the file for examination-locations 1-35.*
Second.--Retain the original Strata-PSU codes in Strata 7-10 and 13 inthe original form as the recoded Strata-PSU codes.
Third.--Recode the remaining strata according to the chart below..—
Fourth.--Repeat the process for examination locations 66-100.’
Old Strata #[tape positions 194-195) New Strata # New PSU #
01020306040511121421151617201s19222523
2426
2728~g
303531323334
0101030304041111141415151717181822
22232326262828303031313333
001002001oo~
001002001002001(Jo~
001002001(-J(-J~
001o(-j~
001oo~
001002001002001002001oo~
001002001002
*See detailed note for tape positions 158-193.
-6a-

TAPE CHARACTERISTICS
Title: 24-Hour Food Consumption Intake Tape
Catalog Number: 4704
Data Set Name: HEHA.NESI.DU470404
Record Length: 405
Blocksize: 81OO
Number of Records: 371,889
Number of Reels: 2 or 4 (depending on tape density)
Recording Mode: Fixed Block, EBCDIC
Channel: 9 Track
Created by: Di~risionof Health Examination StatisticsNational Center for Health StatisticsHyattsville, Maryland
(Revised--September i980)
-7-

General Notes
Demographic Information: An advance letter, announcing the
forthcoming arrival of an interviewer from the U. S.
Bureau of the Census, was mailed to each household that
fell into the sample area. The interviewer subsequently
visited the household to ascertain its composition and to
administer a questionnaire, the primary purpose of which
was to obtain demographic information. The questionnaire
was administered to each potential sample person that was
available and competent enough to respond to questions.
In the event that a potential sample person was not at
home at the time of interview, any responsible adult in
the household was asked to respond to the questions for
the absent person.
Dietary Information: Data on the 24–Hour Food Consumption
Intake Tape were obtained by the 24–hour recall method by
which each of the 20,749 sample persons ages 1–74 years was
asked to report each food he had consumed on the day before
the examination (midnight to midnight) . This method accounted
for all regular meals eaten as well as between–meal foods or
snacks . It included foods eaten on Monday through Friday,
but generally excluded foods eaten on weekends.
The 24–Hour Food Consumption Intake Tape contains a separate
record for each food item consumed by each examined person
(Revised--May 1980)
-8-

together with the amounts of calories and fourteen selected
nutrients contributed by each food. The nutrients are
protein, fat, total carbohydrate, fiber carbohydrate,
calcium, phosphorus, iron, sodium, potassium, vitamin A,
thiamine, riboflavin, niacin and vitamin C. Also contained
on the tape are the ingestion period, the approximate time
of day the food was consumed, and the food source.
Beginning with version 03 of the 24-Hour Food Consumption
Intake Tape, all records now include a quantitative value
(in grams) for the amount of each food item ingested by the
sample person, and values for the amounts of saturated
fatty acid, oleic acid, linoleic acid, and dietary cholesterol.
contributed by each food item.
(Revised--May 1980)
-8a-

SPECIAL NOTE
Since there is a separate data record for each food item consumed by
each examined person, the total number of records found on the micro-
data tape is 371,889. However, there are only 20,749 different examined
persons, each with a possible 50 data records, one for each food item
consumed.
The demographic information is found in tape positions 1–200 on every data
record for each examined person. However, the tape description on pages
14-30 (demographic information) shows only the counts for the total number
of examined persons rather than the total number of data records.
-9-

. .
. . DEMOGRAPHIC DATA SUMMARY - HANES I
TapePositiclns—
Sample sequence number ................................................. 1
Size of place .......................................................... 10SMSA-not SMSA ..................-.................................● ..... 11
Type of living quarters ................................................ 12Land usage .......-............-...........● ............................ 13
If ruTal, asked - How many acres of land are included ..............-... 14If 10 acres or more asked - Sale of crops, etc. amount to $50 or more .. 15If 10 acres or less asked - Sale of crops, etc. amount to $250 or more . 16Age - head of household -....................,..........................●
17
Sex - head of household .......-...● ...● ..0. ● .........● .......9...0e...● 19
..Higliest grade attended -“head of household ............................. 20Race - head of household ...................● ..............-............. 22
Total number of persons in household.-
................................... 23
Total sample persons in household ...............................*. ..... 25Number of rooms in house ........................-...................... 27
Is there piped water .................................................... 28If yes, is there hot and cold piped water .......................● *..... 29
If yes to piped water - !)oes house have = sink ~lth piped water ........ 30Does house have a rafige or cook stove .................*.........=...... 31
Ikeshcuse have arefrigsrator .......................................... 32
Are kitchen facilities used by anyone not living in household .......● .. 33
Total family income group ...........................-.-......m....● .... 34 _
NOTE: The following income questions were asked only if “Total FamilyIncome” was less than $7,000
During Past Year Lid you or &y Members of Your Family Receive Money From:.
Wages or salaries .........-............................................ 36Tf yes - How much altogether before deductions ......................... 37
Social Security or F.ailroad Retirement ......0................*.....● ... 41
If yes - HOW m~ch altogether -.-..................................-● .... 42
Welfare payments or other public assistance ............................ 46
If yes - How much altogether ........................................... 47
Unemployment or Workman’s CompensationIf yes -
................................. 51
How much altogether ....0...........● ,......................... 52
Government employee pensions or private pensions ....................... 56
If yes - How nuch altogether .........● .............#............“...... 57
-1o- “
“1

TapePositions
Dividends, interest or rent ..................0. ........................ 61
If yes - How much altogether ........-.................................. 62
Net income from own non-farm business, professional practice orpartnership ........................................................... 66
If yes -.How much altogether ........................................... 67Net income from a farm ................................................. 21’”
If yes - How much altogether ........................................... 72Veteran’s payments ....00....● ● ......-...............- ● ● .............m#. ‘6
If yes - How miich altogether ........-........● ...*..................... 77
Alimony, child support or contributions from persons not living in
household .-..............-.........-.......................-........- 81
If yes - How much altogether ...Y....................................... 82
Any other income:..............................-...● .....● .........● ● .● .. 86
If yes - How much altogether .......................................● .... 87
Total amount ........................................................... 91Familv unit code .............● .......................................... 95 -
Relationship to head of household .....................................
Age at intervielJ .............................................m........Race of examined person ...............................................Sex of examined person ........-..............-.............-....-.....Marital status .................................’.......................Date of birth (month and year) ......-......... ● ...............*.......
Place of birth ...........-............................................Highest grade of regular school ever attended .........................Did he finish the grade ...........................................0...IS he attending school now “...#........................................Has he ever attended a school of any kind .............................
If yes - What kind of school ..........................................Is any lang~age other than English frequently spoken in the household .If yes - Whatlanguage . .......... .....................................What is your main ancestry or national origin .........................What was he doing most of past three months ...........................
If “something else” - What was he doing ...............................
If “keeping hous~’ or “something else” - Did he work at a job orbusiness at any time during the past three months ....................If “working” - Did he work full-time or part-time .....................Did he mmrk at any time last week or the week before (not around house)If no - Even though he did not work during that time, does he have
. .a Job or business ...................................................
100
101103104105106
110112114 -115116
117118119120122
123
124125126
127
1
.
-11-
.

TapePositions—
Was he looking for wmrk or on lay-off froma job .......................If yes - h~ich .,......................................:...............Class of I.mrker ...................................................,...If seif-er,ployed in “own” business and not a farm, is the business
incorporated ...........................*............● ...............Business or i~dustry code ..........................4..................
Occupation code ..............................#............● ...........Date of examination .............................❑ ......................Age at examinati~n ....................................................Farm/non- farm .............. ...........................................
Poverty index .........................................................Region ;;........................................................”O.......
FOOD PROGRAMS APE’LICABILITY ...........................................
Are youAre youWhat isAre youAre You
certified to participate in the food stamp program? ...........buying f~od stamps now? .......................................the main r,eason you aren’t participating in the program? ......certified to participate in the commodity- distribution program?receiving commodity foods now f~r your family? ................
Why arenlt you participating in the program? ~..........................
SIMPLE WEIGHTS ........................................................
STRATA - Primary Sampling Unit (PSU) .... “..............................
123129
130
13113?
13513s144146
147150
151
152153154155156i57
158
194 -
I
\
.,
-12-

24–HOUR FOOD CONSUMPTION INTAKE DATA SUMMARY – HAJXZS I
TapePositions
CATALOG NUMBER -4704... .....................................
Respondent ...................................................Day of recall ................................................Ingestion period .............................................Food code ....................................................Time of day ..................................................
~.qinenutier. .................................................Yood source ..................................................Interviewer code.. ...........................................Completion code.... ..........................................Food group ...................................................
NUTRIENTS
Calories .....................................................Protein (grams) ..............................................Fat (grams) ..................................................Total carbohydrates (grams) ..................................Fiber carbohydrates ..........................................
Calcium .................................................Phosphorus (mg) ..............................................Iron (mg) ....................................................Sodium (mg) ..................................................Potassium ...............................................
Vitamin A (1.U.) .............................................Thiamine (mg) ................................................Riboflavin (mg) ..............................................Niacin (mg) (Niacin from food sources) .......................Vitamin C (mg) ...............................................Amount of Food Consumed in Grams .............................Saturated Fatty Acid in Grams ................................Oleic Acid in Grams ..........................................Linoleic Acid in Grams .......................................Dietary Cholesterol (mg) .....................................
201
225226227228233
237239240243244
246254262270278
286294302310318
326334342350358366374382390398
-13-

.terr
//.—.—
1
KI
9
,,
rapeLOC.-—-——----
1-5
6-9
10
11
12
13
14
No. of
?osit ion:———
,5
4.
1
1
1
1
1
!“
HEhLTH AND NUTRITION EXAMINATION SURVEY (WINES 1):
DEMOGRAPHIC DATA TAPE(n=20749)
—
ITEM DESCRIPTION & CODES.— ___
DEMOGRAPHICDATA
SamDle Seauence Number.
Catalog Number
4271
Size of Place1- Urbanized area with 3,000,000 or more2 - Urbanized area with 1,000,000 to 2,999,9993- Urbanized area with 250,000 to 999,999 ‘4 - Urbanized area under 250,0005 – Urban place 25,000 or moke outside urbanized area6- Urban place 10,000 to 24,999 outside urbanized area
7- Urban place 2,500 to 9,999 outside urbanized area
8- Rural
SMSA - Not SMSA1 - In SM#A, in central city2 - In SMSA; not in central city4 -mNot in SMSA
Type of Living Quarters
1 - Housing Unit ,2 - Other unit
Land Usage1 - All other2- Rural “
If Rural,’ askedHow Many Acrgs of Land Are Included?1- 10 or more acres2- Less thari10 acres
9- Not applicable
●
.
.
~
Gontrol
counts
20749
/.
3368242325142534
364103011597357
722154~13
8108
20563186
13613
7136
19325204
-l-)Cl-lLJUIJ
LOCATIC]NS 1-65
. -.,
HANES I DataSource-—______ _ _ __ ____—— ———______
Household QuestionnaireSee Detailed Notes
Household QuestionnaireSee Detailed Notes
.
Household
Household
Household
Questionnaire
Questionnaire
Questionnaire

HE’ALTHAND NUTRITION EXAMINATION SURVEY (MINES 1);
‘apeLot,.—.—.—----.
L5
16
17-18
19
20-21
No. of‘nsitions.—-—
1
.
1
.2
1
2
lTEN t!ESCF.liTIOX& CODES—— ——.
[f 10 acres or more, a;ked if
sale of Crops, Etc. Amount to $50 or more?
If 10 acres o_rless, asked if ‘Sale of Crops, Etc. Amount to $250 or more?3 - Yes5-No
9 – Not applicable
Age - Head of Household ‘16-!!2 as given
00 Blank, but applicableSex - Head of Household
1 - MaleFemale2-,m
HiFhest Grade Attended - Head of Household10 -.None
21 -22 -23 -24 -25 -26 -27 -28 -31 -32 -33 -34 -41 -42 -43 -
44 -45 -88 -
1st grade2nd grade
3rd grade .4th grade5th grade6th grade7th grade8th grade9th grade10th gradellth grade12t.hgradeFirst year of collegeSecond year of college
Third year of collegeFourth year of collegeGraduateBlank, but applicable
,
.
—
controlC@ults
—
“ 1160772
18817
,.
1315073
15545
207445
16660
4089
22382
190379427421
681702
24051121145811336153746
1081485
13171084661.
, ..
HANES I DataSource-— -.— .— --— —--..———
Household Questionnail-c
Household Questionnait-c
Household Questionnaire
Household Questionnaire’:
Household Ouestionnairc’

rapeLot..—.—.— ..--.
22
23-24
25-26
27
28
29
30
31
—.
No. of
Position:.—— —
1
!2
2
1
,..,,“
1
1
1
1
,<
IN!ALTH AND NUTRITION EXAMINATION SURVEY (HANES 1);
ITEM DESCF.IPTICIN& CODES.—— _
Race - Head of Household1 - White2 - Negro
*● -
3 - Other
Total Numbe”r of’Persons’ in Household01-19 - As given
Totai “Sample Persons in Household01-07 - As given
Number of Rooms in House .1-8 - As given
9- 9 or more “
Is there piped water?1“- Yes2 -No-
.,If yes “IS there hot and cold piped,water?1 - Yes2 “- No
9 - Not applicable
If yes to piped water - “Does House Have a Sink with Piped Water? “
1 - Yes ‘2 - No3 - Not applicable
lees House Have a Range or Cook Stove?1 - Yes ‘V~ -No “
,.
.
.
.
.
.
——
ControlCou!lts
—I
16387“ 4149
213
20?49
20749
197471002
20043706
19527518704
19866181702
20513236
. -.i. .
HANES I DataSource——-—— — .-- ----——————
Household Questionnaire
See Detailed Notes
,.,
Household
Household
Household
Household
Household
Household
Questionnaire
Questionnaire
Questionnaire’
Questionnaire
Questionnaire “
Questionnaire
Household Questionnaire
i.,
-\,..—,. ..-, .4 .

HEALTH AND NUTRITION I?XAI’lINATIONSURVEY (HANES I);
Iten
J/_.—.-
I
1-+I
s
r’!.
TapeLot.——.—.. = .
32
33
34-35
36
No. ofPosition..— —
1
1.
2
,..,“
1
ITEM DESCRIPTION L CODES—— —,
Does House have a Refrigerator?
1 - Yes
2 - No . *
Are kitchen facilities used by anyone not livinp in household?1 -Yes t
2 - No
9- Not applicable,,
Total Family Income Group11 - Under $1,000 (including loss)12 - $1,000-1,999
13 - $2,000-2,999
14 - $3,000-3,99915 - $4,000-4,999
16 - $5,000-5,999
17 - $6;000-6,999
18 - $7,000-9,999 ,
19 - $10,000-14,99920- $15,000-19,99921 -,$20,000-24,999 ‘
22 - $25,000 and over
88 - Blank, but applicable .
NOTE: The following income-questions were asked only if “Total FamilyIncomet’was less than $7,000. u
DURING PAST YEAR DID YOU OR ANY MEMBERS OF YOUR,FAMILY RECEIVE MONEY
FROM: ‘
Wages or Salaries?
1 - Yes
2- No o ‘“
8 - Blank, bit applicable .9 - Not applicable
.
Contro,
counts——_
20487v 262
64119$18
690
509124814131389128211471030465541751830741612718
47383384614
12013
. .... .
HANES I Data
Source-—..———— —— ~-=-~
Household Questionnaire
Household Questionnaire
Household Questionnaire
See Detailed Notes
,,
Household Questionnaire
ib.

,,
.!
FapeJ.oc,.-.—.—. ___.
7-40
41
2-45
46
17-50
.51
.’
No. of‘osition:———
4
i
4
.,
.“
1
4
1
HEALTH AND NUTRITION EXAMINATION SURVEY (HANEs I)\
ITEM I?ESCRIPTIO!i& CODES—— ._
If yes to above, how much altogether before deductions?
tiOO1-8f3C10 - As given8888 - Blank, @t applicable -.
9999 - Not applicable
Social Security,or Railroad Retirement?1 - Yes
2 - No8 – B1’ank,but applicable
9- Not applicable
If yes to above, how much altogether?
0001-6999 - AS given
8888 - Blank, but applicable
9999 - Not applicable
Welfare.Paym ents or Other Public Assistance?
1 - Yes,
2 - No “:8- Blankj but applicable
9- -Not applicable
If yes to above, how much altogether?
0001–6999 - AS given .8888 - Blank, but applicable
9999 - Not applicable
Unemplo yment or Workmen’s Compensation?
I - Yes “2-No8- Blank’,but applicable
9- Not applicable.
.
.
,
—
Control
counts—.
4468884
15397
29145226595
12014
2852657
17240
24145716605
12014
2383636
17730
4417690604
12014
,,
. -,,.,
HANES I Data
Source-—.—— —.- - ----— —. ____
Household Questionnaire
..,
Household Questionnaire
Household Questionnaire
Household Questionnaire
Household Questionnaire
Household Questionnaire
i.,
,,
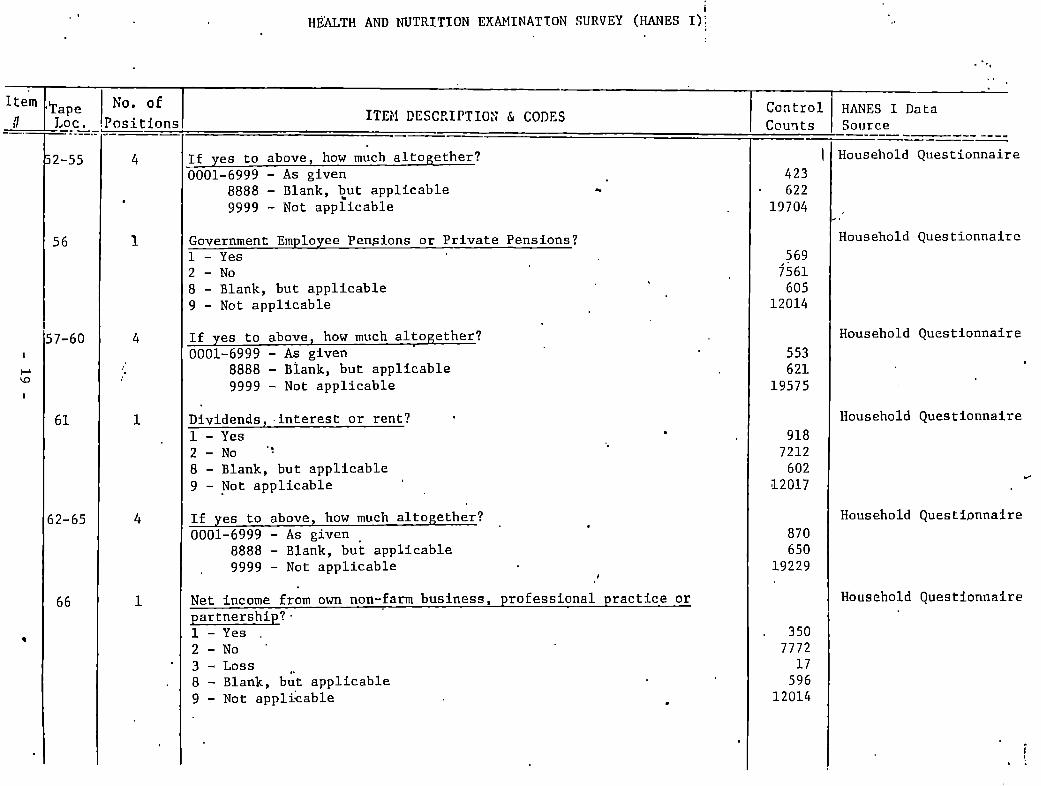
TapeLoc .-—. ——. .__,
12-55
56
;7-60
61
;2-65
66
No. of‘ositinn$-.-——
4
.
1
4
,.,,.“
1
4
1
HEALTH AND NUTRITION EXAMINATION SURVEY (HANES 1); ,,
. ....,
lTEN DESCRIPTIO?i & CODES.— ——
If yes to above, how much altogether?
0001-6999 - As given
8888 - Blank, @t applicable *
9999 - Not applicable
Government Employee Pensions or Private Pensions?1 - Yes2 - No8 - Blank, but applicable
9- Not applicable
If yes to above, how much altogether?
0001-6999 - As ~iven8888 - Biaik, but applicable
9999 - Not applicable
Dividends, interest or rent? ‘
1 - Yes .
2 - No “:8 - Blank, but applicable
9- ~ot applicable
If yes to above, how much altogether?0001-6999 - As given
.
8888 - Blank, bu~ applicable
9999 - Not applicableI
Net income from own non-farm business, professional practice orpartnership? ~
1 - Yes2 -No “
3 - Loss
8- Blank, but applicable
9- Not applicable .
.
Control
Cou!lts
m
423622
19704
569?561605
12014
553621
19575
9187212602
12017
870650
19229
350777217596
12014
HANES I DataSource.—.—-— .—--- ----———..—— —
Household Questionnaire
.
Household Questionnaire
Household Questionnaire
.
Household Questionnaire
Household Questimnaire
Household Questionnaire
i,.

Item
/)——,—
I!N0I
9
.!
‘apeLot.-—.—.—----..
7-70
71
2-75
76
77-80
81
No. of
‘ositions-—===
4
“1
4,.
1.
4
1
HEALTH AND NUTRITION EXAMINATION SURVEY (WINES 1);
. -.,
—
ITEM DESCRIPTION & CODHControl
Cou!lts————
If yesto above, how much altogether?DOCM3-7500- As given
8888 - Blank, but applicable
9999 - Not applicable
Net income from.a farm?’1-
2-3-8-9-
Yes
No
LOSSBlank, but applicableNot applicable
If yes to above, how much al’to~ether?
000C-7500 - As given
8888 - Blank, but applicable
9999 - Not applicable.
●
Veteran’s Payments
1 - Yes .2-No .
8 –.Blank, but applicable o9 - Not applicable
If yes to above, how.much altogether?0001-6999 - As given .
8888 – Blank, but applicable
9999 - Not applicable. . . .
Alimony, child support or contributions from persons not llv~ng m
household?
1 - Yes
2 - No8- Blank, i~t applicable
9- Not applicable
.
.——
I316647
19786
406
170526598
12014
388642
19719
‘4527679601
12017
441612
19696
4397691602
12017
. .
HANES I DataSource——.—-— ——— ~-L--Household Questionnaire’
.,
Household Questionnaire
Household Questionnaire
Household Questionnaire
Household Questionnaire
Household Questionnaire
.I
. .
-.—...-,.

Item
(7.—,—
INIJ
I
a
,,
l’apeLoc ,-—. ——.. --.
12-85
86
17-90
31-94
95-99
100
101-2
140. of?ositions-—=!=
4
i
4
,,,,“
4
5
1
2
1
HEALTH AND NUTRITION EXAMINATION SURVEY (lMNES 1);
ITEN DESCF.IPTIOI;& COI)ES ‘\
.—. _
~
0001-6999 - As given
8888 - Blank, hut applicable -.
9999 - Not applicable
Any other income? ‘1 - Yes2 - No8- ‘Blank,but applicable
9- Not applicable
If yes to above, how much altogether?0001-6999 - As given
8888 - Blank, but applicable
9999 - Not applicable
Total Amount (Total of Positions “37-90)
=0-6999 - As given
8888 ‘L Blank, but applicable
9999m- Not applicable
FAMiLY UNIT CODE00001-23180
Relationship to Head “of Household
l.- Head (1 person living alone or with non-relatives)
.
2- Head (2 or more related persons in family)
3 - Wife o4 - Child ‘
5- Other relative
Age at Interview01-74 - As given
..
,
.
.
Control
Cou!lts
I426615
19708
3257799
60712018
313619
19817
76761060
12013
20749
192049125256
7;;;
20749
,,
. -Ii
. .
HANES I DataSource-—.— — —--- ----.—. ———
Household Questionnaire
Household Questionnaire
Household Questionnaire
Household Questionnaire
. .
Computer generated
See Detailed Notes
Household Questionnaire
Household Questionnaire
;,.

1’
.!
‘apeJ.oc..—.— ..=-..
03
04
05
06-9
:10-1:
No, of
‘osition~—-——
1
Y
,...,.
1
1
4’
2
HEALTH AND NUTRITION EXAMINATION SURVEY (HANES 1);
. -,,.,
ITEll DESCRIPTION & CODES— . .
Race of Examined Person
i-- White
2 - Negro *●
3 - Other
Sex of Examined Person #1 - Male
2 - Female0,
Marital Status
1- Under 172- Married
3 - Widowed
4- Never mar”ried
5 - Divorced6- Separated
8- Blank, but applicable
Date of Bikth (month, year)
01-12 - Month as given
00-99 - Year (1896-1975) as given
place of Birth
1“”:
01-02,04-060.8-1315-42 As given
44-51
53-56 “60-8191-97
88 - Blank, but applicable.
.. s,
,,.
.
,
,
Control
cou~ts—
16351
. 4163235
882011929
678193381292
2265596465
12
2074920749
20605
144
HANES I DataSource-—..—— ,— —.._____——. —Household QuestionnaireSee Detailed Notes
.....
Household Questionnaire
Household Questionnaire
Household Questionnaire
Household QuestionnaireSee Detailed Notes
i. .

,
,,
‘apeLot..—.—.— ..----
L2-13
.14
L15
No. of
‘ositions=—==.=
2
.
,.,,m
1
1
HEALTH AND NUTRITION EXAMNATION SURVEY” (HANES 1);
. -.,. .
ITEM DESCRIPTION & CODES
3ighest Grade of regular school ever attended?Lo - None21 - 1st Grade . *
22 - 2hd Grade
23 - 3rd Grade
24 - 4th Grade ,
25 - 5th Grade
26 - 6th Grade
27 -’7th Grade
28 - 8th Grade
31 - 9th Grade
32 - 10th Grade
33 - llth Grade
34 - 12th Grade .
41 - First year of college42 - Second year of college43 - Third year of college44 - Fourth year of college
●
45 - Graduate
77 - Special School
88 : Blank, but applicable’
99 - Not applicable
Did he finish the grade?
1 - Yes
2,- No8- Blank, but applicable
9- Not applicable ,
_Is he attending school now?1 - Yes
2 - No ,.
8- Blank, but applicable
9- Not applicable
.
.
.
—
Controlcounts
7240438445556660654
’757833
189710701263
96846426598(39
343883
‘ 54018
1082!)66
113805929
2343~oi3
3857476
016416
WINES 1 DataSource-—..—— — --- --...— —.— .—.—
Household Questionnaire
,‘,
.
Household Questionnaire
Household Questionnaire
i.,

—-—
Item
#..—-—..—
I
IQ..e1-
a
t :
.,
rapeLot..,—.— ——..—-..
16
17
,18
.19
——
NO* ofPnsi.tion:- —-
1
.
1
‘.
1
1
HE’ALTH AND NUTRITION UXAMINATTON SURVEY (H.ANESI)j
— —. k—. . . . —
ITEM DESCllIPTIO?i& CODES——.—.
Has he ever attended a school of any kind?
L - Yes2 - No +
f3- Blank, but applicable
9- Not applicable
~es, what kind of SC;OO1? s
1-2-
3-4-5-8-9-
NurseryKindergarten
OtherHeadstartDaycare
Blank, but applicable “Not applicable
Is any language other than English fr~quently spoken in the household?1 - Yes.2 - No.
.
8- Blank;:but applicable
If yes, what language? “o- Gennan
1- Italian2- French
polish:- Russian
5- Spanish .
6- Chinese
7- Other language
8- Blank, but applicable
9- Not applicable
,..
..
.
.
.
Controlcounts
I668
. 11270
18954
’1503627345380
20081
243718110“202
1461374108219
120231
400212
18110
,,
, ..
.,
HAMS I l)ataSource.—.—— -—--———_—- =——,—.
Household Questionnaire
Household Questionnaire
Household Questionnaire
Household Ouestionnai~e-
;. .

Item
i?-
I
N(n
1“
a
,!
L’apeLot.-—.—.—----
20-21
L22
123
.—
No. of‘osit”ion:—.——— .
2
.
,,..“
1
1
HEALTH AND NUTRITION EXAMINATION SURVEY (HANES 1);
1
ITEN L!ESCF,IPTIO:;& COI),ES I Control
counts—— _
What is your main ancestry or national ori~in?—00 - German01 – Irish .02 - Italian
03 – French04 - Polish05 - Russian06 - English07 -’Spanish08 - Mexican
09 - Chinese
10 - Japanese
11 - American, Indian
12 - Negro ~
13 - Jewish
1.4- American
15 - Other
88 - Blank, but applicable99 – Don’; know
What was he doing most of past three months?1- Working2- Keeping house
3- Something else ,
8- Blank, but applicable .
9.– Not applicable
*
.
If “something else” from above, what was he doing?o- Laid off’
1-2-J-4-5-6-7-
!!:
RetiredStudentOther .,111..Staying home #
Looking for workUnable to worlc
Elank, “butapplicable.
Not appllcab~e
—
I
33852592643110452518825414366854045
352
417356
14551956
66507
6371
48692712
276770
281320
792117123
5657
220
26
18010
.,
, .,. .
HANES I DataSource-—-—— .— ___ ___.—— ..——_
Household Questionnaire
Household Questionnaire”
Household ~uestionnairi

,,
:apeLot._ -.=_,:.-.
24
25
26
.27
L28
iHE’ALTH AND NUTRITION EXAMINATION SURVEY (HAWS 1)~
. -.,. .
No. of
‘ositions-—==
1
.
1
‘1
1
1
ITEM J2ESCF.IPTION lf CODES—— .—
If “keeping house” or “something else” from above, did he work at a
job or business at any time during the past three mclnths?
1 - Yes
2-No8- Blank, but spplicab~e
9- Not applicable
If “Morking” from above, did he work full-time or part-time?
1- Full-time
2- Part-time
8- Blank, but applicableNot applicable
.9-
Did he work at any time last week or the week before? (not around “
house)1 - Yes.2-No
,
8 – Blank;!but applicable9- Not applicable
If lrnoll to above, even though he did not work during that time, does
he have a job or business?1 – Yes
2-No8,- Blank, but applicable
9- Not applicable
If “no” in position 126; was he looking for work or on lay-off from
+!!2- Yes “
2-No8- Blan)c,b;t applicable
9- Not applicable
.
—
Control
counts—
10546522
3613137,,,
57051714
3813292
6600755
~103
13291
3976878104
13370
5376738104
13370
HANES I DataSource.—.--— _ .—- -- --—.—— ..———
Household Questionnaire
Household Questionnaire
,,.
Household Questionnaire
Household Questionnai~e
Household Questionnaire
i.,

HEALTH AND NUTRITION EXAMINATION SURVEY (HANES I)
I
zI
TapeLot.
129
130
131
.32-31
.35-3:
.38-4:
No. of
l?osition9
1
1
1
3
3
6
ITEM DESCRIPTION & CODES
If yes to above – which?1- Looking2 - Lay-off3 - Both8 - Blank, but applicable9- Not applicable
Class of Worker1 - Private paid2 - Government-Federal- Government–Other
i-own5- Non-paid6- Never worked
13- Blank, but applicable
9- Not applicable
,
If self–employed in “own” business and not a farm, is the businessincorporated?1- Yes ,2 - No8- Blank, but applicable9 - Not applicable
Business or Industry Code017-999 - As given
Occupation Code001-995 As gi;en
Date of Examination
Month - 01-12 as givenDay - 01-31 as givenYear - 71-75 as given
Control
Count9
40510924
10420107
5462248
1001
7451226025
13086
8353526
20105
20749
20749
20749
I
HANES IData Source
L
Household Questionnaire
I
Household Questionnaire I
I
IiHousehold Questionnaire
Household Questionnaire 1See Detailed Notes -
1Household Questionnaire -See Detailed Notes
Control Record

I
N1
TapeLot.
.44-45
146
.47-49
150
151
.
152
!’!0. of
Positions
2
1
3
1
1
1
● ITEM DESCRIPTION & CODES
Age at Examination
01-75 - As given
Farm1- Farm2 - Nonfarm
.
Poverty Index (X,XX)
001-997 - As given
999 - Index computed 998 or greater999 - Unknown
&I@!1 - Northeast2 - Midwest
3- South4- West
FOOD PROGRAMS APPLICABILITY
1 - Not applicable2 - No program available
3 - Food stamps available
4- Commodities available8- Blank, but applicable
Are you certified to participate in the food stamp program?
1 - Yes2-No9- Don’t knowBlank
,.
.. .. .. ..-. . .
ControlCounts
20749
129119458
2000225
722
4442510156035603
14683112
514276052
23741934126
16315
ILQ{ES IDsta Source
:omputer generated
~omputer generatedSee Detailed Notes
;omputer generated
see Detailed Notes
;omputer .qeneratedSee Detailed Notes
Food Pro8rams Quest.
,
Food Programs Quest.
,“
.-— ... -— —.. . - . ,. .. . . - . .

..
TapeLot.
153
154
155
156
157
Iiom of
?ositions
1
1
1
1
1
● ITEM DESCRIPTION & CODES
Are YOU buying stamps now?
1 - Yes, regularly2 – Yes, occasionally
3-NoB- Blankp but applicableBlank
d
What is the main reason you aren’t participating in the1- No need
pronram?
2- Not enough money at the time3- No transportation4 - Pride5 - OtherB - Blank, but applicable
Blank
Are you certified to participate in the commodity distribution progran1- Yes
2 - No
9- Don’t knowBlank
Are you receiving commodity foods now for your family?1- Yes, regularly2- Ycs, occasionally3-No8 – Blank, but applicableBlank
Why aren’t you participating in the program?1 - No need2- No transportation
3- Pride4 - Other8- Blank, but applicableBlank
. .
. .
Control
Counts
196589307
‘ 1318375
33121168
111,18
20442
215
42325
20086
15914393
20534
1652151
20710
Data Source
Food Programs Quest.
,
Food Programs Quest.
Food Programs Quest.
Food Programs Quest.
#
Food Programs Quesr.
,“
- . —..

.—Item
I}
I
u0}
TapeLot.
L58-6:
L64-6:
L70-7!
L76-81
.,
182-193
194-195
196-198
199-200
No. of
Positions
6
6
6
6
12
2
3
2
ITEM DESCRIPTION & CODES
SAMPLE WEIGHTS
Detailed Persons, Location 01-35Blanks
All Sample Persons, LocationsBlanks
01-35
Detailed Persons, Locations 01-65Blanks
All Sample Persons, Locations 01-65Blanks
Work Area
STRATA ~’
Primary Sampling Unit A’
Work Area
~’Use only for producing variance estimates for examination
locationa 1-65 or 1-100. See the General Note
titled ‘lVariance Estimation’ for producing variance estimates
for examinationl ocations 1-35 or 66-100.
ControlCounts
189218857
1012710622
385416895
207490
20749
20749
—.HA.NES IData Source
See Detailed Notes
See Detailed Notes
See Detailed Notes
See Detailed Notes

I
I
HEALTH AND NUTRITION EXAMINATION SURVEY (HANES I)24- Hour Food Consumption Intake Tape
(371,889 = number of records)
Tape No. ofLot. Positions ITEM DESCRIPTION & CODES
——
2o1- 4 Catalog Number
204 Ino4
205-224
225
226
227
228-232 ,
20 Data User Work Area
1 Respondent1 - Sample person2- Spouse3 - Parent4- Grandparent5 - Combination of above6 - Other
1 Day of Recall
o - Blankj but applicable1 - Sunday2 - Monday3 - Tuesday4 - Wednesday5 - Thursday6 - Friday7- Saturday
1 Ingestion Period1 - A.M.2 - Noon3 - Between meals4 - P.M.5 - Total day
5 FooclCode00002-91001 - as given
I 09999 - ingestion period skipped
ControlCounts
2787461925
554431067
251049604
80
1788 ,68749
76742709696567687182
703
855199416882669109457
76
3632508639
HANES IData Source
24-Hour RecallQuestionnaire
See Detailed Notes
See Detailed Notes

Item
#
I
LdN
TapeLot.
233-236
237-238
239
240-242
243
HEALTH AND NUTRITION EXAMINATION SURVEY @LANES I)
No. ofPositions ITEM DESCRIPTION & CODES
4 Time of Day0001-2445 - as given
2 Line Number01-50 - as given
1
3
1
Food Source1 - Home2 - School3 - Restaurant4 - Other
Interviewer Code032-051 - as given
999 - Blank, but applicable
Completion Code1 - Satisfactory2- Unsatisfactory3 - Refusal4 - Not available5 - Informant incapable6 - Other
ControlCounts
371889
371889
290820146883301933362
3708241065
363703692139
560556110
I-LANESIData Source
24-Hour RecallQuestionnaireSee Detailed Notes
. .-
*“ -

HEALTHAND NI!TRITIONl?JWIINK1’IONSURVEY(WWZS I)
Item
#.—
TapeLoc .——
244-245
246-253
254-261
262-269
‘No. of
Positions
2
8
8
8
Food Group00 -01 -02 -03 -04 -05 -06 -07 -08 -09 -10 -11 -12 -13 -14 -15 -16 -17 -18 -
Ingestion period skippedMilkMeatsPoultryOrgan meatsFish and shellfishEggssoupsFats, oilsLegumesCerealsFruits, vegetables, and juicesSugar and sugar productsDessertsMiscellaneousMixed protein dishesAlcoholic beveragesSugar-free beveragesSalty snacks
NUTRIENTS, (XXXXXX.XX - Decimal not shown on tape)
Calories~0~-00362880 - as given
99999999 – Unknown
Protein (Grams)00000000-00026387 - as given
99999999 - Unknown
Fat (Grams)00000000-00032901 - as given
‘39999999- Unknown
I(revised- September198
ControlCounts
863946987231225420631295872958107394214222
54268626944397915872311662224325
302784333
3701711718
3701711718
3701711718
1
HANES IData Source
24–Hour RecallQuestionnaireSee Detailed Notes
See Detailed Notes
See Detailed Notes

HEALTH ANI)NUTRITION EXAMINATION SURVEY (HANES I)
Iten
#TapeLot.
270-277
278-285
286-293
294-301
302-309
310-
317
318-
325
326-333
No. of Control
?ositions I ITEM DESCRIPTION & CODES11
8
8
8
8
8
8
8
8
Total Carbohydrates00000000-00054725 -
99999999 -
Fiber Carbohydrates00000000-64605635
99999999
Calcium (Mg)00000000-00564479
99999999
Phosphorus (Mg)00000000-00441600
99999999
Iron (Mg)00000000-00006410
99999999
Sodium (Mg)00000000-01240120
99999999
Potassium (Mg)00000000-00704000
99999999
(Grams)as givenUnknown
as givenUnknown
as givenUnknown
as givenUnknown
as givenUnknown
as givenUnknown
as givenUnknown
Vitamin A (International Units (1.U.))00000000-23923200 - as given
99999999 - Unknown
Counts
3701711718
37017117~8
3701711718
3701711718
3701711718
3701711718
3701711718
3701711718
HANES IData Source
24-Hour RecallQuestionnaire
See Detailed Notes

Item#
Tape
Loc .
334-341
342-349
350-357
358-365
366-3’73
374-381
382-389
390-397
No. of
Position
8
8
8
8
8
8
8
8
ITEN DESCRIPTION ANI CODES
Thiamine (Mg)00000000-00001311 - as given
99999999 - Unknown
Riboflavin (Mg)00000000-00001876 - as given
99999999 - Unknown
Niacin (Mg) (Niacin from food sources)00000000-00016896 - as given
99999999 - Unknown
Vitamin C (Mg)00000000-00087450 - as given
99999999 - Unknown
Amount of Food Consumed in Grams00000000-00864002 - as given
99999999 – Unknown
Saturated Fatty Acid in Grams00000000-00015765 – as given
99999999 - Unknown
Qleic Acid in Grams00000000–00014470 - as giveli
99999999 - Unknown
Linoleic Acid in Grams00000000-00011925 - as given
99999999 - Unknown
Controlcounts
3701711718
3701711718
3701711718
3701711718
3701711718
3701711718
3701711718
3701711718
HANESI IData Source
2 4–Hour RecallQuestionnaire
(revised - May 1980

Item.117:
Tape No. ofLoc. Positims
398- I
ITEM DESCRIYTION AW CODES
Dietary Cholesterol00000000-00305489 -
99999999 -
(Mg)as givenUnknown
ControlCounts
3701711718
HANZS IData Source
24–Hour RecallQuestionnaire

-. L . .. . .
DETAILED NOTES .
Size of Plac”e!
Size of place classification was derived from the 1960 census. Accordingto the de~inition used in the 1960 census, the urban population was I
comprised of all persons livin~ in (a) places of 2,500 inhabitants or more
incorpuratcd as cities, boroughs, villa~es and towns (except towms in N’ew
York., New lIn:lnnd, and Wisconsin): (b) the densely settled urban frin~e,whether incorporated or unincorporated, of urbanized areas; (c) tovms inNew En~land and tocm.ships in New Jersey and Pennsylvania which containedno incorporated municipalities as subdivisions and had either 2,500
inhabitants or more, or a population of 2,500 to 25,000 and a density
of 1,500 persons or more per square mile; (d) counties in states otherthan the I{ew England sta~es, :{ewJersey, and Pennsylvania, that had noincorporated mllnicipalities within their boundaries and had a density of1,500 persons per square mile; and (e) unincorporated places of 2,500
inhabitants or mort’ not included in any urban fringe. The remaining
population was classified as rural.
Urban areas are further classified by population size for places within
urbanized areas and other places outsidz urbanized areas.
.
.
.
●
.
-. .
-36-

-,
DETAILED NOTES
TAFE POSITION 11
..
r
SMSA
A standard metropolitan statistical area Is basically a county or a group
of contiguous counties which contains at least one city of 50,000 inhabitants
or more, or “twin cities” with a combined population of at least 50,000.
In addition to the county or counties containing such a city or cities,
contiguous counties are included in an SMSA if, according to the 1960 cel~sus~
they are socially and economically integrated with the central city.
Each SMSA must include at least one central city, and the complete title
of an SMSA identifies the central city or cities.
-37-
.-
TAPE
Race
DETAILED NOTES
POSITIONS 22 AND
. -.,. 1 . . . . .
. .
10-3
The race of the respondent was marked by observation and it was assumed
the race of all related persons was the same as the respondent unless
otherwise learned. The race categories were “Fhite”, “’Negro” or “other.”
If the appropriate category could not be marked’ by observation, then race
was asked. Persons of races other than l.%ite or Negro, such as Japanese,
Chinese, American Tndian, Korean, Hindu, Eskimo, etc. were reported as
I
“Other.” Mexicans were included with “White” unless definitely known to,-
be American Indian or of other nonwhite race.
,
,.
.:.
. . >“.
/
-38-.

. --... .
I
DETAILED NOTES
TAPE POSITIONS 34-35
Total Family Income Group
The income group represents the total combined family income for the past
twelve (12) months. It includes income from all sources such as wages,
salaries, social security or retirement benefits, help from relatives,
rent from property and so forth. The income groups were not reconciled
to the component parts (tape positions 36–94). The income component
parts were not asked when the gross income was greater than $6,999 per annum,
However, amounts greater than $6,999 appear in tape positions 37–40,
67-70, and 72-75. Some respondents reported a loss of income .from their
nonfarm business, professional practice, partnership or farm and this
explains why some data fields are greater than $6,999, but the individual
total in tape positions 91-94 does not exceed this figure.
.
. .
-39-
.

DETAILED NOTES
TAPE POSITIONS 95-99 ,.
Family Unit Code
All related sample persons in the same family unit have the same computer
generated family unit code. This will enable detailed analysis of the
,..
..
-..
. .:...
.
..
individual family unit.
..
..:.
. .
-40-
- ,--- v------ . .. .. ...rw. r ., ..,. . . . .. . . .. . . . . . .. .

DETAILED NOTES.—TAPE POSITIONS 11O-U1”
..
— -.. ..,.-..-—...——— — .-.,- .
I. . IIUNITED STATES II OUTLYING AREAS OF THE U.S. I
..... Standard
AbbreviationCode Name of Place Code
. . —.
&LABANA Ala. 01 Anerican Samoa 60 —
ALASKA Alaska 02 Canal Zone 61 —ARIZONA Ariz. 04 Canton and Enderbuq Islands 62 --AmsAs Ark. 05 Caroline Islands 63CALIFORNIA Calif. 06 Cook Islands 64COLORADO Colo. 08 Gilbert and Ellice Islands 65 —COXNECTICUT Corm. 09 Guam 66DELAWARE Del . 10 Johnston Atoll 67DIST. OF COLLTIBIA D.C. 11 Line Islands - Southern 68FLORIDA Fla. 12 Mariana Islands 69GEORGIA Ga. 13 Marshall Islands 70I-L4WAII llawaii 15 Midway Islands 71lDAHg Idaho 16 Puerto Rico 72ILLINOIS Ill. 17 Ryukyn Islands - Southern 73
INDI&YA Ind, 18 Swan Islands . 74IOWA Iowa 19 Tokelau Islands 75KANs As Kans. 20 U.S. Misc. Caribbean 76KEt:TUChT Ky . 21 U.S. Misc. Pacific Islands—. 77LOUISIANA La. 22 Virgin Tslands 78MAINE Maine 23 Wake Islands 79MARYLA273 Md . 24 Cuba 80‘ASSACHL!SETTS Mass. 25 West Indies 81
.dTPuTf=ANT---- --- ---
X(: -L 9C Xl--&l.! ,+---: F.--- - .- .
011 -----..---------MINNESOTA Minn.
;?South America i;
MISSISSIPPI Miss. 28 Europe 93 —MISSOURI Mo . 29 AfricaMOI{TANA
94Mont . 30 Asia 95
NEBRASKA Ncbr. 31 Australasia 96NEVADA Nev.
.,32 Pacific Islands 97
NEW HAYTSIIIW N.H, 33NEW JERSEY J.J, 34NEW FIEXICO N. Ffex. -35NEw YOP.K N.Y. 36NORTH CAROLINA N.C. 37NORTH DAKOTA N. Dak. 38OHIO Ohio 39
-OKLAHCMA Okla. 40OREGON OreE. 41PEhYSYLVANIA Pa. 42RHODE ISLAh~ R.I. 44SOUTH CAROLINA S.c. i &5
~YIRGINIA Va. ii<{ASHIKGTON Wash. 53
——
WEST VIRGINIA W. Va. 54——
_WISCONSIN Wis . 55WYOMING Wyo . 56
-41-
,., -. --- -. r- ------- —. -.. -_ . . . .------ -—-— ,. ... .,. ,. .-...= . , , .

DETAILED NOTES●
✎
TAYE POSITIONS 132-134 AND 135-137
Industry and Occupation Codes
A person’s occupation may be defined as his principal job or business.
For this .survey purpose, the principal job or business of a respondent is
defined in one of the following waysz If the person worked during the
two week inteniew period or had a job or business, the question concerning
his occupation (or work) applies to his job during that period. If the
respondent held more than one job, the question is directed to the one
at which he spent the most time. It refers to the one he considers most
important when equal time is spent at each job. A person who has not begun
work at a new job, is looking for work, or is on layoff from work is
questioned about his last full-time civilian -job. A full-time job is
defined as one at which the person spent 35 or more hours per week and
which lasted two consecutive weeks or more. A person who has a job to
which he has not yet reported and has never had a previous job or.business
is classified 2s a “new worker.”
&
The 1970 census of population Alphabetical Index of Industries and Occupations
was used in the coding of both the industry and occupation.
Library of Congress Number 74–612012. For sale by the Superintendent .
of Documents, U.S. Government Printing Office, Washington, D.C. 2!3402.
$3.00. Stock Number 0301-2283.
,1
,
Ii1
.4’2-
. . .
1
,i.:

Land used for
identified as
consisting of
DETAILED NOTES
TAPE POSITION 146
farming purposes (Code 1 in Tape Position 146) was
being rural land (Code 2 in Tape Position 13)
10 or more acres (Code 1 in Tape Position 14) with
crop sales amounting to $50 or more (Code 2 in Tape Position 15),
or rural land (Code 2 in Tape Position 13) consisting of less
than 10 acres (Code 2 in Tape Position 14) with crop sales
amounting to $250 or more (Code 3 in Tape Position 16). All
Other land is classified as nonfarm (Code 2 in Tape Position 146).
?
..
.-.-
-43-

DETAILED NOTES
TAPE POSITIONS 147-149
.● ✎
✎
.
Poverty Index--Income status was determined by the Povert Income Ratio [PIR). ; ‘“”?/Poverty statistics published in the Census Bureau report% were based on the
poverty index developed by the Social Security Administration in 1964. (Fora detailed discussion of the SSA poverty standards, see reference 2.) Modifica-tions in the definition of poverty were adopted in 1969.~/ The standard dataseries in poverty for statistical use by all executive departments and establish-ments has been established.~1
The two components of the PIR are the total income-of the household(numerator) and a multiple of the total income necessary to maintain a familywith given characteristics on a nutritionally adequate food pla<’( denominator).
The donor value of the denominator of the PIR is constructed from a food plan(economy plan) necessary to maintain minimum recommended daily nutritionalrequirements. The economy plan is designated by the Department of Agriculturefor “emergency or temporary use when funds are iow.”
For families of three or more persons, the poverty level was set at threetimes the cost of the economy food plan. For smaller families and personsliving alone, the cost of the economy food plan was adjusted by the relativelyhigher fixed expenses of these smaller households.
The denominator or poverty income cutoff adjusts the family poverty incomemaintenance requirements by. the family size, the sex of the family head, the i
Iage of the family head in families with one ~r two members, and the place ofresidence (farm, nonfarm). Annual revisions of the poverty inc~me cutoffs arebased on the changes in the average cost Gf living as reflected in the C~L?~meiPrice Index.
As shown in the table, the annual income considered to be the poverty1
level increases as the family size increases...
A family with any combination ,
of characteristics and with the same income as shown in the table has been,!t
designated as having a PIR or poverty level cf 1.0. The same family with twice;.!
the income found in the table would have a PIR of 2.0. Ratios of less than 1.0can be described as “below poverty,” ratios greater than Gr equal to 1.0, as
.,
“at or above poverty?” iI
Poverty thresholds are computed on a national basis only. No attempt hasbeen made to adjust these thresholds for regional, State, or other localvariation in the cost of living (except for the farm, r.onfarm difference).
.None of the noncash public welfare benefits such as food stamp bonuses or freefood commodities are included in the income of the low income families receivingthese benefits.
‘/Current Population Reports, “Consumer Income,” Series P-60, No. 77, May 7, 1971,— I1“
~/OrsharLsky, M.: “Counting the Poor: Ancther Look at the Poverty Profile,” Social ~~Security Bulletin, January 1965;’’Who’s ‘Whobong the Poor: A Demographic View- of :;
Poverty,” Socisl Security Bulletin, July 1965. I)~~
~/Current Population Reports, “Special Studies,” Series P-23, No. 28, P.ugust 12, 1969. ;!,i
.!;Cjrcular No. A-46, T~ansmitted Memorandum No. 9, Executive Office of the president, ‘
13ureau of the Budge:, August 2$, 1959, and Exhibit L (rev.).
.:
I-44- 1I.:“.‘:;,>,.~t,l.-!’
.

-“”2.-:,
m’.
,DETAIL~ NOTES
TAPE POSITIONS 147-149
.-
Weighted average thresholds ac the lm income level in 1971 by ●lze of family and mexof head, by farm-nonfann residence
Nonfarm Farm
Total
Size of family.“. .
Total
$;,:;;
1:931
3,7002,6122,6992,4243,2076,1134,8455,4416,678
Femle]head Total Femalel
head
All unrelated individuals --------Under 65 years -----------------65 years and over --------------
$2,0402,0981,940
3,7242,6332,7162,4483,2294,1374,B805,4096,751
$;,;:;
1:959
3,76h2,6412,7312,4503,2L64,1394,8845,4926,771
$1,978 $1,7272,017 1,s051,934 1,652
$1,7831,8531,666
$1,6691,7151,643
All families---------------------2 persons ----------------------Head under 65 years ------------Head 65 years and over ---------3 persons----------------------4 persons----------------------5 persons----------------------6 persons----------------------7 persons or more --------------
3,2422,2242,3222,0812,7493,5284.159
3,0792,1302,1952,0892,6273,513L,14B4,6565,516
1
4;6895,749
1
IFor U-nrelated individuals, sex of the individual.
SOURCE: U.S. Department of Comnerce, Social and Economic Statistics Administration, U.S. Bu-reau of the Census “Characceriecics of the Law Income population: 1971,” Current PopulationReports, Series P-60, NO. 86, p. M.
—-.
. .
..
.
-,.,
. .‘.
-45-

,... ——... — ... . . .___
DETAILED NOTES
TAPE 90SITION i50
G.
‘.
~.
-b9
,
Region.
The United States was divided into four broad geographic regions ofapproximately equal population. Those regions,which deviate somewhat from -
the groups used by the Bureau of the Census, are as follows:..
:.
...
.’
,.
.:
......::..
E+!?Q States Included
Northeast Mafne, Vermont, NewConnecticut, Rhodeand Pennsylvania
South Delaware, Maryland,
Hampshire, Massachusetts,Island, New York, New Jersey,
District of Columbia,West Virginia, Virginia, Kentucky, Tennessee,North Carolina, South Carolina, Georgia, Florida,Alabama, Mississippi, Louisiana, and Arkansas
Midwest Ohio, Illinois, Indiana, Michigan, Wisconsin,
“Minnesota, Iowa, Missouri
West Washington, Oregon, California, Nevada, NewMexico, Arizona, Texas, Oklahoma, Kansas,Nebraska, North Dakota, South “Dakota, Idaho,Utah, Colorado, Montana, and Wyoming.
.-,
-i
-46-

&●
b
s
DETAILED NOTESv#
.,.-.
.,
..
.,
,,
,.
,-
.:
.,”. . .
.,, .
‘,,..
TAPE POSITIONS 158-193 ,,
HANES is a multistage, stratified, probability sample of loose clusters ofpersons in land-based segments. In addition, HANES is composed of twodistinct examination components --a nutrition screening examination (takenby all examinees) and a more detailed examination taken by a pre-selectedsubsample of all examinees, ages 25-74. For the nutrition screening exarnina- ‘“tion, locations 1-35 and 1-65 constituted national probability samples
.-
and for the detailed examination, locations 1-35, 1-65, 66-100 and 1-100all constitute national probability samples. In other words, HANES iscomposed of six distinct subsamples of the U.S. population. For a moredetailed discussion of the sample design see Series 1, No. 10a.
Since each of these six subsamples is a distinct subsample of the U.S.population, each subsample requires a different set of weights. The weightsare based upon the probability of selection into the sample, adjustmentsfor nonresponse and further adjustments to approximate the U.S. noninstitu-tionalized population as of the midpoint of each subsample.
In order to select all of those examinees in a particular subsample, i.e.received a particular exam component, it is necessary to exclude allexaminees with a weight of zero or blank. It is also necessary to excludeall zero or blank weights because that is the only way to differentiatemissing data due to nonresponse from data that is missing because the sampledesign dictated that a particular examinee was not supposed to receive aparticular examination component.
It is suggested that any analyses that ale desired by the researcher beperformed using the greatest number of examinees possible; that is, if theresearcher is interested in an exam component of the nutrition screeningexamination he should use the weight and consequently the data from the 65location subsample rather than the 35 location subsample. For the detailedexamination, the researcher should use the 100 location subsample ratherthan one of the othe~s. However, some exam components were only done in aparticular subsampie; for example, only at the first 35 locations. Inthat case, the researcher has no choice in selecting a particular subsample.
There may be occasions when a re~earcher may want to make comparisons ofestimates obtained from various subsamples. For example, the prevalence “ofsome disease condition as estimated from the first 35 locations could becompared with an estimate based upon locations 66-100. The researcher mayalso want to formulate hypotheses using one subsample and test those hypothesesusing another subsample.
-,
-47-
., .-.—,.,.~.-.-.?.,........... .-..-.

DETAILED NOTES
Tape Position 227
Ingestion Period
The ingestion period code ‘5’ refers to one or more food items prepared
once and eaten throughout the day.
.48-

DETAILED NOTES
Tape Positions 228-232
Food Code
The food codes as well as nutrient values of food items per 100 gram
edible portion were obtained from the U. S. Department of Agriculture
Handbook 8, 1963 and from other sources. Because of this constantly
changing food supply, nutrient composition values for new food
combinations were added or updated continually according to information
provided by the U. S. Department of Agriculture. A food code of
‘09999’ was used when an ingestion period was skipped.
For further information, refer to specifications for model grams and
Handbook 8.
-49.

DETAILED NOTES
Tape Positions 233-236
Time of Dav
The time was recorded in minutes and hours using military times.
-50-

DETAILED NOTESTape Positions 244–245
FOOD OR FOOD GROUP EXPLANATION OF FOOD ITEM
1. Milk and Milk Products Includes milk drunk as a beverage orused on cereals; flavored milk drinks;cocoa made from milk; skim milk, yogurt,or buttermilk; ice milk: ice cream orpuddings made with milk; cheese andcheese dishes. EXCEPTION: CREAM CHEESE
2. Meat
3. Poultry
4. Organ meats
5. Fish or Shellfish
6. Egg S
7. soups
8. Fats and Oils
9. Legumes and Nuts
10. Cereals and GrainProducts
Includes beef, pork, lanb, veal, lunc:heonmeats, frankfurters
Includes chicken, turkey, duck, gamebirds, cornish hen, etc.
Includes liver, kidney, heart, spleen,etc.
All varieties of fish and shellfishregardless of whether canned, fresh,frozen, or dried or salted.
Includes eggs eaten e.g. fried, boiled,poached, deviled, or egg salad. DOE SNOT INCLUDE EGGS IN COOKED OR BAKEDDISHES (AS CUSTARDS, PUDDINGS)
Includes milk and water–based; graviesand sauces (meat and vegetable based)
Includes butter, margarine, salad oils,salad dressings, bacon, cream cheese,,cream, peanut butter, non–dairy cream
Includes dry beans and peas like pin:kobeans, red beans, black–eyed peas,peanuts, soy beans, soy products, etc.
Includes breakfast cereals either dr!yas cornflakes or cooked such as oatmeal;grain products such as bread, rolls.biscuits, muffins, cornbread, crackers,unsalted pretzels.
11- Fruits and Vegetables A. All kinds: fresh, canned, frozen,cooked or raw; juices, or fruit drin:ksB. Fruits and Vegetables rich inVitamin Ac. Fruits and Vegetables rich inVitamin C
- 50a -

FOOD OR FOOD GROUP
12. Sugar & primarily sugarproducts
13. Desserts and sweets
14. Miscellaneous
15. Mixed protein disheswith carbohydrates(starches) orvegettiles (cho)
16. Alcohol beverages
17. Sugar free and low
18. Salty snacks
EXPLANATION OF FOOD ITEM
Includes all candy, soft drinks,lemonade, limeade
Includes cake, pie, cookies, fruitpuddings, doughnuts (cake–type andyeast–type) sherbet, sweet snacks.EXCEPTIONS: ICE CREAM, ICE MILK
Including mustard, gelatin, malt,beverage powders, chili powder, seeds,low fat salad dressings
Includes casseroles, pot pies, pizza,spaghetti with meat, etc. EXCEPTIONS:PLAIN CHEESE DISHES
Includes: a) beer, b) wine, c) distilledliquors
Includes coffee (regular, and decaffein--ated) , tea, bouillion, consomme, andcarbonated drinks
Includes potato chips, corn chips,puffed snacks, salted popcorn, saltedpretzels, etc.
(Revised--May 1980)
– 50b -
DETAILED NOTES
Tape Positions 246-365
Nutrients
A value of zero ‘00000000’ can denote the following:
1) that the individual skipped a particular ingestion period.
In this case, the food code will be ‘09999’ (see tape
positions 228-232).
2) that the nutrient value per 100 gram edible portion is ‘00000000’
or “unknown. “ To determine whether this is the case, first
determine the food code (tape positions 228-232). Then search
for that food code on the Nutrient Composition Tape and search
for the nutrient in ’question (see record specifications for
Nutrient Composition Tape). A value of ‘00000000’ denotes
that the particular food does not contain that nutrient. The
values -100, -800, and -900 correspond to a value unknown at
the time HANES dietary data was processed.
There were 1718 records for which the values for calories and selected
nutrients are given as ‘99999999.’ This was done because uncorrectable
transcription errors caused some values for calories and the selected
nutrients were found outside of reasonable expected consumption ranges.
There are some records where the caloric intake or intake for selected
nutrients is low (less than 0.10 of a unit). This is the result of
the reported intake of miniscule amounts of food.
-51_

DETAILED NOTES
Tape Positions 262–269
Fat (Grams )
Fat values on the new 24–Eour Consumption Tape do not
necessarily match those on the original 24–Hour Consumption
Tape because the new values have been computed using updated
nutrient composition information on the amount of fat per
100 gram edible portions of certain foods.
(Revised--May i980)
–52–

DETAILED NOTES
Tape Positions 278–285
Fiber Carbohydrate
The data contained in this field on the tape are
unedited. Also fiber values for many of the foods cataloged
in HANES I were unknown. The values have been included on
this tape in response to requests from data users who were
interested in examining HANES I data using that information
on fiber carbohydrate which was available during the time
frame of the survey.
The Div-ision of Health Examination Statistics of the
National Center For Health Statistics has no plans for any
analysis using fiber carbohydrate values.
(Revised--May 1980)
-53-

DETAILED NOTES
Tape Positions 366-373
Amount of Food Consumed in Grams \
The amount of each individual food item consumed by a sample
person has been quantified in grams. This is done by means
of the food models w?nich have been coded by the dietary
interviewer as representing the amount of each food consumed,
and the gram conversion factor associated with every food
item in the HANES data bank. This factor allows the universal
conversion of food quantities to grams.
(Revised--May 198C)
- 54 -