21, rue d’artois, f-75008 paris b3-208 cigre 2012 http...
TRANSCRIPT

Monitoring and condition assessment for GIS substations and GIL
J.L. RAYON1, A. GIRODET2, J.F. PENNING1, D. GAUTSCHI3, F. AIT-ABDELMALEK1, W. WEIDMANN1, P. JUGE1, G. GRANELLI1
1ALSTOM Grid, Aix-les-Bains France
2ALSTOM Grid, Lyon France
3ALSTOM Grid AG, Oberentfelden Switzerland
SUMMARY The requirements for the condition monitoring of gas-insulated switchgear (GIS) and gas-insulated lines (GIL) has been in constant evolution over the recent years. A few years ago, the main focus of GIS/GIL monitoring was on SF6 density to ensure the correct operation of the equipment and to minimize SF6 losses during the lifetime of the switchgear. The international regulations mentioned by the 1997 Kyoto protocol and the standards concerning SF6 gas-insulated equipment and substations (IEC 62271-203) request utility companies to control their SF6 balance with high accuracy. In the last years, additional features have been implemented to reach the utility’s needs. Today a wide spectrum of new parameters such as partial discharge activities have to be monitored, analyzed and transmitted to the different actors in the best format without any spurious alarms. Flexibility of the integration of on-line monitoring functions enables the asset managers to fulfill their constraints. To meet these new requirements, the monitoring systems are based on digital technologies. Thanks to this evolution, the circuit-breaker behavior is very well known and the result allows having a reliable estimation of the operating time in the controlled switching application. The feedback and the use of latest technologies for the monitoring system allowed creating a reliable condition monitoring but also opened the door to one new challenge: how to implement all the functions into one single integrated monitoring system in order to meet the Smart Grid requirements. KEYWORDS Smart Grid, GIS, GIL, PD Monitoring, UHF, Expertise, Asset management
21, rue d’Artois, F-75008 PARIS B3-208 CIGRE 2012 http : //www.cigre.org

2
1. INTRODUCTION
From the monitoring in the field to the management of his assets, each network manager wishes to know the precise status of his installations in order to:
Increase the reliability, availability and operation of his equipment;
Optimize his maintenance plans and prevent potential failures;
Check the capacity for carrying temporary overloads during peak periods;
Prepare his investments in order to renovate or extend his inventory.
The arrival of modern technologies applied to the condition monitoring has essentially improved the data quality. The accurate status of the main values characterizing GIS and GIL equipment (see Figure 1) now enables an effective response to these requirements and offers the opportunity to integrate the development of new monitoring applications into Smart Grids.
Figure 1: 380kV gas-insulated line (GIL)
2. FEEDBACK History
In the beginning, monitoring applications were set up with the aim of offering an alternative to conventional technologies, whose reliability were sometimes proved insufficient or were called into question, resulting in periodic large-scale corrective or preventive maintenance campaigns for the secondary equipment. Digital products offer self-diagnosis features for the entire monitoring chain, from the field sensors to the acquisition units (IED), so the operator can permanently rely on the quality of the transmitted information. Field applications
Since the first digital monitoring systems which were designed to ensure the monitoring of gas properties [1] were put into service, many developments have been made towards the monitoring of other "vital" constants of the equipment such as the switchgear operating condition or partial discharge activity. More than 100 Alstom Grid gas-insulated substations, representing more than 1,000 bays, are currently equipped with digital monitoring systems. In addition to the simple monitoring of the physical values, the developments in the new systems now tend towards establishing connections with control functions, which will enable the optimization of a substation's operating modes by integrating an overall "network" vision.

3
3. SUITABLE MONITORING APPLICATION
Monitoring applications are integrated into a bottom-up ranked structure. Each level of this structure is allocated to an equipment and intervention level taken into consideration very early in the product specification phase. The Figure 2 shows three important levels which have to be managed by the condition monitoring system.
Figure 2: Ranking of monitoring applications
For each monitoring application, the bay level integrates: Smart sensors mounted on the primary elements, whose design takes into account the EMC
constraints specific to the GIS's environment; IEDs that enable communication with the smart sensors; Communication links that enable data exchange between the IEDs and the sensors; The different simulation, commissioning, diagnosis and maintenance tools; Local display interfaces; Links to the superior level. The monitoring systems based on digital technologies [2] have to distribute their data according to the needs of the different actors in the substation. For control purpose the information has to be sent in real time with a maximum of security. And in addition the staff must have a friendly Human-Machine Interface (HMI) (see Figure3) with useful data that can be analyzed with a simple glance.
Figure 3: Human-Machine Interface showing SF6 density per compartment
At the substation level, the operation people must have the possibility to use supervision tools attached to each monitoring applications ideally in the same screen. These supervision tools are used to centralize and format the data in the databases storing all the events experienced both by the primary equipment and the secondary equipment (SF6 alarm levels, sensor failures etc.). Finally, at the Expert level, the databases are exploited by upper level expertise applications, which include powerful algorithms, based mainly on numerical processing; the advanced features of the different field applications listed in this article authorize an “avant-garde” approach using digital and statistical methods offering managers ultimate tools for the expertise and management of GIS and GIL equipment. That enables to realize a "state of health" for the substation being monitored and provide the operators with instantaneous information as recommended by the IEC62271-203 standard. As the asset managers are already using consolidated data, we talk about “Manager” applications. These tools are able to help them in the choice of the data to be analyzed. Regarding product experts and equipment managers, it results in significant time-saving in the assessment of an operation situation.
Tool ProducSyste
CONTROLBAY LEVEL
SUBSTATION SUPERVIZELocal / Remote
Expert Software MANAGEXPERT
SF P C
4
4. MONITORING FOR OPERATION AND MAINTENANCE
4.1 SF6 MONITORING
The international regulations mentioned by the 1997 Kyoto protocol and the standards concerning SF6 gas-insulated equipment and substations (IEC 62271-203) request utility companies to control their SF6 balance with high accuracy. As well as the possibility of performing alarm functions on thresholds and having real-time measurements of the density of the gas providing equipment insulation, digital monitoring systems offer other opportunities via their recording and calculation potential: Monitoring of all dynamic phenomena such as gas temperature increase or pressure variation and
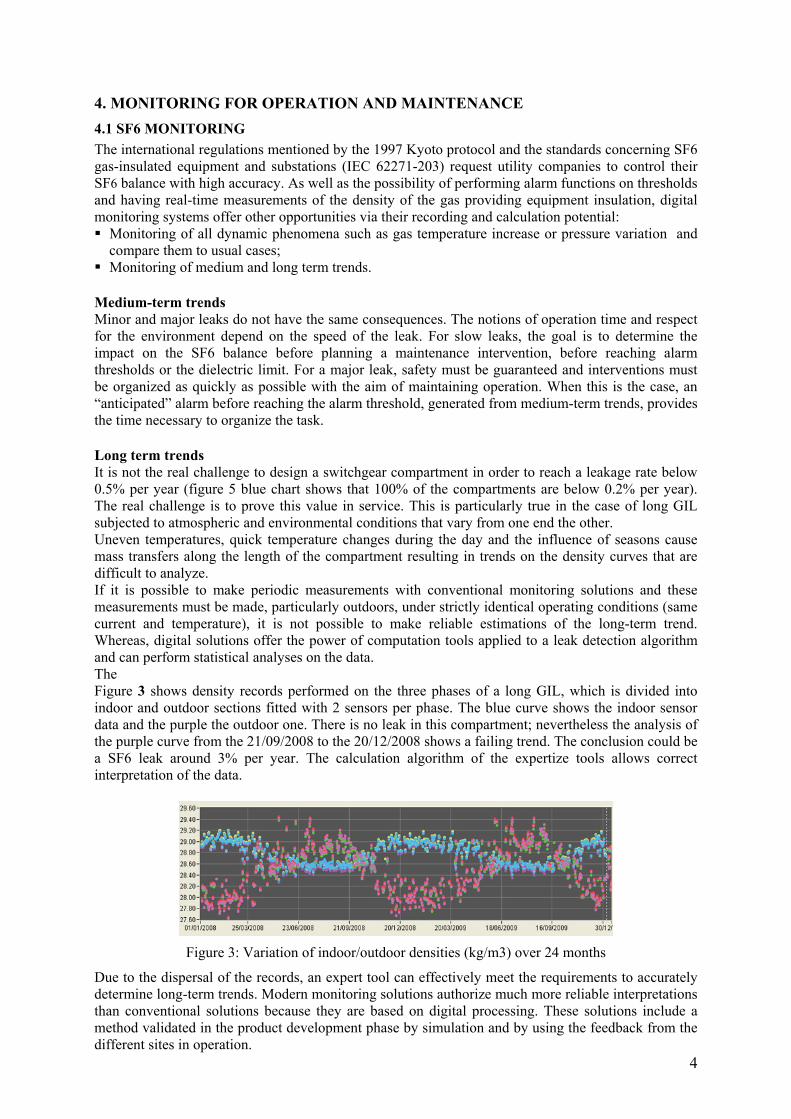
compare them to usual cases; Monitoring of medium and long term trends. Medium-term trends Minor and major leaks do not have the same consequences. The notions of operation time and respect for the environment depend on the speed of the leak. For slow leaks, the goal is to determine the impact on the SF6 balance before planning a maintenance intervention, before reaching alarm thresholds or the dielectric limit. For a major leak, safety must be guaranteed and interventions must be organized as quickly as possible with the aim of maintaining operation. When this is the case, an “anticipated” alarm before reaching the alarm threshold, generated from medium-term trends, provides the time necessary to organize the task. Long term trends It is not the real challenge to design a switchgear compartment in order to reach a leakage rate below 0.5% per year (figure 5 blue chart shows that 100% of the compartments are below 0.2% per year). The real challenge is to prove this value in service. This is particularly true in the case of long GIL subjected to atmospheric and environmental conditions that vary from one end the other. Uneven temperatures, quick temperature changes during the day and the influence of seasons cause mass transfers along the length of the compartment resulting in trends on the density curves that are difficult to analyze. If it is possible to make periodic measurements with conventional monitoring solutions and these measurements must be made, particularly outdoors, under strictly identical operating conditions (same current and temperature), it is not possible to make reliable estimations of the long-term trend. Whereas, digital solutions offer the power of computation tools applied to a leak detection algorithm and can perform statistical analyses on the data. The Figure 3 shows density records performed on the three phases of a long GIL, which is divided into indoor and outdoor sections fitted with 2 sensors per phase. The blue curve shows the indoor sensor data and the purple the outdoor one. There is no leak in this compartment; nevertheless the analysis of the purple curve from the 21/09/2008 to the 20/12/2008 shows a failing trend. The conclusion could be a SF6 leak around 3% per year. The calculation algorithm of the expertize tools allows correct interpretation of the data.
Figure 3: Variation of indoor/outdoor densities (kg/m3) over 24 months
Due to the dispersal of the records, an expert tool can effectively meet the requirements to accurately determine long-term trends. Modern monitoring solutions authorize much more reliable interpretations than conventional solutions because they are based on digital processing. These solutions include a method validated in the product development phase by simulation and by using the feedback from the different sites in operation.
5
Setting-up SF6 indicators Because a large proportion of the routines used in the leak detection algorithm are based on statistical treatments, it is easy to establish a periodical SF6 balance in the form of online indicators. Figure 4 shows an example of two types of indicator inferred from analyses performed over a period of 5 years on a typical GIS: The trends in SF6 emissions into the
atmosphere over several successive years The distribution of leakage rates per
compartment over several successive years
Figure 4: SF6 indicators
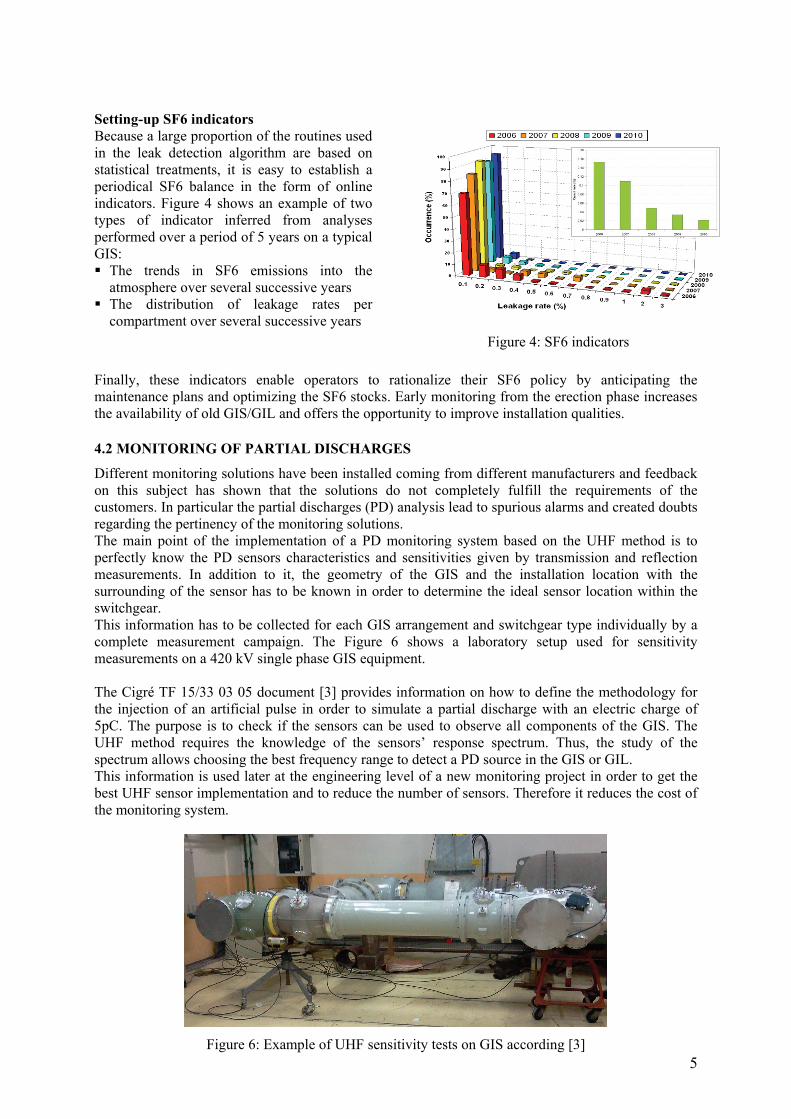
Finally, these indicators enable operators to rationalize their SF6 policy by anticipating the maintenance plans and optimizing the SF6 stocks. Early monitoring from the erection phase increases the availability of old GIS/GIL and offers the opportunity to improve installation qualities. 4.2 MONITORING OF PARTIAL DISCHARGES Different monitoring solutions have been installed coming from different manufacturers and feedback on this subject has shown that the solutions do not completely fulfill the requirements of the customers. In particular the partial discharges (PD) analysis lead to spurious alarms and created doubts regarding the pertinency of the monitoring solutions. The main point of the implementation of a PD monitoring system based on the UHF method is to perfectly know the PD sensors characteristics and sensitivities given by transmission and reflection measurements. In addition to it, the geometry of the GIS and the installation location with the surrounding of the sensor has to be known in order to determine the ideal sensor location within the switchgear. This information has to be collected for each GIS arrangement and switchgear type individually by a complete measurement campaign. The Figure 6 shows a laboratory setup used for sensitivity measurements on a 420 kV single phase GIS equipment. The Cigré TF 15/33 03 05 document [3] provides information on how to define the methodology for the injection of an artificial pulse in order to simulate a partial discharge with an electric charge of 5pC. The purpose is to check if the sensors can be used to observe all components of the GIS. The UHF method requires the knowledge of the sensors’ response spectrum. Thus, the study of the spectrum allows choosing the best frequency range to detect a PD source in the GIS or GIL. This information is used later at the engineering level of a new monitoring project in order to get the best UHF sensor implementation and to reduce the number of sensors. Therefore it reduces the cost of the monitoring system.
Figure 6: Example of UHF sensitivity tests on GIS according [3]

6
The monitoring of partial discharges is also widely used during routine testing in the GIS factories. During the dielectric tests the apparent charge is measured using the conventional method according IEC 60270. At the same time the UHF monitoring system (Figure 7) is simultaneously triggered in order to compare the signal patterns of both systems. The two patterns will be later required during the site commissioning phase for the settings of the PD monitoring systems sensitivity for each sensor individually.
Figure 7: UHF method used in parallel during dielectrical test in production
A long experience in the domain of partial discharge is required to implement a PD monitoring to optimize assets. Therefore, the challenge of an integrated monitoring system is also to have a reliable system avoiding spurious alarms. A decision aid tool Although most partial discharges are harmless, sooner or later, depending on how critical the fault and the degradation of the dielectric environment are, they sometimes result in a flashover. That means that early detection of the phenomenon is important. The underlying question when using a continuous monitoring system of partial discharges with the UHF method is to know in case of acknowledge partial discharge activity if the equipment requires a shut-down for maintenance. The advantage of a continuous monitoring system (on-line system) is its capability to alert the operating and maintenance teams as well as to provide an identification of the defect with a high degree of reliability. Then, complementary analysis such as localization and trend analysis can prevent an operating incident with serious consequences. Figure 8: On-line UHF acquisition unit
The interpretation of a recorded UHF signal is based on:
Putting tools into place that are able to discriminate between a partial discharge pattern and external noise;
Statistical processing of the large amount of data recorded, to produce a trend of change over time;
Localization of the signal
The availability of a library of clearly identifiable fault patterns regularly updated.

7
Diagnosis methodology The diagnosis of the seriousness of partial discharges is carried out in three main phases: Step 1: Spectral analysis, "abnormal" activity? The different frequencies in the UHF spectrum are permanently examined by the partial discharge online monitoring system. When suspect activity is identified on a given frequency, the system tunes into this frequency and starts a time-based analysis which results in a phase resolved pattern. Step 2: Alarm generation The first difficulty concerns the generation of an alert to the operators: is the recorded activity a sign of partial discharge? The signals recorded by the acquisition unit are compared to background noise and filtered. When an alert threshold is reached, an alarm signal is activated. Step 3: Expertise and fault recognition The defect identification is performed by powerful algorithms developed to analyze the spectral and time domain data. Then methods based on the comparison between the unknown defect and those stored in the expert system database allow estimating the probability of belonging to a class of defect. Therefore, a GIS expert from the manufacturer who knows the GIS design, the sensor locations and its direct environment will be able to give a meaningful analysis. In case of PD activities it is not only the pattern that has to be analyzed but also how the pattern is created in real time. Therefore the system must have a special analyze mode for this purpose. Operating condition Expert tools offered by online partial discharge monitoring systems enable the operators to assess the degradation conditions of the equipment. Depending on how critical an identified fault is, a maintenance stop can be scheduled. However, deep knowledge of the switchgear design and the results of UHF factory measurements performed for each type of GIS are often needed to achieve good results.
Figure 9: UHF analysis
Figure 10: Expert tools
Figure 11: Decision structure
ALARM INTERPRETATION
SERIOUS
CAUSE EXPERTISE
STOP OPERATION
REPAIR
OPERATION UNDER OBSERVATION
? Human decision
ANALYSIS OF TRENDS
1 – Spectral analysis
2 – Time-based analysis
3 – Identification
1
2 3
Discrimination Partial discharge/Noise
SPECTRAL ANALYSES
TIME BASED ANALYSIS
EVENT GENERATION
Yes
No
ALARM GENERATION
Statistical processing of the recorded signals
Suspect UHF activity? ?

8
4.3 CIRCUIT BREAKER CONDITION MONITORING Controlled switching of the circuit-breaker: introduction Transient overvoltage may damage expensive equipment and lead to unavailability of electrical networks [4], in particular in the case of long transmission circuits during circuit-breaker closing and re-closing operations. Controlled switching solutions applied to high voltage circuit breakers using intelligent synchronization relays, offer a relevant approach and an electronic alternative to more conventional methods, usually used to reduce the electrical constraints on the equipment. The success of controlled switching is based on two fundamental principles: Identification of a target moment for re-establishing power, which implies perfect knowledge of the
power supply network. Reliable estimation of the duration of the operation for the device being controlled. Performance of controlled switching: influence of the closing window The following case shows the results of simulations performed during a sequence of fast re-closing following the elimination of a fault on a long transmission circuit. The circuit-breaker is closed randomly in a timeslot positioned around the optimum moment for the operation (zero voltage across circuit-breaker terminals in Figure 12).
Figure 12: Overvoltage profile depending on the length of the re-closing timeslot
The maximum voltage level is then determined over the length of the circuit and compared with the length of the target timeslot. These results prove the importance of closing the circuit-breaker within the shortest possible time slot, to control the overvoltage profile over the entire circuit. Given the hypothesis that the controlled switch relay determines the optimum operation moment with high accuracy, it is just as important to anticipate the behavior of the high voltage circuit breaker being controlled. Prediction of the duration of circuit-breaker operations: One of the challenges in controlled switching lies in the prediction of the duration of the operation, subject to the contingencies of the previous operating conditions. Ambient temperature, control device power reserves, control auxiliaries voltage level, dielectric gas pressure, time elapsed since the last operation, long-term drift are all factors that have an influence. Thanks to the permanent monitoring of the circuit-breaker's parameters and to the sophisticated algorithm in place, including instantaneous compensation routines and self-learning, a synchronous operating relay enables reliable and accurate estimation of the behavior of the device. Perfect matching between the operating relay and the controlled device Over and above a simple condition monitoring, controlled switching application appears to be a complex and efficient solution using High-voltage equipment whose operating characteristics, defined by IEC 62271-302, are perfectly
controlled, regardless the operating conditions; Series of sensors reliably transmitting both the characteristic values of the network and the
environmental conditions of the installation. An intelligent relay integrating the algorithms ensuring the two fundamental principles (target
moment identification and operation durations)
Source voltage Re-closing timeslot
Optimum operation moment
Line voltage
Time (ms)
Voltage across circuit-breaker

9
5. CONCLUSIONS
Establishing links with field applications The control of equipment requires good knowledge of the status of its physical constants at the field level. Edition 2 of IEC 61850 standards now enable to exchange the collected data in a structured manner. The new "GISWatch" architecture integrates the communication protocols laid down by IEC 61850 standards, which enable to have an overview of the operating condition of gas-insulated substation or line. Integration of monitoring applications therefore enables the correlation of various data such as the density and quality of dielectric gas, partial discharge activity and wear levels of switching devices, thus enabling the optimization of operating and maintenance modes. All this correlated data is processed to establish a global assessment of the condition of the installation. Digitalization of the substation’s physical parameters is done by defining objects very close to the primary equipment. In particular, pre-processing, formatting and fusion of physical data are performed around: The set-up of configuration tools that define the architecture of communication methods between
the different equipment items; The use of optical type communication media, immune to electromagnetic interference and which
enable high data transmission rates; The set-up diagnosis tools to accompany the new secondary equipment put into service. This correlation of strategic data via setting up elaborate communication network architectures, together with the exploitation of databases by powerful "Manager" tools now authorizes an opening in the direction of "network management system" (NMS) applications. BIBLIOGRAPHY [1] C. Fournet, P. Ponchon, R. Pages, A. Ficheux "Retour d’expérience et perspectives futures des
monitoring digitaux de postes a isolation gazeuse (feedback and future perspectives for digital monitoring of gas-insulated substations) ", MATPOST07_0024, 2007
[2] M. Bernard, A. Girodet, F. Biquez, E. Laruelle, J.L. Rayon, J.F. Penning, A. Ficheux,
A. Bertinato, "Optimized gas insulated lines for bulk power transmission", CIGRE B3_103_2010, 2010
[3] CIGRE Task Force 15/33.03.05, “Partial discharge detection system for GIS: sensitivity
verification for the UHF method and the acoustic method”, ÉLECTRA No. 183, pp. 74-87 [4] T. Jung, J.L. Rayon, F. Aït-Abdelmalek, A. Fanget, J. Sawada, J. Hollman, D. Sydor,
"Application of modern technology to optimize switching of compensated lines", CIGRE A3_101_2010, 2010