21, rue d’artois, f-75008 paris a3-103 cigre 2012 http ... severe specifications of substation...
TRANSCRIPT
Prospective Single and Multi-Phase Short-Circuit Current Levels in the Dutch Transmission, Sub-Transmission and Distribution Grids
A.L.J. JANSSEN1 , M. v. Riet R.P.P. SMEETS J. KANTERS, W.F. v.d.AKKER Liander KEMA TIC G.L.P. AANHAANEN The Netherlands TenneT TSO
SUMMARY As elsewhere in the world, also in the Netherlands utilities face an increase in the actual and future short-circuit current levels at all voltages. This development is provoked by the required increase in transmission capacity as well as the concentration of power generation capacity. Large electricity production sites are moved to peripheral locations, thus overstressing the local transmission networks with respect to both the transmission capacity and the short-circuit power withstand capability. Dispersed power generation facilities, like windmills and co-generation plants for greenhouses, tend to appear in the same (optimal) neighborhoods, thus overstressing the local distribution and sub-transmission networks. In the paper the development of short-circuit currents in the Dutch 400 kV-grid is illustrated. In addition, some particular aspects of the short-circuit currents will be addressed: three-phase and single phase fault currents, DC-time constants, peak values, contributions from transformers and distributed generators. Practical calculation guidelines on the actual short-circuit contribution from generators will be given. An example of design of a 400 kV station extension, emphasizing short-circuit current considerations is evaluated. National and international trends are addressed. More severe specifications of substation equipment lead to adapted designs and adequate testing procedures. Examples from testing of the consequences of short-circuit currents and fault arcs of 80 kA and above are highlighted. KEYWORDS Short-circuit, short-circuit current, distributed generation, high-voltage, power transmission and distribution, circuit-breaker, testing, substation, standardization 1. INTRODUCTION The political and societal impetus of both sustainable energy and integrated markets, lead to more electricity, more power generation capacity, more interconnections between areas and within areas,
21, rue d’Artois, F-75008 PARIS A3-103 CIGRE 2012 http : //www.cigre.org
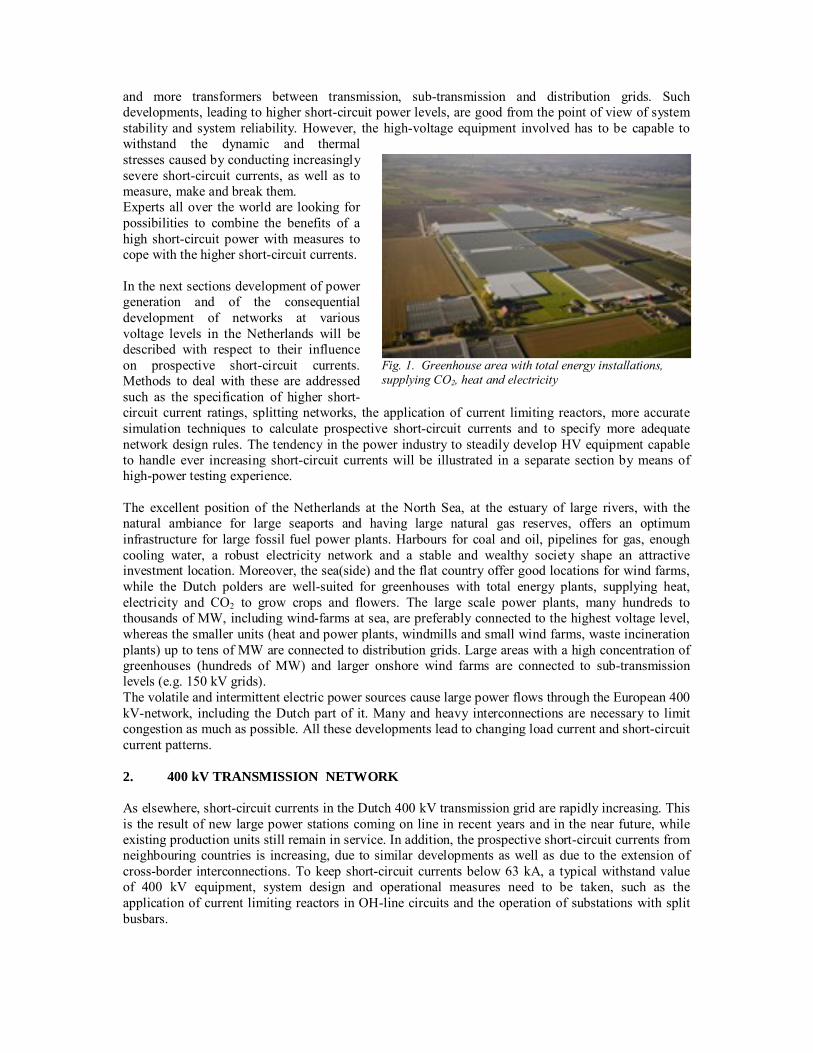
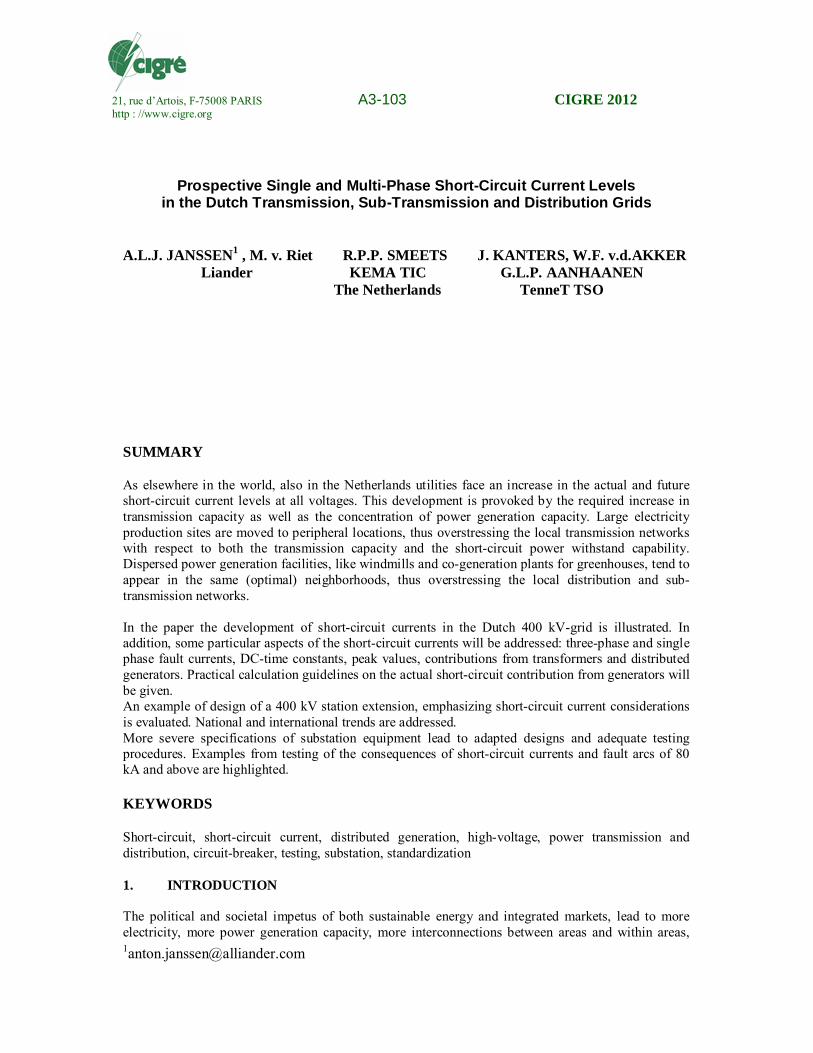
Fig. 1. Greenhouse area with total energy installations, supplying CO2, heat and electricity
and more transformers between transmission, sub-transmission and distribution grids. Such developments, leading to higher short-circuit power levels, are good from the point of view of system stability and system reliability. However, the high-voltage equipment involved has to be capable to withstand the dynamic and thermal stresses caused by conducting increasingly severe short-circuit currents, as well as to measure, make and break them. Experts all over the world are looking for possibilities to combine the benefits of a high short-circuit power with measures to cope with the higher short-circuit currents. In the next sections development of power generation and of the consequential development of networks at various voltage levels in the Netherlands will be described with respect to their influence on prospective short-circuit currents. Methods to deal with these are addressed such as the specification of higher short-circuit current ratings, splitting networks, the application of current limiting reactors, more accurate simulation techniques to calculate prospective short-circuit currents and to specify more adequate network design rules. The tendency in the power industry to steadily develop HV equipment capable to handle ever increasing short-circuit currents will be illustrated in a separate section by means of high-power testing experience. The excellent position of the Netherlands at the North Sea, at the estuary of large rivers, with the natural ambiance for large seaports and having large natural gas reserves, offers an optimum infrastructure for large fossil fuel power plants. Harbours for coal and oil, pipelines for gas, enough cooling water, a robust electricity network and a stable and wealthy society shape an attractive investment location. Moreover, the sea(side) and the flat country offer good locations for wind farms, while the Dutch polders are well-suited for greenhouses with total energy plants, supplying heat, electricity and CO2 to grow crops and flowers. The large scale power plants, many hundreds to thousands of MW, including wind-farms at sea, are preferably connected to the highest voltage level, whereas the smaller units (heat and power plants, windmills and small wind farms, waste incineration plants) up to tens of MW are connected to distribution grids. Large areas with a high concentration of greenhouses (hundreds of MW) and larger onshore wind farms are connected to sub-transmission levels (e.g. 150 kV grids). The volatile and intermittent electric power sources cause large power flows through the European 400 kV-network, including the Dutch part of it. Many and heavy interconnections are necessary to limit congestion as much as possible. All these developments lead to changing load current and short-circuit current patterns. 2. 400 kV TRANSMISSION NETWORK As elsewhere, short-circuit currents in the Dutch 400 kV transmission grid are rapidly increasing. This is the result of new large power stations coming on line in recent years and in the near future, while existing production units still remain in service. In addition, the prospective short-circuit currents from neighbouring countries is increasing, due to similar developments as well as due to the extension of cross-border interconnections. To keep short-circuit currents below 63 kA, a typical withstand value of 400 kV equipment, system design and operational measures need to be taken, such as the application of current limiting reactors in OH-line circuits and the operation of substations with split busbars.
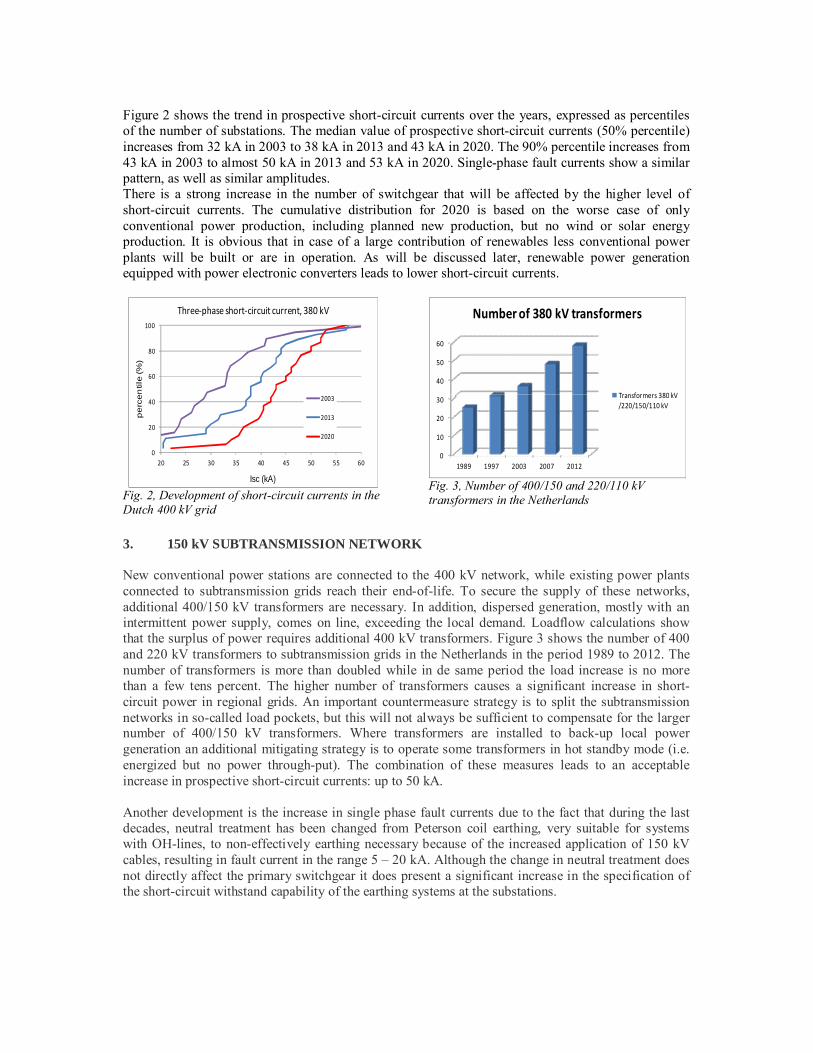
Figure 2 shows the trend in prospective short-circuit currents over the years, expressed as percentiles of the number of substations. The median value of prospective short-circuit currents (50% percentile) increases from 32 kA in 2003 to 38 kA in 2013 and 43 kA in 2020. The 90% percentile increases from 43 kA in 2003 to almost 50 kA in 2013 and 53 kA in 2020. Single-phase fault currents show a similar pattern, as well as similar amplitudes. There is a strong increase in the number of switchgear that will be affected by the higher level of short-circuit currents. The cumulative distribution for 2020 is based on the worse case of only conventional power production, including planned new production, but no wind or solar energy production. It is obvious that in case of a large contribution of renewables less conventional power plants will be built or are in operation. As will be discussed later, renewable power generation equipped with power electronic converters leads to lower short-circuit currents.
Fig. 2, Development of short-circuit currents in the Dutch 400 kV grid
Fig. 3, Number of 400/150 and 220/110 kV transformers in the Netherlands
3. 150 kV SUBTRANSMISSION NETWORK New conventional power stations are connected to the 400 kV network, while existing power plants connected to subtransmission grids reach their end-of-life. To secure the supply of these networks, additional 400/150 kV transformers are necessary. In addition, dispersed generation, mostly with an intermittent power supply, comes on line, exceeding the local demand. Loadflow calculations show that the surplus of power requires additional 400 kV transformers. Figure 3 shows the number of 400 and 220 kV transformers to subtransmission grids in the Netherlands in the period 1989 to 2012. The number of transformers is more than doubled while in de same period the load increase is no more than a few tens percent. The higher number of transformers causes a significant increase in short-circuit power in regional grids. An important countermeasure strategy is to split the subtransmission networks in so-called load pockets, but this will not always be sufficient to compensate for the larger number of 400/150 kV transformers. Where transformers are installed to back-up local power generation an additional mitigating strategy is to operate some transformers in hot standby mode (i.e. energized but no power through-put). The combination of these measures leads to an acceptable increase in prospective short-circuit currents: up to 50 kA. Another development is the increase in single phase fault currents due to the fact that during the last decades, neutral treatment has been changed from Peterson coil earthing, very suitable for systems with OH-lines, to non-effectively earthing necessary because of the increased application of 150 kV cables, resulting in fault current in the range 5 – 20 kA. Although the change in neutral treatment does not directly affect the primary switchgear it does present a significant increase in the specification of the short-circuit withstand capability of the earthing systems at the substations.
0
20
40
60
80
100
20 25 30 35 40 45 50 55 60
pe
rcen
tile (%
)
Isc (kA)
Threephase shortcircuit current, 380 kV
2003
2013
2020
0
10
20
30
40
50
60
1989 1997 2003 2007 2012
Number of 380 kV transformers
Transformers 380 kV
/220/150/110 kV
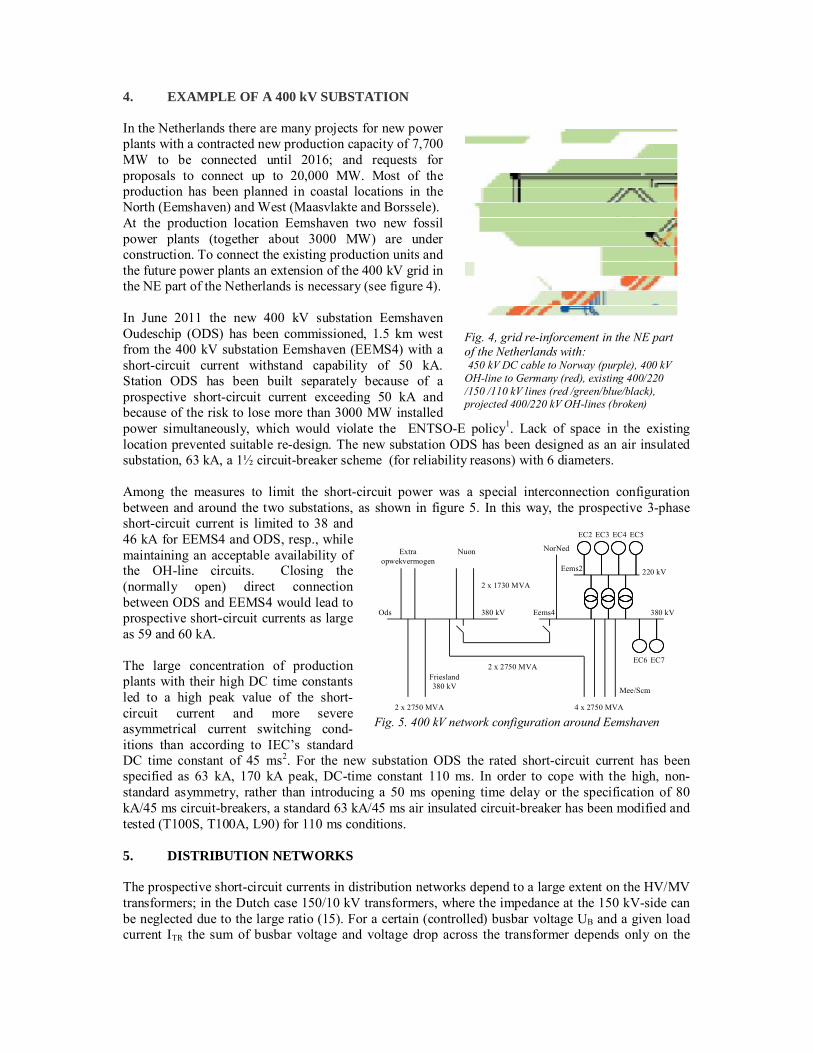
Fig. 4, grid re-inforcement in the NE part of the Netherlands with: 450 kV DC cable to Norway (purple), 400 kV OH-line to Germany (red), existing 400/220 /150 /110 kV lines (red /green/blue/black), projected 400/220 kV OH-lines (broken)
Fig. 5. 400 kV network configuration around Eemshaven
NuonExtraopwekvermogen
Friesland380 kV
2 x 1730 MVA
2 x 2750 MVA
4 x 2750 MVA
EC6 EC7
EC2 EC3 EC4 EC5
220 kV
380 kV
NorNed
2 x 2750 MVA
Eems4
Eems2
380 kVOds
Mee/Scm
4. EXAMPLE OF A 400 kV SUBSTATION In the Netherlands there are many projects for new power plants with a contracted new production capacity of 7,700 MW to be connected until 2016; and requests for proposals to connect up to 20,000 MW. Most of the production has been planned in coastal locations in the North (Eemshaven) and West (Maasvlakte and Borssele). At the production location Eemshaven two new fossil power plants (together about 3000 MW) are under construction. To connect the existing production units and the future power plants an extension of the 400 kV grid in the NE part of the Netherlands is necessary (see figure 4). In June 2011 the new 400 kV substation Eemshaven Oudeschip (ODS) has been commissioned, 1.5 km west from the 400 kV substation Eemshaven (EEMS4) with a short-circuit current withstand capability of 50 kA. Station ODS has been built separately because of a prospective short-circuit current exceeding 50 kA and because of the risk to lose more than 3000 MW installed power simultaneously, which would violate the ENTSO-E policy1. Lack of space in the existing location prevented suitable re-design. The new substation ODS has been designed as an air insulated substation, 63 kA, a 1½ circuit-breaker scheme (for reliability reasons) with 6 diameters. Among the measures to limit the short-circuit power was a special interconnection configuration between and around the two substations, as shown in figure 5. In this way, the prospective 3-phase short-circuit current is limited to 38 and 46 kA for EEMS4 and ODS, resp., while maintaining an acceptable availability of the OH-line circuits. Closing the (normally open) direct connection between ODS and EEMS4 would lead to prospective short-circuit currents as large as 59 and 60 kA. The large concentration of production plants with their high DC time constants led to a high peak value of the short-circuit current and more severe asymmetrical current switching cond-itions than according to IEC’s standard DC time constant of 45 ms2. For the new substation ODS the rated short-circuit current has been specified as 63 kA, 170 kA peak, DC-time constant 110 ms. In order to cope with the high, non-standard asymmetry, rather than introducing a 50 ms opening time delay or the specification of 80 kA/45 ms circuit-breakers, a standard 63 kA/45 ms air insulated circuit-breaker has been modified and tested (T100S, T100A, L90) for 110 ms conditions. 5. DISTRIBUTION NETWORKS The prospective short-circuit currents in distribution networks depend to a large extent on the HV/MV transformers; in the Dutch case 150/10 kV transformers, where the impedance at the 150 kV-side can be neglected due to the large ratio (15). For a certain (controlled) busbar voltage UB and a given load current ITR the sum of busbar voltage and voltage drop across the transformer depends only on the
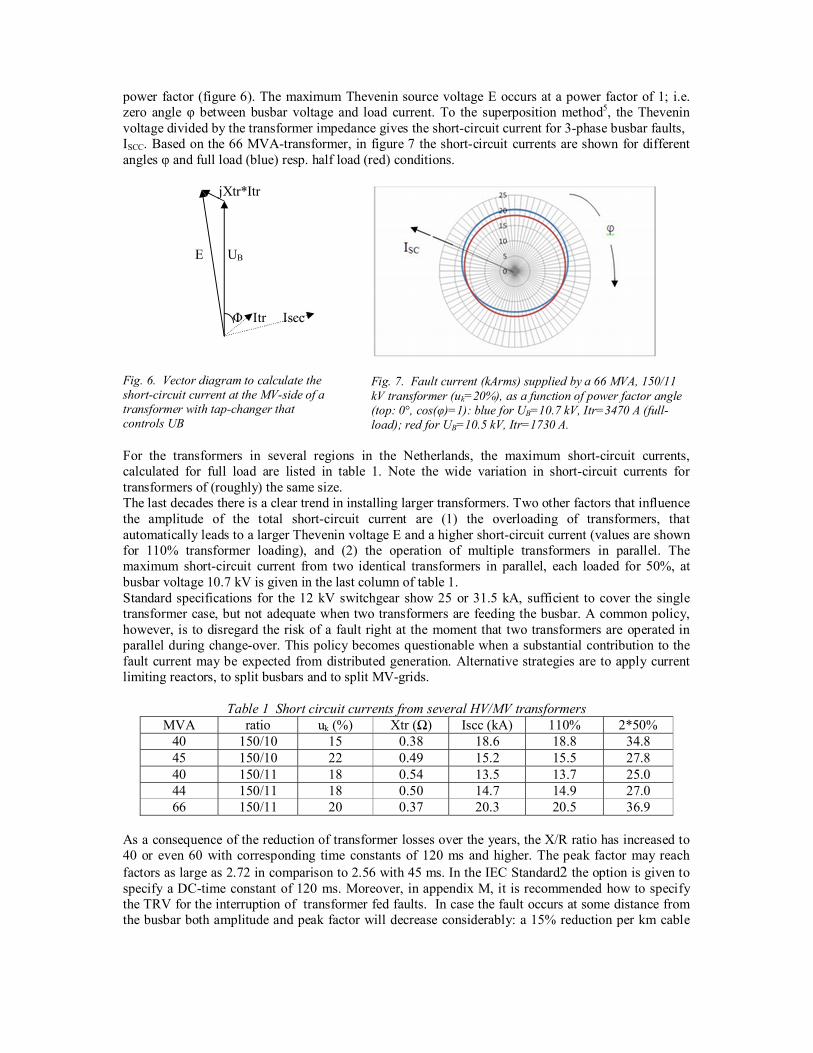
power factor (figure 6). The maximum Thevenin source voltage E occurs at a power factor of 1; i.e. zero angle φ between busbar voltage and load current. To the superposition method5, the Thevenin voltage divided by the transformer impedance gives the short-circuit current for 3-phase busbar faults, ISCC. Based on the 66 MVA-transformer, in figure 7 the short-circuit currents are shown for different angles φ and full load (blue) resp. half load (red) conditions. jXtr*Itr E UB Φ Itr Iscc Fig. 6. Vector diagram to calculate the short-circuit current at the MV-side of a transformer with tap-changer that controls UB
Fig. 7. Fault current (kArms) supplied by a 66 MVA, 150/11 kV transformer (uk=20%), as a function of power factor angle (top: 0°, cos(φ)=1): blue for UB=10.7 kV, Itr=3470 A (full-load); red for UB=10.5 kV, Itr=1730 A.
For the transformers in several regions in the Netherlands, the maximum short-circuit currents, calculated for full load are listed in table 1. Note the wide variation in short-circuit currents for transformers of (roughly) the same size. The last decades there is a clear trend in installing larger transformers. Two other factors that influence the amplitude of the total short-circuit current are (1) the overloading of transformers, that automatically leads to a larger Thevenin voltage E and a higher short-circuit current (values are shown for 110% transformer loading), and (2) the operation of multiple transformers in parallel. The maximum short-circuit current from two identical transformers in parallel, each loaded for 50%, at busbar voltage 10.7 kV is given in the last column of table 1. Standard specifications for the 12 kV switchgear show 25 or 31.5 kA, sufficient to cover the single transformer case, but not adequate when two transformers are feeding the busbar. A common policy, however, is to disregard the risk of a fault right at the moment that two transformers are operated in parallel during change-over. This policy becomes questionable when a substantial contribution to the fault current may be expected from distributed generation. Alternative strategies are to apply current limiting reactors, to split busbars and to split MV-grids.
Table 1 Short circuit currents from several HV/MV transformers MVA ratio uk (%) Xtr (Ω) Iscc (kA) 110% 2*50%
40 150/10 15 0.38 18.6 18.8 34.8 45 150/10 22 0.49 15.2 15.5 27.8 40 150/11 18 0.54 13.5 13.7 25.0 44 150/11 18 0.50 14.7 14.9 27.0 66 150/11 20 0.37 20.3 20.5 36.9
As a consequence of the reduction of transformer losses over the years, the X/R ratio has increased to 40 or even 60 with corresponding time constants of 120 ms and higher. The peak factor may reach factors as large as 2.72 in comparison to 2.56 with 45 ms. In the IEC Standard2 the option is given to specify a DC-time constant of 120 ms. Moreover, in appendix M, it is recommended how to specify the TRV for the interruption of transformer fed faults. In case the fault occurs at some distance from the busbar both amplitude and peak factor will decrease considerably: a 15% reduction per km cable
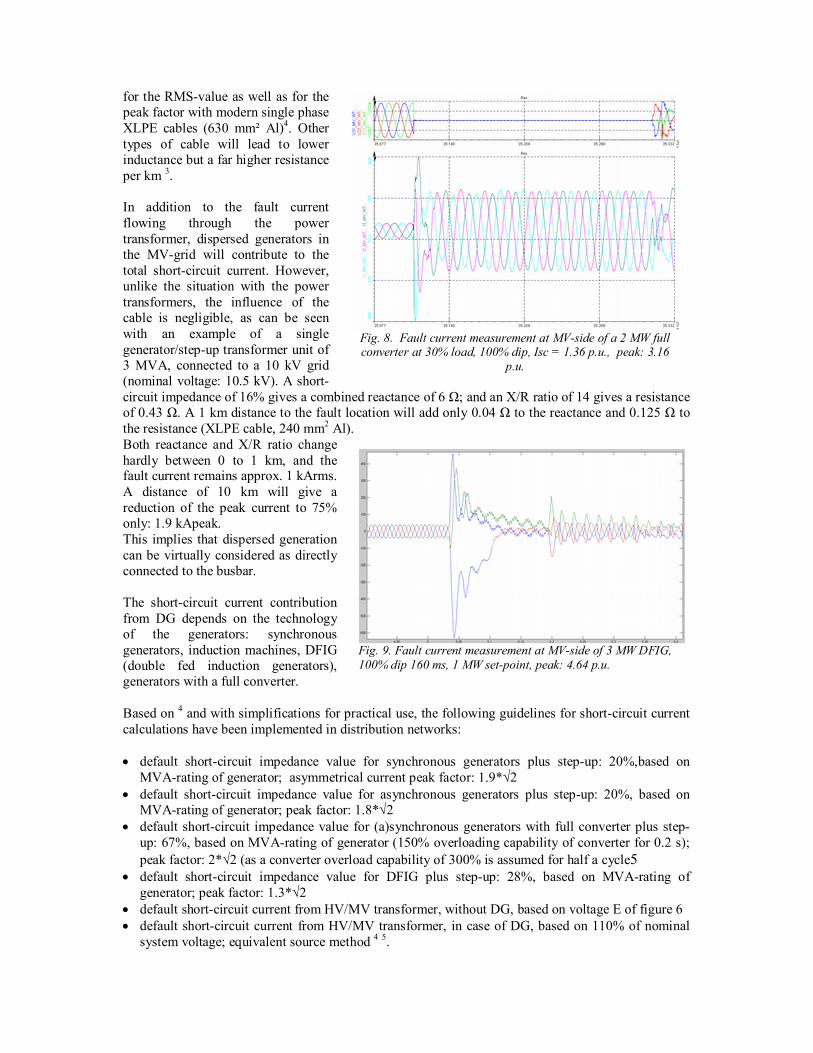
Fig. 8. Fault current measurement at MV-side of a 2 MW full converter at 30% load, 100% dip, Isc = 1.36 p.u., peak: 3.16
p.u.
Fig. 9. Fault current measurement at MV-side of 3 MW DFIG, 100% dip 160 ms, 1 MW set-point, peak: 4.64 p.u.
for the RMS-value as well as for the peak factor with modern single phase XLPE cables (630 mm² Al)4. Other types of cable will lead to lower inductance but a far higher resistance per km 3. In addition to the fault current flowing through the power transformer, dispersed generators in the MV-grid will contribute to the total short-circuit current. However, unlike the situation with the power transformers, the influence of the cable is negligible, as can be seen with an example of a single generator/step-up transformer unit of 3 MVA, connected to a 10 kV grid (nominal voltage: 10.5 kV). A short-circuit impedance of 16% gives a combined reactance of 6 Ω; and an X/R ratio of 14 gives a resistance of 0.43 Ω. A 1 km distance to the fault location will add only 0.04 Ω to the reactance and 0.125 Ω to the resistance (XLPE cable, 240 mm2 Al). Both reactance and X/R ratio change hardly between 0 to 1 km, and the fault current remains approx. 1 kArms. A distance of 10 km will give a reduction of the peak current to 75% only: 1.9 kApeak. This implies that dispersed generation can be virtually considered as directly connected to the busbar. The short-circuit current contribution from DG depends on the technology of the generators: synchronous generators, induction machines, DFIG (double fed induction generators), generators with a full converter. Based on 4 and with simplifications for practical use, the following guidelines for short-circuit current calculations have been implemented in distribution networks: default short-circuit impedance value for synchronous generators plus step-up: 20%,based on
MVA-rating of generator; asymmetrical current peak factor: 1.9*√2 default short-circuit impedance value for asynchronous generators plus step-up: 20%, based on
MVA-rating of generator; peak factor: 1.8*√2 default short-circuit impedance value for (a)synchronous generators with full converter plus step-
up: 67%, based on MVA-rating of generator (150% overloading capability of converter for 0.2 s); peak factor: 2*√2 (as a converter overload capability of 300% is assumed for half a cycle5
default short-circuit impedance value for DFIG plus step-up: 28%, based on MVA-rating of generator; peak factor: 1.3*√2
default short-circuit current from HV/MV transformer, without DG, based on voltage E of figure 6 default short-circuit current from HV/MV transformer, in case of DG, based on 110% of nominal
system voltage; equivalent source method 4 5.
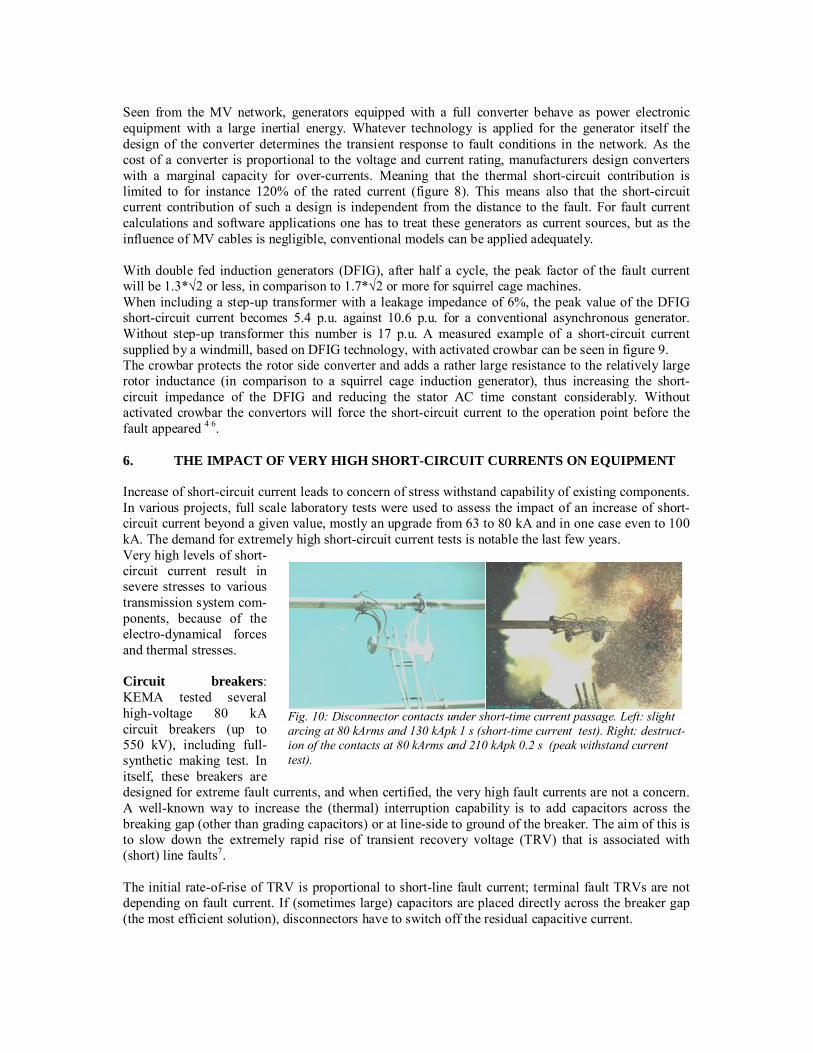
Fig. 10: Disconnector contacts under short-time current passage. Left: slight arcing at 80 kArms and 130 kApk 1 s (short-time current test). Right: destruct-ion of the contacts at 80 kArms and 210 kApk 0.2 s (peak withstand current test).
Seen from the MV network, generators equipped with a full converter behave as power electronic equipment with a large inertial energy. Whatever technology is applied for the generator itself the design of the converter determines the transient response to fault conditions in the network. As the cost of a converter is proportional to the voltage and current rating, manufacturers design converters with a marginal capacity for over-currents. Meaning that the thermal short-circuit contribution is limited to for instance 120% of the rated current (figure 8). This means also that the short-circuit current contribution of such a design is independent from the distance to the fault. For fault current calculations and software applications one has to treat these generators as current sources, but as the influence of MV cables is negligible, conventional models can be applied adequately. With double fed induction generators (DFIG), after half a cycle, the peak factor of the fault current will be 1.3*√2 or less, in comparison to 1.7*√2 or more for squirrel cage machines. When including a step-up transformer with a leakage impedance of 6%, the peak value of the DFIG short-circuit current becomes 5.4 p.u. against 10.6 p.u. for a conventional asynchronous generator. Without step-up transformer this number is 17 p.u. A measured example of a short-circuit current supplied by a windmill, based on DFIG technology, with activated crowbar can be seen in figure 9. The crowbar protects the rotor side converter and adds a rather large resistance to the relatively large rotor inductance (in comparison to a squirrel cage induction generator), thus increasing the short-circuit impedance of the DFIG and reducing the stator AC time constant considerably. Without activated crowbar the convertors will force the short-circuit current to the operation point before the fault appeared 4 6. 6. THE IMPACT OF VERY HIGH SHORT-CIRCUIT CURRENTS ON EQUIPMENT Increase of short-circuit current leads to concern of stress withstand capability of existing components. In various projects, full scale laboratory tests were used to assess the impact of an increase of short-circuit current beyond a given value, mostly an upgrade from 63 to 80 kA and in one case even to 100 kA. The demand for extremely high short-circuit current tests is notable the last few years. Very high levels of short-circuit current result in severe stresses to various transmission system com-ponents, because of the electro-dynamical forces and thermal stresses. Circuit breakers: KEMA tested several high-voltage 80 kA circuit breakers (up to 550 kV), including full-synthetic making test. In itself, these breakers are designed for extreme fault currents, and when certified, the very high fault currents are not a concern. A well-known way to increase the (thermal) interruption capability is to add capacitors across the breaking gap (other than grading capacitors) or at line-side to ground of the breaker. The aim of this is to slow down the extremely rapid rise of transient recovery voltage (TRV) that is associated with (short) line faults7. The initial rate-of-rise of TRV is proportional to short-line fault current; terminal fault TRVs are not depending on fault current. If (sometimes large) capacitors are placed directly across the breaker gap (the most efficient solution), disconnectors have to switch off the residual capacitive current.

Fig. 12: 50 kA Power arc across string insulator, initiated by a a small fuse wire. Left: Arc is burning between arcing horns. Right: Lower arc foot point formed on the OH line
Fig. 11: Initial 80 kA power arc at arrester
Fig. 13: Bundle contraction and expulsion of line spacer due to high short-circuit current in a test (50 kA, 0.3s)
In various situations, circuit breaker contacts must remain closed under high-current passage. Depending on the contact geometry, significant contact forces may be necessary to prevent contacts from blow-off during current passage. This applies especially to butt contacts, as applied in vacuum interrupters. Contact forces over 10 kN are necessary for peak current of 200 kA8. Nevertheless, vacuum interrupters have been reported able to carry 10 kA continuously and to interrupt 100 kA9. The highest interruption current has to be faced by generator circuit breakers; they have demonstrated to be able to interrupt current well above 200 kA 10. Disconnectors: Disconnector contacts must remain closed under the passage of even the maximum short-circuit current. This is verified in a peak current withstand test (requirement of full asymmetrical peak current, duration of test typically 0.2 s) and short-time current test (no asymmetrical peak, standard duration 1 s), as specified in IEC 62271-10211. Due to the very high electro-dynamic forces, contacts naturally tend to repel, unless a special design is applied to use the forces to even contract more tightly. Especially for pantograph disconnectors, the design must be such that the contraction does not lead to permanent deformation. Since the electro-dynamical force is proportional to the square of the momentary current (in a single phase case) the correct representation of the asymmetrical peak is essential in the peak current tests. Arcing must be avoided, as this increases the contact resistance and may lead to welding of the contacts. Thermal withstand is verified in the short-time current test. In figure 10, a disconnector contact systems under the passage of high short-circuit current is shown. Note that most current flows through the left part of the contact due to (slight!) difference in impedance between both contact sections. Tests can be performed on single phase disconnectors, but the electrical environment should be three-phase, in order to create electro-dynamical conditions similar to a substation. Arresters: When surge arresters fail, the resultant fault arc must not lead to explosion of the arrester housing and body. Pressure relief tests have been defined in which a fault is initiated inside the arrester housing (either by a fuse wire or by over voltage). By design the fault arc must be expelled outward immediately in the very initial phase of the fault in order to avoid explosion of the body12. This process is visualized in figure 11, showing the initial arc development during an 80 kA power arc test on a polymer surge arrester.
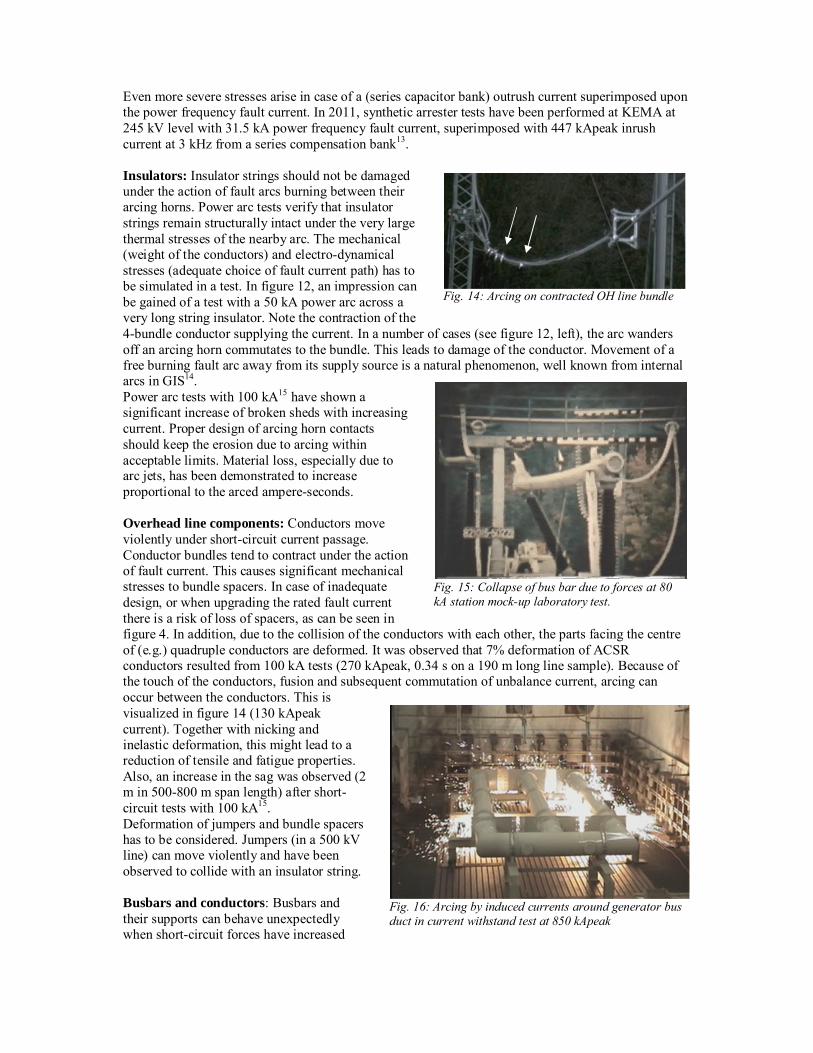
Fig. 14: Arcing on contracted OH line bundle
Fig. 15: Collapse of bus bar due to forces at 80 kA station mock-up laboratory test.
Fig. 16: Arcing by induced currents around generator bus duct in current withstand test at 850 kApeak
Even more severe stresses arise in case of a (series capacitor bank) outrush current superimposed upon the power frequency fault current. In 2011, synthetic arrester tests have been performed at KEMA at 245 kV level with 31.5 kA power frequency fault current, superimposed with 447 kApeak inrush current at 3 kHz from a series compensation bank13. Insulators: Insulator strings should not be damaged under the action of fault arcs burning between their arcing horns. Power arc tests verify that insulator strings remain structurally intact under the very large thermal stresses of the nearby arc. The mechanical (weight of the conductors) and electro-dynamical stresses (adequate choice of fault current path) has to be simulated in a test. In figure 12, an impression can be gained of a test with a 50 kA power arc across a very long string insulator. Note the contraction of the 4-bundle conductor supplying the current. In a number of cases (see figure 12, left), the arc wanders off an arcing horn commutates to the bundle. This leads to damage of the conductor. Movement of a free burning fault arc away from its supply source is a natural phenomenon, well known from internal arcs in GIS14. Power arc tests with 100 kA15 have shown a significant increase of broken sheds with increasing current. Proper design of arcing horn contacts should keep the erosion due to arcing within acceptable limits. Material loss, especially due to arc jets, has been demonstrated to increase proportional to the arced ampere-seconds. Overhead line components: Conductors move violently under short-circuit current passage. Conductor bundles tend to contract under the action of fault current. This causes significant mechanical stresses to bundle spacers. In case of inadequate design, or when upgrading the rated fault current there is a risk of loss of spacers, as can be seen in figure 4. In addition, due to the collision of the conductors with each other, the parts facing the centre of (e.g.) quadruple conductors are deformed. It was observed that 7% deformation of ACSR conductors resulted from 100 kA tests (270 kApeak, 0.34 s on a 190 m long line sample). Because of the touch of the conductors, fusion and subsequent commutation of unbalance current, arcing can occur between the conductors. This is visualized in figure 14 (130 kApeak current). Together with nicking and inelastic deformation, this might lead to a reduction of tensile and fatigue properties. Also, an increase in the sag was observed (2 m in 500-800 m span length) after short-circuit tests with 100 kA15. Deformation of jumpers and bundle spacers has to be considered. Jumpers (in a 500 kV line) can move violently and have been observed to collide with an insulator string. Busbars and conductors: Busbars and their supports can behave unexpectedly when short-circuit forces have increased
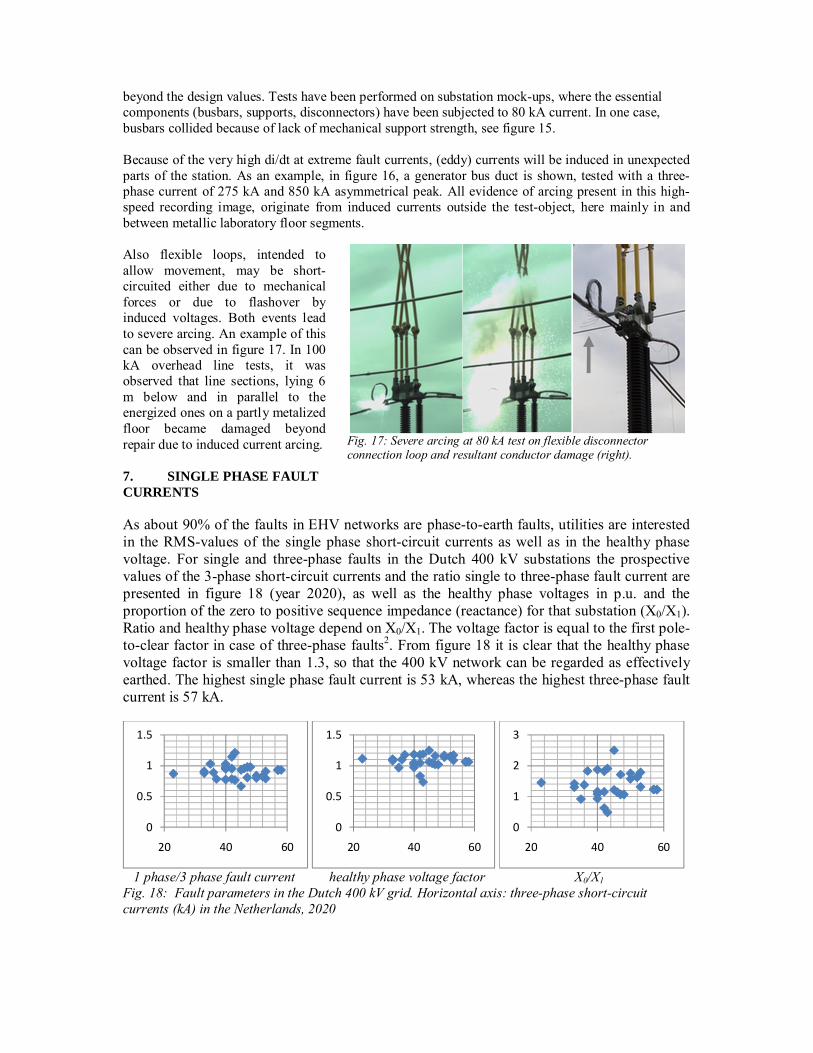
Fig. 17: Severe arcing at 80 kA test on flexible disconnector connection loop and resultant conductor damage (right).
beyond the design values. Tests have been performed on substation mock-ups, where the essential components (busbars, supports, disconnectors) have been subjected to 80 kA current. In one case, busbars collided because of lack of mechanical support strength, see figure 15. Because of the very high di/dt at extreme fault currents, (eddy) currents will be induced in unexpected parts of the station. As an example, in figure 16, a generator bus duct is shown, tested with a three-phase current of 275 kA and 850 kA asymmetrical peak. All evidence of arcing present in this high-speed recording image, originate from induced currents outside the test-object, here mainly in and between metallic laboratory floor segments. Also flexible loops, intended to allow movement, may be short-circuited either due to mechanical forces or due to flashover by induced voltages. Both events lead to severe arcing. An example of this can be observed in figure 17. In 100 kA overhead line tests, it was observed that line sections, lying 6 m below and in parallel to the energized ones on a partly metalized floor became damaged beyond repair due to induced current arcing. 7. SINGLE PHASE FAULT CURRENTS As about 90% of the faults in EHV networks are phase-to-earth faults, utilities are interested in the RMS-values of the single phase short-circuit currents as well as in the healthy phase voltage. For single and three-phase faults in the Dutch 400 kV substations the prospective values of the 3-phase short-circuit currents and the ratio single to three-phase fault current are presented in figure 18 (year 2020), as well as the healthy phase voltages in p.u. and the proportion of the zero to positive sequence impedance (reactance) for that substation (X0/X1). Ratio and healthy phase voltage depend on X0/X1. The voltage factor is equal to the first pole-to-clear factor in case of three-phase faults2. From figure 18 it is clear that the healthy phase voltage factor is smaller than 1.3, so that the 400 kV network can be regarded as effectively earthed. The highest single phase fault current is 53 kA, whereas the highest three-phase fault current is 57 kA.
1 phase/3 phase fault current healthy phase voltage factor X0/X1 Fig. 18: Fault parameters in the Dutch 400 kV grid. Horizontal axis: three-phase short-circuit currents (kA) in the Netherlands, 2020
0
0.5
1
1.5
20 40 60
0
0.5
1
1.5
20 40 60
0
1
2
3
20 40 60
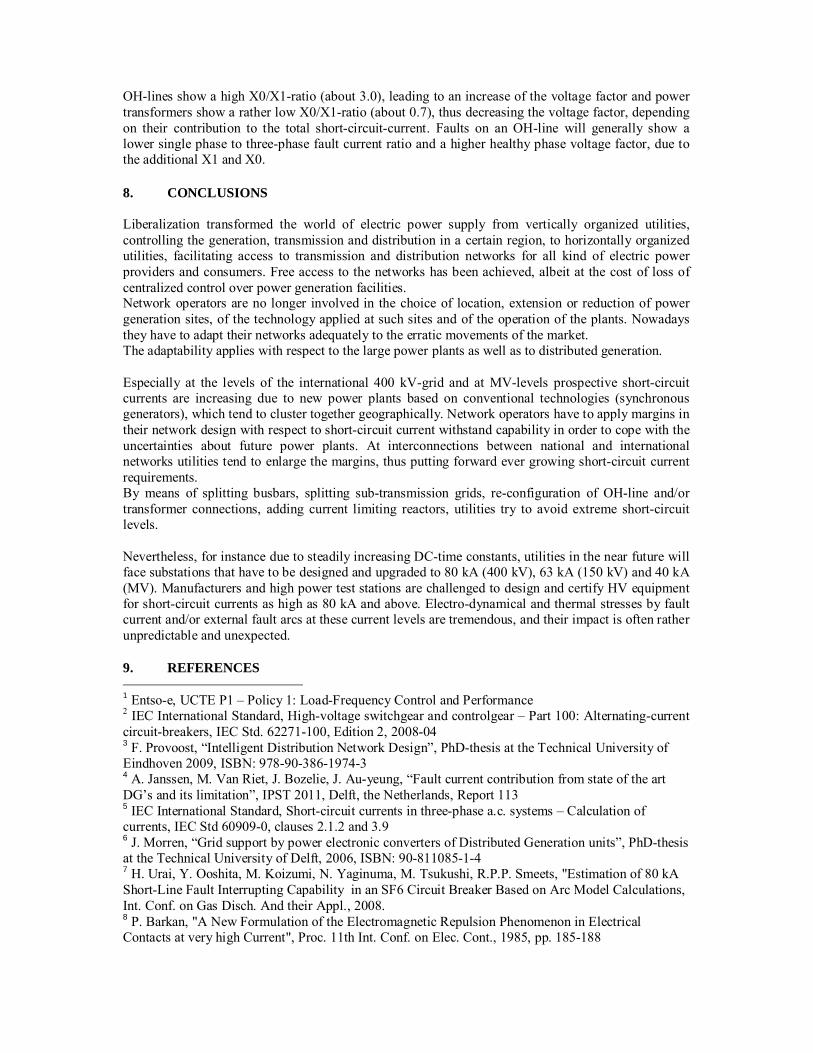
OH-lines show a high X0/X1-ratio (about 3.0), leading to an increase of the voltage factor and power transformers show a rather low X0/X1-ratio (about 0.7), thus decreasing the voltage factor, depending on their contribution to the total short-circuit-current. Faults on an OH-line will generally show a lower single phase to three-phase fault current ratio and a higher healthy phase voltage factor, due to the additional X1 and X0. 8. CONCLUSIONS Liberalization transformed the world of electric power supply from vertically organized utilities, controlling the generation, transmission and distribution in a certain region, to horizontally organized utilities, facilitating access to transmission and distribution networks for all kind of electric power providers and consumers. Free access to the networks has been achieved, albeit at the cost of loss of centralized control over power generation facilities. Network operators are no longer involved in the choice of location, extension or reduction of power generation sites, of the technology applied at such sites and of the operation of the plants. Nowadays they have to adapt their networks adequately to the erratic movements of the market. The adaptability applies with respect to the large power plants as well as to distributed generation. Especially at the levels of the international 400 kV-grid and at MV-levels prospective short-circuit currents are increasing due to new power plants based on conventional technologies (synchronous generators), which tend to cluster together geographically. Network operators have to apply margins in their network design with respect to short-circuit current withstand capability in order to cope with the uncertainties about future power plants. At interconnections between national and international networks utilities tend to enlarge the margins, thus putting forward ever growing short-circuit current requirements. By means of splitting busbars, splitting sub-transmission grids, re-configuration of OH-line and/or transformer connections, adding current limiting reactors, utilities try to avoid extreme short-circuit levels. Nevertheless, for instance due to steadily increasing DC-time constants, utilities in the near future will face substations that have to be designed and upgraded to 80 kA (400 kV), 63 kA (150 kV) and 40 kA (MV). Manufacturers and high power test stations are challenged to design and certify HV equipment for short-circuit currents as high as 80 kA and above. Electro-dynamical and thermal stresses by fault current and/or external fault arcs at these current levels are tremendous, and their impact is often rather unpredictable and unexpected. 9. REFERENCES 1 Entso-e, UCTE P1 – Policy 1: Load-Frequency Control and Performance 2 IEC International Standard, High-voltage switchgear and controlgear – Part 100: Alternating-current circuit-breakers, IEC Std. 62271-100, Edition 2, 2008-04 3 F. Provoost, “Intelligent Distribution Network Design”, PhD-thesis at the Technical University of Eindhoven 2009, ISBN: 978-90-386-1974-3 4 A. Janssen, M. Van Riet, J. Bozelie, J. Au-yeung, “Fault current contribution from state of the art DG’s and its limitation”, IPST 2011, Delft, the Netherlands, Report 113 5 IEC International Standard, Short-circuit currents in three-phase a.c. systems – Calculation of currents, IEC Std 60909-0, clauses 2.1.2 and 3.9 6 J. Morren, “Grid support by power electronic converters of Distributed Generation units”, PhD-thesis at the Technical University of Delft, 2006, ISBN: 90-811085-1-4 7 H. Urai, Y. Ooshita, M. Koizumi, N. Yaginuma, M. Tsukushi, R.P.P. Smeets, "Estimation of 80 kA Short-Line Fault Interrupting Capability in an SF6 Circuit Breaker Based on Arc Model Calculations, Int. Conf. on Gas Disch. And their Appl., 2008. 8 P. Barkan, "A New Formulation of the Electromagnetic Repulsion Phenomenon in Electrical Contacts at very high Current", Proc. 11th Int. Conf. on Elec. Cont., 1985, pp. 185-188
9 S.Yanabu, T.Tsutsumi, K. Yokokura, E. Kaneko, "Recent Developments in High-Power Vacuum Circuit Breakers", IEEE Trans. Plasma Sci., Vol.17 no.5, (1989) pp. 717-723 10 R.P.P. Smeets, H.D. Barts, L. Zehnder, "Extreme Stresses of Generator Circuit Breakers", CIGRE Conference 2006, paper A3-306 11 IEC 622710-102 International Standard, High-voltage switchgear and controlgear – Part 102, Alternating current disconnectors and earthing switches, (2001) 12 R.P.P. Smeets, H. Barts, W. van der Linden, L. Stenström, "Modern ZnO Surge Arresters under Short-Circuit Current Stresses: Test Experiences and Critical Review of the IEC Standard", CIGRE Conference 2004, paper A3-105 13 J.-F. Dubé, R. Goehler, T. Hanninen, R.P. McLaughlin, P. Riffon, M. Schubert, K. Stracevic, "New achievements in pressure relief tests for polymeric-housed varistors used on series compensated capacitor banks", (submitted for publication, IEEE Trans. On Pow. Del.) 14 W. Boeck, K. Krüger, "Arc Motion and Burn Through in GIS", IEEE Trans. on Pow. Del., Vol.7 No.1 (1992), pp.254-261 15 T. Yamada, K. Saito, S. Ito, Y. Nagata, R.P.P. Smeets, P. Knol, "Short-circuit Testing of Overhead Line Components up to 100 kA", CEPSI Conference, 1998, paper 42-11