2020 - lbc tank terminals
TRANSCRIPT
SUSTAINABILITY
REPORT
2020

INT
RO
DU
CT
ION
Storage of liquid bulk products is a business with
a long-term horizon. We build terminals that last
at least fifty years and forge long-term
partnerships with our customers to provide them
an infrastructure to develop the business with
their customers.
To be successful, our employees and contractors
develop a deep knowledge of the terminal
systems that we operate. We handle hazardous
products, and it is therefore imperative that we
have the highest operating standards and
business conduct to ensure that people at our
terminals and in neighboring communities can
rely on us for their safety. Operating these
systems requires knowledge, experience, and
diligence, which is why it is important to invest in
the development and retention of our key
employees.
Our shareholders invest pension premiums in
companies with the expectation that these
companies are still around and can support the
payment of pensions in 40 years’ time. They are
highly committed to making a positive impact
through responsible investment decisions. This is
reflected in their approach to ensure value
creation for all stakeholders by investing in
sustainable growth and contributing to long-term
social and environmental solutions. Therefore,
sustainable business practices are at the heart of
what we do at LBC.
We have been reporting KPIs on our health and
safety performance for many years. Two years
ago, we embarked on a journey to make our
internal reporting compliant with the standards
set through the Global Reporting Initiative (GRI)
reporting framework, which enables us to
benchmark LBC’s performance with other
companies. We also tested the relevance of the
KPIs we defined at LBC with the priorities of our
many stakeholders.
This report is our first GRI based Sustainability
Report. We regard this as a baseline to define
further improvement objectives. We are proud of
our performance so far. At the same time, we
continue to strive for positive developments that
contribute to a sustainable future for LBC and its
stakeholders.
2020 SUSTAINABILITY REPORT | 2

INTRODUCTION 2
SUSTAINABILITY HIGHLIGHTS 4
LBC AT A GLANCE 5
Terminal of the future 8
OUR APPROACH 10
Making impact as a responsible value creator 11
Leading CSR performance 11
Risk management and control 15
Reporting framework 17
Stakeholder engagement and
materiality assessment 18
Group performance overview 21
OUR PERFORMANCE 23
SOCIETAL 24
Process safety 24
Occupational health and safety 25
Talent attraction and retention 26
Community engagement and charity 28
ENVIRONMENTAL 31
Water, soil and groundwater pollution 31
VOC emissions 32
CO2 emissions and energy use 33
Waste 36
GOVERNANCE 37
Business ethics and integrity 37
Application of best practices 38
Customer focus 40
Sustainable procurement 41
Cybersecurity 42
LIST OF DEFINITIONS 43
GRI CONTENT INDEX 44
ABOUT THIS REPORT 47
CONTENTS
2020 SUSTAINABILITY REPORT | 3
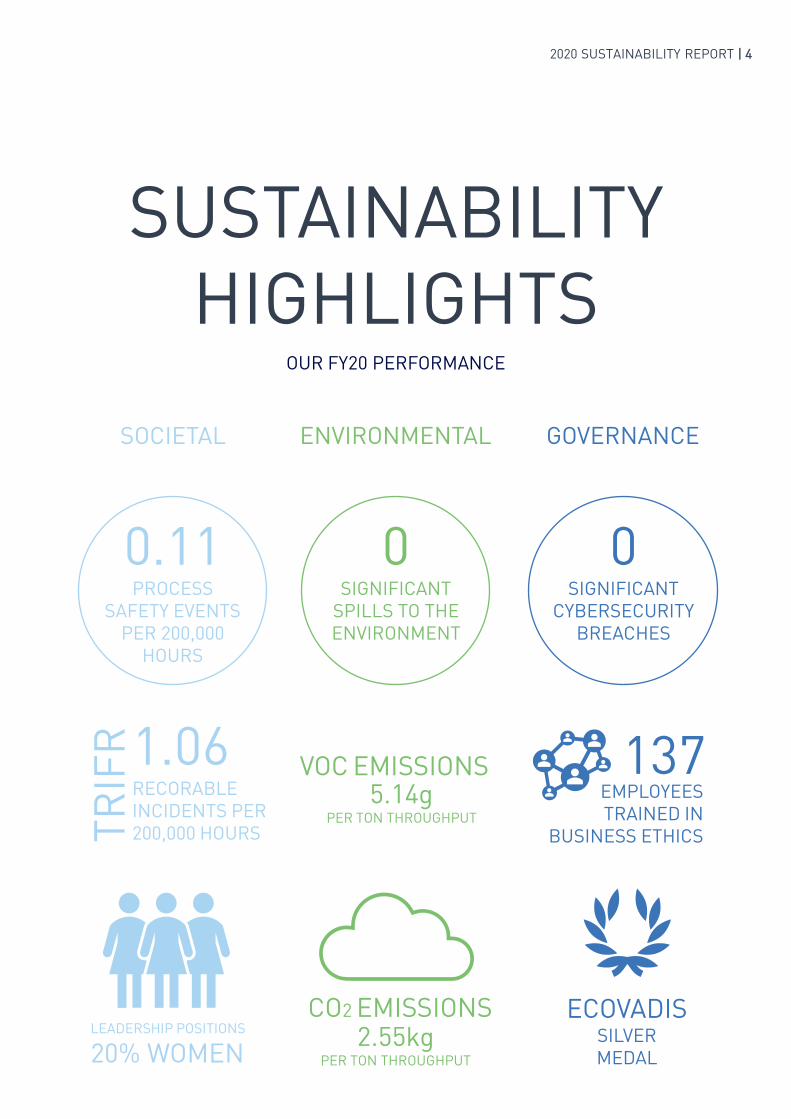
ECOVADISSILVER
MEDAL
SUSTAINABILITY
HIGHLIGHTSOUR FY20 PERFORMANCE
LEADERSHIP POSITIONS
20% WOMEN
1.06RECORABLE
INCIDENTS PER
200,000 HOURS TR
IFR
0.11PROCESS
SAFETY EVENTS
PER 200,000
HOURS
SOCIETAL
0SIGNIFICANT
SPILLS TO THE
ENVIRONMENT
0SIGNIFICANT
CYBERSECURITY
BREACHES
ENVIRONMENTAL GOVERNANCE
2.55kgPER TON THROUGHPUT
CO2 EMISSIONS
5.14gPER TON THROUGHPUT
VOC EMISSIONS 137EMPLOYEES
TRAINED IN
BUSINESS ETHICS
2020 SUSTAINABILITY REPORT | 4
LBC AT A GLANCE
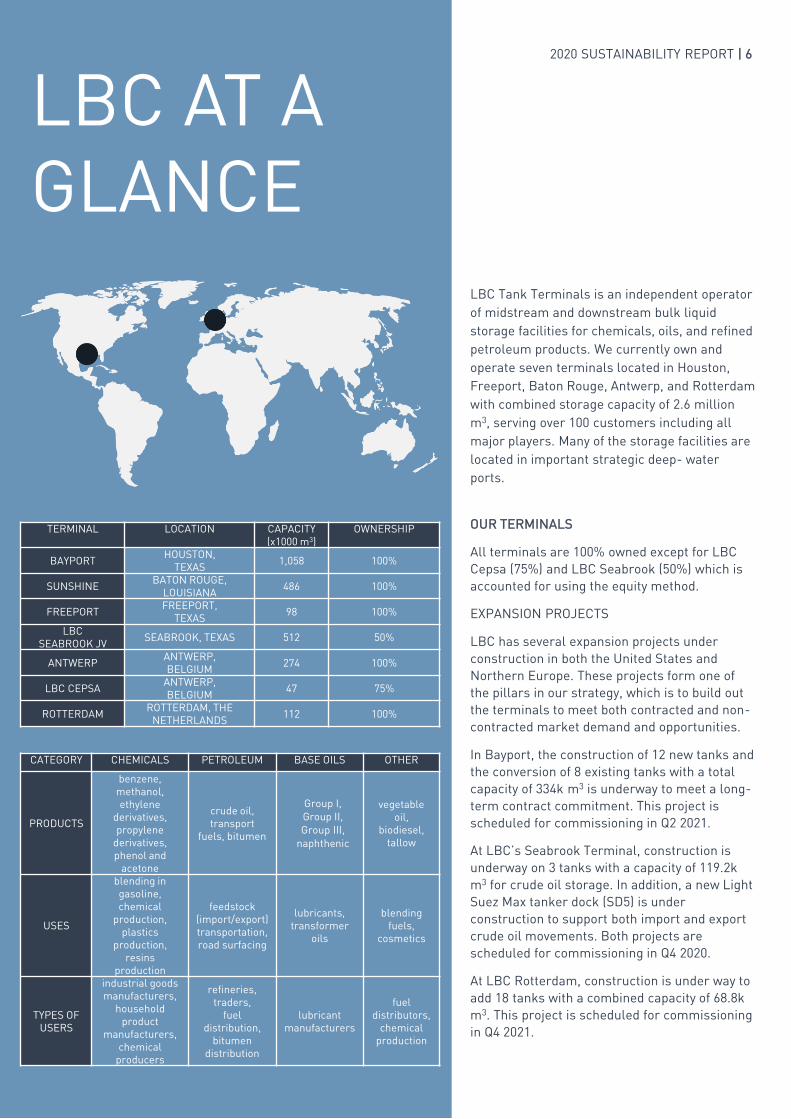
LBC Tank Terminals is an independent operator
of midstream and downstream bulk liquid
storage facilities for chemicals, oils, and refined
petroleum products. We currently own and
operate seven terminals located in Houston,
Freeport, Baton Rouge, Antwerp, and Rotterdam
with combined storage capacity of 2.6 million
m3, serving over 100 customers including all
major players. Many of the storage facilities are
located in important strategic deep- water
ports.
OUR TERMINALS
All terminals are 100% owned except for LBC
Cepsa (75%) and LBC Seabrook (50%) which is
accounted for using the equity method.
EXPANSION PROJECTS
LBC has several expansion projects under
construction in both the United States and
Northern Europe. These projects form one of
the pillars in our strategy, which is to build out
the terminals to meet both contracted and non-
contracted market demand and opportunities.
In Bayport, the construction of 12 new tanks and
the conversion of 8 existing tanks with a total
capacity of 334k m3 is underway to meet a long-
term contract commitment. This project is
scheduled for commissioning in Q2 2021.
At LBC’s Seabrook Terminal, construction is
underway on 3 tanks with a capacity of 119.2k
m3 for crude oil storage. In addition, a new Light
Suez Max tanker dock (SD5) is under
construction to support both import and export
crude oil movements. Both projects are
scheduled for commissioning in Q4 2020.
At LBC Rotterdam, construction is under way to
add 18 tanks with a combined capacity of 68.8k
m3. This project is scheduled for commissioning
in Q4 2021.
TERMINAL LOCATION CAPACITY
(x1000 m3)
OWNERSHIP
BAYPORTHOUSTON,
TEXAS1,058 100%
SUNSHINEBATON ROUGE,
LOUISIANA486 100%
FREEPORTFREEPORT,
TEXAS98 100%
LBC
SEABROOK JVSEABROOK, TEXAS 512 50%
ANTWERPANTWERP,
BELGIUM274 100%
LBC CEPSAANTWERP,
BELGIUM47 75%
ROTTERDAMROTTERDAM, THE
NETHERLANDS112 100%
LBC AT A
GLANCE
CATEGORY CHEMICALS PETROLEUM BASE OILS OTHER
PRODUCTS
benzene,
methanol,
ethylene
derivatives,
propylene
derivatives,
phenol and
acetone
crude oil,
transport
fuels, bitumen
Group I,
Group II,
Group III,
naphthenic
vegetable
oil,
biodiesel,
tallow
USES
blending in
gasoline,
chemical
production,
plastics
production,
resins
production
feedstock
(import/export)
transportation,
road surfacing
lubricants,
transformer
oils
blending
fuels,
cosmetics
TYPES OF
USERS
industrial goods
manufacturers,
household
product
manufacturers,
chemical
producers
refineries,
traders,
fuel
distribution,
bitumen
distribution
lubricant
manufacturers
fuel
distributors,
chemical
production
2020 SUSTAINABILITY REPORT | 6
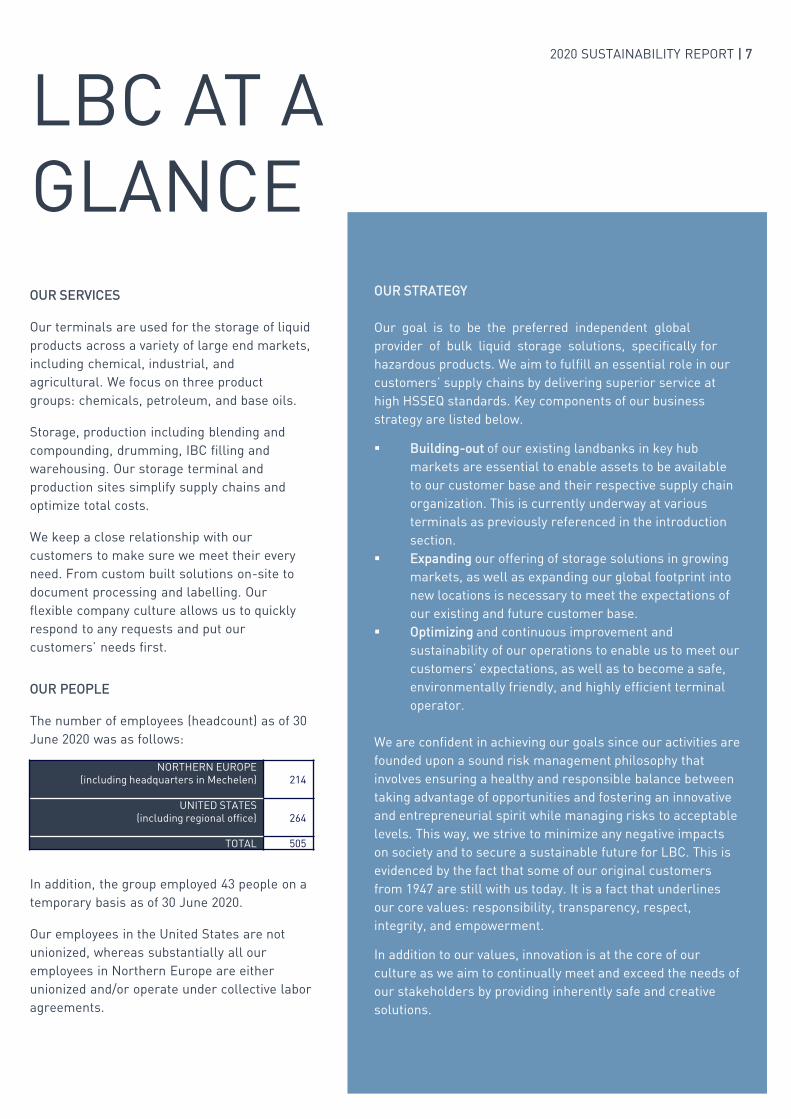
OUR PEOPLE
The number of employees (headcount) as of 30
June 2020 was as follows:
In addition, the group employed 43 people on a
temporary basis as of 30 June 2020.
Our employees in the United States are not
unionized, whereas substantially all our
employees in Northern Europe are either
unionized and/or operate under collective labor
agreements.
OUR SERVICES
Our terminals are used for the storage of liquid
products across a variety of large end markets,
including chemical, industrial, and
agricultural. We focus on three product
groups: chemicals, petroleum, and base oils.
Storage, production including blending and
compounding, drumming, IBC filling and
warehousing. Our storage terminal and
production sites simplify supply chains and
optimize total costs.
We keep a close relationship with our
customers to make sure we meet their every
need. From custom built solutions on-site to
document processing and labelling. Our
flexible company culture allows us to quickly
respond to any requests and put our
customers’ needs first.
OUR STRATEGY
Our goal is to be the preferred independent global
provider of bulk liquid storage solutions, specifically for
hazardous products. We aim to fulfill an essential role in our
customers’ supply chains by delivering superior service at
high HSSEQ standards. Key components of our business
strategy are listed below.
▪ Building-out of our existing landbanks in key hub
markets are essential to enable assets to be available
to our customer base and their respective supply chain
organization. This is currently underway at various
terminals as previously referenced in the introduction
section.
▪ Expanding our offering of storage solutions in growing
markets, as well as expanding our global footprint into
new locations is necessary to meet the expectations of
our existing and future customer base.
▪ Optimizing and continuous improvement and
sustainability of our operations to enable us to meet our
customers’ expectations, as well as to become a safe,
environmentally friendly, and highly efficient terminal
operator.
We are confident in achieving our goals since our activities are
founded upon a sound risk management philosophy that
involves ensuring a healthy and responsible balance between
taking advantage of opportunities and fostering an innovative
and entrepreneurial spirit while managing risks to acceptable
levels. This way, we strive to minimize any negative impacts
on society and to secure a sustainable future for LBC. This is
evidenced by the fact that some of our original customers
from 1947 are still with us today. It is a fact that underlines
our core values: responsibility, transparency, respect,
integrity, and empowerment.
In addition to our values, innovation is at the core of our
culture as we aim to continually meet and exceed the needs of
our stakeholders by providing inherently safe and creative
solutions.
LBC AT A
GLANCE
NORTHERN EUROPE
(including headquarters in Mechelen) 214
UNITED STATES
(including regional office) 264
TOTAL 505
2020 SUSTAINABILITY REPORT | 7
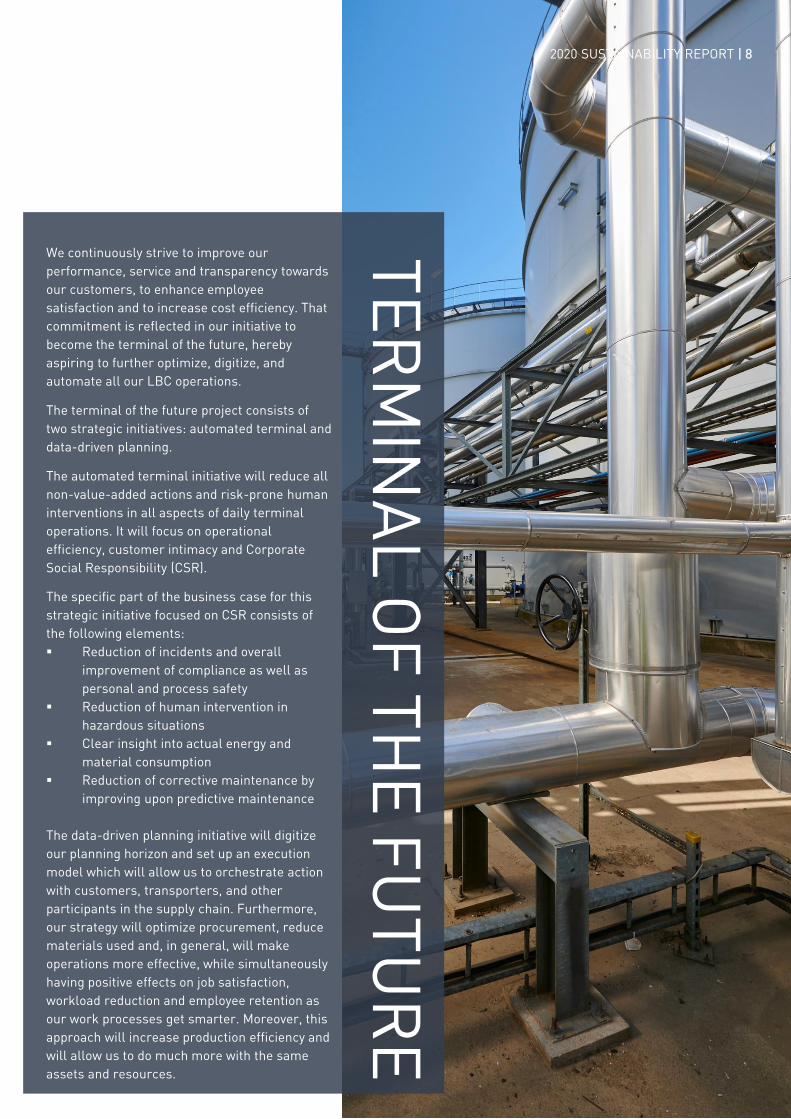
We continuously strive to improve our
performance, service and transparency towards
our customers, to enhance employee
satisfaction and to increase cost efficiency. That
commitment is reflected in our initiative to
become the terminal of the future, hereby
aspiring to further optimize, digitize, and
automate all our LBC operations.
The terminal of the future project consists of
two strategic initiatives: automated terminal and
data-driven planning.
The automated terminal initiative will reduce all
non-value-added actions and risk-prone human
interventions in all aspects of daily terminal
operations. It will focus on operational
efficiency, customer intimacy and Corporate
Social Responsibility (CSR).
The specific part of the business case for this
strategic initiative focused on CSR consists of
the following elements:
▪ Reduction of incidents and overall
improvement of compliance as well as
personal and process safety
▪ Reduction of human intervention in
hazardous situations
▪ Clear insight into actual energy and
material consumption
▪ Reduction of corrective maintenance by
improving upon predictive maintenance
The data-driven planning initiative will digitize
our planning horizon and set up an execution
model which will allow us to orchestrate action
with customers, transporters, and other
participants in the supply chain. Furthermore,
our strategy will optimize procurement, reduce
materials used and, in general, will make
operations more effective, while simultaneously
having positive effects on job satisfaction,
workload reduction and employee retention as
our work processes get smarter. Moreover, this
approach will increase production efficiency and
will allow us to do much more with the same
assets and resources.
TE
RM
INA
L O
F T
HE
FU
TU
RE
2020 SUSTAINABILITY REPORT | 8
TERMINAL
OF THE
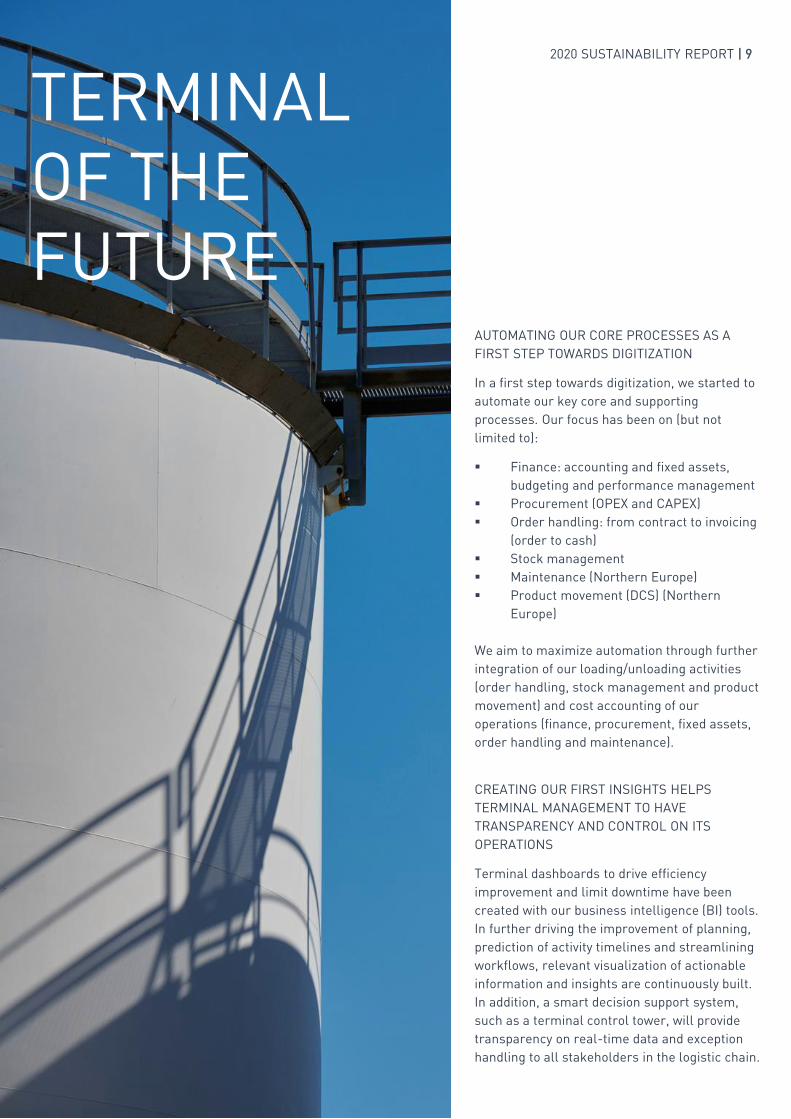
FUTUREAUTOMATING OUR CORE PROCESSES AS A
FIRST STEP TOWARDS DIGITIZATION
In a first step towards digitization, we started to
automate our key core and supporting
processes. Our focus has been on (but not
limited to):
▪ Finance: accounting and fixed assets,
budgeting and performance management
▪ Procurement (OPEX and CAPEX)
▪ Order handling: from contract to invoicing
(order to cash)
▪ Stock management
▪ Maintenance (Northern Europe)
▪ Product movement (DCS) (Northern
Europe)
We aim to maximize automation through further
integration of our loading/unloading activities
(order handling, stock management and product
movement) and cost accounting of our
operations (finance, procurement, fixed assets,
order handling and maintenance).
CREATING OUR FIRST INSIGHTS HELPS
TERMINAL MANAGEMENT TO HAVE
TRANSPARENCY AND CONTROL ON ITS
OPERATIONS
Terminal dashboards to drive efficiency
improvement and limit downtime have been
created with our business intelligence (BI) tools.
In further driving the improvement of planning,
prediction of activity timelines and streamlining
workflows, relevant visualization of actionable
information and insights are continuously built.
In addition, a smart decision support system,
such as a terminal control tower, will provide
transparency on real-time data and exception
handling to all stakeholders in the logistic chain.
2020 SUSTAINABILITY REPORT | 9

OUR APPROACH
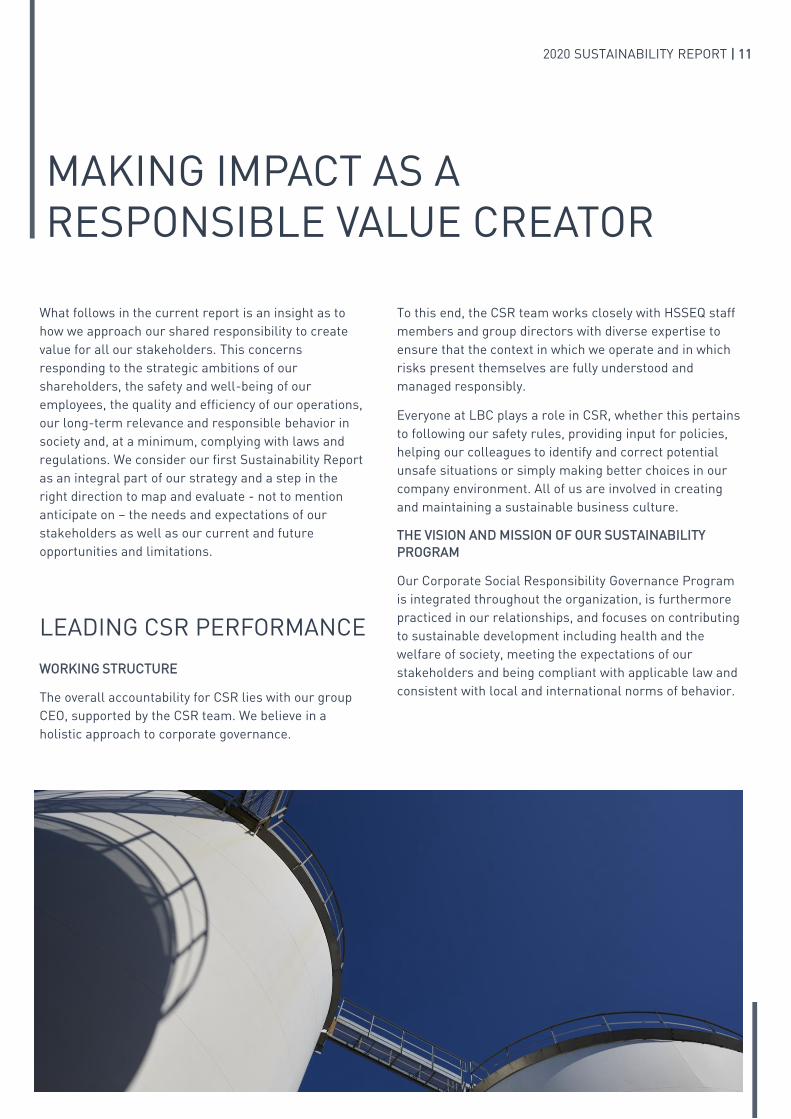
What follows in the current report is an insight as to
how we approach our shared responsibility to create
value for all our stakeholders. This concerns
responding to the strategic ambitions of our
shareholders, the safety and well-being of our
employees, the quality and efficiency of our operations,
our long-term relevance and responsible behavior in
society and, at a minimum, complying with laws and
regulations. We consider our first Sustainability Report
as an integral part of our strategy and a step in the
right direction to map and evaluate - not to mention
anticipate on – the needs and expectations of our
stakeholders as well as our current and future
opportunities and limitations.
LEADING CSR PERFORMANCE
WORKING STRUCTURE
The overall accountability for CSR lies with our group
CEO, supported by the CSR team. We believe in a
holistic approach to corporate governance.
MAKING IMPACT AS A
RESPONSIBLE VALUE CREATOR
To this end, the CSR team works closely with HSSEQ staff
members and group directors with diverse expertise to
ensure that the context in which we operate and in which
risks present themselves are fully understood and
managed responsibly.
Everyone at LBC plays a role in CSR, whether this pertains
to following our safety rules, providing input for policies,
helping our colleagues to identify and correct potential
unsafe situations or simply making better choices in our
company environment. All of us are involved in creating
and maintaining a sustainable business culture.
THE VISION AND MISSION OF OUR SUSTAINABILITY
PROGRAM
Our Corporate Social Responsibility Governance Program
is integrated throughout the organization, is furthermore
practiced in our relationships, and focuses on contributing
to sustainable development including health and the
welfare of society, meeting the expectations of our
stakeholders and being compliant with applicable law and
consistent with local and international norms of behavior.
2020 SUSTAINABILITY REPORT | 11
MAKING IMPACT AS A
RESPONSIBLE VALUE CREATOR
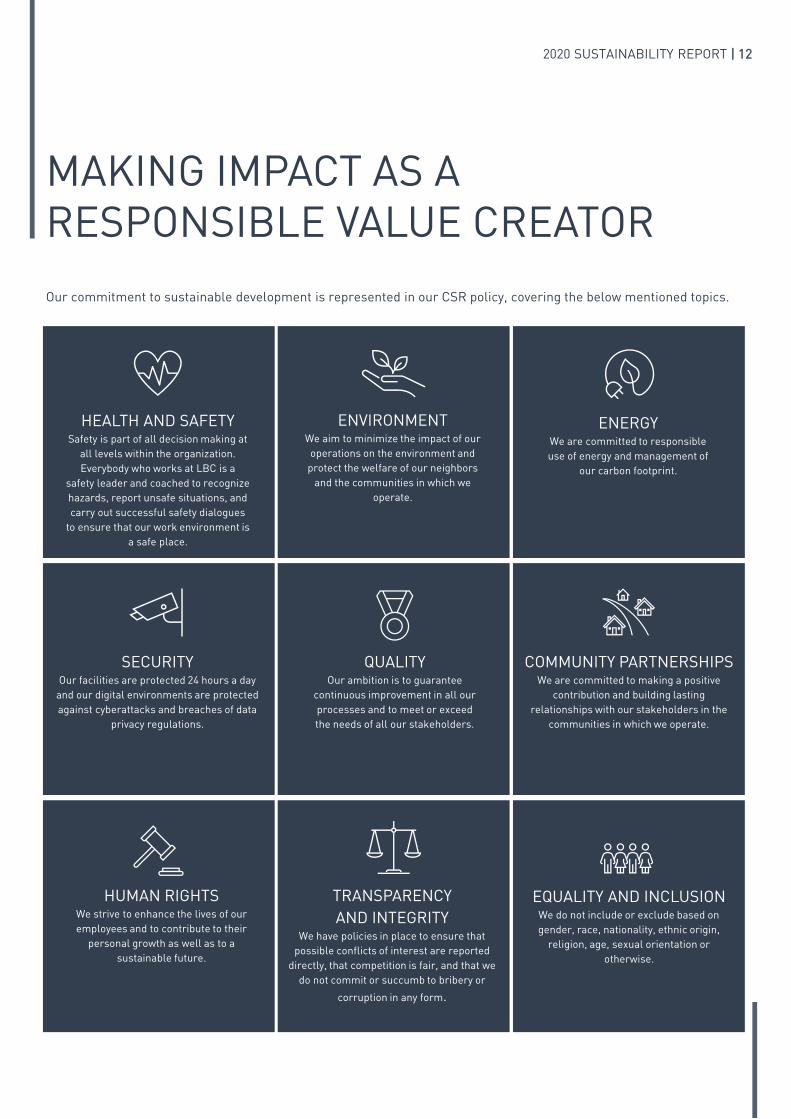
Our commitment to sustainable development is represented in our CSR policy, covering the below mentioned topics.
HEALTH AND SAFETYSafety is part of all decision making at
all levels within the organization.
Everybody who works at LBC is a
safety leader and coached to recognize
hazards, report unsafe situations, and
carry out successful safety dialogues
to ensure that our work environment is
a safe place.
ENVIRONMENTWe aim to minimize the impact of our
operations on the environment and
protect the welfare of our neighbors
and the communities in which we
operate.
ENERGYWe are committed to responsible
use of energy and management of
our carbon footprint.
QUALITYOur ambition is to guarantee
continuous improvement in all our
processes and to meet or exceed
the needs of all our stakeholders.
COMMUNITY PARTNERSHIPSWe are committed to making a positive
contribution and building lasting
relationships with our stakeholders in the
communities in which we operate.
SECURITYOur facilities are protected 24 hours a day
and our digital environments are protected
against cyberattacks and breaches of data
privacy regulations.
TRANSPARENCY
AND INTEGRITYWe have policies in place to ensure that
possible conflicts of interest are reported
directly, that competition is fair, and that we
do not commit or succumb to bribery or
corruption in any form.
HUMAN RIGHTS We strive to enhance the lives of our
employees and to contribute to their
personal growth as well as to a
sustainable future.
EQUALITY AND INCLUSIONWe do not include or exclude based on
gender, race, nationality, ethnic origin,
religion, age, sexual orientation or
otherwise.
2020 SUSTAINABILITY REPORT | 12
MAKING IMPACT AS A
RESPONSIBLE VALUE CREATOR
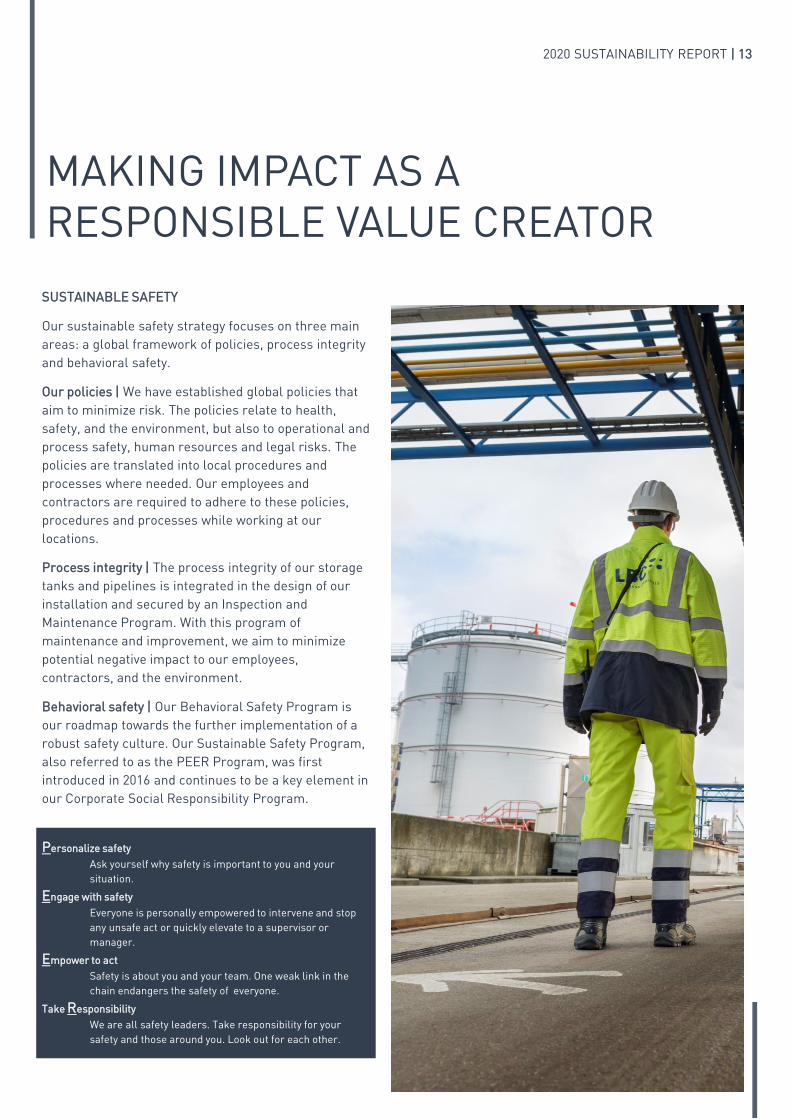
SUSTAINABLE SAFETY
Our sustainable safety strategy focuses on three main
areas: a global framework of policies, process integrity
and behavioral safety.
Our policies | We have established global policies that
aim to minimize risk. The policies relate to health,
safety, and the environment, but also to operational and
process safety, human resources and legal risks. The
policies are translated into local procedures and
processes where needed. Our employees and
contractors are required to adhere to these policies,
procedures and processes while working at our
locations.
Process integrity | The process integrity of our storage
tanks and pipelines is integrated in the design of our
installation and secured by an Inspection and
Maintenance Program. With this program of
maintenance and improvement, we aim to minimize
potential negative impact to our employees,
contractors, and the environment.
Behavioral safety | Our Behavioral Safety Program is
our roadmap towards the further implementation of a
robust safety culture. Our Sustainable Safety Program,
also referred to as the PEER Program, was first
introduced in 2016 and continues to be a key element in
our Corporate Social Responsibility Program.
Personalize safety
Ask yourself why safety is important to you and your
situation.
Engage with safety
Everyone is personally empowered to intervene and stop
any unsafe act or quickly elevate to a supervisor or
manager.
Empower to act
Safety is about you and your team. One weak link in the
chain endangers the safety of everyone.
Take Responsibility
We are all safety leaders. Take responsibility for your
safety and those around you. Look out for each other.
2020 SUSTAINABILITY REPORT | 13
20 CRITICAL SAFETY RULES
Our 20 critical safety rules are the standards to live by
for our employees, visitors, and contractors. These
rules are communicated regularly and are included in
safety moments at the start of formal meetings.
SAFETY OBSERVATIONS
Safety observations are an integral part of the PEER
Program. They focus on behaviors of workers, both LBC
employees and contractors, and they typically include
both safe and less safe behaviors.
INCIDENT REPORTING AND FOLLOW-UP
A key element in the Sustainable Safety Program is our
incident reporting process. We allow all employees to
enter incidents, near misses or unsafe acts and
situations in the database. Due to the reporting culture,
the accessibility and foundation of the new improved
incident database, we noted an increase in near miss
and unsafe act and situation reporting with 370%
compared to our previous database, which confirms our
proactive safety and reporting culture. Recognizing and
reporting near miss incidents can significantly improve
worker safety and enhance our organization’s safety
culture.
We make a distinction between safety and health
incidents, operational incidents, including
environmental incidents, asset availability incidents
and non-compliances, and customer complaints. The
incidents are classified according to their actual and
potential severity based on the severity impact matrix.
Reported incidents are reviewed by the local terminal
management teams as well as at group level. We share
incidents that have a significant or major severity level
with all employees. Where relevant, we share safety
alerts within our terminals and offices as part of our
learning from incidents process. Root causes of
significant and major incidents are investigated by a
pool of trained investigators.
MAKING IMPACT AS A
RESPONSIBLE VALUE CREATOR
TapRoot® methodology | During FY20, we introduced
the TapRoot® incident investigation methodology at
LBC on a global level. To this end, multiple employees
were assigned to a training which introduces a
systematic process and software designed to find the
real root causes of incidents and accidents.
Business intelligence (BI) as a monitoring and
reporting tool | Monitoring and reporting systems have
been improved by means of live and interactive Power
BI reports, ranging from HSSEQ, compliance, customer
satisfaction to finance. The Power BI reports track and
trace all data deriving from the reporting portal, which
is fully accessible to our employees and contractors.
The key KPIs defined within our organization for each of
our terminals, such as incidents, customer complaints,
environmental parameters and turnaround times for all
the applicable modalities, allow us to identify trends
and develop objectives, demonstrating the aim to
continuously improve our performance. All the KPIs are
monitored monthly and are discussed within the global
leadership teams on a terminal, regional and global
level during business review and management review
recurrent meetings.
Strengthening the internal audit processes | We
strengthened and improved the internal audit
processes in FY20 by training a pool of employees as
internal auditors, who have been put to the test when
the global audit was conducted. All LBC locations were
internally audited on the established KPIs. Gaps were
noted and targets for FY21 have been set based on the
audit report.
Contractor safety | We have an extensive selection
process based on safety parameters for the selection of
our contractors with whom we work closely to ensure
that they understand and live by our procedures and
put safety at the forefront of everything they do at LBC
locations. In addition, we organize frequent meetings
with our main contractors to identify potential
improvement opportunities.
2020 SUSTAINABILITY REPORT | 14
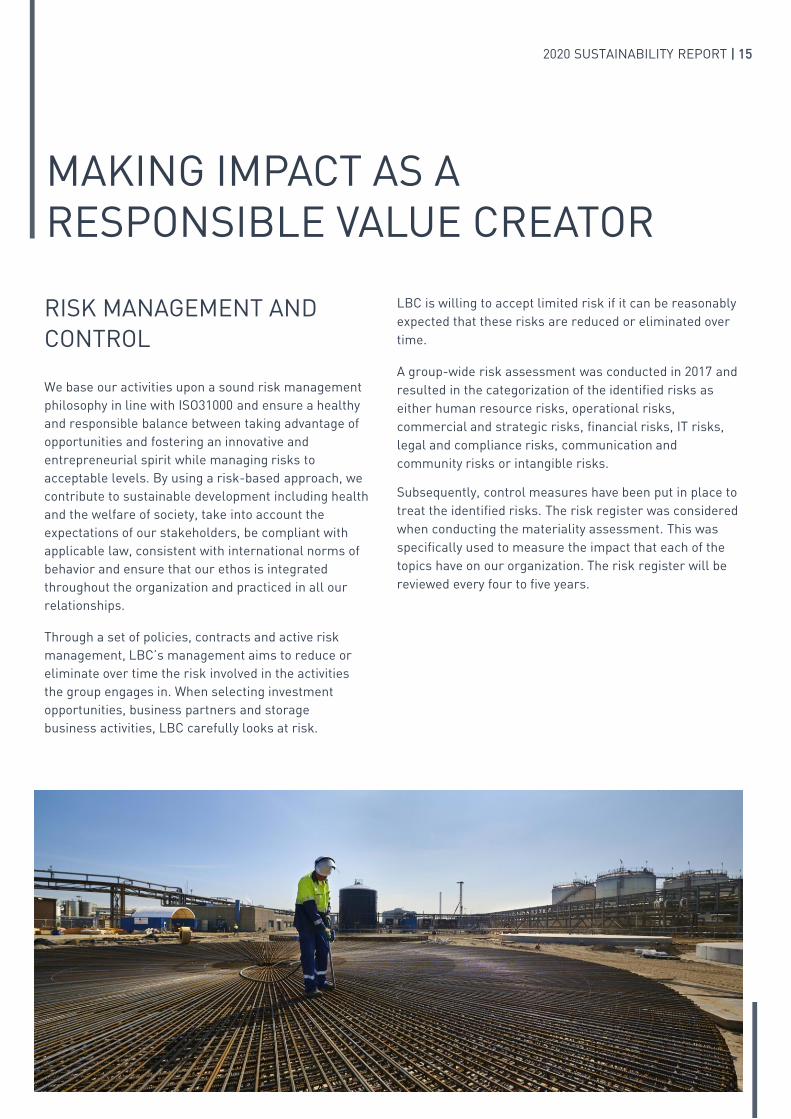
RISK MANAGEMENT AND
CONTROL
We base our activities upon a sound risk management
philosophy in line with ISO31000 and ensure a healthy
and responsible balance between taking advantage of
opportunities and fostering an innovative and
entrepreneurial spirit while managing risks to
acceptable levels. By using a risk-based approach, we
contribute to sustainable development including health
and the welfare of society, take into account the
expectations of our stakeholders, be compliant with
applicable law, consistent with international norms of
behavior and ensure that our ethos is integrated
throughout the organization and practiced in all our
relationships.
Through a set of policies, contracts and active risk
management, LBC’s management aims to reduce or
eliminate over time the risk involved in the activities
the group engages in. When selecting investment
opportunities, business partners and storage
business activities, LBC carefully looks at risk.
MAKING IMPACT AS A
RESPONSIBLE VALUE CREATOR
LBC is willing to accept limited risk if it can be reasonably
expected that these risks are reduced or eliminated over
time.
A group-wide risk assessment was conducted in 2017 and
resulted in the categorization of the identified risks as
either human resource risks, operational risks,
commercial and strategic risks, financial risks, IT risks,
legal and compliance risks, communication and
community risks or intangible risks.
Subsequently, control measures have been put in place to
treat the identified risks. The risk register was considered
when conducting the materiality assessment. This was
specifically used to measure the impact that each of the
topics have on our organization. The risk register will be
reviewed every four to five years.
2020 SUSTAINABILITY REPORT | 15
CSR COMMITTEE
Our CSR Committee assists the Board of Directors
(Board) to discharge its responsibilities, and to support
and guide LBC’s management team to further ensure
the group’s strategy, decisions, and policies in respect
of Corporate Social Responsibility. The meetings are
held at least (but not limited to) three times per year.
The committee consists of at least three members.
Each committee member must be a member of the
Board of Directors. Meetings are attended by LBC’s CEO
and COO.
The CSR Committee endeavors to:
▪ promote a culture of health and safety
compliance and sustainability;
▪ ensure effective and open communication
between the Board and LBC group;
▪ ensure that directors are provided with
appropriate and relevant information in relation
to the issues within this mandate that is of high
quality and allow informed judgments to be made
by them; and
▪ make recommendations to the Board in
accordance with these terms of reference from
time to time.
AUDIT AND RISK COMMITTEE
The Audit and Risk Committee assists the Board to
discharge its responsibilities regarding management of
risks, compliance, reporting, auditing, etc. The meetings
are held at least twice per year. The committee consists
of at least three members. The Chairman of the Board
is a member of the committee and each member of the
committee must be a member of the Board.
The Audit and Risk Committee endeavors to:
▪ maintain and improve the quality, credibility and
objectivity of the financial accounting process;
▪ promote a culture of compliance;
MAKING IMPACT AS A
RESPONSIBLE VALUE CREATOR
▪ ensure effective communication between the Board
and the senior financial and operational management
in relation to audit and compliance issues;
▪ ensure effective audit functions and communication
between the Board and external auditors;
▪ ensure that financial compliance strategies and
financial compliance functions are effective; and
▪ ensure that directors and senior management are
provided with financial and non-financial information
that is of high quality and relevant to the decisions to
be made.
REMUNERATION AND NOMINATION COMMITTEE
The Remuneration and Nomination Committee assists the
Board to discharge its responsibilities regarding:
▪ evaluating the effectiveness of the company’s
management and the performance of individual
executive directors;
▪ regularly reviewing the structure, size and
composition of the company’s management;
▪ ensuring the company has coherent remuneration
policies and practices to attract and retain executive
directors who will create value for shareholders;
▪ monitoring those remuneration policies and
practices; and
▪ ensuring the company fairly and responsibly rewards
executive directors considering the company’s
performance, the performance of the executive
directors and the general pay environment.
The committee consists of at least two members. Each
member of the committee must be a member of the Board.
The meetings are held at least twice per year.
2020 SUSTAINABILITY REPORT | 16
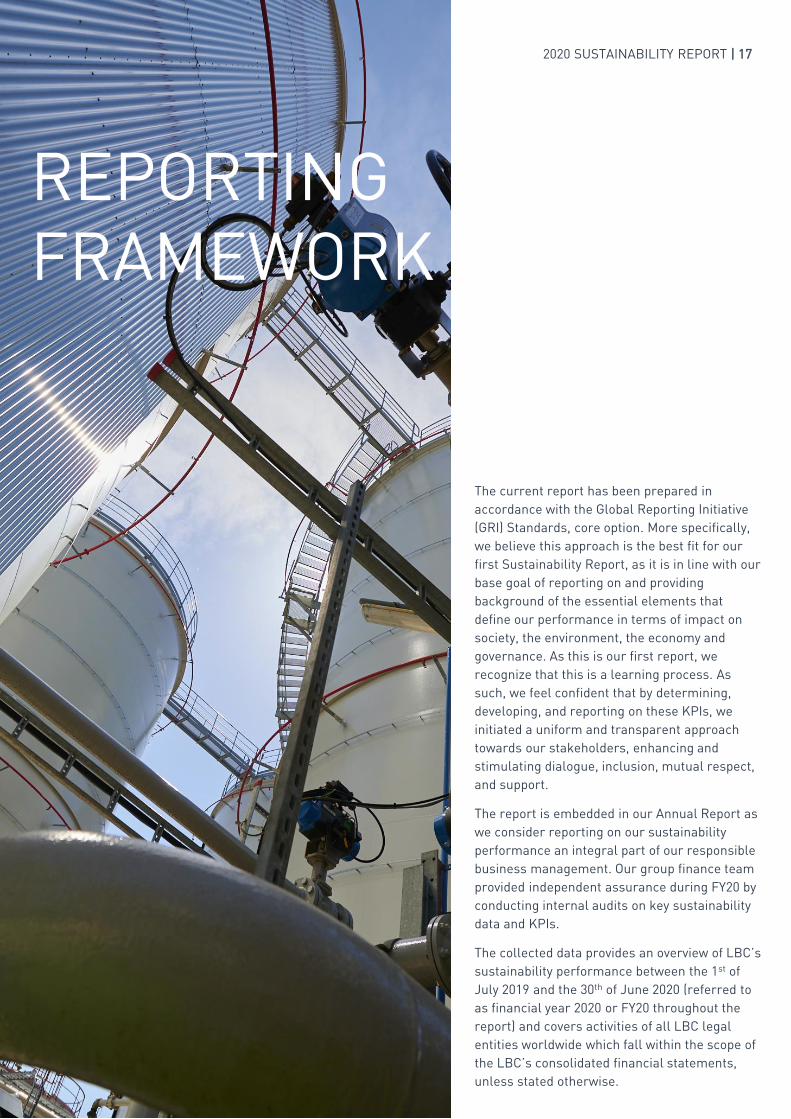
The current report has been prepared in
accordance with the Global Reporting Initiative
(GRI) Standards, core option. More specifically,
we believe this approach is the best fit for our
first Sustainability Report, as it is in line with our
base goal of reporting on and providing
background of the essential elements that
define our performance in terms of impact on
society, the environment, the economy and
governance. As this is our first report, we
recognize that this is a learning process. As
such, we feel confident that by determining,
developing, and reporting on these KPIs, we
initiated a uniform and transparent approach
towards our stakeholders, enhancing and
stimulating dialogue, inclusion, mutual respect,
and support.
The report is embedded in our Annual Report as
we consider reporting on our sustainability
performance an integral part of our responsible
business management. Our group finance team
provided independent assurance during FY20 by
conducting internal audits on key sustainability
data and KPIs.
The collected data provides an overview of LBC’s
sustainability performance between the 1st of
July 2019 and the 30th of June 2020 (referred to
as financial year 2020 or FY20 throughout the
report) and covers activities of all LBC legal
entities worldwide which fall within the scope of
the LBC’s consolidated financial statements,
unless stated otherwise.
REPORTING
FRAMEWORK
2020 SUSTAINABILITY REPORT | 17
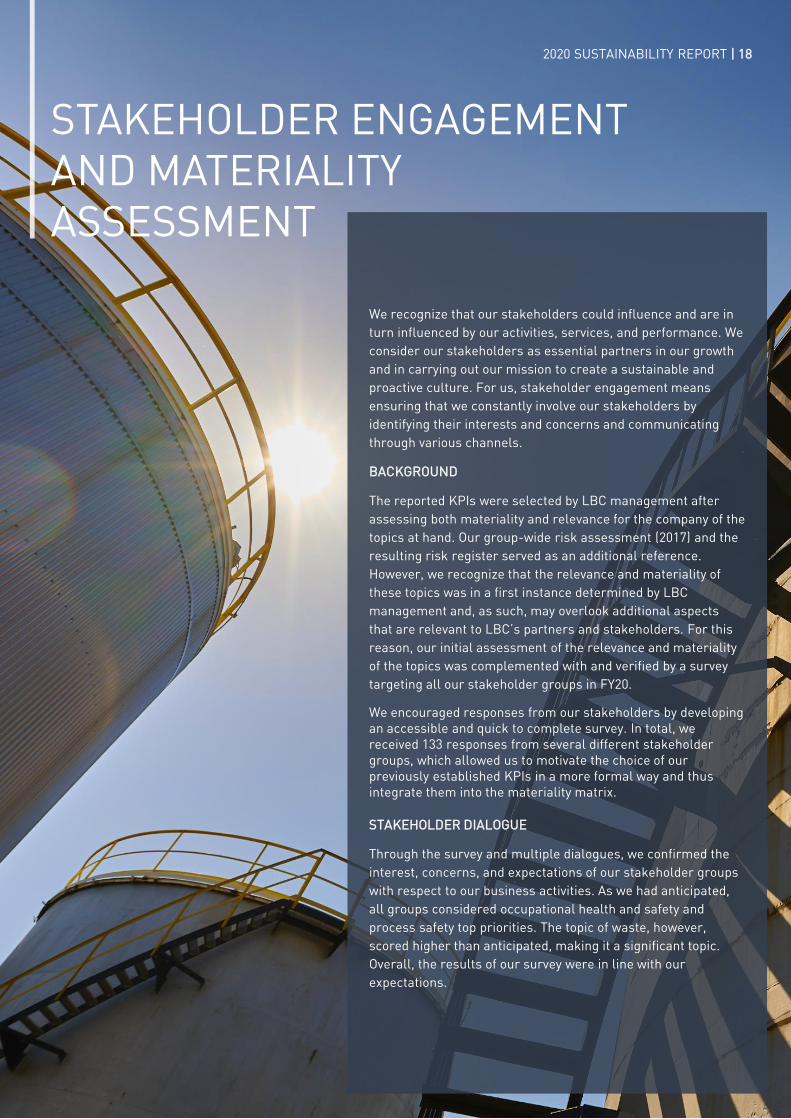
We recognize that our stakeholders could influence and are in
turn influenced by our activities, services, and performance. We
consider our stakeholders as essential partners in our growth
and in carrying out our mission to create a sustainable and
proactive culture. For us, stakeholder engagement means
ensuring that we constantly involve our stakeholders by
identifying their interests and concerns and communicating
through various channels.
BACKGROUND
The reported KPIs were selected by LBC management after
assessing both materiality and relevance for the company of the
topics at hand. Our group-wide risk assessment (2017) and the
resulting risk register served as an additional reference.
However, we recognize that the relevance and materiality of
these topics was in a first instance determined by LBC
management and, as such, may overlook additional aspects
that are relevant to LBC’s partners and stakeholders. For this
reason, our initial assessment of the relevance and materiality
of the topics was complemented with and verified by a survey
targeting all our stakeholder groups in FY20.
We encouraged responses from our stakeholders by developing
an accessible and quick to complete survey. In total, we
received 133 responses from several different stakeholder
groups, which allowed us to motivate the choice of our
previously established KPIs in a more formal way and thus
integrate them into the materiality matrix.
STAKEHOLDER DIALOGUE
Through the survey and multiple dialogues, we confirmed the
interest, concerns, and expectations of our stakeholder groups
with respect to our business activities. As we had anticipated,
all groups considered occupational health and safety and
process safety top priorities. The topic of waste, however,
scored higher than anticipated, making it a significant topic.
Overall, the results of our survey were in line with our
expectations.
STAKEHOLDER ENGAGEMENT
AND MATERIALITY
ASSESSMENT
2020 SUSTAINABILITY REPORT | 18

STAKEHOLDER ENGAGEMENT
AND MATERIALITY ASSESSMENT
OUR CUSTOMERS
We recognize that our customers require us to align
our Sustainability Policy with theirs and that they
expect their products to be handled valuably and
stored in a safe way, compliant with local rules and
regulations. Their identified priorities are
occupational health and safety, process safety, water,
(no) soil and groundwater pollution and (no) VOC
emissions. Our commitment towards our customers
is reflected in the setup of our stakeholder
engagement survey as well as in frequent face-to-face
meetings or conference calls, emails, and audits.
OUR EMPLOYEES
Our employees, including contractors, are at the heart
of everything that we do. As such, they value that we
put their best interests and talent first and help them
develop the necessary skills through learning and
development (among other things in how to maintain a
safe and healthy work environment). Their identified
priorities are occupational health and safety, process
safety, water, (no) soil and groundwater pollution and
customer focus. Next to engaging with them via
surveys, our commitment to our employees is
reflected in our daily work relationships, open
dialogue, training, and coaching.
OUR SUPPLIERS
Our contractors and suppliers indicated through the
survey that they consider occupational health and
safety, process safety, water, (no) soil and
groundwater pollution and VOC emissions as priority
topics. Similar to the way we communicate with our
customers, we engage with suppliers via frequent
face-to-face meetings or conference calls and site
visits. In addition, our mutual commitment is reflected
in supplier contracts.
OUR FINANCIAL AND CAPITAL MARKETS
Financial and capital markets appreciate that we are
reporting on our sustainable performance and
recognize it as one of our organization’s long-term
strategic advantages. We deducted from the survey that
their identified priorities are occupational health and
safety, process safety, cybersecurity threats and
business ethics and integrity.
OUR SOCIETAL STAKEHOLDERS
Included in this stakeholder group are authority and
governmental organizations, NGOs, neighbors, local
communities, etc. Much like our customers, our
societal stakeholders consider compliance with local
regulations, the focus on risk management and safe
operations as priorities. They value responsible
business management through a transparent
approach. Topics identified as significantly important
for our societal stakeholders include occupational
health and safety, process safety, water, (no) soil and
groundwater pollution, and the application of best
practices. Our commitment to each of these groups is
reflected in written contracts, our external
communication (website and social media channels),
audits and the stakeholder engagement survey.
OUR SHAREHOLDERS
Similarly to the financial and capital markets, our
shareholders consider the transparency and
comparability of our approach to sustainability as an
advantage on the long term. We identified occupational
health and safety, process safety, CO2 emissions and
energy use, business ethics and integrity and
adaptation to climate change as their priorities. We
strive for open dialogue with our shareholders through
monthly board meetings, regular updates, and targeted
committee meetings (CSR Committee, Audit and Risk
Committee, Project Review Committee, Remuneration
and Nomination Committee).
2020 SUSTAINABILITY REPORT | 19

MATERIALITY MATRIX AND THE DEVELOPMENT OF OUR KEY TOPICS
The extensiveness of reporting depends on the significance of the topic (identified as major, significant, or minor).
We report in detail on and have KPIs in place for all major topics, as well as for four significant topics (CO2 emissions
and energy use, application of best practices, talent attraction and retention and cybersecurity threats).
In a first instance, our efforts have been put towards reporting on the topics that are most material to LBC and our
stakeholders (i.e. major and significant topics). Therefore, we have chosen to not report on moderate topics, unless
stated otherwise in the report. Performance measurement on the moderate topics will be developed going forward.
STAKEHOLDER ENGAGEMENT
AND MATERIALITY ASSESSMENT
RELEVANCE TO THE STAKEHOLDERS
IMP
AC
T O
N T
HE
BU
SIN
ES
S
DIVERSITY AND INCLUSION WATER USE
NUISANCEBIODIVERSITY
COMMUNITY ENGAGEMENT AND CHARITYADAPTATION TO
CLIMATE CHANGE
HUMAN RIGHTS
SUSTAINABLE PROCUREMENT
CO2 EMISSIONS
AND ENERGY USE
APPLICATION OF
BEST PRACTICES
WASTE
CYBERSECURITY
THREATS
CUSTOMER FOCUS
BUSINESS ETHICS
AND INTEGRITY
OCCUPATIONAL HEALTH
AND SAFETY
PROCESS SAFETY
WATER, SOIL AND
GROUNDWATER POLLUTION
VOC
EMISSIONS
TALENT ATTRACTION
AND RETENTION
MA
JO
R T
OP
ICS
MO
DE
RA
TE
TO
PIC
S
SIG
NIF
ICA
NT
TO
PIC
SOCCUPATIONAL HEALTH
AND SAFETY
PROCESS SAFETY
BUSINESS ETHICS AND
INTEGRITY
WATER, SOIL
AND GROUNDWATER
POLLUTION
VOC EMISSIONS
CO2 EMISSIONS
AND ENERGY USE
APPLICATION OF BEST
PRACTICES
TALENT ATTRACTION
AND RETENTION
WASTE
CYBERSECURITY THREATS
CUSTOMER FOCUS
SUSTAINABLE PROCUREMENT
ADAPTATION TO CLIMATE
CHANGE
HUMAN RIGHTS
WATER USE
DIVERSITY AND INCLUSION
NUISANCE
BIODIVERSITY
COMMUNITY ENGAGEMENT
AND CHARITY
2020 SUSTAINABILITY REPORT | 20
SOCIETAL KPIs
TOPIC
METRIC
KPI
TARGET 2020
PERFORMANCE
2020
GRI STANDARD
SDG
PR
OC
ES
S S
AF
ET
Y
Loss of primary
containment
Process safety
events rate (PSER)
▪ Tier 1
PSER
▪ Tier 2
PSER
Number of category
A, B and C
loss of primary
containment
incidents
Establish
baseline
Tier 1 + Tier 2
PSER: 0.11
6 LOPC A, B and C
incidents
OC
CU
PA
TIO
NA
L H
EA
LT
H
AN
D S
AF
ET
Y
Injuries of own
employees and
contractors
Total Recordable
Incidents Frequency
Rate (TRIFR)
Lost Time Incident
Frequency Rate
(LITFR)
LBC employee
TRIFR: 1.69
LBC employee
TRIFR: 1.06
LTIFR: 1.06
Contractor
TRIFR: 0.91
LITFR: 0.23
GRI 403
Occupational health
and safety
(2018 version)
TA
LE
NT
AT
TR
AC
TIO
N A
ND
RE
TE
NT
ION
LBC staff absence
LBC staff turnover
Diversity and
inclusion
Absence rate
Staff turnover
Women in (senior)
leadership positions
Age distribution
Establish
baseline for
absence rate
Establish
baseline
Absence short-
term: 1.46
Absence long-
term: 3.28
Absolute and
relative
joiners: 67 (13.2%)
leavers: 69 (13.0%)
See page 27
See page 27
GRI 401
Employment
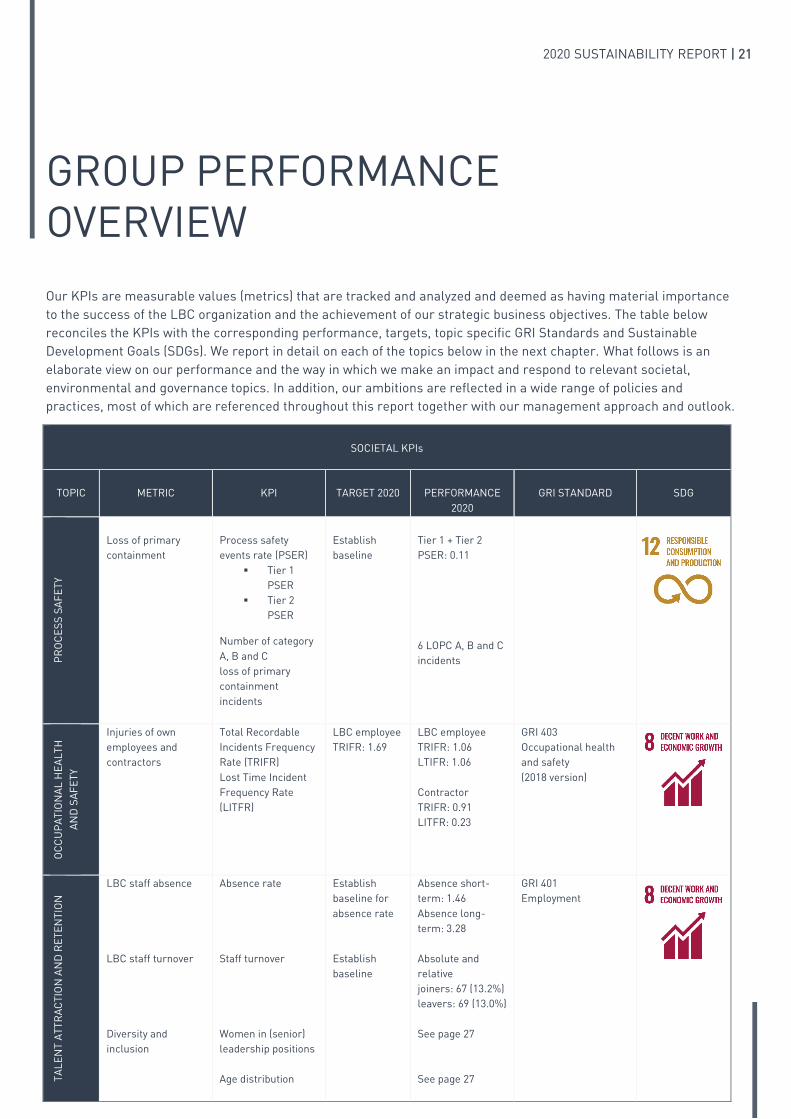
Our KPIs are measurable values (metrics) that are tracked and analyzed and deemed as having material importance
to the success of the LBC organization and the achievement of our strategic business objectives. The table below
reconciles the KPIs with the corresponding performance, targets, topic specific GRI Standards and Sustainable
Development Goals (SDGs). We report in detail on each of the topics below in the next chapter. What follows is an
elaborate view on our performance and the way in which we make an impact and respond to relevant societal,
environmental and governance topics. In addition, our ambitions are reflected in a wide range of policies and
practices, most of which are referenced throughout this report together with our management approach and outlook.
GROUP PERFORMANCE
OVERVIEW
2020 SUSTAINABILITY REPORT | 21

ENVIRONMENTAL KPIs
TOPIC
METRIC
KPI
TARGET 2020
PERFORMANCE
2020
GRI STANDARD
SDG
CO
2 E
MIS
SIO
NS
AN
D E
NE
RG
Y U
SE
CO2 gas emissions
Energy
CO2 emissions
(in metric tons)
CO2 emission
intensity
(in kg per metric ton
throughput)
Energy intensity
(in MJ per ton
throughput)
Establish
baseline
52287
(market-based)
51985
(location-based)
2.56
(market-based)
2.55
(location-based)
48.06
GRI 305
Emissions
VO
C E
MIS
SIO
NS
Volatile organic
compounds
g VOC per ton
throughput
Establish
baseline
5.14
GRI 305
Emissions
WA
TE
R A
ND
SO
IL
PO
LL
UT
ION
Release to water or
soil
Number of LOPC
incidents resulting
in product (> 100 kg)
reaching the
environment
(water or soil)
Establish
baseline
0
GRI 306
Effluents and waste
GOVERNANCE TOPICS
BU
SIN
ES
S E
TH
ICS
AN
D
INT
EG
RIT
Y
Corruption, bribery,
discrimination,
permit violations
Number of
employees trained in
business ethics
Number of permit
violations that
resulted in fines
Develop and
roll-out a
business
ethics training
Establish
baseline
137 employees
completed the
business ethics
training
Permit violations
resulting in fines:
0
GRI 307
Environmental
compliance
AP
PL
ICA
TIO
N O
F B
ES
T
PR
AC
TIC
ES
Certified
management
systems
CSR rating
Number of facilities
with, where
applicable, ISO 9001
and 14001
certifications, CDI-T
assessment
EcoVadis rating
GRESB rating
Establish
baseline
3 terminals are
certified against
ISO 9001 and ISO
14001, 2 terminals
are assessed
against the CDI-T
standard
EcoVadis: 60/100
GRESB: 54/100
CY
BE
RS
EC
UR
ITY
TH
RE
AT
S
Cybersecurity
breaches
Number of
significant and
major cybersecurity
breaches
Establish
baseline
0
OUR PERFORMANCE
Emergency Response Plans are in place to mitigate
serious consequences from spills or other emergencies.
In addition, our implemented training programs allow
our staff to acquire the necessary skills to safely operate
our equipment, prevent loss of containment incidents,
and respond to emergencies.
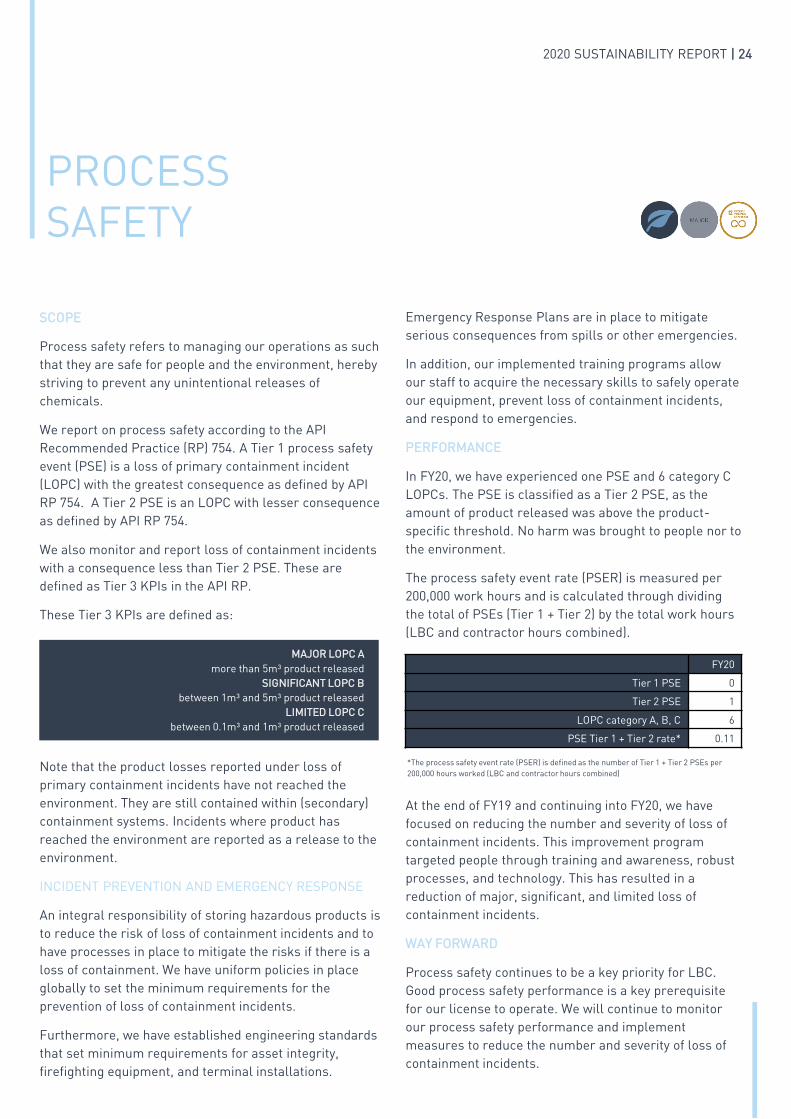
PERFORMANCE
In FY20, we have experienced one PSE and 6 category C
LOPCs. The PSE is classified as a Tier 2 PSE, as the
amount of product released was above the product-
specific threshold. No harm was brought to people nor to
the environment.
The process safety event rate (PSER) is measured per
200,000 work hours and is calculated through dividing
the total of PSEs (Tier 1 + Tier 2) by the total work hours
(LBC and contractor hours combined).
At the end of FY19 and continuing into FY20, we have
focused on reducing the number and severity of loss of
containment incidents. This improvement program
targeted people through training and awareness, robust
processes, and technology. This has resulted in a
reduction of major, significant, and limited loss of
containment incidents.
WAY FORWARD
Process safety continues to be a key priority for LBC.
Good process safety performance is a key prerequisite
for our license to operate. We will continue to monitor
our process safety performance and implement
measures to reduce the number and severity of loss of
containment incidents.
PROCESS
SAFETY
SCOPE
Process safety refers to managing our operations as such
that they are safe for people and the environment, hereby
striving to prevent any unintentional releases of
chemicals.
We report on process safety according to the API
Recommended Practice (RP) 754. A Tier 1 process safety
event (PSE) is a loss of primary containment incident
(LOPC) with the greatest consequence as defined by API
RP 754. A Tier 2 PSE is an LOPC with lesser consequence
as defined by API RP 754.
We also monitor and report loss of containment incidents
with a consequence less than Tier 2 PSE. These are
defined as Tier 3 KPIs in the API RP.
These Tier 3 KPIs are defined as:
Note that the product losses reported under loss of
primary containment incidents have not reached the
environment. They are still contained within (secondary)
containment systems. Incidents where product has
reached the environment are reported as a release to the
environment.
INCIDENT PREVENTION AND EMERGENCY RESPONSE
An integral responsibility of storing hazardous products is
to reduce the risk of loss of containment incidents and to
have processes in place to mitigate the risks if there is a
loss of containment. We have uniform policies in place
globally to set the minimum requirements for the
prevention of loss of containment incidents.
Furthermore, we have established engineering standards
that set minimum requirements for asset integrity,
firefighting equipment, and terminal installations.
FY20
Tier 1 PSE 0
Tier 2 PSE 1
LOPC category A, B, C 6
PSE Tier 1 + Tier 2 rate* 0.11
*The process safety event rate (PSER) is defined as the number of Tier 1 + Tier 2 PSEs per
200,000 hours worked (LBC and contractor hours combined)
MAJOR LOPC A
more than 5m³ product released
SIGNIFICANT LOPC B
between 1m³ and 5m³ product released
LIMITED LOPC C
between 0.1m³ and 1m³ product released
2020 SUSTAINABILITY REPORT | 24
The TRIFR of 1.06 is well below our FY20 target of 1.69.
The TRIFR has been improving over the last few years
because of our continuous focus, initiatives and
communication on health and safety matters. Our end
goal is zero, i.e. no incidents where people are injured.
We are confident in our ambition considering that in
FY20, the US region concluded the fiscal year without a
recordable injury.
A safety improvement plan has been implemented to
provide measures to maintain the safety improvement
trend in all terminals we own and operate. A recent
analysis shows that the main causes of incidents are
related to the breach of one or more of our 20 critical
safety rules, training or competency failure and
equipment failure. To address these causes, we have put
programs in place that focus on awareness, behavior
and following procedures. Timely inspection and
maintenance of equipment is also addressed.
GLOBAL SAFETY CAMPAIGN – SLIPS, TRIPS AND FALLS
The analysis of OSHA recordable incidents showed us
that 30% of the injuries are caused by slip, trip and fall
incidents. To this end, we developed a safety campaign,
focusing on preventing these incidents through proper
design of the workplace, good housekeeping, and safe
walking practices. We communicated this campaign
internally, using posters, e-learnings, and a dedicated
intranet page as well as externally through social media
and our website.
WAY FORWARD
Our performance management system, which is
currently limited to the managerial level, will be
extended to all LBC employees, hereby enabling
everyone in our organization to consult a formal platform
to discuss performance, and address potential issues or
barriers. In addition, our new e-learning tool is in place
and various trainings have been rolled out throughout
the company. Our goal is to further optimize the tool and
increase the number of e-learnings provided, which will
allow us to be more responsive to the specific training
requirements of each of our locations.
OCCUPATIONAL HEALTH
AND SAFETY
SCOPE
Our motto is Always Safe, Never Sorry. We believe that all
occupational health and safety incidents are preventable.
We believe that everybody has the right to a safe working
environment and that everybody should return home from
work safely and well to their loved ones. Safety is a core
value that is part of all decision making at every level
within our organization. Everybody has a responsibility
and is empowered to make responsible decisions. To this
end, we deploy many resources in our Sustainable Safety
Behavior Program in which everybody who works at LBC
is coached to recognize hazards, identify and report
unsafe situations and carry out a successful safety
dialogue in order to ensure that our working environment
is a safe place.
We use the OSHA 1904 methodology for the classification
of occupational health and safety incidents. Injuries to
LBC employees and contractors are reported separately.
Furthermore, it should be noted that temporary
contractors who fill a position in the LBC organizational
structure or that report to an LBC employee fall under the
LBC employee category when it comes to incident
reporting. Injuries to contractors that do not fit this
definition are reported separately.
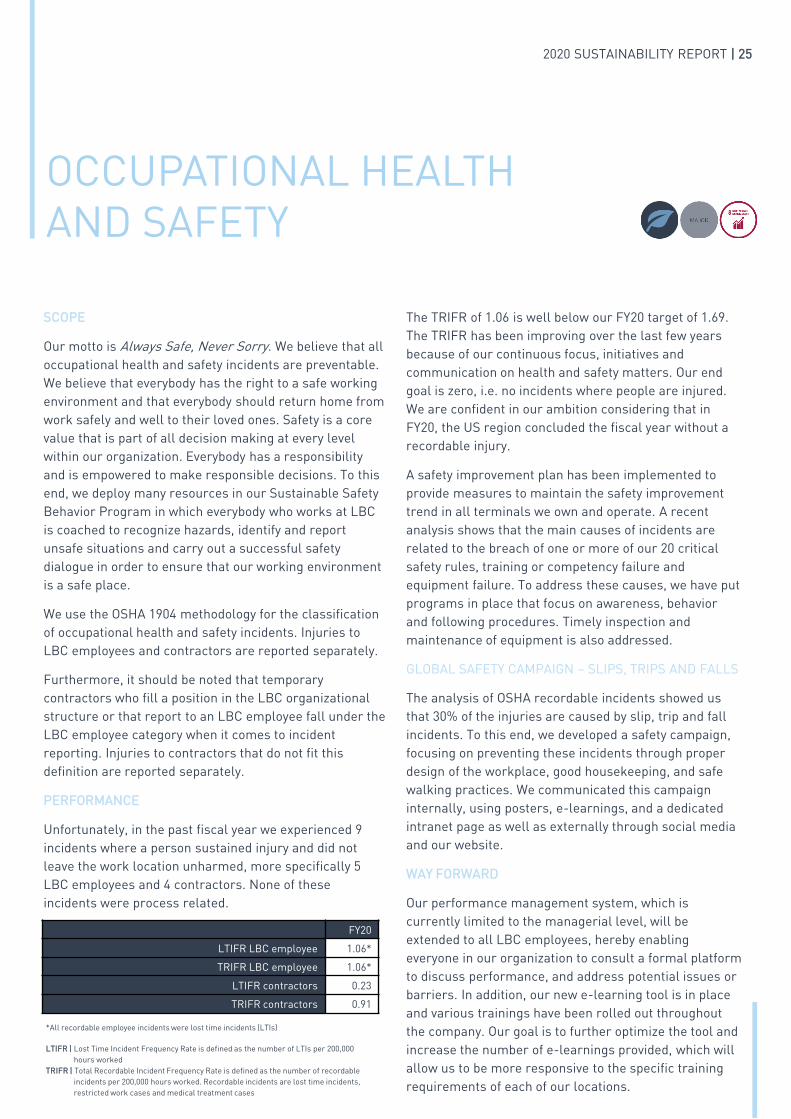
PERFORMANCE
Unfortunately, in the past fiscal year we experienced 9
incidents where a person sustained injury and did not
leave the work location unharmed, more specifically 5
LBC employees and 4 contractors. None of these
incidents were process related.
FY20
LTIFR LBC employee 1.06*
TRIFR LBC employee 1.06*
LTIFR contractors 0.23
TRIFR contractors 0.91
*All recordable employee incidents were lost time incidents (LTIs)
LTIFR | Lost Time Incident Frequency Rate is defined as the number of LTIs per 200,000
hours worked
TRIFR | Total Recordable Incident Frequency Rate is defined as the number of recordable
incidents per 200,000 hours worked. Recordable incidents are lost time incidents,
restricted work cases and medical treatment cases
2020 SUSTAINABILITY REPORT | 25
SCOPE
Talent attraction and retention is successfully managed by
empowering our workforce, recognizing the diversity
among our employees, and anticipating on their needs and
expectations by thinking more creatively and in a more
innovative way. In this part, we report on employee
training and development, employee wellbeing, absence
rate, diversity, and age distribution. The performance
metrics are reported for LBC employees. Any person with
an employment contract with LBC is referred to as an
employee.
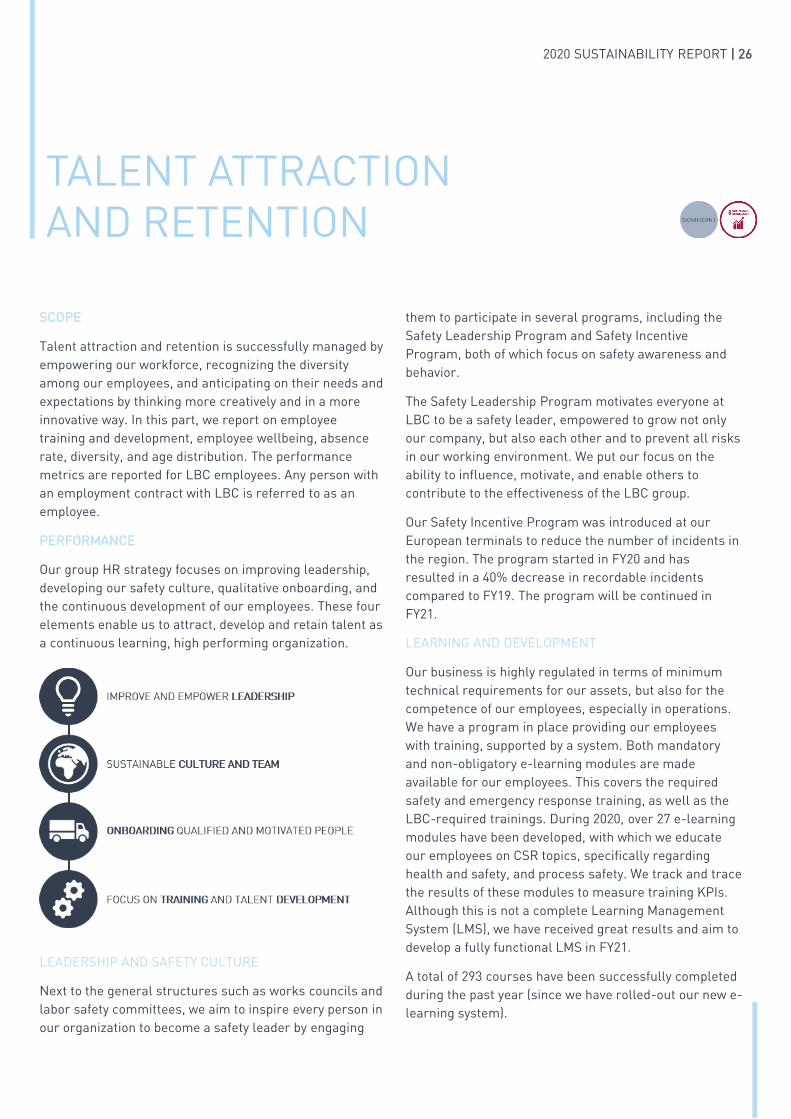
PERFORMANCE
Our group HR strategy focuses on improving leadership,
developing our safety culture, qualitative onboarding, and
the continuous development of our employees. These four
elements enable us to attract, develop and retain talent as
a continuous learning, high performing organization.
LEADERSHIP AND SAFETY CULTURE
Next to the general structures such as works councils and
labor safety committees, we aim to inspire every person in
our organization to become a safety leader by engaging
them to participate in several programs, including the
Safety Leadership Program and Safety Incentive
Program, both of which focus on safety awareness and
behavior.
The Safety Leadership Program motivates everyone at
LBC to be a safety leader, empowered to grow not only
our company, but also each other and to prevent all risks
in our working environment. We put our focus on the
ability to influence, motivate, and enable others to
contribute to the effectiveness of the LBC group.
Our Safety Incentive Program was introduced at our
European terminals to reduce the number of incidents in
the region. The program started in FY20 and has
resulted in a 40% decrease in recordable incidents
compared to FY19. The program will be continued in
FY21.
LEARNING AND DEVELOPMENT
Our business is highly regulated in terms of minimum
technical requirements for our assets, but also for the
competence of our employees, especially in operations.
We have a program in place providing our employees
with training, supported by a system. Both mandatory
and non-obligatory e-learning modules are made
available for our employees. This covers the required
safety and emergency response training, as well as the
LBC-required trainings. During 2020, over 27 e-learning
modules have been developed, with which we educate
our employees on CSR topics, specifically regarding
health and safety, and process safety. We track and trace
the results of these modules to measure training KPIs.
Although this is not a complete Learning Management
System (LMS), we have received great results and aim to
develop a fully functional LMS in FY21.
A total of 293 courses have been successfully completed
during the past year (since we have rolled-out our new e-
learning system).
TALENT ATTRACTION
AND RETENTION
2020 SUSTAINABILITY REPORT | 26
TALENT ATTRACTION
AND RETENTION
EMPLOYEE WELLBEING
Respect for work-life balance is key in our Retention
Policy. Flexibility is demanded and granted, especially
regarding workplace organization, telework and
commuting. Employees are provided with quality
equipment to allow them to operate in a safe and healthy
workplace. Not only are employees supported and
provided for at our facilities, they can rely on us for
improving their work environment at home.
Due to the COVID-19 pandemic, many of our employees
were required to telework. We displayed a procedure,
allowing our teleworkers to receive all materials
necessary to create a comfortable office space at home.
During this time, we communicated the risks of affected
work-life balance and possible burnout, and
recommended team leaders to regularly check on their
team members. In addition, update emails were sent out
to the group daily, communicating everything regarding
the pandemic (from sick leave to global statistics). For our
essential workers, on-site circulation plans were
developed immediately, providing the ability to follow
social distancing measures. Zero contact procedures were
developed to avoid any unnecessary contact with third
parties and visitors. Furthermore, we provided our
employees with the necessary supplies including face
masks and hand sanitizers.
Identifying and acknowledging the core needs of our
employees only contributes to our success as a company.
We therefore conducted an employee welfare survey with
questions focusing on personal wellbeing in both
professional and private environments of our employees
and offered guidance and assistance where needed or
desired. As we strive for continuous improvement in our
approach, we will assess the need for a more extensive
survey.
We aim to have a diverse workforce as we believe this is
key for better decision making and sustainable business
performance.
PERFORMANCE METRICS
We believe the absence rates and the staff turnover
rates at group level are acceptable, but we do recognize
that for some specific terminals additional efforts are
required to improve performance.
The absence rate is calculated by dividing the sick leave
hours by the regular hours, where regular hours are the
hours per work schedule.
We aim to have a diverse workforce as we believe this is
key for better decision making and sustainable business
performance. In FY20, the proportion of women in
(senior) leadership positions (ELT, global directors,
regional and terminal management) was 20%. This
number and the age distribution data below show that
there is room for improvement.
WAY FORWARD
We will continue to focus on maintaining safe and
healthy workplace standards for our employees. The
absence rate is an area of concern and we will assess
the need for additional action.
Furthermore, it has been recognized that there is a need
for a robust HR management system to enable the
monitoring of key indicators as described above and to
distribute e-learning modules and track progress.
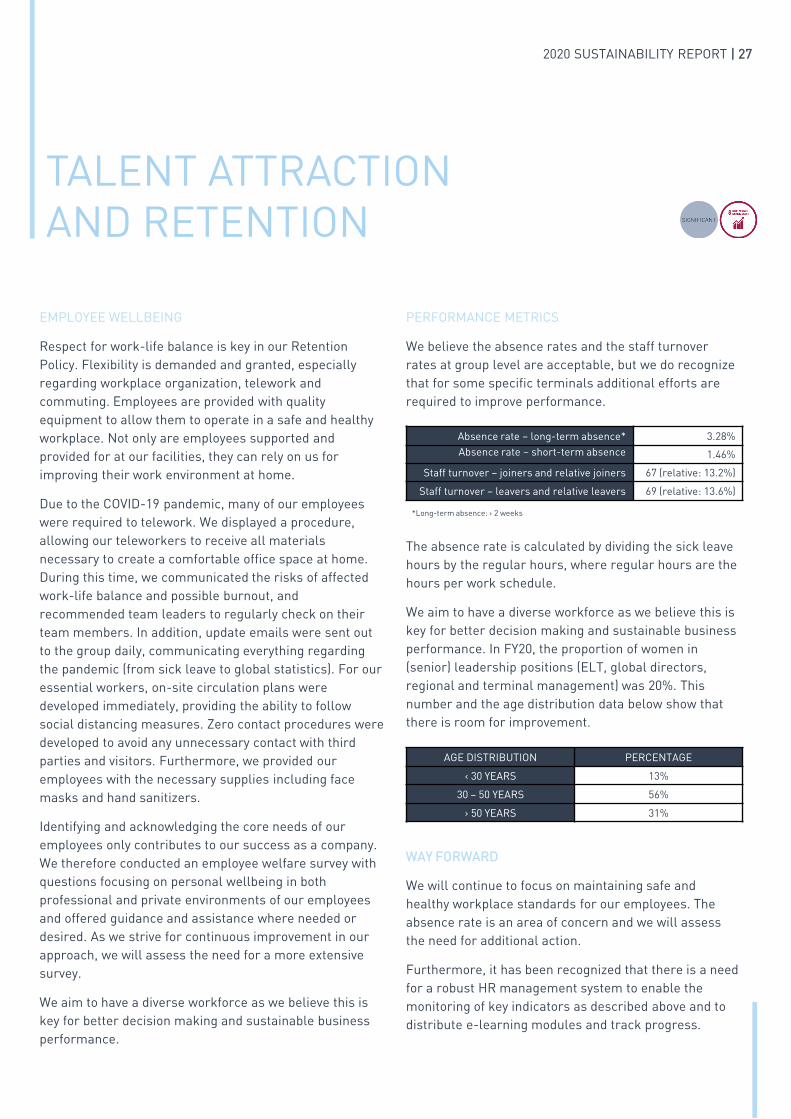
*Long-term absence: > 2 weeks
Absence rate – long-term absence* 3.28%
Absence rate – short-term absence 1.46%
Staff turnover – joiners and relative joiners 67 (relative: 13.2%)
Staff turnover – leavers and relative leavers 69 (relative: 13.6%)
AGE DISTRIBUTION PERCENTAGE
< 30 YEARS 13%
30 – 50 YEARS 56%
> 50 YEARS 31%
2020 SUSTAINABILITY REPORT | 27
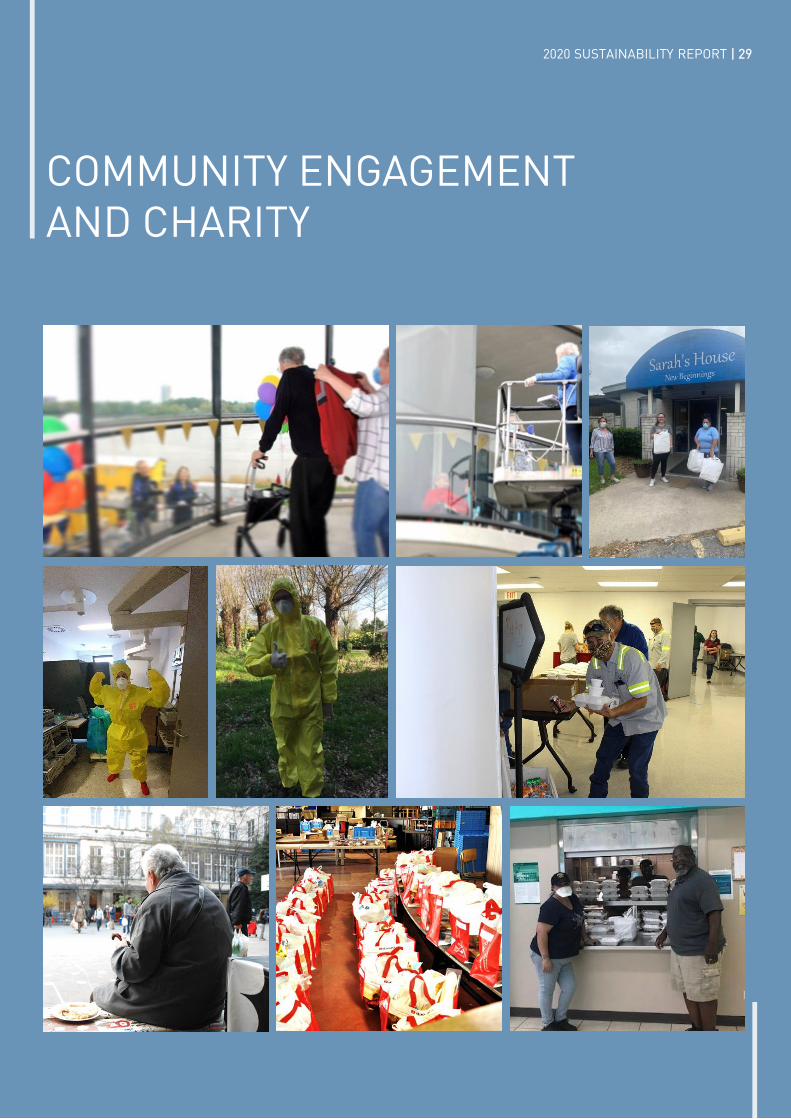
In the US, we overall supported the local economy and
non-profits simultaneously. This was achieved by means
of ordering and delivering food from local restaurants to
non-profit organizations that deal with the health crisis
daily. In addition, we made monetary donations to non-
profits, as well as monetary donations as scholarships
that are awarded to qualified students to enable them to
further their education in local colleges.
Along with monetary and supplementary donations, we
organized collection campaigns, assessed the needs of
each organization and consequently incentivized people
outside of our organization to contribute to these
charities as well.
WAY FORWARD
We continue to make monetary and supplementary
donations to educational organizations in our
communities in Europe and the US. Supplementary
donations consist of donating IT equipment to
organizations who refurbish and distribute e.g. laptops to
young schoolers in need of material to complete
schoolwork from home. Most of our support is based on
one-off charitable donations, however we envision to
engage in more long-term programs in the future.
COMMUNITY ENGAGEMENT
AND CHARITY
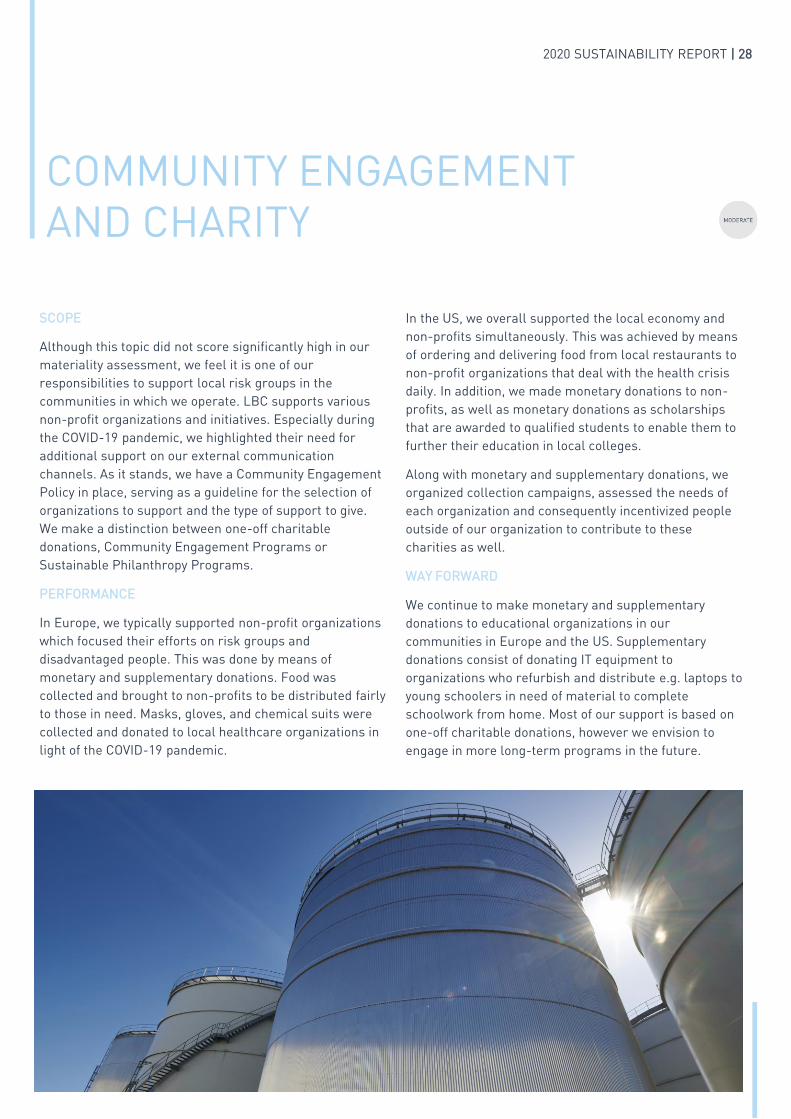
SCOPE
Although this topic did not score significantly high in our
materiality assessment, we feel it is one of our
responsibilities to support local risk groups in the
communities in which we operate. LBC supports various
non-profit organizations and initiatives. Especially during
the COVID-19 pandemic, we highlighted their need for
additional support on our external communication
channels. As it stands, we have a Community Engagement
Policy in place, serving as a guideline for the selection of
organizations to support and the type of support to give.
We make a distinction between one-off charitable
donations, Community Engagement Programs or
Sustainable Philanthropy Programs.
PERFORMANCE
In Europe, we typically supported non-profit organizations
which focused their efforts on risk groups and
disadvantaged people. This was done by means of
monetary and supplementary donations. Food was
collected and brought to non-profits to be distributed fairly
to those in need. Masks, gloves, and chemical suits were
collected and donated to local healthcare organizations in
light of the COVID-19 pandemic.
2020 SUSTAINABILITY REPORT | 28
COMMUNITY ENGAGEMENT
AND CHARITY
2020 SUSTAINABILITY REPORT | 29
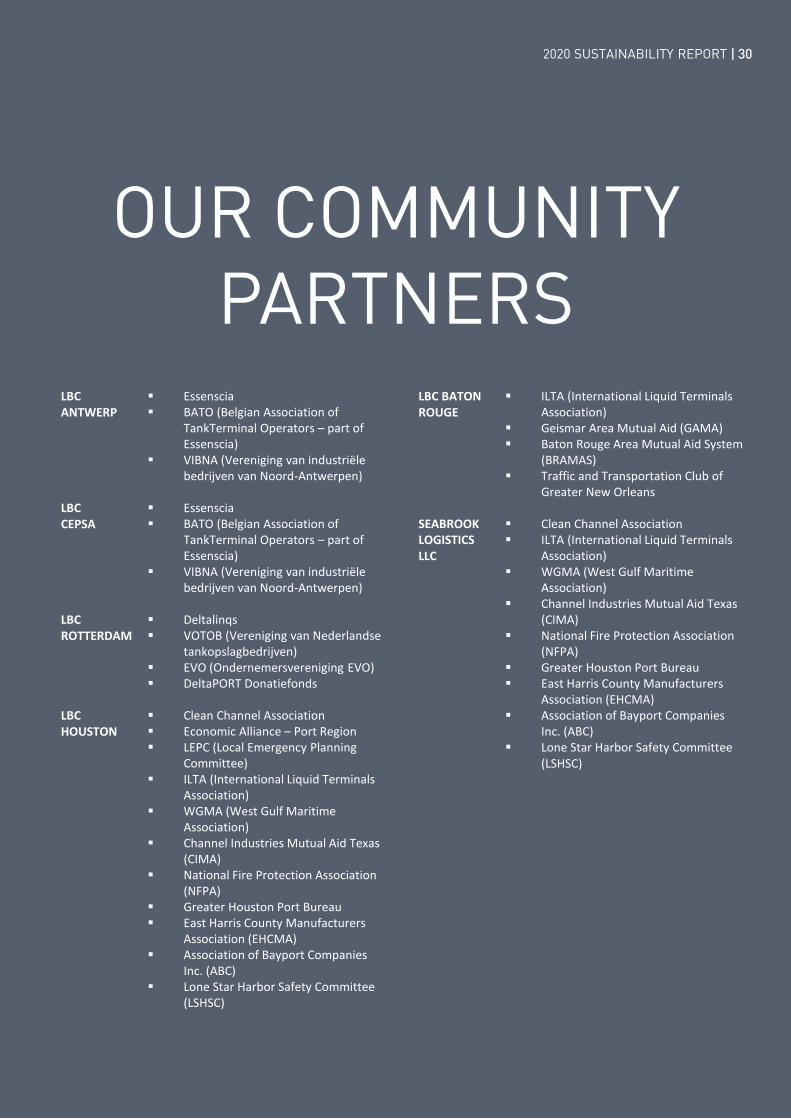
LBC BATON ROUGE
▪ ILTA (International Liquid Terminals Association)
▪ Geismar Area Mutual Aid (GAMA)▪ Baton Rouge Area Mutual Aid System
(BRAMAS)▪ Traffic and Transportation Club of
Greater New Orleans
SEABROOK LOGISTICS LLC
▪ Clean Channel Association ▪ ILTA (International Liquid Terminals
Association)▪ WGMA (West Gulf Maritime
Association)▪ Channel Industries Mutual Aid Texas
(CIMA)▪ National Fire Protection Association
(NFPA)▪ Greater Houston Port Bureau▪ East Harris County Manufacturers
Association (EHCMA)▪ Association of Bayport Companies
Inc. (ABC)▪ Lone Star Harbor Safety Committee
(LSHSC)
OUR COMMUNITY
PARTNERSLBC ANTWERP
▪ Essenscia▪ BATO (Belgian Association of
TankTerminal Operators – part of Essenscia)
▪ VIBNA (Vereniging van industriële bedrijven van Noord-Antwerpen)
LBC CEPSA
▪ Essenscia▪ BATO (Belgian Association of
TankTerminal Operators – part of Essenscia)
▪ VIBNA (Vereniging van industriële bedrijven van Noord-Antwerpen)
LBC ROTTERDAM
▪ Deltalinqs▪ VOTOB (Vereniging van Nederlandse
tankopslagbedrijven)▪ EVO (Ondernemersvereniging EVO)▪ DeltaPORT Donatiefonds
LBC HOUSTON
▪ Clean Channel Association▪ Economic Alliance – Port Region▪ LEPC (Local Emergency Planning
Committee) ▪ ILTA (International Liquid Terminals
Association)▪ WGMA (West Gulf Maritime
Association)▪ Channel Industries Mutual Aid Texas
(CIMA)▪ National Fire Protection Association
(NFPA)▪ Greater Houston Port Bureau▪ East Harris County Manufacturers
Association (EHCMA)▪ Association of Bayport Companies
Inc. (ABC)▪ Lone Star Harbor Safety Committee
(LSHSC)
2020 SUSTAINABILITY REPORT | 30
WATER, SOIL AND
GROUNDWATER POLLUTION
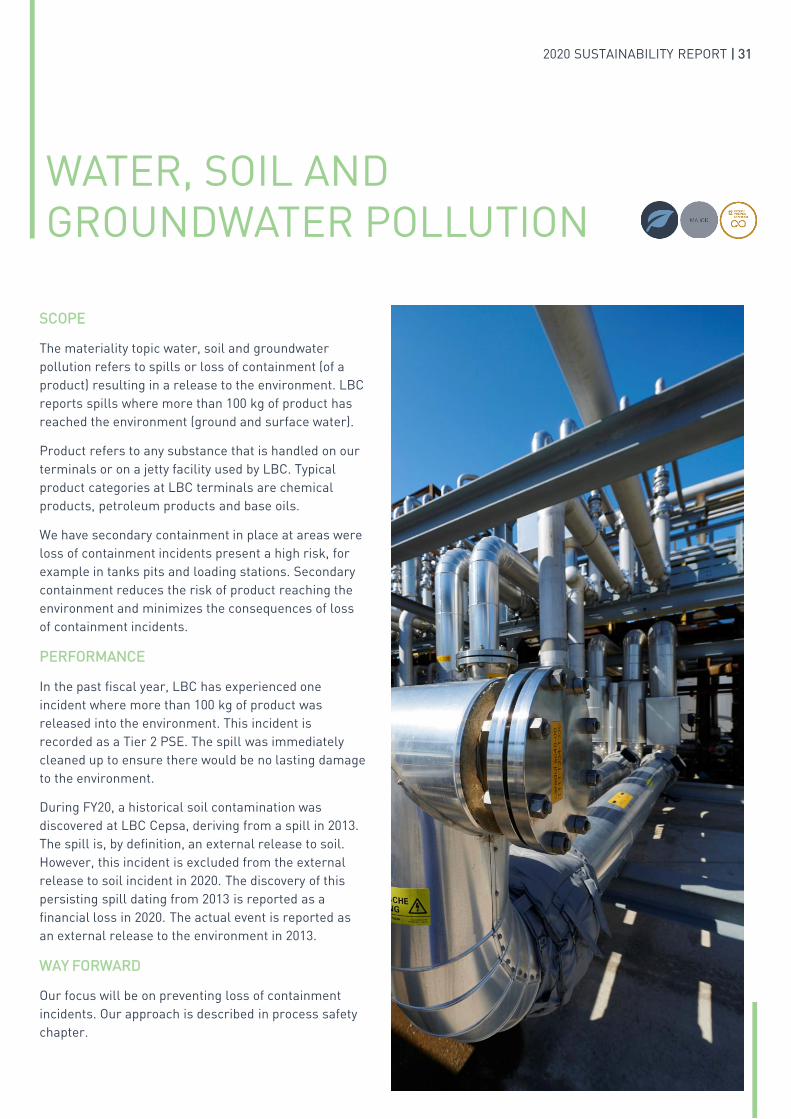
SCOPE
The materiality topic water, soil and groundwater
pollution refers to spills or loss of containment (of a
product) resulting in a release to the environment. LBC
reports spills where more than 100 kg of product has
reached the environment (ground and surface water).
Product refers to any substance that is handled on our
terminals or on a jetty facility used by LBC. Typical
product categories at LBC terminals are chemical
products, petroleum products and base oils.
We have secondary containment in place at areas were
loss of containment incidents present a high risk, for
example in tanks pits and loading stations. Secondary
containment reduces the risk of product reaching the
environment and minimizes the consequences of loss
of containment incidents.
PERFORMANCE
In the past fiscal year, LBC has experienced one
incident where more than 100 kg of product was
released into the environment. This incident is
recorded as a Tier 2 PSE. The spill was immediately
cleaned up to ensure there would be no lasting damage
to the environment.
During FY20, a historical soil contamination was
discovered at LBC Cepsa, deriving from a spill in 2013.
The spill is, by definition, an external release to soil.
However, this incident is excluded from the external
release to soil incident in 2020. The discovery of this
persisting spill dating from 2013 is reported as a
financial loss in 2020. The actual event is reported as
an external release to the environment in 2013.
WAY FORWARD
Our focus will be on preventing loss of containment
incidents. Our approach is described in process safety
chapter.
2020 SUSTAINABILITY REPORT | 31
Therefore, we have chosen to only report emissions from
these terminals. As we periodically monitor the VOC
emissions from the other terminals, including them in
future reporting will be considered if their contribution to
the total amount of VOC emissions increases.
VOC emissions are calculated using the EPA TANKS
4.09d software which is based on the EPA AP-42
standard. Tank-to-tank transfers are excluded from the
calculations. Vapor pressures from products are
calculated using the equations from EPA standard and
the Yaws Handbook of Vapor Pressure for products that
are not listed in the EPA standard.
PERFORMANCE
The amount of VOC emitted depends on several factors,
including product vapor pressure, temperature, tank
type and activities (e.g. roof landings and tank cleaning).
An additional analysis of the VOC emissions from our US
terminals shows that 75% of the emissions is related to
standing / working losses.
Furthermore, we have established a baseline for FY20 in
terms of grams VOC per metric ton throughput.
WAY FORWARD
It is our objective to minimize VOC emissions. We will
assess opportunities for improvement and determine
priorities for investments. In addition, we will also
explore possibilities to measure and report emissions
such as NOx and SOx in the future.
VOC
EMISSIONS
SCOPE
Some of the products we store for our customers are
classified as volatile organic compounds (VOCs). These are
products that easily evaporate at ambient temperature.
VOCs can be hazardous for people and the environment.
Sources of VOC vapor emissions include tank losses from
routine operations and venting, emissions from loading
and emissions when cleaning tanks.
Tank losses from routine operations can be categorized as
standing / breathing loss, working loss from a fixed roof
tank, or working loss from a tank with an internal floating
roof.
Standing/breathing loss is the release of emissions from a
tank due to vapor expansion and contraction that results
from changes in temperature and barometric pressure.
Working loss from a fixed roof tank is the evaporative loss
of filling. Emissions due to filling operations are the result
of an increase in the liquid level in the tank. As the liquid
level increases, the pressure inside the vapor space
increases and vapors are expelled from the tank through
vents.
Working loss from a tank with an internal floating roof is
derived from the evaporative loss during liquid withdrawal
from the tank. When the liquid level is lowered, the
floating roof is also lowered. Liquid remains on the inner
tank walls and columns and evaporates.
Emissions from loading are a result of the transfer of
products out of the facility (i.e. rail car, tank truck, or
marine vessel).
Emissions from cleaning refers to emissions from gas
freeing of tanks before cleaning.
We aim to minimize the emission of these VOCs by
applying technical measures on storage tanks and by
installing vapor treatment units. We estimate that
approximately 97% of the VOC emissions is derived from
our terminals Bayport, Seabrook, and Sunshine1.
*VOC and throughput: Bayport, Seabrook and Sunshine
kg VOC emissions (x1000) 95.41
g VOC per metric ton throughput* 5.14
ACTIVITY TYPE RELATIVE CONTRIBUTION
TANK STANDING / WORKING 75%
LOADING 16%
ROOF LANDING / FLOATING 7%
TANK CLEANING 2%
2020 SUSTAINABILITY REPORT | 32
1This is based on the emission calculations from the European terminals using methodologies
prescribed by local legislation. Freeport is exempt from reporting VOC emissions to the local
authorities as the VOC potential to emit is less than the threshold limit.
PERFORMANCE
We use the following CO2 emission factors and energy
conversion factors:
All emission calculations are in accordance with the
Greenhouse Gas (GHG) Protocol. Scope 1 emissions are
calculated by multiplying the natural gas consumption by
the emission factor for natural gas. Scope 2 emissions
are calculated by multiplying the electricity consumption
by the electricity emission factors and multiplying the
steam consumption by the steam emission factor.
It should be noted that market- and location-based
scope 2 emissions are included in the scope of this
report. The location-based method reflects the average
emission intensity of grids on which electricity
consumption occurs. The market-based method
considers emissions from the specific electricity
providers used by LBC. For the calculation of the
location-based emissions, the electricity consumption is
multiplied by IEA/eGrid emission factors. For the
market-based emission, the electricity consumption is
multiplied by the emission factors provided by the
electricity suppliers.
Energy intensity is defined as energy consumption
(electricity, natural gas and purchased steam) in MJ per
metric ton throughput.
CO2 EMISSIONS
AND ENERGY USE
According to our materiality assessment, CO2 emissions
and energy use are not considered major material topics.
However, LBC has decided to report on our approach as
we consider this a highly relevant matter for our business
and the environment.
SCOPE
LBC’s reporting of CO2 emissions encompasses emissions
from the combustion of natural gas (scope 1) and
emissions from purchased electricity (scope 2). Natural
gas is typically used for producing steam to heat tanks, as
well as to operate vapor abatement systems. Main
consumers of electricity are i.e. heat tracing, lighting, and
pumps. We do not report on scope 3 emissions. Scope 3
emissions include for example employee travel,
commuting and emissions associated with contracted
solid waste disposal and wastewater treatment.
In scope are all LBC terminals, except for Freeport. The
global corporate head office in Mechelen and the regional
office in Houston are also excluded as these locations do
not have operational (terminal) activities. At our LBC
Cepsa location, natural gas is not used, however, there is
use of steam produced by an external party. The latter is
therefore included in the scope 2 emissions.
At Freeport, utilities are contractually supplied by the
customer to support the operations of the terminal. The
assets are not metered separately, hence making it
currently impossible to track usage. Unlike LBC Cepsa,
LBC Freeport does not use natural gas in the terminal to
support operations. Alternatively, electricity is used at the
Freeport location.
Other energy sources such as diesel, petrol, LPG, and
propane account for less than 5% of the total energy use
and CO2 emissions from LBC’s terminal operations. As the
contribution of these sources to the total amount is rather
limited, they have been excluded from the current report.
As we periodically monitor the use of these energy
sources, including them in future reporting will be
considered if their contribution to the total amount of
energy use increases.
FY20
Energy intensity
(MJ per metric ton throughput)48.06
EMISSION FACTORS NATURAL GAS
Bilan Carbone V8.4
EMISSION FACTORS ELECTRICITY – MARKET-BASED
provided by supplier
EMISSION FACTORS ELECTRICITY – LOCATION-BASED
IEA (European terminals), eGrid Jan 2020 (US terminals)
EMISSION FACTOR STEAM
provided by supplier
ENERGY CONVERSION FACTOR NATURAL GAS
IEA
2020 SUSTAINABILITY REPORT | 33
CO2 intensity is defined as total CO2 emissions in kg per
metric ton throughput. Total emissions are defined as
scope 1 emissions + scope 2 emissions.
PROJECTS
As almost all the CO2 emissions are related to
combustion of natural gas and production of electricity,
the energy efficiency projects are targeted towards these
energy sources.
We have projects running in all terminals to upgrade
lighting with LED lights, and we are continuously
improving energy efficiency by replacement or repair of
insulation systems on tanks and piping. Furthermore, we
have eliminated various sections of old steam piping in
our Rotterdam terminal to reduce distribution losses.
In addition, we are installing new steam boilers and a new
warm water installation at our Antwerp terminal. This will
increase the overall energy efficiency. Moreover, the
optimization of energy will be achieved by a relocation of
the renewed water installation close to the steam boilers,
which allows for an efficient recovery of condensate, and
by the installation of an economizer and a vent condenser,
both making more efficient use of the produced heat.
Where feasible, hydraulic pumps are substituted with
electrical pumps with variable speed drives (VSD). VSD
control has several benefits in pumping systems, the
most important one being energy saving.
*Scope 2: market-based conversion factors used for all terminals, except Antwerp and
Cepsa, where location-based conversion factors are used as market-based conversion
factors were not available.
Lastly, in our Houston terminal, we are upgrading the
existing vapor treatment systems (flares) to be more
efficient. Our Seabrook terminal is already equipped with
a new type of vapor treatment system that is more
efficient than the older types.
WAY FORWARD
LBC Rotterdam participates in the Energy Efficiency
Covenant. Our Rainbow expansion project provides an
excellent opportunity to explore more efficient ways of
generating heating for the tanks. Options under review
include the replacement of old boilers with more
efficient boilers, the re-use of the heat produced in our
vapor treatment system (incinerator), use of solar panels
or other green energy supply to produce hydrogen, which
we can use in our incinerator and heating/boilers, the
installation of electro boilers and, alternately or
combined, solar panels and storage of heat in a heat
buffer used for heating tanks.
Much like in Rotterdam, we continue to explore
opportunities in other terminals to improve energy-
efficiency and reduce CO2 emissions.
Energy intensity (MJ per metric ton throughput) 48.06
Scope 1 emissions (metric ton CO2 x1000) 40.38
Scope 2 emissions – market-based (metric ton CO2 x1000) 11.91
Scope 2 emissions – location-based (metric ton CO2 x1000)* 11.61
Total emissions market-based (metric ton CO2 x1000) 52.29
Total emissions location-based (metric ton CO2 x1000) 51.98
CO2 intensity (kg CO2 per ton throughput) – market-based 2.56
CO2 intensity (kg CO2 per ton throughput) – location-based* 2.55
2020 SUSTAINABILITY REPORT | 34
CO2 EMISSIONS
AND ENERGY USE
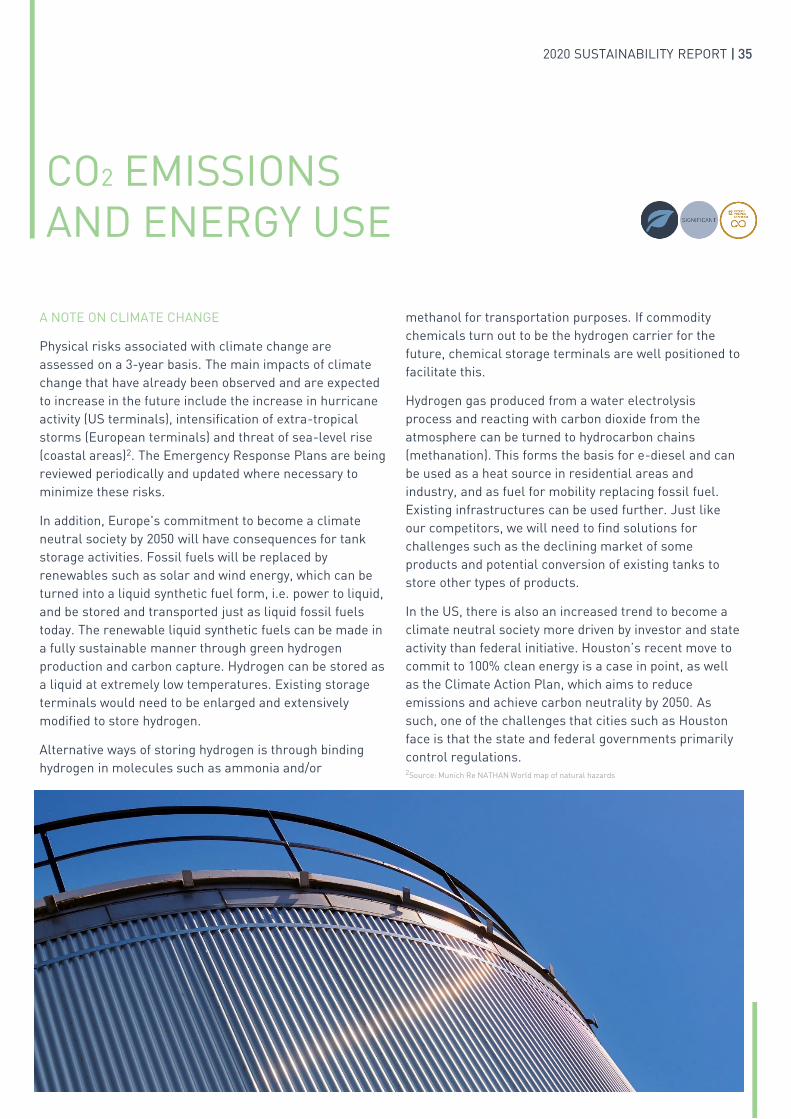
methanol for transportation purposes. If commodity
chemicals turn out to be the hydrogen carrier for the
future, chemical storage terminals are well positioned to
facilitate this.
Hydrogen gas produced from a water electrolysis
process and reacting with carbon dioxide from the
atmosphere can be turned to hydrocarbon chains
(methanation). This forms the basis for e-diesel and can
be used as a heat source in residential areas and
industry, and as fuel for mobility replacing fossil fuel.
Existing infrastructures can be used further. Just like
our competitors, we will need to find solutions for
challenges such as the declining market of some
products and potential conversion of existing tanks to
store other types of products.
In the US, there is also an increased trend to become a
climate neutral society more driven by investor and state
activity than federal initiative. Houston’s recent move to
commit to 100% clean energy is a case in point, as well
as the Climate Action Plan, which aims to reduce
emissions and achieve carbon neutrality by 2050. As
such, one of the challenges that cities such as Houston
face is that the state and federal governments primarily
control regulations.
A NOTE ON CLIMATE CHANGE
Physical risks associated with climate change are
assessed on a 3-year basis. The main impacts of climate
change that have already been observed and are expected
to increase in the future include the increase in hurricane
activity (US terminals), intensification of extra-tropical
storms (European terminals) and threat of sea-level rise
(coastal areas)2. The Emergency Response Plans are being
reviewed periodically and updated where necessary to
minimize these risks.
In addition, Europe's commitment to become a climate
neutral society by 2050 will have consequences for tank
storage activities. Fossil fuels will be replaced by
renewables such as solar and wind energy, which can be
turned into a liquid synthetic fuel form, i.e. power to liquid,
and be stored and transported just as liquid fossil fuels
today. The renewable liquid synthetic fuels can be made in
a fully sustainable manner through green hydrogen
production and carbon capture. Hydrogen can be stored as
a liquid at extremely low temperatures. Existing storage
terminals would need to be enlarged and extensively
modified to store hydrogen.
Alternative ways of storing hydrogen is through binding
hydrogen in molecules such as ammonia and/or
2020 SUSTAINABILITY REPORT | 35
CO2 EMISSIONS
AND ENERGY USE
2Source: Munich Re NATHAN World map of natural hazards
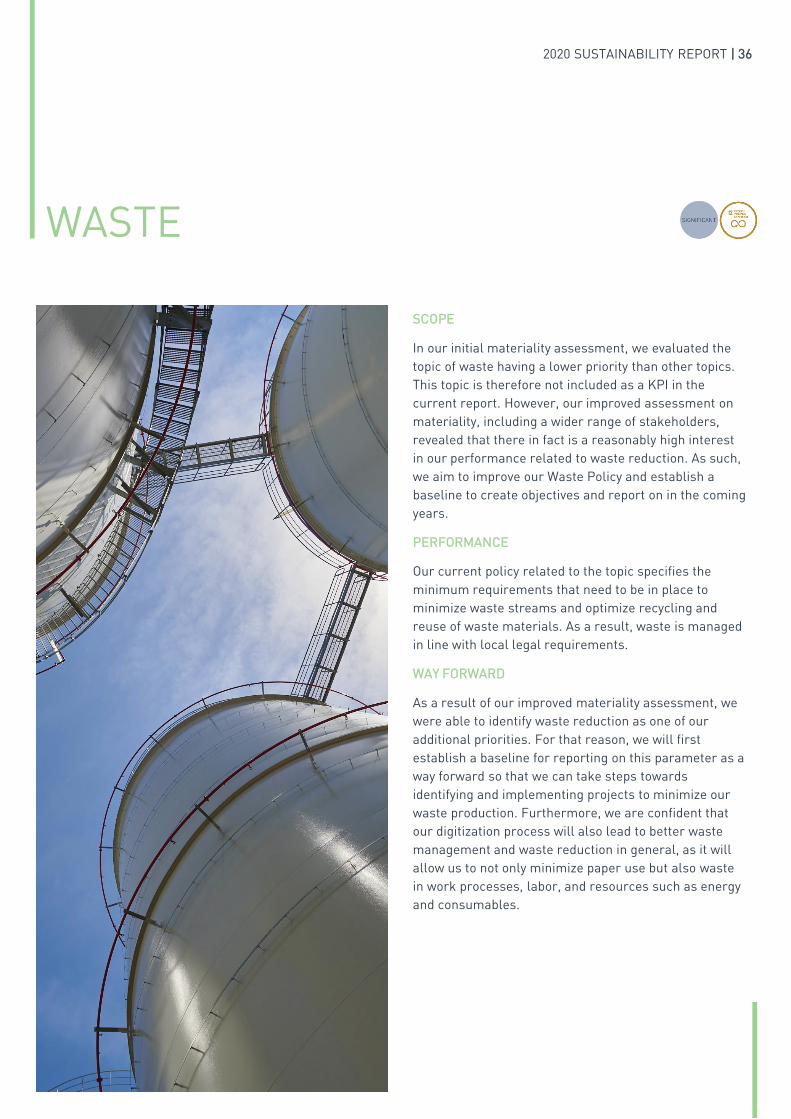
WASTE
SCOPE
In our initial materiality assessment, we evaluated the
topic of waste having a lower priority than other topics.
This topic is therefore not included as a KPI in the
current report. However, our improved assessment on
materiality, including a wider range of stakeholders,
revealed that there in fact is a reasonably high interest
in our performance related to waste reduction. As such,
we aim to improve our Waste Policy and establish a
baseline to create objectives and report on in the coming
years.
PERFORMANCE
Our current policy related to the topic specifies the
minimum requirements that need to be in place to
minimize waste streams and optimize recycling and
reuse of waste materials. As a result, waste is managed
in line with local legal requirements.
WAY FORWARD
As a result of our improved materiality assessment, we
were able to identify waste reduction as one of our
additional priorities. For that reason, we will first
establish a baseline for reporting on this parameter as a
way forward so that we can take steps towards
identifying and implementing projects to minimize our
waste production. Furthermore, we are confident that
our digitization process will also lead to better waste
management and waste reduction in general, as it will
allow us to not only minimize paper use but also waste
in work processes, labor, and resources such as energy
and consumables.
2020 SUSTAINABILITY REPORT | 36
EXAMPLE OF GOOD BUSINESS ETHICS
SHIPDOCK 5 (SD5) CONSTRUCTION ACTIVITIES IN SEABROOK
We anticipated that the construction project to build SD5 would
receive several noise complaints associated with pile driving of the
72" piles making up the combi-wall section of the dock. We
monitored noise at our fence line and in the community at 3
different locations and limited construction hours from 8AM to 5PM
Monday through Friday. Furthermore, we set up a website and
neighbor helpline to provide updates on construction activities. In a
final instance, we organized an open house, which was attended by
60 to 70 residents, where we informed the local community on the
project.
BUSINESS ETHICS
AND INTEGRITY
SCOPE
LBC’s code of ethics covers anti-bribery, competition
law, health and safety, and more. Moreover, it serves as
a guideline for our employees to act accordingly and
make correct decisions in their everyday work. Local
procedures are in place to enable reports of any
behavior not in line with the code of ethics. We are
honest and conduct our activities with strong moral
principles and continually strive to do what is right and
avoid harm. We have policies in place to ensure that
possible conflicts of interest are reported directly, that
competition is fair, and that we do not commit or
succumb to bribery or corruption in any form.
Furthermore, a Whistleblower Policy is implemented
and allows reporting of important ethical issues straight
to the highest level of the organization and, if preferred,
anonymously.
PERFORMANCE
At LBC, we build an environment where everyone feels
valued and enabled to contribute their best to the
company and to society. To put this into practice, it is
important to create ethical values in line with our
corporate policy.
TRAINING
Our employees are trained on business ethics, anti-
corruption, and whistleblowing procedures through our
recently developed e-learning modules. Since the roll-
out of the modules in May 2020, 137 LBC employees
successfully completed the business ethics e-learning
module. This was the first wave and included all LBC
management. The second wave will include all other LBC
employees. In addition, the module is now implemented
in our onboarding process.
WHISTLEBLOWING
Stakeholders can report unethical, illegal or
irresponsible acts via our whistleblower communication
service [email protected]. This process is available
for employees and third parties, including contractors
and suppliers. The mechanism can be used anonymously
and is communicated via posters, e-learning, and the
LBC website. In FY20, there was one case reported via
the whistleblower process. After thorough investigation,
the case was revisited as an employment grievance and
action has been taken to follow-up on the reported
issues.
NON-COMPLIANCE
Non-compliances are reported via the incident reporting
process and followed up by the local terminal
management teams. Non-compliances may include
actions against legal or other requirements such as ISO
or customer requirements.
PERMIT VIOLATIONS
We report on violations of environmental and safety
regulations that resulted in a fine. In FY20, we have
received three fines for environmental permit violations,
all of which are categorized as minor3 fines. These minor
fines are related to incidents that occurred in FY16, FY17
and FY19. As they are not related to incidents in FY20,
they are not in scope for this Sustainability Report.
WAY FORWARD
We will continue to increase awareness on business
ethics and integrity and will consequently assess the
need for group policy on a grievance mechanism. We aim
to train all LBC employees in business ethics, as we
progress towards the second wave of the business ethics
training program.
2020 SUSTAINABILITY REPORT | 37
3Minor fine ( < 5,000 USD), limited fine ( > 5,000 USD and < 10,000 USD), significant fine ( > 10,000
USD and < 50,000 USD) and major fine ( > 50,000 USD)
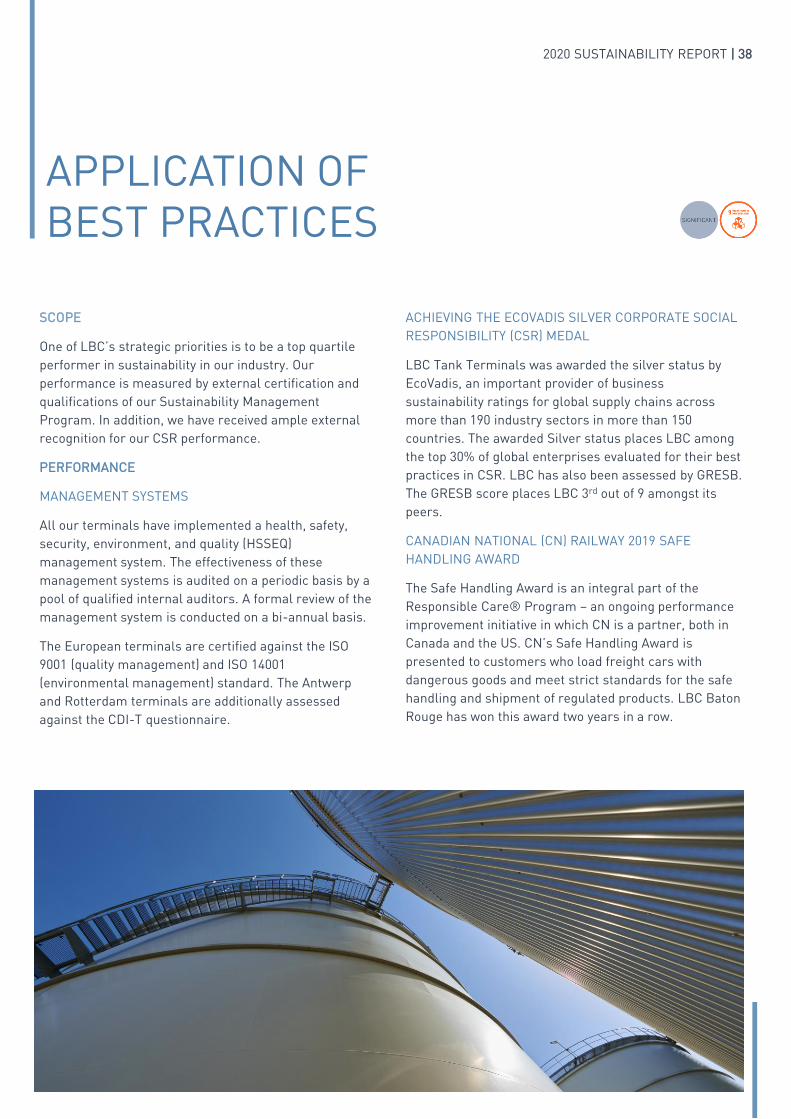
ACHIEVING THE ECOVADIS SILVER CORPORATE SOCIAL
RESPONSIBILITY (CSR) MEDAL
LBC Tank Terminals was awarded the silver status by
EcoVadis, an important provider of business
sustainability ratings for global supply chains across
more than 190 industry sectors in more than 150
countries. The awarded Silver status places LBC among
the top 30% of global enterprises evaluated for their best
practices in CSR. LBC has also been assessed by GRESB.
The GRESB score places LBC 3rd out of 9 amongst its
peers.
CANADIAN NATIONAL (CN) RAILWAY 2019 SAFE
HANDLING AWARD
The Safe Handling Award is an integral part of the
Responsible Care® Program – an ongoing performance
improvement initiative in which CN is a partner, both in
Canada and the US. CN’s Safe Handling Award is
presented to customers who load freight cars with
dangerous goods and meet strict standards for the safe
handling and shipment of regulated products. LBC Baton
Rouge has won this award two years in a row.
APPLICATION OF
BEST PRACTICES
SCOPE
One of LBC’s strategic priorities is to be a top quartile
performer in sustainability in our industry. Our
performance is measured by external certification and
qualifications of our Sustainability Management
Program. In addition, we have received ample external
recognition for our CSR performance.
PERFORMANCE
MANAGEMENT SYSTEMS
All our terminals have implemented a health, safety,
security, environment, and quality (HSSEQ)
management system. The effectiveness of these
management systems is audited on a periodic basis by a
pool of qualified internal auditors. A formal review of the
management system is conducted on a bi-annual basis.
The European terminals are certified against the ISO
9001 (quality management) and ISO 14001
(environmental management) standard. The Antwerp
and Rotterdam terminals are additionally assessed
against the CDI-T questionnaire.
2020 SUSTAINABILITY REPORT | 38
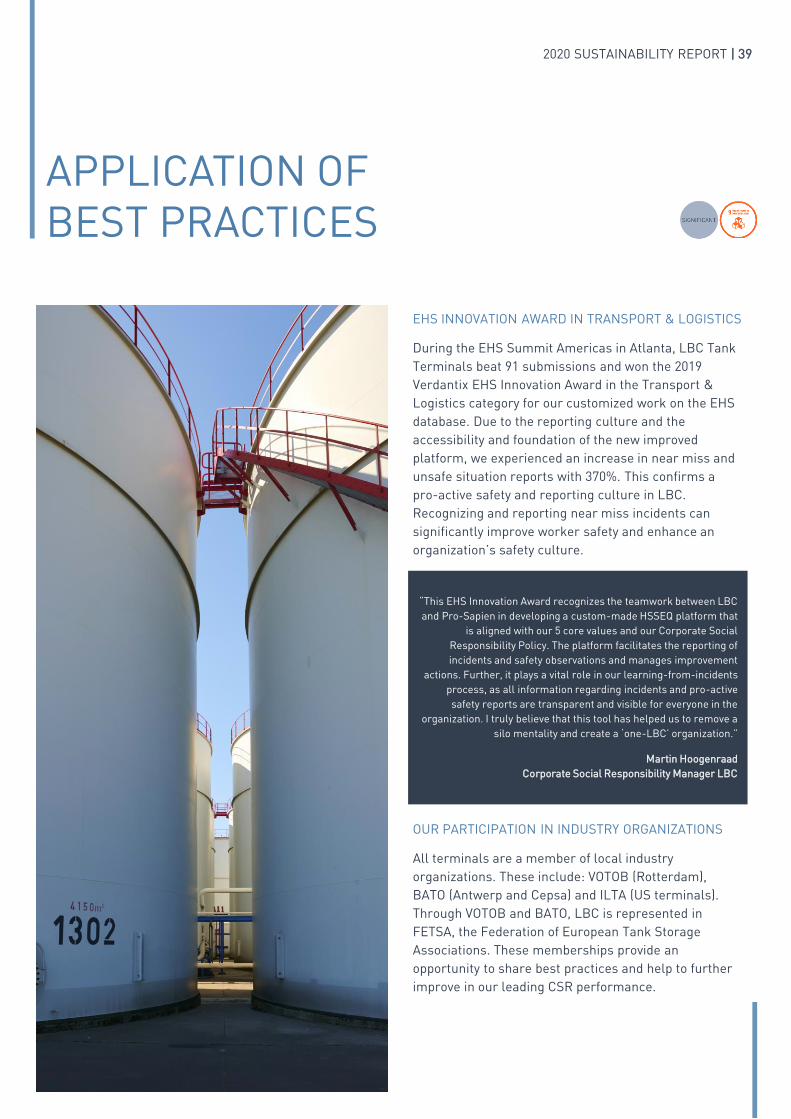
EHS INNOVATION AWARD IN TRANSPORT & LOGISTICS
During the EHS Summit Americas in Atlanta, LBC Tank
Terminals beat 91 submissions and won the 2019
Verdantix EHS Innovation Award in the Transport &
Logistics category for our customized work on the EHS
database. Due to the reporting culture and the
accessibility and foundation of the new improved
platform, we experienced an increase in near miss and
unsafe situation reports with 370%. This confirms a
pro-active safety and reporting culture in LBC.
Recognizing and reporting near miss incidents can
significantly improve worker safety and enhance an
organization’s safety culture.
OUR PARTICIPATION IN INDUSTRY ORGANIZATIONS
All terminals are a member of local industry
organizations. These include: VOTOB (Rotterdam),
BATO (Antwerp and Cepsa) and ILTA (US terminals).
Through VOTOB and BATO, LBC is represented in
FETSA, the Federation of European Tank Storage
Associations. These memberships provide an
opportunity to share best practices and help to further
improve in our leading CSR performance.
APPLICATION OF
BEST PRACTICES
“This EHS Innovation Award recognizes the teamwork between LBC
and Pro-Sapien in developing a custom-made HSSEQ platform that
is aligned with our 5 core values and our Corporate Social
Responsibility Policy. The platform facilitates the reporting of
incidents and safety observations and manages improvement
actions. Further, it plays a vital role in our learning-from-incidents
process, as all information regarding incidents and pro-active
safety reports are transparent and visible for everyone in the
organization. I truly believe that this tool has helped us to remove a
silo mentality and create a ‘one-LBC’ organization.”
Martin Hoogenraad
Corporate Social Responsibility Manager LBC
2020 SUSTAINABILITY REPORT | 39
CUSTOMER
FOCUS
SCOPE
LBC aims to be the preferred independent global
provider of bulk liquid storage solutions. Our
infrastructure is considered an integral part of the
logistical supply chain of our customers. Our global
footprint consists of facilities located in Europe and
America serving over 100 customers, who we aim to
provide with the safest, most reliable, and efficient tank
storage and logistical solutions. By trusting their
products to be stored in our tanks, we realize that we
must continue to work hard every day to earn such trust
of being selected as the preferred supplier. As such,
this chapter covers our customer satisfaction,
complaints, and engagement.
PERFORMANCE
To ensure our customers’ product integrity, we are
following a strict RFP (Request for Proposal) procedure
that involves joint evaluation of a customer inquiry by
various key departments before accepting any new
product at our terminals. To execute a service order in
time and correctly, our customers follow a standard
nomination procedure. Integration with customers’ ERP
to deliver a seamless and standard nomination process
through EDI or any electronic interface will aid in
further optimizing available time, assets, and
manpower to serve our customers as optimal as
possible.
Customer focus is one of the core fundaments at LBC.
Referred to as Customer@Heart, we aim to meet or
even exceed service expectations and consider this a
standard practice. In carrying Customer@Heart, we aim
to deliver around the clock and near-real time stock
and order information, hereby creating higher value for
our customers by providing them stock information for
their rented tanks and products and order status for
vessels, barges, trucks, rail and pump-over
movements.
Customer performance meetings are held monthly.
Various KPIs related to LBC’s performance (e.g. Truck
and Vessel Turn Around Times [TTAT, VTAT] and safety
performance and individual incidents reporting) are
shared with our customers and discussed during these
regular customer performance meetings, where we tend
to see an overall focus on occupational health and safety
performance.
Some of our customers conduct audits at our facilities.
We encourage these audits as we believe these help us to
improve our performance and instill confidence in our
operational capabilities.
Another vital part of the overall supply chain is to serve
the customers of our customers and other 3rd parties,
such as surveyors and transport companies. Connecting
these parties seamlessly requires flexibility, service, and
dedication. It is therefore fundamental that we are always
focused to work as efficiently as possible to ensure a
sustainable flow of products and processes for and on
behalf of our customers.
CUSTOMER COMPLAINTS
We perform a strict follow-up of customer complaints and
handle them similarly to safety related incidents.
Complaints are categorized and integrated into the
database based on a 4-level severity scale. Depending on
the severity of the complaint, further investigation will be
initiated. Our management teams discuss light category
incidents during review meetings and provide feedback to
our customers. Incidents rated as severe follow a
thorough and structured incident investigation. In such a
situation, a multidisciplinary team takes the lead and the
actions are logged into the central action manager
database.
WAY FORWARD
In the upcoming year, we are planning to launch a
customer satisfaction survey. The results will show the
key areas for further improvement and will allow us to
further focus on what is @Heart for our customers. In
addition, we are improving our overall service levels and
will continue the process of optimizing our customer
portal. Further transparency will be delivered along the
continued maximization of automation providing real-time
information on the customized dashboard.
2020 SUSTAINABILITY REPORT | 40
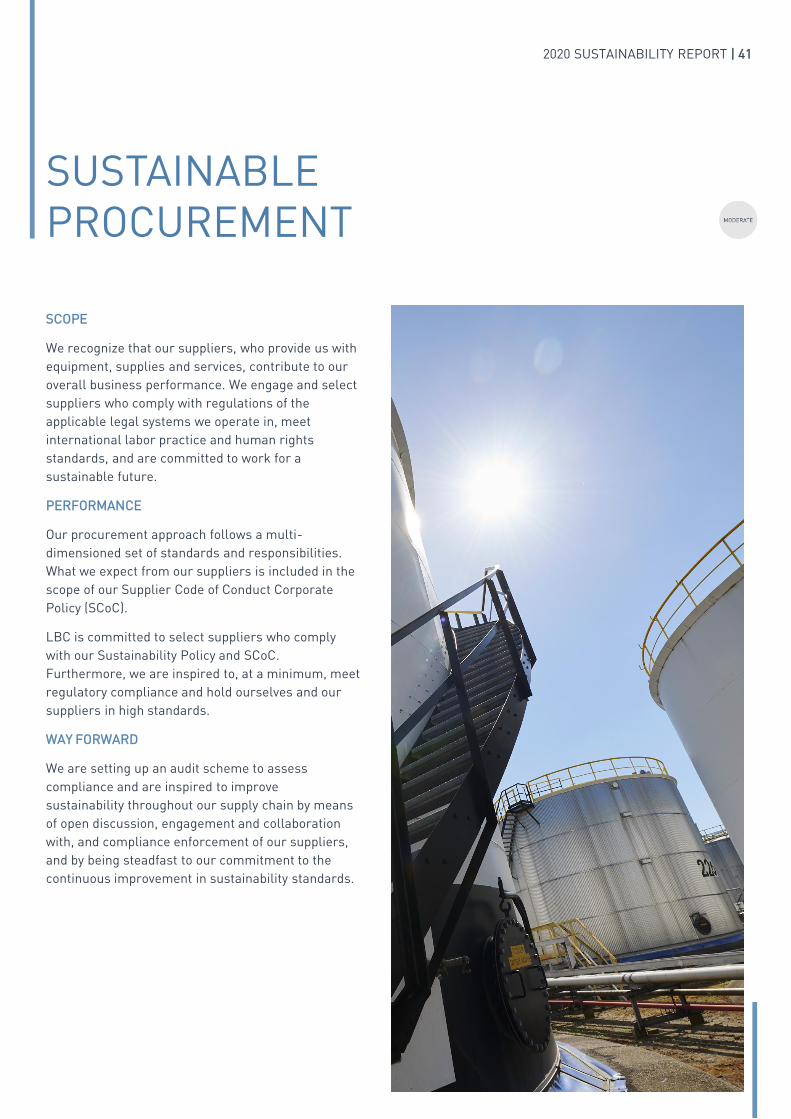
SCOPE
We recognize that our suppliers, who provide us with
equipment, supplies and services, contribute to our
overall business performance. We engage and select
suppliers who comply with regulations of the
applicable legal systems we operate in, meet
international labor practice and human rights
standards, and are committed to work for a
sustainable future.
PERFORMANCE
Our procurement approach follows a multi-
dimensioned set of standards and responsibilities.
What we expect from our suppliers is included in the
scope of our Supplier Code of Conduct Corporate
Policy (SCoC).
LBC is committed to select suppliers who comply
with our Sustainability Policy and SCoC.
Furthermore, we are inspired to, at a minimum, meet
regulatory compliance and hold ourselves and our
suppliers in high standards.
WAY FORWARD
We are setting up an audit scheme to assess
compliance and are inspired to improve
sustainability throughout our supply chain by means
of open discussion, engagement and collaboration
with, and compliance enforcement of our suppliers,
and by being steadfast to our commitment to the
continuous improvement in sustainability standards.
SUSTAINABLE
PROCUREMENT
2020 SUSTAINABILITY REPORT | 41

SCOPE
We live in a digital and challenging world where every 39
seconds a hacking attempt is registered. With the
average cost of a data breach being $8 million, the need
to protect our business information is at an all-time high.
In response to hackers working around the clock to find
vulnerabilities into our systems, we continuously improve
our cybersecurity profile and consider this as a priority.
Our strategy is focused on the reduction of our detection
cycle time by regularly assessing our risks, planning our
response adequately in case of an incident, while
continuously creating awareness across all stakeholders
and protecting all our data. Furthermore, our approach is
built on two international standard frameworks, namely
the ISO/IEC/ISA risk framework and the NIST control
framework.
PERFORMANCE
In alignment with the NIST framework, we build the
necessary protective layers and internet defense for all
our functions, hereby protecting our users’ identities,
data and devices while minimizing the risk of
unauthorized access to LBC’s critical assets.
Our various protection layers and real-time monitoring
are focused on:
▪ Protecting our emails from phishing and other
threats
▪ Protecting our clients and servers against threats
(malware, viruses and hacking)
▪ Securing LBC’s boundaries, i.e. external access to
the LBC environment
▪ Safeguarding our OT (Operational Technology)
environment
▪ Protecting confidential data
OUR CYBERSECURITY PLATFORM
▪ Extreme visibility of all IT and OT assets by
continuous real-time network scanning
▪ Continuous monitoring and detection of malicious
activity and high-risk security and integrity changes
▪ Continuous vulnerability monitoring
One of the lagging KPIs we track to monitor performance
is the number of significant and major cybersecurity
breaches. As shown in the table below, we have not
experienced any significant or major cybersecurity
breaches in FY20.
WAY FORWARD
In a continuous improvement program, we are developing
a cybersecurity handbook and learning platform for all our
internal stakeholders and we will evaluate suppliers based
upon their cybersecurity maturity. As such, cybersecurity
guidelines will be embedded throughout our work
processes, from vendor selection to the way we develop or
create new solutions or technology as part of our agile
workstreams.
In addition, we strive to be NIS4 compliant over the course
of 2022 and become ISO 270015 certified.
CYBERSECURITY
FY20
Significant and major cybersecurity
breaches in FY200
2020 SUSTAINABILITY REPORT | 42
4EU Directive on Security of Network and Information Systems (NIS Directive)5Information Security Management System
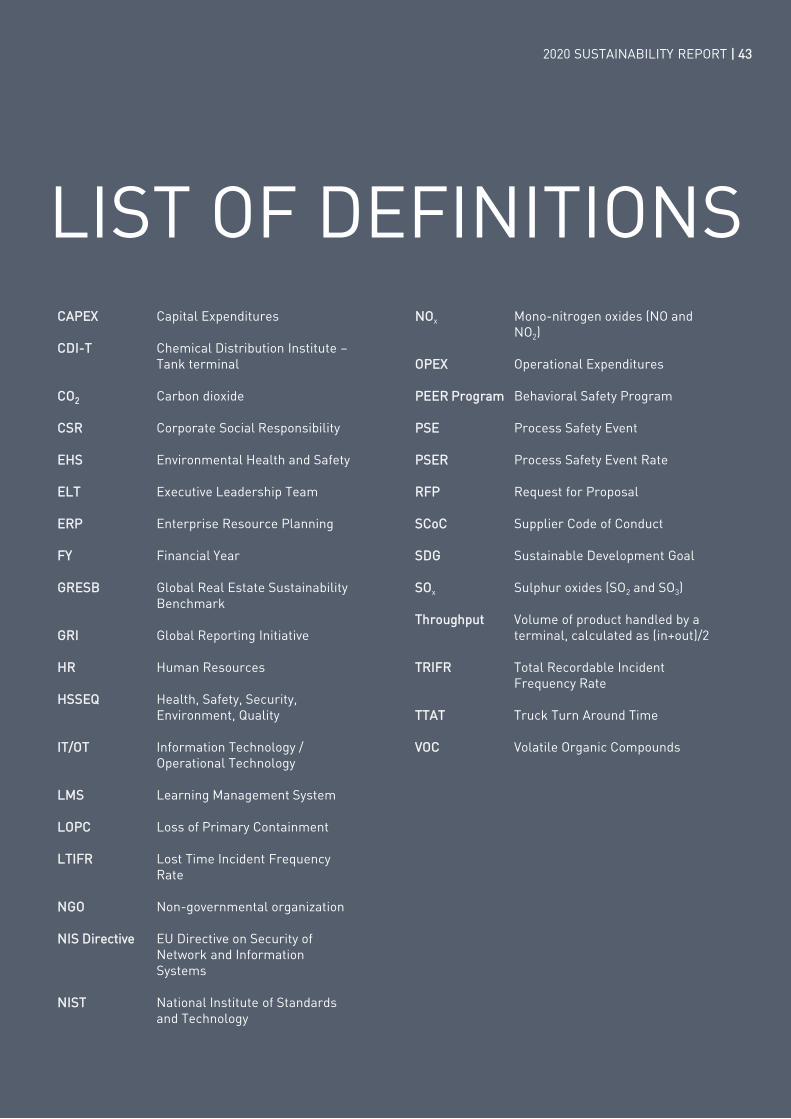
CAPEX Capital Expenditures
CDI-T Chemical Distribution Institute –
Tank terminal
CO2 Carbon dioxide
CSR Corporate Social Responsibility
EHS Environmental Health and Safety
ELT Executive Leadership Team
ERP Enterprise Resource Planning
FY Financial Year
GRESB Global Real Estate Sustainability
Benchmark
GRI Global Reporting Initiative
HR Human Resources
HSSEQ Health, Safety, Security,
Environment, Quality
IT/OT Information Technology /
Operational Technology
LMS Learning Management System
LOPC Loss of Primary Containment
LTIFR Lost Time Incident Frequency
Rate
NGO Non-governmental organization
NIS Directive EU Directive on Security of
Network and Information
Systems
NIST National Institute of Standards
and Technology
LIST OF DEFINITIONSNOx Mono-nitrogen oxides (NO and
NO2)
OPEX Operational Expenditures
PEER Program Behavioral Safety Program
PSE Process Safety Event
PSER Process Safety Event Rate
RFP Request for Proposal
SCoC Supplier Code of Conduct
SDG Sustainable Development Goal
SOx Sulphur oxides (SO2 and SO3)
Throughput Volume of product handled by a
terminal, calculated as (in+out)/2
TRIFR Total Recordable Incident
Frequency Rate
TTAT Truck Turn Around Time
VOC Volatile Organic Compounds
2020 SUSTAINABILITY REPORT | 43

GRI STANDARD DISCLOSURE CHAPTER COMMENT
ORGANISATIONAL PROFILE
102-1 Name of the organization LBC at a glance
102-2 Activities and services LBC at a glance
102-3 Location of headquarters LBC at a glance
102-4 Location of operations LBC at a glance
102-5 Ownership and legal form LBC at a glance
102-6 Markets served LBC at a glance
102-7 Scale of the organization LBC at a glance
102-8 Information on employees and other
workers
LBC at a glance
102-9 Supply chain LBC at a glance
102-11 Precautionary principle or approach Risk management and control
102-12 External initiatives Application of best practices
Community engagement and
charity
102-13 Membership of associations Application of best practices
STRATEGY
102-14 Statement from senior decision-maker Our strategy
102-15 Key impacts, risks, and opportunities Terminal of the future
ETHICS AND INTEGRITY
102-16 Values, principles, standards, and norms of
behavior
Our approach
102-17 Mechanisms for advice and concerns about
ethics
Business ethics and integrity
GOVERNANCE
102-18 Governance structure Risk management and control
102-30 Effectiveness of risk management
processes
Risk management and control
STAKEHOLDER ENGAGEMENT
102-40 List of stakeholder groups Stakeholder engagement and
materiality assessment
102-41 Collective bargaining agreements Talent attraction and retention
102-42 Identifying and selecting stakeholders Stakeholder engagement and
materiality assessment
102-43 Approach to stakeholder engagement Stakeholder engagement and
materiality assessment
GRI CONTENT INDEX
2020 SUSTAINABILITY REPORT | 44
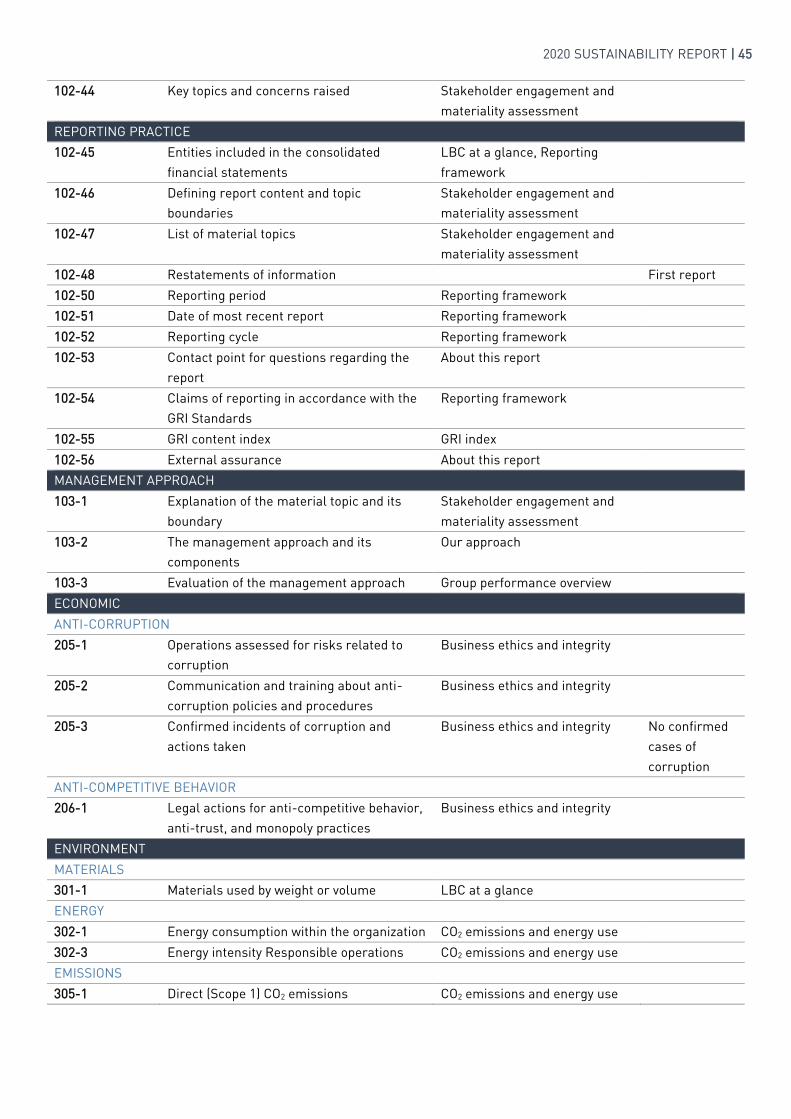
102-44 Key topics and concerns raised Stakeholder engagement and
materiality assessment
REPORTING PRACTICE
102-45 Entities included in the consolidated
financial statements
LBC at a glance, Reporting
framework
102-46 Defining report content and topic
boundaries
Stakeholder engagement and
materiality assessment
102-47 List of material topics Stakeholder engagement and
materiality assessment
102-48 Restatements of information First report
102-50 Reporting period Reporting framework
102-51 Date of most recent report Reporting framework
102-52 Reporting cycle Reporting framework
102-53 Contact point for questions regarding the
report
About this report
102-54 Claims of reporting in accordance with the
GRI Standards
Reporting framework
102-55 GRI content index GRI index
102-56 External assurance About this report
MANAGEMENT APPROACH
103-1 Explanation of the material topic and its
boundary
Stakeholder engagement and
materiality assessment
103-2 The management approach and its
components
Our approach
103-3 Evaluation of the management approach Group performance overview
ECONOMIC
ANTI-CORRUPTION
205-1 Operations assessed for risks related to
corruption
Business ethics and integrity
205-2 Communication and training about anti-
corruption policies and procedures
Business ethics and integrity
205-3 Confirmed incidents of corruption and
actions taken
Business ethics and integrity No confirmed
cases of
corruption
ANTI-COMPETITIVE BEHAVIOR
206-1 Legal actions for anti-competitive behavior,
anti-trust, and monopoly practices
Business ethics and integrity
ENVIRONMENT
MATERIALS
301-1 Materials used by weight or volume LBC at a glance
ENERGY
302-1 Energy consumption within the organization CO2 emissions and energy use
302-3 Energy intensity Responsible operations CO2 emissions and energy use
EMISSIONS
305-1 Direct (Scope 1) CO2 emissions CO2 emissions and energy use
2020 SUSTAINABILITY REPORT | 45
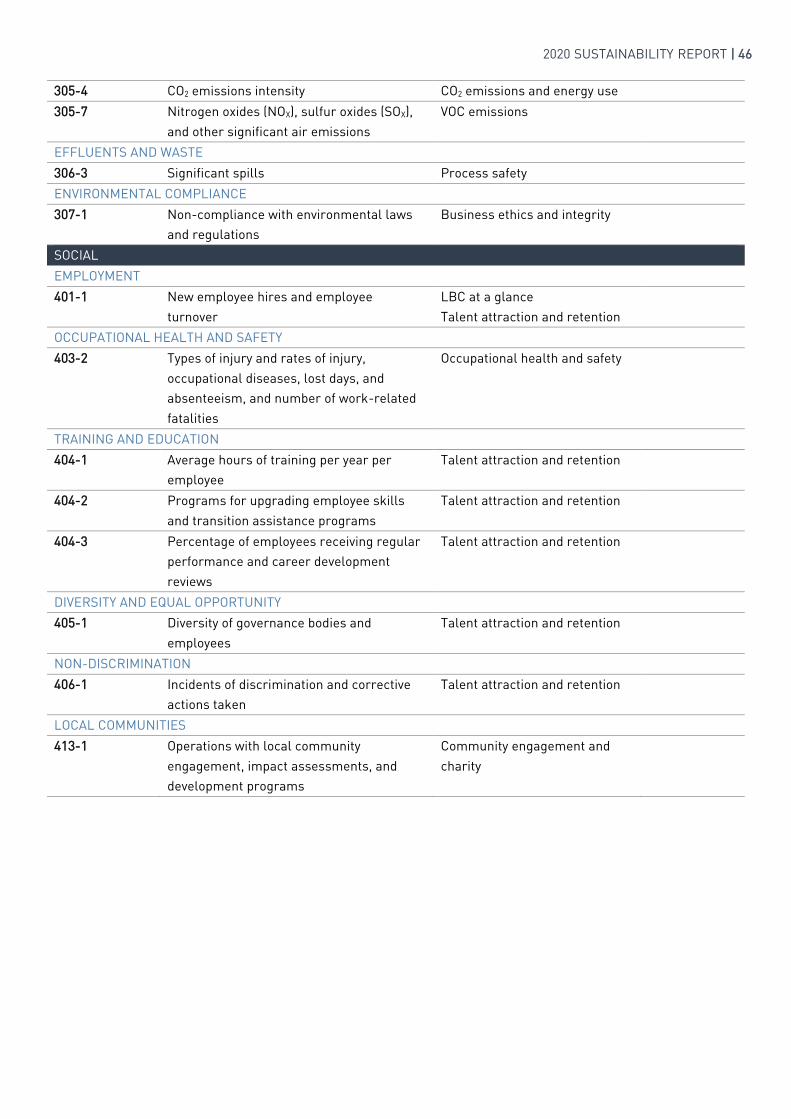
305-4 CO2 emissions intensity CO2 emissions and energy use
305-7 Nitrogen oxides (NOX), sulfur oxides (SOX),
and other significant air emissions
VOC emissions
EFFLUENTS AND WASTE
306-3 Significant spills Process safety
ENVIRONMENTAL COMPLIANCE
307-1 Non-compliance with environmental laws
and regulations
Business ethics and integrity
SOCIAL
EMPLOYMENT
401-1 New employee hires and employee
turnover
LBC at a glance
Talent attraction and retention
OCCUPATIONAL HEALTH AND SAFETY
403-2 Types of injury and rates of injury,
occupational diseases, lost days, and
absenteeism, and number of work-related
fatalities
Occupational health and safety
TRAINING AND EDUCATION
404-1 Average hours of training per year per
employee
Talent attraction and retention
404-2 Programs for upgrading employee skills
and transition assistance programs
Talent attraction and retention
404-3 Percentage of employees receiving regular
performance and career development
reviews
Talent attraction and retention
DIVERSITY AND EQUAL OPPORTUNITY
405-1 Diversity of governance bodies and
employees
Talent attraction and retention
NON-DISCRIMINATION
406-1 Incidents of discrimination and corrective
actions taken
Talent attraction and retention
LOCAL COMMUNITIES
413-1 Operations with local community
engagement, impact assessments, and
development programs
Community engagement and
charity
2020 SUSTAINABILITY REPORT | 46

This report has been prepared in accordance
with the Global Reporting Initiative (GRI)
Standards, core option. The collected data
provides an overview of our sustainability efforts
between the July 1st, 2019 and June 30th, 2020
and covers the activities of all LBC legal entities
worldwide which fall within the scope of our
consolidated financial statements.
All internal stakeholders accountable for the
company’s sustainability program and
performance have validated the content of this
Sustainability Report.
In addition, the report content has been partially
reviewed by the audit firm
PricewaterhouseCoopers (PwC) Belgium. The
topics reviewed have been marked with the
symbol throughout the report.
Click here for the independent assurance
statement
CONTACT
Any questions about this report can be directed
PHOTO CREDITS
CHRIS BONIS FOTOGRAFIE EN FILM (p.13 and p.23)
AUVIMEDIA (all other photos excl. p.29)
PLEASE CONSIDER THE ENVIRONMENT BEFORE PRINTING
AB
OU
T T
HIS
RE
PO
RT
2020 SUSTAINABILITY REPORT | 47

The Members of the Board of LBC Belgium Holding NV
LBC Belgium Holding NV
Schaliënhoevedreef 20
2800 Mechelen
Belgium
Independent Assurance Report on the LBC Sustainability Report for the year ended 30
June 2020
This report has been prepared in accordance with the terms of our engagement contract dated 12
November 2018, (the “Agreement”), whereby we have been engaged to perform a limited-assurance
engagement in order to provide an independent limited assurance report in connection with a
selection of performance metrics of the sustainability topics marked with a symbol ( ), included in
the Sustainability Report of LBC Belgium Holding NV as of and for the fiscal year ended 30 June 2020
(the “Report”).
The Directors’ Responsibility
The Directors of LBC Belgium Holding NV (the “Company”) are responsible for the preparation and
presentation of the selection of performance metrics of the sustainability topics marked with a symbol
( ), included in the Sustainability Report of the Company (the “Subject Matter Information”) in
accordance with the criteria disclosed in the Report (hereafter the “Criteria”).
This responsibility includes: designing, implementing and maintaining internal control relevant to the
proper preparation and presentation of the Subject Matter Information and applying an appropriate
basis of preparation; and making estimates that are reasonable in the circumstances.
Our Independence and Quality Control
We have complied with the legal requirements in respect of auditor independence, particularly in
accordance with the rules set down in articles 12, 13, 14, 16, 20, 28 and 29 of the Belgian Act of 7
December 2016 organising the audit profession and its public oversight of registered auditors, and
with the independence and other ethical requirements of the Code of Ethics for Professional
Accountants issued by the International Ethics Standards Board for Accountants, which is founded on
fundamental principles of integrity, objectivity, professional competence and due care, confidentiality
and professional behavior.
Our firm applies International Standard on Quality Control 1 and accordingly maintains a
comprehensive system of quality control including documented policies and procedures regarding
compliance with ethical requirements, professional standards and applicable legal and regulatory
requirements.
PwC Bedrijfsrevisoren bv - PwC Reviseurs d'Entreprises srl - Risk Assurance Services Maatschappelijke zetel/Siège social: Woluwe Garden, Woluwedal 18, B-1932 Sint-Stevens-Woluwe T: +32 (0)2 710 4211, F: +32 (0)2 710 4299, www.pwc.com BTW/TVA BE 0429.501.944 / RPR Brussel - RPM Bruxelles / ING BE43 3101 3811 9501 - BIC BBRUBEBB / BELFIUS BE92 0689 0408 8123 - BIC GKCC BEBB
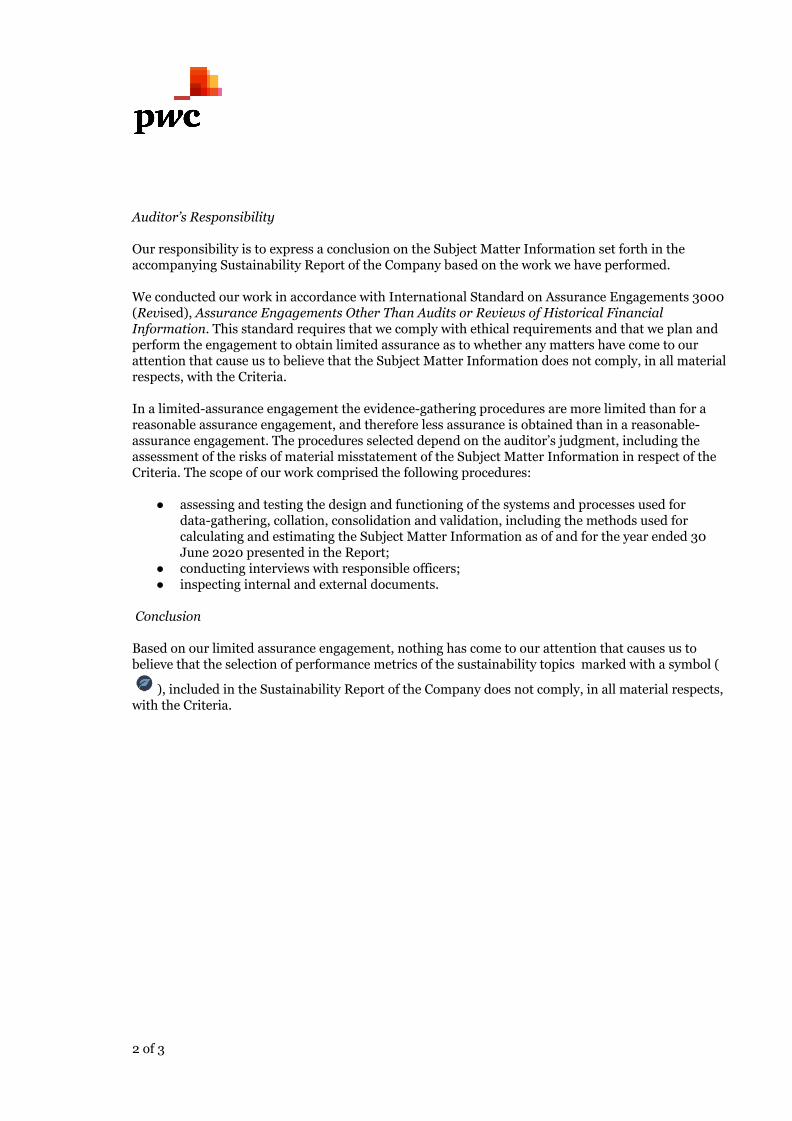
Auditor’s Responsibility
Our responsibility is to express a conclusion on the Subject Matter Information set forth in the
accompanying Sustainability Report of the Company based on the work we have performed.
We conducted our work in accordance with International Standard on Assurance Engagements 3000
(Revised), Assurance Engagements Other Than Audits or Reviews of Historical Financial
Information. This standard requires that we comply with ethical requirements and that we plan and
perform the engagement to obtain limited assurance as to whether any matters have come to our
attention that cause us to believe that the Subject Matter Information does not comply, in all material
respects, with the Criteria.
In a limited-assurance engagement the evidence-gathering procedures are more limited than for a
reasonable assurance engagement, and therefore less assurance is obtained than in a reasonable-
assurance engagement. The procedures selected depend on the auditor’s judgment, including the
assessment of the risks of material misstatement of the Subject Matter Information in respect of the
Criteria. The scope of our work comprised the following procedures:
● assessing and testing the design and functioning of the systems and processes used for
data-gathering, collation, consolidation and validation, including the methods used for
calculating and estimating the Subject Matter Information as of and for the year ended 30
June 2020 presented in the Report;
● conducting interviews with responsible officers;
● inspecting internal and external documents.
Conclusion
Based on our limited assurance engagement, nothing has come to our attention that causes us to
believe that the selection of performance metrics of the sustainability topics marked with a symbol (
), included in the Sustainability Report of the Company does not comply, in all material respects,
with the Criteria.
2 of 3
Restriction on Use and Distribution of our Report
Our report is intended solely for the use of the Company, in connection with their Report as of and for
the year ended 30 June 2020 and should not be used for any other purpose. We do not accept or
assume and deny any liability or duty of care to any other party to whom this report may be shown or
into whose hands it may come.
Sint-Stevens-Woluwe, 30 September 2020
PwC Bedrijfsrevisoren BV/SRL
Represented by
Marc Daelman 1
Partner
1 Marc Daelman BV, director, represented by its permanent representative Marc Daelman
3 of 3