2020 health care transactions resource guide
TRANSCRIPT

2020 Health Care Transactions
Resource Guide

americanhealthlaw.org 9
Introduction
HSG has completed more than 30 anesthesia subsidy assess-ments since 2011. According to a 2009 article from Becker’s Hospital Review,1 “Around 2000, anesthesia providers
started approaching hospitals for subsidies on top of their contractual arrangements.” Additionally, a 2012 white paper by North American Partners in Anesthesia2 stated, “Many hospitals have expexrienced 30 to 40 percent increases in their anesthesia subsidy over the past few years, yet they may not have received any additional services for that investment. In some cases, coverage has actually gotten worse, and hospitals are left asking, ‘What have we been paying for?’” At HSG, our experience reflects both these sentiments. Not only have hospitals seen growth in an area where there used to be no additional cost (anesthesia), but now they are concerned they are not getting true value from their subsidy dollars and/or there is waste inherent in their anesthesia arrangement.
Hospitals and health systems do not want to subsidize poor opera-tions, bad business decisions, and inefficiencies. Additionally, they do not want to subsidize a group that does not share their values and goals for efficiency, volume, superior quality, and customer satisfac-tion (i.e., the patients and surgeons they serve). Surgery is the one area in which hospitals and health systems can achieve a healthy margin on their patient volume. As such, anything that affects surgery should, and typically does, have their utmost attention. Anesthesia not only affects surgery; it is critical to the delivery of surgery. It is not wise to allow issues in anesthesia to linger. Doing so can be crush-ing to a hospital when those issues come to a head.
Because compliance is of the utmost concern for hospitals and health systems, most of HSG’s anesthesia subsidy assessments have resulted in a formal fair market value and commercial reasonableness opinion regarding a hospital or health system’s financial support of an indepen-dent anesthesia practice for the group’s provision of anesthesia and peri-operative services. However, other assessments have resulted in more than an opinion of fair market value and commercial reasonable-ness. Sometimes findings require a performance improvement plan with the existing anesthesia group, and sometimes findings require a complete change of direction finding new management for anesthesia.
Over the last decade, HSG’s work on this area has covered 11 differ-ent organizations. Total financial support provided by our hospital clients to their contracted anesthesia provider group has ranged from
$500,000 to $3.7 million per year. The number of anesthesia providers included in HSG studies has ranged from a low of 3 to a high of 66, with an average subsidy per provider ranging from a low of $35,000 per provider to a high of $209,000 per provider.
This article will discuss the central focus of typical anesthesia subsidy reviews and appraisals—fair market value for provider salaries and benefits (total provider compensation). It will also highlight other key areas and factors that influence the level of subsidy that health care organizations provide to independent/contracted anesthesia providers. The text that follows provides an approach to holistically evaluate key factors and functions that impact the level of an anesthe-sia subsidy.
CompensationEvaluating the fair market value of provider compensation must take into consideration the relative level of provider production (units and cases per provider). While there is a baseline level of compensation expected for a position in most markets (i.e., base salaries between the 25th and 50th percentiles), achieving higher levels of compensa-tion (e.g., in the 75th to 90th percentile), requires additional valida-tion. While sub-specialization, unique expertise, and call coverage requirements and burden are prime examples of factors that can drive compensation up into these higher percentiles, one common and key driver of compensation is production. In anesthesia, the number of cases and total American Society of Anesthesiologists (ASA) units are primary metrics of productivity. In other specialties, the metrics used tend to be Work Relative Value Units. It is logical that provid-ers producing between the 75th and 90th percentiles should be able to earn between the 75th and 90th percentiles. It is equally logical that providers producing at a median level, should not be earning between the 75th and 90th percentiles—not without other unique cir-cumstances. The Medical Group Management Association (MGMA) Provider Compensation and Production Survey, the Sullivan Cotter (Sullivan Cotter) Physician Compensation and Productivity Sur-vey Report, and the America Medical Group Association (AMGA) Compensation and Productivity Survey are three primary and widely utilized sources of physician compensation and production. The reports are leveraged by the team at HSG and are heavily relied upon as a reference for our evaluation of compensation and production levels for anesthesiologists and Certified Registered Nurse Anesthe-tists (CRNAs), as well as a host of other specialties.
Anesthesia Subsidy Assessment: Fair Market Value and Beyond
Neal D. Barker, Partner | HSG [email protected]
HSG
10 AHLA Health Care Transactions Resource Guide
HSG
The level of after-hours and weekend call coverage per provider is another factor that must be considered when evaluating the ap-propriateness, fair market value, and commercial reasonableness of compensation for anesthesia providers. Call coverage is a service that is a real-life burden on the providers who make themselves available. From a hospital’s perspective, call coverage is an extremely valuable and necessary service, and without call coverage, patient safety and quality of care are compromised. Depending on the culture, mix, and size of a provider group, call coverage could be non-existent, fre-quent, or infrequent. What’s more, the intensity of each call response may vary depending upon the hospital, its medical staff, and the mar-ket. HSG has experience with groups in which the CRNAs take no call, and all of the call coverage is provided by the anesthesiologists. Conversely, HSG has worked with groups in which the CRNAs take all the call coverage. Clearly, all other factors being equal, a CRNA who is not required to take call should probably make less than a CRNA who takes one in five days of call.
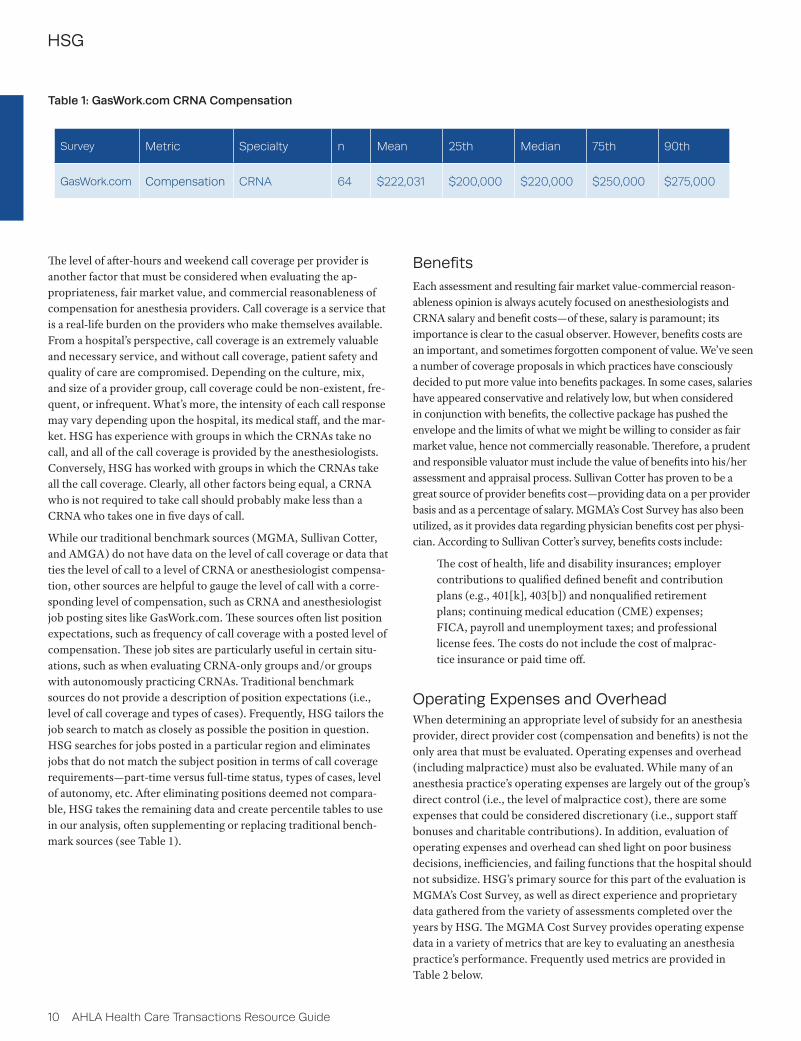
While our traditional benchmark sources (MGMA, Sullivan Cotter, and AMGA) do not have data on the level of call coverage or data that ties the level of call to a level of CRNA or anesthesiologist compensa-tion, other sources are helpful to gauge the level of call with a corre-sponding level of compensation, such as CRNA and anesthesiologist job posting sites like GasWork.com. These sources often list position expectations, such as frequency of call coverage with a posted level of compensation. These job sites are particularly useful in certain situ-ations, such as when evaluating CRNA-only groups and/or groups with autonomously practicing CRNAs. Traditional benchmark sources do not provide a description of position expectations (i.e., level of call coverage and types of cases). Frequently, HSG tailors the job search to match as closely as possible the position in question. HSG searches for jobs posted in a particular region and eliminates jobs that do not match the subject position in terms of call coverage requirements—part-time versus full-time status, types of cases, level of autonomy, etc. After eliminating positions deemed not compara-ble, HSG takes the remaining data and create percentile tables to use in our analysis, often supplementing or replacing traditional bench-mark sources (see Table 1).
Benefits Each assessment and resulting fair market value-commercial reason-ableness opinion is always acutely focused on anesthesiologists and CRNA salary and benefit costs—of these, salary is paramount; its importance is clear to the casual observer. However, benefits costs are an important, and sometimes forgotten component of value. We’ve seen a number of coverage proposals in which practices have consciously decided to put more value into benefits packages. In some cases, salaries have appeared conservative and relatively low, but when considered in conjunction with benefits, the collective package has pushed the envelope and the limits of what we might be willing to consider as fair market value, hence not commercially reasonable. Therefore, a prudent and responsible valuator must include the value of benefits into his/her assessment and appraisal process. Sullivan Cotter has proven to be a great source of provider benefits cost—providing data on a per provider basis and as a percentage of salary. MGMA’s Cost Survey has also been utilized, as it provides data regarding physician benefits cost per physi-cian. According to Sullivan Cotter’s survey, benefits costs include:
The cost of health, life and disability insurances; employer contributions to qualified defined benefit and contribution plans (e.g., 401[k], 403[b]) and nonqualified retirement plans; continuing medical education (CME) expenses; FICA, payroll and unemployment taxes; and professional license fees. The costs do not include the cost of malprac-tice insurance or paid time off.
Operating Expenses and OverheadWhen determining an appropriate level of subsidy for an anesthesia provider, direct provider cost (compensation and benefits) is not the only area that must be evaluated. Operating expenses and overhead (including malpractice) must also be evaluated. While many of an anesthesia practice’s operating expenses are largely out of the group’s direct control (i.e., the level of malpractice cost), there are some expenses that could be considered discretionary (i.e., support staff bonuses and charitable contributions). In addition, evaluation of operating expenses and overhead can shed light on poor business decisions, inefficiencies, and failing functions that the hospital should not subsidize. HSG’s primary source for this part of the evaluation is MGMA’s Cost Survey, as well as direct experience and proprietary data gathered from the variety of assessments completed over the years by HSG. The MGMA Cost Survey provides operating expense data in a variety of metrics that are key to evaluating an anesthesia practice’s performance. Frequently used metrics are provided in Table 2 below.
Table 1: GasWork.com CRNA Compensation
Survey Metric Specialty n Mean 25th Median 75th 90th
GasWork.com Compensation CRNA 64 $222,031 $200,000 $220,000 $250,000 $275,000
americanhealthlaw.org 11
HSG
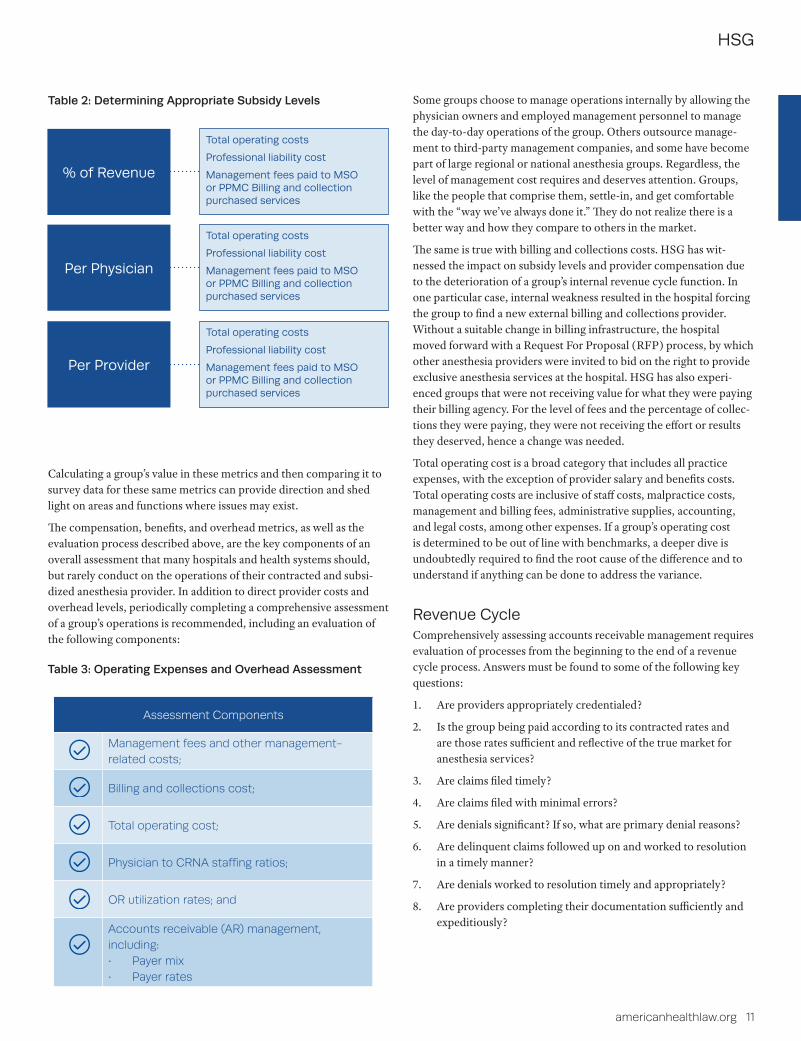
Table 2: Determining Appropriate Subsidy Levels
Calculating a group’s value in these metrics and then comparing it to survey data for these same metrics can provide direction and shed light on areas and functions where issues may exist.
The compensation, benefits, and overhead metrics, as well as the evaluation process described above, are the key components of an overall assessment that many hospitals and health systems should, but rarely conduct on the operations of their contracted and subsi-dized anesthesia provider. In addition to direct provider costs and overhead levels, periodically completing a comprehensive assessment of a group’s operations is recommended, including an evaluation of the following components:
Some groups choose to manage operations internally by allowing the physician owners and employed management personnel to manage the day-to-day operations of the group. Others outsource manage-ment to third-party management companies, and some have become part of large regional or national anesthesia groups. Regardless, the level of management cost requires and deserves attention. Groups, like the people that comprise them, settle-in, and get comfortable with the “way we’ve always done it.” They do not realize there is a better way and how they compare to others in the market.
The same is true with billing and collections costs. HSG has wit-nessed the impact on subsidy levels and provider compensation due to the deterioration of a group’s internal revenue cycle function. In one particular case, internal weakness resulted in the hospital forcing the group to find a new external billing and collections provider. Without a suitable change in billing infrastructure, the hospital moved forward with a Request For Proposal (RFP) process, by which other anesthesia providers were invited to bid on the right to provide exclusive anesthesia services at the hospital. HSG has also experi-enced groups that were not receiving value for what they were paying their billing agency. For the level of fees and the percentage of collec-tions they were paying, they were not receiving the effort or results they deserved, hence a change was needed.
Total operating cost is a broad category that includes all practice expenses, with the exception of provider salary and benefits costs. Total operating costs are inclusive of staff costs, malpractice costs, management and billing fees, administrative supplies, accounting, and legal costs, among other expenses. If a group’s operating cost is determined to be out of line with benchmarks, a deeper dive is undoubtedly required to find the root cause of the difference and to understand if anything can be done to address the variance.
Revenue Cycle Comprehensively assessing accounts receivable management requires evaluation of processes from the beginning to the end of a revenue cycle process. Answers must be found to some of the following key questions:
1. Are providers appropriately credentialed?
2. Is the group being paid according to its contracted rates and are those rates sufficient and reflective of the true market for anesthesia services?
3. Are claims filed timely?
4. Are claims filed with minimal errors?
5. Are denials significant? If so, what are primary denial reasons?
6. Are delinquent claims followed up on and worked to resolution in a timely manner?
7. Are denials worked to resolution timely and appropriately?
8. Are providers completing their documentation sufficiently and expeditiously?
% of Revenue
Total operating costs
Professional liability cost
Management fees paid to MSO or PPMC Billing and collection purchased services
Per Physician
Total operating costs
Professional liability cost
Management fees paid to MSO or PPMC Billing and collection purchased services
Per Provider
Total operating costs
Professional liability cost
Management fees paid to MSO or PPMC Billing and collection purchased services
Table 3: Operating Expenses and Overhead Assessment
Assessment Components
Management fees and other management-related costs;
Billing and collections cost;
Total operating cost;
Physician to CRNA staffing ratios;
OR utilization rates; and
Accounts receivable (AR) management, including:• Payer mix• Payer rates
12 AHLA Health Care Transactions Resource Guide
HSG
Some common metrics and datapoints utilized in a comprehensive revenue cycle assessment include:
1. Gross FFS collection rate;
2. Adjusted FFS collection rate;
3. Adjustments by adjustment type;
4. Collections per ASA unit (or wRVU);
5. Days in accounts receivable (AR);
6. AR aging, particularly the percentage of AR over 90 days;
7. Denial rates;
8. Denials by denial reason; and
9. Charge lag rates.
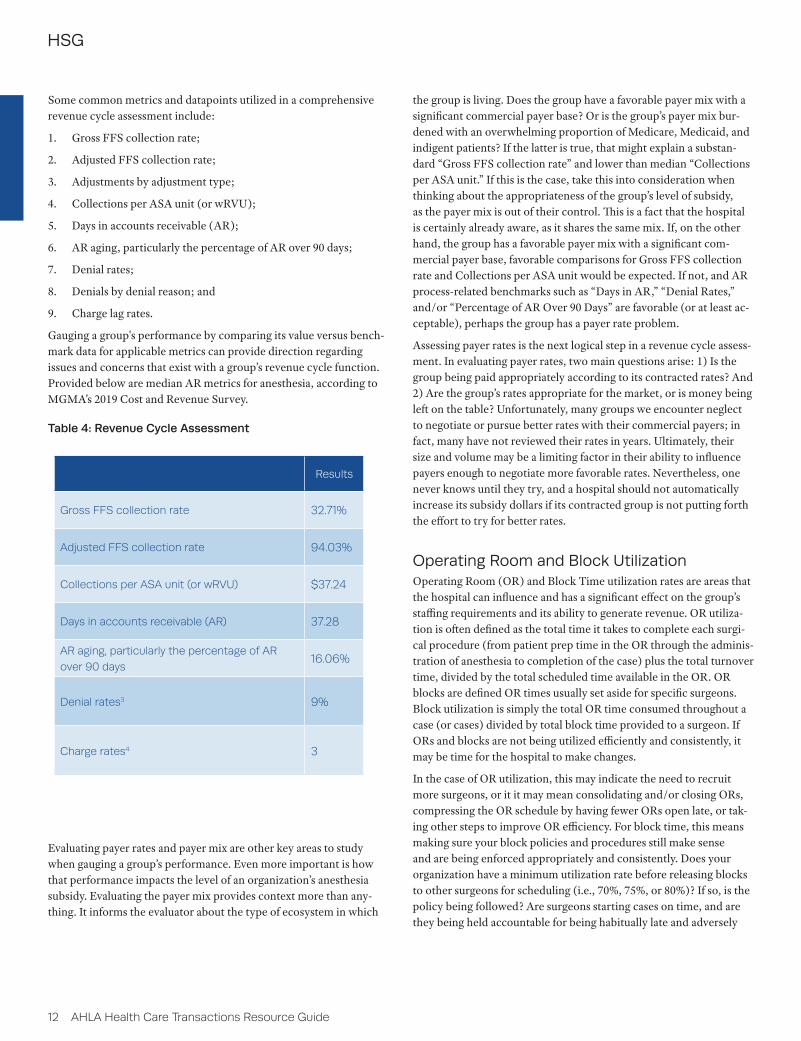
Gauging a group's performance by comparing its value versus bench-mark data for applicable metrics can provide direction regarding issues and concerns that exist with a group’s revenue cycle function. Provided below are median AR metrics for anesthesia, according to MGMA’s 2019 Cost and Revenue Survey.
Evaluating payer rates and payer mix are other key areas to study when gauging a group’s performance. Even more important is how that performance impacts the level of an organization’s anesthesia subsidy. Evaluating the payer mix provides context more than any-thing. It informs the evaluator about the type of ecosystem in which
the group is living. Does the group have a favorable payer mix with a significant commercial payer base? Or is the group’s payer mix bur-dened with an overwhelming proportion of Medicare, Medicaid, and indigent patients? If the latter is true, that might explain a substan-dard “Gross FFS collection rate” and lower than median “Collections per ASA unit.” If this is the case, take this into consideration when thinking about the appropriateness of the group’s level of subsidy, as the payer mix is out of their control. This is a fact that the hospital is certainly already aware, as it shares the same mix. If, on the other hand, the group has a favorable payer mix with a significant com-mercial payer base, favorable comparisons for Gross FFS collection rate and Collections per ASA unit would be expected. If not, and AR process-related benchmarks such as “Days in AR,” “Denial Rates,” and/or “Percentage of AR Over 90 Days” are favorable (or at least ac-ceptable), perhaps the group has a payer rate problem.
Assessing payer rates is the next logical step in a revenue cycle assess-ment. In evaluating payer rates, two main questions arise: 1) Is the group being paid appropriately according to its contracted rates? And 2) Are the group’s rates appropriate for the market, or is money being left on the table? Unfortunately, many groups we encounter neglect to negotiate or pursue better rates with their commercial payers; in fact, many have not reviewed their rates in years. Ultimately, their size and volume may be a limiting factor in their ability to influence payers enough to negotiate more favorable rates. Nevertheless, one never knows until they try, and a hospital should not automatically increase its subsidy dollars if its contracted group is not putting forth the effort to try for better rates.
Operating Room and Block Utilization Operating Room (OR) and Block Time utilization rates are areas that the hospital can influence and has a significant effect on the group’s staffing requirements and its ability to generate revenue. OR utiliza-tion is often defined as the total time it takes to complete each surgi-cal procedure (from patient prep time in the OR through the adminis-tration of anesthesia to completion of the case) plus the total turnover time, divided by the total scheduled time available in the OR. OR blocks are defined OR times usually set aside for specific surgeons. Block utilization is simply the total OR time consumed throughout a case (or cases) divided by total block time provided to a surgeon. If ORs and blocks are not being utilized efficiently and consistently, it may be time for the hospital to make changes.
In the case of OR utilization, this may indicate the need to recruit more surgeons, or it it may mean consolidating and/or closing ORs, compressing the OR schedule by having fewer ORs open late, or tak-ing other steps to improve OR efficiency. For block time, this means making sure your block policies and procedures still make sense and are being enforced appropriately and consistently. Does your organization have a minimum utilization rate before releasing blocks to other surgeons for scheduling (i.e., 70%, 75%, or 80%)? If so, is the policy being followed? Are surgeons starting cases on time, and are they being held accountable for being habitually late and adversely
Table 4: Revenue Cycle Assessment
Results
Gross FFS collection rate 32.71%
Adjusted FFS collection rate 94.03%
Collections per ASA unit (or wRVU) $37.24
Days in accounts receivable (AR) 37.28
AR aging, particularly the percentage of AR
over 90 days16.06%
Denial rates3 9%
Charge rates4 3
americanhealthlaw.org 13
HSG
affecting the daily OR schedule? Are definitions of “emergent” and “elective” cases consistent, and what cases can be added to the sched-ule “after hours?”
These can be tough questions that require challenging and politically charged decisions to be made. Undoubtedly, this will test how serious OR efficiency is taken and its impact on an organization’s anesthesia subsidy. Perhaps, focus on these areas can help reduce the subsidy. If nothing else, examining these factors should create assurances that the value of an anesthesia subsidy is maximized.
Staffing RatiosPhysician-to-CRNA staffing ratio is another area in which HSG has helped hospitals impact their subsidy. Sometimes the impact is im-mediate, but many times it is a gradual transition over the years. More
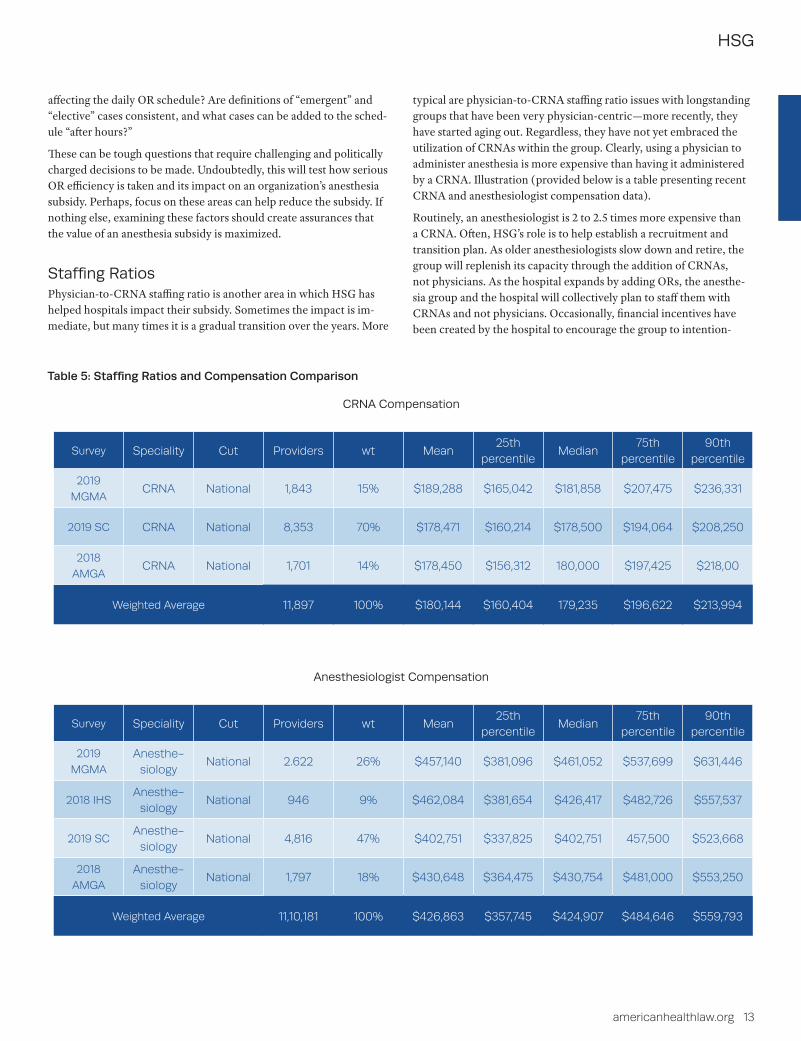
typical are physician-to-CRNA staffing ratio issues with longstanding groups that have been very physician-centric—more recently, they have started aging out. Regardless, they have not yet embraced the utilization of CRNAs within the group. Clearly, using a physician to administer anesthesia is more expensive than having it administered by a CRNA. Illustration (provided below is a table presenting recent CRNA and anesthesiologist compensation data).
Routinely, an anesthesiologist is 2 to 2.5 times more expensive than a CRNA. Often, HSG’s role is to help establish a recruitment and transition plan. As older anesthesiologists slow down and retire, the group will replenish its capacity through the addition of CRNAs, not physicians. As the hospital expands by adding ORs, the anesthe-sia group and the hospital will collectively plan to staff them with CRNAs and not physicians. Occasionally, financial incentives have been created by the hospital to encourage the group to intention-
Table 5: Staffing Ratios and Compensation Comparison
CRNA Compensation
Survey Speciality Cut Providers wt Mean25th
percentileMedian
75th percentile
90th percentile
2019
MGMACRNA National 1,843 15% $189,288 $165,042 $181,858 $207,475 $236,331
2019 SC CRNA National 8,353 70% $178,471 $160,214 $178,500 $194,064 $208,250
2018
AMGACRNA National 1,701 14% $178,450 $156,312 180,000 $197,425 $218,00
Weighted Average 11,897 100% $180,144 $160,404 179,235 $196,622 $213,994
Anesthesiologist Compensation
Survey Speciality Cut Providers wt Mean25th
percentileMedian
75th percentile
90th percentile
2019
MGMA
Anesthe-siology
National 2.622 26% $457,140 $381,096 $461,052 $537,699 $631,446
2018 IHSAnesthe-
siologyNational 946 9% $462,084 $381,654 $426,417 $482,726 $557,537
2019 SCAnesthe-
siologyNational 4,816 47% $402,751 $337,825 $402,751 457,500 $523,668
2018
AMGA
Anesthe-siology
National 1,797 18% $430,648 $364,475 $430,754 $481,000 $553,250
Weighted Average 11,10,181 100% $426,863 $357,745 $424,907 $484,646 $559,793
14 AHLA Health Care Transactions Resource Guide
HSG
ally and aggressively make this transition. The goal is never to push physicians out. The goal of such a plan is to find the most efficient and cost-effective staffing model for the organization, whether that be in one of four medical direction variations (1 to 1, 1 to 2, 1 to 3, or 1 to 4) or a supervisory model (1 anesthesiologist supervising more than 4 CRNAs). This type of transition requires physician buy-in, engagement, and leadership. Most organizations we work with have a hunger for anesthesiologist leadership.
StructureFinally, what is the appropriate financial structure for an organization’s anesthesia subsidy? HSG has seen a variety of different structures, from CRNAs who are employed by the hospital but the anesthesiolo-gists are independent, to fixed stipends where monthly payments do not vary, to revenue guarantees in which actual payments may vary. From HSG’s perspective, a revenue guarantee is the best approach. This entails prospectively determining and establishing what level of revenue the group needs to compensate its anesthesiologists and CRNAs with fair market value salaries and benefits, and covers costs associated with appropriate overhead and operating expenses. With this overall revenue number established, the hospital or health system must determine the limits of its financial exposure. The question that a hospital or health system must answer, therefore, is what is the maxi-mum amount it is willing and able to subsidize the group?
For example, if the group requires $30 million to provide fair market value compensation to its 30 physicians and 38 CRNAs—as well as cover billing costs and other operating expenses—what is the hospital willing to risk in order to “guarantee” that the group will realize $30 million in revenue? Typically, the group has a history of case volume and professional revenue, a track record of cases performed, and professional revenue collected on these cases. Using this $30 million revenue requirement example, assume that the group has shown the ability to collect $24 million per year in professional revenue, with expected improvements in revenue cycle and additional OB/GYN and GI cases estimated to bring in an incremental $2 million in rev-enue, which would allow a projection of $26 million in professional revenue. In this scenario, the question the hospital must therefore answer is whether it is willing to take the risk of potentially subsidiz-ing the anesthesia group to the tune of $4 million? If the answer is no, then negotiations and discussion of alternatives begins. If the answer is yes, a huge hurdle has been cleared, but there is likely still more work to be done with the subsidy structure.
HSG advocates the building of incentives into the subsidy structure. Referring back to an earlier statement that hospitals and health sys-tems “don’t want to subsidize a group that doesn’t share their values and their goals for efficiency, volume, superior quality, and customer satisfaction,” an organization can attempt to influence behaviors and align goals with appropriately structured incentives. This can be done as a withhold of potential subsidy dollars (i.e., withholding 5 to 10%
of every eligible subsidy dollar) as a fixed and predetermined amount carved out of total expected subsidy payments (the “stick”), or it can be done with additional dollars on top of potential subsidy payments (the “carrot”). Whether an organization chooses the carrot or stick, HSG advocates operational, efficiency, quality, outcomes, communi-cation, leadership, and customer satisfaction incentives.
Regardless of the group’s size or the size of the anesthesia subsidy, HSG is confident that following the approach described throughout this article will yield positive results for the hospital or health system; enable the organization to better track and monitor its anesthesia and peri-operative services; and maximize the value it receives for each dollar of subsidy paid to its anesthesia provider.
ReferencesAmerican Medical Group Association (AMGA). (2018 Report
Based on 2017 Data). 2018 Medical Group Compensation and Productivity Survey.
GasWork.com. (n.d.). Compensation website for Anesthesiology and Anesthesiology-related professions (www.gaswork.com).
Integrated Healthcare Strategies (IHS). (n.d.). 2018 Physician Com-pensation and Production Survey, Compensation Survey Report.
Medical Group Management Association (MGMA). (2019 Survey Based on 2018 Data). 2019 Practice Operations.
Medical Group Management Association (MGMA). (2019 Survey Based on 2018 Data). 2019 Provider Compensation and Produc-tion Survey.
Medical Group Management Association (MGMA). (2019 Survey Based on 2018 Data). 2019 Cost and Revenue Survey.
Sullivan, Cotter and Associates (SC). (n.d.). 2019 Physician Compensation and Productivity Survey Report.
Endnotes
1. Becker’s Hospital Review, Anesthesia Subsidy Requests: What They Are and How to Pre-pare for Them (Apr. 3, 2009), https://www.beckershospitalreview.com/news-analysis/anesthesia-subsidy-requests-what-they-are-and-how-to-prepare-for-them.html.
2. 2. North American Partners in Anesthesia, Changing Anesthesia Providers: The Playbook for a Simple and Sustainable Transition ( July 2015), http://napaanesthe-sia.com/wp-content/uploads/2015/07/WhitePaper_Changing-Anesthesia-Providers.pdf.
3. Definition: Percentage of practice claims denied on first submission; Source: 2019 MGMA Practice Operations Survey (Median for Surgical Single Specialties).
4. Definition: Charge-posting lag time between date of service and claim drop date to payer; Source: 2019 MGMA Practice Operations Survey (Median for Surgical Single Specialties).

Fair market value and commercial reasonableness compliance of physician
compensation is vital to all health systems. Hospital-based physician
subsidy arrangements are no different. Some hospitals have increased
anesthesia subsidies by 30-40% in recent years which triggers a need
to evaluate hospital-based physician subsidy agreements
comprehensively.
The highly experienced team at HSG will evaluate the fair market value
and commercial reasonableness related to provider compensation,
medical directorships, acquisitions, and hospital-based subsidy
arrangements with physicians and physician groups. A comprehensive
assessment can also identify cost inefficiencies and broken functionality
within a contracted group.
Fair Market Value and Commercial Reasonableness Opinions Conduct a Comprehensive Assessment
Schedule your comprehensive evaluation of physicians’ contracts now.Contact Neal Barker at (502) 814-1189 or [email protected]
Are your hospital-based physician subsidy arrangements working for you?
HSG completed an assessment of our
anesthesia staffing, our group’s revenue
cycle function and operations, as well as
other factors affecting our anesthesia
subsidy. HSG listened to our needs, talked
to our anesthesiologists, CRNAs, and
leadership, and came to understand our
culture, challenges and unique needs. They
made impactful recommendations for our
health system and our relationship with
anesthesia going forward. HSG did an
exceptional job for us.
Jeremy BiggsPresident and CAOMethodist Medical Center of Oak Ridge
HSGadvisors.com | © 2020 HSG