2019 q4 md&a and fs
TRANSCRIPT

BARRICK YEAR-END 2019 1 MANAGEMENT’S DISCUSSION AND ANALYSIS
MANAGEMENT’S DISCUSSION AND ANALYSIS (“MD&A”)
Management’s Discussion and Analysis (“MD&A”) is intended to help the reader understand Barrick Gold Corporation (“Barrick”, “we”, “our” or the “Company”), our operations, financial performance and the present and future business environment. This MD&A, which has been prepared as of February 20, 2020, should be read in conjunction with our audited consolidated financial statements (“Financial Statements”) for the year ended December 31, 2019. Unless otherwise indicated, all amounts are presented in US dollars.
For the purposes of preparing our MD&A, we consider the materiality of information. Information is considered material if: (i) such information results in, or would reasonably be expected to result in, a significant change in the market price or value of our shares; (ii) there is a substantial likelihood that
a reasonable investor would consider it important in making an investment decision; or (iii) it would significantly alter the total mix of information available to investors. We evaluate materiality with reference to all relevant circumstances, including potential market sensitivity.
Continuous disclosure materials, including our most recent Form 40-F/Annual Information Form, annual MD&A, audited consolidated financial statements, and Notice of Annual Meeting of Shareholders and Proxy Circular will be available on our website at www.barrick.com, on SEDAR at www.sedar.com and on EDGAR at www.sec.gov. For an explanation of terminology unique to the mining industry, readers should refer to the glossary on page 91.
CAUTIONARY STATEMENT ON FORWARD-LOOKING INFORMATION Certain information contained or incorporated by reference in this MD&A, including any information as to our strategy, projects, plans or future financial or operating performance, constitutes “forward-looking statements”. All statements, other than statements of historical fact, are forward-looking statements. The words “believe”, “expect”, “anticipate”, “target”, “plan”, “objective”, “assume”, “intend”, “intention”, “project”, “goal”, “continue”, “budget”, “estimate”, “potential”, “may”, “will”, “can”, “could”, “would” and similar expressions identify forward-looking statements. In particular, this MD&A contains forward-looking statements including, without limitation, with respect to: Barrick’s goal to be the world’s most valued gold mining business; Barrick’s forward-looking production guidance and estimates of future costs ; cash flow forecasts; projected capital, operating and exploration expenditures; targeted debt and cost reductions; mine life and production rates; potential mineralization and metal or mineral recoveries; our ability to identify, invest in and develop potential Tier One, Tier Two and Strategic Assets; our strategies and plans with respect to environmental matters, including climate change; our future plans, growth potential, financial strength, investments and overall strategy; our plans and expected completion and benefits of our growth projects, including construction of twin exploration declines at Goldrush, the Turquoise Ridge Third Shaft, Pueblo Viejo plant expansion, Zaldívar chloride leach project, and Veladero power transmission project; our ability to convert resources into reserves; asset sales, joint ventures and partnerships, including expected closing of the sale of our interest in Massawa; expectations regarding future price assumptions, financial performance and other outlook or guidance.
Forward-looking statements are necessarily based upon a number of estimates and assumptions including material estimates and assumptions related to the factors set forth below that, while considered reasonable by the Company as at the date of this MD&A in light of management’s experience and perception of current conditions and expected developments, are inherently subject to significant business, economic and competitive uncertainties and contingencies. Known and unknown factors could cause actual results to differ materially from those projected in the forward-looking statements and undue reliance should not be placed on such
statements and information. Such factors include, but are not limited to: fluctuations in the spot and forward price of gold, copper or certain other commodities (such as silver, diesel fuel, natural gas and electricity); the speculative nature of mineral exploration and development; changes in mineral production performance, exploitation and exploration successes; risks associated with projects in the early stages of evaluation and for which additional engineering and other analysis is required; the Company’s ability to successfully re-integrate Acacia’s operations; whether benefits expected from recent transactions are realized; disruption of supply routes which may cause delays in construction and mining activities at Barrick’s more remote properties; diminishing quantities or grades of reserves; increased costs, delays, suspensions and technical challenges associated with the construction of capital projects; operating or technical difficulties in connection with mining or development activities, including geotechnical challenges and disruptions in the maintenance or provision of required infrastructure and information technology systems; failure to comply with environmental and health and safety laws and regulations; timing of receipt of, or failure to comply with, necessary permits and approvals; uncertainty whether some or targeted investments and projects will meet the Company’s capital allocation objectives and internal hurdle rate; the impact of global liquidity and credit availability on the timing of cash flows and the values of assets and liabilities based on projected future cash flows; adverse changes in our credit ratings; the impact of inflation; fluctuations in the currency markets; changes in U.S. dollar interest rates; risks arising from holding derivative instruments; changes in national and local government legislation, taxation, controls or regulations and/or changes in the administration of laws, policies and practices; expropriation or nationalization of property and political or economic developments in Canada, the United States and other jurisdictions in which the Company or its affiliates do or may carry on business in the future; lack of certainty with respect to foreign legal systems, corruption and other factors that are inconsistent with the rule of law; risks associated with illegal and artisanal mining; the risks of operating in jurisdictions where infectious diseases present major health care issues; damage to the Company’s reputation due to the actual or perceived occurrence of any number of events, including negative publicity with respect to the Company’s handling of environmental matters or dealings with community

BARRICK YEAR-END 2019 2 MANAGEMENT’S DISCUSSION AND ANALYSIS
groups, whether true or not; the possibility that future exploration results will not be consistent with the Company’s expectations; risks that exploration data may be incomplete and considerable additional work may be required to complete further evaluation, including but not limited to drilling, engineering and socioeconomic studies and investment; risk of loss due to acts of war, terrorism, sabotage and civil disturbances; litigation; contests over title to properties, particularly title to undeveloped properties, or over access to water, power and other required infrastructure; business opportunities that may be presented to, or pursued by, the Company; risks associated with the fact that certain of the initiatives described in this MD&A are still in the early stages and may not materialize; our ability to successfully integrate acquisitions or complete divestitures; risks associated with working with partners in jointly controlled assets; employee relations including loss of key employees; increased costs and physical risks, including extreme weather events and resource shortages, related to climate change; and availability and increased costs associated with mining inputs and labor. In addition, there are risks and hazards associated with the business of mineral exploration, development and mining, including environmental hazards, industrial accidents, unusual or unexpected formations, pressures, cave-ins,
flooding and gold bullion, copper cathode or gold or copper concentrate losses (and the risk of inadequate insurance, or inability to obtain insurance, to cover these risks).
Many of these uncertainties and contingencies can affect our actual results and could cause actual results to differ materially from those expressed or implied in any forward-looking statements made by, or on behalf of, us. Readers are cautioned that forward-looking statements are not guarantees of future performance. All of the forward-looking statements made in this MD&A are qualified by these cautionary statements. Specific reference is made to the most recent Form 40-F/Annual Information Form on file with the SEC and Canadian provincial securities regulatory authorities for a more detailed discussion of some of the factors underlying forward-looking statements and the risks that may affect Barrick’s ability to achieve the expectations set forth in the forward-looking statements contained in this MD&A. We disclaim any intention or obligation to update or revise any forward-looking statements whether as a result of new information, future events or otherwise, except as required by applicable law.
MERGER WITH RANDGOLD RESOURCES LIMITEDOn January 1, 2019, Barrick acquired 100% of the issued and outstanding shares of Randgold Resources Limited (“Randgold”) for $7.9 billion based on the December 31, 2018 closing share price of Barrick’s common shares (the "Merger"). We began consolidating the operating results, cash flows and net assets of Randgold from January 1, 2019 and the results presented in this MD&A reflect that. Refer to note 4 of the Financial Statements for further details of this transaction.
USE OF NON-GAAP FINANCIAL PERFORMANCE MEASURES
We use the following non-GAAP financial performance measures in our MD&A:
• “adjusted net earnings”• “free cash flow”• “EBITDA”• “adjusted EBITDA”• “total cash costs per ounce”• “C1 cash costs per pound”• “all-in sustaining costs per ounce/pound”• “all-in costs per ounce” and• “realized price”
For a detailed description of each of the non-GAAP measures used in this MD&A and a detailed reconciliation to the most directly comparable measure under International Financial Reporting Standards (“IFRS”), please refer to the Non-GAAP Financial Performance Measures section of this MD&A on pages 63 to 85. Each non-GAAP financial performance measure has been annotated with a reference to an endnote on page 86. The non-GAAP financial performance measures set out in this MD&A are intended to provide additional information to investors and do not have any standardized meaning under IFRS, and therefore may not be comparable to other issuers, and should not be considered in isolation or as a substitute for measures of performance prepared in accordance with IFRS.
Changes in Presentation of Non-GAAP Financial Performance Measures
Realized PriceStarting with this MD&A, we began adjusting for the cumulative catch-up adjustment to revenue relating to our streaming arrangements in our calculation of realized price. The prior periods have been restated to reflect this change. We believe that this additional information will assist analysts, investors and other stakeholders of Barrick to better understand our ability to generate revenue by excluding non-cash amounts from the calculation as they are not necessarily reflective of the underlying operating results for the periods presented.
Total cash costsStarting from the first quarter of 2019, we have renamed "cash costs" to "total cash costs" when referring to our gold operations. The calculation of total cash costs is identical to our previous calculation of cash costs with only a change in the naming convention of this non-GAAP measure.
All-in sustaining costs and all-in costsStarting from the first quarter of 2019, we have included sustaining capital expenditures and project capital expenditures on a cash basis instead of an accrual basis. As a result of adopting IFRS 16 Leases, the full lease amount is included in accrued capital expenditures on initial recognition. We believe that the change in capital expenditures from an accrual basis to a cash basis better reflects the timing of costs associated with our operations. The original World Gold Council ("WGC") Guidance Note explicitly excluded certain financing activities from all-in sustaining costs and all-in costs. As a result of the new lease accounting standard, the WGC Guidance Note was updated to include both the principal and interest portion of the cash lease payment in the all-in sustaining costs and all-in cost metrics. We have updated our calculation accordingly. Prior periods have not been restated but would not be materially different.

INDEX pageOverview
Our Vision
Our Business
Our Strategy
Sustainability
Financial and Operating Highlights
Safety
Environment
Climate ChangeReserves and Resources
Key Business Developments
Outlook for 2020
Risks and Risk Management
Market Overview
Production and Cost Summary
Operating Divisions Performance
Nevada Gold Mines
Carlin
Cortez
Turquoise RidgeOther Nevada Gold Mines
Pueblo Viejo
Loulo-Gounkoto
Kibali
Veladero
Porgera
North MaraOther Mines - Gold
Other Mines - Copper
Growth Projects
Exploration
pageReview of Financial Results
Revenue
Production Costs
Capital Expenditures
General and Administrative Expenses
Exploration, Evaluation and Project Costs
Finance Costs, Net
Additional Significant Statement of IncomeItemsIncome Tax Expense
Financial Condition Review
Balance Sheet Review
Shareholders’ Equity
Financial Position and Liquidity
Summary of Cash Inflow (Outflow)
Summary of Financial Instruments
Commitments and Contingencies
Review of Quarterly Results
Internal Control over Financial Reporting andDisclosure Controls and ProceduresIFRS Critical Accounting Policies and AccountingEstimates
Non-GAAP Financial Performance MeasuresTechnical Information
Endnotes
Glossary of Technical Terms
Mineral Reserves and Mineral Resources
Management’s Responsibility
Management’s Report on Internal Control OverFinancial ReportingIndependent Auditor’s Report
Financial Statements
Notes to Consolidated Financial Statements
4
4
4
4
6
10
10
10
11
12
15
18
19
21
23
24
25
27
29
31
32
34
36
38
40
42
44
45
46
47
50
50
51
53
53
54
54
55
56
58
58
58
58
59
60
61
62
62
63
63
86
86
91
92
103
104
105
110
115

BARRICK YEAR-END 2019 4 MANAGEMENT’S DISCUSSION AND ANALYSIS
OVERVIEW
Our VisionWe strive to be the world’s most valued gold mining business by finding, developing and owning the best assets, with the best people, to deliver sustainable returns for our owners and partners.
Our BusinessBarrick is one of the world’s leading gold mining companies with annual gold production and gold reserves that are among the largest in the industry. We are principally engaged in the production and sale of gold and copper, as well as related activities such as exploration and mine development. We hold interests in fifteen producing gold mines, including six Tier One Gold Assets1 and a diversified asset portfolio positioned for growth in many of the world’s most prolific gold districts. These gold mines are geographically diversified and are located in Argentina, Canada, Côte d’Ivoire, the Democratic Republic of Congo, the Dominican Republic, Mali, Papua New Guinea, Tanzania and the United States. Our copper business includes a wholly-owned copper mine in Zambia and 50% interests in copper mines in Chile and Saudi Arabia. We also have exploration and development projects located throughout the Americas and Africa. We sell our production in the world market through the following distribution channels: gold bullion is sold in the gold spot market; and gold and copper concentrate is sold to independent smelting companies. Barrick shares trade on the New York Stock Exchange under the symbol GOLD and the Toronto Stock Exchange under the symbol ABX.
2019 Revenue (millions)
Our StrategyOur strategy is to operate as business owners by attracting and developing world-class people who are informed and involved in the value chain of the business, act with integrity and are tireless in their pursuit of excellence. We are focused on returns to our stakeholders by optimizing free cash flow, managing risk to create long-term value for our shareholders and partnering with host governments and communities to transform their natural resources into sustainable benefits and mutual prosperity. We aim to achieve this through the following:
Asset Quality• Grow and invest in a portfolio of Tier One Gold Assets1,
Tier Two Gold Assets and Strategic Assets2 with an emphasis on organic growth. We will focus our efforts on
identifying, investing in and developing assets that meet our investment criteria. With respect to Tier One Gold Assets, we are focused on assets with a reserve potential greater than 5 million ounces of gold that will generate an internal rate of return (IRR) of at least 15%. With respect to Tier Two Gold Assets, we are focused on assets with a reserve potential of greater than 3 million ounces of gold that will generate an IRR of at least 20% (in each case based on our long-term gold price assumptions).
• Focus on brownfields opportunities at Nevada Gold Mines LLC (“Nevada Gold Mines”) following the integration of Barrick’s and Newmont Corporation’s (“Newmont”) interests in Nevada through the creation of the joint venture, together with Pueblo Viejo, Loulo-Gounkoto and Kibali.
• Invest in exploration across extensive land positions in many of the world’s most prolific gold districts.
• Maximize the long-term value of our strategic Copper Business3.
• Sell non-core assets over time in a disciplined manner.
Operational Excellence• Strive for zero harm workplaces.• Operate a flat management structure with a strong
ownership culture. • Streamline management and operations, and hold
management accountable for the businesses they manage.
• Leverage innovation and technology to drive industry-leading efficiencies.
• Build trust-based partnerships with host governments, business partners, and local communities to drive shared long-term value.
Sustainable Profitability• Follow a disciplined approach to growth, emphasizing
long-term value for all stakeholders. • Increase returns to shareholders, driven by a focus on
return on capital, internal rate of return and free cash flow.
Sustainability
Barrick’s sustainability vision is to create long-term value for all our stakeholders. We contribute to the social and economic development of our host countries and communities. We protect the safety and health of our workforce. We respect human rights. And we manage our impacts on the natural environment, both today and with future generations in mind. We live our vision every day, by embedding environmental, social and economic considerations into all our business decisions, through partnerships with host governments and communities and by engaging respectfully with all our stakeholders.
Our approach to achieving these four ambitions is set out in a new overarching Sustainable Development Policy, which commits us to supporting the socio-economic development of host countries and communities. We have also published policies in the areas of Social Performance, which incorporates Community Development and Engagement, Occupational Health and Safety, and Environment and Human Rights. All policies meet or exceed the requirements of host country legislation and international standards such
BARRICK YEAR-END 2019 5 MANAGEMENT’S DISCUSSION AND ANALYSIS
as the IFC Performance Standards or UN Guiding Principles on Business and Human Rights. Our updated Code of Conduct sets out the ethical behavior expected of everyone working at, or with, Barrick.
Day-to-day ownership of sustainability risks and opportunities is in the hands of individual sites - where our core business is located. Each operation’s General Manager, supported by dedicated teams on site, is accountable for putting Barrick’s vision into action at the site level. This includes maintaining an ISO-certified environmental and safety management system, building robust community engagement mechanisms and managing energy and water plans.
We anticipate that the social and environmental expectations of mining companies will become even higher in the future. We are clear that our ability to maintain our social license to operate will depend on our ability to meet these expectations. To meet this challenge, we will continue to embed environmental, social and economic considerations into our business decisions, engage respectfully with stakeholders and act on their concerns and continue to build deep partnerships with our communities, host governments and other partners.

BARRICK YEAR-END 2019 6 MANAGEMENT’S DISCUSSION AND ANALYSIS
FINANCIAL AND OPERATING HIGHLIGHTS
For the three months ended For the years ended 12/31/2019 9/30/2019 % Change 12/31/19 12/31/18 % Change 12/31/17Financial Results ($ millions)Revenues 2,883 2,678 8 % 9,717 7,243 34 % 8,374Cost of sales 1,987 1,889 5 % 6,911 5,220 32 % 5,300Net earnings (loss)a 1,387 2,277 (39)% 3,969 (1,545) 357 % 1,438Adjusted net earningsb 300 264 14 % 902 409 121 % 876Adjusted EBITDAb 1,562 1,297 20 % 4,833 3,080 57 % 4,115Adjusted EBITDA marginc 54 % 48 % 13 % 50 % 43 % 16 % 49%Total minesite sustaining capital expendituresd 394 406 (3)% 1,320 968 36 % 1,116Total project capital expendituresd 46 96 (52)% 370 425 (13)% 280Total consolidated capital expendituresd,e 446 502 (11)% 1,701 1,400 22 % 1,396Net cash provided by operating activities 875 1,004 (13)% 2,833 1,765 61 % 2,065Net cash provided by operating activities marginf 30 % 37 % (19)% 29 % 24 % 21 % 25%Free cash flowb 429 502 (15)% 1,132 365 210 % 669Net earnings (loss) per share (basic and diluted) 0.78 1.30 (40)% 2.26 (1.32) 271 % 1.23Adjusted net earnings (basic)b per share 0.17 0.15 13 % 0.51 0.35 46 % 0.75Weighted average diluted common shares(millions of shares) 1,778 1,756 1 % 1,758 1,167 51 % 1,166Operating ResultsGold production (thousands of ounces)g 1,439 1,306 10 % 5,465 4,527 21 % 5,323Gold sold (thousands of ounces)g 1,413 1,318 7 % 5,467 4,544 20 % 5,302Market gold price ($/oz) 1,481 1,472 1 % 1,393 1,268 10 % 1,257Realized gold priceb,g ($/oz) 1,483 1,476 0 % 1,396 1,270 10 % 1,258Gold cost of sales (Barrick’s share)g,h ($/oz) 1,046 1,065 (2)% 1,005 892 13 % 794Gold total cash costsb,g ($/oz) 692 710 (3)% 671 588 14 % 526Gold all-in sustaining costsb,g ($/oz) 923 984 (6)% 894 806 11 % 750Copper production (millions of pounds)i 117 112 4 % 432 383 13 % 413Copper sold (millions of pounds)i 91 65 40 % 355 382 (7)% 405Market copper price ($/lb) 2.67 2.63 2 % 2.72 2.96 (8)% 2.80Realized copper priceb,i ($/lb) 2.76 2.55 8 % 2.77 2.88 (4)% 2.95Copper cost of sales (Barrick’s share)i,j ($/lb) 2.26 2.00 13 % 2.14 2.40 (11)% 1.77Copper C1 cash costsb,i ($/lb) 1.90 1.62 17 % 1.69 1.97 (14)% 1.66Copper all-in sustaining costsb,i ($/lb) 2.82 2.58 9 % 2.52 2.82 (11)% 2.34
As at
12/31/19As at
9/30/19 % ChangeAs at
12/31/18 % ChangeAs at
12/31/17Financial Position ($ millions)Debt (current and long-term) 5,536 5,560 0 % 5,738 (4)% 6,423Cash and equivalents 3,314 2,405 38 % 1,571 111 % 2,234Debt, net of cash 2,222 3,155 (30)% 4,167 (47)% 4,189
a. Net earnings (loss) represents net earnings (loss) attributable to the equity holders of the Company.b. Adjusted net earnings, adjusted EBITDA, free cash flow, adjusted net earnings per share, realized gold price, all-in sustaining costs, total cash costs, C1 cash costs
and realized copper price are non-GAAP financial performance measures with no standardized meaning under IFRS and therefore may not be comparable to similar measures presented by other issuers. For further information and a detailed reconciliation of each non-GAAP measure to the most directly comparable IFRS measure, please see pages 63 to 85 of this MD&A.
c. Represents adjusted EBITDA divided by revenue.d. Amounts presented on a consolidated cash basis. Project capital expenditures are included in our calculation of all-in costs, but not included in our calculation of all-in
sustaining costs.e. Total consolidated capital expenditures also includes capitalized interest.f. Represents net cash provided by operating activities divided by revenue.g. Includes Tanzania on a 63.9% basis until September 30, 2019 (notwithstanding the completion of the Acacia transaction on September 17, 2019, we consolidated our
interest in Acacia and recorded a non-controlling interest of 36.1% in the income statement for the entirety of the third quarter of 2019 as a matter of convenience), Pueblo Viejo on a 60% basis, South Arturo on a 60% basis (36.9% from July 1, 2019 onwards as a result of its contribution to Nevada Gold Mines), and Veladero on a 50% basis, which reflects our equity share of production and sales. Also includes Loulo-Gounkoto on an 80% basis, Kibali on a 45% basis, Tongon on an 89.7% basis and Morila on a 40% basis, which reflects our equity share of production and sales, commencing January 1, 2019, the effective date of the Merger. Also removes the non-controlling interest of 38.5% Nevada Gold Mines from July 1, 2019 onwards.
h. Gold cost of sales (Barrick’s share) is calculated as cost of sales - gold on an attributable basis (excluding sites in care and maintenance) divided by ounces sold.i. Amounts reflect production and sales from Jabal Sayid and Zaldívar on a 50% basis, which reflects our equity share of production, and Lumwana.j. Copper cost of sales (Barrick’s share) is calculated as cost of sales - copper plus our equity share of cost of sales attributable to Zaldívar and Jabal Sayid divided by
pounds sold.

BARRICK YEAR-END 2019 7 MANAGEMENT’S DISCUSSION AND ANALYSIS
a. These are non-GAAP financial performance measures with no standardized meaning under IFRS and therefore may not be comparable to similar measures presented by other issuers. For further information and a detailed reconciliation of each non-GAAP measure to the most directly comparable IFRS measure, please see pages 63 to 85 of this MD&A.
b. Cost of sales applicable to gold per ounce is calculated using cost of sales applicable to gold on an attributable basis (removing the non-controlling interest of 40% Pueblo Viejo, 36.1% Tanzania (notwithstanding the completion of the Acacia transaction on September 17, 2019, we consolidated our interest in Acacia and recorded a non-controlling interest of 36.1% in the income statement for the entirety of the third quarter of 2019 as a matter of convenience) and 40% South Arturo from cost of sales (63.1% of South Arturo from July 1, 2019 onwards as a result of its contribution to Nevada Gold Mines)), divided by attributable gold ounces. The non-controlling interest of 20% Loulo-Gounkoto and 10.3% of Tongon is also removed from cost of sales and our proportionate share of cost of sales attributable to equity method investments (Kibali and Morila) is included commencing January 1, 2019, the effective date of the Merger. Also removes the non-controlling interest of 38.5% Nevada Gold Mines from cost of sales from July 1, 2019 onwards. Cost of sales applicable to copper per pound is calculated using cost of sales applicable to copper including our proportionate share of cost of sales attributable to equity method investments (Zaldívar and Jabal Sayid), divided by consolidated copper pounds (including our proportionate share of copper pounds from our equity method investments).

BARRICK YEAR-END 2019 8 MANAGEMENT’S DISCUSSION AND ANALYSIS
Factors affecting net earnings and adjusted net earnings4 - three months ended December 31, 2019 versus September 30, 2019
Net earnings attributable to equity holders of Barrick ("net earnings") for the three months ended December 31, 2019 were $1,387million compared to $2,277 million in the prior quarter. The decrease was primarily due to a gain of $1.9 billion ($1.5 billion net of taxes) relating to the remeasurement of Turquoise Ridge to fair value as a result of its contribution to Nevada Gold Mines and an impairment reversal of $947 million ($663 million net of taxes) at Lumwana, both occurring in the prior quarter. In the current quarter, there were net impairment reversals of $566 million relating to an impairment reversal at Pueblo Viejo of $865 million ($277 million net of taxes and non-controlling interest) and an impairment charge at Pascua-Lama of $296 million (no tax impact). Net earnings in the current quarter were further impacted by a $628 million gain on the de-recognition of the deferred revenue liability relating to our silver sale agreement with Wheaton Precious Metals Corp., a gain of $408 million resulting from the sale of our 50% interest in Kalgoorlie, and a gain of $216 million on a settlement of customs duty and indirect taxes at Lumwana. After adjusting for items that are not indicative of future operating earnings, adjusted net earnings4 of $300 million for the three months ended December 31, 2019 were $36 million higher than the prior quarter, due to an increase in revenue resulting from higher sales volume and marginally higher realized prices4, partially offset by higher cost of sales resulting from the increased sales volume.
Significant adjusting items (pre-tax and excluding non-controlling interest effects) in the three months ended December 31, 2019 include:
• $845 million in other income adjustments, primarily related to a $628 million gain on the de-recognition of the deferred revenue liability relating to our silver sale agreement with Wheaton Precious Metals Corp. and a gain of $216 million on a settlement of customs duty and indirect taxes at Lumwana;
• $566 million in net impairment reversals, relating to Pueblo Viejo, partially offset by impairment charges at Pascua-Lama; and
• $414 million in acquisition/disposition gains, primarily resulting from the sale of our 50% interest in Kalgoorlie.
Refer to page 64 for a full list of reconciling items between net earnings and adjusted net earnings4 for the current and previous periods.
Factors affecting net earnings and adjusted net earnings4 - year ended December 31, 2019 versus December 31, 2018
Net earnings for the year ended December 31, 2019 were $3,969 million compared to a loss of $1,545 million in the same prior year period. The significant increase was mainly due to a gain of $1.9 billion ($1.5 billion net of taxes) relating to the remeasurement of Turquoise Ridge to fair value as a result of its contribution to Nevada Gold Mines and a gain of $408 million resulting from the sale of our 50% interest in Kalgoorlie. This was combined with impairment reversals at Lumwana of $947 million ($663 million net of taxes) and at Pueblo Viejo of $865 million ($277 million net of taxes and non-controlling interest), partially offset by an impairment charge at Pascua-Lama of $296 million (no tax impact). In addition to these impacts, there were significant tax adjustments relating to the de-recognition of deferred tax assets of $814 million occurring in the prior year, a $628 million gain on the de-recognition of the deferred revenue liability relating to our silver sale agreement with Wheaton Precious Metals Corp., and a gain of $216 million on a tax settlement at Lumwana. After adjusting for items that are not indicative of future operating earnings, adjusted net earnings4
of $902 million for the year ended December 31, 2019 were $493 million higher than the same prior year period. The increase in adjusted net earnings was primarily due to higher sales volumes as a result of the Merger and the formation of Nevada Gold Mines. Excluding the impact of the Merger and the formation of Nevada Gold Mines, the increase in adjusted net earnings was primarily due to an increase in realized gold prices4.
Significant adjusting items (pre-tax and excluding non-controlling interest effects) in the year December 31, 2019 include:• $2,327 million in acquisition/disposition gains mainly relating to the remeasurement of Turquoise Ridge to fair value as a
result of its contribution to Nevada Gold Mines and a gain of $408 million resulting from the sale of our 50% interest in Kalgoorlie;
• $1,423 million in net impairment reversals, relating to Lumwana and Pueblo Viejo, partially offset by impairments at Pascua-Lama; and
• $687 million in other income adjustments, primarily related to a $628 million gain on the de-recognition of the deferred revenue liability relating to our silver sale agreement with Wheaton Precious Metals Corp. and a gain of $216 million on a settlement of customs duty and indirect taxes at Lumwana, partially offset by severance costs as a result of the implementation of a number of organizational reductions.
Refer to page 64 for a full list of reconciling items between net earnings and adjusted net earnings4 for the current and previous periods.

BARRICK YEAR-END 2019 9 MANAGEMENT’S DISCUSSION AND ANALYSIS
Factors affecting Operating Cash Flow and Free Cash Flow4 - three months ended December 31, 2019 versus September 30, 2019
In the three months ended December 31, 2019, we generated $875 million in operating cash flow, compared to $1,004 million in the prior quarter. The decrease of $129 million was primarily due to an increase in interest paid as a result of the timing of interest payments on our public market debt, partially offset by an increase in gold and copper sales volumes of 7% and 40%, respectively. This was further impacted by higher gold and copper realized prices4 of $1,483 per ounce and $2.76 per pound, respectively, for the three months ended December 31, 2019, compared to $1,476 per ounce and $2.55 per pound, respectively, in the prior quarter.
Free cash flow4 for the three months ended December 31, 2019 was $429 million, compared to $502 million in the prior quarter, reflecting lower operating cash flows, partially offset by lower capital expenditures. In the three months ended December 31, 2019, capital expenditures on a cash basis were $446 million compared to $502 million in the prior quarter primarily due to lower project capital expenditures with the most significant change related to Cortez due to decreases at the Cortez Hills Underground Rangefront project.
Factors affecting Operating Cash Flow and Free Cash Flow4 - year ended December 31, 2019 versus December 31, 2018
For the year ended December 31, 2019, we generated $2,833 million in operating cash flow, compared to $1,765 million in the same prior year period. The increase of $1,068 million was primarily due to higher sales volume as a result of the Merger and the formation of Nevada Gold Mines. This was combined with higher realized gold prices4 of $1,396 per ounce in 2019 compared to $1,270 per ounce in 2018 and, partially offset by higher cost of sales per ounce5.
For 2019, we generated free cash flow4 of $1,132 million compared to $365 million in 2018. The increase primarily reflects higher operating cash flows, partially offset by higher capital expenditures. In 2019, capital expenditures on a cash basis were $1,701 million compared to $1,400 million in the same prior year period. Higher capital expenditures of $301 million were primarily due to an increase in minesite sustaining capital expenditures as a result of the Merger and the consolidation impact of Nevada Gold Mines, partially offset by lower project capital expenditures at Cortez due to decreasing Crossroads dewatering activities and Rangefront project expenditures.

BARRICK YEAR-END 2019 10 MANAGEMENT’S DISCUSSION AND ANALYSIS
SafetyOur safety vision is “Every person going home safe and healthy every day.” In 2019, although we operated with zero fatalities, our Total Reportable Injury Frequency Rate6 (“TRIFR”) increased by 5%, from 2.12 to 2.24, year-over-year. In analyzing the incidents and frequencies, the combination of assets into Nevada Gold Mines in the North America region did have an impact on our performance. The Africa and Middle East region improved year-on-year in both Lost Time Injuries (“LTIs”) and TRIFR.
Barrick is fully committed to the safety, health and well-being of our people, their families and the communities in which we operate. We review safety performance and incidents, share lessons learned and communicate best practices across our business during weekly Executive Committee Review meetings, the main forum for senior management to review our current safety performance. We will continue our efforts to further reduce injury occurrences.
Every site has its own site-specific safety procedures, management plans and systems in place, in line with international best practice. Our goal is for the safety management systems at all operational mines to be certified to the internationally recognized ISO 45001 standard by the end of 2021.
Our renewed focus on safety and reaffirmed commitment to prevent fatalities has led to the company-wide roll out of new controls including our ten Fatality Prevention Commitments to help eliminate fatalities and serious injuries. Our Fatality Prevention Commitments align with the International Council on Mining and Metal’s Life Saving Controls, which are based upon lessons learned from fatal incidents within the mining industry, including Barrick’s experience. Our Commitments and Unacceptable Behaviors guideline has also been implemented, which reaffirms our zero tolerance policy for behavior such as working on site under the influence of drugs or alcohol.
EnvironmentBarrick continues to rebuild its reputation for environmental excellence and aims to become the world’s most valued gold mining business by delivering sustainable returns for our owners and partners, including the host communities and countries in which we operate.
We have set a corporate goal for all sites to have their Environmental Management System (“EMS”) certified to the ISO 14001:2015 standard by the end of 2020. Currently, all operations, except the Jabal Sayid mine in Saudi Arabia and the Tanzanian assets, are certified to this standard.
In 2019, we introduced a new Environmental Incident Reporting and Investigation Standard to better define the classification, reporting, responsibility and investigation of environmental incidents at Barrick sites. As defined by our new system, we had zero Class 1 - High Significance7 incidents and 13 Class 2 - Medium Significance8 incidents in 2019.
Climate ChangeClimate change, including shifts in temperature and precipitation and more frequent severe weather events, could affect the mining industry in a range of possible ways. Volatile
climatic conditions can affect the stability and effectiveness of infrastructure and equipment; potentially impact environmental protection and site closure practices; lead to changes in the regulatory environment, including increased carbon tax regimes; and potentially impact the stability and cost of water and energy supplies. We therefore view climate change as a company, community, and global concern. In 2019, following our merger with Randgold and the formation of Nevada Gold Mines, we reviewed and updated the climate change strategy developed in 2017.
Barrick’s climate change strategy has three pillars: identify, understand and mitigate the risks associated with climate change; measure and reduce our impacts on climate change; and improve our disclosure on climate change. Action taken on each pillar in 2019 is described below.
Identify, understand and mitigate the risks associated with climate changeWe continue to take steps to identify and manage risks and build resilience to climate change, as well as to position ourselves for new opportunities. In 2019, climate change- related factors continued to be incorporated into Barrick’s formal risk assessment process (for example, consideration is given to the availability of and access to water and the impact of increased precipitation, drought, or severe storms on operations as well as on communities near our operations). We have identified several climate-related risks and opportunities for our business: physical impacts of climate change, such as an increase in extended duration extreme precipitation events; an increase in regulations that seek to address climate change; and increased global investment in innovation and low-carbon technologies.
Measure and reduce the Company’s impact on climate changeMining is an energy-intensive business, and we understand the important link between energy use and greenhouse gas (“GHG”) emissions. By effectively managing our energy use, we can reduce our draw from local energy grids, reduce our GHG emissions, achieve more efficient production, and reduce direct mining costs. In 2019, we progressed the conversion of the Quisqueya I power generation facility in the Dominican Republic from heavy fuel oil to natural gas. We expect the power plant to receive its first liquefied natural gas deliveries in first quarter 2020. The conversion will help reduce the mine site’s power generation costs and GHG emissions by 30%. We also advanced a power transmission project at Veladero to connect the mine to grid power and started construction of a solar plant at Loulo-Gounkoto. Each of these projects is expected to reduce the need for diesel generators, thereby reducing our emissions and power generation costs.
Improve our disclosure on climate changeIn 2019, one of our first reporting activities as a merged Company was to complete the CDP (formerly known as the Carbon Disclosure Project) emissions questionnaire which makes investor-relevant climate data widely available.
Throughout 2019, the Board’s Corporate Governance & Nominating Committee, which met quarterly, was responsible for overseeing Barrick’s policies, programs, and performance relating to the environment, including climate change. The Audit & Risk Committee assisted the Board in overseeing the Company’s management of enterprise risks as well as the implementation of policies and standards for monitoring and

BARRICK YEAR-END 2019 11 MANAGEMENT’S DISCUSSION AND ANALYSIS
mitigating such risks. Climate change is built into our formal risk management process, outputs of which were reviewed by the Audit & Risk Committee throughout 2019. In addition, the Audit & Risk Committee reviewed the Company’s approach to climate change in the context of Barrick’s public disclosure.
At the management level, in furtherance of its commitment to sustainability, Barrick established the Environmental and Social Oversight (“E&S”) Committee in 2019. The E&S Committee is chaired by the President and Chief Executive Officer, and includes each of the regional Chief Operating Officers, Mine General Managers and health, safety, and environment and closure leads, as well as the Group Sustainability Executive and an independent sustainability consultant. The E&S Committee meets each quarter to review the Company’s sustainability performance and compliance with its sustainability policies, as well as to identify concerns and opportunities at the Company’s operations at an early stage. The President and Chief Executive Officer reviews the reports of the E&S Committee with the Corporate Governance & Nominating Committee on a quarterly basis as part of the Committee’s mandate to oversee Barrick’s environmental, safety and health, corporate social responsibility, and human rights programs, policies and performance.
Further to the specific focus of the E&S Committee, regular Executive Committee review meetings throughout 2019 allowed for the discussion of opportunities and risks that may help or hinder the Company from achieving its objectives, including climate-related risks (e.g., spring snow melts, hurricanes, flooding, and mud slides).
We expect our climate change activities to continue into 2020 and beyond. Site-level climate-related risks and mitigation plans will continue to be reviewed in the context of the company-wide risk assessment, and site-level plans to reduce energy and GHG emissions will be strengthened. We also expect to continue providing our climate-related disclosure. Overall, based on the work completed, Barrick continues to build resilience to withstand the potential impacts of climate change and leverage potential opportunities as the global economy transitions to a low-carbon future.
Reserves and ResourcesGoldBarrick’s 2019 reserves were calculated using a gold price assumption of $1,200 per ounce, consistent with 2018. As of December 31, 2019, Barrick’s proven and probable gold reserves were 71 million ounces9 at an average grade of 1.68 g/t, compared to 62 million ounces10 at an average grade of 1.56 g/t in the previous year. Reserve replenishment was achieved across the majority of Barrick’s Tier One Assets1, including Kibali, Loulo-Gounkoto, Turquoise Ridge, together with Goldstrike and Leeville in the Carlin Complex.
There were several significant changes to mineral reserves year-on-year, including the Merger with Randgold, the formation of Nevada Gold Mines with Newmont, the acquisition of the minority interests in Acacia and the divestiture of Kalgoorlie, which had the net impact of adding 13.4 million ounces to attributable proven and probable mineral reserves. Successful mineral resource conversion
added 5.9 million ounces to mineral reserves offsetting annual mining depletion of 6.0 million ounces of mining depletion.
In 2019, the principal addition to mineral reserves was through the Merger with Randgold, which added 13 million ounces at an average grade of 4.0 g/t to Barrick’s attributable proven and probable reserves. The Nevada Gold Mines transaction added a further 3.2 million ounces to attributable proven and probable reserves, net of the changes in ownership. Barrick’s acquisition of the minorities’ interest in Acacia and subsequent signing of the framework agreement with the Government of Tanzania (“GoT”), through which the GoT will acquire a 16% free-carried interest in the former Acacia sites, resulted in the addition of a further 1 million ounces in Barrick’s 84% attributable proven and probable reserves for North Mara, Bulyanhulu and Buzwagi. These additions from acquisition were partially offset by the removal of 3.7 million ounces of attributable proven and probable reserves from the divestment of Kalgoorlie.
In 2019, we also added 5.9 million ounces of attributable proven and probable reserves through the conversion of mineral resources as summarized below.
The Africa and Middle East region added 2.1 million ounces, of which Loulo-Gounkoto and Kibali were the primary contributors adding a combined 1.6 million ounces of attributable proven and probable reserves. This was principally from high-grade underground extensions at Yalea and KCD underground, as well as the addition of the Kalimva-Ikamva open pit at Kibali. Additional contributions came from an increase in the gold price assumption used to estimate mineral reserves to $1,200 per ounce (from $1,000 per ounce) for the acquired Randgold assets. Notably, proven and probable mineral reserve grades at both Loulo-Gounkoto and Kibali have stayed relatively consistent year-on-year, highlighting the quality of these Tier One Assets.
North America added 2.8 million ounces of attributable proven and probable reserves, principally from high-grade underground extensions in Carlin and Turquoise Ridge. As expected, the elimination of the previous Toll Milling Agreement following the formation of Nevada Gold Mines allowed us to optimize the underground cut-off grade at Turquoise Ridge and contribute to the year-on-year increase in reserves. For further information on Goldrush and Fourmile, please refer to the Projects section of this MD&A.
Supporting their potential to become Tier One Assets, Veladero and Porgera added a combined 1.0 million ounces of attributable proven and probable reserves. This was mainly due to the conversion of mineral resources at Veladero and underground extensions at Porgera.
The additions described above were partially offset by mining depletion of 6.0 million ounces of attributable proven and probable reserves, other losses of 4.5 million ounces, which were primarily comprised of the removal of the Phase Six pushback at Hemlo and the reclassification of 3.8 million ounces from mineral reserves at Lagunas Norte to mineral resources, in line with our decision to put the property on care and maintenance in 2019.

BARRICK YEAR-END 2019 12 MANAGEMENT’S DISCUSSION AND ANALYSIS
In 2019, all mineral resources were calculated using a gold price assumption of $1,500 per ounce, consistent with 2018. Barrick’s mineral resources for 2019 are now reported on an inclusive basis, and include all areas that form mineral reserves, reported at a mineral resource cut-off grade and the assumed commodity price. All open pit mineral resources are contained within a Whittle shell, while all underground mineral resources are contained within stope optimizer shells. As of December 31, 2019, measured and indicated gold resources were 170 million ounces9 at an average grade of 1.55 g/t and inferred gold resources were 39 million ounces9 at an average grade of 1.3 g/t.
CopperCopper mineral reserves for 2019 were calculated using a copper price of $2.75 per pound and mineral resources at $3.50 per pound, consistent with 2018. As of December 31, 2019, proven and probable copper reserves were 13 billion pounds9, compared to 11 billion pounds10 at the end of 2018. The growth of copper mineral reserves was primarily driven by Lumwana which added 2.2 billion pounds of proven and
probable reserves. This was from a combination of reclassification and remodeling of the Chimiwungo pit and mine cost optimization. This optimization was a direct outcome of improved plant throughput and mining efficiency in 2019, resulting in a reduction of the cut-off grade at Lumwana.
Measured and indicated copper resources were 26 billionpounds9 at an average grade of 0.38% and inferred copper resources were 2.2 billion pounds9 at an average grade of 0.2% as of December 31, 2019. An increase in copper mineral resources at Zaldívar was driven by the inclusion of leachable primary sulfide ore. Zaldívar is jointly owned by Antofagasta and Barrick and is operated by Antofagasta.
The 2019 mineral reserves and mineral resources are estimated using the combined value of gold, copper and silver. Accordingly mineral reserves and mineral resources are reported for all assets where copper or silver is produced and sold as a primary product or a by-product.
Key Business Developments
2019 Highlights• Successful integration of former Randgold executive team
and establishment of two additional regions modeled on the Africa regional team after transformational Merger completed on January 1, 2019
• Negotiation, completion and integration of former Barrick and Newmont operations in Nevada to form the Nevada Gold Mines joint venture - the single largest gold complex in the world and unlocking up to $500 million per annum in synergies
• Acquisition of Acacia minority shareholdings and finalization of agreement to end dispute with the Government of Tanzania and restore our license to operate
• Further rationalization of our portfolio to focus on Tier One Gold Assets1, Tier Two Gold Assets and Strategic Assets2 with the divestment of Kalgoorlie and pending sale of Massawa (expected to close in the first quarter of 2020)
• Full year gold production at upper end and copper production above guidance ranges
• Strengthened balance sheet through positive free cash flow, dispositions of non-core assets and debt repurchases
• Debt, net of cash, now at $2.2 billion, a 47% decrease from the prior year and the lowest level since 2007
• Increasing shareholder returns, having raised the quarterly dividend three times in respect of 2019 performance
Sale of MassawaOn December 10, 2019, Barrick announced that it and its Senegalese joint venture partner have reached an agreement to sell their aggregate 90% interest in the Massawa project (“Massawa”) in Senegal to Teranga Gold Corporation (“Teranga”) for total consideration of up to $430 million.
The consideration consists of an up-front payment of $380 million, including a cash payment of approximately $300 million and Teranga common shares, plus a contingent payment of up to $50 million which is based upon the average gold price for the three-year period immediately following closing.
Barrick will receive 92.5% of the total purchase price for its interest in the Massawa project, with the balance to be received by Barrick’s local Senegalese partner for its minority interest. Barrick is providing $25 million of the $225 million syndicated debt financing secured by Teranga in connection with the transaction.
The transaction is expected to close in the first quarter of 2020 and is subject to receipt of the Massawa exploitation license and residual exploration license from the Government of Senegal, certain other acknowledgments from the Government of Senegal and other customary closing conditions. Refer to note 4 to the Financial Statements for more information.
Sale of KalgoorlieOn November 28, 2019, we completed the sale of our 50% interest in the Kalgoorlie mine in Western Australia to Saracen Mineral Holdings Limited for total cash consideration of $750 million. The transaction resulted in a gain of $408 million for the year ended December 31, 2019.
Pascua-LamaIn the fourth quarter of 2019, we completed a study of the Pascua-Lama project and concluded that we do not have a plan that meets our investment criteria under our current assumptions. This was an indicator of impairment and we concluded that the carrying value of Pascua-Lama exceeded the Fair Value Less Cost to Dispose (“FVLCD”) and we recorded a non-current asset impairment of $296 million, based on a FVLCD of $398 million. Refer to note 21 to the Financial Statements for more information. We have also updated the liability for the silver stream agreement to align with the conclusions from the completion of the study. The deferred revenue liability was derecognized, and a current liability was recognized for the residual balance payable to Wheaton Precious Metals Corp. of $253 million under the agreement. This adjustment resulted in $628 million recorded in Other Income. Refer to notes 3 and 9 to the Financial Statements for more information.

BARRICK YEAR-END 2019 13 MANAGEMENT’S DISCUSSION AND ANALYSIS
In addition, a new closure plan and estimate supported by feasibility level engineering studies was finalized, which resulted in a decrease in the provision for environmental rehabilitation liability of $270 million.
Barrick’s intention is to update our geological understanding of the orebody and this process is expected to take a number of years to complete. The focus in 2020 at Pascua-Lama will be on addressing the gaps identified in the geological and geo-metallurgical understanding of the orebody, building upon the improved 3D geology model completed in 2019. This includes a drill program at the Penelope deposit of Lama, as well as column testing to assess the amenability of Penelope ore for heap leaching at Veladero. Refer to the Exploration section of the MD&A for more information.
Acacia Mining plcOn September 17, 2019, Barrick acquired all of the Acacia Mining plc (“Acacia”) shares we did not already own through a share-for-share exchange of 0.168 Barrick shares and any Acacia Exploration Special Dividends for each ordinary share of Acacia. The Acacia Exploration Special Dividends11 and any deferred cash consideration dividends (if applicable) will be paid as a consequence of a sales process to realize value from the sale of certain Acacia exploration properties to be undertaken during the two-year period following closing. This transaction resulted in the issuance of 24,836,876 Barrick common shares or approximately 1% of Barrick’s share capital. As a result, Acacia ceased trading on the London Stock Exchange and became a wholly-owned subsidiary of Barrick called Barrick TZ Limited. Refer to note 4 to the Financial Statements for more information.
Notwithstanding the completion of the Acacia transaction on September 17, 2019, we consolidated our interest in Acacia and recorded a non-controlling interest of 36.1% in the income statement for the entirety of the third quarter of 2019 as a matter of convenience. As at September 30, 2019, we derecognized the non-controlling interest on the balance sheet related to our former 63.9% ownership of Acacia to reflect our 100% interest at that time. The former Acacia mine sites (Bulyanhulu, North Mara and Buzwagi) will now be referred to individually in this report.
On January 24, 2020, Barrick announced that the Company had ratified the creation of Twiga Minerals Corporation (“Twiga”) at a signing ceremony with the President of Tanzania, formalizing the establishment of a joint venture between Barrick and the Government of Tanzania (“GoT”) and resolution of all outstanding disputes between Barrick and the GoT, including the lifting of the previous concentrate export ban, effective immediately. The GoT will receive a free carried shareholding of 16% in each of the former Acacia mines (Bulyanhulu, Buzwagi and North Mara), and will receive its half of the economic benefits from taxes, royalties, clearing fees and participation in all cash distributions made by the mines and Twiga, after the recoupment of capital investments. Twiga will provide management services to the mines.
The terms of the signed agreement are consistent with those previously announced, including the payment of $300 million to settle all outstanding tax and other disputes (the “Settlement Payment”); the lifting of the concentrate export ban; the sharing of future economic benefits from the mines on a 50/50
basis; and a dispute resolution mechanism that provides for binding international arbitration. The 50/50 division of economic benefits will be maintained through an annual true-up mechanism, which will not account for the Settlement Payment.
Barrick and the GoT continue to fulfill their respective obligations to satisfy all conditions of the signed agreement, primarily with respect to the execution and delivery of formal termination documents for the settlement of all outstanding disputes between the two parties.
Operating results are included at 100% from October 1, 2019 up until the GoT’s 16% free-carried interest is made effective, which is expected to be as of January 1, 2020, and on an 84% basis thereafter.
Nevada Gold Mines LLCOn March 10, 2019, we entered into an implementation agreement with Newmont to create a joint venture, named Nevada Gold Mines, combining our respective mining operations, assets, reserves and talent in Nevada, USA. This includes Barrick's Cortez, Goldstrike, Turquoise Ridge and Goldrush properties and Newmont's Carlin, Twin Creeks, Phoenix, Long Canyon and Lone Tree properties. On July 1, 2019, the transaction closed and we began consolidating the operating results, cash flows and net assets of Nevada Gold Mines from that date forward. Barrick is the operator of the joint venture and owns 61.5%, with Newmont owning the remaining 38.5% of the joint venture.
As a result of this transaction, Barrick recognized a gain in our earnings for the third quarter of $1.9 billion on the remeasurement of our previous 75% interest of Turquoise Ridge. Refer to note 4 to the Financial Statements for more information.
Debt ManagementOn July 15, 2019, Barrick completed a make-whole repurchase of the $248 million of outstanding principal on our 4.95% Notes due 2020 and incurred a loss on debt extinguishment of $3 million in the third quarter of 2019. The debt repayment is expected to result in an annualized interest saving of $12 million.
Subsequent to year end, on January 31, 2020, Barrick completed a make-whole repurchase of the $337 million of outstanding principal on our 3.85% Notes due 2022 and a loss on debt extinguishment of $15 million will be recorded in the first quarter of 2020. The debt repayment is expected to result in an annualized interest saving of $13 million.
Debt, net of cash, has been reduced by 47% from the prior year to $2.2 billion.
Reko Diq ArbitrationOn July 12, 2019, the World Bank International Centre for Settlement of Investment Disputes (“ICSID”) awarded $5.84 billion in damages to Tethyan Copper Company Pty Limited (“TCC”), a joint venture held equally by Barrick and Antofagasta plc, in relation to the arbitration claims filed against the Government of Pakistan (“GOP”) following the unlawful denial of a mining lease for the Reko Diq project in Pakistan in 2011.

BARRICK YEAR-END 2019 14 MANAGEMENT’S DISCUSSION AND ANALYSIS
Damages include compensation of $4.087 billion in relation to the fair market value of the Reko Diq project at the time the mining lease was denied, and interest until the date of the award of $1.753 billion. Compound interest continues to apply at a rate of US Prime +1% per annum until the award is paid.
In November 2019, the GOP applied to annul TCC’s damages award, which resulted in an automatic stay on TCC from pursuing enforcement action. ICSID has constituted a committee to hear the annulment application, consisting of a president from South Korea and additional members from Mexico and Finland. The committee appointed by ICSID to hear the application for annulment will also determine whether the stay on enforcement proceedings should be extended or lifted while it considers the application for annulment. No decision on the GOP’s annulment application or the stay on enforcement proceedings has yet been made.
The proceeds of this award will not be recognized in our financial statements until any such proceeds have been collected. Refer to note 36 to the Financial Statements for more information regarding these and related matters.
Randgold Resources Limited MergerOn January 1, 2019, we acquired 100% of the issued and outstanding shares of Randgold. Each Randgold shareholder received 6.1280 common shares of Barrick for each Randgold share, which resulted in the issuance of 583,669,178 Barrick common shares. After this share issuance, Barrick shareholders owned 66.7%, while former Randgold shareholders owned 33.3%, of the shares of the combined company. We have determined that this transaction represents a business combination with Barrick identified as the acquirer. Based on the December 31, 2018 closing share price of Barrick’s common shares, the total consideration of the acquisition was $7.9 billion.
Randgold was a publicly traded mining company with ownership interests in the following gold mines: Kibali in the
Democratic Republic of Congo; Tongon in Côte d’Ivoire; Loulo-Gounkoto and Morila in Mali; the Massawa project in Senegal and various exploration properties. We began consolidating the operating results, cash flows and net assets of Randgold from January 1, 2019.
In conjunction with the Merger, Barrick has a new management team, effective January 1, 2019. Mark Bristow is now President and Chief Executive Officer of Barrick. He was formerly the Chief Executive Officer of Randgold, a position he held since its incorporation in 1995. Graham Shuttleworth is now Senior Executive Vice-President and Chief Financial Officer of Barrick, having formerly served as Randgold‘s Chief Financial Officer since 2007. Kevin Thomson, Senior Executive Vice-President, Strategic Matters, continues in the role to which he was appointed at Barrick in October 2014.
In addition, Barrick is now managed by three regional Chief Operating Officers, each of whom reports to the President and Chief Executive Officer. Catherine Raw, formerly Barrick's Chief Financial Officer, was appointed Chief Operating Officer, North America. Mark Hill, formerly Barrick's Chief Investment Officer, was appointed Chief Operating Officer, Latin America and Asia Pacific. Willem Jacobs, formerly Randgold's General Manager East and Central Africa, was appointed Chief Operating Officer, Africa and Middle East.
Following the closing of the Merger, Barrick's Board of Directors was reconstituted with the following nine Directors: John Thornton (Executive Chairman), Brett Harvey (Lead Independent Director), Mark Bristow, María Ignacia Benítez, Gustavo Cisneros, Christopher Coleman, Michael Evans, Brian Greenspun, and Andrew Quinn. Regrettably, on February 28, 2019, María Ignacia Benítez passed away. Barrick’s Corporate Governance & Nominating Committee initiated a search for an equally compelling and qualified female candidate to fill the vacant Board position and on August 9, 2019, we announced the appointment of Loreto Silva to the Board of Directors as an independent director.

BARRICK YEAR-END 2019 15 MANAGEMENT’S DISCUSSION AND ANALYSIS
Outlook for 2020 Operating Division GuidanceOur 2019 gold and copper production, cost of sales, total cash costs4, all-in sustaining costs4 and 2020 forecast gold and copper production, cost of sales, total cash costs4 and all-in sustaining costs4 ranges by operating division are as follows:
Operating Division
2019attributableproduction(000s ozs)
2019 cost of salesa
($/oz)
2019 total cash
costsb ($/oz)
2019 all-in sustaining
costsb ($/oz)
2020 forecastattributableproduction(000s ozs)
2020 forecast cost of salesa
($/oz)
2020 forecast total cash costsb
($/oz)
2020 forecast all-in
sustaining costsb ($/oz)
GoldCarlin (61.5%)c,d 968 1,004 746 984 1,000 - 1,050 920 - 970 760 - 810 1,000 - 1,050Cortez (61.5%)c 801 762 515 651 450 - 480 980 - 1,030 640 - 690 910 - 960Turquoise Ridge (61.5%)c 335 846 585 732 430 - 460 900 - 950 540 - 590 690 - 740Phoenix (61.5%)c 56 2,093 947 1,282 100 - 120 1,850 - 1,900 700 - 750 920 - 970Long Canyon (61.5%)c 58 1,088 333 681 130 - 150 910 - 960 240 - 290 450 - 500
Nevada Gold Mines (61.5%) 2,218 924 634 828 2,100 - 2,250 970 - 1,020 660 - 710 880 - 930Hemlo 213 1,137 904 1,140 200 - 220 960 - 1,010 800 - 850 1,200 - 1,250
North America 2,431 943 655 851 2,300 - 2,450 970 - 1,020 660 - 710 900 - 950
Pueblo Viejo (60%) 590 747 471 592 530 - 580 840 - 890 520 - 570 720 - 770Veladero (50%) 274 1,188 734 1,105 240 - 270 1,220 - 1,270 670 - 720 1,250 - 1,300Porgera (47.5%) 284 994 838 1,003 240 - 270 890 - 940 770 - 820 960 - 1,010Kalgoorlie (50%)e 206 1,062 873 1,183
Latin America & Asia Pacific 1,354 937 664 874 1,000 - 1,100 930 - 980 610 - 660 890 - 940
Loulo-Gounkoto (80%) 572 1,044 634 886 500 - 540 1,050 - 1,100 620 - 670 970 - 1,020Kibali (45%) 366 1,111 568 693 340 - 370 1,030 - 1,080 600 - 650 790 - 840North Maraf 251 953 646 802 240 - 270 750 - 800 570 - 620 830 - 880Tongon (89.7%) 245 1,469 787 844 240 - 260 1,390 - 1,440 680 - 730 740 - 790Bulyanhuluf 27 1,207 676 773 30 - 50 1,210 - 1,260 790 - 840 1,110 - 1,160Buzwagif 83 1,240 1,156 1,178 80 - 100 850 - 900 820 - 870 850 - 900
Africa & Middle East 1,544 1,332 673 834 1,450 - 1,600 1,040 - 1,090 640 - 690 870 - 920
Total Attributable to Barrickg,h,i,j 5,465 1,005 671 894 4,800 - 5,200 980 - 1,030 650 - 700 920 - 970
2019attributableproduction
(M lbs)
2019 cost of salesa
($/lb)
2019 C1 cash
costsb ($/lb)
2019 all-in sustaining
costsb ($/lb)
2020 forecast attributable production
(M lbs)
2020 forecast cost of salesa
($/lb)
2020 forecast C1 cash costsb
($/lb)
2020 forecast all-in
sustaining costsb ($/lb)
Copper Lumwana 238 2.13 1.79 3.04 250 - 280 2.20 - 2.40 1.50 - 1.70 2.30 - 2.60 Zaldívar (50%) 128 2.46 1.77 2.15 120 - 135 2.40 - 2.70 1.65 - 1.85 2.30 - 2.60 Jabal Sayid (50%) 66 1.53 1.26 1.51 60 - 70 1.75 - 2.00 1.40 - 1.60 1.50 - 1.70Total Copperi 432 2.14 1.69 2.52 440 - 500 2.10 - 2.40 1.50 - 1.80 2.20 - 2.50
a. Cost of sales applicable to gold per ounce is calculated using cost of sales applicable to gold on an attributable basis (removing the non-controlling interest of 40% Pueblo Viejo, 20% of Loulo-Gounkoto, 10.3% of Tongon, 36.1% of Tanzania (notwithstanding the completion of the Acacia transaction on September 17, 2019, our results include our 63.9% share up until the end of the third quarter of 2019 as a matter of convenience) and 40% of South Arturo (63.1% of South Arturo from July 1, 2019 onwards as a result of its contribution to Nevada Gold Mines) from cost of sales and including our proportionate share of cost of sales attributable to our equity method investments in Kibali and Morila), divided by attributable gold ounces sold. Also removes the non-controlling interest of 38.5% Nevada Gold Mines from cost of sales from July 1, 2019 onwards. Cost of sales applicable to copper per pound is calculated using cost of sales applicable to copper including our proportionate share of cost of sales attributable to our equity method investments in Zaldívar and Jabal Sayid, divided by consolidated copper pounds sold (including our proportionate share of copper pounds sold from our equity method investments).
b. Total cash costs, all-in sustaining costs and C1 cash costs are non-GAAP financial performance measures with no standardized meaning under IFRS and therefore may not be comparable to similar measures of performance presented by other issuers. For further information and a detailed reconciliation of the non-GAAP measures used in this section of the MD&A to the most directly comparable IFRS measures, please see pages 63 to 85 of this MD&A.
c. These five operations are part of Nevada Gold Mines from July 1, 2019. Amounts include Cortez (100%), Goldstrike (100%) and Turquoise Ridge (75%), also known collectively as Barrick Nevada, from January 1, 2019 to June 30, 2019, and Cortez, Carlin (which includes Goldstrike), Turquoise Ridge (including Twin Creeks), Phoenix and Long Canyon on a 61.5% basis from July 1, 2019 onwards as a result of the formation of Nevada Gold Mines with Newmont on July 1, 2019.
d. Includes our 60% share of South Arturo from January 1, 2019 to June 30, 2019 and 36.9% from July 1, 2019 onwards as a result of the formation of Nevada Gold Mines with Newmont on July 1, 2019.
e. As a result of the sale of our 50% interest in Kalgoorlie on November 28, 2019, there is no guidance for 2020.f. Formerly known as Acacia Mining plc. On September 17, 2019, Barrick acquired all of the shares of Acacia it did not own. Operating results are included at 100% from October
1, 2019 (notwithstanding the completion of the Acacia transaction on September 17, 2019, we consolidated our interest in Acacia and recorded a non-controlling interest of 36.1% in the income statement for the entirety of the third quarter of 2019 as a matter of convenience) up until the GoT’s 16% free-carried interest is made effective, which is expected to be January 1, 2020, and on an 84% basis thereafter. As the GoT’s 16% free-carried interest is expected to be made effective as of January 1, 2020, our 2020 outlook represents our 84% share.
g. Also includes Lagunas Norte, Golden Sunlight, and Morila (40%) and excludes Pierina which is mining incidental ounces as it enters closure. Due to the planned ramp down of operations, we have ceased to include production or non-GAAP cost metrics for Golden Sunlight or Morila after the second quarter and Lagunas Norte after the third quarter.
h. Total cash costs and all-in sustaining costs per ounce include costs allocated to non-operating sites.i. Operating division guidance ranges reflect expectations at each individual operating division, and may not add up to the company-wide guidance range total. The company-
wide 2019 results and guidance ranges exclude Pierina, which is mining incidental ounces as it enters closure, and Golden Sunlight and Morila after the second quarter of 2019 and Lagunas Norte after the third quarter of 2019 due to the planned ramp down of operations.
j. Includes corporate administration costs.

BARRICK YEAR-END 2019 16 MANAGEMENT’S DISCUSSION AND ANALYSIS
Operating Division, Consolidated Expense and Capital GuidanceOur 2019 gold and copper production, cost of sales, total cash costs4, all-in sustaining costs4, consolidated expenses and capital expenditures and 2020 forecast gold and copper production, cost of sales, total cash costs4, all-in sustaining costs4, consolidated expenses and capital expenditures are as follows:
($ millions, except per ounce/pound data) 2019 Original Guidance Q3 2019 Guidance 2019 Actual 2020 Guidance
Gold production and costsProduction (millions of ounces) 5.10 - 5.60 5.10 - 5.60 5.47 4.80 - 5.20
Gold unit production costsCost of sales - gold ($ per oz) 880 - 940 940 - 990 1,005 980 - 1,030Total cash costs ($ per oz)a 650 - 700 650 - 700 671 650 - 700Depreciation ($ per oz) 215 - 235 320 - 350 348 300 - 330 All-in sustaining costs ($ per oz)a 870 - 920 870 - 920 894 920 - 970
Copper production and costsProduction (millions of pounds) 375 - 430 375 - 430 432 440 - 500
Copper unit production costsCost of sales - copper ($ per lb) 2.30 - 2.70 2.30 - 2.70 2.14 2.10 - 2.40 C1 cash costs ($ per lb)a 1.70 - 2.00 1.70 - 2.00 1.69 1.50 - 1.80Depreciation ($ per lb) 0.60 - 0.70 0.60 - 0.70 0.28 0.60 - 0.70 Copper all-in sustaining costs ($ per lb)a 2.40 - 2.90 2.40 - 2.90 2.52 2.20 - 2.50
Exploration and project expenses 280 - 340 280 - 340 342 280 - 320Exploration and evaluation 160 - 170 170 - 180 212 210 - 230Project expenses 120 - 150 120 - 150 130 70 - 90
General and administrative expenses ~200 ~200 212 ~170Corporate administration b ~140 ~140 148 ~130 Stock-based compensation c ~40 ~40 37 ~40 Acacia/Tanzania d ~20 ~20 27 0
Other expense (income) 80 - 100 80 - 100 (3,100) 80 - 100Finance costs, net e 500 - 550 500 - 550 469 400 - 450Attributable capital expenditures:
Attributable minesite sustaining 1,100 - 1,300 1,100 - 1,300 1,176 1,300 - 1,500Attributable project 300 - 400 300 - 400 336 300 - 400
Total attributable capital expenditures f 1,400 - 1,700 1,400 - 1,700 1,512 1,600 - 1,900
a. Total cash costs, all-in sustaining costs and C1 cash costs are non-GAAP financial performance measures with no standardized meaning under IFRS and therefore may not be comparable to similar measures of performance presented by other issuers. For further information and a detailed reconciliation of the non-GAAP measures used in this section of the MD&A to the most directly comparable IFRS measures, please see pages 63 to 85 of this MD&A.
b. 2019 actual of $148 million includes $18 million of severance costs.c. 2019 actual based on US$18.59 and 2020 guidance based on a three-month trailing average ending December 31, 2019 of US$17.51 per share.d. For 2019, Acacia/Tanzania general and administrative expenses were substantially comprised of stock-based compensation and severance costs related to Acacia
prior to the acquisition of the non-controlling interest in September 2019.e. 2019 actual includes a net loss on debt extinguishment of $3 million.f. Attributable capital expenditures are presented on the same basis as guidance, which includes our 61.5% share of Nevada Gold Mines, our 60% share of Pueblo
Viejo, our 80% share of Loulo-Gounkoto, our 89.7% share of Tongon, our 84% share of North Mara, Bulyanhulu and Buzwagi and our 50% share of Zaldívar and Jabal Sayid. As the GoT’s 16% free-carried interest is expected to be made effective as of January 1, 2020, our 2020 outlook represents our 84% share of North Mara, Bulyanhulu and Buzwagi.

BARRICK YEAR-END 2019 17 MANAGEMENT’S DISCUSSION AND ANALYSIS
2020 Guidance AnalysisEstimates of future production, cost of sales, and total cash costs4 presented in this MD&A are based on mine plans that reflect the expected method by which we will mine reserves at each site. Actual gold and copper production and associated costs may vary from these estimates due to a number of operational and non-operational risk factors (see the “Cautionary Statement on Forward-Looking Information” on page 1 of this MD&A for a description of certain risk factors that could cause actual results to differ materially from these estimates).
Gold ProductionWe expect 2020 gold production to be in the range of 4.8 to 5.2 million ounces. As expected, gold production is lower year-over-year given the depletion of the high-grade Cortez Hills Open Pit deposit, divestment of Kalgoorlie and the decision to place Lagunas Norte, Morila and Golden Sunlight in care and maintenance in 2019. Based on mine sequencing and planned maintenance shutdowns, we expect gold production in the second half of 2020 to be slightly higher than the first half.
Gold Cost of Sales per ounceOn a per ounce basis, cost of sales applicable to gold5, after removing the portion related to non-controlling interests, is expected to be in the range of $980 to $1,030 per ounce in 2020. This is in line with the prior year resulting from a full year impact of the higher depreciation at Nevada Gold Mines offset by lower cost of sales primarily at Kibali and North Mara.
Gold Total Cash Costs per ounce4
Total cash costs per ounce4 are expected to be in the range of $650 to $700, unchanged from the 2019 range. We expect Cortez to have higher total cash costs per ounce4 than 2019 driven primarily by the cessation of the comparatively high-grade, low-cost Cortez Hills Open Pit in the first half of 2019. We also expect higher total cash costs per ounce4 at Pueblo Viejo in 2020 due to lower grades compared to the prior year, in line with the mine plan. Lower costs year-over-year at Veladero, Porgera, and North Mara are expected to offset these impacts on Barrick’s total cash costs per ounce4.
Gold All-In Sustaining Costs per ounce4
All-in sustaining costs per ounce4 are expected to be in the range of $920 to $970 for gold, slightly higher than 2019, and driven primarily by the increase in minesite sustaining capital expenditures as discussed below.
Copper Production and CostsWe expect 2020 copper production to be in the range of 440 to 500 million pounds, up from production of 432 million pounds in 2019. This increase is mainly driven by Lumwana following the sustainable improvements we have made to increase plant efficiency and availability through 2019. Together with cost rationalization, these performance improvements have driven a reduction in mining and processing costs per tonne and increased reserves.
In 2020, cost of sales applicable to copper5 is expected to be in the range of $2.10 to $2.40 per pound, in line with the $2.14 per pound outcome for 2019. C1 cash costs per pound4 guidance of $1.50 to $1.80 per pound for 2020 is also in line with 2019. Notably, we expect Lumwana C1 cash costs per pound4 of $1.50 to $1.70 to be lower year-over-year partially driven by the plant availability and efficiency improvements
we have implemented at the mine as discussed earlier. Copper all-in sustaining costs per pound4 guidance of $2.20 to $2.50 for 2020 represents an improvement from $2.52 in 2019.
Exploration and Project ExpensesWe expect to incur approximately $210 to $230 million of exploration and evaluation expenditures in 2020 which includes 100% of the expenditure for Nevada Gold Mines for the full year.
We expect to incur approximately $70 to $90 million of project expenses in 2020, compared to $130 million in 2019. In 2020, project expenses are mainly related to the ongoing site costs at Pascua-Lama and advancing the expansion project at Pueblo Viejo.
General and Administrative ExpensesIn 2020, we expect corporate administration costs to be approximately $130 million, a decrease of $18 million compared to 2019. This mainly reflects the additional severance costs incurred in 2019 associated with our workforce reduction following the Merger. This is partially offset by one-off integration costs associated with Randgold, Nevada Gold Mines and Acacia.
Separately, stock-based compensation expense in 2020 is expected to be approximately $40 million.
Finance Costs, NetIn 2020, net finance costs of $400 to $450 million primarily represent interest expense on long-term debt, non-cash interest expense relating to the gold and silver streaming agreements at Pueblo Viejo, and accretion, net of finance income. We expect net finance costs in 2020 to be lower year-over-year from $469 million in 2019 due in part to lower interest expense following debt repayments of $248 million in 2019. This is combined with the absence of non-cash interest expense related to the silver streaming agreement at Pascua-Lama (refer to notes 3 and 9 to the Financial Statements for more information). Our 2020 forecast includes the loss on debt extinguishment of $15 million related to the make-whole repurchase in January 2020 of $337 million of outstanding principal on our 3.85% Notes due 2022.
Capital ExpendituresTotal attributable gold and copper capital expenditures for 2020 are expected to be in the range of $1,600 to $1,900 million. We continue to focus on the delivery of our project capital pipeline and we expect attributable project capital expenditures to be in the range of $300 to $400 million, consistent with 2019.
More than half of our attributable project capital expenditures in 2020 relate to advancing the expansion project at Pueblo Viejo, the third shaft project at Turquoise Ridge and construction of the Goldrush twin exploration declines. The remainder of project capital expenditure is mainly associated with the Zaldívar Chloride Leach Project and the restart of mining operations at Bulyanhulu.
Attributable minesite sustaining capital expenditures are expected to be in the range of $1,300 to $1,500 million compared to $1,176 million in 2019. The increase is primarily a result of increased capitalized stripping and underground development at Loulo-Gounkoto, the Phase 6 leach pad

BARRICK YEAR-END 2019 18 MANAGEMENT’S DISCUSSION AND ANALYSIS
expansion at Veladero, tailings capacity expansion at Hemlo, plant refurbishment at Bulyanhulu and the development of the Kalima-Ikamva pit project at Kibali.
Effective Income Tax RateAt a gold price of $1,350/oz, our expected effective tax rate range for 2020 is between 30% to 35%. The rate is sensitive to the relative proportion of sales in high versus low tax jurisdictions, realized gold and copper prices, the proportion of income from our equity accounted investments and the level of non-tax affected costs in countries where we generate net losses.
Outlook Assumptions and Economic Sensitivity Analysis
2020 GuidanceAssumption Hypothetical Change Impact on EBITDAa
(millions)Impact on All-in
Sustaining Costsa
Gold revenue, net of royalties $1,350/oz +/- $100/oz +/- $472 +/- $4/oz
Copper revenue, net of royalties $2.75/lb +/- $0.50/lb +/- $224 +/- $0.02/lba. EBITDA and all-in sustaining costs are non-GAAP financial performance measures with no standardized definition under IFRS. For further
information and a detailed reconciliation, please see pages 63 to 85 of this MD&A.
Risks and Risk Management OverviewThe ability to deliver on our vision, strategic objectives and operating guidance depends on our ability to understand and appropriately respond to the uncertainties or “risks” we face that may prevent us from achieving our objectives. In order to achieve this we:• Maintain a framework that permits us to manage risk
effectively and in a manner that creates the greatest value;
• Integrate a process for managing risk into all our important decision-making processes so that we reduce the effect of uncertainty on achieving our objectives;
• Actively monitor key controls we rely on to achieve the Company’s objectives so that they remain in place and are effective at all times; and
• Provide assurance to senior management and relevant committees of the Board on the effectiveness of key control activities.
Board and Committee OversightWe maintain strong risk oversight practices, with responsibilities outlined in the mandates of the Board and related committees. The Board’s mandate makes clear its responsibility for reviewing and discussing with management the processes used to assess and manage risk, including the identification by management of the principal risks of the business, and the implementation of appropriate systems to deal with such risks.
The Audit & Risk Committee of the Board of Directors assists the Board in overseeing the Company’s management of principal risks as well as the implementation of policies and standards for monitoring and modifying such risks, and monitoring and reviewing the Company’s financial position and financial risk management programs generally. The Corporate Governance & Nominating Committee assists the Board in overseeing the Company’s environmental, safety and health, corporate social responsibility, and human rights programs, policies and performance.
Management OversightOur weekly Executive Committee Review is the main forum for senior management to raise and discuss risks facing the operations and organization more broadly. At regularly scheduled meetings, the Board and the Audit & Risk
Committee are provided with updates on the key issues identified by management at these weekly sessions.
Principal RisksThe following subsections describe some of our key sources of uncertainty and most important risk modification activities. The risks described below are not the only ones facing Barrick. Our business is subject to inherent risks in financial, regulatory, strategic and operational areas. For a more comprehensive discussion of those inherent risks, see “Risk Factors” in our most recent Form 40-F/Annual Information Form on file with the SEC and Canadian provincial securities regulatory authorities. Also see the “Cautionary Statement on Forward-Looking Information” on page 1 of this MD&A.
Financial position and liquidityOur liquidity profile, level of indebtedness and credit ratings are all factors in our ability to meet short- and long-term financial demands. Barrick’s outstanding debt balances impact liquidity through scheduled interest and principal repayments and the results of leverage ratio calculations, which could influence our investment grade credit ratings and ability to access capital markets. In addition, our ability to draw on our credit facility is subject to meeting its covenants. Our primary source of liquidity is our operating cash flow, which is dependent on the ability of our operations to deliver projected future cash flows. The ability of our operations to deliver projected future cash flows, as well as future changes in gold and copper market prices, either favorable or unfavorable, will continue to have a material impact on our cash flow and liquidity.
Key risk modification activities:• Continued focus on generating positive free cash flow by
improving the underlying cost structures of our operations in a sustainable manner;
• Disciplined capital allocation criteria for all investments, to ensure a high degree of consistency and rigor is applied to all capital allocation decisions based on a comprehensive understanding of risk and reward;
• Preparation of budgets and forecasts to understand the impact of different price scenarios on liquidity, and formulate appropriate strategies;
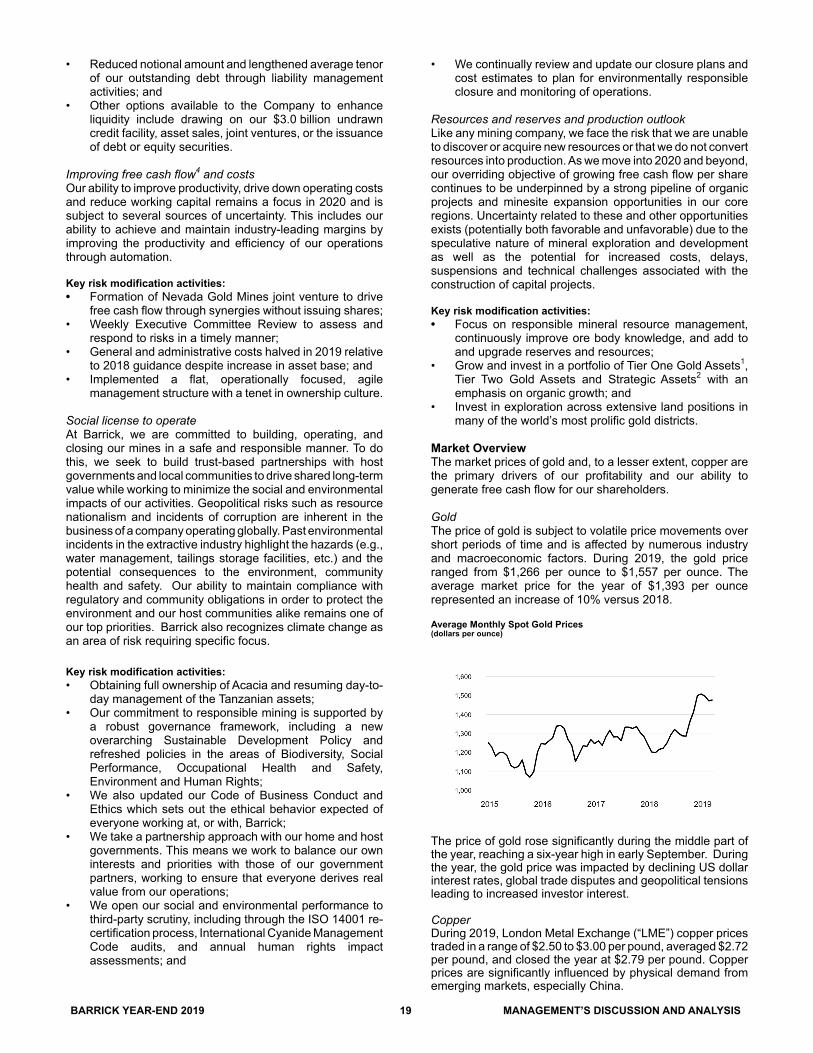
BARRICK YEAR-END 2019 19 MANAGEMENT’S DISCUSSION AND ANALYSIS
• Reduced notional amount and lengthened average tenor of our outstanding debt through liability management activities; and
• Other options available to the Company to enhance liquidity include drawing on our $3.0 billion undrawn credit facility, asset sales, joint ventures, or the issuance of debt or equity securities.
Improving free cash flow4 and costsOur ability to improve productivity, drive down operating costs and reduce working capital remains a focus in 2020 and is subject to several sources of uncertainty. This includes our ability to achieve and maintain industry-leading margins by improving the productivity and efficiency of our operations through automation.
Key risk modification activities:• Formation of Nevada Gold Mines joint venture to drive
free cash flow through synergies without issuing shares;• Weekly Executive Committee Review to assess and
respond to risks in a timely manner;• General and administrative costs halved in 2019 relative
to 2018 guidance despite increase in asset base; and• Implemented a flat, operationally focused, agile
management structure with a tenet in ownership culture.
Social license to operateAt Barrick, we are committed to building, operating, and closing our mines in a safe and responsible manner. To do this, we seek to build trust-based partnerships with host governments and local communities to drive shared long-term value while working to minimize the social and environmental impacts of our activities. Geopolitical risks such as resource nationalism and incidents of corruption are inherent in the business of a company operating globally. Past environmental incidents in the extractive industry highlight the hazards (e.g., water management, tailings storage facilities, etc.) and the potential consequences to the environment, community health and safety. Our ability to maintain compliance with regulatory and community obligations in order to protect the environment and our host communities alike remains one of our top priorities. Barrick also recognizes climate change as an area of risk requiring specific focus. Key risk modification activities:• Obtaining full ownership of Acacia and resuming day-to-
day management of the Tanzanian assets;• Our commitment to responsible mining is supported by
a robust governance framework, including a new overarching Sustainable Development Policy and refreshed policies in the areas of Biodiversity, Social Performance, Occupational Health and Safety, Environment and Human Rights;
• We also updated our Code of Business Conduct and Ethics which sets out the ethical behavior expected of everyone working at, or with, Barrick;
• We take a partnership approach with our home and host governments. This means we work to balance our own interests and priorities with those of our government partners, working to ensure that everyone derives real value from our operations;
• We open our social and environmental performance to third-party scrutiny, including through the ISO 14001 re-certification process, International Cyanide Management Code audits, and annual human rights impact assessments; and
• We continually review and update our closure plans and cost estimates to plan for environmentally responsible closure and monitoring of operations.
Resources and reserves and production outlookLike any mining company, we face the risk that we are unable to discover or acquire new resources or that we do not convert resources into production. As we move into 2020 and beyond, our overriding objective of growing free cash flow per share continues to be underpinned by a strong pipeline of organic projects and minesite expansion opportunities in our core regions. Uncertainty related to these and other opportunities exists (potentially both favorable and unfavorable) due to the speculative nature of mineral exploration and development as well as the potential for increased costs, delays, suspensions and technical challenges associated with the construction of capital projects.
Key risk modification activities:• Focus on responsible mineral resource management,
continuously improve ore body knowledge, and add to and upgrade reserves and resources;
• Grow and invest in a portfolio of Tier One Gold Assets1, Tier Two Gold Assets and Strategic Assets2 with an emphasis on organic growth; and
• Invest in exploration across extensive land positions in many of the world’s most prolific gold districts.
Market OverviewThe market prices of gold and, to a lesser extent, copper are the primary drivers of our profitability and our ability to generate free cash flow for our shareholders.
GoldThe price of gold is subject to volatile price movements over short periods of time and is affected by numerous industry and macroeconomic factors. During 2019, the gold price ranged from $1,266 per ounce to $1,557 per ounce. The average market price for the year of $1,393 per ounce represented an increase of 10% versus 2018.
Average Monthly Spot Gold Prices(dollars per ounce)
The price of gold rose significantly during the middle part of the year, reaching a six-year high in early September. During the year, the gold price was impacted by declining US dollar interest rates, global trade disputes and geopolitical tensions leading to increased investor interest.
CopperDuring 2019, London Metal Exchange (“LME”) copper prices traded in a range of $2.50 to $3.00 per pound, averaged $2.72per pound, and closed the year at $2.79 per pound. Copper prices are significantly influenced by physical demand from emerging markets, especially China.

BARRICK YEAR-END 2019 20 MANAGEMENT’S DISCUSSION AND ANALYSIS
Copper prices fell to the lows of the year in early September due to a strong US dollar, a weakening Chinese yuan, and concerns over global trade due to tariff actions before rising into the end of the year on low global stockpile levels and an easing in trade tensions between the US and China.
Average Monthly Spot Copper Prices(dollars per pound)
We have provisionally priced copper sales for which final price determination versus the relevant copper index is outstanding at the balance sheet date. As at December 31, 2019, we recorded 39 million pounds of copper sales still subject to final price settlement at an average provisional price of $2.80 per pound. The impact to net income before taxation of a 10% movement in the market price of copper would be approximately $11 million, holding all other variables constant.
Currency Exchange RatesThe results of our mining operations outside of the United States are affected by US dollar exchange rates. We have exposure to the Argentine peso through operating costs at our Veladero mine, and peso denominated VAT receivable balances. In addition, we have exposure to the Canadian and Australian dollars, Chilean peso, Papua New Guinea kina, Peruvian sol, Zambian kwacha, Tanzanian shilling, Dominican peso, West African CFA franc, Euro, South African rand, and British pound through mine operating and capital costs.
Fluctuations in the US dollar increase the volatility of our costs reported in US dollars. In 2019, the Australian dollar traded in a range of $0.67 to $0.73 against the US dollar, while the US dollar against the Canadian dollar, Argentine peso, and CFA franc ranged from $1.30 to $1.37 and ARS 36.85 to ARS 62.00, and XOF 568 to XOF 664, respectively. During the year, the US dollar traded strongly. Along with inflation pressures in Argentina and government actions, this led to a continued weakening of the Argentine peso during the year. During 2019, we did not have any currency hedge positions, and are unhedged against foreign exchange exposures as at December 31, 2019 beyond spot requirements.
FuelFor 2019, the price of West Texas Intermediate (“WTI”) crude oil traded in a wide range between $44 and $67 per barrel, with an average market price of $57 per barrel, and closed the year at $61 per barrel. Oil prices were impacted by global trade tensions, geopolitical events, and the US dollar.
Average Monthly Spot Crude Oil Price (WTI)(dollars per barrel)
During 2019, we did not have any fuel hedge positions, and are unhedged against fuel exposures as at December 31, 2019.
US Dollar Interest RatesAfter four years of benchmark rate increases by the US Federal Reserve, the benchmark rate was lowered by 75 basis points over the course of 2019 to a range of 1.50% to 1.75% in an effort to keep the economy stable during a period of slowing growth and global trade uncertainty. Further changes to short-term rates in 2020 are expected to be dependent on economic data.
At present, our interest rate exposure mainly relates to interest income received on our cash balances ($3.3 billion at December 31, 2019); the mark-to-market value of derivative instruments; the carrying value of certain long-lived assets and liabilities; and the interest payments on our variable-rate debt ($0.1 billion at December 31, 2019). Currently, the amount of interest expense recorded in our consolidated statement of income is not materially impacted by changes in interest rates, because the majority of debt was issued at fixed interest rates. The relative amounts of variable-rate financial assets and liabilities may change in the future, depending on the amount of operating cash flow we generate, as well as the level of capital expenditures and our ability to borrow on favorable terms using fixed rate debt instruments. Changes in interest rates affect the accretion expense recorded on our provision for environmental rehabilitation and therefore would affect our net earnings.

BARRICK YEAR-END 2019 21 MANAGEMENT’S DISCUSSION AND ANALYSIS
Production and Cost Summary - Gold
For the three months ended For the years ended12/31/2019 9/30/2019 % Change 12/31/2019 12/31/2018 % Change 12/31/2017
Nevada Gold Mines (61.5%)a
Gold produced (000s oz) 585 535 9 % 2,218 2,368 (6)% 2,523Cost of sales ($/oz) 1,038 1,027 1 % 924 814 13 % 786Total cash costs ($/oz)b 711 693 3 % 634 526 20 % 467All-in sustaining costs ($/oz)b 944 946 0 % 828 664 25 % 634Cortez (61.5%)c
Gold produced (000s oz) 133 126 6 % 801 1,265 (37)% 1,447Cost of sales ($/oz) 945 829 14 % 762 659 16 % 657Total cash costs ($/oz)b 681 570 19 % 515 351 47 % 300All-in sustaining costs ($/oz)b 1,012 772 31 % 651 430 51 % 380
Carlin (61.5%)d
Gold produced (000s oz) 276 278 (1)% 968 835 16 % 780Cost of sales ($/oz) 975 1,007 (3)% 1,004 1,054 (5)% 1,024Total cash costs ($/oz)b 766 775 (1)% 746 740 1 % 721All-in sustaining costs ($/oz)b 965 1,014 (5)% 984 983 0 % 1,045
Turquoise Ridge (61.5%)e
Gold produced (000s oz) 111 82 35 % 335 268 25 % 211Cost of sales ($/oz) 971 1,077 (10)% 846 783 8 % 715Total cash costs ($/oz)b 625 622 0 % 585 678 (14)% 589All-in sustaining costs ($/oz)b 800 840 (5)% 732 756 (3)% 733
Phoenix (61.5%)f
Gold produced (000s oz) 31 25 24 % 56Cost of sales ($/oz) 2,025 2,186 (7)% 2,093Total cash costs ($/oz)b 902 1,010 (11)% 947All-in sustaining costs ($/oz)b 1,034 1,622 (36)% 1,282
Long Canyon (61.5%)f
Gold produced (000s oz) 34 24 42 % 58Cost of sales ($/oz) 1,026 1,170 (12)% 1,088Total cash costs ($/oz)b 317 353 (10)% 333All-in sustaining costs ($/oz)b 657 714 (8)% 681
Pueblo Viejo (60%)Gold produced (000s oz) 179 139 29 % 590 581 2 % 650Cost of sales ($/oz) 660 807 (18)% 747 750 0 % 699Total cash costs ($/oz)b 422 504 (16)% 471 465 1 % 405All-in sustaining costs ($/oz)b 517 631 (18)% 592 623 (5)% 525
Loulo-Gounkoto (80%)g
Gold produced (000s oz) 144 153 (6)% 572Cost of sales ($/oz) 1,037 1,018 2 % 1,044Total cash costs ($/oz)b 631 630 0 % 634All-in sustaining costs ($/oz)b 917 966 (5)% 886
Kibali (45%)g
Gold produced (000s oz) 87 91 (4)% 366Cost of sales ($/oz) 1,205 1,187 2 % 1,111Total cash costs ($/oz)b 608 554 10 % 568All-in sustaining costs ($/oz)b 740 703 5 % 693
Kalgoorlie (50%)h
Gold produced (000s oz) 36 58 (38)% 206 314 (34)% 368Cost of sales ($/oz) 1,127 1,037 9 % 1,062 899 18 % 806Total cash costs ($/oz)b 940 856 10 % 873 732 19 % 642All-in sustaining costs ($/oz)b 1,172 1,170 0 % 1,183 857 38 % 729
Tongon (89.7%)g
Gold produced (000s oz) 61 62 (2)% 245Cost of sales ($/oz) 1,476 1,396 6 % 1,469Total cash costs ($/oz)b 803 793 1 % 787All-in sustaining costs ($/oz)b 867 869 0 % 844

BARRICK YEAR-END 2019 22 MANAGEMENT’S DISCUSSION AND ANALYSIS
Production and Cost Summary - Gold (continued)
For the three months ended For the years ended12/31/2019 9/30/2019 % Change 12/31/19 12/31/18 % Change 12/31/2017
Porgera (47.5%)Gold produced (000s oz) 82 75 9 % 284 204 39 % 235Cost of sales ($/oz) 909 1,024 (11)% 994 996 0 % 944Total cash costs ($/oz)b 757 868 (13)% 838 796 5 % 781All-in sustaining costs ($/oz)b 894 1,053 (15)% 1,003 1,083 (7)% 993
Veladero (50%)i
Gold produced (000s oz) 71 58 22 % 274 278 (1)% 432Cost of sales ($/oz) 1,138 1,243 (8)% 1,188 1,112 7 % 897Total cash costs ($/oz)b 710 773 (8)% 734 629 17 % 598All-in sustaining costs ($/oz)b 1,142 1,142 0 % 1,105 1,154 (4)% 987
HemloGold produced (000s oz) 54 49 10 % 213 171 25 % 196Cost of sales ($/oz) 1,632 1,083 51 % 1,137 1,157 (2)% 986Total cash costs ($/oz)b 1,091 953 14 % 904 1,046 (14)% 841All-in sustaining costs ($/oz)b 1,380 1,280 8 % 1,140 1,318 (14)% 1,092
North Maraj
Gold produced (000s oz) 103 29 255 % 251 215 17 % 207Cost of sales ($/oz) 1,021 907 13 % 953 795 20 % 683Total cash costs ($/oz)b 675 603 12 % 646 603 7 % 509All-in sustaining costs ($/oz)b 830 850 (2)% 802 830 (3)% 773
Buzwagij
Gold produced (000s oz) 28 18 56 % 83 93 (11)% 172Cost of sales ($/oz) 1,235 1,292 (4)% 1,240 939 32 % 643Total cash costs ($/oz)b 1,144 1,202 (5)% 1,156 916 26 % 600All-in sustaining costs ($/oz)b 1,169 1,220 (4)% 1,178 947 24 % 632
Bulyanhuluj
Gold produced (000s oz) 9 6 50 % 27 26 4 % 112Cost of sales ($/oz) 1,293 1,288 0 % 1,207 1,231 (2)% 1,309Total cash costs ($/oz)b 752 729 3 % 676 650 4 % 848All-in sustaining costs ($/oz)b 909 769 18 % 773 754 3 % 1,319
Total Attributable to Barrickk
Gold produced (000s oz) 1,439 1,306 10 % 5,465 4,527 21 % 5,323Cost of sales ($/oz)l 1,046 1,065 (2)% 1,005 892 13 % 794Total cash costs ($/oz)b 692 710 (3)% 671 588 14 % 526All-in sustaining costs ($/oz)b 923 984 (6)% 894 806 11 % 750
a. Represents the combined results of Cortez, Goldstrike (including our 60% share of South Arturo) and our 75% interest in Turquoise Ridge until June 30, 2019. Commencing July 1, 2019, the date Nevada Gold Mines was established, the results represent our 61.5% interest in Cortez, Carlin (including Goldstrike and 60% of South Arturo), Turquoise Ridge (including Twin Creeks), Phoenix and Long Canyon.
b. These are non-GAAP financial performance measures with no standardized meaning under IFRS and therefore may not be comparable to similar measures presented by other issuers. For further information and a detailed reconciliation of each non-GAAP measure used in this section of the MD&A to the most directly comparable IFRS measure, please see pages 63 to 85 of this MD&A.
c. On July 1, 2019, Cortez was contributed to Nevada Gold Mines, a joint venture with Newmont. As a result, the amounts presented are on an 100% basis up until June 30, 2019, and on a 61.5% basis thereafter.
d. On July 1, 2019, Barrick's Goldstrike and Newmont's Carlin were contributed to Nevada Gold Mines and are now referred to as Carlin. As a result, the amounts presented represent Goldstrike on a 100% basis (including our 60% share of South Arturo) up until June 30, 2019, and the combined results of Carlin and Goldstrike (including our 60% share of South Arturo) on a 61.5% basis thereafter.
e. Barrick owned 75% of Turquoise Ridge through to the end of the second quarter of 2019, with our joint venture partner, Newmont, owning the remaining 25%. Turquoise Ridge was proportionately consolidated on the basis that the joint venture partners that have joint control have rights to the assets and obligations for the liabilities relating to the arrangement. The figures presented in this table are based on our 75% interest in Turquoise Ridge until June 30, 2019. On July 1, 2019, Barrick's 75% interest in Turquoise Ridge and Newmont's Twin Creeks and 25% interest in Turquoise Ridge were contributed to Nevada Gold Mines. Starting July 1, 2019, the results represent our 61.5% share of Turquoise Ridge and Twin Creeks, now referred to as Turquoise Ridge.
f. These sites were acquired as a result of the formation of Nevada Gold Mines on July 1, 2019.g. These sites did not form a part of the Barrick consolidated results in 2018 and 2017 as these sites were acquired as a result of the Merger. h. On November 28, 2019, we completed the sale of our 50% interest in Kalgoorlie in Western Australia to Saracen Mineral Holdings Limited for total cash consideration
of $750 million. Accordingly, these represent our 50% interest until November 28, 2019.i. On June 30, 2017, we sold 50% of Veladero; therefore, these represent results on a 100% basis from January 1 to June 30, 2017 and on a 50% basis from July 1,
2017 onwards.j. Formerly known as Acacia Mining plc. On September 17, 2019, Barrick acquired all of the shares of Acacia it did not own. Operating results are included at 100%
from October 1, 2019 (notwithstanding the completion of the Acacia transaction on September 17, 2019, we consolidated our interest in Acacia and recorded a non-controlling interest of 36.1% in the income statement for the entirety of the third quarter of 2019 as a matter of convenience) up until the GoT’s 16% free-carried interest is made effective, which is expected to be January 1, 2020, and on an 84% basis thereafter.
k. With the end of mining at Golden Sunlight and Morila in the second quarter and Lagunas Norte in the third quarter as previously reported, we have ceased to include production or non-GAAP cost metrics for these sites from July 1, 2019 and October 1, 2019, respectively, onwards although these sites are included in the Total Attributable to Barrick in the prior period comparatives.
l. Cost of sales per ounce (Barrick’s share) is calculated as cost of sales - gold on an attributable basis (excluding sites in care and maintenance) divided by gold equity ounces sold.

BARRICK YEAR-END 2019 23 MANAGEMENT’S DISCUSSION AND ANALYSIS
Production and Cost Summary - Copper
For the three months ended For the years ended12/31/2019 9/30/2019 % Change 12/31/19 12/31/18 % Change 12/31/17
LumwanaCopper production (millions lbs) 63 65 (3)% 238 224 6 % 256Cost of sales ($/lb) 2.22 2.04 9 % 2.13 2.51 (15)% 1.57C1 cash costs ($/lb)a 2.10 1.83 15 % 1.79 2.08 (14)% 1.66All-in sustaining costs ($/lb)a 3.41 3.66 (7)% 3.04 3.08 (1)% 2.35
Zaldívar (50%)Copper production (millions lbs) 36 32 13 % 128 104 23 % 114Cost of sales ($/lb) 2.59 2.18 19 % 2.46 2.55 (4)% 2.15C1 cash costs ($/lb)a 1.95 1.55 26 % 1.77 1.97 (10)% 1.66All-in sustaining costs ($/lb)a 2.56 1.91 34 % 2.15 2.47 (13)% 2.21
Jabal Sayid (50%)Copper production (millions lbs) 18 15 20 % 66 55 20 % 43Cost of sales ($/lb) 1.47 1.63 (10)% 1.53 1.73 (12)% 1.90C1 cash costs ($/lb)a 1.29 1.42 (9)% 1.26 1.53 (18)% 1.70All-in sustaining costs ($/lb)a 1.78 1.65 8 % 1.51 1.92 (21)% 2.30
Total CopperCopper production (millions lbs) 117 112 4 % 432 383 13 % 413Cost of sales ($/lb)b 2.26 2.00 13 % 2.14 2.40 (11)% 1.77C1 cash costs ($/lb)a 1.90 1.62 17 % 1.69 1.97 (14)% 1.66All-in sustaining costs ($/lb)a 2.82 2.58 9 % 2.52 2.82 (11)% 2.34
a. These are non-GAAP financial performance measures with no standardized meaning under IFRS and therefore may not be comparable to similar measures presented by other issuers. For further information and a detailed reconciliation of each non-GAAP measure used in this section of the MD&A to the most directly comparable IFRS measure, please see pages 63 to 85 of this MD&A.
b. Cost of sales per pound (Barrick’s share) is calculated as cost of sales - copper plus our equity share of cost of sales attributable to Zaldívar and Jabal Sayid divided by copper pounds sold.
OPERATING DIVISIONS PERFORMANCE
Review of Operating Divisions PerformanceFollowing the Merger in the first quarter of 2019 and the events surrounding Nevada Gold Mines and Acacia in the third quarter of 2019 (refer to page 12 for further details), our presentation of reportable operating segments consists of nine gold mines (Cortez, Carlin, Turquoise Ridge, Pueblo Viejo, Loulo-Gounkoto, Kibali, Veladero, Porgera and North Mara). The remaining operating segments, including our remaining gold mines, copper mines and projects, have been
grouped into an “other” category and will not be reported on individually. Segment performance is evaluated based on a number of measures including operating income before tax, production levels and unit production costs. Certain costs are managed on a consolidated basis and are therefore not reflected in segment income.

BARRICK YEAR-END 2019 24 MANAGEMENT’S DISCUSSION AND ANALYSIS
Nevada Gold Mines (61.5% basis)a, Nevada USA
Summary of Operating and Financial Data For the three months ended For the years ended
12/31/19 9/30/19 % Change 12/31/19 12/31/18 % Change 12/31/17Total tonnes mined (000s) 53,267 52,528 1 % 189,456 182,204 4 % 211,733
Open pit ore 9,316 7,706 21 % 26,942 20,605 31 % 17,530 Open pit waste 42,623 43,572 (2)% 157,868 157,960 0 % 190,710 Underground 1,328 1,250 6 % 4,646 3,639 28 % 3,493
Average grade (grams/tonne) Open pit mined 0.82 0.77 6 % 0.93 2.96 (69)% 2.70 Underground mined 10.70 9.97 7 % 10.52 10.96 (4)% 10.58 Processed 1.96 2.02 (3)% 2.29 3.47 (34)% 3.45Ore tonnes processed (000s) 11,586 10,211 13 % 36,724 25,680 43 % 24,366 Oxide mill 3,044 3,124 (3)% 8,338 4,527 84 % 4,562 Roaster 1,344 1,309 3 % 5,377 5,104 5 % 4,902 Autoclave 1,556 1,316 18 % 5,656 5,338 6 % 4,730 Heap leach 5,642 4,462 26 % 17,353 10,711 62 % 10,172
Recovery rate 80% 79% 1 % 82% 83% (1)% 86% Oxide Mill 60% 60% 0 % 69% 83% (17)% 91% Roaster 86% 87% (1)% 87% 89% (3)% 89% Autoclave 74% 79% (6)% 74% 69% 8 % 62%
Gold produced (000s oz) 585 535 9 % 2,218 2,368 (6)% 2,523 Oxide mill 76 76 0 % 336 590 (43)% 957 Roaster 286 275 4 % 1,070 1,120 (4)% 929 Autoclave 155 112 39 % 547 497 10 % 459 Heap leach 68 72 (6)% 265 161 65 % 178
Gold sold (000s oz) 565 537 5 % 2,223 2,359 (6)% 2,579Revenue ($ millions) 861 804 7 % 3,128 2,986 5 % 3,241Cost of sales ($ millions) 573 552 4 % 2,035 1,921 6 % 2,028Income ($ millions) 277 237 17 % 1,050 1,011 4 % 1,169EBITDA ($ millions)b 440 403 9 % 1,642 1,688 (3)% 1,990EBITDA marginc 51% 50% 2 % 52% 57% (7)% 61%Capital expenditures ($ millions)d,e 145 164 (12)% 627 626 0 % 620 Minesite sustainingd 124 110 13 % 380 272 40 % 392 Projectd 21 54 (61)% 247 354 (30)% 228Cost of sales ($/oz) 1,038 1,027 1 % 924 814 13 % 786Total cash costs ($/oz)b 711 693 3 % 634 526 20 % 467All-in sustaining costs ($/oz)b 944 946 0 % 828 664 25 % 634All-in costs ($/oz)b 982 1,048 (6)% 938 814 15 % 726
a. Represents the combined results of Cortez, Goldstrike (including our 60% share of South Arturo) and our 75% interest in Turquoise Ridge until June 30, 2019. Commencing July 1, 2019, the date Nevada Gold Mines was established, the results represent our 61.5% interest in Cortez, Carlin (including Goldstrike and 60% of South Arturo), Turquoise Ridge (including Twin Creeks), Phoenix and Long Canyon.
b. These are non-GAAP financial performance measures with no standardized meaning under IFRS and therefore may not be comparable to similar measures presented by other issuers. For further information and a detailed reconciliation of each non-GAAP measure used in this section of the MD&A to the most directly comparable IFRS measure, please see pages 63 to 85 of this MD&A.
c. Represents EBITDA divided by revenue.d. Presented on a cash basis as a result of adopting IFRS 16 Leases starting in the first quarter of 2019. Capital expenditures for 2018 and 2017 are presented on
an accrued basis. Please refer to page 2 of this MD&A for more details. e. Amounts presented exclude capitalized interest.
As discussed on page 12, on July 1, 2019, Nevada Gold Mines was established which encompasses Barrick's former Cortez, Goldstrike, Turquoise Ridge and Goldrush properties and Newmont's former Carlin, Twin Creeks, Phoenix, Long Canyon and Lone Tree properties. Barrick is the operator of the joint venture and owns 61.5%, with Newmont owning the remaining 38.5% of the joint venture. Refer to the following pages for a detailed discussion of Cortez, Carlin (including Goldstrike) and Turquoise Ridge (including Twin Creeks) results.

BARRICK YEAR-END 2019 25 MANAGEMENT’S DISCUSSION AND ANALYSIS
Carlin (61.5% basis)a, Nevada USA
Summary of Operating and Financial Data For the three months ended For the years ended 12/31/19 9/30/19 % Change 12/31/19 12/31/18 % Change 12/31/17Total tonnes mined (000s) 13,639 11,584 18 % 49,343 59,605 (17)% 76,587
Open pit ore 1,832 1,627 13 % 4,773 4,626 3 % 1,575Open pit waste 10,966 9,145 20 % 41,978 53,387 (21)% 73,374Underground 841 812 4 % 2,592 1,592 63 % 1,638
Average grade (grams/tonne)Open pit mined 1.84 1.44 28 % 2.08 3.75 (44)% 3.56Underground mined 9.40 8.61 9 % 9.09 9.39 (3)% 8.88Processed 3.65 3.33 10 % 3.80 4.32 (12)% 4.20
Ore tonnes processed (000s) 3,156 3,188 (1)% 10,467 8,075 30 % 8,041Oxide mill 705 663 6 % 1,368 n/a n/a n/aRoaster 991 980 1 % 3,627 3,341 9 % 3,783Autoclave 892 810 10 % 4,169 4,734 n/a 4,258Heap leach 568 735 (23)% 1,303 n/a n/a n/a
Recovery rate 75% 76% (1)% 75% 74% 1 % 77%Roaster 86% 87% (1)% 86% 89% (2)% 88%Autoclave 58% 63% (9)% 59% 53% 12 % 62%
Gold produced (000s oz) 276 278 (1)% 968 835 16 % 780Oxide mill 11 14 (21)% 25 n/a n/a n/aRoaster 205 213 (4)% 694 606 15 % 531Autoclave 49 38 29 % 225 229 (2)% 248Heap leach 11 13 (15)% 24 n/a n/a n/a
Gold sold (000s oz) 275 272 1 % 967 842 15 % 868Revenue ($ millions) 408 401 2 % 1,355 1,066 27 % 1,091Cost of sales ($ millions) 268 274 (2)% 971 886 10 % 889Income ($ millions) 133 121 10 % 370 166 123 % 186EBITDA ($ millions)b 191 183 5 % 609 428 42 % 446EBITDA marginc 47% 46% 3 % 45% 40% 12 % 41%Capital expenditures ($ millions)d,e 51 56 (9)% 211 186 13 % 263 Minesite sustainingd 51 56 (9)% 211 186 13 % 263 Projectd 0 0 0 % 0 0 0 % 0Cost of sales ($/oz) 975 1,007 (3)% 1,004 1,054 (5)% 1,024Total cash costs ($/oz)b 766 775 (1)% 746 740 1 % 721All-in sustaining costs ($/oz)b 965 1,014 (5)% 984 983 0 % 1,045All-in costs ($/oz)b 965 1,014 (5)% 984 983 0 % 1,045
a. On July 1, 2019, Barrick's Goldstrike operations and Newmont's Carlin operations were contributed to Nevada Gold Mines and are now collectively referred to as Carlin. As a result, the amounts presented represent Goldstrike on a 100% basis (including our 60% share of South Arturo) up until June 30, 2019, and the combined results of Carlin and Goldstrike (including our 60% share of South Arturo) on a 61.5% basis thereafter.
b. These are non-GAAP financial performance measures with no standardized meaning under IFRS and therefore may not be comparable to similar measures presented by other issuers. For further information and a detailed reconciliation of each non-GAAP measure used in this section of the MD&A to the most directly comparable IFRS measure, please see pages 63 to 85 of this MD&A.
c. Represents EBITDA divided by revenue.d. Presented on a cash basis as a result of adopting IFRS 16 Leases starting in the first quarter of 2019. Capital expenditures for 2018 and 2017 are presented on
an accrued basis. Please refer to page 2 of this MD&A for more details. e. Amounts presented exclude capitalized interest.
On July 1, 2019, Barrick's Goldstrike operations and Newmont's Carlin operations were contributed to Nevada Gold Mines and are now collectively referred to as Carlin. As a result, the amounts presented represent Goldstrike on a 100% basis (including our 60% share of South Arturo) up until June 30, 2019, and the combined results of Carlin and Goldstrike (including our 60% share of South Arturo) on a 61.5% basis thereafter. As a result of this transaction, there is now a higher proportion of open pit ore mined and, consequently, the average grade processed is lower, which
also aligns with the inclusion of a heap leach facility contributed by Newmont.
Safety and EnvironmentThree LTIs were recorded during the quarter (at Goldstrike surface and Carlin) with an LTIFR of 1.27 per million hours worked versus 2.05 the previous quarter. Goldstrike underground reported zero LTIs during the fourth quarter. No Class 1 environmental incidents occurred during the quarter.

BARRICK YEAR-END 2019 26 MANAGEMENT’S DISCUSSION AND ANALYSIS
Financial Results Q4 2019 compared to Q3 2019Carlin's income for the fourth quarter of 2019 increased by 10% primarily due to lower cost of sales per ounce5 and higher sales volumes resulting from higher grade ore mined and processed.
Gold production in the fourth quarter of 2019 was 1% lower compared to the prior quarter, mainly due to lower production from the roasters and oxide mill offset by higher autoclave production. The higher autoclave production is a result of higher throughput from processing Carlin stockpiles from Pete open pit, a synergy unlocked by the creation of Nevada Gold Mines. Cost of sales per ounce5 and total cash costs per ounce4 in the fourth quarter of 2019 were 3% and 1% lower, respectively, than the prior quarter mainly due to a higher proportion of lower cost underground production in the feed mix. In the fourth quarter of 2019, all-in sustaining costs per ounce4 decreased by 5% compared to the prior quarter primarily due to lower minesite sustaining capital expenditures.
Capital expenditures in the fourth quarter of 2019 were 9% lower than the prior quarter due to lower underground development and equipment purchases, lower maintenance component replacements for the open pit and the completion of the autoclave brick re-line in the third quarter. Capital drilling also decreased due to the completion of drilling programs for the winter season.
2019 compared to 2018Carlin's income for 2019 reflects our 61.5% interest in Nevada Gold Mines and is inclusive of income from Newmont’s former Carlin operations and the Goldstrike operations from July 1, 2019. Income for Carlin for the first six months of 2019 and the twelve months of 2018 represents Barrick’s 100% interest in the Goldstrike operations (including the 60% interest in South Arturo) prior to the formation of Nevada Gold Mines. This was the primary driver of the 123% increase in Carlin’s income compared to 2018.
Income and EBITDA4,a
a The results represent Goldstrike on a 100% basis (including our 60% share of South Arturo) from January 1, 2017 to June 30, 2019 and on the combined results of Carlin and Goldstrike (including our 60% share of South Arturo) on a 61.5% basis from July 1, 2019 onwards.
Gold production for 2019 was 16% higher compared to the prior year, primarily due to the inclusion of Newmont’s former Carlin operations from July 1, 2019. Production in the first six months of 2019 was also higher due to scheduled roaster maintenance at Goldstrike in the first six months of 2018. This was partially offset by the reduction in Barrick's interest in Goldstrike (including the 60% interest in South Arturo) from 100% to 61.5% from July 1, 2019.
Productiona
(000s ounces)
a The results represent Goldstrike (including our 60% share of South Arturo) on a 100% basis from January 1, 2018 to June 30, 2019 and the combined results of Carlin and Goldstrike (including our 60% share of South Arturo) on a 61.5% basis from July 1, 2019 onwards.
Cost of sales per ounce5 was 5% lower than the prior year due to lower depreciation expense on a per ounce basis. Total cash costs per ounce4 and all-in sustaining costs per ounce4
were in line with the prior year.
Cost of Sales5, Total Cash Costs4 and AISC4
($ per ounce)
Capital expenditures for 2019 increased by 13% from the same prior year period due to higher minesite sustaining capital expenditures. Higher minesite sustaining capital expenditures are attributed to the inclusion of Newmont's former Carlin operations, partially offset by the reduction in Barrick's interest in Goldstrike (including the 60% interest in South Arturo) from 100% to 61.5% from July 1, 2019.
2019 compared to Outlook Gold production for 2019 of 968 thousand ounces was within the guidance range of 960 to 1,020 thousand ounces. Cost of sales per ounce5 of $1,004 was lower than the guidance range of $1,020 to $1,080 per ounce. Total cash costs per ounce4 and all-in sustaining costs per ounce4 of $746 and $984, respectively, were within the guidance ranges of $740 to $790 per ounce, and $955 to $995 per ounce, respectively.

BARRICK YEAR-END 2019 27 MANAGEMENT’S DISCUSSION AND ANALYSIS
Cortez (61.5% basis)a, Nevada USA
Summary of Operating and Financial Data For the three months ended For the years ended 12/31/19 9/30/19 % Change 12/31/19 12/31/18 % Change 12/31/17Total tonnes mined (000s) 23,422 23,357 0 % 105,949 121,929 (13)% 134,503 Open pit ore 3,876 2,158 80 % 14,640 15,979 (8)% 15,955 Open pit waste 19,275 20,948 (8)% 90,029 104,573 (14)% 117,336 Underground 271 251 8 % 1,280 1,377 (7)% 1,212Average grade (grams/tonne) Open pit mined 0.45 0.42 7 % 0.67 2.73 (75)% 2.65 Underground mined 11.58 11.41 2 % 10.66 10.73 (1)% 13.28 Processed 1.29 1.54 (16)% 1.60 2.67 (40)% 3.10Ore tonnes processed (000s) 4,259 2,837 50 % 17,583 17,001 3 % 15,853 Oxide mill 638 654 (2)% 3,462 4,527 (24)% 4,562 Roaster 353 329 7 % 1,750 1,763 (1)% 1,119 Heap leach 3,268 1,854 76 % 12,371 10,711 15 % 10,172Recovery rate 75% 84% (10)% 86% 87% (1)% 92% Oxide Mill 69% 79% (13)% 78% 83% (6)% 91% Roaster 86% 86% 0 % 87% 91% (4)% 91%Gold produced (000s oz) 133 126 6 % 801 1,265 (37)% 1,447 Oxide mill 35 34 3 % 253 590 (57)% 956 Roaster 81 62 31 % 376 514 (27)% 312 Heap leach 17 30 (43)% 172 161 7 % 178Gold sold (000s oz) 132 126 5 % 798 1,255 (36)% 1,489Revenue ($ millions) 194 185 5 % 1,086 1,589 (32)% 1,870Cost of sales ($ millions) 124 105 19 % 608 828 (27)% 979Income ($ millions) 69 77 (10)% 459 726 (37)% 873EBITDA ($ millions)b 105 109 (4)% 656 1,112 (41)% 1,405EBITDA marginc 54% 59% (9)% 60% 70% (14)% 75%Capital expenditures ($ millions)d,e 43 53 (19)% 255 340 (25)% 294 Minesite sustainingd 40 22 80 % 90 65 38 % 96 Projectd 3 31 (89)% 165 275 (40)% 198Cost of sales ($/oz) 945 829 14 % 762 659 16 % 657Total cash costs ($/oz)b 681 570 19 % 515 351 47 % 300All-in sustaining costs ($/oz)b 1,012 772 31 % 651 430 51 % 380All-in costs ($/oz)b 1,039 1,020 2 % 854 649 31 % 512
a. On July 1, 2019, Cortez was contributed to Nevada Gold Mines, a joint venture with Newmont. As a result, the amounts presented are on a 100% basis up until June 30, 2019, and on a 61.5% basis thereafter.
b. These are non-GAAP financial performance measures with no standardized meaning under IFRS and therefore may not be comparable to similar measures presented by other issuers. For further information and a detailed reconciliation of each non-GAAP measure used in this section of the MD&A to the most directly comparable IFRS measure, please see pages 63 to 85 of this MD&A.
c. Represents EBITDA divided by revenue.d. Presented on a cash basis as a result of adopting IFRS 16 Leases starting in the first quarter of 2019. Capital expenditures for 2018 and 2017 are presented on
an accrued basis. Please refer to page 2 of this MD&A for more details. e. Amounts presented exclude capitalized interest.
On July 1, 2019, Barrick's Cortez operations were contributed to Nevada Gold Mines, a joint venture with Newmont. As a result, the amounts presented represent Cortez on a 100% basis up until June 30, 2019 and on a 61.5% basis thereafter.
Safety and EnvironmentThere were no LTIs at Cortez during the quarter which resulted in an LTIFR of zero per million hours, which is consistent with the prior quarter. No Class 1 environmental incidents occurred during the quarter.
Financial ResultsQ4 2019 compared to Q3 2019Cortez’s income for the fourth quarter of 2019 was 10% lower than the prior quarter primarily due to higher cost of sales per ounce5, partially offset by higher sales volume resulting from higher gold production.
Gold production in the fourth quarter of 2019 was 6% higher compared to the prior quarter, primarily due to increased underground ore mined and then processed at the Carlin Roasters combined with higher recoveries, partially offset by lower heap leach production. The routing of Cortez underground ore through Mill 6 at Carlin was a synergy unlocked by the creation of Nevada Gold Mines.

BARRICK YEAR-END 2019 28 MANAGEMENT’S DISCUSSION AND ANALYSIS
Cost of sales per ounce5 and total cash costs per ounce4 in the fourth quarter of 2019 were 14% and 19% higher, respectively, versus the prior quarter primarily due to sales mix and ore routing. In the third quarter of 2019, the remaining higher grade, low-cost stockpiles from the Cortez Hills Open Pit (“CHOP”) were processed. In the fourth quarter of 2019, all-in sustaining costs per ounce4 increased by 31% compared to the prior quarter due to higher cash costs per ounce4 together with higher minesite sustaining capital expenditure. Capital expenditures in the fourth quarter of 2019 decreased by 19% compared to the prior quarter due to lower project capital expenditures, partially offset by higher minesite sustaining capital expenditures. The lower project capital expenditures relative to the third quarter of 2019 were due to decreases at the Cortez Hills Underground Rangefront project and the change in classification of the Crossroads open pit project from project to sustaining capital. At the Rangefront project, the contractor was removed from site in the fourth quarter due to sub-standard work and safety performance and we are in the process of finding a replacement. The Crossroads open pit project transitioned to production status late in the third quarter from pre-production in the second quarter. Accordingly, higher minesite sustaining capital expenditures relative to the third quarter of 2019 is attributed to this transition.
2019 compared to 2018 Cortez’s income for 2019 reflects our 61.5% interest following the formation of Nevada Gold Mines as described above. Income for Cortez for the same prior year period represents Barrick's 100% share of the Cortez operations. In addition to this impact, Cortez's income was impacted by a decrease in sales volume reflecting lower gold production and higher cost of sales per ounce5 partially offset by the higher realized gold price4.
Income and EBITDA4,a
a The results are on a 100% basis from January 1, 2017 to June 30, 2019 and on a 61.5% basis from July 1, 2019 onwards.
Gold production for 2019 was 37% lower, primarily due to the reduction in Barrick's interest in Cortez from July 1, 2019 combined with lower grades mined and processed from CHOP as mining was completed in the second quarter of 2019. This was partially offset by higher leach production, and a reduction of gold in circuit. Leach production has increased as mining and placement from Crossroads ramped up in the current year and additional tonnes were placed under solution. The lower gold in circuit balances were also related to the completion of mining at CHOP as the high-grade CHOP ore in circuit was drawn down by the end of the second quarter of 2019.
Productiona
(000s ounces)
a The results are on a 100% basis from January 1, 2017 to June 30, 2019 and on a 61.5% basis from July 1, 2019 onwards.
Cost of sales per ounce5 for 2019 increased by 16%, due to higher total cash costs per ounce4 offset slightly by lower depreciation expense as mined ounce production has dropped significantly with the transition away from mining predominantly ore in the CHOP pit to waste stripping at Crossroads. Total cash costs per ounce4 was 47% higher than the prior year due to lower grades as mining from CHOP was completed in the second quarter of 2019 combined with increased royalty costs and higher tonnes hauled. Royalties have increased as production shifts from CHOP to Crossroads, which carries a higher royalty rate. For 2019, all-in sustaining costs per ounce4 increased by 51% compared to 2018, due to higher total cash costs per ounce4 and increased sustaining capital expenditures.
Cost of Sales5, Total Cash Costs4 and AISC4
($ per ounce)
Capital expenditures for 2019 were 25% lower than the prior year due to the reduction in Barrick's interest in Cortez from 100% to 61.5% from July 1, 2019. In addition to this, the lower project capital expenditures were due to decreasing Crossroads dewatering activities and Rangefront project expenditures. Sustaining capital increased over the prior year due to Area 30 leach pad expansion work.
2019 compared to OutlookGold production for 2019 of 801 thousand ounces was at the high end of the guidance range of 760 to 810 thousand ounces. Cost of sales per ounce5 for 2019 was $762, which was lower than the guidance range of $810 to $850 per ounce. Total cash costs per ounce4 and all-in sustaining costs per ounce4 of $515 and $651, respectively, also came in better than guidance, with ranges of $530 to $580 per ounce and $670 to $710 per ounce, respectively.

BARRICK YEAR-END 2019 29 MANAGEMENT’S DISCUSSION AND ANALYSIS
Turquoise Ridge (61.5%)a, Nevada USA
Summary of Operating and Financial Data For the three months ended For the years ended
12/31/19 9/30/19 % Change 12/31/19 12/31/18 % Change 12/31/17Total tonnes mined (000s) 3,819 4,811 (21)% 9,001 670 1,243 % 643
Open pit ore 608 732 (17)% 1,340 n/a n/a n/aOpen pit waste 2,995 3,892 (23)% 6,887 n/a n/a n/aUnderground 216 187 16 % 774 670 16 % 643
Average grade (grams/tonne)Open pit mined 1.80 1.01 78 % 1.37 n/a n/a n/aUnderground mined 14.09 13.28 6 % 14.44 15.00 (4)% 15.45Processed 4.28 3.78 13 % 5.62 14.79 (62)% 15.01
Ore tonnes processed (000s) 934 950 (2)% 2,201 604 264 % 472Oxide Mill 114 107 6 % 221 n/a n/a n/aAutoclave 660 506 30 % 1,483 604 146 % 472Heap leach 160 337 (53)% 497 n/a n/a n/a
Recovery Rate 86% 89% (3)% 89% 93% (4)% 92%Oxide Mill 87% 87% 0 % 87% n/a n/a n/aAutoclave 86% 89% (3)% 89% 93% (4)% 92%
Gold produced (000s oz) 111 82 35 % 335 268 25 % 211Oxide Mill 3 5 (40)% 8 n/a n/a n/aAutoclave 105 74 42 % 321 268 20 % 211Heap leach 3 3 (11)% 6 n/a n/a n/a
Gold sold (000s oz) 99 96 3 % 356 262 36 % 222Revenue ($ millions) 152 142 7 % 504 331 52 % 280Cost of sales ($ millions) 95 103 (8)% 300 206 46 % 159Income ($ millions) 56 38 47 % 201 126 59 % 119EBITDA ($ millions)b 90 81 12 % 293 154 90 % 147EBITDA marginc 59% 57% 4 % 58% 47% 25 % 53%Capital expenditures ($ millions)d 24 26 (7)% 85 62 37 % 36 Minesite sustainingd 18 18 1 % 50 20 149 % 32 Projectd 6 8 (25)% 35 42 (17)% 4Cost of sales ($/oz) 971 1,077 (10)% 846 783 8 % 715Total cash costs ($/oz)b 625 622 0 % 585 678 (14)% 589All-in sustaining costs ($/oz)b 800 840 (5)% 732 756 (3)% 733All-in costs ($/oz)b 863 927 (7)% 834 916 (9)% 753
a. Prior to July 1, 2019, Barrick owned 75% of Turquoise Ridge with our joint venture partner, Newmont, owning the remaining 25%. Turquoise Ridge was proportionately consolidated on the basis that the joint venture partners that have joint control have rights to the assets and obligations for the liabilities relating to the arrangement. The figures presented in this table are based on our 75% interest in Turquoise Ridge until June 30, 2019. On July 1, 2019, Barrick's 75% interest in Turquoise Ridge and Newmont's 100% interest in Twin Creeks and 25% interest in Turquoise Ridge were contributed to Nevada Gold Mines. Starting July 1, 2019, the results represent our 61.5% share of Turquoise Ridge and Twin Creeks, now collectively referred to as Turquoise Ridge.
b. These are non-GAAP financial performance measures with no standardized meaning under IFRS and therefore may not be comparable to similar measures presented by other issuers. For further information and a detailed reconciliation of each non-GAAP measure used in this section of the MD&A to the most directly comparable IFRS measure, please see pages 63 to 85 of this MD&A.
c. Represents EBITDA divided by revenue. d. Presented on a cash basis as a result of adopting IFRS 16 Leases starting in the first quarter of 2019. Capital expenditures for 2018 and 2017 are presented on
an accrued basis. Please refer to page 2 of this MD&A for more details.
Barrick owned 75% of Turquoise Ridge through to the end of the second quarter of 2019, with our joint venture partner, Newmont, owning the remaining 25%. The figures presented in this table are based on our 75% interest in Turquoise Ridge until June 30, 2019. On July 1, 2019, Barrick's 75% interest in Turquoise Ridge and Newmont's Twin Creeks and 25% interest in Turquoise Ridge were contributed to Nevada Gold Mines. Starting July 1, 2019, our results represent our 61.5% share of Turquoise Ridge and Twin Creeks, now referred to as Turquoise Ridge. As a result of this transaction, from July 1, 2019, Turquoise Ridge includes the Twin Creeks open pit operations resulting in considerably higher tonnes mined at
a lower average grade of ore processed. It also includes the Twin Creeks processing operations and heap leach facility contributed by Newmont.
Safety and EnvironmentThere were two LTIs during the quarter, which resulted in an LTIFR of 2.57 per million hours worked versus 1.41 the previous quarter. Site leadership teams continue to focus their field engagements to reinforce safe work requirements and reduce hand injury occurrences. No Class 1 environmental incidents occurred during the quarter.

BARRICK YEAR-END 2019 30 MANAGEMENT’S DISCUSSION AND ANALYSIS
Financial ResultsQ4 2019 compared to Q3 2019 Turquoise Ridge's income for the fourth quarter of 2019 increased by 47% mainly due to lower cost of sales per ounce5
in conjunction with higher sales volumes reflecting higher production.
Gold production in the fourth quarter of 2019 was 35% higher than the prior quarter, primarily due to increased autoclave throughput in addition to the processing of higher grade ore. The higher autoclave throughput is due to higher availability following a planned shutdown in the prior quarter.
Cost of sales per ounce5 in the fourth quarter of 2019 was 10% lower than the prior quarter. Inventory that was subject to a positive remeasurement to fair value upon the formation of Nevada Gold Mines on July 1, 2019 was largely sold and reflected in cost of sales for the third quarter of 2019.
Total cash costs per ounce4 was in line with the prior quarter. All-in sustaining costs per ounce4 decreased by 5% compared to the prior quarter primarily reflecting lower minesite sustaining capital expenditures on a per ounce sold basis.
Capital expenditures in the fourth quarter of 2019 decreased by 7% compared to the prior quarter primarily due to lower project spend on the Third Shaft project.
2019 compared to 2018 Turquoise Ridge’s income for 2019 reflects our 61.5% interest in Nevada Gold Mines and is inclusive of income from Newmont’s former Twin Creeks operations and the Turquoise Ridge operations from July 1, 2019. Income for Turquoise Ridge for the first six months of 2019 and the twelve months of 2018 represents Barrick’s 75% interest in the Turquoise Ridge operations prior to the formation of Nevada Gold Mines. Consequently, this was the primary driver of the 59% increase in Turquoise Ridge’s income compared to 2018.
Income and EBITDA4,a
a The results represent Turquoise Ridge on a 75% basis from January 1, 2017 to June 30, 2019 and the combined results of Turquoise Ridge and Twin Creeks on a 61.5% basis from July 1, 2019 onwards.
Gold production for 2019 was 25% higher compared to the prior year, primarily due to the inclusion of Newmont’s former Twin Creeks operations from July 1, 2019. Production was also higher in the first six months of 2019 relative to the first six months of 2018 due to higher ore tonnes mined at better grades. This was partially offset by the reduction in Barrick's
interest in the Turquoise Ridge operations from 75% to 61.5% from July 1, 2019.
Productiona
(000s ounces)
a The results represent Turquoise Ridge on a 75% basis from January 1, 2017 to June 30, 2019 and the combined results of Turquoise Ridge and Twin Creeks on a 61.5% basis from July 1, 2019 onwards.
Cost of sales per ounce5 in 2019 was 8% per ounce higher than the prior year mainly reflecting an increase in depreciation resulting from the restatement of assets to fair value on the formation of Nevada Gold Mines as explained above. Total cash costs per ounce4 was 14% lower than the prior year due to more high-grade underground ore being processed and the elimination of the Toll Milling Agreement as a result of the formation of Nevada Gold Mines. In 2019, all-in sustaining costs per ounce4 decreased by 3% compared to the prior year due to lower total cash costs per ounce4.
Cost of Sales5, Total Cash Costs4 and AISC4
($ per ounce)
In 2019, capital expenditures increased by 37% compared to the prior year. The increase was due to higher minesite sustaining capital as a result of combining Turquoise Ridge with Twin Creeks, offset by lower project capital spend for the Third Shaft project.
2019 compared to OutlookGold production in 2019 of 335 thousand ounces was within the guidance range of 330 to 370 thousand ounces. Cost of sales per ounce5 and total cash costs per ounce4 of $846 and $585, respectively, were also within the guidance ranges of $800 to $850 per ounce and $550 to $600 per ounce, respectively. All-in sustaining costs per ounce4 of $732 was slightly over the guidance range of $680 to $730 per ounce.

BARRICK YEAR-END 2019 31 MANAGEMENT’S DISCUSSION AND ANALYSIS
Other Nevada Gold Mines
Summary of Operating and Financial Data For the three months ended12/31/19 9/30/19
Goldproduced(000s oz)
Cost ofsales($/oz)
Total cash costs ($/oz)a
All-in sustaining
costs ($/oz)a
Capital Expend-ituresb
Goldproduced(000s oz)
Cost ofsales($/oz)
Total cash costs
($/oz)a
All-in sustaining
costs ($/oz)a
Capital Expend-ituresb
Phoenix (61.5%)c 31 2,025 902 1,034 5 25 2,186 1,010 1,622 9Long Canyon (61.5%)c 34 1,026 317 657 10 24 1,170 353 714 6
a. These are non-GAAP financial performance measures with no standardized meaning under IFRS and therefore may not be comparable to similar measures presented by other issuers. For further information and a detailed reconciliation of each non-GAAP measure used in this section of the MD&A to the most directly comparable IFRS measure, please see pages 63 to 85 of this MD&A.
b. Includes both minesite sustaining and project capital expenditures. c. These sites were acquired as a result of the formation of Nevada Gold Mines on July 1, 2019.
Phoenix (61.5%)Gold production in the fourth quarter of 2019 for Phoenix was 24% higher compared to the prior quarter, primarily due to a more optimized ore blend leading to better mill recoveries. Cost of sales per ounce5 in the fourth quarter of 2019 was 7% lower than the prior quarter due to an improvement in production and sales. Third quarter attributable sales were impacted by the timing of the first gold concentrate sale following the formation of Nevada Gold Mines. In the fourth quarter of 2019, all-in sustaining costs per ounce4 decreased by 36% compared to the prior quarter primarily due to the increase in ounces sold and higher copper by-product credits offset slightly by increased sustaining capital expenditures. Sustaining capital expenditures decreased in the fourth quarter of 2019 due to timing of the tailings damn construction.
Compared to our outlook, gold production of 56 thousand ounces in 2019 was within the guidance range of 50 to 70 thousand ounces. Cost of sales per ounce5 of $2,093 was better than the guidance range of $2,250 to $2,300 per ounce. Total cash costs per ounce4 of $947 was at the lower end of the guidance range of $940 to $990 per ounce, while all-in sustaining costs per ounce4of $1,282 was above the guidance range of $1,120 to $1,150 per ounce.
Long Canyon (61.5%)Gold production for Long Canyon in the fourth quarter of 2019was 42% higher compared to the third quarter of 2019, primarily due to additional cells placed under leach, leading to improved recoveries. Cost of sales per ounce5 in the fourthquarter of 2019 was 12% lower than the prior quarter, mainly due to higher ounces sold driven by higher production. All-in sustaining costs per ounce4 decreased by 8% compared to the prior quarter, primarily due to higher production and sales driving lower total cash costs per ounce4 offset slightly by increased sustaining capital expenditures. Sustaining capital expenditures increased in the fourth quarter due to an increase in capitalized waste mined from Cut 7 of the open pit. Permitting for the open pit and underground expansions at Long Canyon is underway, though currently only the open pit is included in the life of mine plan.
Gold production in 2019 of 58 thousand ounces was above the guidance range of 40 to 50 thousand ounces. Cost of sales per ounce5 of $1,088 was better than the guidance range of $1,100 to $1,150 per ounce. Total cash costs per ounce4
of $333 was within the guidance range of $300 to $350 per ounce, while all-in sustaining costs per ounce4 of $681 was significantly better than the guidance range of $920 to $950 per ounce.

BARRICK YEAR-END 2019 32 MANAGEMENT’S DISCUSSION AND ANALYSIS
Pueblo Viejo (60% basis)a, Dominican Republic
Summary of Operating and Financial Data For the three months ended For the years ended
12/31/19 9/30/19 % Change 12/31/19 12/31/18 % Change 12/31/17Open pit tonnes mined (000s) 5,729 5,817 (2)% 24,732 24,063 3 % 23,430
Open pit ore 3,083 1,767 74 % 8,085 9,418 (14)% 13,514Open pit waste 2,646 4,050 (35)% 16,647 14,645 14 % 9,916
Average grade (grams/tonne)Open pit waste 2.92 2.98 (2)% 2.76 2.78 (1)% 3.07Processed 4.20 4.05 4 % 3.91 4.04 (3)% 4.57
Autoclave ore tonnes processed (000s) 1,464 1,182 24 % 5,164 5,008 3 % 4,791Recovery Rate 89% 90% (1)% 89% 89% 0 % 92%Gold produced (000s oz) 179 139 29 % 590 581 2 % 650Gold sold (000s oz) 174 136 28 % 584 590 (1)% 637Revenue ($ millions) 240 213 13% 843 798 6 % 850Cost of sales ($ millions) 114 109 5% 435 443 (2)% 445Income ($ millions) 125 104 20% 402 342 18 % 395EBITDA ($ millions)b 159 133 20% 522 457 14 % 538EBITDA marginc 66% 62% 6 % 62% 57% 8 % 63%Capital expenditures ($ millions)d 14 16 (13%) 64 87 (26)% 69 Minesite sustainingd 14 16 (13%) 64 87 (26)% 69 Projectd 0 0 0% 0 0 0 % 0Cost of sales ($/oz) 660 807 (18%) 747 750 0 % 699Total cash costs ($/oz)b 422 504 (16%) 471 465 1 % 405All-in sustaining costs ($/oz)b 517 631 (18%) 592 623 (5)% 525All-in costs ($/oz)b 525 636 (17%) 600 623 (4)% 525a. Pueblo Viejo is accounted for as a subsidiary with a 40% non-controlling interest. The results in the table and the discussion that follows are based on our 60%
share only.b. These are non-GAAP financial performance measures with no standardized meaning under IFRS and therefore may not be comparable to similar measures
presented by other issuers. For further information and a detailed reconciliation of each non-GAAP measure used in this section of the MD&A to the most directly comparable IFRS measure, please see pages 63 to 85 of this MD&A.
c. Represents EBITDA divided by revenue.d. Presented on a cash basis as a result of adopting IFRS 16 Leases starting in the first quarter of 2019. Capital expenditures for 2018 and 2017 are presented on
an accrued basis. Please refer to page 2 of this MD&A for more details.
Safety and EnvironmentThere were no LTIs at Pueblo Viejo during the quarter which resulted in an LTIFR of zero per million hours worked, consistent with the previous quarter. No Class 1 environmental incidents were reported during the quarter.
Financial ResultsQ4 2019 compared to Q3 2019Pueblo Viejo’s income for the fourth quarter of 2019 was 20% higher than the third quarter of 2019 due to higher sales volume and lower cost of sales per ounce5.
Gold production for the fourth quarter of 2019 was 29% higher than the prior quarter mainly due to higher throughput following optimization work resulting in record oxidized sulfur tonnes as well as the completion of scheduled maintenance that occurred in the third quarter of 2019.
Cost of sales per ounce5 and total cash costs per ounce4 for the fourth quarter of 2019 were 18% and 16% lower, respectively, than the prior quarter primarily reflecting the impact of higher sales volume that was driven by the increase in grade and throughput. For the fourth quarter of 2019, all-in sustaining costs per ounce4 decreased by 18% mainly reflecting lower total cash costs per ounce4 and lower minesite sustaining capital expenditures.
Capital expenditures for the fourth quarter of 2019 decreased by 13% compared to the prior quarter, primarily due to lower expenditures at the Llagal Tailings Storage Facility and the completion of the replacement of oxygen plant motors in the third quarter of 2019.
2019 compared to 2018Pueblo Viejo’s income for 2019 was 18% higher than the prior year due to higher realized gold prices4, while sales volume and cost of sales per ounce5 remained relatively consistent.
Income and EBITDA4
Gold production for 2019 was 2% higher than the prior year mainly due to higher tonnes processed, partially offset by lower grade.

BARRICK YEAR-END 2019 33 MANAGEMENT’S DISCUSSION AND ANALYSIS
Production(000s ounces)
Cost of sales per ounce5 and total cash costs per ounce4 for 2019 were in line and increased by 1%, respectively, compared to the prior year primarily reflecting the impact of slightly lower sales volume. For 2019, all-in sustaining costs per ounce4 decreased by 5% mainly reflecting lower minesite sustaining capital expenditures, partially offset by slightly higher total cash costs per ounce4.
Cost of Sales5, Total Cash Costs4 and AISC4
($ per ounce)
Capital expenditures for 2019 decreased by 26% compared to the prior year, primarily due to lower capitalized stripping from the Monte Negro and Cumba pits compared to a higher proportion of tonnes mined in the prior year from the Moore pit in accordance with the mine plan. This was combined with a decrease in tailings storage facility construction activities during the year.
2019 compared to OutlookGold production in 2019 of 590 thousand ounces was at the high end of the guidance range of 550 to 600 thousand ounces. Cost of sales per ounce5 of $747 was better than the guidance range of $780 to $830 per ounce. Total cash costs per ounce4 of $471 was at the low end of the guidance range of $465 to $510 per ounce. All-in sustaining costs per ounce4
of $592 was better than the guidance range of $610 to $650 per ounce.

BARRICK YEAR-END 2019 34 MANAGEMENT’S DISCUSSION AND ANALYSIS
Loulo-Gounkoto (80% basis)a, Mali
Summary of Operating and Financial Data For the three months ended For the years ended 12/31/19 9/30/19 % Change 12/31/19 12/31/18b % Change 12/31/17b
Total tonnes mined (000s) 7,250 8,115 (11)% 32,192 30,926 4 % 27,972 Open pit ore 1,080 286 278 % 2,726 3,484 (22)% 1,875 Open pit waste 5,566 7,244 (23)% 27,183 25,278 8 % 23,925 Underground 604 585 3 % 2,283 2,164 5 % 2,172Average grade (grams/tonne) Open pit mined 5.69 4.06 40 % 4.83 3.10 56 % 4.10 Underground mined 5.14 5.09 1 % 4.67 5.10 (8)% 6.20 Processed 5.64 5.14 10 % 4.90 4.31 14 % 4.98Ore tonnes processed (000s) 886 1,013 (13)% 3,945 4,123 (4)% 3,934Recovery rate 89% 92% (3)% 92% 92% 0 % 93%Gold produced (000s oz) 144 153 (6)% 572 528 8 % 584Gold sold (000s oz) 144 155 (7)% 575 534 8 % 579Revenue ($ millions) 214 230 (7)% 806Cost of sales ($ millions) 149 159 (7)% 601Income ($ millions) 65 64 1 % 190EBITDA ($ millions)c 123 125 (1)% 426EBITDA margind 58% 54% 6 % 53%Capital expenditures ($ millions) 38 49 (22)% 136 Minesite sustaining 37 49 (24)% 133 Project 1 0 100 % 3Cost of sales ($/oz) 1,037 1,018 2 % 1,044Total cash costs ($/oz)c 631 630 0 % 634All-in sustaining costs ($/oz)c 917 966 (5)% 886All-in costs ($/oz)c 922 971 (5)% 891
a. Barrick owns 80% of Société des Mines de Loulo SA and Société des Mines de Gounkoto with the Republic of Mali owning 20%. Loulo-Gounkoto is accounted for as a subsidiary with a 20% non-controlling interest on the basis that Barrick controls the asset. The results in the table and the discussion that follows are based on our 80% share inclusive of the impact of the purchase price allocation resulting from the Merger.
b. These results did not form a part of the Barrick consolidated results as this site was acquired as a result of the Merger. As a result, operational statistics are presented for reference purposes only.
c. These are non-GAAP financial performance measures with no standardized meaning under IFRS and therefore may not be comparable to similar measures presented by other issuers. For further information and a detailed reconciliation of each non-GAAP measure used in this section of the MD&A to the most directly comparable IFRS measure, please see pages 63 to 85 of this MD&A.
d. Represents EBITDA divided by revenue.
Safety and EnvironmentThere were no LTIs during the fourth quarter at Loulo-Gounkoto, which was in line with the previous quarter. No Class 1 environmental incidents were recorded.
Financial ResultsQ4 2019 compared to Q3 2019Loulo-Gounkoto’s income for the fourth quarter of 2019 was in line with the prior quarter.
Gold production for the fourth quarter of 2019 was 6% lower than the prior quarter mainly due to lower plant throughput due to a girth gear failure, partially offset by higher feed grade from both Yalea and the Gounkoto South Pit. The girth gear was repaired in December 2019.
Cost of sales per ounce5 for the fourth quarter of 2019 was 2% higher than the prior quarter primarily due to higher depreciation per ounce. Total cash costs per ounce4 was in line with the prior quarter as the impact of lower throughput was largely offset by the impact of the higher grade processed. For the fourth quarter of 2019, all-in sustaining costs per ounce4 decreased by 5% compared to the prior quarter
reflecting lower sustaining capital expenditures from reduced capitalized stripping.
Capital expenditures for the fourth quarter of 2019 decreased by 22% compared to the prior quarter, primarily due to lower capitalized stripping costs.
2019 Loulo-Gounkoto’s income for 2019 was $190 million.
Gold production in 2019 was 8% higher compared to the same prior year period, primarily due to higher feed grade from Yalea and the Gounkoto South Pit.
Production(000s ounces)
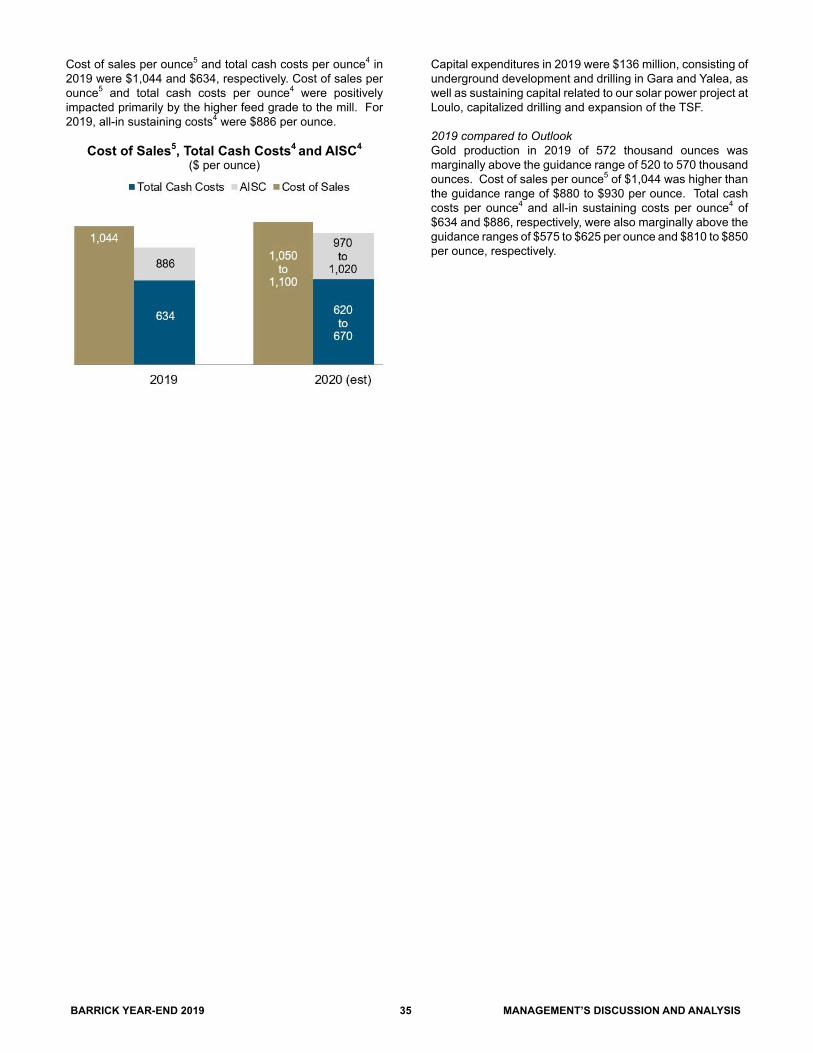
BARRICK YEAR-END 2019 35 MANAGEMENT’S DISCUSSION AND ANALYSIS
Cost of sales per ounce5 and total cash costs per ounce4 in 2019 were $1,044 and $634, respectively. Cost of sales per ounce5 and total cash costs per ounce4 were positively impacted primarily by the higher feed grade to the mill. For 2019, all-in sustaining costs4 were $886 per ounce.
Cost of Sales5, Total Cash Costs4 and AISC4
($ per ounce)
Capital expenditures in 2019 were $136 million, consisting of underground development and drilling in Gara and Yalea, as well as sustaining capital related to our solar power project at Loulo, capitalized drilling and expansion of the TSF.
2019 compared to OutlookGold production in 2019 of 572 thousand ounces was marginally above the guidance range of 520 to 570 thousand ounces. Cost of sales per ounce5 of $1,044 was higher than the guidance range of $880 to $930 per ounce. Total cash costs per ounce4 and all-in sustaining costs per ounce4 of $634 and $886, respectively, were also marginally above the guidance ranges of $575 to $625 per ounce and $810 to $850 per ounce, respectively.

BARRICK YEAR-END 2019 36 MANAGEMENT’S DISCUSSION AND ANALYSIS
Kibali (45% basis)a, Democratic Republic of Congo
Summary of Operating and Financial Data For the three months ended For the years ended 12/31/19 9/30/19 % Change 12/31/19 12/31/18b % Change 12/31/17b
Total tonnes mined (000s) 3,096 3,077 1 % 12,273 14,790 (17)% 16,435 Open pit ore 346 269 29 % 1,693 2,455 (31)% 2,239 Open pit waste 2,290 2,330 (2)% 8,824 10,709 (18)% 13,275 Underground 460 478 (4)% 1,756 1,626 8 % 921Average grade (grams/tonne) Open pit mined 2.21 2.26 (2)% 2.32 2.43 (4)% 2.39 Underground mined 4.68 5.17 (9)% 5.12 5.06 1 % 5.51 Processed 3.67 3.74 (2)% 3.80 3.45 10 % 2.92Ore tonnes processed (000s) 839 852 (2)% 3,381 3,698 (9)% 3,429Recovery rate 88% 88% 0 % 89% 89% 0 % 83%Gold produced (000s oz) 87 91 (4)% 366 363 1 % 268Gold sold (000s oz) 89 89 0 % 363 370 (2)% 272Revenue ($ millions) 130 133 (2)% 505Cost of sales ($ millions) 106 107 (1)% 403Income ($ millions) 30 25 20 % 108EBITDA ($ millions)c 82 82 0 % 304EBITDA margind 63% 62% 2 % 60%Capital expenditures ($ millions) 9 14 (36)% 43 Minesite sustaining 9 13 (31)% 41 Project 0 1 (100)% 2Cost of sales ($/oz) 1,205 1,187 2 % 1,111Total cash costs ($/oz)c 608 554 10 % 568All-in sustaining costs ($/oz)c 740 703 5 % 693All-in costs ($/oz)c 746 717 4 % 701
a. Barrick owns 45% of Kibali Goldmines SA (Kibali) with the Democratic Republic of Congo ("DRC") and our joint venture partner, AngloGold Ashanti, owning 10% and 45%, respectively. Kibali is accounted for as an equity method investment on the basis that the joint venture partners that have joint control have rights to the net assets of the joint venture. The figures presented in this table and the discussion that follows are based on our 45% effective interest in Kibali inclusive of the impact of the purchase price allocation resulting from the Merger.
b. These results did not form a part of the Barrick consolidated results as this site was acquired as a result of the Merger. As a result, operational statistics are presented for reference purposes only.
c. These are non-GAAP financial performance measures with no standardized meaning under IFRS and therefore may not be comparable to similar measures presented by other issuers. For further information and a detailed reconciliation of each non-GAAP measure used in this section of the MD&A to the most directly comparable IFRS measure, please see pages 63 to 85 of this MD&A.
d. Represents EBITDA divided by revenue.
Safety and EnvironmentKibali did not sustain any LTIs during the fourth quarter, in line with the safety performance of the previous quarter. No Class 1 environmental incidents were recorded.
Financial ResultsQ4 2019 compared to Q3 2019Kibali’s income for the fourth quarter of 2019 was 20% higher than the third quarter of 2019.
Gold production for the fourth quarter of 2019 was 4% lower than the prior quarter as grade fed to the plant decreased in comparison with the prior period, in line with plan, as the restoration of stockpiles following the second quarter winder failure continued. Additionally, plant throughput decreased marginally, in line with plan.
Cost of sales per ounce5 and total cash costs per ounce4 for the fourth quarter of 2019 were 2% and 10% higher, respectively, than the prior quarter primarily due to the decrease in grade fed to the plant, increased grade control drilling costs and an increase in stripping costs that were
expensed. This was offset by lower quarter-on-quarter general and administrative expenditure. For the fourth quarter of 2019, all-in sustaining costs per ounce4 increased by 5% compared to the prior quarter, reflecting higher total cash costs per ounce4 offset by lowerminesite sustaining capital expenditures as detailed below, when compared with the previous period.
Capital expenditures for the fourth quarter of 2019 decreased by 36% due to lower capitalized stripping and underground development, although these were in line with plan.
2019Kibali’s income for 2019 was $108 million.
Gold production in 2019 was 1% higher compared to the same prior year period, primarily due to increased feed grade in the current period as a result of blending more higher grade underground material in line with the mine plan, partially offset by decreased throughput.

BARRICK YEAR-END 2019 37 MANAGEMENT’S DISCUSSION AND ANALYSIS
Production(000s ounces)
Cost of sales per ounce5 and total cash costs per ounce4 in 2019 were $1,111 and $568 per ounce, respectively. Cost of sales includes the depreciation charge relating to the purchase price allocation fair value increment. Although total cash costs per ounce4 were impacted by higher operating expenditures in the first quarter of the year, cost performance has improved over the remainder of the year. For 2019, all-in sustaining costs per ounce4 were $693 per ounce.
Cost of Sales5, Total Cash Costs4 and AISC4
($ per ounce)
Capital expenditures in 2019 were $43 million, consisting of underground mining development, underground hauling equipment, capitalized stripping, capitalized drilling and rebuilds of mobile equipment.
2019 compared to OutlookGold production in 2019 of 366 thousand ounces was higher than the guidance range of 330 to 350 thousand ounces. Cost of sales per ounce5 of $1,111 was also better than the guidance range of $1,150 to $1,200 per ounce. Total cash costs per ounce4 and all-in sustaining costs per ounce4 of $568 and $693, respectively, were in the lower half of the guidance ranges of $555 to $605 per ounce and $670 to $730 per ounce, respectively.

BARRICK YEAR-END 2019 38 MANAGEMENT’S DISCUSSION AND ANALYSIS
Veladero (50% basis)a,b, Argentina
Summary of Operating and Financial Data For the three months ended For the years ended
12/31/19 9/30/19 % Change 12/31/19 12/31/18 % Change 12/31/17Open pit tonnes mined (000s) 10,277 9,449 9 % 36,758 35,646 3 % 48,376 Open pit ore 4,828 3,909 24 % 16,048 15,718 2 % 21,558 Open pit waste 5,449 5,540 (2)% 20,710 19,928 4 % 26,818Average grade (grams/tonne)
Open pit mined 0.80 0.68 18 % 0.71 0.78 (9)% 1.00 Processed 0.88 0.74 19 % 0.79 0.85 (8)% 1.02
Heap leach ore tonnes processed (000s) 3,880 3,463 12 % 13,587 13,547 0 % 21,190Gold produced (000s oz) 71 58 22 % 274 278 (1)% 432Gold sold (000s oz) 70 59 19 % 271 280 (3)% 458Revenue ($ millions) 106 89 19 % 386 366 5 % 591Cost of sales ($ millions) 82 72 14 % 323 310 4 % 410Income ($ millions) 21 14 50 % 57 53 8 % 173EBITDA ($ millions)c 50 39 28 % 172 174 (1)% 292EBITDA margind 47% 44% 8 % 45% 48% (6)% 49%Capital expenditures ($ millions)e 28 19 47 % 106 143 (26)% 173 Minesite sustaininge 28 19 47 % 91 143 (37)% 173 Projecte 0 0 0 % 15 0 0 % 0Cost of sales ($/oz) 1,138 1,243 (8)% 1,188 1,112 7 % 897Total cash costs ($/oz)c 710 773 (8)% 734 629 17 % 598All-in sustaining costs ($/oz)c 1,142 1,142 0 % 1,105 1,154 (4)% 987All-in costs ($/oz)c 1,142 1,142 0 % 1,162 1,154 1 % 987
a. Barrick owns 50% of Veladero with our joint venture partner, Shandong Gold, owning the remaining 50%. Veladero is proportionately consolidated on the basis that the joint venture partners that have joint control have rights to the assets and obligations for the liabilities relating to the arrangement. The figures presented in this table and the discussion that follows are based on our 50% interest in Veladero inclusive of the impact of remeasurement of our interest in Veladero following the disposal of a 50% interest on June 30, 2017.
b. On June 30, 2017, we sold 50% of Veladero; therefore, these represent results on a 100% basis from January 1 to June 30, 2017 and on a 50% basis from July 1, 2017 onwards.
c. These are non-GAAP financial performance measures with no standardized meaning under IFRS and therefore may not be comparable to similar measures presented by other issuers. For further information and a detailed reconciliation of each non-GAAP measure used in this section of the MD&A to the most directly comparable IFRS measure, please see pages 63 to 85 of this MD&A.
d. Represents EBITDA divided by revenue.e. Presented on a cash basis as a result of adopting IFRS 16 Leases starting in the first quarter of 2019. Capital expenditures for 2018 and 2017 are presented on
an accrued basis. Please refer to page 2 of this MD&A for more details.
Safety and EnvironmentAt Veladero, two LTIs were recorded during the quarter resulting in a LTIFR of 1.24 per million hours worked versus 0.52 the previous quarter. No Class 1 environmental incidents occurred during the quarter.
Minera Andina del Sol SRL, the joint venture company that operates the Veladero mine, is the subject of various regulatory proceedings related to operational incidents occurring in March 2017, September 2016 and September 2015. Refer to note 36 to the Financial Statements for more information regarding these and related matters.
Financial ResultsQ4 2019 compared to Q3 2019Veladero’s income for the fourth quarter of 2019 was 50% higher than the third quarter of 2019 primarily due to higher sales volume and lower cost of sales per ounce5.
Gold production in the fourth quarter of 2019 was 22% higher than the prior quarter, primarily due to higher ore grades and higher tonnages processed, partially offset by lower leach pad recoveries.
Cost of sales per ounce5 and total cash costs per ounce4 in the fourth quarter of 2019 both decreased by 8%, mainly due to the impact of higher sales volumes, partially offset by higher direct mining costs, export duties and royalties from increased realized gold prices. In the fourth quarter of 2019, all-in sustaining costs per ounce4 remained in line with the prior quarter as lower total cash costs per ounce4 were offset by higher minesite sustaining capital expenditures.
Capital expenditures in the fourth quarter of 2019 increased by 47% compared to the prior quarter mainly relating to construction activities for leach pad expansion phases 4B, 5B and 6, combined with higher capitalized stripping.
2019 compared to 2018Veladero’s income for 2019 was 8% higher than the prior year primarily due to higher realized gold prices4, partially offset by lower sales volumes and higher cost of sales per ounce5.

BARRICK YEAR-END 2019 39 MANAGEMENT’S DISCUSSION AND ANALYSIS
Income and EBITDA4, a
a The results are on an 100% basis from January 1, 2017 to June 30, 2017 and on an 50% basis from July 1, 2017 onwards.
In 2019, gold production exceeded guidance with better than expected results from leach pad recovery initiatives and improved solution management. As a result, gold production was relatively consistent with the prior year as lower ore grades processed were partially offset by higher leach pad recoveries.
Productiona
(000s ounces)
a The results are on an 100% basis from January 1, 2017 to June 30, 2017 and on an 50% basis from July 1, 2017 onwards.
In 2019, cost of sales per ounce5 and total cash costs per ounce4 increased by 7% and 17%, respectively, compared to the prior year mainly due to higher export duties and royalties resulting from increased realized gold prices4 and the export tax announced in September 2018 by the Argentine government. This was partially offset by the devaluation of the Argentine peso and business improvement initiatives. Cost of sales per ounce5 was further impacted by lower depreciation expense.
All-in sustaining costs per ounce4 in 2019 decreased by 4% compared to the prior year primarily due to a decrease in minesite sustaining capital expenditures on a per ounce basis, partially offset by an increase in total cash costs per ounce4.
Cost of Sales5, Total Cash Costs4 and AISC4
($ per ounce)
In 2019, capital expenditures decreased by 26% compared to the prior year mainly due to the funding of a power transmission line in Argentina as a result of an agreement made with the Provincial Power Regulatory Body of San Juan (“EPRE”) occurring in the prior year, lower capitalized stripping and lower purchases of components and mine equipment, partially offset by an increase in construction activities for leach pad expansion phases 4B, 5B, and 6.
2019 compared to OutlookGold production in 2019 of 274 thousand ounces exceeded the guidance range of 230 to 250 thousand ounces. All cost metrics came in below guidance. Cost of sales per ounce5 was $1,188 compared to the guidance range of $1,250 to $1,350 per ounce. Total cash costs per ounce4 was $734 compared to $770 to $820 per ounce, and all-in sustaining costs per ounce4 was $1,105, compared to $1,150 to $1,250 per ounce.
Regulatory mattersOn December 14, 2019, the President of Argentina abolished the exchange rate limit applied to the calculation of export duties (previously ARS 4 for each $1). On December 23, 2019, the Argentine Congress further enacted an emergency law setting a maximum rate for mining export duties at 8%; however, this emergency law has not yet entered into force. Barrick is seeking the immediate implementation of the reduced 8% cap for customs purposes; however, a decision on this has not yet been made.

BARRICK YEAR-END 2019 40 MANAGEMENT’S DISCUSSION AND ANALYSIS
Porgera (47.5% basis)a, Papua New Guinea
Summary of Operating and Financial Data For the three months ended For the years ended
12/31/19 9/30/19 % Change 12/31/19 12/31/18 % Change 12/31/17Total tonnes mined (000s) 2,880 3,657 (21)% 13,156 9,862 33 % 11,504
Open pit ore 509 495 3 % 1,825 568 221 % 767Open pit waste 2,124 2,914 (27)% 10,406 8,529 22 % 9,912Underground 247 248 0 % 925 765 21 % 825
Average grade (grams/tonne)Open pit mined 2.07 2.07 0 % 1.92 2.06 (7)% 1.87Underground mined 7.86 5.88 34 % 6.67 6.93 (4)% 6.57Processed 3.94 3.33 18 % 3.44 3.46 (1)% 3.03
Autoclave ore tonnes processed (000s) 705 705 0 % 2,640 2,138 23 % 2,798Recovery Rate 92% 90% 2 % 91% 86% 5 % 86%Gold produced (000s oz) 82 75 9 % 284 204 39 % 235Gold sold (000s oz) 82 75 9 % 285 213 34 % 253Revenue ($ millions) 123 111 11% 403 269 50 % 322Cost of sales ($ millions) 75 76 (1)% 284 212 34 % 238Income ($ millions) 44 35 26 % 113 56 102 % 83EBITDA ($ millions)b 56 46 22 % 155 98 58 % 121EBITDA marginc 46% 44% 4 % 38% 36% 6 % 38%Capital expenditures ($ millions)d 11 14 (21)% 45 62 (28)% 55
Minesite sustainingd 11 14 (21)% 45 62 (28)% 55Projectd 0 0 0 % 0 0 0 % 0
Cost of sales ($/oz) 909 1,024 (11)% 994 996 0 % 944Total cash costs ($/oz)b 757 868 (13)% 838 796 5 % 781All-in sustaining costs ($/oz)b 894 1,053 (15)% 1,003 1,083 (7)% 993All-in costs ($/oz)b 894 1,053 (15)% 1,003 1,083 (7)% 993
a. Barrick owns 47.5% of Porgera with our joint venture partners, Zijin Mining and Mineral Resources Enga, owning the remaining 47.5% and 5%, respectively. Porgera is proportionately consolidated on the basis that the joint venture partners that have joint control have rights to the assets and obligations for the liabilities relating to the arrangement. The figures presented in this table and the discussion that follows are based on our 47.5% interest in Porgera.
b. These are non-GAAP financial performance measures with no standardized meaning under IFRS and therefore may not be comparable to similar measures presented by other issuers. For further information and a detailed reconciliation of each non-GAAP measure used in this section of the MD&A to the most directly comparable IFRS measure, please see pages 63 to 85 of this MD&A.
c. Represents EBITDA divided by revenue.d. Presented on a cash basis as a result of adopting IFRS 16 Leases starting in the first quarter of 2019. Capital expenditures for 2018 and 2017 are presented on
an accrued basis. Please refer to page 2 of this MD&A for more details.
Safety and EnvironmentThere were 3 LTIs at Porgera during the quarter which resulted in an LTIFR of 1.04 per million hours worked versus 1.05 the previous quarter. No Class 1 environmental incidents were reported during the quarter.
Financial ResultsQ4 2019 compared to Q3 2019Porgera’s income for the fourth quarter of 2019 was 26% higher than the third quarter of 2019 primarily due to higher sales volume reflecting higher gold production and a decrease in cost of sales per ounce5.
Gold production in the fourth quarter of 2019 was 9% higher than the prior quarter, primarily due to higher underground ore grade mined and processed. Cost of sales per ounce5 and total cash costs per ounce4 in the fourth quarter of 2019 decreased by 11% and 13%, respectively. This was mainly due to the higher underground grade processed and the depletion of historic concentrate
stockpiles in the previous quarter that was included in inventory at higher unit costs.
In the fourth quarter of 2019, all-in sustaining costs per ounce4
decreased by 15% compared to the prior quarter due to the decrease in total cash costs per ounce4 and lower minesite sustaining capital expenditures.
Capital expenditures in the fourth quarter of 2019 decreased by 21% compared to the prior quarter due to lower capitalized stripping as the mining sequence changed from predominantly waste stripping to ore production, in line with the mine plan for the quarter.
2019 compared to 2018Porgera’s income for 2019 was 102% higher than the prior year, primarily due to an increase in sales volume and higher realized gold prices4. In 2018, operations at Porgera were impacted by an earthquake which disrupted power supply for an extended period. This impacted all of the performance and cost metrics for 2018.

BARRICK YEAR-END 2019 41 MANAGEMENT’S DISCUSSION AND ANALYSIS
Income and EBITDA4
In 2019, gold production exceeded the top end of the guidance range and was 39% higher compared to the prior year, reflecting a strong finish to the year given better mill availability in the second half of 2019 as well as the impact to operations from the earthquake in the prior year.
Production(000s ounces)
In 2019, cost of sales per ounce5 remained consistent with the prior year, while total cash costs per ounce4 increased by 5%. Higher total cash costs per ounce4 were due to increased energy costs related to power line interruptions during the first half of 2019, higher freight costs and increased maintenance activities following the deferral of this work in 2018 due to the earthquake. This was partially offset by the impact of higher sales volume.
All-in sustaining costs4 in 2019 decreased by 7% compared to the prior year due to lower minesite sustaining capital expenditures, partially offset by increased total cash costs per ounce4.
Cost of Sales5, Total Cash Costs4 and AISC4
($ per ounce)
In 2019, capital expenditures decreased by 28% compared to the prior year primarily due to lower capitalized stripping as the mining sequence changed from predominantly waste stripping to ore production, in line with the mine plan.
2019 compared to OutlookGold production in 2019 of 284 thousand ounces exceeded the guidance range of 240 to 260 thousand ounces. All cost metrics were within guidance. Cost of sales per ounce5 of $994 was in the lower end of the guidance range of $980 to $1,030 per ounce. Total cash costs per ounce4 was $838 compared to $800 to $850 per ounce, and all-in sustaining costs per ounce4 was $1,003, compared to $985 to $1,025 per ounce.
Regulatory MattersPorgera's current Special Mining Lease terminated on August 16, 2019. The company has been working constructively with the government of Papua New Guinea to negotiate a 20-year extension. On August 2, 2019, the National Court of Papua New Guinea ruled that the provisions of the country’s 1992 Mining Act applied to the Porgera gold mine, thus allowing it to continue operating while the application to extend its Special Mining Lease is being considered. The Company expects to reach an agreement with the government and does not expect interruptions to the operation while these discussions are ongoing.

BARRICK YEAR-END 2019 42 MANAGEMENT’S DISCUSSION AND ANALYSIS
North Maraa, Tanzania
Summary of Operating and Financial Data For the three months ended For the years ended
12/31/19 9/30/19 % Change 12/31/19 12/31/18 % Change 12/31/17Total tonnes mined (000s) 3,529 1,780 98 % 10,388 10,821 (4)% 10,469 Open pit ore 1,854 667 178 % 3,987 1,837 117 % 2,011 Open pit waste 1,288 970 33 % 5,532 8,218 (33)% 7,765 Underground 387 143 170 % 869 766 13 % 693Average grade (grams/tonne) Open pit mined 2.12 1.89 12 % 2.03 2.00 2 % 1.73 Underground mined 5.30 6.87 (23)% 6.82 7.79 (12)% 8.68
Processedb 4.78 5.58 (14)% 4.50 3.96 14 % 3.85Ore tonnes processed (000s) 714 172 316 % 1,829 1,819 1 % 1,815Recovery rate 94% 94% 0 % 94% 93% 1 % 92% Mining 94% 94% 0 % 94% 93% 1 % 92%Gold produced (000s oz) 103 29 253 % 251 215 17 % 207Gold sold (000s oz) 103 36 186 % 248 212 17 % 207Revenue ($ millions) 153 55 178% 350 270 30 % 261Cost of sales ($ millions) 105 33 216 % 236 169 40 % 141Income ($ millions) 52 20 163 % 112 94 19 % 112EBITDA ($ millions)c 87 31 184 % 187 134 40 % 148EBITDA margind 57% 56% 2 % 53% 49% 8 % 57%Capital expenditures ($ millions)e 16 9 73 % 42 52 (19)% 59 Minesite sustaininge 15 8 83 % 36 47 (23)% 52 Projecte 1 1 0 % 6 5 20 % 7Cost of sales ($/oz) 1,021 907 13 % 953 795 20 % 683Total cash costs ($/oz)c 675 603 12 % 646 603 7 % 509All-in sustaining costs ($/oz)c 830 850 (2)% 802 830 (3)% 773All-in costs ($/oz)c 840 886 (5)% 824 855 (4)% 804
a. Formerly part of Acacia Mining plc. On September 17, 2019, Barrick acquired all of the shares of Acacia it did not own. Refer to note 4 to the Financial Statements for more information. The results are on a 63.9% basis until September 30, 2019 and on a 100% basis from October 1, 2019 onwards.
b. Includes tailings retreatment.c. These are non-GAAP financial performance measures with no standardized meaning under IFRS and therefore may not be comparable to similar measures
presented by other issuers. For further information and a detailed reconciliation of each non-GAAP measure used in this section of the MD&A to the most directly comparable IFRS measure, please see pages 63 to 85 of this MD&A.
d. Represents EBITDA divided by revenue.e. Presented on a cash basis as a result of adopting IFRS 16 Leases starting in the first quarter of 2019. Capital expenditures for 2018 and 2017 are presented on
an accrued basis. Please refer to page 2 of this MD&A for more details.
On January 24, 2020, Barrick announced that the Company had ratified the creation of Twiga at a signing ceremony with the President of Tanzania, formalizing the establishment of a joint venture between Barrick and the Government of Tanzania (“GoT”) and resolution of all outstanding disputes between Barrick and the GoT. The GoT will receive a free carried shareholding of 16% in each of the former Acacia mines (Bulyanhulu, Buzwagi and North Mara), and will receive its half of the economic benefits from taxes, royalties, clearing fees and participation in all cash distributions made by the mines and Twiga, after the recoupment of capital investments. Twiga will provide management services to the mines. The GoT’s free-carried interest is expected to be made effective as of January 1, 2020.
Refer to note 36 to the Financial Statements for more information regarding this matter.
Financial ResultsQ4 2019 compared to Q3 2019North Mara’s income for the fourth quarter of 2019 was 163% higher than the third quarter of 2019, mainly due to the impact
of the acquisition of all of the shares that we did not own of Acacia on September 17, 2019. This resulted in our attributable share of income being reported at 100% compared to 63.9% in the prior quarter. This was combined with higher sales volume as the prior quarter was impacted by a prohibition notice issued by the Tanzanian National Environment Management Council (“NEMC”) on July 16, 2019 (the “Prohibition Notice”) which resulted in the closure of the tailings storage facility (“TSF”) and shutdown of the processing plant for approximately two months. This was partially offset by higher cost of sales in the fourth quarter of 2019.
In the fourth quarter of 2019, gold production was 253% higher than the prior quarter, primarily due to the Prohibition Notice that occurred in the prior quarter, as discussed above and further below. This was further impacted by the acquisition of all of the shares that we did not own of Acacia, which resulted in an increase in our attributable production from 63.9% to 100%.

BARRICK YEAR-END 2019 43 MANAGEMENT’S DISCUSSION AND ANALYSIS
Cost of sales per ounce5 and total cash costs per ounce4 in the fourth quarter of 2019 were 13% and 12% higher, respectively, than the prior quarter primarily due to higher sales-related costs driven by sales volumes and higher processing consumables costs, partly offset by lower general and administrative costs as the third quarter of 2019 included increased provisions for inventory obsolescence. All-in sustaining costs per ounce4 in the fourth quarter of 2019 were 2% lower than the prior quarter as a result of lower minesite sustaining capital expenditures on a per ounce sold basis, partially offset by higher total cash costs per ounce4.
Capital expenditures in the fourth quarter of 2019 were 73% higher than the third quarter of 2019, mainly due to the 36.1% increase in our attributable share of capital expenditures combined with higher minesite sustaining capital expenditures. Higher minesite sustaining capital expenditures are attributed to the deferral of capital projects due to the cash flow constraints experienced by Acacia as a result of the Prohibition Notice in the third quarter and the implementation of water management measures for the TSF.
2019 compared to 2018North Mara’s income for 2019 was 19% higher than the prior year primarily due to the impact of the acquisition of all of the shares that we did not own of Acacia on September 17, 2019, as income was included at 100% starting from October 1, 2019. This was combined with higher realized gold prices4, partially offset by lower sales volumes and higher cost of sales per ounce5.
Income and EBITDA4,a
a The results are on a 63.9% basis from January 1, 2017 to September 30, 2019 and on a 100% basis from October 1, 2019 onwards.
In 2019, gold production was 17% higher than the prior year primarily due to the 36.1% increase in our shareholding and attributable production. This was partly offset by lower production due to the Prohibition Notice which resulted in the closure of the North Mara TSF and shutdown of the processing plant for most of the third quarter of 2019.
Productiona
(000s ounces)
a The results are on a 63.9% basis from January 1, 2018 to September 30, 2019 and on a 100% basis from October 1, 2019 onwards. As the GoT’s 16% free-carried interest is expected to be made effective as of January 1, 2020, our 2020 outlook represents our 84% share.
Cost of sales per ounce5 and total cash costs per ounce4 in 2019 were 20% and 7% higher, respectively, than the prior year mainly due to higher stripping costs expensed in the current period and an increase in provisions for supplies obsolescence, partly offset by the build-up of ore inventory stockpiles. All-in sustaining costs per ounce4 were 3% lower than the prior year due to a decrease in minesite sustaining capital expenditures driven by lower capitalized stripping costs on the back of lower strip ratios, partially offset by higher total cash costs per ounce4.
Cost of Sales5, Total Cash Costs4 and AISC4
($ per ounce)
In 2019, capital expenditures decreased by 19% compared to the prior year mainly due to lower minesite sustaining capital expenditures. Lower minesite sustaining capital expenditures were attributed to reduced capitalized stripping costs driven by a lower strip ratio as mining entered the main ore zone of the Nyabirama open pit.
2019 compared to OutlookOverall guidance for 2019 was previously only provided in relation to Acacia and not at the mine site level.
North Mara Environmental IssuesDuring 2019, the GoT issued two environmental protection orders and directions to Acacia’s North Mara mine in relation to alleged breaches of environmental regulations relating to seepage from and the discharge of a hazardous substance from the North Mara TSF. In March 2019, the GoT directed the North Mara mine to resolve an incident that resulted in the spillage of water into the local environment. On July 16, 2019, the NEMC issued the Prohibition Notice to North Mara Gold Mine Limited (the Tanzanian operating company of the North Mara mine), which ordered the North Mara mine to suspend operations at its TSF on July 20, 2019. NEMC cited the North Mara mine’s failure to contain and prevent seepage from the TSF as grounds for its issuance of the Prohibition Notice.
On September 17, 2019, following the submission of a detailed action plan to remediate issues related to the TSF and the implementation of remedial measures to contain the seepage from the TSF, the Prohibition Notice was lifted and North Mara was permitted to resume operations at the TSF.
Refer to note 36 to the Financial Statements for more information regarding this matter.

BARRICK YEAR-END 2019 44 MANAGEMENT’S DISCUSSION AND ANALYSIS
Other Mines - Gold
Summary of Operating and Financial Data For the three months ended
12/31/19 9/30/19
Goldproduced(000s oz)
Cost of sales ($/oz)
Total cash costs ($/oz)a
All-in sustaining
costs ($/oz)a
Capital Expend-ituresb
Goldproduced(000s oz)
Cost ofsales($/oz)
Total cash costs
($/oz)a
All-in sustaining
costs ($/oz)a
Capital Expend-ituresb
Kalgoorlie (50%)c 36 1,127 940 1,172 6 58 1,037 856 1,170 15Tongon (89.7%) 61 1,476 803 867 3 62 1,396 793 869 4Hemlo 54 1,632 1,091 1,380 15 49 1,083 953 1,280 15Buzwagid 28 1,235 1,144 1,169 0 18 1,292 1,202 1,220 0Bulyanhulud 9 1,293 752 909 1 6 1,288 729 769 1Lagunas Nortee 33 1,661 1,327 1,422 0
a. These are non-GAAP financial performance measures with no standardized meaning under IFRS and therefore may not be comparable to similar measures presented by other issuers. For further information and a detailed reconciliation of each non-GAAP measure used in this section of the MD&A to the most directly comparable IFRS measure, please see pages 63 to 85 of this MD&A.
b. Includes both minesite sustaining and project capital expenditures.c. On November 28, 2019, we completed the sale of our 50% interest in Kalgoorlie in Western Australia to Saracen Mineral Holdings Limited for total cash consideration
of $750 million. The transaction resulted in a gain of $408 million for the year ended December 31, 2019. The operating results reported for Kalgoorlie reflect the Company’s attributable share of Kalgoorlie’s results until the date of disposal.
d. Formerly part of Acacia Mining plc. On September 17, 2019, Barrick acquired all of the shares of Acacia it did not own. Refer to note 4 to the Financial Statements for more information.
e. As previously mentioned, as Lagunas Norte has transitioned to care and maintenance at the end of the third quarter of 2019, we have ceased to include the immaterial residual ounces in our production or non-GAAP cost metrics for this operation.
Kalgoorlie (50% basis), AustraliaGold production in the fourth quarter of 2019 for Kalgoorlie was 38% lower compared to the prior quarter, primarily due to the impact of the sale of our 50% interest in the Kalgoorlie mine on November 28, 2019. This was partially offset by higher recovery and throughput. Cost of sales per ounce5 in the fourth quarter of 2019 was 9% higher than the prior quarter mainly due to the impact of lower sales volume. In the fourth quarter of 2019, all-in sustaining costs per ounce4 was in line with the prior quarter as lower minesite sustaining capital expenditures was offset by higher total cash costs per ounce4.
Compared to our outlook, gold production in 2019 of 206 thousand ounces was below the guidance range of 260 to 280 thousand ounces, mainly due to the sale of our 50% interest in November 2019 and the exclusion zones put in place to safely manage the east and west walls of the pit as advised by Newmont (the operator during that time). Cost of sales per ounce5 of $1,062 was higher than the guidance range of $920 to $970 per ounce. Total cash costs per ounce4 and all-in sustaining costs per ounce4 of $873 and $1,183, respectively, were above the guidance ranges of $740 to $790 per ounce and $1,010 to $1,050 per ounce, respectively.
Tongon (89.7% basis), Côte d'IvoireGold production for Tongon in the fourth quarter of 2019 was 2% lower than the prior quarter. Cost of sales per ounce5 in the fourth quarter of 2019 was 6% higher than the prior quarter as a result of higher depreciation expense, partially offset by lower direct mining costs. All-in sustaining costs per ounce4
in the fourth quarter of 2019 was in line with the prior quarter as both minesite sustaining capital expenditures on a per ounce basis and total cash costs per ounce4 were largely in line with prior quarter.
Gold production in 2019 of 245 thousand ounces was slightly below the guidance range of 250 to 270 thousand ounces. Cost of sales per ounce5 of $1,469 was higher than the guidance range of $1,300 to $1,350 per ounce. Total cash costs per ounce4 and all-in sustaining costs per ounce4 of $787 and $844, respectively, were both slightly above the
guidance range of $710 to $760 per ounce and $780 to $820 per ounce, respectively.
Hemlo, Ontario, CanadaHemlo's gold production in the fourth quarter of 2019 was 10%higher than the prior quarter primarily due to higher mill throughput, partially offset by lower grade. Cost of sales per ounce5 in the fourth quarter of 2019 was 51% higher than the prior quarter primarily due to higher direct mining costs and higher royalties driven by an increase in realized gold prices4. In the fourth quarter of 2019, all-in sustaining costs per ounce4
increased by 8% compared to the prior quarter due to higher total cash costs4 with sustaining capital expenditures in line with the prior quarter.
Gold production in 2019 of 213 thousand ounces was within the guidance range of 200 to 220 thousand ounces. Cost of sales per ounce5 of $1,137 and total cash costs per ounce4
of $904 were both above the guidance range of $890 to $940 per ounce and $765 to $815 per ounce, respectively. All-in sustaining costs per ounce4 of $1,140 was within the guidance range of $1,100 to $1,200 per ounce.
Buzwagi, TanzaniaGold production for Buzwagi in the fourth quarter of 2019 was 56% higher compared to the third quarter of 2019, primarily due to the acquisition of all of the shares that we did not own in Acacia on September 17, 2019, which resulted in an increase in our attributable production to 100% (previously 63.9%). Cost of sales per ounce5 in the fourth quarter of 2019was 4% lower than the prior quarter, mainly due to lower maintenance and contractor services costs driven by the timing of process plant maintenance. All-in sustaining costs per ounce4 decreased by 4% compared to the prior quarter, primarily due to lower total cash costs per ounce4.
Overall guidance for 2019 was previously only provided in relation to Acacia and not at the minesite level.

BARRICK YEAR-END 2019 45 MANAGEMENT’S DISCUSSION AND ANALYSIS
Bulyanhulu, TanzaniaGold production for Bulyanhulu in the fourth quarter of 2019 was 50% higher compared to the third quarter of 2019, primarily due to the acquisition of all of the shares that we did not own in Acacia on September 17, 2019, which resulted in an increase in our attributable production to 100% (previously 63.9%). Cost of sales per ounce5 in the fourth quarter of 2019 was largely in line with the prior quarter. All-in sustaining costs per ounce4 increased by 18% compared to the prior quarter, primarily due to the deferral of minesite sustaining capital
expenditures to the fourth quarter following cash flow constraints experienced by Acacia in the prior quarter as a result of the Prohibition Notice at North Mara.
Overall guidance for 2019 was previously only provided in relation to Acacia and not at the minesite level.
Other Mines - Copper
Summary of Operating and Financial Data For the three months ended12/31/19 9/30/19
Copperproduction(millions of
pounds)
Cost of sales ($/lb)
C1 cash costs ($/lb)a
All-in sustaining
costs ($/lb)a
Capital Expend-ituresb
Copperproduction(millions of
pounds)
Cost ofsales($/lb)
C1 cash costs ($/lb)a
All-in sustaining
costs ($/lb)a
Capital Expend-ituresb
Lumwana 63 2.22 2.10 3.41 37 65 2.04 1.83 3.66 37Zaldívar (50%) 36 2.59 1.95 2.56 21 32 2.18 1.55 1.91 11Jabal Sayid(50%) 18 1.47 1.29 1.78 7 15 1.63 1.42 1.65 4
a. These are non-GAAP financial performance measures with no standardized meaning under IFRS and therefore may not be comparable to similar measures presented by other issuers. For further information and a detailed reconciliation of each non-GAAP measure used in this section of the MD&A to the most directly comparable IFRS measure, please see pages 63 to 85 of this MD&A.
b. Includes both minesite sustaining and project capital expenditures.
Lumwana, ZambiaCopper production for Lumwana in the fourth quarter of 2019 was 3% lower than the prior quarter due to a slight decrease in throughput and grade, in line with plan. As previously announced, sales continued to be affected by a major refurbishment at one of the third-party smelters that processes a portion of the mine’s concentrate. The refurbishment was completed in January 2020. We are evaluating our opportunities with this third-party smelter to steadily sell the concentrate stockpiled during the refurbishment period through the course of the year. Cost of sales per pound5 in the fourth quarter of 2019 was 9% higher than the prior quarter primarily due to lower capitalized stripping. In the fourth quarter of 2019, all-in sustaining costs per pound4 decreased by 7% compared to the prior quarter, primarily due to lower minesite sustaining capital expenditures on a per ounce basis, partially offset by higher C1 cash costs per pound4.
Compared to our outlook, copper production in 2019 of 238 million pounds was near the high end of the guidance range of 210 to 240 million pounds. Cost of sales per pound5 and C1 cash costs per pound4 of $2.13 and $1.79, respectively, were both below the guidance range of $2.25 to $2.50 per pound and $1.80 to $2.10 per pound, respectively. All-in sustaining costs4 of $3.04 per pound was within the guidance range of $2.75 to $3.15 per pound.
Zaldívar (50% basis), ChileCopper production for Zaldívar in the fourth quarter of 2019 was 13% higher than the prior quarter mainly due to higher throughput and grades as well as operational initiatives implemented to reduce leach pad lift heights and resting times between irrigation cycles to accelerate recoveries. Cost of sales per pound5 in the fourth quarter of 2019 was 19% higher than the prior quarter primarily due to costs associated with the settlement of labor contract negotiations and the social unrest offset partially by a weaker local currency. All-in
sustaining costs per pound4 increased by 34% compared to the prior quarter primarily due to the impact of higher capitalized stripping and sustaining capital expenditures corresponding to budgeted purchases of spare parts for mine equipment and plant components.
Copper production in 2019 of 128 million pounds was close to the high end of the guidance range of 120 to 130 million pounds. All cost metrics were within the guidance ranges. Cost of sales per pound5 was $2.46 compared to $2.40 to $2.70 per pound. C1 cash costs per pound4 was $1.77, compared to $1.65 to $1.85 per pound, and all-in sustaining costs4 was $2.15, compared to $2.00 to $2.20 per pound.
Jabal Sayid (50% basis), Saudi ArabiaJabal Sayid's copper production in the fourth quarter of 2019was 20% higher compared to the prior quarter, primarily due to an increase in underground mined tonnes after an improvement in availability from new equipment as well as better grades. Cost of sales per pound5 in the fourth quarter of 2019 was 10% lower than the prior quarter as a result of processing material with improved grade, combined with lower processing as well as general and administrative expenses. All-in sustaining costs per pound4 in the fourthquarter of 2019 increased by 8% when compared to the prior quarter, as lower total cash costs4 was outweighed by increased minesite sustaining capital expenditures primarily relating to the concentrate filter expansion project.
Copper production in 2019 of 66 million pounds exceeded the guidance range of 45 to 60 million pounds. All cost metrics were below the guidance range. Cost of sales per pound5
was $1.53 compared to $2.00 to $2.30 per pound. C1 cash costs per pound4 was $1.26, compared to $1.60 to $1.90 per pound, and all-in sustaining costs4 was $1.51, compared to $1.60 to $1.90 per pound.

BARRICK YEAR-END 2019 46 MANAGEMENT’S DISCUSSION AND ANALYSIS
Growth Project Updates
Goldrush Complex, Nevada, USAAt the Goldrush Complex, updated resource models were completed for Goldrush and Fourmile and will be used as the basis of the final feasibility study. No changes to Goldrush mineral reserves have been declared in 2019; these will be updated in 2020 upon completion of mine design changes within the feasibility study. The mineral resources have been updated based on the new models with Goldrush now reported as part of Cortez underground resources as it is our intention for the Goldrush mine to be run under Cortez management once in production. We have standardized our mineral resource reporting to be inclusive of mineral reserves and all underground mineral resources are now reported within $1,500 per ounce stope optimized shells. We believe this better reflects the global underground potential of the deposits at the prescribed resource gold price and includes internal dilution within these stope shapes and, as such, there are higher tonnes at lower grade within the resource declarations. Attributable underground mineral resources at Goldrush (61.5%) now stands at 26.3 million tonnes at 7.8 g/t for 6.6 million ounces in the indicated category and 4.8 million tonnes at 7.60 g/t for 1.2 million ounces in the inferred category. Fourmile (100%) inferred underground mineral resources increased to 5.4 million tonnes at 10.9 g/t for 1.9 million ounces. Fourmile resources continue to be reported separately as it has not yet been contributed to Nevada Gold Mines.
A geotechnical mining rock mass model was also completed in the fourth quarter of 2019 and this will be used together with the updated geological and resource models to update stope and development designs for the feasibility study. Work on a localized dewatering model commenced in November 2019 and is progressing well with recommendations expected in the first quarter of 2020.
Construction of the twin exploration declines at Goldrush continues to progress ahead of schedule and achieved 1,296 meters of total development, an improvement of 328 meters compared to the 986 meters that was budgeted for the fourth quarter of 2019. Overall progress status stands at 61% (from 46% as at the end of the third quarter of 2019) and the forecast decline completion date is now November 2020 (previously March 2021). As at December 31, 2019, we have spent $128 million (including $19 million in the fourth quarter of 2019) on the Goldrush project inclusive of the exploration declines (100% basis). The current capital estimate for the Goldrush project is approximately $1.0 billion (100% basis), subject to the completion of the updated Goldrush feasibility study.
Permitting activities are advancing on-track following our submission of a Plan of Operations to the Bureau of Land Management in September 2019. We continue to expect updated mine and feed schedules by the third quarter of 2020 and the final Goldrush feasibility study to be completed in the first quarter of 2021.
Turquoise Ridge Third Shaft, Nevada, USA12
Construction of the third shaft at Turquoise Ridge, which has a hoisting capacity of 5,500 tonnes per day, continues to advance according to schedule and within budget, with efforts in 2019 focused on surface civil works and shaft sinking. Major progress in the fourth quarter of 2019 focused around sinking-plant commissioning and the commencement of sinking
activities. Shaft sinking commenced in early November and the shaft liner has advanced to a depth of 149 meters below collar. To date, we have spent $119 million (including $9 million in the fourth quarter of 2019) out of an estimated capital cost of approximately $300-$330 million (100% basis).
Pueblo Viejo Plant Expansion Study, Dominican Republic13
Studies remain supportive of a plant expansion at the Pueblo Viejo mine that could significantly increase throughput, allowing the mine to maintain average annual gold production of approximately 800,000 ounces after 2022 (100% basis).
Study work completed during the quarter resulted in a flowsheet adopting the upgrade of the existing autoclaves to “flash” (vaporize) additional water as the means of dissipating the extra heat from the higher sulfide feed to the pressure oxidation (POX) circuit. This involves additional high-pressure slurry pumps and recycle flash capability with thickening provided through an upgrade of existing facilities.
This oxidation solution provides for lower capital and operating costs compared to previously studied options. A new flotation circuit to enable higher sulfide feed for the oxidation circuit remains as previously proposed. Additional neutralization, flotation leach, limestone grinding and water treatment are also included in the new flowsheet. Fourth quarter debottlenecking studies identified a requirement for increased oxygen resulting in a revision of the oxygen plant design to 3,000 tonnes per day.
Block flow diagrams, process design criteria, process descriptions, process flow diagrams, and process and instrumentation drawings have been completed as have quantitative risk assessments during the fourth quarter of 2019. A preliminary operating and capital expenditure estimate, execution plan and schedule have been developed.
Work is also well advanced on the concept study for the management of additional tailings capacity to support the expansion of the process plant. In line with Pueblo Viejo’s environmental responsibility, baseline studies continue for the Environmental Impact Study for the process plant expansion.
Environmental Impact Studies are ongoing for additional tailings and waste rock management. Based on the advanced studies completed to date, we continue to progress our engineering and evaluation work towards a feasibility study for the process plant expansion and the proposed tailings storage facility.
Zaldívar Chloride Leach Project, ChileZaldívar is jointly owned by Antofagasta and Barrick and is operated by Antofagasta.
In December 2019, the Board of Compañía Minera Zaldívar approved the Chloride Leach Project. The capital cost of the project of $189 million (100% basis) consists of the cost of execution and commissioning as well as a joint venture board-controlled contingency provision. The project contemplates the construction of a chloride dosing system, an upgrade of the solvent extraction plant and the construction of additional washing ponds.

BARRICK YEAR-END 2019 47 MANAGEMENT’S DISCUSSION AND ANALYSIS
Work will begin early in 2020, with 2022 expected to be the first full year of operation. Upon completion, the project is expected to increase copper recoveries by more than 10 percentage points through the addition of chlorides to the leach solution and with further potential upside in recoveries possible depending on the type of ore being processed. This process is based on a proprietary technology called CuproChlor® that was developed by Antofagasta at its Michilla operation, which had similar ore types to those that are processed at Zaldívar. Once completed and in full operation, the project is expected to increase production at Zaldívar by approximately 10-15 kilotonnes per annum of copper at lower operating costs over the remaining life of the mine.
Veladero Power Transmission Project, Chile-ArgentinaIn 2019, we commenced construction of an extension to the existing Pascua-Lama power transmission line to connect to the Veladero mine. When completed in the second half of 2020, the power transmission line will allow Veladero to convert to grid power exported from Chile and cease operating the current high-cost diesel generation power plant located at site. A power purchase price agreement was also executed during the fourth quarter of 2019 to supply power from renewable energy that will significantly reduce Veladero’s carbon footprint.
Exploration
Nevada Gold Mines, Nevada, USA14
Nevada Gold Mines land holdings encompass more than two million acres across some of the best endowed gold trends in North America. Consolidation of these lands and associated data is being leveraged to build camp-scale, unified geologic models. In 2019, significant modeling advances were made with camp scale models created for the northern part of the Carlin Trend and Gold Quarry area. A preliminary geologic model of the consolidated Turquoise Ridge district was also completed in the fourth quarter of 2019.
During the fourth quarter of 2019, three diamond drill holes totaling 3,061 meters were completed across the Carlin Trend. A hole was completed within Little Boulder Basin at the end of the quarter. The hole intersected significant alteration and is the first of a series of framework holes to support target delineation in this area of extensive disturbance and post-mineral cover between Goldstrike and Leeville. One additional concept was tested to the south at Richmond Mountain during the quarter. The hole confirmed the geological interpretation. However, the alteration encountered was not encouraging.
At the Rain sub-district, noteworthy results from drilling completed in the second half of the year include two significant intercepts highlighting open-ended mineralization at two separate areas on this relatively underexplored portion of the southern Carlin Trend. The first hole (RAN-2355) intersected 6.1 meters at 8.52 g/t hosted in 130 meters of thick breccia overprinted by silicification and sulfidation altering a carbonate rock not traditionally considered a favorable host. The result validates potential for structurally controlled high-grade mineralization below the stratigraphic level of past exploration and production focus. The second hole evaluated potential along the northwest extension of the Rain fault corridor. The hole (RAN-2349) intersected 3.5 meters at 7.50 g/t about 600 meters south of the Rain fault and is open to the south and west. The potential of the Rain sub-district highlighted by these holes is a promising start to reinvigorating exploration in this target-rich area.
Heading into 2020, the Carlin Trend will become the most active exploration area in Barrick’s portfolio. Leveraging skills and knowledge from the recent success at Fourmile to make high-impact discoveries is the priority. To ensure effective target selection and testing, the program will continue to focus on building robust geologic understanding by relogging, mapping, sampling and drilling with data integrated into scale appropriate models.
At Turquoise Ridge, work towards unifying the geology model across this newly consolidated district is in progress. Merging of all available data is well advanced. Definition of the stratigraphic framework has prioritized marker unit identification with some success. A major relogging program will be advanced during the first quarter of 2020. The work will establish a more robust stratigraphic framework ahead of shifting focus to interpreting the structural framework necessary to delineating targets. Several target concepts have already emerged. These include an area of sparsely drilled favorable limestone host rock at the crest of a district-scale antiform cutting across the north end of the Twin Creeks Complex. The concept is supported by modeled geology and downhole geochemistry showing a vertically extensive auriferous and metal-rich plume. There are also several untested intersections of ore-controlling faults. These emerging targets will be prioritized together with additional concepts anticipated as the modeling and exploration effort matures.
Generative activities in Nevada have been reinvigorated with the consolidation of extensive data covering the Nevada Gold Mines area of interest. Regional scale modeling to link the major gold trends will begin early 2020. The effort will focus on delineating the Roberts Mountains thrust and underlying favorable carbonate rocks where cover conceals this priority targeting criteria across a vast area of interest.
Fourmile, Nevada, USA15
The discovery announced in the third quarter of 2019 was successfully followed up with a hole (FM19-14D) intersecting multiple discontinuous zones of high-grade mineralization over a vertical extent of 250 meters including 3.1 meters at 6.24 g/t, 7.5 meters at 9.22 g/t, 3.1 meters at 47.85 g/t, 3.7 meters at 86.19 g/t, 4.8 meters at 42.48 g/t, and 2.7 meters at 180.36 g/t. The discovery is located about a kilometer north of Fourmile in an area of sparse, 200 to 400 meter spaced, framework drill holes. Follow-up drilling will resume in the second quarter of 2020 following the winter break. Surface mapping and sampling were ongoing during the fourth quarter of 2019. Fieldwork continues to add value, even with target depths often exceeding a kilometer, by highlighting structural controls and geochemical leakage through barren bedrock cover as well as areas requiring framework drilling. Three widely spaced diamond drill holes totaling 4,292 meters were completed during the fourth quarter of 2019.
The focus in 2019 on aggressive advanced target testing resulted in more than doubling the inferred resource at

BARRICK YEAR-END 2019 48 MANAGEMENT’S DISCUSSION AND ANALYSIS
Fourmile. To achieve this growth, a total of 43 new diamond drill holes totaling 40,712 meters were incorporated into geologic and resource models. The most significant addition was found at the intersection of the steeply west-dipping Anna fault identified from this season’s advanced targeting from the moderately west-dipping Sadler reverse fault and associated fold that has been a key targeting criterion for several seasons. Near this structural intersection, brecciated, metasomatized carbonate rock hosts high-grade mineralization. The zone remains open down-dip to the west as well as along strike. Follow-up drilling will resume in the first quarter of 2020. These new holes will also provide excellent platforms to continue building confidence in the resource by directionally drilling across west-dipping mineralization at a favorable orientation.
With rapid resource growth and the potential significant value associated with high-grade mineralization intersected to date, work supporting geotechnical, geo-metallurgical, hydrological and other characterizations of Fourmile have been initiated. Exploration and technical studies are closely coordinated to leverage as much value as possible from every drill hole. A Fourmile study team will be organized in the first quarter of 2020 to evaluate and de-risk the project. The team will ultimately deliver a feasibility study, key to strategic decisions associated with the project including its possible inclusion into Nevada Gold Mines.
Hemlo, Ontario, CanadaAn airborne magnetic survey and surface trenching program was completed during the fourth quarter of 2019. Integrating results from both programs shows a positive correlation between gold and magnetic susceptibility west of the mine. Follow-up will be an important aspect of the 2020 exploration program. Drilling the down plunge extension of the C Zone to assess growth potential was ongoing through the quarter and will continue into 2020. The C-Zone represents most of the current resources and underground mill feed at Hemlo.
Pueblo Viejo, Dominican RepublicDrill testing of targets generated from the first integrated geological model and a renewed understanding on the controls to mineralization was the focus for the quarter. To the southeast of Mejita, a structural control to high grades was established and drill-tested; however, the favorable horizon has been eroded. To the east and northeast of Mejita, historic gold in soil anomalies grading +100ppb Au are in part coincident with the projection of a northeast ore controlling structure from the Moore Pit in an area coincident with newly mapped phreatomagmatic breccias. Drill testing intersected favorable alteration and results are pending. In the first quarter of 2020, we will be applying geophysical techniques to map potential concentrations of sulfides associated with mineralization at Arroyo Hondo and Arroyo del Rey; such surveys were historically successful at mapping sulfide association with the Monte Negro and Moore ore bodies.
Alturas-Del Carmen, ArgentinaAt Del Carmen, an updated mineral inventory was calculated for Rojo Grande which will contribute to further development studies for the Alturas project in 2020. Mineralization at Rojo Grande is at or near surface and could provide a source of early ore for potential development scenarios at Alturas. Finally, drill testing of four priority litho-structural targets in the Alturas-Del Carmen camp, incorporating newly defined high-
grade controls to mineralization, has commenced in January 2020.
Veladero, ArgentinaAt Veladero, a large 3.5 x 2.5 km alteration system has been delineated at the Coiron prospect, located to the southwest of the open pits. Mapping and geophysics have identified many characteristics of our known high sulfidation epithermal deposits and suggests a dominantly preserved hydrothermal system. Drill testing has commenced in January 2020. Multiple other brownfields targets are advancing to delineation and drill testing.
Lagunas Norte, PeruAt Lagunas Norte, we completed structural mapping and deep penetrating geophysics which is delineating both oxide and sulfide targets. Encouragingly, the southern extension of the Lagunas Norte Fault has been redefined and opens up potential for further mineralization to the south of the deposit. A drill program has commenced in January 2020 to test this zone.
Drilling was also initiated at the end of the fourth quarter of 2019 on two targets within the district: La Capilla and Antonio Chuco. At La Capilla, outcropping oxide mineralization defined by channel sampling and drilling extends over a 400 m strike. A potential diatreme feeder has been defined, which may extend mineralization over a much larger area. Drilling will test the diatreme concept and delineate the footprint potential of oxide mineralization. This project is less than 10 km east of Lagunas Norte and could provide near-term oxide material. At Antonio Chuco, 20 km south of Lagunas Norte, surface sampling has identified gold mineralization in north-south oriented silicified structures which may also control the emplacement of breccia bodies.
Pascua-Lama, Chile and ArgentinaBarrick’s intention is to update our geological understanding of the orebody as part of our strategy to bring Pascua-Lama to account. This process is expected to take a number of years to complete.
The focus in 2020 at Pascua-Lama will be on addressing the gaps identified in the geological and geo-metallurgical understanding of the orebody, building upon the improved 3D geology model completed in 2019. To support this, drilling over the next two summer seasons is being contemplated, which may drive further desktop studies. Additionally, a geological and geo-metallurgical drill program at the Penelope deposit of Lama has been budgeted for 2020. Column testing is also planned to assess the amenability of Penelope ore for heap leaching at Veladero.
Porgera, Papua New GuineaFocus during the quarter was on designing a drill program targeting the potential mineralization expansion of the open pit, into the Wangima zone. Historical wide-spaced drill results, combined with preliminary geophysical survey responses and surface sampling, indicated the possibility of a continuation of stacked structurally controlled lenses extending along strike within an interpreted intrusive corridor. Barrick plans to execute an exploratory/infill drill program from both surface and underground platforms during 2020 and 2021. The program is geologically designed as multi-phase and will be calibrated as results become available, and the geology is confirmed. Preliminary results support the
BARRICK YEAR-END 2019 49 MANAGEMENT’S DISCUSSION AND ANALYSIS
extension of both the intrusive corridor and repetition of stacked structures.
Bambadji, Senegal16
At Bambadji, follow-up drilling started testing saprolite anomalies defined through auger drilling under suppressive regolith along the multi-kilometer Gefa-Maliki corridor. Preliminary results confirm bedrock mineralization over the first target tested in the south of the corridor where drill intercepts from the first two RC lines returned 7.0 meters at 16.72 g/t, 30.0 meters at 1.06 g/t and 13.0 meters at 1.31 g/t. Mineralization is hosted within brecciated albitite and fine-medium grained sediments associated with silica, hematite +/- tourmaline and disseminated or patchy pyrite. Results are pending for an extra six lines testing three kilometers of strike length with geological observations suggesting a continuous system past the Gefa Main target and extending a further five kilometers north across the Maliki target, where drilling is currently confirming similar geological findings. Drilling at the Madina target located on the Gounkoto Domain Boundary extension confirmed weak mineralization along northeastern structures propagating within a competent albitite body, but which do not have the potential for economic mineralization. Auger drilling and IP surveys are underway in the northern half of the permit to identify new opportunities to be tested in the second quarter of 2020.
Loulo-Gounkoto, Mali17
At Yalea, step out drilling confirmed the extension of the Transfer Zone over an additional 320 meters towards the South with follow-up drilling planned in the first quarter of 2020 to extend this further. At Loulo 3, resource drilling was completed for the underground opportunity while exploration progressed to the north along the gap zone with Loulo 2, where initial observations show potential for a new open pit. New greenfield targets were generated along the Yalea structure and at the Yalea Ridge, with follow-up planned during the first quarter of 2020. At Gounkoto, exploration in the south of the deposit below the current pit intersected additional high-grade shoots. Follow-up work is planned in the first quarter of 2020 to define if they have the potential to be mined from underground. Exploration on the Faraba Trend has focused on a newly recognized structure which is thought to control mineralization over four kilometers across the Faraba complex. Elsewhere in Mali, generative work is in progress in the Kenieba-Kedougou Inlier and in Mali South with ground being reviewed.
Tongon, Côte d'IvoireAt Nielle, drilling focused on testing gaps along the Badenou trend with limited success in identifying potential for additional satellite resources. Deeper holes are being drilled at the Mercator target to test the down-dip and plunge potential of higher grade shoots beneath the current pit shells. Sub-surface testing of priority targets in the license area is in progress with follow-up drilling planned in the first quarter of 2020 on the best targets. Following the completion of resource conversion drilling at Djinni, optimization work on the updated model returned positive results with the deposit potentially extending the Tongon life of mine by almost a year at the current production rate. A feasibility study is planned at Djinni in 2020 to bring the deposit into the mining schedule.
Regional Exploration, Côte d'IvoireDrilling has been completed across seven priority targets on the Sissedougou and Mankono permits. Results received to
date confirm low- to medium-grade mineralization related to quartz veining hosted within or at the contact with intrusives. Auger drilling is planned to follow potential extensions to some historic targets beneath suppressive regolith in the north of Sissedougou, while soil sampling is covering a major structure in the northeast of the permit. At Boundiali, shallow drilling was completed on the first targets of the Syama corridor, while two more targets remain to be tested before drawing definitive conclusions on the corridor. In southeastern Côte d’Ivoire, stream sampling across the Ketesso area of interest is expected to be completed early in 2020 allowing for the definition of anomalous basins for follow-up.
Kibali, Democratic Republic of Congo18
At Kibali, KCD was the center of activities with further testing of the 12000 lode, a review of the 11000 lode for potential up and down-dip extensions and the start of a deep hole testing the KCD down-plunge extension. At Pakaka and Ikamva, model updates and optimizations are being conducted to assess the potential for underground opportunities following positive drill results received in the third quarter of 2019. Oere was also an area of focus for ounce delivery along the KZ North structure with a third phase of drilling currently in progress to test the potential at depth and along strike. Results to date indicate the potential of a small satellite resource at Oere.
North Mara and Bulyanhulu, Tanzania The main focus during the quarter was the delivery of an updated geologic model for Gokona underground at North Mara. The new model shows mineralization controlled by rheologic contrasts in the broadly folded host stratigraphy. Mineralization typically occurs along volcanic andesite, intermediate dyke and meta-sediment contacts. Significant upside exists in areas of the system where previous drilling is sub-parallel to these folded contacts as well as along strike in both directions and in the footwall of the deposit. Going forward, takeaways from the new model will be applied to exploration along the highly prospective +20 km long Gokona mineralized trend. At Bulyanhulu, an updated geologic interpretation confirmed the exceptional geologic continuity of this system, as well as a near-surface target that has potential to host plunging shoots of higher grade mineralization.
Jabal Sayid, Kingdom of Saudi ArabiaAt Jabal Sayid, target generation work continued through integration and interpretation of historic and new data from the remodeling of lodes 2 and 4. Drill testing of priority targets has started with the first hole investigating the extension of lode 4. To date, this hole has confirmed the continuity of the lithologic and alteration package host to the mineralization. Other brownfield and greenfield targets are being advanced to drill stage with priority targets testing planned for the second quarter of 2020.

BARRICK YEAR-END 2019 50 MANAGEMENT’S DISCUSSION AND ANALYSIS
REVIEW OF FINANCIAL RESULTS
Revenue
($ millions,except perounce/pounddata in dollars)
For the threemonths ended For the years ended
12/31/19 9/30/19 12/31/19 12/31/18 12/31/17
Gold000s oz solda 1,413 1,318 5,467 4,544 5,302000s oz produceda 1,439 1,306 5,465 4,527 5,323Market price ($/oz) 1,481 1,472 1,393 1,268 1,257Realized price ($/oz)b 1,483 1,476 1,396 1,270 1,258Revenue 2,758 2,585 9,186 6,600 7,631
Coppermillions lbs solda 91 65 355 382 405millions lbs produceda 117 112 432 383 413Market price ($/lb) 2.67 2.63 2.72 2.96 2.80Realized price ($/lb)b 2.76 2.55 2.77 2.88 2.95Revenue 82 45 393 512 608
Other sales 43 48 138 131 135Total revenue 2,883 2,678 9,717 7,243 8,374
a. Includes our equity share of gold ounces from Tanzania until September 30, 2019 (notwithstanding the completion of the Acacia transaction on September 17, 2019, we consolidated our interest in Acacia and recorded a non-controlling interest of 36.1% in the income statement for the entirety of the third quarter of 2019 as a matter of convenience) and Pueblo Viejo and copper pounds from Zaldívar and Jabal Sayid. Also includes our equity share of gold ounces from Loulo-Gounkoto, Tongon, Kibali and Morila commencing January 1, 2019, the effective date of the Merger. Starting July 1, 2019, it also includes our 61.5% share of Nevada Gold Mines.
b. Realized price is a non-GAAP financial performance measure with no standardized meaning under IFRS and therefore may not be comparable to similar measures of performance presented by other issuers. For further information and a detailed reconciliation of each non-GAAP measure used in this section of the MD&A to the most directly comparable IFRS measure, please see pages 63 to 85 of this MD&A.
2019 gold production of 5.47 million ounces was at the upper end of the guidance range of 5.1-5.6 million ounces and 2019 copper production of 432 million pounds was above the guidance range of 375-430 million pounds.
Q4 2019 compared to Q3 2019In the fourth quarter of 2019, gold revenues increased by 7% compared to the third quarter of 2019 primarily due to higher sales volume, combined with higher realized gold prices4. The average market price for the three-month period ended December 31, 2019 was $1,481 per ounce versus $1,472 per ounce for the prior quarter. During the fourth quarter of 2019, the gold price ranged from $1,446 per ounce to $1,525 per ounce and closed the quarter at $1,515 per ounce. Gold prices in the quarter were influenced by fluctuations in US Treasury rates and changes in expectations for US benchmark interest rates; movements in the US dollar; economic concerns as a result of global trade disputes; and net purchases from investors and the official sector.
In the fourth quarter of 2019, attributable gold production was 133 thousand ounces higher than the prior quarter, primarily due to the impact of the acquisition of all of the shares that we did not own of Acacia on September 17, 2019, which resulted in an increase in attributable production at North Mara, Bulyanhulu and Buzwagi to 100% (from 63.9%). This was combined with the resumption of operations at North Mara after the lifting of the Prohibition Notice late in the third quarter of 2019, higher throughput at Pueblo Viejo due to record sulfur tonnes oxidized following optimization work, partially offset by the sale of our 50% interest in Kalgoorlie (included in the Other category above) on November 28, 2019.
Copper revenues in the fourth quarter of 2019 increased by 82% compared to the prior quarter, primarily due to higher copper sales volume and higher realized copper prices4. The average market price in the fourth quarter of 2019 was $2.67per pound versus $2.63 per pound in the prior quarter. In the fourth quarter of 2019, the realized copper price4 was higher than the market copper price as a result of the impact of positive provisional pricing adjustments recorded, whereas negative provisional pricing adjustments were recorded in the prior quarter. During the fourth quarter of 2019, the copper price ranged from $2.53 per pound to $2.84 per pound and closed the quarter at $2.79 per pound. Copper prices in the fourth quarter were positively influenced by progress on trade negotiations between the US and China and a further reduction in global stockpiles.
Attributable copper production in the fourth quarter of 2019 increased by 5 million pounds compared to the prior quarter, primarily due to higher throughput and grades at both Zaldívar and Jabal Sayid. In spite of a strong quarter on production, sales were negatively affected by a major refurbishment at one of the third-party smelters that processes a portion of Lumwana’s concentrate. The refurbishment was completed in January 2020. We are evaluating our opportunities with this third-party smelter to steadily sell the concentrate stockpiled during the refurbishment period through the course of the year.

BARRICK YEAR-END 2019 51 MANAGEMENT’S DISCUSSION AND ANALYSIS
2019 compared to 2018In 2019, gold revenues increased by 39% compared to the prior year primarily due to the inclusion of production from sites acquired as part of the Merger and due to the formation of Nevada Gold Mines, which commenced on July 1, 2019 and is consolidated and included in revenue at 100%. Excluding the impact of the Merger and the formation of Nevada Gold Mines, gold revenues were in line with the prior year as a decrease in gold sales volumes was largely offset by an increase in realized gold prices4. The average market gold price for 2019 was $1,393 per ounce versus $1,268 per ounce in the prior year.
In 2019, attributable gold production was 938 thousand ounces or 21% higher than the prior year. Excluding the impact of the Merger and the formation of Nevada Gold Mines, gold production for the year decreased by 383 thousand ounces or 8%, mainly due to lower grades mined and processed at Cortez as mining from CHOP was completed in the second quarter of 2019.
Copper revenues for 2019 were down 23% compared to the prior year due to lower realized copper prices4, combined with lower copper sales volume. Copper sales were adversely impacted by a major refurbishment at one of the third-party smelters that processes a portion of Lumwana’s concentrate. In 2019, the realized copper price4 was higher than the market copper price as a result of positive provisional pricing adjustments to copper sales that were subject to finalization in 2019. The 2018 realized copper price4 was lower than the market copper price as a result of negative provisional pricing adjustments, the opposite impact from the current year.
Attributable copper production for 2019 was 13% higher than the prior year, mainly due to the improvements in plant availability and efficiency implemented at Lumwana, as well as higher grade and throughput at Zaldívar following crusher and conveyor issues that occurred in the prior year period.
Production Costs
($ millions,except perounce/pounddata in dollars)
For the threemonths ended For the years ended
12/31/19 9/30/19 12/31/19 12/31/18 12/31/17Gold
Direct mining costsa 1,252 1,207 4,274 3,130 3,063Depreciation 549 538 1,902 1,253 1,529Royaltyexpense 85 79 308 196 206Communityrelations 10 7 30 42 38
Cost of sales 1,896 1,831 6,514 4,621 4,836Cost of sales ($/oz)b 1,046 1,065 1,005 892 794Total cash costs ($/oz)c 692 710 671 588 526All-in sustaining costs ($/oz)c 923 984 894 806 750
CopperDirectmining costs 55 30 224 344 274Depreciation 17 13 100 170 83Royaltyexpense 8 5 34 39 38Communityrelations 0 1 3 5 4
Cost of sales 80 49 361 558 399Cost of sales ($/lb)b 2.26 2.00 2.14 2.40 1.77C1 cash costs ($/lb)c 1.90 1.62 1.69 1.97 1.66All-in sustaining costs ($/lb)c 2.82 2.58 2.52 2.82 2.34
a. Includes mining and processing costs.b. Cost of sales applicable to gold per ounce is calculated using cost of sales
applicable to gold on an attributable basis (removing the non-controlling interest of 40% Pueblo Viejo, 36.1% Tanzania until September 30, 2019 (notwithstanding the completion of the Acacia transaction on September 17, 2019, we consolidated our interest in Acacia and recorded a non-controlling interest of 36.1% in the income statement for the entirety of the third quarter of 2019 as a matter of convenience) and 40% South Arturo from cost of sales (63.1% of South Arturo from July 1, 2019 onwards as a result of its contribution to Nevada Gold Mines)), divided by attributable gold ounces. The non-controlling interest of 20% Loulo-Gounkoto and 10.3% of Tongon is also removed from cost of sales and our proportionate share of cost of sales attributable to equity method investments (Kibali and Morila) is included commencing January 1, 2019, the effective date of the Merger. Also removes the non-controlling interest of 38.5% Nevada Gold Mines from cost of sales from July 1, 2019 onwards. Cost of sales applicable to copper per pound is calculated using cost of sales applicable to copper including our proportionate share of cost of sales attributable to equity method investments (Zaldívar and Jabal Sayid), divided by consolidated copper pounds (including our proportionate share of copper pounds from our equity method investments).
c. Total cash costs, C1 cash costs and all-in sustaining costs are non-GAAP financial performance measures with no standardized meaning under IFRS and therefore may not be comparable to similar measures of performance presented by other issuers. For further information and a detailed reconciliation of each non-GAAP measure used in this section of the MD&A to the most directly comparable IFRS measure, please see pages 63 to 85 of this MD&A.

BARRICK YEAR-END 2019 52 MANAGEMENT’S DISCUSSION AND ANALYSIS
Q4 2019 compared to Q3 2019In the fourth quarter of 2019, cost of sales applicable to gold was 4% higher compared to the third quarter of 2019 as a result of increased sales volume. Our 45% interest in Kibali and 40% interest in Morila are equity accounted for and therefore we do not include their cost of sales in our consolidated gold cost of sales. On a per ounce basis, cost of sales applicable to gold5, after including our proportionate share of cost of sales at our equity method investees, and total cash costs4 were 2% and 3% lower, respectively, than the prior quarter primarily due to the impact of higher grade and throughput at Pueblo Viejo, partially offset by lower grades at Cortez as the remaining higher grade, low-cost stockpiles from CHOP were processed in the third quarter of 2019.
In the fourth quarter of 2019, gold all-in sustaining costs4 decreased by 6% on a per ounce basis compared to the prior quarter primarily due to lower total cash costs4 as discussed above, combined with lower general and administrative expenses and lower minesite sustaining capital expenditures.
In the fourth quarter of 2019, cost of sales applicable to copper was 63% higher than the prior quarter primarily due to higher copper sales volume at Lumwana as a result of our efforts to sell concentrate through other channels while the major refurbishment at one of the third-party smelters continued. Our 50% interests in Zaldívar and Jabal Sayid are equity accounted for and therefore we do not include their cost of sales in our consolidated copper cost of sales. On a per pound basis, cost of sales applicable to copper5 and C1 cash costs4, after including our proportionate share of cost of sales at our equity method investees, increased by 13% and 17%, respectively, compared to the prior quarter primarily due to more stripping expenditures being expensed rather than capitalized at Zaldívar and Lumwana.
In the fourth quarter of 2019, copper all-in sustaining costs4, which have been adjusted to include our proportionate share of equity method investees, were 9% higher per pound than the prior quarter primarily reflecting higher C1 cash costs4, partially offset by lower minesite sustaining capital expenditures on a per pound sold basis.
2019 compared to 20182019 cost of sales applicable to gold5 was $1,005 per ounce compared to our guidance range of $940-$990 per ounce. In 2019, cost of sales applicable to gold was 41% higher than the prior year primarily due to increased sales volume resulting from the Merger and the formation of Nevada Gold Mines. Excluding the impact of the Merger and Nevada Gold Mines, cost of sales applicable to gold was 3% lower compared to the prior year, in line with the change in production after adjusting for the impact of the Merger and Nevada Gold Mines. On a per ounce basis, cost of sales applicable to gold5, after including our proportionate share of cost of sales at our equity method investees, was 13% higher than the prior year primarily due to higher depreciation on a per ounce basis as a result of the fair value increments applied to our interests in the legacy Randgold and Nevada Gold Mines operations. Total cash costs per ounce4 increased by 14% compared to the same prior year period primarily due to the impact of lower grades processed from Cortez and higher export duties and royalties at Veladero.
Gold total cash costs4 and all-in sustaining costs4 for 2019were $671 and $894 per ounce, respectively, both within the guidance ranges of $650-$700 and $870-$920 per ounce. In 2019, gold all-in sustaining costs per ounce4 increased by 11% compared to the prior year primarily due to higher total cash costs4 as discussed above, combined with higher minesite sustaining capital expenditures on a per ounce basis, partially offset by lower general and administrative expenses.
2019 cost of sales applicable to copper5 and C1 cash costs4
were $2.14 and $1.69 per pound, both below our guidance ranges of $2.30-$2.70 and $1.70-$2.00 per pound, respectively. In 2019, cost of sales applicable to copper was 35% lower than the prior year, primarily due to the impact of lower copper sales volume at Lumwana, as sales were negatively affected by a major refurbishment at one of the third-party smelters that processes a portion of Lumwana’s concentrate. The refurbishment was completed in January 2020. We are evaluating our opportunities with this third-party smelter to steadily sell the concentrate stockpiled during the refurbishment period through the course of the year. Our 50% interests in Zaldívar and Jabal Sayid are equity accounted for and therefore we do not include their cost of sales in our consolidated copper cost of sales. On a per pound basis, cost of sales applicable to copper5 and C1 cash costs4, after including our proportionate share of cost of sales at our equity method investees, decreased by 11% and 14%, respectively, compared to the prior year primarily due to the fundamental and sustainable improvements in plant availability and operational efficiency initiatives implemented at Lumwana.
2019 copper all-in sustaining costs4, which have been adjusted to include our proportionate share of equity method investments, were $2.52 per pound, at the lower end of our guidance range of $2.40-$2.90 per pound. Copper all-in sustaining costs4 were 11% lower than the prior year primarily reflecting the lower total C1 cash costs4, partially offset by higher minesite sustaining capital expenditures on a per pound basis.

BARRICK YEAR-END 2019 53 MANAGEMENT’S DISCUSSION AND ANALYSIS
Capital Expendituresa
($ millions)For the three
months ended For the years ended 12/31/19 9/30/19 12/31/19 12/31/18 12/31/17
Minesite sustainingb 394 406 1,320 968 1,116Project capital expendituresc 46 96 370 425 280Capitalizedinterest 6 0 11 7 0Totalconsolidatedcapitalexpenditures 446 502 1,701 1,400 1,396Attributable capital expendituresd 393 397 1,512 1,363 1,3142019 Attributable capital expenditures guidanced
$1,400to
$1,700a. These amounts are presented on a 100% cash basis, except for
attributable capital expenditures.b. Includes both minesite sustaining and mine development.c. Project capital expenditures (on an accrued basis until December 31,
2018, and on a cash basis thereafter) are included in our calculation of all-in costs, but not included in our calculation of all-in sustaining costs.
d. These amounts are presented on the same basis as our guidance and include our 60% share of Pueblo Viejo and South Arturo (36.9% of South Arturo from July 1, 2019 onwards as a result of its contribution to Nevada Gold Mines), our 63.9% share of Tanzania until September 30, 2019 (notwithstanding the completion of the Acacia transaction on September 17, 2019, we consolidated our interest in Acacia and recorded a non-controlling interest of 36.1% in the income statement for the entirety of the third quarter of 2019 as a matter of convenience) and our 50% share of Zaldívar and Jabal Sayid. Also includes our 80% share of Loulo-Gounkoto, 89.7% share of Tongon, 45% share of Kibali and 40% share of Morila commencing January 1, 2019, the effective date of the Merger. Starting July 1, 2019, it also includes our 61.5% share of Nevada Gold Mines.
Q4 2019 compared to Q3 2019In the fourth quarter of 2019, total consolidated capital expenditures on a cash basis decreased by 11% compared to the third quarter of 2019, primarily due to lower project capital expenditures of 52%, combined with a decrease in minesite sustaining capital expenditures of 3%. Lower project capital expenditures are mainly attributed to Cortez due to decreases at the Cortez Hills Underground Rangefront project and the change in classification of the Crossroads open pit project. Crossroads transitioned to production status late in the third quarter of 2019 from pre-production prior to that. As such, lower project capital expenditures are attributable to this transition resulting in a change in the classification of capital expenditures from project to sustaining. The decrease in minesite sustaining capital expenditures is the result of lower stripping costs capitalized at Loulo-Gounkoto, partially offset by the change in classification of the Crossroads open pit project as discussed above.
2019 compared to 2018In 2019, total consolidated capital expenditures on a cash basis increased by 22% compared to the prior year, primarily due to the impact of the sites acquired as part of the Merger and from Nevada Gold Mines, which commenced on July 1, 2019, and is consolidated and included at 100%. Excluding the impact of the Merger and the formation of Nevada Gold Mines, capital expenditures decreased by 4% mainly due to lower project capital expenditures at Cortez due to decreasing
Crossroads dewatering activities and Rangefront project expenditures, while minesite sustaining capital expenditures remained in line with the prior year.
2019 compared to OutlookAttributable capital expenditures for 2019 of $1,512 million were at the lower end of the guidance range of $1,400 to $1,700 million.
General and Administrative Expenses
($ millions)For the three
months ended For the years ended
12/31/19 9/30/19 12/31/19 12/31/18 12/31/17
Corporate administrationa 26 39 148 212 201Share-based compensationb 5 13 37 27 26Tanzaniac 0 16 27 26 21General &administrativeexpenses 31 68 212 265 2482019 General &administrativeexpensesguidance ~$200
a. For the three months and year ended December 31, 2019, corporate administration costs include approximately $nil and $18 million, respectively, of severance costs (September 30, 2019: $3 million; 2018 $63 million; 2017: $3 million).
b. Based on US$18.59 share price as at December 31, 2019(September 30, 2019: US$17.33; 2018: US$13.54; 2017: $14.47) and excludes share-based compensation relating to Tanzania.
c. Formerly known as Acacia Mining plc. This line includes severance costs of approximately $13 million and $15 million, for the three months and year ended December 31, 2019, respectively.
Q4 2019 compared to Q3 2019In the fourth quarter of 2019, general and administrative expenses decreased by $37 million compared to the thirdquarter of 2019 primarily due to severance costs incurred by Tanzania resulting from the closure of Acacia’s London and Johannesburg offices that occurred in the prior quarter. This was combined with lower corporate administration expenses of $13 million mainly due to cost reductions and lower short-term incentive accruals during the quarter. This was further impacted by lower share-based compensation of $8 million mainly resulting from a more modest increase in our share price during the fourth quarter of 2019 compared to the increase in the prior quarter.
2019 compared to 2018General and administrative expenses decreased by $53million compared to the prior year due to lower corporate administration expenses attributed to the organizational reductions related to both the implementation of the decentralized operating model in the prior year and the Merger in the current period. This was partially offset by higher share-based compensation resulting from higher share prices compared to the prior year.
2019 compared to OutlookExclusive of severance costs of $33 million, general and administrative expenses were lower than guidance of ~$200 million. Corporate administration expenses of $130 million (excluding severances of $18 million) were below guidance of ~$140 million, highlighting the benefit of cost reduction activities during the year and the implementation of our flat, operationally focused, agile management structure.

BARRICK YEAR-END 2019 54 MANAGEMENT’S DISCUSSION AND ANALYSIS
Exploration, Evaluation and Project Costs
($ millions)For the three
months ended For the years ended 12/31/19 9/30/19 12/31/19 12/31/18 12/31/17
Globalexploration andevaluation 33 34 143 121 126Advancedproject costs:
Pascua-Lama 11 13 49 77 122 Other 6 5 20 36 14Corporatedevelopment 10 11 51 60 13Businessimprovementand innovation 0 1 10 44 32Minesiteexploration andevaluation 24 22 69 45 47
Totalexploration,evaluationand projectexpenses 84 86 342 383 3542019 total E&Eand projectexpensesguidance
$280to
$340
Q4 2019 compared to Q3 2019Exploration, evaluation and project expenses for the fourth quarter of 2019 were in line with the prior quarter.
2019 compared to 2018Exploration, evaluation and project costs for 2019 decreased by $41 million compared to the prior year. This was due to lower advanced project costs, primarily at Pascua-Lama, and lower business improvement and innovation costs as a result of digitization initiatives occurring in the prior year. This was partially offset by an increase in minesite exploration and evaluation expenses at Nevada Gold Mines and higher global exploration and evaluation expenses mainly due to the expansion project at Pueblo Viejo.
2019 compared to OutlookExploration, evaluation and project costs for 2019 were marginally above the top end of the guidance range of $280 to $340 million. This was due to higher exploration and evaluation expenditures, which were above the guidance range of $170 to $180 million, marginally offset by lower project expenditure, which was at the lower end of the $120 to $150 million range.
Finance Costs, Net
($ millions)For the three
months ended For the years ended 12/31/19 9/30/19 12/31/19 12/31/18 12/31/17
Interest expensea 104 112 435 452 511Accretion 16 19 75 87 67Loss on debtextinguishment 0 3 3 29 127Interestcapitalized (6) (3) (14) (9) 0Other financecosts 5 (2) 1 1 0Financeincome (13) (4) (31) (15) (14)Finance costs,net 106 125 469 545 691
2019 financecosts, netguidance
$500 to
$550a. For the three months and year ended December 31, 2019, interest expense
includes approximately $28 million and $103 million, respectively, of non-cash interest expense relating to the gold and silver streaming agreements with Wheaton Precious Metals Corp. and Royal Gold, Inc. (September 30, 2019: $25 million; 2018: $98 million; 2017: $101 million).
Q4 2019 compared to Q3 2019In the fourth quarter of 2019, net finance costs were 15% lower than the prior quarter, mainly due to an increase in finance income resulting from the unwinding of the discount related to a prepaid long-term royalty at Carlin which was recorded at its fair value on the formation of Nevada Gold Mines.
2019 compared to 2018In 2019, net finance costs were 14% lower than the prior year primarily due to a decrease in loss on debt extinguishment and lower interest expense, both attributable to debt reductions we have made over the preceding 18 months. The loss on debt extinguishment in 2019 relates to the make-whole repurchase of the outstanding $248 million of principal of our 4.95% notes due 2020 in July 2019. For 2018, the loss on debt extinguishment relates to the make-whole repurchase of the remaining $629 million of principal on the 4.40% Notes due 2021 in July 2018, which also resulted in a decrease in interest expense compared to the prior year.
2019 compared to OutlookNet finance costs for 2019 were below the guidance range of $500 to $550 million. This was due to higher finance income and lower accretion expense on our environmental rehabilitation provisions.

BARRICK YEAR-END 2019 55 MANAGEMENT’S DISCUSSION AND ANALYSIS
Additional Significant Statement of Income Items
($ millions)For the three
months ended For the years ended 12/31/19 9/30/19 12/31/19 12/31/18 12/31/17
Impairmentcharges(reversals) (566) (872) (1,423) 900 (212)Loss oncurrencytranslation 53 40 109 136 72Other expense(income) (1,282) (1,852) (3,100) 90 (799)
Impairment Charges (Reversals)
($ millions)For the three
months ended For the years ended 12/31/19 9/30/19 12/31/19 12/31/18 12/31/17
Post-tax(our
share)
Post-tax(our
share)
Post-tax(our
share)
Post-tax(our
share)
Post-tax(our
share)
Assetimpairments(reversals)
Lumwana 0 (663) (663) 0 (259)Pueblo Viejo (277) 0 (277) 0 0Pascua-Lama 296 0 296 (7) 407Nevada GoldMines 0 46 48 11 0Lagunas Norte 0 11 12 405 2Veladero 0 0 2 160 0
Equity methodinvestments 0 0 0 30 0Acaciaexplorationsites 0 0 0 17 0Cerro Casale 0 0 0 0 (518)
Bulyanhulu 0 0 0 0 350GoldenSunlight 0 0 0 0 2Explorationsites 0 0 0 0 8Other 3 4 14 29 1
Total assetimpairmentcharges(reversals) 22 (602) (568) 645 (7) Goodwill
Veladero 0 0 0 154 0
Total goodwillimpairmentcharges 0 0 0 154 0Tax effects andNCI (588) (270) (855) 101 (205)Total impairmentcharges(reversals) (566) (872) (1,423) 900 (212)
Impairment Charges (Reversals)Q4 2019 compared to Q3 2019In the fourth quarter of 2019, net impairment charges were $22 million (net of tax and non-controlling interests) compared to reversals of $602 million (net of tax and non-controlling interests) in the prior quarter. The net impairment charge in the fourth quarter of 2019 mainly relates to a charge of $296 million (no tax impact) at Pascua-Lama, as we completed a
study of the Pascua-Lama project and concluded that we do not have a plan that meets our investment criteria under our current assumptions. This was partially offset by net impairment reversals at Pueblo Viejo of $277 million net of tax and non-controlling interest ($865 million pre-tax and non-controlling interest), reflecting the progression of our engineering and evaluation work on the process plant expansion and additional tailings facility. In conjunction with the increase in the long-term gold price assumption, this has resulted in an improvement in the life of mine cash flows for the mine site. In the third quarter of 2019, the net impairment reversal relates to a reversal at Lumwana of $663 million net of tax ($947 million pre-tax), partially offset by impairments of land holdings and CHOP infrastructure assets at Cortez.
2019 compared to 2018In 2019, we recognized $568 million (net of tax and non-controlling interests) of net impairment reversals for non-current assets. This was mainly at Lumwana: $663 million net of tax ($947 million pre-tax) as a result of significant reductions achieved in the current year in unit mining costs and improvements in plant availability reflected in our updated life of mine plan, combined with an increase in our long-term copper price assumption of $3.00 per pound from $2.85 per pound. In addition, we recognized $277 million net of tax and non-controlling interest ($865 million pre-tax and non-controlling interest) of net impairment reversals at Pueblo Viejo, reflecting the progression of our engineering and evaluation work on the process plant expansion and additional tailings facility in conjunction with the increase in the long-term gold price assumption. This was partially offset by net impairment charges of $296 million (no tax impact) at Pascua-Lama, as we completed a study of the Pascua-Lama project and concluded that we do not have a plan that meets our investment criteria under our current assumptions.
Refer to note 21 to the Financial Statements for a full description of impairment charges, including pre-tax amounts and sensitivity analysis.
Loss on Currency TranslationQ4 2019 compared to Q3 2019Loss on currency translation in the fourth quarter of 2019 was $53 million compared to $40 million in the prior quarter. The increase was primarily due to the revaluation of a Zambian tax settlement, partially offset by lower unrealized foreign currency translation losses resulting from a modest depreciation of the Argentine peso in the current quarter versus a significant depreciation in the prior quarter. This currency depreciation resulted in the revaluation of our peso denominated value-added tax receivable balances. During the fourth quarter of 2019, the Argentine peso continued to weaken versus the US dollar due in part to high inflation.
2019 compared to 2018Loss on currency translation for 2019 decreased by $27 million compared to the prior year. The decrease was primarily due to continued unrealized foreign currency translation losses relating to the Argentine peso, but from a lower asset base in 2019 versus 2018. The peso has significantly depreciated in both periods and has revalued our peso denominated value-added tax receivable balances. After modest appreciation of the Argentine peso in the second quarter of 2019, the impact of inflation and political uncertainty in Argentina experienced in the third and fourth quarters of

BARRICK YEAR-END 2019 56 MANAGEMENT’S DISCUSSION AND ANALYSIS
2019 has driven a return to the general trend in recent years of a weakening peso versus the US dollar.
Other Expense (Income)Q4 2019 compared to Q3 2019In the fourth quarter of 2019, other income was $1,282 million compared to $1,852 million in the prior quarter. Other income in the fourth quarter of 2019 mainly relates to a $628 million gain on the de-recognition of the deferred revenue liability relating to our silver sale agreement with Wheaton Precious Metals Corp. Refer to note 29 to the Financial Statements for more information. Other income in the fourth quarter of 2019 also includes a gain of $408 million resulting from the sale of our 50% interest in Kalgoorlie, and a gain of $216 million on a settlement of customs duty and indirect taxes at Lumwana. Other income in the third quarter of 2019 mainly related to the gain on the remeasurement of Barrick’s 75% interest in Turquoise Ridge to fair value as a result of its contribution to Nevada Gold Mines. Refer to note 4 to the Financial Statements for more information.
2019 compared to 2018Other income was $3,100 million in 2019 compared to an expense of $90 million in the prior year. In 2019, we recognized a gain of $1,886 million relating to the remeasurement of Barrick’s 75% interest in Turquoise Ridge to fair value as a result of its contribution to Nevada Gold Mines, and a $628 million gain on the de-recognition of the deferred revenue liability relating to our silver sale agreement with Wheaton Precious Metals Corp. This was further impacted by a gain of $408 million resulting from the sale of our 50% interest in Kalgoorlie, and a gain of $216 million on a settlement of customs duty and indirect taxes at Lumwana. In 2018, we recognized $68 million of litigation fees, which primarily consists of legal fees at Acacia, and the settlement of a dispute regarding a historical supplier contract acquired as part of the Equinox acquisition in 2011; $51 million of write-offs, which relates primarily to the write-off of a Western Australia long-term stamp duty receivable; and $13 million related to an insurance payment to our Porgera JV. This was partially offset by a $45 million gain on the sale of a non-core royalty asset at Acacia, and $24 million of insurance proceeds received at Kalgoorlie.
For a further breakdown of other expense (income), refer to note 9 to the Financial Statements.
Income Tax ExpenseIncome tax expense was $1,783 million in 2019. The underlying effective tax rate for ordinary income in 2019 was 34% after adjusting for the impact of the change in accounting for the Wheaton Precious Metals Corp. silver streaming agreement; the accounting gain on disposal of Turquoise Ridge; the profit on sale of Kalgoorlie; the net impact of foreign currency translation losses on deferred tax balances; the impact of impairment charges (reversals); the impact of debt extinguishment costs; the impact of asset sales and non-hedge derivatives; the impact of non-deductible foreign exchange losses; the impact of accruing for US withholding tax; and the impact of other expense adjustments. The unadjusted tax rate for income in 2019 was 28% of the loss before income taxes.
We record deferred tax charges or credits if changes in facts or circumstances affect the estimated tax basis of assets and
therefore the amount of deferred tax assets or liabilities to reflect changing expectations in our ability to realize deferred tax assets. The interpretation of tax regulations and legislation and their application to our business is complex and subject to change. We have significant amounts of deferred tax assets, including tax loss carry forwards, and also deferred tax liabilities. We have significant amounts of unrecognized deferred tax assets (e.g. for tax losses in Canada). Potential changes of any of these amounts, as well as our ability to realize deferred tax assets, could significantly affect net income or cash flow in future periods.
Reconciliation to Canadian Statutory RateFor the years ended 12/31/19 12/31/18At 26.5% statutory rate 1,684 (63)Increase (decrease) due to:
Allowances and special tax deductionsa (129) (59)Impact of foreign tax ratesb (264) (4)Expenses not tax deductible 78 74Impairment charges not recognized indeferred tax assets 45 168Goodwill impairment charges not taxdeductible 0 54Net currency translation losses on deferredtax balances 43 41Tax impact from pass-through entities andequity accounted investments (140) (15)Current year tax losses not recognized indeferred tax assets 8 100Sale of 50% interest in Kalgoorlie 12 0De-recognition of deferred tax assets 4 814United States adjustment to one-time tollcharge 0 (49)Adjustments in respect of prior years (13) 3Increase to income tax related contingentliabilities 21 0Dominican Republic tax audit 0 42Impact of tax rate changes (35) 0United States withholding taxes 30 (107)Other withholding taxes 24 14Mining taxes 412 184Other items 3 1Income tax expense 1,783 1,198
a. We are able to claim certain allowances and tax deductions unique to extractive industries that result in a lower effective tax rate.
b. We operate in multiple foreign tax jurisdictions that have tax rates different than the Canadian statutory rate.
The more significant items impacting income tax expense in 2019 and 2018 include the following:
Currency TranslationDeferred tax balances are subject to remeasurement for changes in currency exchange rates each period. This is required in countries where tax is paid in local currency and accounts are prepared in local GAAP. The most significant balances are Argentine deferred tax liabilities. In 2019 and 2018, tax expense of $75 million and $41 million, respectively, primarily arose from translation losses due to the weakening of the Argentine peso against the US dollar. These translation losses are included within deferred tax expense (recovery). In 2019, deferred tax balances for legacy Randgold assets in Mali and Côte d’Ivoire required remeasurement at year end.
BARRICK YEAR-END 2019 57 MANAGEMENT’S DISCUSSION AND ANALYSIS
De-recognition of Deferred Tax AssetsIn the fourth quarter of 2018, we recorded a deferred tax expense of $673 million related to de-recognition of the deferred tax asset in Canada, and a deferred tax expense of $141 million related to de-recognition of the deferred tax asset in Peru. The de-recognition of the deferred tax asset in Canada follows the Merger and management’s focus on growing the business globally, particularly on our Tier One
Gold Assets1 which are outside of Canada. This required us to reassess the level of repatriated earnings expected in Canada, and Canadian income thereon to support the deferred tax asset. The de-recognition of the deferred tax asset does not constrain our ability to use Canadian carry forward tax losses against future income in Canada; however, we did not expect to be able to use these losses in the foreseeable future as a result of the change in strategy in the fourth quarter of 2018. The de-recognition of the deferred tax asset in Peru in the fourth quarter of 2018 follows management’s review of expected future earnings. The associated impairment of inventory at Lagunas Norte was also driven by the change in the fourth quarter of 2018 in our expected approach to financing future reclamation activities in Peru. Based on these reviews in Canada and Peru, it was determined that the realization of these deferred tax assets was no longer probable.
United States Withholding TaxesIn the fourth quarter of 2018, primarily due to restructuring associated with the Merger, we concluded that going forward, we would reinvest our future undistributed earnings of our United States subsidiaries indefinitely. As a result of our reassessment, we recorded a deferred tax recovery of $107 million.
In 2019, we reassessed our intentions on the current and future undistributed earnings of our United States subsidiaries due to the formation of Nevada Gold Mines. Based on the free cash flow that we expect Nevada Gold Mines to generate, together with other factors, we concluded that it was no longer our intent to indefinitely reinvest our current and future undistributed earnings of our United States subsidiaries. Therefore in the fourth quarter of 2019, we recognized an increase in our income tax provisions in the amount of $30 million, representing withholding tax on undistributed United States earnings.
Framework for former Acacia Operations in Tanzania On October 20, 2019, Barrick announced that it had reached an agreement with the Government of Tanzania (“GoT”) to settle all disputes between the GoT and the mining companies formerly operated by Acacia but now managed by Barrick. The final agreements were submitted to the Tanzanian Attorney General for review and legalization.
On January 24, 2020, Barrick announced that the Company had ratified the creation of Twiga at a signing ceremony with the President of Tanzania, formalizing the establishment of a joint venture between Barrick and the GoT and resolution of all outstanding disputes between Barrick and the GoT, including the lifting of the previous concentrate export ban, effective immediately.
The terms of the signed agreement are consistent with those previously announced, including the payment of $300 million to settle all outstanding tax and other disputes (the “Settlement Payment”); the lifting of the concentrate export ban; the sharing of future economic benefits from the mines on a 50/50 basis; and a dispute resolution mechanism that provides for binding international arbitration. The 50/50 division of economic benefits will be maintained through an annual true-up mechanism, which will not account for the Settlement Payment.
The Settlement Payment will be paid in installments, with an initial payment of $100 million to the GoT following the resumption of mineral concentrate exports. Five subsequent annual payments of $40 million each will be made, starting on the first anniversary of the fulfillment of all conditions of the signed agreement, subject to certain cash flow conditions.
A tax provision of $128 million had been recorded prior to December 31, 2016 in respect of tax disputes related to Acacia. Of this amount, $70 million was recorded in 2016. In the third quarter of 2017, an additional amount of $172 million was recorded as current tax expense. See note 36 to the Financial Statements for further information with respect to these matters.
Zambian Tax MattersThe mining taxes assessed to the Lumwana Mine have contradicted the Development Agreement that was finalized between Lumwana Mining Company Limited (“LMC”) and the Government of Zambia on December 16, 2005. In 2015, the Company began to take steps to preserve its rights under the Development Agreement and started to engage in formal discussions with the government to redress historical tax issues relating to the Development Agreement. On October 3, 2018, a deed of settlement was signed by the Government of Zambia and LMC. The deed provided that, within 30 days of the deed, LMC shall file tax returns for 2012 through 2017, and the government shall have the right to conduct and complete an audit of the returns. The audit of these tax returns by the Zambian tax authority was completed in the fourth quarter of 2019 and we recorded a $50 million asset reflecting the final settlement of this matter. We also released historical accruals related to customs duty and indirect taxes resulting in a total of $216 million recognized in Other Income in 2019 (refer to note 9 to the Financial Statements for more information).

BARRICK YEAR-END 2019 58 MANAGEMENT’S DISCUSSION AND ANALYSIS
FINANCIAL CONDITION REVIEW Summary Balance Sheet and Key Financial Ratios ($ millions, except ratios and share amounts) As at December 31, 2019 As at December 31, 2018 As at December 31, 2017Total cash and equivalents 3,314 1,571 2,234Current assets 3,573 2,407 2,450Non-current assets 37,505 18,653 20,624Total Assets 44,392 22,631 25,308Current liabilities excluding short-term debt 2,001 1,625 1,688Non-current liabilities excluding long-term debta 7,028 5,883 6,130Debt (current and long-term) 5,536 5,738 6,423Total Liabilities 14,565 13,246 14,241Total shareholders’ equity 21,432 7,593 9,286Non-controlling interests 8,395 1,792 1,781Total Equity 29,827 9,385 11,067Total common shares outstanding (millions of shares)b 1,778 1,168 1,167Key Financial Ratios:
Current ratioc 2.9:1 2.38:1 2.68:1 Debt-to-equityd 0.19:1 0.61:1 0.58:1
a. Non-current financial liabilities as at December 31, 2019 were $5,559 million (2018: $6,201 million; 2017: $6,844 million).b. Total common shares outstanding do not include 0.3 million stock options.c. Represents current assets (excluding assets held-for-sale) divided by current liabilities (including short-term debt and excluding liabilities held-for-sale) as at
December 31, 2019, December 31, 2018 and December 31, 2017.d. Represents debt divided by total shareholders’ equity (including minority interest) as at December 31, 2019, December 31, 2018, and December 31, 2017.
Balance Sheet ReviewTotal assets were $44.4 billion at December 31, 2019, approximately $21.8 billion higher than at December 31, 2018, primarily reflecting the impact of the sites acquired and asset values restated to fair value in connection with the formation of Nevada Gold Mines on July 1, 2019. These sites are consolidated at 100%. The increase in total assets also reflects the $7.9 billion Merger. Refer to note 4 to the Financial Statements for a summary of the purchase price allocations in relation to these transactions.
Our asset base is primarily comprised of non-current assets such as property, plant and equipment and goodwill, reflecting the capital-intensive nature of the mining business and our history of growth through acquisitions. Other significant assets include production inventories, indirect taxes recoverable and receivable, concentrate sales receivables, other government transaction and joint venture related receivables, and cash and equivalents.
Total liabilities at December 31, 2019 were $14.6 billion, approximately $1.3 billion higher than at December 31, 2018, also reflecting the impact of the formation of Nevada Gold Mines and the Merger. This was combined with the resulting increase in deferred income tax liabilities. Our liabilities are primarily comprised of debt, other non-current liabilities such as provisions and deferred income tax liabilities, and accounts payable.
Shareholders’ EquityAs at 2/4/2020 Number of shares Common shares 1,777,926,611Stock options 277,732
As a result of the Merger, 583,669,178 Barrick common shares were issued to the former Randgold shareholders. On September 17, 2019, we issued 24,836,670 common shares to the minority shareholders of Acacia in exchange for their shares in Acacia.
Financial Position and LiquidityTotal cash and cash equivalents as at December 31, 2019 were $3.3 billion. Our capital structure comprises a mix of debt, non-controlling interest (primarily at Nevada Gold Mines) and shareholders’ equity. As at December 31, 2019, our total debt was $5.5 billion (debt net of cash and equivalents was $2.2 billion) and our debt-to-equity ratio was 0.19:1. This compares to debt as at December 31, 2018 of $5.7 billion (debt net of cash and cash equivalents was $4.2 billion), and a debt-to-equity ratio of 0.61:1.
On January 31, 2020, we completed a make-whole repurchase of the outstanding $337 million of principal of the 3.85% notes due 2022, which has reduced our total debt to approximately $5.2 billion subsequent to year end.
We currently have less than $40 million in debt due before 2021, and approximately $5 billion of our outstanding debt matures after 2032. In November 2019, we amended and restated the credit and guarantee agreement (the “Credit Facility”) with certain lenders, which requires such lenders to make available to us a credit facility of $3.0 billion or the equivalent amount in Canadian dollars. The Credit Facility, which is unsecured, currently has an interest rate of London Interbank Offered Rate (“LIBOR”) plus 1.25% on drawn amounts, and a commitment rate of 0.15% on undrawn amounts. As part of the amendment and restatement, the termination date of the Credit Facility was extended from January 2024 to January 2025. The Credit Facility is undrawn as at December 31, 2019.

BARRICK YEAR-END 2019 59 MANAGEMENT’S DISCUSSION AND ANALYSIS
In 2020, we have capital commitments of $155 million and expect to incur attributable sustaining and project capital expenditures of approximately $1,600 to $1,900 million in 2020 based on our guidance range on page 15. In 2020, we have $323 million in interest payments and other amounts as detailed in the table on page 61. In addition, we have contractual obligations and commitments of $473 million in purchase obligations for supplies and consumables. We expect to fund these commitments through operating cash flow, which is our primary source of liquidity, as well as existing cash balances.
Our operating cash flow is dependent on the ability of our operations to deliver projected future cash flows. The market prices of gold, and to a lesser extent copper, are the primary drivers of our operating cash flow. Other options to enhance liquidity include further portfolio optimization and the creation of new joint ventures and partnerships; issuance of equity securities in the public markets or to private investors, which could be undertaken for liquidity enhancement and/or in connection with establishing a strategic partnership; issuance of long-term debt securities in the public markets or to private investors (Moody’s and S&P currently rate Barrick’s outstanding long-term debt as investment grade, with ratings of Baa2 and BBB, respectively); and drawing on the $3.0 billion available under our undrawn Credit Facility (subject to compliance with covenants and the making of certain representations and warranties, this facility is available for drawdown as a source of financing). The key financial covenant in our undrawn Credit Facility requires Barrick to maintain a net debt to total capitalization ratio of less than 0.60:1. Barrick’s net debt to total capitalization ratio was 0.07:1 as at December 31, 2019 (0.31:1 as at December 31, 2018).
Summary of Cash Inflow (Outflow)
($ millions)For the three
months ended For the years ended 12/31/19 9/30/19 12/31/19 12/31/18 12/31/17Net cashprovided byoperatingactivities 875 1,004 2,833 1,765 2,065InvestingactivitiesCapitalexpenditures (446) (502) (1,701) (1,400) (1,396)Cash acquiredin Merger 0 0 751 0 0Divestitures 750 0 750 0 0Cash receivedfrom equitymethodinvestments 113 72 217 0 0Other (55) 47 33 (94) 1,059Total investinginflows(outflows) 362 (383) 50 (1,494) (337)FinancingactivitiesNet change in debta (6) (269) (309) (687) (1,533)Dividendsb (87) (67) (548) (125) (125)Net(disbursements)funding to non-controllinginterests (236) (31) (281) (84) (126)Other 1 (2) (1) (29) (102)Totalfinancinginflows(outflows) (328) (369) (1,139) (925) (1,886)Effect ofexchange rate 0 0 (1) (9) 3Increase(decrease) incash andequivalents 909 252 1,743 (663) (155)
a. The difference between the net change in debt on a cash basis and the net change on the balance sheet is due to changes in non-cash charges, specifically the unwinding of discounts and amortization of debt issue costs.
b. For the three months ended December 31, 2019, we declared and paid dividends in US dollars totaling $0.05 per share. For the year ended December 31, 2019, we declared and paid $0.13 and $0.20 per share to Barrick shareholders, respectively (September 30, 2019: declared and paid $0.04 per share; 2018: declared $0.19 per share and paid $0.12 per share; 2017: declared and paid $0.12 per share). Dividends paid for the year ended December 31, 2019 also includes $2.69 per share to Randgold shareholders (2018: nil; 2017: nil).
Q4 2019 compared to Q3 2019In the fourth quarter of 2019, we generated $875 million in operating cash flow, compared to $1,004 million in the prior quarter. The decrease of $129 million was primarily due to an increase in interest paid as a result of the timing of payments on our long-term debt (generally paid semi-annually). This was partially offset by an increase in gold and copper sales volumes, higher gold and copper realized prices4, and lower gold cost of sales per ounce5.
Cash inflows from investing activities in the fourth quarter of 2019 were $362 million, compared to cash outflows of $383

BARRICK YEAR-END 2019 60 MANAGEMENT’S DISCUSSION AND ANALYSIS
million in the prior quarter. The increase was primarily due to the sale of our 50% interest in Kalgoorlie for cash consideration of $750 million.
Net financing cash outflows for the fourth quarter of 2019 amounted to $328 million, compared to $369 million in the prior quarter. The decrease of $41 million is primarily due to the make-whole repurchase of our 4.95% notes due 2020 in July 2019 occurring in the prior quarter. This was partially offset by an increase in disbursements to non-controlling interests.
2019 compared to 2018In 2019, we generated $2,833 million in operating cash flow, compared to $1,765 million in the prior year. The increase of $1,068 million was primarily due to higher gold sales volume and higher gold realized prices4, partially offset by higher gold cost of sales per ounce5.
Cash inflows from investing activities for 2019 were $50 million compared to an outflow of $1,494 million in the prior year. The increase was primarily due to cash acquired of $751 million
as a result of the Merger and total cash consideration received of $750 million relating to the sale of our 50% interest in Kalgoorlie. This was combined with dividends received and shareholder loan repayments from equity method investments of $217 million, and lower investment purchases of $155 million. The investing inflows more than offset an increase in capital expenditures in the current year.
Net financing cash outflows for 2019 amounted to $1,139million, compared to $925 million in the prior year. The higher outflows are primarily due to increased dividend payments. This was due to the first quarter 2019 payment of dividends declared in the fourth quarter of 2018 by Barrick and Randgold of $67 million and $256 million, respectively. This was combined with an increase in dividends declared starting in the first quarter of 2019, reflecting Barrick’s profitability and financial strength and is in line with the commitment to shareholder returns when the Merger was announced. Net financing cash outflows were also impacted by an increase in disbursements to non-controlling interests, partially offset by lower debt repayments during the year.
Summary of Financial Instrumentsa
As at December 31, 2019
Financial Instrument Principal/Notional Amount Associated Risks
Cash and equivalents $3,314 million Accounts receivable $363 million Other investments $258 millionAccounts payable $1,155 millionDebt $5,564 millionRestricted share units $43 millionDeferred share units $9 million
a. Refer to notes 25, 26 and 28 to the Financial Statements for more information regarding financial instruments, fair value measurements and financial risk management, respectively.

BARRICK YEAR-END 2019 61 MANAGEMENT’S DISCUSSION AND ANALYSIS
COMMITMENTS AND CONTINGENCIES
Litigation and ClaimsWe are currently subject to various litigation proceedings as disclosed in note 36 to the Financial Statements, and we may be involved in disputes with other parties in the future that may result in litigation. If we are unable to resolve these disputes favorably, it may have a material adverse impact on our financial condition, cash flow and results of operations.
Contractual Obligations and Commitments
In the normal course of business, we enter into contracts that give rise to commitments for future minimum payments. The following table summarizes the remaining contractual maturities of our financial liabilities and operating and capital commitments shown on an undiscounted basis:
($ millions)Payments due
as at December 31, 2019
2020 2021 2022 2023 2024
2025and
thereafter TotalDebta
Repayment of principalb 14 7 337 0 0 5,109 5,467Capital leases 25 15 12 8 5 32 97Interest 323 321 314 307 306 4,445 6,016
Provisions for environmental rehabilitationc 169 174 193 176 143 2,103 2,958Restricted share units 28 11 3 0 0 0 42Pension benefits and other post-retirement benefits 27 7 7 7 6 99 153Minimum royalty paymentsd 27 1 1 1 1 0 31Purchase obligations for supplies and consumablese 473 229 142 142 142 553 1,681Capital commitmentsf 155 111 37 27 31 22 383Social development costsg 30 8 7 3 6 53 107Deposit on Pascua-Lama silver sale agreementh 253 0 0 0 0 0 253Total 1,524 884 1,053 671 640 12,416 17,188
a. Debt and Interest - Our debt obligations do not include any subjective acceleration clauses or other clauses that enable the holder of the debt to call for early repayment, except in the event that we breach any of the terms and conditions of the debt or for other customary events of default. We are not required to post any collateral under any debt obligations. Projected interest payments on variable rate debt were based on interest rates in effect at December 31, 2019. Interest is calculated on our long-term debt obligations using both fixed and variable rates.
b. Repayment of principal - On January 31, 2020, we completed a make-whole repurchase of the outstanding $337 million of principal of the 3.85% notes due 2022. The $337 million of principal is included in the table above.
c. Provisions for environmental rehabilitation - Amounts presented in the table represent the undiscounted uninflated future payments for the expected cost of provisions for environmental rehabilitation.
d. Minimum royalty payments are related to continuing operations and are presented net of recoverable amounts.e. Purchase obligations for supplies and consumables - Includes commitments related to new purchase obligations to secure a supply of acid, tires and cyanide for
our production process.f. Capital commitments - Purchase obligations for capital expenditures include only those items where binding commitments have been entered into. g. Social development costs – Includes a commitment of $42 million ($28 million in 2020 and $14 million in 2025 and thereafter) related to the funding of a power
transmission line in Argentina.h. Deposit on Pascua-Lama silver sale agreement - Relates to our silver sale agreement with Wheaton Precious Metals Corp. Refer to note 24 to the Financial
Statements for more information.

BARRICK YEAR-END 2019 62 MANAGEMENT’S DISCUSSION AND ANALYSIS
REVIEW OF QUARTERLY RESULTS
Quarterly Informationa
2019 2018
($ millions, except where indicated) Q4 Q3 Q2 Q1 Q4 Q3 Q2 Q1Revenues 2,883 2,678 2,063 2,093 1,904 1,837 1,712 1,790Realized price per ounce – goldb 1,483 1,476 1,317 1,307 1,223 1,216 1,313 1,332Realized price per pound – copperb 2.76 2.55 2.62 3.07 2.76 2.76 3.11 2.98Cost of sales 1,987 1,889 1,545 1,490 1,577 1,315 1,176 1,152Net earnings (loss) 1,387 2,277 194 111 (1,197) (412) (94) 158 Per share (dollars)c 0.78 1.30 0.11 0.06 (1.02) (0.35) (0.08) 0.14Adjusted net earningsb 300 264 154 184 69 89 81 170 Per share (dollars)b,c 0.17 0.15 0.09 0.11 0.06 0.08 0.07 0.15Operating cash flow 875 1,004 434 520 411 706 141 507Cash capital expenditures 446 502 379 374 374 387 313 326Free cash flowb 429 502 55 146 37 319 (172) 181
a. Sum of all the quarters may not add up to the annual total due to rounding.b. Realized price, adjusted net earnings, adjusted net earnings per share and free cash flow are non-GAAP financial performance measures with no standardized
meaning under IFRS and therefore may not be comparable to similar measures of performance presented by other issuers. For further information and a detailed reconciliation of each non-GAAP measure used in this section of the MD&A to the most directly comparable IFRS measure, please see pages 63 to 85 of this MD&A.
c. Calculated using weighted average number of shares outstanding under the basic method of earnings per share.
Our recent financial results reflect our emphasis on cost discipline and growing operating cash flow. The positive free cash flow4 generated, combined with the proceeds from various divestitures, have allowed us to continually strengthen our balance sheet over the past two years.
In the fourth quarter of 2019, we recorded $22 million (net of tax and non-controlling interests) of net impairment charges, mainly relating to a charge at Pascua-Lama of $296 million, partially offset by a net impairment reversal at Pueblo Viejo of $277 million. We also recorded a $628 million gain on the de-recognition of the deferred revenue liability relating to our silver sale agreement with Wheaton Precious Metals Corp., a gain of $408 million resulting from the sale of our 50% interest in Kalgoorlie, and a gain of $216 million on a settlement of customs duty and indirect taxes at Lumwana. In the third quarter of 2019, net earnings and cash flows were impacted by the formation of Nevada Gold Mines and the
commencement of the contribution of its operations to Barrick's net earnings and cash flows. Net earnings in the third quarter of 2019 includes a $1.5 billion (net of tax effects) gain on remeasurement of Turquoise Ridge as a result of its contribution to Nevada Gold Mines and a $663 million (net of tax effects) impairment reversal at Lumwana. Starting in the first quarter of 2019, we had an increase in sales volume due to the Merger and the commencement of the contribution of Randgold's operations to Barrick's net earnings and cash flows. In the fourth quarter of 2018, we recorded $319 million (net of tax effects and non-controlling interests) of net asset impairments primarily relating to impairments of $160 million of non-current assets and $154 million of goodwill at the Veladero mine. We also recorded in the fourth quarter of 2018 an inventory impairment of $166 million at Lagunas Norte, which was included in cost of sales. In the third quarter of 2018, we recorded a $405 million impairment charge resulting from an asset impairment at Lagunas Norte.
INTERNAL CONTROL OVER FINANCIAL REPORTING AND DISCLOSURE CONTROLS AND PROCEDURES Management is responsible for establishing and maintaining adequate internal control over financial reporting and disclosure controls and procedures. Internal control over financial reporting is a framework designed to provide reasonable assurance regarding the reliability of financial reporting and the preparation of financial statements for external purposes in accordance with IFRS. The Company’s internal control over financial reporting framework includes those policies and procedures that (i) pertain to the maintenance of records that, in reasonable detail, accurately and fairly reflect the transactions and dispositions of the assets of the Company; (ii) provide reasonable assurance that transactions are recorded as necessary to permit preparation of financial statements in accordance with IFRS, and that receipts and expenditures of the Company are being made only in accordance with authorizations of management and directors of the Company; and (iii) provide reasonable assurance regarding prevention or timely detection of
unauthorized acquisition, use or disposition of the Company’s assets that could have a material effect on the Company’s consolidated financial statements.
Disclosure controls and procedures form a broader framework designed to provide reasonable assurance that other financial information disclosed publicly fairly presents in all material respects the financial condition, results of operations and cash flows of the Company for the periods presented in this MD&A and Barrick’s Annual Report. The Company’s disclosure controls and procedures framework includes processes designed to ensure that material information relating to the Company, including its consolidated subsidiaries, is made known to management by others within those entities to allow timely decisions regarding required disclosure.
Together, the internal control over financial reporting and disclosure controls and procedures frameworks provide

BARRICK YEAR-END 2019 63 MANAGEMENT’S DISCUSSION AND ANALYSIS
internal control over financial reporting and disclosure. Due to its inherent limitations, internal control over financial reporting and disclosure may not prevent or detect all misstatements. Further, the effectiveness of internal control is subject to the risk that controls may become inadequate because of changes in conditions, or that the degree of compliance with policies or procedures may change.
There were no changes in the Company’s internal control over financial reporting during the fourth quarter of 2019 that have materially affected, or are reasonably likely to materially affect, the Company’s internal control over financial reporting.
The management of Barrick, at the direction of our President and Chief Executive Officer and Senior Executive Vice-President, Chief Financial Officer, evaluated the effectiveness of the design and operation of internal control over financial reporting as of the end of the period covered by this report
based on the framework and criteria established in Internal Control – Integrated Framework (2013) as issued by the Committee of Sponsoring Organizations of the Treadway Commission (COSO). Based on that evaluation, management concluded that the Company’s internal control over financial reporting was effective as at December 31, 2019.
Barrick’s annual management report on internal control over financial reporting and the integrated audit report of Barrick’s auditors for the year ended December 31, 2019 will be included in Barrick’s 2019 Annual Report and its 2019 Form 40-F/Annual Information Form on file with the US Securities and Exchange Commission and Canadian provincial securities regulatory authorities.
IFRS CRITICAL ACCOUNTING POLICIES AND ACCOUNTING ESTIMATES
Management has discussed the development and selection of our critical accounting estimates with the Audit Committee of the Board of Directors, and the Audit Committee has reviewed the disclosure relating to such estimates in conjunction with its review of this MD&A. The accounting policies and methods we utilize determine how we report our financial condition and results of operations, and they may require Management to make estimates or rely on assumptions about matters that are inherently uncertain. The consolidated financial statements have been prepared in accordance with IFRS as issued by the International Accounting Standards Board (“IASB”) under the historical cost convention, as modified by revaluation of certain financial assets, derivative contracts and post-retirement assets. Our significant accounting policies are disclosed in note 2 to the
Financial Statements, including a summary of current and future changes in accounting policies.
Critical Accounting Estimates and JudgmentsCertain accounting estimates have been identified as being “critical” to the presentation of our financial condition and results of operations because they require us to make subjective and/or complex judgments about matters that are inherently uncertain; or there is a reasonable likelihood that materially different amounts could be reported under different conditions or using different assumptions and estimates. Our significant accounting judgments, estimates and assumptions are disclosed in note 3 to the accompanying Financial Statements.
NON-GAAP FINANCIAL PERFORMANCE MEASURES
Adjusted Net Earnings and Adjusted Net Earnings per Share
Adjusted net earnings is a non-GAAP financial measure which excludes the following from net earnings:
• Impairment charges (reversals) related to intangibles, goodwill, property, plant and equipment, and investments;
• Acquisition/disposition gains/losses;• Foreign currency translation gains/losses;• Significant tax adjustments;• Unrealized gains/losses on non-hedge derivative
instruments; and• Tax effect and non-controlling interest of the above
items.
Management uses this measure internally to evaluate our underlying operating performance for the reporting periods presented and to assist with the planning and forecasting of future operating results. Management believes that adjusted net earnings is a useful measure of our performance because impairment charges, acquisition/disposition gains/losses and significant tax adjustments do not reflect the underlying operating performance of our core mining business and are not necessarily indicative of future operating results. Furthermore, foreign currency translation gains/losses and unrealized gains/losses from non-hedge derivatives are not necessarily reflective of the underlying operating results for the reporting periods presented. The tax effect and non-controlling interest of the adjusting items are also excluded
to reconcile the amounts to Barrick’s share on a post-tax basis, consistent with net earnings.
As noted, we use this measure for internal purposes. Management’s internal budgets and forecasts and public guidance do not reflect the types of items we adjust for. Consequently, the presentation of adjusted net earnings enables investors and analysts to better understand the underlying operating performance of our core mining business through the eyes of management. Management periodically evaluates the components of adjusted net earnings based on an internal assessment of performance measures that are useful for evaluating the operating performance of our business segments and a review of the non-GAAP measures used by mining industry analysts and other mining companies.
Adjusted net earnings is intended to provide additional information only and does not have any standardized definition under IFRS and should not be considered in isolation or as a substitute for measures of performance prepared in accordance with IFRS. The measures are not necessarily indicative of operating profit or cash flow from operations as determined under IFRS. Other companies may calculate these measures differently. The following table reconciles these non-GAAP measures to the most directly comparable IFRS measure.

BARRICK YEAR-END 2019 64 MANAGEMENT’S DISCUSSION AND ANALYSIS
Reconciliation of Net Earnings to Net Earnings per Share, Adjusted Net Earnings and Adjusted Net Earnings per Share
($ millions, except per share amounts in dollars) For the three months ended For the years ended 12/31/19 9/30/19 12/31/19 12/31/18 12/31/17
Net earnings (loss) attributable to equity holders of the Company 1,387 2,277 3,969 (1,545) 1,438Impairment charges (reversals) related to long-lived assetsa (566) (872) (1,423) 900 (212)Acquisition/disposition (gains) lossesb (414) (1,901) (2,327) (68) (911)(Gain) loss on currency translation 53 40 109 136 72Significant tax adjustmentsc 74 35 34 742 244Other (income) expense adjustmentsd (845) 53 (687) 366 178Unrealized gains (losses) on non-hedge derivative instruments 0 1 0 1 (1)Tax effect and non-controlling intereste 611 631 1,227 (123) 68Adjusted net earnings 300 264 902 409 876Net earnings (loss) per sharef 0.78 1.30 2.26 (1.32) 1.23Adjusted net earnings per sharef 0.17 0.15 0.51 0.35 0.75
a. Net impairment reversals for the current year primarily relate to non-current asset reversals at Pueblo Viejo, partially offset by impairment charges at Pascua-Lama in the fourth quarter of 2019. This was further impacted by non-current asset reversals at Lumwana in the third quarter of 2019. Net impairment charges for 2018 primarily relate to non-current asset impairments at Lagunas Norte and non-current asset and goodwill impairments at Veladero.
b. Acquisition/disposition gains for the current year primarily relate to the gain on the sale of our 50% interest in Kalgoorlie in the fourth quarter of 2019 and the gain on the remeasurement of Turquoise Ridge to fair value as a result of its contribution to Nevada Gold Mines in the third quarter of 2019.
c. Significant tax adjustments in 2018 primarily relate to the de-recognition of our Canadian and Peruvian deferred tax assets.d. Other expense adjustments for the current year primarily relate to the gain on the de-recognition of the deferred revenue liability relating to our silver sale agreement
with Wheaton Precious Metals Corp. and the gain on a settlement of customs duty and indirect taxes at Lumwana, both occurring in the fourth quarter of 2019. e. Tax effect and non-controlling interest for the current year primarily relates to the impairment charges related to long-lived assets.f. Calculated using weighted average number of shares outstanding under the basic method of earnings per share.
Free Cash FlowFree cash flow is a measure that deducts capital expenditures from net cash provided by operating activities. Management believes this to be a useful indicator of our ability to operate without reliance on additional borrowing or usage of existing cash.
Free cash flow is intended to provide additional information only and does not have any standardized definition under
IFRS, and should not be considered in isolation or as a substitute for measures of performance prepared in accordance with IFRS. The measure is not necessarily indicative of operating profit or cash flow from operations as determined under IFRS. Other companies may calculate this measure differently. The following table reconciles this non-GAAP measure to the most directly comparable IFRS measure.
Reconciliation of Net Cash Provided by Operating Activities to Free Cash Flow ($ millions) For the three months ended For the years ended
12/31/19 9/30/19 12/31/19 12/31/18 12/31/17Net cash provided by operating activities 875 1,004 2,833 1,765 2,065Capital expenditures (446) (502) (1,701) (1,400) (1,396)Free cash flow 429 502 1,132 365 669

BARRICK YEAR-END 2019 65 MANAGEMENT’S DISCUSSION AND ANALYSIS
Total cash costs per ounce, All-in sustaining costs per ounce, All-in costs per ounce, C1 cash costs per pound and All-in sustaining costs per pound
Total cash costs per ounce, all-in sustaining costs per ounce and all-in costs per ounce are non-GAAP financial measures which are calculated based on the definition published by the World Gold Council (a market development organization for the gold industry comprised of and funded by 25 gold mining companies from around the world, including Barrick). The WGC is not a regulatory organization. Management uses these measures to monitor the performance of our gold mining operations and its ability to generate positive cash flow, both on an individual site basis and an overall company basis.
Total cash costs start with our cost of sales related to gold production and removes depreciation, the non-controlling interest of cost of sales and includes by-product credits. All-in sustaining costs start with total cash costs and include sustaining capital expenditures, sustaining leases, general and administrative costs, minesite exploration and evaluation costs and reclamation cost accretion and amortization. These additional costs reflect the expenditures made to maintain current production levels.
Starting from the first quarter of 2019, we have renamed "cash costs" to "total cash costs" when referring to our gold operations. The calculation of total cash costs is identical to our previous calculation of cash costs with only a change in the naming convention of this non-GAAP measure.
All-in costs starts with all-in sustaining costs and adds additional costs that reflect the varying costs of producing gold over the life-cycle of a mine, including: project capital expenditures (capital expenditures at new projects and discrete projects at existing operations intended to increase production capacity and will not benefit production for at least 12 months) and other non-sustaining costs (primarily non-sustaining leases, exploration and evaluation costs, community relations costs and general and administrative costs that are not associated with current operations). These definitions recognize that there are different costs associated with the life-cycle of a mine, and that it is therefore appropriate to distinguish between sustaining and non-sustaining costs.
Starting from the first quarter of 2019, we have included sustaining capital expenditures and project capital expenditures on a cash basis instead of an accrual basis. As a result of adopting IFRS 16 Leases, the full lease amount is included in accrued capital expenditures on initial recognition. We believe that the change in capital expenditures from an accrual basis to a cash basis better reflects the timing of costs associated with our operations. The original World Gold Council ("WGC") Guidance Note explicitly excluded certain financing activities from all-in sustaining costs and all-in costs. As a result of the new lease accounting standard, the WGC Guidance Note was updated to include both the principal and interest portion of the cash lease payment in the all-in sustaining costs and all-in cost metrics. We have updated our calculation accordingly. Prior periods have not been restated but would not be materially different.
We believe that our use of total cash costs, all-in sustaining costs and all-in costs will assist analysts, investors and other stakeholders of Barrick in understanding the costs associated with producing gold, understanding the economics of gold mining, assessing our operating performance and also our ability to generate free cash flow from current operations and to generate free cash flow on an overall company basis. Due to the capital-intensive nature of the industry and the long useful lives over which these items are depreciated, there can be a significant timing difference between net earnings calculated in accordance with IFRS and the amount of free cash flow that is being generated by a mine and therefore we believe these measures are useful non-GAAP operating metrics and supplement our IFRS disclosures. These measures are not representative of all of our cash expenditures as they do not include income tax payments, interest costs or dividend payments. These measures do not include depreciation or amortization.
Total cash costs per ounce, all-in sustaining costs and all-in costs are intended to provide additional information only and do not have standardized definitions under IFRS and should not be considered in isolation or as a substitute for measures of performance prepared in accordance with IFRS. These measures are not equivalent to net income or cash flow from operations as determined under IFRS. Although the WGC has published a standardized definition, other companies may calculate these measures differently.
In addition to presenting these metrics on a by-product basis, we have calculated these metrics on a co-product basis. Our co-product metrics remove the impact of other metal sales that are produced as a by-product of our gold production from cost per ounce calculations but does not reflect a reduction in costs for costs associated with other metal sales.
C1 cash costs per pound and all-in sustaining costs per pound are non-GAAP financial measures related to our copper mine operations. We believe that C1 cash costs per pound enables investors to better understand the performance of our copper operations in comparison to other copper producers who present results on a similar basis. C1 cash costs per pound excludes royalties and production taxes and non-routine charges as they are not direct production costs. All-in sustaining costs per pound is similar to the gold all-in sustaining costs metric and management uses this to better evaluate the costs of copper production. We believe this measure enables investors to better understand the operating performance of our copper mines as this measure reflects all of the sustaining expenditures incurred in order to produce copper. All-in sustaining costs per pound includes C1 cash costs, sustaining capital expenditures, sustaining leases, general and administrative costs, minesite exploration and evaluation costs, royalties and production taxes, reclamation cost accretion and amortization and write-downs taken on inventory to net realizable value.
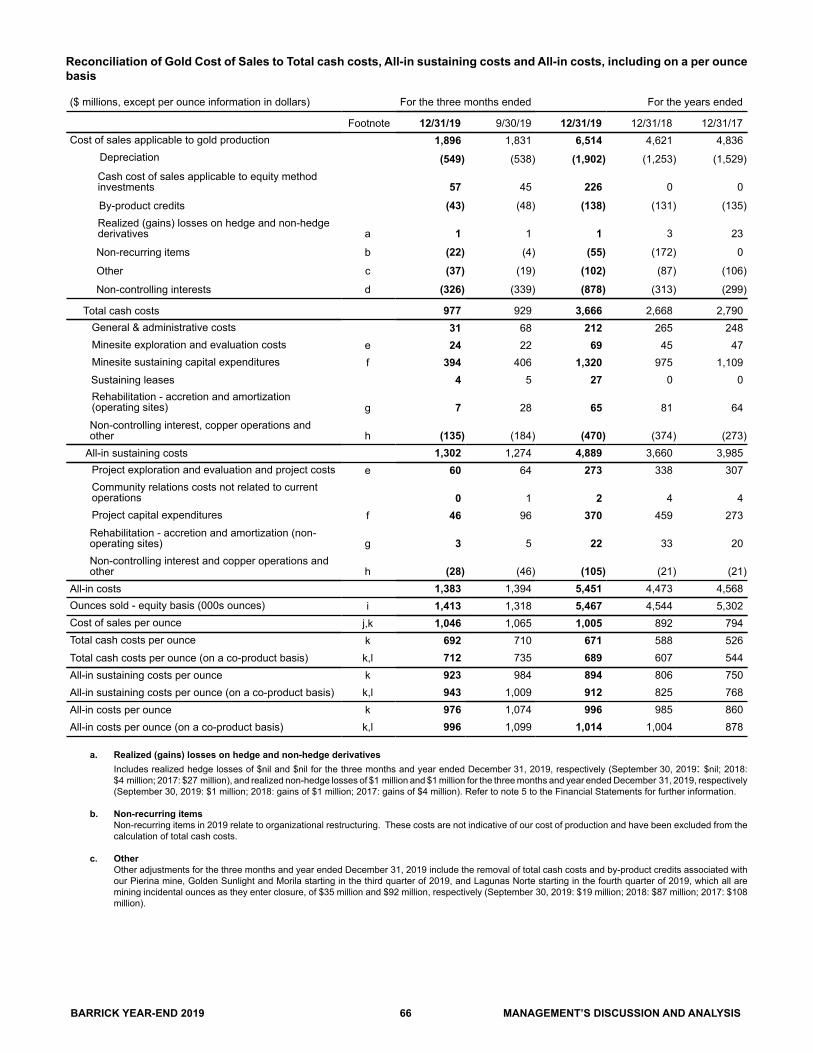
BARRICK YEAR-END 2019 66 MANAGEMENT’S DISCUSSION AND ANALYSIS
Reconciliation of Gold Cost of Sales to Total cash costs, All-in sustaining costs and All-in costs, including on a per ounce basis
($ millions, except per ounce information in dollars) For the three months ended For the years ended
Footnote 12/31/19 9/30/19 12/31/19 12/31/18 12/31/17Cost of sales applicable to gold production 1,896 1,831 6,514 4,621 4,836
Depreciation (549) (538) (1,902) (1,253) (1,529)Cash cost of sales applicable to equity methodinvestments 57 45 226 0 0
By-product credits (43) (48) (138) (131) (135)Realized (gains) losses on hedge and non-hedgederivatives a 1 1 1 3 23
Non-recurring items b (22) (4) (55) (172) 0
Other c (37) (19) (102) (87) (106)
Non-controlling interests d (326) (339) (878) (313) (299)
Total cash costs 977 929 3,666 2,668 2,790 General & administrative costs 31 68 212 265 248
Minesite exploration and evaluation costs e 24 22 69 45 47Minesite sustaining capital expenditures f 394 406 1,320 975 1,109Sustaining leases 4 5 27 0 0Rehabilitation - accretion and amortization(operating sites) g 7 28 65 81 64Non-controlling interest, copper operations andother h (135) (184) (470) (374) (273)
All-in sustaining costs 1,302 1,274 4,889 3,660 3,985Project exploration and evaluation and project costs e 60 64 273 338 307Community relations costs not related to currentoperations 0 1 2 4 4Project capital expenditures f 46 96 370 459 273Rehabilitation - accretion and amortization (non-operating sites) g 3 5 22 33 20Non-controlling interest and copper operations andother h (28) (46) (105) (21) (21)
All-in costs 1,383 1,394 5,451 4,473 4,568Ounces sold - equity basis (000s ounces) i 1,413 1,318 5,467 4,544 5,302Cost of sales per ounce j,k 1,046 1,065 1,005 892 794Total cash costs per ounce k 692 710 671 588 526Total cash costs per ounce (on a co-product basis) k,l 712 735 689 607 544All-in sustaining costs per ounce k 923 984 894 806 750All-in sustaining costs per ounce (on a co-product basis) k,l 943 1,009 912 825 768All-in costs per ounce k 976 1,074 996 985 860All-in costs per ounce (on a co-product basis) k,l 996 1,099 1,014 1,004 878
a. Realized (gains) losses on hedge and non-hedge derivativesIncludes realized hedge losses of $nil and $nil for the three months and year ended December 31, 2019, respectively (September 30, 2019: $nil; 2018: $4 million; 2017: $27 million), and realized non-hedge losses of $1 million and $1 million for the three months and year ended December 31, 2019, respectively (September 30, 2019: $1 million; 2018: gains of $1 million; 2017: gains of $4 million). Refer to note 5 to the Financial Statements for further information.
b. Non-recurring itemsNon-recurring items in 2019 relate to organizational restructuring. These costs are not indicative of our cost of production and have been excluded from the calculation of total cash costs.
c. OtherOther adjustments for the three months and year ended December 31, 2019 include the removal of total cash costs and by-product credits associated with our Pierina mine, Golden Sunlight and Morila starting in the third quarter of 2019, and Lagunas Norte starting in the fourth quarter of 2019, which all are mining incidental ounces as they enter closure, of $35 million and $92 million, respectively (September 30, 2019: $19 million; 2018: $87 million; 2017: $108 million).

BARRICK YEAR-END 2019 67 MANAGEMENT’S DISCUSSION AND ANALYSIS
d. Non-controlling interests Non-controlling interests include non-controlling interests related to gold production of $477 million and $1,306 million, respectively, for the three months and year ended December 31, 2019 (September 30, 2019: $506 million; 2018: $453 million; 2017: $454 million). Non-controlling interests include Pueblo Viejo and Tanzania until September 30, 2019 (notwithstanding the completion of the Acacia transaction on September 17, 2019, we consolidated our interest in Acacia and recorded a non-controlling interest of 36.1% in the income statement for the entirety of the third quarter of 2019 as a matter of convenience). Starting January 1, 2019, the effective date of the Merger, non-controlling interests also include Loulo-Gounkoto and Tongon and starting July 1, 2019, it also includes Nevada Gold Mines. Refer to note 5 to the Financial Statements for further information.
e. Exploration and evaluation costsExploration, evaluation and project expenses are presented as minesite if it supports current mine operations and project if it relates to future projects. Refer to page 54 of this MD&A.
f. Capital expendituresCapital expenditures are related to our gold sites only and are presented on a 100% cash basis starting from January 1, 2019 and on a 100% accrued basis for 2018 and 2017. They are split between minesite sustaining and project capital expenditures. Project capital expenditures are distinct projects designed to increase the net present value of the mine and are not related to current production. Significant projects in the current year are stripping at Rangefront declines, Cortez Crossroads, the Goldrush exploration declines, the Deep South Expansion, and construction of the third shaft at Turquoise Ridge. Refer to page 53 of this MD&A.
g. Rehabilitation - accretion and amortizationIncludes depreciation on the assets related to rehabilitation provisions of our gold operations and accretion on the rehabilitation provisions of our gold operations, split between operating and non-operating sites.
h. Non-controlling interest and copper operationsRemoves general & administrative costs related to non-controlling interests and copper based on a percentage allocation of revenue. Also removes exploration, evaluation and project expenses, rehabilitation costs and capital expenditures incurred by our copper sites and the non-controlling interest of our Tanzania operations until September 30, 2019 (notwithstanding the completion of the Acacia transaction on September 17, 2019, we consolidated our interest in Acacia and recorded a non-controlling interest of 36.1% in the income statement for the entirety of the third quarter of 2019 as a matter of convenience) and Pueblo Viejo and South Arturo (63.1% of South Arturo from July 1, 2019 onwards as a result of its contribution to Nevada Gold Mines). Also removes the non-controlling interest of our Loulo-Gounkoto and Tongon operating segments commencing January 1, 2019, the effective date of the Merger, and of Nevada Gold Mines starting July 1, 2019. It also includes capital expenditures applicable to equity method investments. Figures remove the impact of Pierina, Golden Sunlight and Morila starting in the third quarter of 2019, and Lagunas Norte starting in the fourth quarter of 2019. The impact is summarized as the following:
($ millions) For the three months ended For the years ended Non-controlling interest, copper operations and other 12/31/19 9/30/19 12/31/19 12/31/18 12/31/17
General & administrative costs (3) (22) (58) (104) (21)Minesite exploration and evaluation costs (6) (9) (16) (3) (12)Rehabilitation - accretion and amortization (operating sites) (1) (10) (13) (6) (10)
Minesite sustaining capital expenditures (125) (143) (383) (261) (230)
All-in sustaining costs total (135) (184) (470) (374) (273)
Project exploration and evaluation and project costs (14) (12) (54) (16) (17)Project capital expenditures (14) (34) (51) (5) (4)
All-in costs total (28) (46) (105) (21) (21)
i. Ounces sold - equity basis Figures remove the impact of Pierina, Golden Sunlight and Morila starting in the third quarter of 2019, and Lagunas Norte starting in the fourth quarter of
2019, which are mining incidental ounces as the sites enter closure.
j. Cost of sales per ounceFigures remove the cost of sales impact of Pierina of $14 million and $113 million, respectively, for the three months and year ended December 31, 2019 (September 30, 2019: $28 million; 2018: $116 million; 2017: $174 million); starting in the third quarter of 2019, Golden Sunlight of $nil and $1 million, respectively, for the three months and year ended December 31, 2019 (September 30, 2019: $1 million; 2018: $nil; 2017: $nil) and Morila of $13 million and $23 million, respectively, for the three months and year ended December 31, 2019 (September 30, 2019: $10 million; 2018: $nil; 2017: $nil); and starting in the fourth quarter of 2019, Lagunas Norte of $26 million and $26 million, respectively, for the three months and year ended December 31, 2019 (September 30, 2019: $nil; 2018: $nil; 2017: $nil), which are mining incidental ounces as these sites enter closure. Cost of sales per ounce excludes non-controlling interest related to gold production. Cost of sales applicable to gold per ounce is calculated using cost of sales on an attributable basis (removing the non-controlling interest of 40% Pueblo Viejo, 36.1% Tanzania until September 30, 2019 (notwithstanding the completion of the Acacia transaction on September 17, 2019, we consolidated our interest in Acacia and recorded a non-controlling interest of 36.1% in the income statement for the entirety of the third quarter of 2019 as a matter of convenience) and 40% South Arturo from cost of sales (63.1% of South Arturo from July 1, 2019 onwards as a result of its contribution to Nevada Gold Mines)), divided by attributable gold ounces. The non-controlling interest of 20% Loulo-Gounkoto and 10.3% of Tongon is also removed from cost of sales and our proportionate share of cost of sales attributable to equity method investments (Kibali and Morila) is included commencing January 1, 2019, the effective date of the Merger. Also removes the non-controlling interest of 38.5% Nevada Gold Mines from cost of sales from July 1, 2019 onwards.
k. Per ounce figuresCost of sales per ounce, cash costs per ounce, all-in sustaining costs per ounce and all-in costs per ounce may not calculate based on amounts presented in this table due to rounding.
l. Co-product costs per ounceCash costs per ounce, all-in sustaining costs per ounce and all-in costs per ounce presented on a co-product basis remove the impact of by-product credits of our gold production (net of non-controlling interest) calculated as:
($ millions) For the three months ended For the years ended
12/31/19 9/30/19 12/31/19 12/31/18 12/31/17
By-product credits 43 48 138 131 135
Non-controlling interest (17) (16) (48) (45) (30)
By-product credits (net of non-controlling interest) 26 32 90 86 105

BARRICK YEAR-END 2019 68 MANAGEMENT’S DISCUSSION AND ANALYSIS
Reconciliation of Gold Cost of Sales to Total cash costs, All-in sustaining costs and All-in costs, including on a per ounce basis, by operating segment
($ millions, except per ounce information in dollars) For the three months ended 12/31/19
Footnote Carlina CortezbTurquoise
RidgecLong
Canyond PhoenixdNevada
Gold Minese HemloPueblo
Viejo VeladeroCost of sales applicable togold production 436 202 155 55 86 934 87 189 82
Depreciation (92) (58) (55) (38) (22) (265) (7) (55) (29)
By-product credits 0 0 (1) 0 (26) (27) 0 (12) (3)
Non-recurring items f (1) 0 0 0 0 (1) (21) (1) 0Other 0 0 0 0 0 0 0 0 0Non-controlling interests (132) (54) (38) (7) (14) (245) 0 (48) 0
Total cash costs 211 90 61 10 24 396 59 73 50General & administrativecosts 0 0 0 0 0 0 0 0 0Minesite exploration andevaluation costs g 8 3 1 3 1 16 0 0 1Minesite sustainingcapital expenditures h 92 65 29 17 8 211 15 23 28Sustaining leases 0 0 0 0 0 0 1 0 0Rehabilitation - accretionand amortization(operating sites) i 0 4 (1) (1) (2) 0 0 4 1Non-controlling interests (45) (29) (9) (7) (4) (94) 0 (11) 0
All-in sustaining costs 266 133 81 22 27 529 75 89 80Project exploration andevaluation and projectcosts g 0 0 0 0 0 0 0 6 0Project capitalexpenditures h 0 6 11 0 0 38 0 0 0Non-controlling interests 0 (3) (5) 0 0 (17) 0 (3) 0
All-in costs 266 136 87 22 27 550 75 92 80Ounces sold - equity basis(000s ounces) 275 132 99 33 26 565 53 174 70Cost of sales per ounce j,k 975 945 971 1,026 2,025 1,038 1,632 660 1,138Total cash costs per ounce k 766 681 625 317 902 711 1,091 422 710Total cash costs per ounce(on a co-product basis) k,l 767 684 632 319 1,504 760 1,094 462 733All-in sustaining costs perounce k 965 1,012 800 657 1,034 944 1,380 517 1,142All-in sustaining costs perounce (on a co-productbasis) k,l 966 1,015 807 659 1,636 993 1,383 557 1,165
All-in costs per ounce k 965 1,039 863 657 1,034 982 1,384 525 1,142All-in costs per ounce (on aco-product basis) k,l 966 1,042 870 659 1,636 1,031 1,387 565 1,165

BARRICK YEAR-END 2019 69 MANAGEMENT’S DISCUSSION AND ANALYSIS
($ millions, except per ounce information in dollars) For the three months ended 12/31/19
Footnote Porgera KalgoorliemLoulo-
Gounkoto KibaliNorth Maran Tongon Bulyanhulun Buzwagin
Cost of sales applicable togold production 75 44 186 106 105 99 12 31
Depreciation (12) (6) (73) (52) (35) (45) (5) (2) By-product credits (1) (1) 0 (1) (1) (1) 0 0 Non-recurring items f 0 0 0 0 0 0 0 0
Other 0 0 0 0 0 0 0 0Non-controlling interests 0 0 (22) 0 0 (6) 0 0
Total cash costs 62 37 91 53 69 47 7 29General & administrativecosts 0 0 0 0 0 0 0 0Minesite exploration andevaluation costs g 1 2 5 2 0 1 0 0Minesite sustainingcapital expenditures h 11 6 46 9 15 3 1 0Sustaining leases 1 0 0 1 0 1 0 1Rehabilitation - accretionand amortization(operating sites) i (1) 1 1 0 1 0 0 0Non-controlling interests 0 0 (11) 0 0 (1) 0 0
All-in sustaining costs 74 46 132 65 85 51 8 30Project exploration andevaluation and projectcosts g 0 0 0 0 0 0 0 0Project capitalexpenditures h 0 0 1 0 1 0 1 0Non-controlling interests 0 0 0 0 0 0 0 0
All-in costs 74 46 133 65 86 51 9 30Ounces sold - equity basis(000s ounces) 82 39 144 89 103 59 9 26Cost of sales per ounce j,k 909 1,127 1,037 1,205 1,021 1,476 1,293 1,235Total cash costs per ounce k 757 940 631 608 675 803 752 1,144Total cash costs per ounce(on a co-product basis) k,l 765 943 631 611 687 805 805 1,161All-in sustaining costs perounce k 894 1,172 917 740 830 867 909 1,169All-in sustaining costs perounce (on a co-productbasis) k,l 902 1,175 917 743 842 869 962 1,186All-in costs per ounce k 894 1,172 922 746 840 867 935 1,169All-in costs per ounce (ona co-product basis) k,l 902 1,175 922 749 852 869 988 1,186

BARRICK YEAR-END 2019 70 MANAGEMENT’S DISCUSSION AND ANALYSIS
($ millions, except per ounce information in dollars) For the three months ended 9/30/19
Footnote Carlina CortezbTurquoise
RidgecLong
Canyond PhoenixdNevada Gold
Minese HemloPueblo
Viejo VeladeroCost of sales applicable togold production 445 170 168 46 68 897 55 181 72
Depreciation (101) (53) (70) (32) (14) (270) (6) (48) (25)
By-product credits (1) (1) (1) 0 (22) (25) (1) (17) (1)
Non-recurring items f 0 0 0 0 0 0 (1) 0 0Other 0 0 0 0 0 0 0 0 0Non-controlling interests (133) (45) (37) (5) (13) (233) 0 (48) 0
Total cash costs 210 71 60 9 19 369 47 68 46General & administrativecosts 0 0 0 0 0 0 0 0 0Minesite exploration andevaluation costs g 5 2 2 3 0 12 0 0 1Minesite sustainingcapital expenditures h 102 36 27 9 14 188 15 27 19Sustaining leases 0 0 1 0 0 1 0 0 1Rehabilitation - accretionand amortization(operating sites) i 8 4 3 1 4 20 1 3 1Non-controlling interests (48) (15) (12) (5) (6) (86) 0 (12) 0
All-in sustaining costs 277 98 81 17 31 504 63 86 68Project exploration andevaluation and projectcosts g 0 0 0 0 0 0 0 0 0Project capitalexpenditures h 0 49 13 0 0 85 0 0 0Non-controlling interests 0 (18) (5) 0 0 (31) 0 0 0
All-in costs 277 129 89 17 31 558 63 86 68Ounces sold - equity basis(000s ounces) 272 126 96 24 19 537 50 136 59
Cost of sales per ounce j,k 1,007 829 1,077 1,170 2,186 1,027 1,083 807 1,243Total cash costs per ounce k 775 570 622 353 1,010 693 953 504 773Total cash costs per ounce(on a co-product basis) k,l 776 571 622 355 1,734 694 956 587 799All-in sustaining costs perounce k 1,014 772 840 714 1,622 946 1,280 631 1,142All-in sustaining costs perounce (on a co-productbasis) k,l 1,015 773 840 716 2,346 947 1,283 714 1,168
All-in costs per ounce k 1,014 1,020 927 714 1,622 1,048 1,280 636 1,142All-in costs per ounce (on aco-product basis) k,l 1,015 1,021 927 716 2,346 1,049 1,283 719 1,168

BARRICK YEAR-END 2019 71 MANAGEMENT’S DISCUSSION AND ANALYSIS
($ millions, except per ounce information in dollars) For the three months ended 9/30/19
Footnote Porgera KalgoorliemLagunas
NorteoLoulo-
Gounkoto KibaliNorth Maran Tongon Bulyanhulun Buzwagin
Cost of sales applicable togold production 77 60 54 199 107 52 102 11 35
Depreciation (11) (10) (5) (76) (57) (17) (44) (5) (2) By-product credits (1) 0 (2) 0 0 (1) 0 0 0 Non-recurring items f 0 0 (3) 0 0 0 0 0 0
Other 0 0 0 0 0 0 0 0 0Non-controlling interests 0 0 0 (25) 0 (13) (6) (2) (12)
Total cash costs 65 50 44 98 50 21 52 4 21General & administrativecosts 0 0 0 0 0 0 0 0 0Minesite exploration andevaluation costs g 0 2 1 3 0 0 0 0 0Minesite sustainingcapital expenditures h 14 15 0 60 13 14 4 0 0Sustaining leases 1 1 0 2 0 0 1 0 0Rehabilitation - accretionand amortization(operating sites) i (1) 0 2 0 0 1 0 0 0Non-controlling interests 0 0 0 (13) 0 (5) 0 0 0
All-in sustaining costs 79 68 47 150 63 31 57 4 21Project exploration andevaluation and projectcosts g 0 0 0 0 0 0 0 0 0Project capitalexpenditures h 0 0 0 1 1 1 0 1 0Non-controlling interests 0 0 0 (1) 0 0 0 0 0
All-in costs 79 68 47 150 64 32 57 5 21Ounces sold - equity basis(000s ounces) 75 58 33 155 89 36 66 5 18Cost of sales per ounce j,k 1,024 1,037 1,661 1,018 1,187 907 1,396 1,288 1,292Total cash costs per ounce k 868 856 1,327 630 554 603 793 729 1,202Total cash costs per ounce(on a co-product basis) k,l 878 859 1,374 630 554 608 795 754 1,210All-in sustaining costs perounce k 1,053 1,170 1,422 966 703 850 869 769 1,220All-in sustaining costs perounce (on a co-productbasis) k,l 1,063 1,173 1,469 966 703 855 871 794 1,228All-in costs per ounce k 1,053 1,170 1,422 971 717 886 869 866 1,220All-in costs per ounce (ona co-product basis) k,l 1,063 1,173 1,469 971 717 891 871 891 1,228

BARRICK YEAR-END 2019 72 MANAGEMENT’S DISCUSSION AND ANALYSIS
($ millions, except per ounce information in dollars) For the year ended 12/31/19
Footnote Carlina CortezbTurquoise
RidgecLong
Canyond PhoenixdNevada Gold
Minese HemloNorth
AmericaCost of sales applicable to goldproduction 1,310 751 425 101 154 2,741 247 2,988
Depreciation (312) (240) (140) (70) (36) (798) (27) (825)
By-product credits (1) (1) (2) 0 (48) (52) (1) (53)
Non-recurring items f (10) 0 0 0 0 (10) (23) (33)Other 0 0 0 0 0 0 0 0Non-controlling interests (266) (99) (75) (12) (27) (479) 0 (479)
Total cash costs 721 411 208 19 43 1,402 196 1,598General & administrativecosts 0 0 0 0 0 0 0 0Minesite exploration andevaluation costs g 17 8 4 6 1 36 1 37Minesite sustaining capitalexpenditures h 307 129 70 26 22 554 47 601Sustaining leases 0 0 1 0 0 1 1 2Rehabilitation - accretion andamortization (operating sites) i 10 16 2 0 2 30 2 32Non-controlling interests (102) (44) (21) (12) (10) (189) 0 (189)
All-in sustaining costs 953 520 264 39 58 1,834 247 2,081Project exploration andevaluation and project costs g 0 0 0 0 0 0 0 0Project capital expenditures h 0 186 45 0 0 295 0 295Non-controlling interests 0 (21) (10) 0 0 (48) 0 (48)
All-in costs 953 685 299 39 58 2,081 247 2,328Ounces sold - equity basis(000s ounces) 967 798 356 57 45 2,223 217 2,440Cost of sales per ounce j,k 1,004 762 846 1,088 2,093 924 1,137 943Total cash costs per ounce k 746 515 585 333 947 634 904 655Total cash costs per ounce (ona co-product basis) k,l 747 516 588 335 1,600 657 907 677All-in sustaining costs perounce k 984 651 732 681 1,282 828 1,140 851All-in sustaining costs perounce (on a co-product basis) k,l 985 652 735 683 1,935 851 1,143 873
All-in costs per ounce k 984 854 834 681 1,282 938 1,141 953All-in costs per ounce (on a co-product basis) k,l 985 855 837 683 1,935 961 1,144 975

BARRICK YEAR-END 2019 73 MANAGEMENT’S DISCUSSION AND ANALYSIS
($ millions, except per ounce information in dollars) For the year ended 12/31/19
Footnote Pueblo Viejo Veladero Porgera KalgoorliemLatin America &
Asia PacificCost of sales applicable to goldproduction 721 323 284 223 1,551
Depreciation (196) (115) (42) (38) (391) By-product credits (61) (8) (3) (1) (73) Non-recurring items f (2) (1) 0 0 (3)
Other 0 0 0 0 0Non-controlling interests (187) 0 0 0 (187)
Total cash costs 275 199 239 184 897General & administrativecosts 0 0 0 0 0Minesite exploration andevaluation costs g 0 3 2 6 11Minesite sustaining capitalexpenditures h 107 91 45 52 295Sustaining leases 0 2 3 4 9Rehabilitation - accretion andamortization (operating sites) i 10 5 (2) 3 16Non-controlling interests (47) 0 0 0 (47)
All-in sustaining costs 345 300 287 249 1,181Project exploration andevaluation and project costs g 8 0 0 0 8Project capital expenditures h 0 15 0 0 15Non-controlling interests (3) 0 0 0 (3)
All-in costs 350 315 287 249 1,201Ounces sold - equity basis(000s ounces) 584 271 285 210 1,350Cost of sales per ounce j,k 747 1,188 994 1,062 937Total cash costs per ounce k 471 734 838 873 664Total cash costs per ounce (ona co-product basis) k,l 536 759 848 876 716All-in sustaining costs perounce k 592 1,105 1,003 1,183 874All-in sustaining costs perounce (on a co-product basis) k,l 657 1,130 1,013 1,186 926All-in costs per ounce k 600 1,162 1,003 1,183 885All-in costs per ounce (on a co-product basis) k,l 665 1,187 1,013 1,186 937

BARRICK YEAR-END 2019 74 MANAGEMENT’S DISCUSSION AND ANALYSIS
($ millions, except per ounce information in dollars) For the year ended 12/31/19
FootnoteLoulo-
Gounkoto KibaliNorth Maran Tongon Bulyanhulun Buzwagin
Africa & MiddleEast
Cost of sales applicable to goldproduction 751 403 310 402 45 138 2,049
Depreciation (295) (196) (97) (186) (19) (8) (801) By-product credits 0 (1) (2) (1) (1) (1) (6) Non-recurring items f 0 0 0 0 0 0 0
Other 0 0 0 0 0 0 0Non-controlling interests (91) 0 (51) (23) (7) (36) (208)
Total cash costs 365 206 160 192 18 93 1,034General & administrativecosts 0 0 0 0 0 0 0Minesite exploration andevaluation costs g 12 3 0 3 0 0 18Minesite sustaining capitalexpenditures h 165 41 48 11 2 0 267Sustaining leases 3 1 0 2 0 1 7Rehabilitation - accretion andamortization (operating sites) i 1 0 3 0 1 1 6Non-controlling interests (37) 0 (13) (2) (1) 0 (53)
All-in sustaining costs 509 251 198 206 20 95 1,279Project exploration andevaluation and project costs g 0 0 0 0 0 0 0Project capital expenditures h 4 2 9 0 3 0 18Non-controlling interests (1) 0 (3) 0 (1) 0 (5)
All-in costs 512 253 204 206 22 95 1,292Ounces sold - equity basis(000s ounces) 575 363 248 245 27 81 1,539Cost of sales per ounce j,k 1,044 1,111 953 1,469 1,207 1,240 1,332Total cash costs per ounce k 634 568 646 787 676 1,156 673Total cash costs per ounce (ona co-product basis) k,l 634 571 654 789 709 1,166 677All-in sustaining costs perounce k 886 693 802 844 773 1,178 834All-in sustaining costs perounce (on a co-product basis) k,l 886 696 810 846 806 1,188 838All-in costs per ounce k 891 701 824 846 840 1,178 842All-in costs per ounce (on a co-product basis) k,l 891 704 832 848 873 1,188 846

BARRICK YEAR-END 2019 75 MANAGEMENT’S DISCUSSION AND ANALYSIS
($ millions, except per ounce information in dollars) For the year ended 12/31/18
Footnote Carlina CortezbTurquoise
RidgecLong
Canyond PhoenixdNevada
Gold Minese HemloGolden
SunlightoPueblo
Viejo VeladeroCost of sales applicableto gold production 886 828 206 1,921 195 53 732 310
Depreciation (262) (386) (28) (677) (18) 0 (185) (121)
By-product credits (1) (1) 0 (2) (1) 0 (90) (8)
Non-recurring items f 0 0 0 0 0 0 (2) (4)Other 0 0 0 0 0 0 2 0Non-controllinginterests 0 0 0 0 0 0 (183) 0
Total cash costs 623 441 178 1,242 176 53 274 177General &administrative costs 0 0 0 0 0 0 0 0Minesite explorationand evaluation costs g 13 6 0 19 0 0 0 2Minesite sustainingcapital expenditures h 195 65 20 280 42 3 145 143Sustaining leases 0 0 0 0 0 0 0 0Rehabilitation -accretion andamortization(operating sites) i 5 25 1 31 4 3 10 1Non-controllinginterests (10) 0 0 (10) 0 0 (62) 0
All-in sustaining costs 826 537 199 1,562 222 59 367 323Project explorationand evaluation andproject costs g 0 0 0 6 0 0 0 0Project capitalexpenditures h 0 276 42 354 0 0 0 0Non-controllinginterests 0 0 0 0 0 0 0 0
All-in costs 826 813 241 1,922 222 59 367 323Ounces sold - equitybasis (000s ounces) 842 1,255 262 2,359 168 30 590 280Cost of sales per ounce j,k 1,054 659 783 814 1,157 1,755 750 1,112Total cash costs perounce k 740 351 678 526 1,046 1,762 465 629Total cash costs perounce (on a co-productbasis) k,l 742 352 678 527 1,050 1,772 553 654All-in sustaining costsper ounce k 983 430 756 664 1,318 1,954 623 1,154All-in sustaining costsper ounce (on a co-product basis) k,l 985 431 756 665 1,322 1,964 711 1,179
All-in costs per ounce k 983 649 916 814 1,320 1,954 623 1,154All-in costs per ounce(on a co-product basis) k,l 985 650 916 815 1,324 1,964 711 1,179

BARRICK YEAR-END 2019 76 MANAGEMENT’S DISCUSSION AND ANALYSIS
($ millions, except per ounce information in dollars) For the year ended 12/31/18
Footnote Porgera KalgoorlieLagunas
NorteoLoulo-
Gounkotop KibalipNorth Maran Tongonp Bulyanhulun Buzwagin Morilao,p
Cost of sales applicableto gold production 213 288 337 264 53 139
Depreciation (42) (52) (46) (62) (24) (3) By-product credits (2) (2) (13) (2) (1) (1) Non-recurring items f 0 0 (166) 0 0 0
Other 0 0 0 0 0 0Non-controllinginterests 0 0 0 (72) (10) (49)
Total cash costs 169 234 112 128 18 86General &administrative costs 0 0 0 0 0 0Minesite explorationand evaluation costs g 0 10 2 0 0 0Minesite sustainingcapital expenditures h 62 26 20 74 3 4Sustaining leases 0 0 0 0 0 0Rehabilitation -accretion andamortization (operatingsites) i (1) 4 25 2 1 1Non-controllinginterests 0 0 0 (27) (1) (2)
All-in sustaining costs 230 274 159 177 21 89Project exploration andevaluation and projectcosts g 0 0 0 0 0 0Project capitalexpenditures h 0 0 2 8 4 0Non-controllinginterests 0 0 0 (3) (1) 0
All-in costs 230 274 161 182 24 89Ounces sold - equitybasis (000s ounces) 213 320 251 212 27 94Cost of sales per ounce j,k 996 899 1,342 795 1,231 939Total cash costs perounce k 796 732 448 603 650 916Total cash costs perounce (on a co-productbasis) k,l 810 737 499 609 674 922All-in sustaining costs perounce k 1,083 857 636 830 754 947All-in sustaining costs perounce (on a co-productbasis) k,l 1,097 862 687 836 778 953All-in costs per ounce k 1,083 857 644 855 848 947All-in costs per ounce (ona co-product basis) k,l 1,097 862 695 861 872 953

BARRICK YEAR-END 2019 77 MANAGEMENT’S DISCUSSION AND ANALYSIS
($ millions, except per ounce information in dollars) For the year ended 12/31/17
Footnote Carlina CortezbTurquoise
RidgecLong
Canyond PhoenixdNevada
Gold Minese HemloGolden
SunlightoPueblo
Viejo Veladeroq
Cost of sales applicableto gold production 889 980 159 2,028 193 55 730 410
Depreciation (260) (533) (28) (821) (27) (3) (229) (119)
By-product credits (2) (1) 0 (3) (1) 0 (72) (17)
Non-recurring items f 0 0 0 0 0 0 0 0Other 0 0 0 0 0 0 0 0Non-controllinginterests (1) 0 0 (1) 0 0 (171) 0
Total cash costs 626 446 131 1,203 165 52 258 274General &administrative costs 0 0 0 0 0 0 0 0Minesite explorationand evaluation costs g 10 6 0 16 0 0 0 3Minesite sustainingcapital expenditures h 264 96 32 392 44 0 114 173Sustaining leases 0 0 0 0 0 0 0 0Rehabilitation -accretion andamortization(operating sites) i 10 15 1 26 5 2 13 2Non-controllinginterests (3) 0 0 (3) 0 0 (51) 0
All-in sustaining costs 907 563 164 1,634 214 54 334 452Project explorationand evaluation andproject costs g 0 0 0 8 0 0 0 0Project capitalexpenditures h 0 198 4 228 5 1 0 0Non-controllinginterests 0 0 0 0 0 0 0 0
All-in costs 907 761 168 1,870 219 55 334 452Ounces sold - equitybasis (000s ounces) 868 1,489 222 2,579 196 41 637 458
Cost of sales per ounce j,k 1,024 657 715 786 986 1,334 699 897Total cash costs perounce k 721 300 589 467 841 1,265 405 598Total cash costs perounce (on a co-productbasis) k,l 723 301 589 468 846 1,270 475 636All-in sustaining costsper ounce k 1,045 380 733 634 1,092 1,329 525 987All-in sustaining costsper ounce (on a co-product basis) k,l 1,047 381 733 635 1,097 1,334 595 1,025
All-in costs per ounce k 1,045 512 753 726 1,119 1,349 525 987All-in costs per ounce(on a co-product basis) k,l 1,047 513 753 727 1,124 1,354 595 1,025

BARRICK YEAR-END 2019 78 MANAGEMENT’S DISCUSSION AND ANALYSIS
($ millions, except per ounce information in dollars) For the year ended 12/31/17
Footnote Porgera KalgoorlieLagunas
NorteoLoulo-
Gounkotop KibalipNorth Maran Tongonp Bulyanhulun Buzwagin Morilao,p
Cost of sales applicableto gold production 239 292 245 223 142 104
Depreciation (39) (58) (68) (56) (47) (4) By-product credits (3) (2) (16) (1) (3) (3) Non-recurring items f 0 0 0 0 0 0
Other 0 0 0 0 1 0Non-controllinginterests 0 0 0 (60) (33) (34)
Total cash costs 197 232 161 106 60 63General &administrative costs 0 0 0 0 0 0Minesite explorationand evaluation costs g 1 9 4 0 0 0Minesite sustainingcapital expenditures h 55 20 20 83 49 5Sustaining leases 0 0 0 0 0 0Rehabilitation -accretion andamortization (operatingsites) i (2) 3 7 3 2 1Non-controllinginterests 0 0 0 (31) (18) (2)
All-in sustaining costs 251 264 192 161 93 67Project exploration andevaluation and projectcosts g 0 0 0 0 0 0Project capitalexpenditures h 0 0 5 10 1 0Non-controllinginterests 0 0 0 (4) 0 0
All-in costs 251 264 197 167 94 67Ounces sold - equitybasis (000s ounces) 253 362 397 207 69 103Cost of sales per ounce j,k 944 806 617 683 1,309 643Total cash costs perounce k 781 642 405 509 848 600Total cash costs perounce (on a co-productbasis) k,l 791 647 446 513 872 616All-in sustaining costs perounce k 993 729 483 773 1,319 632All-in sustaining costs perounce (on a co-productbasis) k,l 1,003 734 524 777 1,343 648All-in costs per ounce k 993 729 497 804 1,330 632All-in costs per ounce (ona co-product basis) k,l 1,003 734 538 808 1,354 648
a. On July 1, 2019, Barrick's Goldstrike and Newmont's Carlin were contributed to Nevada Gold Mines and are now referred to as Carlin. As a result, the amounts presented represent Goldstrike on a 100% basis (including our 60% share of South Arturo) up until June 30, 2019, and the combined results of Carlin and Goldstrike (including our 60% share of South Arturo) on a 61.5% basis thereafter.
b. On July 1, 2019, Cortez was contributed to Nevada Gold Mines, a joint venture with Newmont. As a result, the amounts presented are on a 100% basis up until June 30, 2019, and on a 61.5% basis thereafter.
c. Barrick owned 75% of Turquoise Ridge through to the end of the second quarter of 2019, with our joint venture partner, Newmont, owning the remaining 25%. Turquoise Ridge was proportionately consolidated on the basis that the joint venture partners that have joint control have rights to the assets and obligations for the liabilities relating to the arrangement. The figures presented in this table are based on our 75% interest in Turquoise Ridge until June 30, 2019. On July 1, 2019, Barrick's 75% interest in Turquoise Ridge and Newmont's Twin Creeks and 25% interest in Turquoise Ridge were contributed to Nevada Gold Mines. Starting July 1, 2019, the results represent our 61.5% share of Turquoise Ridge and Twin Creeks, now referred to as Turquoise Ridge.
d. These sites were acquired as a result of the formation of Nevada Gold Mines on July 1, 2019. The results for 2018 and 2017 did not form a part of the Barrick consolidated results as these sites were acquired as a result of the formation of Nevada Gold Mines. Therefore, no comparative figures are provided.

BARRICK YEAR-END 2019 79 MANAGEMENT’S DISCUSSION AND ANALYSIS
e. Represents the combined results of Cortez, Goldstrike (including our 60% share of South Arturo) and our 75% interest in Turquoise Ridge until June 30, 2019. Commencing July 1, 2019, the date Nevada Gold Mines was established, the results represent our 61.5% interest in Cortez, Carlin (including Goldstrike and 60% of South Arturo), Turquoise Ridge (including Twin Creeks), Phoenix and Long Canyon.
f. Non-recurring items Non-recurring items in 2019 relate to organizational restructuring. These costs are not indicative of our cost of production and have been excluded from the calculation of total cash costs.
g. Exploration and evaluation costsExploration, evaluation and project expenses are presented as minesite sustaining if it supports current mine operations and project if it relates to future projects. Refer to page 54 of this MD&A.
h. Capital expenditures Capital expenditures are related to our gold sites only and are presented on a 100% cash basis starting from January 1, 2019 and on a 100% accrued basis for 2018 and 2017. They are split between minesite sustaining and project capital expenditures. Project capital expenditures are distinct projects designed to increase the net present value of the mine and are not related to current production. Significant projects in the current year are stripping at Rangefront declines, Cortez Crossroads, the Goldrush exploration declines, the Deep South Expansion, and construction of the third shaft at Turquoise Ridge. Refer to page 53 of this MD&A.
i. Rehabilitation - accretion and amortization Includes depreciation on the assets related to rehabilitation provisions of our gold operations and accretion on the rehabilitation provision of our gold operations, split between operating and non-operating sites.
j. Cost of sales per ounceCost of sales applicable to gold per ounce is calculated using cost of sales on an attributable basis (removing the non-controlling interest of 40% Pueblo Viejo, 36.1% Tanzania until September 30, 2019 (notwithstanding the completion of the Acacia transaction on September 17, 2019, we consolidated our interest in Acacia and recorded a non-controlling interest of 36.1% in the income statement for the entirety of the third quarter of 2019 as a matter of convenience) and 40% South Arturo from cost of sales (63.1% of South Arturo from July 1, 2019 onwards as a result of its contribution to Nevada Gold Mines)), divided by attributable gold ounces. The non-controlling interest of 20% Loulo-Gounkoto and 10.3% of Tongon is also removed from cost of sales and our proportionate share of cost of sales attributable to equity method investments (Kibali and Morila) is included commencing January 1, 2019, the effective date of the Merger. Also removes the non-controlling interest of 38.5% Nevada Gold Mines from cost of sales from July 1, 2019 onwards.
k. Per ounce figures Cost of sales per ounce, total cash costs per ounce, all-in sustaining costs per ounce and all-in costs per ounce may not calculate based on amounts presented in this table due to rounding.
l. Co-product costs per ounce Total cash costs per ounce, all-in sustaining costs per ounce and all-in costs per ounce presented on a co-product basis removes the impact of by-product credits of our gold production (net of non-controlling interest) calculated as:
($ millions) For the three months ended 12/31/19
Carlina CortezbTurquoise
RidgecLong
Canyond PhoenixdNevada Gold
Minese HemloPueblo
Viejo VeladeroBy-product credits 0 0 1 0 26 27 0 12 3Non-controlling interest 0 0 (1) 0 (9) (10) 0 (6) 0By-product credits (net ofnon-controlling interest) 0 0 0 0 17 17 0 6 3
($ millions) For the three months ended 12/31/19
Porgera KalgoorliemLoulo-
Gounkoto KibaliNorth Maran Tongon Bulyanhulun Buzwagin
By-product credits 1 1 0 1 1 1 0 0Non-controlling interest 0 0 0 0 0 0 0 0By-product credits (net ofnon-controlling interest) 1 1 0 1 1 1 0 0
($ millions) For the three months ended 9/30/19
Carlina CortezbTurquoise
RidgecLong
Canyond PhoenixdNevada Gold
Minese HemloPueblo
Viejo VeladeroBy-product credits 1 1 1 0 22 25 1 17 1Non-controlling interest 0 0 0 0 (9) (9) 0 (6) 0By-product credits (net ofnon-controlling interest) 1 1 1 0 13 16 1 11 1
($ millions) For the three months ended 9/30/19
Porgera KalgoorliemLagunas
NorteoLoulo-
Gounkoto Kibali North Maran Tongon Bulyanhulun Buzwagin
By-product credits 1 0 2 0 0 1 0 0 0Non-controlling interest 0 0 0 0 0 0 0 0 0By-product credits (net ofnon-controlling interest) 1 0 2 0 0 1 0 0 0

BARRICK YEAR-END 2019 80 MANAGEMENT’S DISCUSSION AND ANALYSIS
For the year ended 12/31/19
Carlina CortezbTurquoise
RidgecLong
Canyond PhoenixdNevada Gold
Minese HemloPueblo
Viejo VeladeroBy-product credits 1 1 2 0 48 52 1 61 8Non-controlling interest 0 0 (1) 0 (18) (19) 0 (24) 0By-product credits (net of non-controlling interest) 1 1 1 0 30 33 1 37 8
For the year ended 12/31/19
Porgera KalgoorliemLoulo-
Gounkoto KibaliNorth Maran Tongon Bulyanhulun Buzwagin
By-product credits 3 1 0 1 2 1 1 1Non-controlling interest 0 0 0 0 0 0 0 0By-product credits (net ofnon-controlling interest) 3 1 0 1 2 1 1 1
For the year ended 12/31/18
Carlina CortezbTurquoise
RidgecLong
Canyond PhoenixdNevada
Gold Minese HemloGolden
SunlightoPueblo
Viejo VeladeroBy-product credits 1 1 0 2 1 0 90 8Non-controlling interest 0 0 0 0 0 0 (37) 0By-product credits (net ofnon-controlling interest) 1 1 0 2 1 0 53 8
For the year ended 12/31/18
Porgera KalgoorlieLagunas
NorteoLoulo-
Gounkotop Kibalip North Maran Tongonp Bulyanhulun Buzwagin Morilao,p
By-product credits 2 2 13 2 1 1Non-controlling interest 0 0 0 (1) 0 0By-product credits (net ofnon-controlling interest) 2 2 13 1 1 1
For the year ended 12/31/17
Carlina CortezbTurquoise
RidgecLong
Canyond PhoenixdNevada
Gold Minese HemloGolden
SunlightoPueblo
Viejo Veladeroq
By-product credits 2 1 0 3 1 0 72 17Non-controlling interest 0 0 0 0 0 0 0 0By-product credits (net ofnon-controlling interest) 2 1 0 3 1 0 72 17
For the year ended 12/31/17
Porgera KalgoorlieLagunas
NorteoLoulo-
Gounkotop Kibalip North Maran Tongonp Bulyanhulun Buzwagin Morilao,p
By-product credits 3 2 16 1 3 3Non-controlling interest 0 0 0 0 (1) (2)By-product credits (net ofnon-controlling interest) 3 2 16 1 2 1
m. On November 28, 2019, we completed the sale of our 50% interest in Kalgoorlie in Western Australia to Saracen Mineral Holdings Limited for total cash consideration of $750 million. The transaction resulted in a gain of $408 million for the year ended December 31, 2019. The operating results reported for Kalgoorlie reflect the Company’s attributable share of Kalgoorlie’s results until the date of disposal.
n. Formerly part of Acacia Mining plc. On September 17, 2019, Barrick acquired all of the shares of Acacia it did not own. Refer to note 4 to the Financial Statements for more information. The results are on a 63.9% basis until September 30, 2019 and on a 100% basis from October 1, 2019 onwards.
o. With the end of mining at Lagunas Norte in the third quarter of 2019 and at Golden Sunlight and Morila in the second quarter of 2019 as previously reported, we have ceased to include production or non-GAAP cost metrics for these sites from October 1, 2019 and July 1, 2019, respectively, onwards.
p. The results for 2018 and 2017 did not form a part of the Barrick consolidated results as these sites were acquired as a result of the Merger. Therefore, no comparative figures are provided.
q. On June 30, 2017, we sold 50% of Veladero; therefore, these represent results on a 100% basis from January 1 to June 30, 2017 and on a 50% basis from July 1, 2017 onwards.

BARRICK YEAR-END 2019 81 MANAGEMENT’S DISCUSSION AND ANALYSIS
Reconciliation of Copper Cost of Sales to C1 cash costs and All-in sustaining costs, including on a per pound basis
($ millions, except per pound information in dollars) For the three months ended For the years ended
12/31/19 9/30/19 12/31/19 12/31/18 12/31/17
Cost of sales 80 49 361 558 399
Depreciation/amortization (17) (13) (100) (170) (83)
Treatment and refinement charges 25 18 99 144 157Cash cost of sales applicable to equity methodinvestments 94 59 288 281 245
Less: royalties and production taxesa (9) (5) (35) (44) (38)
By-product credits (1) (3) (9) (6) (5)
Other 0 0 (5) (11) 0
C1 cash cost of sales 172 105 599 752 675
General & administrative costs 3 5 19 28 12
Rehabilitation - accretion and amortization 7 2 15 16 12
Royalties and production taxes 9 5 35 44 38
Minesite exploration and evaluation costs 2 1 6 4 6
Minesite sustaining capital expenditures 60 48 215 220 204
Sustaining leases 3 0 5 0 0
Inventory write-downs 0 0 0 11 0
All-in sustaining costs 256 166 894 1,075 947
Pounds sold - consolidated basis (millions pounds) 91 65 355 382 405
Cost of sales per poundb,c 2.26 2.00 2.14 2.40 1.77
C1 cash costs per poundb 1.90 1.62 1.69 1.97 1.66
All-in sustaining costs per poundb 2.82 2.58 2.52 2.82 2.34a. For the three months and year ended December 31, 2019, royalties and production taxes include royalties of $8 million and $34 million, respectively (September 30,
2019: $5 million, 2018: $39 million and 2017: $38 million).b. Cost of sales per pound, C1 cash costs per pound and all-in sustaining costs per pound may not calculate based on amounts presented in this table due to rounding.c. Cost of sales per pound related to copper is calculated using cost of sales including our proportionate share of cost of sales attributable to equity method investments
(Zaldívar and Jabal Sayid), divided by consolidated copper pounds sold (including our proportionate share of copper pounds sold from our equity method investments).

BARRICK YEAR-END 2019 82 MANAGEMENT’S DISCUSSION AND ANALYSIS
Reconciliation of Copper Cost of Sales to C1 cash costs and All-in sustaining costs, including on a per pound basis, by operating site
($ millions, except per pound information in dollars) For the three months ended
12/31/19 9/30/19
Zaldívar Lumwana Jabal Sayid Zaldívar Lumwana Jabal SayidCost of sales 104 80 22 57 49 24
Depreciation/amortization (26) (17) (7) (17) (13) (5)Treatment and refinement charges 0 20 5 0 14 4Less: royalties and production taxesa 0 (9) 0 0 (5) 0
By-product credits 0 0 (1) 0 0 (3)
Other 0 0 0 0 0 0C1 cash cost of sales 78 74 19 40 45 20
Rehabilitation - accretion and amortization 4 3 0 0 2 0Royalties and production taxes 0 9 0 0 5 0Minesite exploration and evaluation costs 2 0 0 1 0 0Minesite sustaining capital expenditures 16 37 7 7 37 4Sustaining leases 3 0 0 0 0 0Inventory write-downs 0 0 0 0 0 0
All-in sustaining costs 103 123 26 48 89 24Pounds sold - consolidated basis (millions pounds) 40 36 15 26 24 15
Cost of sales per poundb,c 2.59 2.22 1.47 2.18 2.04 1.63
C1 cash costs per poundb 1.95 2.10 1.29 1.55 1.83 1.42
All-in sustaining costs per poundb 2.56 3.41 1.78 1.91 3.66 1.65
($ millions, except per pound information in dollars) For the years ended December 3112/31/19 12/31/18 12/31/17
Zaldívar LumwanaJabalSayid Zaldívar Lumwana
JabalSayid Zaldívar Lumwana
JabalSayid
Cost of sales 307 361 93 261 558 98 243 396 75Depreciation/amortization (86) (100) (27) (59) (170) (19) (55) (83) (17)Treatment and refinement charges 0 80 19 0 125 19 0 144 14Less: royalties and production taxesa 0 (35) 0 0 (39) (5) 0 (38) 0By-product credits 0 0 (9) 0 0 (6) 0 0 (5)Other 0 (5) 0 0 (11) 0 0 0 0
C1 cash cost of sales 221 301 76 202 463 87 188 419 67Rehabilitation - accretion andamortization 5 10 0 0 16 0 0 12 0Royalties and production taxesa 0 35 0 0 39 5 0 38 0Minesite exploration and evaluation costs 6 0 0 2 2 0 4 2 0Minesite sustaining capital expenditures 34 166 15 49 154 17 58 123 23Sustaining leases 3 2 0 0 0 0 0 0 0Inventory write-downs 0 0 0 0 11 0 0 0 0
All-in sustaining costs 269 514 91 253 685 109 250 594 90Pounds sold - consolidated basis (millionspounds) 125 169 61 103 222 57 113 253 39Cost of sales per poundb,c 2.46 2.13 1.53 2.55 2.51 1.73 2.15 1.57 1.90C1 cash costs per poundb 1.77 1.79 1.26 1.97 2.08 1.53 1.66 1.66 1.70All-in sustaining costs per poundb 2.15 3.04 1.51 2.47 3.08 1.92 2.21 2.35 2.30
a. For the three months and year ended December 31, 2019, royalties and production taxes include royalties of $8 million and $34 million, respectively (September 30, 2019: $5 million; 2018: $39 million and 2017: $38 million, respectively).
b. Cost of sales per pound, C1 cash costs per pound and all-in sustaining costs per pound may not calculate based on amounts presented in this table due to rounding.c. Cost of sales per pound applicable to copper is calculated using cost of sales including our proportionate share of cost of sales attributable to equity method
investments (Zaldívar and Jabal Sayid), divided by consolidated copper pounds sold (including our proportionate share of copper pounds sold from our equity method investments).

BARRICK YEAR-END 2019 83 MANAGEMENT’S DISCUSSION AND ANALYSIS
EBITDA and Adjusted EBITDA
EBITDA is a non-GAAP financial measure, which excludes the following from net earnings:
• Income tax expense;• Finance costs;• Finance income; and• Depreciation.
Management believes that EBITDA is a valuable indicator of our ability to generate liquidity by producing operating cash flow to fund working capital needs, service debt obligations, and fund capital expenditures. Management uses EBITDA for this purpose. EBITDA is also frequently used by investors and analysts for valuation purposes whereby EBITDA is multiplied by a factor or “EBITDA multiple” that is based on an observed or inferred relationship between EBITDA and market values to determine the approximate total enterprise value of a company.
Adjusted EBITDA removes the effect of impairment charges; acquisition/disposition gains/losses; foreign currency translation gains/losses; other expense adjustments; and unrealized gains on non-hedge derivative instruments. We also remove the impact of the income tax expense, finance costs, finance income and depreciation incurred in our equity method accounted investments. We believe these items
provide a greater level of consistency with the adjusting items included in our Adjusted Net Earnings reconciliation, with the exception that these amounts are adjusted to remove any impact on finance costs/income, income tax expense and/or depreciation as they do not affect EBITDA. We believe this additional information will assist analysts, investors and other stakeholders of Barrick in better understanding our ability to generate liquidity from our full business, including equity method investments, by excluding these amounts from the calculation as they are not indicative of the performance of our core mining business and not necessarily reflective of the underlying operating results for the periods presented.
EBITDA and adjusted EBITDA are intended to provide additional information to investors and analysts and do not have any standardized definition under IFRS, and should not be considered in isolation or as a substitute for measures of performance prepared in accordance with IFRS. EBITDA and adjusted EBITDA exclude the impact of cash costs of financing activities and taxes, and the effects of changes in operating working capital balances, and therefore are not necessarily indicative of operating profit or cash flow from operations as determined under IFRS. Other companies may calculate EBITDA and adjusted EBITDA differently.
Reconciliation of Net Earnings to EBITDA and Adjusted EBITDA
($ millions) For the three months ended For the years ended
12/31/19 9/30/19 12/31/19 12/31/18 12/31/17
Net earnings (loss) 1,776 2,435 4,574 (1,435) 1,516
Income tax expense 784 791 1,783 1,198 1,231
Finance costs, neta 90 106 394 458 624
Depreciation 572 559 2,032 1,457 1,647
EBITDA 3,222 3,891 8,783 1,678 5,018Impairment charges (reversals) of long-lived assetsb (566) (872) (1,423) 900 (212)
Acquisition/disposition (gains)/lossesc (414) (1,901) (2,327) (68) (911)
Foreign currency translation (gains)/losses 53 40 109 136 72
Other (income) expense adjustmentsd (845) 53 (687) 336 51Unrealized gains on non-hedge derivativeinstruments 0 1 0 1 (1)Income tax expense, net finance costsa, and depreciation from equity investees 112 85 378 97 98
Adjusted EBITDA 1,562 1,297 4,833 3,080 4,115a. Finance costs exclude accretion.b. Net impairment reversals for the current year primarily relate to non-current asset reversals at Pueblo Viejo, partially offset by impairment charges at Pascua-Lama
in the fourth quarter of 2019. This was further impacted by non-current asset reversals at Lumwana in the third quarter of 2019. Net impairment charges for 2018 primarily relate to non-current asset impairments at Lagunas Norte and non-current asset and goodwill impairments at Veladero.
c. Acquisition/disposition gains for the current year primarily relate to the gain on the sale of our 50% interest in Kalgoorlie in the fourth quarter of 2019 and the gain on the remeasurement of Turquoise Ridge to fair value as a result of its contribution to Nevada Gold Mines in the third quarter of 2019.
d. Other expense adjustments for the current year primarily relate to the gain on the de-recognition of the deferred revenue liability relating to our silver sale agreement with Wheaton Precious Metals Corp. and the gain on a settlement of customs duty and indirect taxes at Lumwana, both occurring in the fourth quarter of 2019.

BARRICK YEAR-END 2019 84 MANAGEMENT’S DISCUSSION AND ANALYSIS
Reconciliation of Segment Income to Segment EBITDA
($ millions) For the three months ended 12/31/19
Carlin
(61.5%)Cortez
(61.5%)
Turquoise Ridge
(61.5%)
Nevada Gold Mines
(61.5%)Pueblo
Viejo (60%)
Loulo-Gounkoto
(80%)Kibali(45%)
Veladero(50%)
Porgera(47.5%)
North Maraa
Income 133 69 56 277 125 65 30 21 44 52Depreciation 58 36 34 163 34 58 52 29 12 35EBITDA 191 105 90 440 159 123 82 50 56 87
For the three months ended 9/30/19
Carlin
(61.5%)Cortez
(61.5%)
Turquoise Ridge
(61.5%)
Nevada Gold Mines
(61.5%)Pueblo
Viejo (60%)
Loulo-Gounkoto
(80%)Kibali(45%)
Veladero(50%)
Porgera(47.5%)
North Maraa
Income 121 77 38 237 104 64 25 14 35 20Depreciation 62 32 43 166 29 61 57 25 11 11EBITDA 183 109 81 403 133 125 82 39 46 31
For the year ended 12/31/19
Carlinb
(61.5%)Cortezc (61.5%)
Turquoise Ridged
(61.5%)
Nevada Gold Minese
(61.5%)Pueblo
Viejo (60%)
Loulo-Gounkoto
(80%)Kibali(45%)
Veladero(50%)
Porgera(47.5%)
North Maraa
Income 370 459 201 1,050 402 190 108 57 113 112Depreciation 239 197 92 592 120 236 196 115 42 75EBITDA 609 656 293 1,642 522 426 304 172 155 187
For the year ended 12/31/18
Carlinb
(61.5%)Cortezc (61.5%)
Turquoise Ridged
(61.5%)
Nevada Gold Minese
(61.5%)Pueblo
Viejo (60%)Loulo-
Gounkotof KibalifVeladero
(50%)Porgera(47.5%)
North Maraa
Income 166 726 126 1,011 342 53 56 94Depreciation 262 386 28 677 115 121 42 40EBITDA 428 1,112 154 1,688 457 174 98 134
For the year ended 12/31/17
Carlinb
(61.5%)Cortezc (61.5%)
Turquoise Ridged
(61.5%)
Nevada Gold Minese
(61.5%)Pueblo
Viejo (60%)Loulo-
Gounkotof KibalifVeladero
(50%)gPorgera(47.5%)
North Maraa
Income 186 873 119 1,169 395 173 83 112Depreciation 260 532 28 821 143 119 38 36EBITDA 446 1,405 147 1,990 538 292 121 148
a. Formerly part of Acacia Mining plc. On September 17, 2019, Barrick acquired all of the shares of Acacia it did not own. Refer to note 4 to the Financial Statements for more information. The results are on a 63.9% basis until September 30, 2019 and on a 100% basis from October 1, 2019 onwards.
b. On July 1, 2019, Barrick's Goldstrike and Newmont's Carlin were contributed to Nevada Gold Mines and are now referred to as Carlin. As a result, the amounts presented represent Goldstrike on a 100% basis (including our 60% share of South Arturo) up until June 30, 2019, and the combined results of Carlin and Goldstrike (including our 60% share of South Arturo) on a 61.5% basis thereafter.
c. On July 1, 2019, Cortez was contributed to Nevada Gold Mines, a joint venture with Newmont. As a result, the amounts presented are on a 100% basis up until June 30, 2019, and on a 61.5% basis thereafter.
d. Barrick owned 75% of Turquoise Ridge through to the end of the second quarter of 2019, with our joint venture partner, Newmont, owning the remaining 25%. Turquoise Ridge was proportionately consolidated on the basis that the joint venture partners that have joint control have rights to the assets and obligations for the liabilities relating to the arrangement. The figures presented in this table are based on our 75% interest in Turquoise Ridge until June 30, 2019. On July 1, 2019, Barrick's 75% interest in Turquoise Ridge and Newmont's Twin Creeks and 25% interest in Turquoise Ridge were contributed to Nevada Gold Mines. Starting July 1, 2019, the results represent our 61.5% share of Turquoise Ridge and Twin Creeks, now referred to as Turquoise Ridge.
e. Represents the combined results of Cortez, Goldstrike (including our 60% share of South Arturo) and our 75% interest in Turquoise Ridge until June 30, 2019. Commencing July 1, 2019, the date Nevada Gold Mines was established, the results represent our 61.5% interest in Cortez, Carlin (including Goldstrike and 60% of South Arturo), Turquoise Ridge (including Twin Creeks), Phoenix and Long Canyon.
f. The results for 2018 and 2017 did not form a part of the Barrick consolidated results as these sites were acquired as a result of the Merger. Therefore, no comparative figures are provided.
g. On June 30, 2017, we sold 50% of Veladero; therefore, these represent results on a 100% basis from January 1 to June 30, 2017 and on a 50% basis from July 1, 2017 onwards.
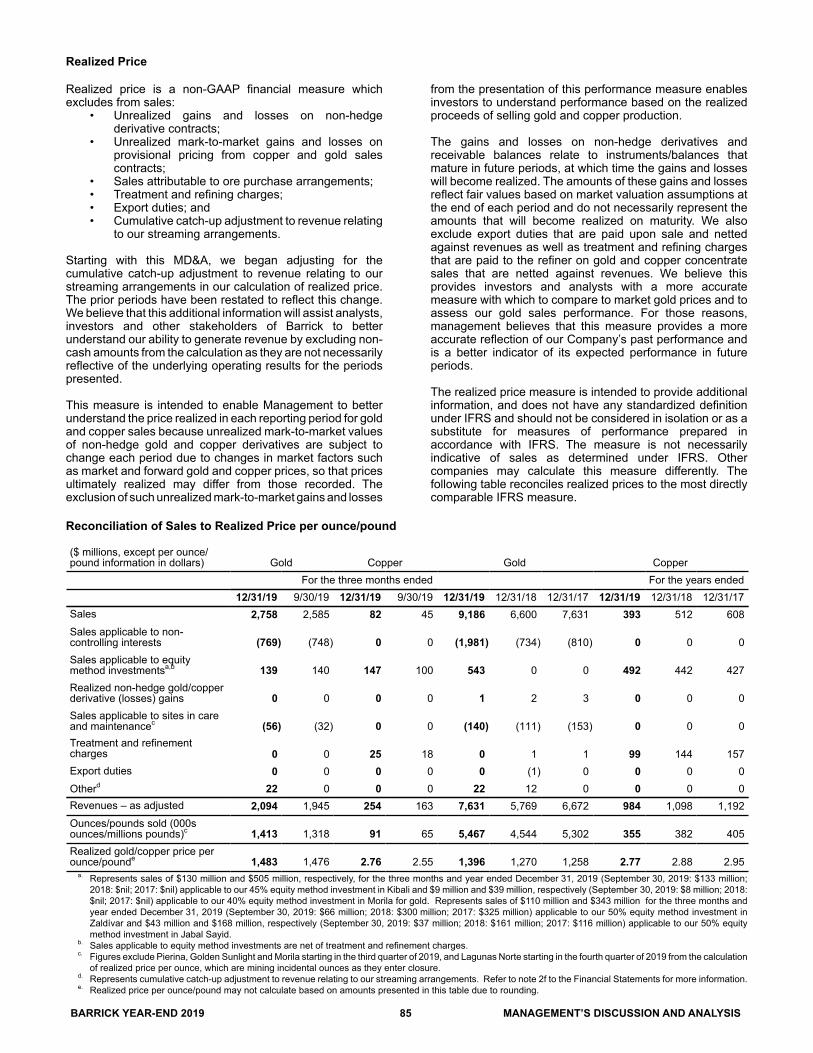
BARRICK YEAR-END 2019 85 MANAGEMENT’S DISCUSSION AND ANALYSIS
Realized Price
Realized price is a non-GAAP financial measure which excludes from sales:
• Unrealized gains and losses on non-hedge derivative contracts;
• Unrealized mark-to-market gains and losses on provisional pricing from copper and gold sales contracts;
• Sales attributable to ore purchase arrangements;• Treatment and refining charges; • Export duties; and• Cumulative catch-up adjustment to revenue relating
to our streaming arrangements.
Starting with this MD&A, we began adjusting for the cumulative catch-up adjustment to revenue relating to our streaming arrangements in our calculation of realized price. The prior periods have been restated to reflect this change. We believe that this additional information will assist analysts, investors and other stakeholders of Barrick to better understand our ability to generate revenue by excluding non-cash amounts from the calculation as they are not necessarily reflective of the underlying operating results for the periods presented.
This measure is intended to enable Management to better understand the price realized in each reporting period for gold and copper sales because unrealized mark-to-market values of non-hedge gold and copper derivatives are subject to change each period due to changes in market factors such as market and forward gold and copper prices, so that prices ultimately realized may differ from those recorded. The exclusion of such unrealized mark-to-market gains and losses
from the presentation of this performance measure enables investors to understand performance based on the realized proceeds of selling gold and copper production.
The gains and losses on non-hedge derivatives and receivable balances relate to instruments/balances that mature in future periods, at which time the gains and losses will become realized. The amounts of these gains and losses reflect fair values based on market valuation assumptions at the end of each period and do not necessarily represent the amounts that will become realized on maturity. We also exclude export duties that are paid upon sale and netted against revenues as well as treatment and refining charges that are paid to the refiner on gold and copper concentrate sales that are netted against revenues. We believe this provides investors and analysts with a more accurate measure with which to compare to market gold prices and to assess our gold sales performance. For those reasons, management believes that this measure provides a more accurate reflection of our Company’s past performance and is a better indicator of its expected performance in future periods.
The realized price measure is intended to provide additional information, and does not have any standardized definition under IFRS and should not be considered in isolation or as a substitute for measures of performance prepared in accordance with IFRS. The measure is not necessarily indicative of sales as determined under IFRS. Other companies may calculate this measure differently. The following table reconciles realized prices to the most directly comparable IFRS measure.
Reconciliation of Sales to Realized Price per ounce/pound
($ millions, except per ounce/pound information in dollars) Gold Copper Gold Copper
For the three months ended For the years ended 12/31/19 9/30/19 12/31/19 9/30/19 12/31/19 12/31/18 12/31/17 12/31/19 12/31/18 12/31/17Sales 2,758 2,585 82 45 9,186 6,600 7,631 393 512 608Sales applicable to non-controlling interests (769) (748) 0 0 (1,981) (734) (810) 0 0 0Sales applicable to equity method investmentsa,b 139 140 147 100 543 0 0 492 442 427Realized non-hedge gold/copperderivative (losses) gains 0 0 0 0 1 2 3 0 0 0Sales applicable to sites in care and maintenancec (56) (32) 0 0 (140) (111) (153) 0 0 0Treatment and refinementcharges 0 0 25 18 0 1 1 99 144 157Export duties 0 0 0 0 0 (1) 0 0 0 0Otherd 22 0 0 0 22 12 0 0 0 0Revenues – as adjusted 2,094 1,945 254 163 7,631 5,769 6,672 984 1,098 1,192Ounces/pounds sold (000s ounces/millions pounds)c 1,413 1,318 91 65 5,467 4,544 5,302 355 382 405Realized gold/copper price per ounce/pounde 1,483 1,476 2.76 2.55 1,396 1,270 1,258 2.77 2.88 2.95
a. Represents sales of $130 million and $505 million, respectively, for the three months and year ended December 31, 2019 (September 30, 2019: $133 million; 2018: $nil; 2017: $nil) applicable to our 45% equity method investment in Kibali and $9 million and $39 million, respectively (September 30, 2019: $8 million; 2018: $nil; 2017: $nil) applicable to our 40% equity method investment in Morila for gold. Represents sales of $110 million and $343 million for the three months and year ended December 31, 2019 (September 30, 2019: $66 million; 2018: $300 million; 2017: $325 million) applicable to our 50% equity method investment in Zaldívar and $43 million and $168 million, respectively (September 30, 2019: $37 million; 2018: $161 million; 2017: $116 million) applicable to our 50% equity method investment in Jabal Sayid.
b. Sales applicable to equity method investments are net of treatment and refinement charges. c. Figures exclude Pierina, Golden Sunlight and Morila starting in the third quarter of 2019, and Lagunas Norte starting in the fourth quarter of 2019 from the calculation
of realized price per ounce, which are mining incidental ounces as they enter closure.d. Represents cumulative catch-up adjustment to revenue relating to our streaming arrangements. Refer to note 2f to the Financial Statements for more information.e. Realized price per ounce/pound may not calculate based on amounts presented in this table due to rounding.

BARRICK YEAR-END 2019 86 MANAGEMENT’S DISCUSSION AND ANALYSIS
TECHNICAL INFORMATIONThe scientific and technical information contained in this MD&A has been reviewed and approved by Steven Yopps, MMSA, Director - Metallurgy, North America; Craig Fiddes, North America Resource Modeling Manager; Chad Yuhasz, P.Geo, Mineral Resource Manager, Latin America and Australia Pacific; Simon Bottoms, CGeol, MGeol, FGS, FAusIMM, Mineral Resources Manager: Africa and Middle East; Rodney Quick, MSc, Pr. Sci.Nat, Mineral Resource Management and Evaluation Executive; John Steele, CIM, Metallurgy, Engineering and Capital Projects Executive; and Rob Krcmarov, FAusIMM, Executive Vice President, Exploration and Growth – each a “Qualified Person” as defined in National Instrument 43-101 – Standards of Disclosure for Mineral Projects.
All mineral reserve and mineral resource estimates are estimated in accordance with National Instrument 43-101 – Standards of Disclosure for Mineral Projects. Unless otherwise noted, such mineral reserve and mineral resource estimates are as of December 31, 2019.
ENDNOTES
1 A Tier One Gold Asset is a mine with a stated life in excess of 10 years, annual production of at least 500,000 ounces of gold and total cash costs per ounce over the mine life that are in the lower half of the industry cost curve.
2 A Tier Two Gold Asset is a mine with a stated life in excess of 10 years, annual production of at least 250,000 ounces of gold and total cash costs per ounce over the mine life that are in the lower half of the industry cost curve. A Strategic Asset is an asset which in the opinion of Barrick, has the potential to deliver significant unrealized value in the future.
3 Currently consists of Barrick’s Lumwana mine and Zaldívar and Jabal Sayid copper joint ventures.
4 These are non-GAAP financial performance measures with no standardized meaning under IFRS and therefore may not be comparable to similar measures presented by other issuers. For further information and a detailed reconciliation of each non-GAAP measure to the most directly comparable IFRS measure, please see pages 63 to 85 of this MD&A.
5 Cost of sales applicable to gold per ounce is calculated using cost of sales applicable to gold on an attributable basis (removing the non-controlling interest of 40% Pueblo Viejo, 36.1% Tanzania until September 30, 2019 (notwithstanding the completion of the Acacia transaction on September 17, 2019, we consolidated our interest in Acacia and recorded a non-controlling interest of 36.1% in the income statement for the entirety of the third quarter of 2019 as a matter of convenience) and 40% South Arturo from cost of sales (63.1% of South Arturo from July 1, 2019 onwards as a result of its contribution to Nevada Gold Mines)), divided by attributable gold ounces. The non-controlling interest of 20% Loulo-Gounkoto and 10.3% of Tongon is also removed from cost of sales and our proportionate share of cost of sales attributable to equity method investments (Kibali and Morila) is included commencing January 1, 2019, the effective date of the Merger. Also removes the non-controlling interest of 38.5% Nevada Gold Mines from cost of sales from July 1, 2019 onwards. Cost of sales applicable to copper per pound is calculated using cost of sales applicable to copper including our proportionate share of cost of sales attributable to equity method investments (Zaldívar and Jabal Sayid), divided by consolidated copper pounds (including our proportionate share of copper pounds from our equity method investments).
6 Total reportable incident frequency rate (“TRIFR”) is a ratio calculated as follows: number of reportable injuries x 1,000,000 hours divided by the total number of hours worked. Reportable injuries include fatalities, lost time injuries, restricted duty injuries, and medically treated injuries.
7 Class 1 - High Significance is defined as an incident that causes significant negative impacts on human health or the environment or an incident that extends onto publicly accessible land and has the potential to cause significant adverse impact to surrounding communities, livestock or wildlife.
8 Class 2 - Medium Significance is defined as an incident that has the potential to cause negative impact on human health or the environment but is reasonably anticipated to result in only localized and short-term environmental or community impact requiring minor remediation.
9 Estimated in accordance with National Instrument 43-101 as required by Canadian securities regulatory authorities. Estimates are as of December 31, 2019, unless otherwise noted. Proven reserves of 280 million tonnes grading 2.42 g/t, representing 22 million ounces of gold, and 420 million tonnes grading 0.4%, representing 3,700 million pounds of copper. Probable reserves of 1,000 million tonnes grading 1.48 g/t, representing 49 million ounces of gold, and 1,200 million tonnes grading 0.38%, representing 9,800 million pounds of copper. Measured resources of 530 million tonnes grading 2.21 g/t, representing 37 million ounces of gold, and 660 million tonnes grading 0.38%, representing 5,500 million pounds of copper. Indicated resources of 2,800 million tonnes grading 1.43 g/t, representing 130 million ounces of gold, and 2,400 million tonnes grading 0.38%, representing 21,000 million pounds of copper. Inferred resources of 940 million tonnes grading 1.3 g/t, representing 39 million ounces of gold, and 430 million tonnes grading 0.2%, representing 2,200 million pounds of copper. Complete mineral reserve and mineral resource data for all mines and projects referenced in this MD&A, including tonnes, grades, and ounces, can be found on pages 92-102 of Barrick’s Fourth Quarter and Year-End 2019 Report.
10 Estimated in accordance with National Instrument 43-101 as required by Canadian securities regulatory authorities. Estimates are as of December 31, 2018, unless otherwise noted. Proven reserves of 344.6 million tonnes grading 2.15 g/t, representing 23.9 million ounces of gold and probable reserves of 0.9 billion tonnes grading 1.33 g/t, representing 38.4 million ounces of

BARRICK YEAR-END 2019 87 MANAGEMENT’S DISCUSSION AND ANALYSIS
gold. 11 billion pounds of copper reserves were comprised of proven reserves of 285.6 million tonnes grading 0.43%, representing 2.7 billion pounds of copper and probable reserves of 940.0 million tonnes grading 0.38%, representing 7.9 billion pounds of copper. Complete 2018 mineral reserve and mineral resource data for all mines and projects referenced in this MD&A, including tonnes, grades, and ounces, can be found on pages 35-41 of Barrick’s Annual Information Form/Form 40-F for the year ended December 31, 2018 on file with Canadian provincial securities regulatory authorities and the U.S. Securities and Exchange Commission.
11 The term “Acacia Exploration Special Dividends” refers to special dividends potentially payable by Barrick to former shareholders of Acacia, as a consequence of the sales process to realize value from the sale (if any) of certain of Acacia’s exploration assets located in the Republic of Kenya, the Republic of Mali and Burkina Faso, and excluding the sale of Acacia’s interests in the Nyanzaga Gold Project in Tanzania and the South Houndé Project in Burkina Faso, for which Acacia had already commenced and advanced sales processes.
12 See the Technical Report on the Turquoise Ridge mine, dated March 19, 2019, and filed on SEDAR at www.sedar.com and EDGAR at www.sec.gov on March 23, 2019.
13 See the Technical Report on the Pueblo Viejo mine, Sanchez Ramirez Province, Dominican Republic, dated March 19, 2018, and filed on SEDAR at www.sedar.com and EDGAR at www.sec.gov on March 23, 2018.
14 Carlin Trend Exploration Significant Intercepts1
Drill Results from Q4 2019Drill Hole Azimuth Dip Interval (m) Width (m)2 Au (g/t)
RAN-02349 0 (90) 538.0 - 541.5 3.5 7.50
RAN-02355 0 (90)507.8 - 509.2 1.4 5.33516.0 - 516.9 0.9 5.93520.6 - 526.7 6.1 8.52
1. All intercepts calculated using a 5 g/t Au cutoff and are uncapped; minimum intercept width is 0.8 m; internal dilution is less than 20% total width.
2. True widths of intercepts are uncertain at this stage, geometry of orebody is unconstrained.
The drilling results for the Carlin Trend exploration area in this MD&A have been prepared in accordance with National Instrument 43-101 – Standards of Disclosure for Mineral Projects. All drill hole assay information has been manually reviewed and approved by staff geologists and re-checked by the project manager. Sample preparation and analyses are conducted by ALS Minerals. Procedures are employed to ensure security of samples during their delivery from the drill rig to the laboratory. The quality assurance procedures, data verification and assay protocols used in connection with drilling and sampling on the Carlin Trend conform to industry accepted quality control methods.

BARRICK YEAR-END 2019 88 MANAGEMENT’S DISCUSSION AND ANALYSIS
Historic Drill Results1
Drill Hole Azimuth Dip Interval (m) Width (m)2 Au (g/t)
DPC-0241 072 (57)
160.9 - 165.5 4.6 7.48168.5 - 179.2 10.7 10.57199.0 - 200.5 1.5 6.91212.8 - 217.5 4.7 10.82229.5 - 231.0 1.5 6.42243.2 - 244.7 1.5 5.17273.7 - 276.8 3.1 8.75334.7 - 365.2 30.5 15.86369.7 - 396.2 26.5 11.24421.5 - 430.6 9.1 5.89
DSU-00190 105 (60) 379.5 - 388.5 9.0 12.81
GEN-017033 105 (75)
271.6 - 274.1 2.5 8.46296.3 - 297.7 1.4 5.47302.1 - 303.0 0.9 10.7307.3 - 308.8 1.5 5.28316.2 - 320.8 4.0 11.08326.8 - 352.5 24.7 8.56
U12-P05-16 059 (30)
141.7 - 144.8 3.1 8.09370.3 - 371.8 1.5 5.93376.4 - 391.7 15.3 7.14394.7 - 396.2 1.5 5.27397.8 - 400.8 3.0 6.15
GB-681CM4 0 (90)
608.1 - 614.2 6.1 23.17620.3 - 621.8 1.5 17.29661.4 - 662.9 1.5 7.19725.4 - 730.0 4.6 8.58736.1 - 739.2 3.1 6.73740.7 - 742.2 1.5 5.99763.5 - 765.0 1.5 10.79
U17-M05-02 075 (45)7.6 - 9.1 1.5 5.08
13.7 - 21.3 7.6 7.82193.6 - 202.7 9.1 21.02
1. All intercepts are from legacy drilling, completed prior to 2019.2. True widths of intercepts are uncertain at this stage, geometry of orebody is unconstrained.3. Interval vs. width discrepancy is due to sub-meter no recovery zone internal to intercept.4. Laboratory unknown.
The drilling results for the Carlin Trend exploration area in this MD&A have been prepared in accordance with National Instrument 43-101 – Standards of Disclosure for Mineral Projects. All drill hole assay information has been manually reviewed and approved by staff geologists and re-checked by the project manager. Sample preparation and analyses are conducted by ALS Minerals or predecessor companies. Procedures are employed to ensure security of samples during their delivery from the drill rig to the laboratory. The quality assurance procedures, data verification and assay protocols used in connection with drilling and sampling on the Carlin Trend conform to industry accepted quality control methods.

BARRICK YEAR-END 2019 89 MANAGEMENT’S DISCUSSION AND ANALYSIS
15 Fourmile Significant Intercepts1
Drill Results from Q4 2019Drill Hole2 Azimuth Dip Interval (m) Width (m)3 Au (g/t)
FM19-14D 233 (73)
1100.3 - 1103.3 3 6.21148.0 - 1155.5 7.5 9.21169.3 - 1162.8 1.5 9.31234.7 - 1236.2 1.5 7.51239.3 - 1242.3 3 47.81259.1 - 1260.6 1.5 7.01301.8 - 1303.3 1.5 20.21309.4 - 1310.9 1.5 16.31333.8 - 1337.5 3.7 86.21343.5 - 1345.2 1.7 29.61356.6 - 1361.2 4.6 42.51372.8 - 1375.5 2.7 180.3
FM19-26D4 65 (75)717.8 - 719.2 1.4 5.2774.8 - 776.3 1.5 18.5
FM19-40D 173 (84)870.2 - 871.7 1.5 10.4883 - 895.5 12.5 31.2904.4 - 926 21.6 24.9
FM19-61D 251 (86)
835.2 - 854.7 19.5 17.9863.5 - 872.0 8.5 10.4889.7 - 891.5 1.8 6.5892.9 - 894.0 1.1 10.8898.9 - 901.9 3.0 6.5957.1 - 959.5 2.4 14.8
FM19-64D 119 (85) 881.7 - 885.1 3.4 15.9FM19-68D 166 (77) 1092.1 - 1096.5 4.4 18.1
1. All intercepts calculated using a 5 g/t Au cutoff and are uncapped; minimum intercept width is 0.8 m; internal dilution is less than 20% total width.
2. Fourmile drill hole nomenclature: FM (Fourmile) followed by the year (19 for 2019) or GRC (Gold Rush Core) with no designation of the year.
3. True widths of intercepts are uncertain at this stage.4. Partial results reported in Q2 2019.
The drilling results for the Fourmile property contained in this MD&A have been prepared in accordance with National Instrument 43-101 – Standards of Disclosure for Mineral Projects. All drill hole assay information has been manually reviewed and approved by staff geologists and re-checked by the project manager. Sample preparation and analyses are conducted by ALS Minerals. Procedures are employed to ensure security of samples during their delivery from the drill rig to the laboratory. The quality assurance procedures, data verification and assay protocols used in connection with drilling and sampling on the Fourmile property conform to industry accepted quality control methods.
16 Bambadji Significant Intercepts1
Drill Results from Q4 2019Drill Hole2 Azimuth Dip Interval (m) Width (m)3 Au (g/t)
GFRC007 90 (50) 6.0 - 19.0 13.00 1.31GFRC008 90 (50) 22.0 - 52.0 30.00 1.06GFRC009 90 (50) 7.0 - 33.0 26.00 0.55GFRC013 90 (50) 19.0 - 26.0 8.00 0.68GFRC029 90 (50) 26.0 - 30.0 4.00 5.15GFRC031 90 (50) 41.0 - 48.0 7.00 16.72
1. All intercepts calculated using a 0.5 g/t Au cutoff and are uncapped; minimum intercept width is 2 m; internal dilution is less than 2 m total width.
2. Gefa drill hole nomenclature: prospect initial GF (Gefa), followed by type of drilling RC (Reverse Circulation) and DH (Diamond Drilling).3. True widths of intercepts are uncertain at this stage.

BARRICK YEAR-END 2019 90 MANAGEMENT’S DISCUSSION AND ANALYSIS
The drilling results for the Bambadji property contained in this MD&A have been prepared in accordance with National Instrument 43-101 – Standards of Disclosure for Mineral Projects. All drill hole assay information has been manually reviewed and approved by staff geologists and re-checked by the project manager. Sample preparation and analyses are conducted by SGS, an independent laboratory. Industry accepted best practices for preparation and fire assaying procedures are utilized to determine gold content. Procedures are employed to ensure security of samples during their delivery from the drill rig to the laboratory. The quality assurance procedures, data verification and assay protocols used in connection with drilling and sampling on the Bambadji property conform to industry accepted quality control methods.
17 See the Technical Report on the Loulo-Gounkoto Gold Mine Complex, Mali, dated September 18, 2018, with an effective date of December 31, 2017, and filed on SEDAR at www.sedar.com and EDGAR at www.sec.gov on January 2, 2019.
18 See the Technical Report on the Kibali Gold Mine, Republic of Congo, dated September 18, 2018, with an effective date of December 31, 2017, and filed on SEDAR at www.sedar.com and EDGAR at www.sec.gov on January 2, 2019.

BARRICK YEAR-END 2019 91 MANAGEMENT’S DISCUSSION AND ANALYSIS
GLOSSARY OF TECHNICAL TERMS ALL-IN SUSTAINING COSTS: A non-GAAP measure of cost per ounce/pound for gold/copper. Refer to page 66 of this MD&A for further information and a reconciliation of the measure.
AUTOCLAVE: Oxidation process in which high temperatures and pressures are applied to convert refractory sulfide mineralization into amenable oxide ore.
BY-PRODUCT: A secondary metal or mineral product recovered in the milling process such as silver.
C1 CASH COSTS: A non-GAAP measure of cost per pound for copper. Refer to page 81 of this MD&A for further information and a reconciliation of the measure.
CONCENTRATE: A very fine, powder-like product containing the valuable ore mineral from which most of the waste mineral has been eliminated.
CONTAINED OUNCES: Represents ounces in the ground before loss of ounces not able to be recovered by the applicable metallurgical process.
DEVELOPMENT: Work carried out for the purpose of gaining access to an ore body. In an underground mine this includes shaft sinking, crosscutting, drifting and raising. In an open pit mine, development includes the removal of overburden.
DILUTION: The effect of waste or low-grade ore which is unavoidably included in the mined ore, lowering the recovered grade.
DORÉ: Unrefined gold and silver bullion bars usually consisting of approximately 90 percent precious metals that will be further refined to almost pure metal.
DRILLING:Core: drilling with a hollow bit with a diamond cutting rim to produce a cylindrical core that is used for geological study and assays. Used in mineral exploration.In-fill: drilling closer spaced holes in between existing holes, used to provide greater geological detail and to help establish reserve estimates.
EXPLORATION: Prospecting, sampling, mapping, diamond-drilling and other work involved in searching for ore.
FREE CASH FLOW: A non-GAAP measure that reflects our ability to generate cash flow. Refer to page 64 of this MD&A for a definition.
GRADE: The amount of metal in each tonne of ore, expressed as grams per tonne for precious metals and as a percentage for most other metals.
Cut-off grade: the minimum metal grade at which an ore body can be economically mined (used in the calculation of ore reserves).Mill-head grade: metal content per tonne of ore going into a mill for processing. (g/t)Reserve grade: estimated metal content of an ore body, based on reserve calculations.
HEAP LEACHING: A process whereby gold/copper is extracted by “heaping” broken ore on sloping impermeable pads and continually applying to the heaps a weak cyanide solution/sulfuric acid which dissolves the contained gold/copper. The gold/copper-laden solution is then collected for gold/copper recovery.
HEAP LEACH PAD: A large impermeable foundation or pad used as a base for ore during heap leaching.
MILL: A processing facility where ore is finely ground and thereafter undergoes physical or chemical treatment to extract the valuable metals.
MINERAL RESERVE: See pages 92 to 102 – Summary Gold/Copper Mineral Reserves and Mineral Resources.
MINERAL RESOURCE: See pages 92 to 102 – Summary Gold/Copper Mineral Reserves and Mineral Resources.
OPEN PIT: A mine where the minerals are mined entirely from the surface.
ORE: Rock, generally containing metallic or non-metallic minerals, which can be mined and processed at a profit.
ORE BODY: A sufficiently large amount of ore that can be mined economically.
OUNCES: Troy ounce is a unit of measure used for weighing gold at 999.9 parts per thousand purity and is equivalent to 31.1035g.
RECLAMATION: The process by which lands disturbed as a result of mining activity are modified to support beneficial land use. Reclamation activity may include the removal of buildings, equipment, machinery and other physical remnants of mining, closure of tailings storage facilities, leach pads and other mine features, and contouring, covering and re-vegetation of waste rock and other disturbed areas.
RECOVERY RATE: A term used in process metallurgy to indicate the proportion of valuable material physically recovered in the processing of ore. It is generally stated as a percentage of the valuable material recovered compared to the total material originally contained.
REFINING: The final stage of metal production in which impurities are removed from the molten metal.
STRIPPING: Removal of overburden or waste rock overlying an ore body in preparation for mining by open pit methods.
TAILINGS: The material that remains after all economically and technically recoverable precious metals have been removed from the ore during processing.
TOTAL CASH COSTS: A non-GAAP measure of cost per ounce for gold. Refer to page 66 of this MD&A for further information and a reconciliation of the measure.

BARRICK YEAR-END 2019 92 RESERVES AND RESOURCES
Mineral Reserves and Mineral Resources
GOLD MINERAL RESERVES 1,2,3
As at December 31, 2019 PROVEN PROBABLE TOTAL
Tonnes GradeContained
ozs Tonnes GradeContained
ozs Tonnes GradeContained
ozsBased on attributable ounces (Mt) (g/t) (Moz) (Mt) (g/t) (Moz) (Mt) (g/t) (Moz)
AFRICA AND MIDDLE EASTKibali surface 3.5 2.49 0.28 7.1 3.14 0.71 11 2.92 0.99Kibali underground 5.8 5.13 0.95 14 4.76 2.2 20 4.87 3.2
Kibali (45.00%) total 9.3 4.13 1.2 22 4.23 2.9 31 4.20 4.2Loulo-Gounkoto surface 8.4 2.95 0.80 9.7 3.56 1.1 18 3.28 1.9Loulo-Gounkoto underground 9.0 4.64 1.3 18 5.41 3.2 27 5.16 4.5
Loulo-Gounkoto (80.00%) total 17 3.83 2.1 28 4.77 4.3 45 4.41 6.4Tongon surface (89.70%) 4.3 1.94 0.27 4.6 2.33 0.35 8.9 2.14 0.61Massawa surface (83.25%) 4 — — — 17 3.94 2.2 17 3.94 2.2
Bulyanhulu surface 5,6 — — — 1.1 1.19 0.041 1.1 1.19 0.041Bulyanhulu underground 5,6 2.0 11.01 0.72 4.4 10.56 1.5 6.4 10.70 2.2
Bulyanhulu (84.00%) total 5,6 2.0 11.01 0.72 5.5 8.72 1.5 7.5 9.34 2.2North Mara surface 6 0.34 2.63 0.029 15 1.47 0.70 15 1.49 0.73North Mara underground 6 0.77 5.39 0.13 5.0 5.40 0.87 5.8 5.40 1.0
North Mara (84.00%) total 6 1.1 4.54 0.16 20 2.46 1.6 21 2.57 1.7Buzwagi surface (84.00%) 6 — — — 5.1 0.84 0.14 5.1 0.84 0.14Jabal Sayid surface (50.00%) 7.2 0.20 0.046 5.4 0.29 0.051 13 0.24 0.097
AFRICA AND MIDDLE EAST TOTAL 41 3.44 4.6 110 3.78 13 150 3.69 18
NORTH AMERICAHemlo surface — — — 1.6 1.28 0.066 1.6 1.28 0.066Hemlo underground 0.91 4.94 0.15 8.1 4.30 1.1 9.0 4.37 1.3
Hemlo (100%) total 0.91 4.94 0.15 9.7 3.81 1.2 11 3.90 1.3Long Canyon surface (61.50%) 0.26 2.23 0.019 4.6 2.49 0.37 4.9 2.48 0.39Phoenix surface (61.50%) 9.4 0.66 0.20 94 0.59 1.8 100 0.59 2.0
Carlin surface 43 2.70 3.7 60 1.75 3.4 100 2.15 7.1Carlin underground 13 9.75 4.2 5.9 9.23 1.7 19 9.59 5.9
Carlin (61.50%) total 56 4.37 7.9 65 2.42 5.1 120 3.32 13Cortez surface 4.4 2.40 0.34 53 1.26 2.1 57 1.35 2.5Cortez underground 7 0.59 9.61 0.18 11 9.93 3.4 11 9.91 3.6
Cortez (61.50%) total 5.0 3.25 0.52 64 2.73 5.6 69 2.77 6.1Turquoise Ridge surface 18 2.02 1.2 16 1.86 0.94 34 1.95 2.1Turquoise Ridge underground 9.8 11.55 3.6 7.8 10.08 2.5 18 10.90 6.2
Turquoise Ridge (61.50%) total 28 5.38 4.8 23 4.59 3.5 51 5.02 8.3
NORTH AMERICA TOTAL 99 4.25 14 260 2.08 17 360 2.68 31

BARRICK YEAR-END 2019 93 RESERVES AND RESOURCES
GOLD MINERAL RESERVES 1,2,3
As at December 31, 2019 PROVEN PROBABLE TOTAL
Tonnes GradeContained
ozs Tonnes GradeContained
ozs Tonnes GradeContained
ozsBased on attributable ounces (Mt) (g/t) (Moz) (Mt) (g/t) (Moz) (Mt) (g/t) (Moz)
LATIN AMERICA AND ASIA PACIFICNorte Abierto surface (50.00%) 110 0.65 2.4 480 0.59 9.2 600 0.60 12Pueblo Viejo surface (60.00%) 10 2.68 0.87 61 2.46 4.8 71 2.49 5.7Veladero surface (50.00%) 15 0.60 0.30 110 0.74 2.5 120 0.73 2.8
Porgera surface — — — 8.5 3.63 0.99 8.5 3.63 0.99Porgera underground 1.3 6.68 0.29 5.3 6.25 1.1 6.6 6.33 1.3
Porgera (47.50%) total 1.3 6.68 0.29 14 4.63 2.1 15 4.81 2.3
LATIN AMERICA AND ASIA PACIFICTOTAL 140 0.84 3.8 660 0.87 19 810 0.87 22
TOTAL 280 2.42 22 1,000 1.48 49 1,300 1.68 71
1 See accompanying Mineral Reserves and Mineral Resources endnote #1.2 See accompanying Mineral Reserves and Mineral Resources endnote #2.3 See accompanying Mineral Reserves and Mineral Resources endnote #4.4 See accompanying Mineral Reserves and Mineral Resources endnote #9.5 See accompanying Mineral Reserves and Mineral Resources endnote #15.6 See accompanying Mineral Reserves and Mineral Resources endnote #10.7 See accompanying Mineral Reserves and Mineral Resources endnote #17.
COPPER MINERAL RESERVES 1,2,3,4
As at December 31, 2019 PROVEN PROBABLE TOTAL
TonnesCu
GradeContained
Cu TonnesCu
GradeContained
Cu TonnesCu
GradeContained
CuBased on attributable pounds (Mt) (%) (Mlb) (Mt) (%) (Mlb) (Mt) (%) (Mlb)AFRICA AND MIDDLE EAST
Bulyanhulu underground (84.00%) 5,6 2.0 0.53 24 4.4 0.56 54 6.4 0.55 77Lumwana surface (100%) 58 0.50 640 480 0.56 6,000 540 0.56 6,600
Jabal Sayid surface 0.079 3.21 5.6 — — — 0.079 3.21 5.6Jabal Sayid underground 7.1 2.44 380 5.4 2.09 250 13 2.29 630
Jabal Sayid (50.00%) total 7.2 2.45 390 5.4 2.09 250 13 2.29 640AFRICA AND MIDDLE EAST TOTAL 67 0.71 1,100 490 0.58 6,300 560 0.59 7,300NORTH AMERICA
Phoenix surface (61.50%) 27 0.19 120 130 0.17 490 160 0.18 610NORTH AMERICA TOTAL 27 0.19 120 130 0.17 490 160 0.18 610LATIN AMERICA AND ASIA PACIFIC
Zaldívar surface (50.00%) 220 0.43 2,100 69 0.42 640 280 0.43 2,700Norte Abierto surface (50.00%) 110 0.19 480 480 0.23 2400 600 0.22 2,900
LATIN AMERICA AND ASIA PACIFICTOTAL 330 0.35 2,500 550 0.25 3,000 880 0.29 5,600
TOTAL 420 0.4 3,700 1,200 0.38 9,800 1,600 0.38 13,000
1 See accompanying Mineral Reserves and Mineral Resources endnote #1.2 See accompanying Mineral Reserves and Mineral Resources endnote #2.3 See accompanying Mineral Reserves and Mineral Resources endnote #7.4 See accompanying Mineral Reserves and Mineral Resources endnote #4.5 See accompanying Mineral Reserves and Mineral Resources endnote #15.6 See accompanying Mineral Reserves and Mineral Resources endnote #10.

BARRICK YEAR-END 2019 94 RESERVES AND RESOURCES
SILVER MINERAL RESERVES 1,2,3,4
As at December 31, 2019 PROVEN PROBABLE TOTAL
TonnesAg
GradeContained
Ag TonnesAg
GradeContained
Ag TonnesAg
GradeContained
AgBased on attributable ounces (Mt) (g/t) (Moz) (Mt) (g/t) (Moz) (Mt) (g/t) (Moz)AFRICA AND MIDDLE EAST
Bulyanhulu underground (84.00%) 5,6 2.0 8.91 0.58 4.4 6.19 0.87 6.4 7.05 1.5AFRICA AND MIDDLE EAST TOTAL 2.0 8.91 0.58 4.4 6.19 0.87 6.4 7.05 1.5NORTH AMERICA
Phoenix surface (61.50%) 9.4 8.18 2.5 94 6.99 21 100 7.10 24NORTH AMERICA TOTAL 9.4 8.18 2.5 94 6.99 21 100 7.10 24
LATIN AMERICA AND ASIA PACIFICPueblo Viejo surface (60.00%) 10 14.45 4.7 61 16.30 32 71 16.04 37Norte Abierto surface (50.00%) 110 1.91 7.0 480 1.43 22 600 1.52 29Veladero surface (50.00%) 15 12.68 6.2 110 14.27 48 120 14.07 54
LATIN AMERICA AND ASIA PACIFICTOTAL 140 3.99 18 650 4.91 100 790 4.75 120
TOTAL 150 4.31 21 750 5.18 120 900 5.03 150
1 See accompanying Mineral Reserves and Mineral Resources endnote #1.2 See accompanying Mineral Reserves and Mineral Resources endnote #2.3 See accompanying Mineral Reserves and Mineral Resources endnote #7.4 See accompanying Mineral Reserves and Mineral Resources endnote #4.5 See accompanying Mineral Reserves and Mineral Resources endnote #15.6 See accompanying Mineral Reserves and Mineral Resources endnote #10.

BARRICK YEAR-END 2019 95 RESERVES AND RESOURCES
GOLD MINERAL RESOURCES 1,2,3,4
As at December 31, 2019 MEASURED (M) 5,6 INDICATED (I) 5,7 (M) + (I) 5,6,7 INFERRED 8
Tonnes GradeContained
ozs Tonnes GradeContained
ozsContained
ozs Tonnes GradeContained
ozs
Based on attributable ounces (Mt) (g/t) (Moz) (Mt) (g/t) (Moz) (Moz) (Mt) (g/t) (Moz)
AFRICA AND MIDDLE EASTKibali surface 5.3 2.43 0.42 15 2.63 1.3 1.7 5.0 2.0 0.32Kibali underground 9.2 4.94 1.5 28 3.66 3.3 4.8 7.0 4.1 0.93
Kibali (45.00%) total 14 4.02 1.9 43 3.30 4.6 6.5 12 3.2 1.2Loulo-Gounkoto surface 9.9 3.06 0.98 15 3.44 1.6 2.6 3.3 2.9 0.31Loulo-Gounkotounderground 14 4.79 2.2 21 5.55 3.8 6.0 12 4.1 1.6
Loulo-Gounkoto (80.00%)total 24 4.09 3.2 36 4.69 5.4 8.6 15 3.9 1.9Tongon surface (89.70%) 4.6 2.05 0.31 11 2.43 0.86 1.2 5.3 2.4 0.41
Massawa surface 9 — — — 19 4.00 2.5 2.5 3.1 2.2 0.22Massawa underground 9 — — — — — — — 2.2 4.1 0.29
Massawa (83.25%) 9 — — — 19 4.00 2.5 2.5 5.3 3.0 0.51Bulyanhulu surface 10 — — — 1.1 1.19 0.041 0.041 — — —Bulyanhulu underground 10 3.1 12.55 1.3 9.8 8.99 2.8 4.1 13 11.8 4.8
Bulyanhulu (84.00%) total 10 3.1 12.55 1.3 11 8.22 2.9 4.1 13 11.8 4.8North Mara surface 10 2.3 2.37 0.18 27 1.73 1.5 1.7 1.8 1.1 0.060North Mara underground 10 0.74 6.13 0.15 10 4.57 1.5 1.7 6.3 4.5 0.91
North Mara (84.00%) total 10 3.1 3.28 0.32 37 2.52 3.0 3.3 8.1 3.7 0.97Buzwagi surface (84.00%) 10 — — — 7.9 0.99 0.25 0.25 20 0.9 0.56Jabal Sayid surface(50.00%) 7.6 0.24 0.057 7.1 0.40 0.092 0.15 2.2 0.6 0.041
AFRICA AND MIDDLE EASTTOTAL 57 3.81 7.0 170 3.52 19 27 81 4.0 10NORTH AMERICA
Carlin surface 47 2.59 3.9 130 1.48 6.4 10 12 1.1 0.40Carlin underground 21 8.23 5.6 10 7.67 2.6 8.2 3.2 8.0 0.82
Carlin (61.50%) total 68 4.35 9.5 140 1.93 8.9 18 15 2.6 1.2Cortez surface 5.0 2.33 0.38 75 1.33 3.2 3.6 43 0.6 0.89Cortez underground 11 0.90 8.41 0.24 36 8.09 9.3 9.5 5.5 7.7 1.4
Cortez (61.50%) total 5.9 3.26 0.62 110 3.51 12 13 49 1.4 2.2Donlin surface (50.00%) 3.9 2.52 0.31 270 2.24 19 20 46 2.0 3.0
Hemlo surface — — — 32 1.91 2.0 2.0 3.0 1.0 0.096Hemlo underground 1.8 4.25 0.25 8.6 3.19 0.88 1.1 6.0 4.7 0.91
Hemlo (100%) total 1.8 4.25 0.25 41 2.18 2.9 3.1 9.1 3.5 1.0Long Canyon surface 0.65 2.79 0.059 10 2.65 0.89 0.95 1.6 1.6 0.083
Long Canyon underground 0.085 11.80 0.032 1.1 9.29 0.33 0.36 0.20 6.1 0.039
Long Canyon (61.50%) total 0.74 3.83 0.091 12 3.29 1.2 1.3 1.8 2.1 0.12Turquoise Ridge surface 24 2.06 1.6 32 1.96 2.0 3.6 11 1.6 0.57Turquoise Ridgeunderground 14 10.00 4.4 10 9.09 3.0 7.4 1.8 9.1 0.53
Turquoise Ridge (61.50%)total 38 4.95 6.0 42 3.72 5.0 11 13 2.7 1.1Phoenix surface (61.50%) 15 0.60 0.28 180 0.53 3.1 3.4 12 0.4 0.15Fourmile underground(100%) — — — — — — — 5.4 10.9 1.9
NORTH AMERICA TOTAL 130 4.00 17 800 2.06 53 70 150 2.2 11

BARRICK YEAR-END 2019 96 RESERVES AND RESOURCES
GOLD MINERAL RESOURCES 1,2,3,4
As at December 31, 2019 MEASURED (M) 5,6 INDICATED (I) 5,7 (M) + (I) 5,6,7 INFERRED 8
Tonnes GradeContained
ozs Tonnes GradeContained
ozsContained
ozs Tonnes GradeContained
ozs
Based on attributable ounces (Mt) (g/t) (Moz) (Mt) (g/t) (Moz) (Moz) (Mt) (g/t) (Moz)
LATIN AMERICA AND ASIAPACIFIC
Pueblo Viejo surface(60.00%) 80 2.41 6.2 120 2.25 9.0 15 33 2.1 2.2
Norte Abierto surface(50.00%) 190 0.63 3.9 1,100 0.53 19 22 370 0.4 4.4
Pascua Lama surface(100%) 43 1.86 2.6 390 1.49 19 21 15 1.7 0.86
Veladero surface (50.00%) 18 0.56 0.33 180 0.63 3.6 4.0 20 0.7 0.42Lagunas Norte surface(100%) 1.4 0.94 0.043 57 2.31 4.2 4.3 1.4 1.1 0.050
Alturas surface (100%) — — — — — — — 260 1.1 8.9Porgera surface — — — 15 3.24 1.6 1.6 7.1 2.6 0.58Porgera underground 1.5 6.57 0.31 8.7 6.16 1.7 2.0 2.8 6.5 0.57
Porgera (47.50%) total 1.5 6.57 0.31 24 4.30 3.3 3.6 9.8 3.7 1.2
LATIN AMERICA AND ASIAPACIFIC TOTAL 340 1.24 13 1,900 0.96 58 71 710 0.8 18
TOTAL 530 2.21 37 2,800 1.43 130 170 940 1.3 39
1 Mineral resources which are not mineral reserves do not have demonstrated economic viability.2 See accompanying Mineral Reserves and Mineral Resources endnote #1.3 See accompanying Mineral Reserves and Mineral Resources endnote #3.4 See accompanying Mineral Reserves and Mineral Resources endnote #4.5 See accompanying Mineral Reserves and Mineral Resources endnote #5.6 Measured mineral resources are shown inclusive of proven mineral reserves. 7 Indicated mineral resources are shown inclusive of probable mineral reserves.8 See accompanying Mineral Reserves and Mineral Resources endnote #6.9 See accompanying Mineral Reserves and Mineral Resources endnote #9.10 See accompanying Mineral Reserves and Mineral Resources endnote #10.11 See accompanying Mineral Reserves and Mineral Resources endnote #17.

BARRICK YEAR-END 2019 97 RESERVES AND RESOURCES
COPPER MINERAL RESOURCES 1,2,3,4,5
As at December 31, 2019 MEASURED (M) 6,7 INDICATED (I) 7,8 (M) + (I) 6,7,8 INFERRED 9
Tonnes GradeContained
lbs Tonnes GradeContained
lbsContained
lbs Tonnes GradeContained
lbsBased on attributablepounds (Mt) (%) (Mlb) (Mt) (%) (Mlb) (Mlb) (Mt) (%) (Mlb)
AFRICA AND MIDDLEEAST
Bulyanhulu underground (84.00%) 10 3.1 0.54 37 9.8 0.44 94 130 13 0.6 170Lumwana surface (100%) 81 0.53 940 850 0.65 12,000 13,000 9.6 0.5 120
Jabal Sayid surface 0.079 3.21 5.6 — — — 5.6 — — —Jabal Sayidunderground 7.5 2.66 440 7.1 2.38 370 810 2.2 2.1 100
Jabal Sayid (50.00%)total 7.6 2.66 440 7.1 2.38 370 820 2.2 2.1 100
AFRICA AND MIDDLEEAST TOTAL 91 0.71 1,400 860 0.66 13,000 14,000 24 0.7 390NORTH AMERICA
Phoenix surface (61.50%) 43 0.18 170 260 0.16 880 1,100 18 0.2 62
NORTH AMERICA TOTAL 43 0.18 170 260 0.16 880 1,100 18 0.2 62
LATIN AMERICA ANDASIA PACIFIC
Zaldívar surface (50.00%) 350 0.41 3,200 280 0.38 2,400 5,500 29 0.4 260Norte Abierto surface(50.00%) 170 0.21 790 1000 0.21 4,700 5,500 360 0.2 1,400
LATIN AMERICA ANDASIA PACIFIC TOTAL 520 0.34 3,900 1,300 0.25 7,100 11,000 390 0.2 1,700
TOTAL 660 0.38 5,500 2,400 0.38 21,000 26,000 430 0.2 2,200
1 Mineral resources which are not mineral reserves do not have demonstrated economic viability.2 See accompanying Mineral Reserves and Mineral Resources endnote #1.3 See accompanying Mineral Reserves and Mineral Resources endnote #3.4 See accompanying Mineral Reserves and Mineral Resources endnote #4.5 See accompanying Mineral Reserves and Mineral Resources endnote #7.6 Measured mineral resources are shown inclusive of proven mineral reserves. 7 See accompanying Mineral Reserves and Mineral Resources endnote #5.8 Indicated mineral resources are shown inclusive of probable mineral reserves.9 See accompanying Mineral Reserves and Mineral Resources endnote #6.10 See accompanying Mineral Reserves and Mineral Resources endnote #10.

BARRICK YEAR-END 2019 98 RESERVES AND RESOURCES
SILVER MINERAL RESOURCES 1,2,3,4,5
As at December 31, 2019 MEASURED (M) 6,7 INDICATED (I) 7,8 (M) + (I) 6,7,8 INFERRED 9
TonnesAg
GradeContained
Ag TonnesAg
GradeContained
ozsContained
ozs TonnesAg
GradeContained
ozsBased on attributableounces (Mt) (g/t) (Moz) (Mt) (g/t) (Moz) (Moz) (Mt) (g/t) (Moz)
AFRICA AND MIDDLEEAST
Bulyanhulu underground (84.00%) 10 3.1 7.96 0.80 9.8 6.17 1.9 2.7 13 9.0 3.7
AFRICA AND MIDDLEEAST TOTAL 3.1 7.96 0.80 9.8 6.17 1.9 2.7 13 9.0 3.7NORTH AMERICA
Phoenix surface(61.50%) 15 7.42 3.5 180 6.38 37 41 12 6.1 2.5
NORTH AMERICA TOTAL 15 7.42 3.5 180 6.38 37 41 12 6.1 2.5
LATIN AMERICA ANDASIA PACIFIC
Pueblo Viejo surface(60.00%) 80 16.16 42 120 11.17 45 86 33 10.6 11Norte Abierto surface(50.00%) 190 1.62 10 1,100 1.23 43 53 370 1.0 11Pascua-Lama surface(100%) 43 57.21 79 390 52.22 660 740 15 17.8 8.8Lagunas Norte surface(100%) 1.4 2.69 0.12 57 5.40 9.9 10 1.4 3.5 0.16Veladero surface(50.00%) 18 11.97 7.0 180 14.06 80 87 20 15.0 9.5
LATIN AMERICA ANDASIA PACIFIC TOTAL 330 12.78 140 1,800 14.19 840 970 440 2.9 41
TOTAL 350 12.52 140 2,000 13.44 870 1,000 460 3.2 47
1 Mineral resources which are not mineral reserves do not have demonstrated economic viability.2 See accompanying Mineral Reserves and Mineral Resources endnote #1.3 See accompanying Mineral Reserves and Mineral Resources endnote #3.4 See accompanying Mineral Reserves and Mineral Resources endnote #4.5 See accompanying Mineral Reserves and Mineral Resources endnote #7.6 Measured mineral resources are shown inclusive of proven mineral reserves. 7 See accompanying Mineral Reserves and Mineral Resources endnote #5.8 Indicated mineral resources are shown inclusive of probable mineral reserves.9 See accompanying Mineral Reserves and Mineral Resources endnote #6.10 See accompanying Mineral Reserves and Mineral Resources endnote #10.

BARRICK YEAR-END 2019 99 RESERVES AND RESOURCES
SUMMARY GOLD MINERAL RESERVES 1,2,3
For the years ended December 31 2019 2018Ownership Tonnes Grade Ounces Ownership Tonnes Grade Ounces
Based on attributable ounces % (Mt) (g/t) (Moz) % (Mt) (g/t) (Moz)AFRICA AND MIDDLE EAST
Kibali surface 4 45.00% 11 2.92 0.99Kibali underground 4 45.00% 20 4.87 3.2
Kibali Total 4 45.00% 31 4.20 4.2Loulo-Gounkoto surface 4 80.00% 18 3.28 1.9Loulo-Gounkoto underground 4 80.00% 27 5.16 4.5
Loulo-Gounkoto Total 4 80.00% 45 4.41 6.4Tongon surface 4 89.70% 8.9 2.14 0.61Massawa surface 4,5 83.25% 17 3.94 2.2
Bulyanhulu surface 6 84.00% 1.1 1.19 0.041Bulyanhulu underground 6 84.00% 6.4 10.70 2.2
Bulyanhulu Total 6 84.00% 7.5 9.34 2.2 63.90% 6.6 8.2 1.7North Mara surface 6 84.00% 15 1.49 0.73North Mara underground 6 84.00% 5.8 5.40 1.0
North Mara Total 6 84.00% 21 2.57 1.7 63.90% 17 2.59 1.4Buzwagi surface 6 84.00% 5.1 0.84 0.14 63.90% 6.8 0.90 0.20Jabal Sayid surface 50.00% 13 0.24 0.097
AFRICA AND MIDDLE EAST TOTAL 150 3.69 18NORTH AMERICA
Hemlo surface 100% 1.6 1.28 0.066Hemlo underground 100% 9.0 4.37 1.3
Hemlo Total 100% 11 3.90 1.3 100% 24 2.48 1.9Golden Sunlight 100% 0.30 1.70 —Long Canyon surface Total 7 61.50% 4.9 2.48 0.39Phoenix surface 7 61.50% 100 0.59 2.0
Carlin surface 8 61.50% 100 2.15 7.1 100% 63 2.99 6.1Carlin Underground 8 61.50% 19 9.59 5.9 100% 8.9 9.98 2.9
Carlin Total 8 61.50% 120 3.32 13.0 100% 72 3.91 9.0Cortez surface 9 61.50% 57 1.35 2.5Cortez Underground 9,10 61.50% 11 9.91 3.6
Cortez Total 9 61.50% 69 2.77 6.1 100% 150 1.87 11Turquoise Ridge surface 11 61.50% 34 1.95 2.1Turquoise Ridge underground 11 61.50% 18 10.90 6.2
Turquoise Ridge Total 11 61.50% 51 5.02 8.3 75% 16 12.97 6.8NORTH AMERICA TOTAL 360 2.68 31LATIN AMERICA AND ASIA PACIFIC
Norte Abierto surface 50.00% 600 0.60 12.0 50.00% 600 0.60 12Pueblo Viejo surface 60.00% 71 2.49 5.7 60.00% 77 2.66 6.6Veladero surface 50.00% 120 0.73 2.8 50.00% 110 0.74 2.5Lagunas Norte 100% — — — 100% 45 2.74 4.0
Porgera surface 47.50% 8.5 3.63 0.99Porgera underground 47.50% 6.6 6.33 1.3
Porgera Total 47.50% 15 4.81 2.3 47.50% 13 4.93 2.1Kalgoorlie 12 50.00% 96 1.18 3.7
LATIN AMERICA AND ASIA PACIFIC TOTAL 810 0.87 22Other 14 0.24 0.10
TOTAL 1,300 1.68 71 1,200 1.56 62
1 See accompanying Mineral Reserves and Mineral Resources endnote #1.2 See accompanying Mineral Reserves and Mineral Resources endnote #2.3 See accompanying Mineral Reserves and Mineral Resources endnote #4.4 See accompanying Mineral Reserve and Mineral Resource endnote #8.5 See accompanying Mineral Reserve and Mineral Resource endnote #9.6 See accompanying Mineral Reserve and Mineral Resource endnote #10.

BARRICK YEAR-END 2019 100 RESERVES AND RESOURCES
7 See accompanying Mineral Reserve and Mineral Resource endnote #11.8 See accompanying Mineral Reserve and Mineral Resource endnote #12.9 See accompanying Mineral Reserve and Mineral Resource endnote #13.10 See accompanying Mineral Reserve and Mineral Resource endnote #17.11 See accompanying Mineral Reserve and Mineral Resource endnote #14.12 See accompanying Mineral Reserve and Mineral Resource endnote #16.

BARRICK YEAR-END 2019 101 RESERVES AND RESOURCES
Mineral Reserves and Resources Endnotes
1. Mineral reserves (“reserves”) and mineral resources (“resources”) have been estimated as at December 31, 2019 (unless otherwise noted) in accordance with National Instrument 43-101 as required by Canadian securities regulatory authorities. For United States reporting purposes, the SEC has adopted amendments to its disclosure rules to modernize the mineral property disclosure requirements for issuers whose securities are registered with the SEC under the Securities and Exchange Act of 1934, as amended (the “Exchange Act”). These amendments became effective February 25, 2019 (the “SEC Modernization Rules”) with compliance required for the first fiscal year beginning on or after January 1, 2021. The SEC Modernization Rules replace the historical property disclosure requirements for mining registrants that were included in SEC Industry Guide 7, which will be rescinded from and after the required compliance date of the SEC Modernization Rules. As a result of the adoption of the SEC Modernization Rules, the SEC now recognizes estimates of “measured”, “indicated” and “inferred” mineral resources. In addition, the SEC has amended its definitions of “proven mineral reserves” and “probable mineral reserves” to be substantially similar to the corresponding Canadian Institute of Mining, Metallurgy and Petroleum definitions, as required by NI 43-101. U.S. investors should understand that “inferred” mineral resources have a great amount of uncertainty as to their existence and great uncertainty as to their economic and legal feasibility. In addition, U.S. investors are cautioned not to assume that any part or all of Barrick’s mineral resources constitute or will be converted into reserves. Mineral resource and mineral reserve estimations have been prepared by employees of Barrick, its joint venture partners or its joint venture operating companies, as applicable, under the supervision of regional Mineral Resource Managers Simon Bottoms, Africa & Middle East Mineral Resource Manager and Chad Yuhasz, Latin America & Australia Pacific Mineral Resource Manager, Craig Fiddes, North America Resource Modeling Manager and reviewed by Rodney Quick Barrick Executive Mineral Resource Management and Evaluation. Except as noted below, reserves have been estimated based on an assumed gold price of US$1,200 per ounce, an assumed silver price of US$16.50 per ounce, and an assumed copper price of US$2.75 per pound and long-term average exchange rates of 1.30 CAD/US$. Reserve estimates incorporate current and/or expected mine plans and cost levels at each property. Varying cut-off grades have been used depending on the mine and type of ore contained in the reserves. Barrick’s normal data verification procedures have been employed in connection with the calculations. Verification procedures include industry-standard quality control practices. Resources as at December 31, 2019 have been estimated using varying cut-off grades, depending on both the type of mine or project, its maturity and ore types at each property.
2. In confirming our annual reserves for each of our mineral properties, projects, and operations, we conduct a reserve test on December 31 of each year to verify that the future undiscounted cash flow from reserves is positive. The cash flow ignores all sunk costs and only considers future operating and closure expenses as well as any future capital costs.
3. The Barrick 2018 mineral resources were reported on an exclusive basis and exclude all areas that form mineral reserves; the Barrick 2019 mineral resources are reported on an inclusive basis and include all areas that form mineral reserves, reported at a mineral resource cut-off and associated commodity price. As a result, the respective Barrick 2018 mineral resources are not directly comparable to that of the Barrick 2019 mineral resources.
4. All mineral resource and mineral reserve estimates of tonnes, Au oz, Ag oz and Cu lb are reported to the second significant digit.
5. All measured and indicated mineral resource estimates of grade and all proven and probable mineral reserve estimates of grade for Au g/t, Ag g/t and Cu % are reported to 2 decimal places.
6. All inferred mineral resource estimates of grade for Au g/t, Ag g/t and Cu % are reported to 1 decimal place.7. 2019 polymetallic mineral resources and mineral reserves are estimated using the combined value of gold, copper & silver
and accordingly are reported as Gold, Copper & Silver mineral resources and mineral reserves.8. These sites were acquired as a result of the Merger and therefore are not reported as of December 31, 2018.9. On December 10, 2019, Barrick entered into an agreement to sell its interest in Massawa to Teranga Gold Corporation.
The transaction is expected to close in the first quarter of 2020. For additional information, see page 12 of Barrick’s Fourth Quarter and Year End Report 2020.
10. Formerly known as Acacia Mining plc. On September 17, 2019, Barrick acquired all of the shares of Acacia it did not own, bringing its ownership of Bulyanhulu, North Mara and Buzwagi up from 63.9% to 100%. On January 24, 2020, Barrick announced the signing of an agreement with the GoT, through which, among other things, the GoT will acquire a 16% free-carried interest in these sites, expected to be made effective as of January 1, 2020. For convenience, Barrick is reporting these mineral reserves and resources at its resulting 84% ownership interest.
11. These sites were acquired as a result of the formation of Nevada Gold Mines on July 1, 2019.12. On July 1, 2019, Barrick's Goldstrike and Newmont’s Carlin were contributed to Nevada Gold Mines and are now referred
to as Carlin. As a result, the amounts presented as of December 31, 2018 represent Goldstrike on a 100% basis (including our 60% share of South Arturo), and the amounts presented as of December 31, 2019 represent Carlin and Goldstrike (including our 60% share of South Arturo) on a 61.5% basis.
13. On July 1, 2019, Cortez was contributed to Nevada Gold Mines. As a result, Barrick now holds a 61.5% interest in Cortez. The amounts presented as of December 31, 2018 represent Cortez and Goldrush on a 100% basis, and the amounts presented as of December 31, 2019 represent Cortez and Goldrush on a 61.5% basis.

BARRICK YEAR-END 2019 102 RESERVES AND RESOURCES
14. On July 1, 2019, Barrick's 75% interest in Turquoise Ridge and Newmont’s Twin Creeks and 25% interest in Turquoise Ridge were contributed to Nevada Gold Mines. As a result, the amounts presented as of December 31, 2018 are based on our 75% interest in Turquoise Ridge and the amounts presented as of December 31, 2019 represent our 61.5% share of Turquoise Ridge and Twin Creeks, now referred to as Turquoise Ridge.
15. Silver and copper probable reserve tonnage at the Bulyanhulu mine is less than the gold probable reserve tonnage because the gold reserve includes 1.3 million tonnes of tailings material which are being separately reprocessed for recovery of gold only.
16. On November 28, 2019, we completed the sale of our 50% interest in Kalgoorlie in Western Australia to Saracen Mineral Holdings Limited. For additional information, see page 12 of Barrick’s Fourth Quarter and Year End Report 2019.
17. Cortez underground includes 3.9 million tonnes at 9.69 g/t for 1.2 million ounces of probable reserves, 26.3 million tonnes at 7.80 g/t for 6.6 million ounces of indicated resources and 4.8 million tonnes at 7.60 g/t for 1.2 million ounces of inferred resources related to Goldrush. As noted in endnote #3, mineral resources are reported on an inclusive basis.

BARRICK YEAR-END 2019 103
MANAGEMENT’S RESPONSIBILITY
Management’s Responsibility for Financial Statements
The accompanying consolidated financial statements have been prepared by and are the responsibility of the Board of Directors and Management of the Company.
The consolidated financial statements have been prepared in accordance with International Financial Reporting Standards as issued by the International Accounting Standards Board and reflect Management’s best estimates and judgments based on currently available information. The Company has developed and maintains a system of internal controls in order to ensure, on a reasonable and cost effective basis, the reliability of its financial information.
The consolidated financial statements have been audited by PricewaterhouseCoopers LLP, Chartered Professional Accountants. Their report outlines the scope of their examination and opinion on the consolidated financial statements.
/s/ Graham Shuttleworth
Graham ShuttleworthSenior Executive Vice Presidentand Chief Financial OfficerFebruary 20, 2019

BARRICK YEAR-END 2019 104
MANAGEMENT’S REPORT ON INTERNAL CONTROL OVER FINANCIAL REPORTING
Barrick’s management is responsible for establishing and maintaining internal control over financial reporting.
Barrick’s management assessed the effectiveness of the Company’s internal control over financial reporting as at December 31, 2019. Barrick’s Management used the Internal Control – Integrated Framework (2013) as issued by the Committee of Sponsoring Organizations of the Treadway Commission (COSO) to evaluate the effectiveness of Barrick’s internal control over financial reporting. Based on management’s assessment, Barrick’s internal control over financial reporting is effective as at December 31, 2019.
The effectiveness of the Company’s internal control over financial reporting as at December 31, 2019 has been audited by PricewaterhouseCoopers LLP, Chartered Professional Accountants, as stated in their report which is located on pages 105 - 109of Barrick’s 2019 Annual Financial Statements.

PricewaterhouseCoopers LLPPwC Tower, 18 York Street, Suite 2600, Toronto, Ontario, Canada M5J 0B2T: +1 416 863 1133, F: +1 416 365 8215
“PwC” refers to PricewaterhouseCoopers LLP, an Ontario limited liability partnership.
Report of Independent Registered Public Accounting Firm
To the Board of Directors and Shareholders of Barrick Gold Corporation
Opinions on the Financial Statements and Internal Control over Financial Reporting
We have audited the accompanying consolidated balance sheets of Barrick Gold Corporation and its subsidiaries (together, the Company) as of December 31, 2019 and 2018, and the related consolidated statements of income, comprehensive income, cash flow and changes in equity for the years then ended, including the related notes (collectively referred to as the consolidated financial statements). We also have audited the Company’s internal control over financial reporting as of December 31, 2019, based on criteria established in Internal Control – Integrated Framework (2013) issued by the Committee of Sponsoring Organizations of the Treadway Commission (COSO).
In our opinion, the consolidated financial statements referred to above present fairly, in all material respects, the financial position of the Company as of December 31, 2019 and 2018, and its financial performance and its cash flows for the years then ended in conformity with International Financial Reporting Standards as issued by the International Accounting Standards Board (IFRS). Also in our opinion, the Company maintained, in all material respects, effective internal control over financial reporting as of December 31, 2019, based on criteria established in Internal Control – Integrated Framework (2013) issued by the COSO.
Basis for Opinions
The Company’s management is responsible for these consolidated financial statements, for maintaining effective internal control over financial reporting, and for its assessment of the effectiveness of internal control over financial reporting, included in the accompanying Management’s Report on Internal Control over Financial Reporting. Our responsibility is to express opinions on the Company’s consolidated financial statements and on the Company’s internal control over financial reporting based on our audits. We are a public accounting firm registered with the Public Company Accounting Oversight Board (United States) (PCAOB) and are required to be independent with respect to the Company in accordance with the U.S. federal securities laws and the applicable rules and regulations of the Securities and Exchange Commission and the PCAOB.
We conducted our audits in accordance with the standards of the PCAOB. Those standards require that we plan and perform the audits to obtain reasonable assurance about whether the consolidated financial statements are free of material misstatement, whether due to error or fraud, and whether effective internal control over financial reporting was maintained in all material respects.
Our audits of the consolidated financial statements included performing procedures to assess the risks of material misstatement of the consolidated financial statements, whether due to error or fraud, and performing procedures that respond to those risks. Such procedures included examining, on a test basis, evidence regarding the amounts and disclosures in the consolidated financial statements. Our audits also included evaluating the accounting principles used and significant estimates made by management, as well as evaluating the overall presentation of the consolidated financial statements. Our audit of internal control over financial reporting included obtaining an understanding of internal control over financial reporting, assessing the risk that a material weakness exists, and testing and evaluating the design and operating effectiveness of internal control based on the assessed risk. Our audits also included performing such other procedures as we considered necessary in the circumstances. We believe that our audits provide a reasonable basis for our opinions.
Definition and Limitations of Internal Control over Financial Reporting
A company’s internal control over financial reporting is a process designed to provide reasonable assurance regarding the reliability of financial reporting and the preparation of financial statements for external purposes in accordance with generally accepted accounting principles. A company’s internal control over financial reporting includes those policies and procedures that (i) pertain to the maintenance of records that, in reasonable detail, accurately and fairly reflect the transactions and dispositions of the assets of the company; (ii) provide reasonable assurance that

transactions are recorded as necessary to permit preparation of financial statements in accordance with generally accepted accounting principles, and that receipts and expenditures of the company are being made only in accordance with authorizations of management and directors of the company; and (iii) provide reasonable assurance regarding prevention or timely detection of unauthorized acquisition, use, or disposition of the company’s assets that could have a material effect on the financial statements.
Because of its inherent limitations, internal control over financial reporting may not prevent or detect misstatements. Also, projections of any evaluation of effectiveness to future periods are subject to the risk that controls may become inadequate because of changes in conditions, or that the degree of compliance with the policies or procedures may deteriorate.
Critical Audit Matters
The critical audit matters communicated below are matters arising from the current period audit of the consolidated financial statements that were communicated or required to be communicated to the audit & risk committee and that (i) relate to accounts or disclosures that are material to the consolidated financial statements and (ii) involved our especially challenging, subjective, or complex judgments. The communication of critical audit matters does not alter in any way our opinion on the consolidated financial statements, taken as a whole, and we are not, by communicating the critical audit matters below, providing separate opinions on the critical audit matters or on the accounts or disclosures to which they relate.
Fair value of the property, plant and equipment and equity in investees acquired as part of the Randgold Resources Limited merger (the Merger)
As described in notes 2, 3 and 4 to the consolidated financial statements, the Company acquired 100% of the issued and outstanding shares of Randgold Resources Limited (Randgold) on January 1, 2019. Total consideration paid by the Company for Randgold shares was $7.9 billion of which $3.9 billion was allocated to property, plant and equipment and $3.3 billion was allocated to equity in investees. To determine the fair value of a large portion of property, plant and equipment and equity in investees acquired, management used discounted cash flow models. Management applied significant judgment in determining the fair value, including the use of significant assumptions such as: future metal prices, expected future production costs and capital expenditures, weighted average costs of capital, and the estimated quantities of ore reserves and mineral resources, including the expected conversions of resources to reserves. Estimated quantities of ore reserves and mineral resources are based on information compiled by qualified persons (management’s specialists).
The principal considerations for our determination that performing procedures relating to the fair value of the property, plant and equipment and equity in investees acquired as part of the Merger is a critical audit matter are: (i) there was significant judgment required by management in determining the fair values of a large portion of the property, plant and equipment and equity in investees acquired as part of the Merger, which were based on discounted cash flow models, including the selection of the significant assumptions such as future metal prices, expected future production costs and capital expenditures, weighted average costs of capital, and the estimated quantities of ore reserves and mineral resources, including the expected conversions of resources to reserves; (ii) the degree of auditor judgment, subjectivity and effort in performing procedures and evaluating audit evidence relating to the fair value measurement of a large portion of the property, plant and equipment and equity in investees acquired; and (iii) audit effort included the involvement of professionals with specialized skill and knowledge.
Addressing the matter involved performing procedures and evaluating audit evidence in connection with forming our overall opinion on the consolidated financial statements. These procedures included testing the effectiveness of controls over the valuation of the property, plant and equipment and equity in investees, including controls relating to the significant assumptions used in those management estimates. These procedures also included, among others: testing management’s process for determining the fair value of a large portion of the property, plant and equipment and equity in investees; evaluating the appropriateness of the discounted cash flow models; testing the completeness, accuracy, and relevance of underlying data used in the models and evaluating the reasonableness of the significant assumptions, including the future metal prices, expected future production costs and capital expenditures, weighted average costs of capital, and the estimated quantities of ore reserves and mineral resources, including the expected conversions of resources to reserves. Evaluating the reasonableness of the future metal price assumptions involved

comparing those prices to external benchmarking data. Evaluating the reasonableness of expected future production costs and capital expenditures was done by comparing the costs and capital expenditures to actual production and other third-party information, where available. The work of management’s specialists was used in performing the procedures to evaluate the reasonableness of the ore reserve and mineral resources estimates and the expected conversions of resources to reserves. As a basis for using this work, management’s specialists’ qualifications and objectivity were understood as well as their methods and assumptions. The procedures performed included tests of the data used by management’s specialists and evaluation of their findings. Professionals with specialized skill and knowledge assisted us in evaluating the reasonableness of the weighted average costs of capital.
Fair value of the Newmont Corporation (Newmont) property, plant and equipment acquired and fair value of the Company’s property plant and equipment contributed as part of the Newmont mines acquisition
As described in notes 2, 3 and 4 to the consolidated financial statements, the Company established a joint venture with Newmont, to combine their respective mining operations, assets, reserves and talent in Nevada, USA. The transaction concluded on July 1, 2019, establishing Nevada Gold Mines LLC (Nevada Gold Mines) as the joint venture. Management determined that the Company controls Nevada Gold Mines, and that the transaction to acquire the Newmont mines represents a business combination with the Company as the acquirer. Management determined that the consideration paid by the Company for control over the Newmont mines is the fair value of the non-controlling interest of the Company’s mines contributed and that the fair value of the consideration was $3.9 billion. A large portion of the fair value of the non-controlling interest contributed was property, plant and equipment. Management also determined that the fair value of the property, plant and equipment acquired was $3.5 billion. To determine the fair value of a large portion of the property, plant and equipment acquired and contributed, management used discounted cash flow models. Management applied significant judgment in determining the fair value of a large portion of the property, plant and equipment acquired and contributed, including the use of significant assumptions such as future metal prices, weighted average costs of capital, estimated quantities of ore reserves and mineral resources, including expected conversions of resources to reserves, and expected future production costs and capital expenditures for the mines contributed and acquired. Estimated quantities of ore reserves and mineral resources are based on information compiled by qualified persons (management’s specialists).
The principal considerations for our determination that performing procedures relating to the fair value of the property, plant and equipment acquired and contributed as part of the Newmont mines acquisition is a critical audit matter are: (i) there was significant judgment required by management in determining the fair value of a large portion of the property, plant and equipment acquired and contributed using discounted cash flow models as part of the acquisition, including the selection of the significant assumptions such as future metal prices, weighted average costs of capital, estimated quantities of ore reserves and mineral resources, including expected conversions of resources to reserves and expected future production costs and capital expenditures; and (ii) the degree of auditor judgment, subjectivity and effort in performing procedures and evaluating audit evidence relating to the fair value measurement of a large portion of the property, plant and equipment acquired and contributed; and (iii) audit effort included the involvement of professionals with specialized skill and knowledge.
Addressing the matter involved performing procedures and evaluating audit evidence in connection with forming our overall opinion on the consolidated financial statements. These procedures included testing the effectiveness of controls over the valuation of the property, plant and equipment, including controls relating to the significant assumptions used in those management estimates. These procedures also included, among others: testing management’s process for determining the fair value of a large portion of the property, plant and equipment acquired and contributed; evaluating the appropriateness of the discounted cash flow models; testing the completeness, accuracy and relevance of underlying data used in the models and evaluating the reasonableness of significant assumptions, including future metal prices, weighted average costs of capital, estimated quantities of ore reserves and mineral resources, including expected conversions of resources to reserves and expected future production costs and capital expenditures. Evaluating the reasonableness of the future metal price assumptions involved comparing those prices to external benchmarking data. Evaluating the reasonableness of expected future production costs and capital expenditures was done by comparing the costs and capital expenditures to actual production and other third-party information, where available. The work of management’s specialists was used in performing the procedures to evaluate the reasonableness of the ore reserves and mineral resources estimates and the expected conversions of resources to reserves. As a basis for this work, management’s specialists’ qualifications and objectivity were understood as well as their methods and assumptions.

The procedures performed included tests of the data used by management’s specialists and evaluation of their findings. Professionals with specialized skill and knowledge assisted in evaluating the reasonableness of the weighted average costs of capital.
Impairment assessments for goodwill and other non-current assets and impairment reversal assessments for other non-current assets
As described in notes 2, 3, 10, 19, 20 and 21 to the consolidated financial statements, the Company’s goodwill and other non-current assets are tested for impairment if there is an indicator of impairment (or reversal of impairment), and in the case of goodwill annually during the fourth quarter. Impairment assessments and impairment reversal assessments for other non-current assets are conducted at the level of the Cash Generating Unit (CGU), which is the lowest level for which identifiable cash flows are largely independent of the cash flows of other assets and includes most liabilities specific to the CGU. For operating mines and projects, the individual mine/project represents a CGU for impairment and impairment reversal assessments. The Company’s goodwill and other non-current assets balances at December 31, 2019 were $4.8 billion and $32.7 billion, respectively. Indicators of impairment were identified for the following CGUs: Bulyanhulu, North Mara, Buzwagi, and Pascua-Lama and indicators of impairment reversal were identified for the Lumwana and Pueblo Viejo CGUs. The Company determined that the carrying amount of Pascua-Lama was not recoverable and an impairment to other non-current assets of $296 million was recognized. The Company identified that the Fair Values Less Costs of Disposal (FVLCD) of the Lumwana CGU and the Pueblo Viejo CGU exceeded the carrying values of these CGUs and therefore recognized other non-current asset impairment reversals of $947 million and $865 million for the Lumwana and Pueblo Viejo CGUs, respectively. For each CGU tested for impairment or impairment reversal, the Company compared the carrying amount of the CGU to its FVLCD. In all instances, except for the Pascua-Lama CGU, management estimated the FVLCD of the CGUs by using discounted cash flow models and the application of a specific Net Asset Value (NAV) multiple for each CGU, where appropriate. For the Pascua-Lama CGU, management estimated the FVLCD of the CGU using a market approach by considering observable market values for comparable assets expressed as dollar per ounce of measured and indicated resources. Management’s estimates of FVLCD included significant assumptions with respect to future metal prices, operating and capital costs, weighted average costs of capital, NAV multiples, market values expressed as dollar per ounce of measured and indicated resources, and the estimated quantities of ore reserves and mineral resources, including the expected conversions of resources to reserves. Management estimates of quantities of ore reserves and mineral resources are based on information compiled by qualified persons (management’s specialists).
The principal considerations for our determination that performing procedures relating to the impairment assessments for goodwill and other non-current assets and impairment reversal assessments for other non-current assets is a critical audit matter are (i) there was significant judgment required by management in estimating the FVLCD of the CGUs using discounted cash flow models and the application of a specific NAV multiple, where appropriate or by using a market approach considering observable market values for comparable assets; (ii) the degree of auditor judgment, subjectivity and effort in performing procedures and evaluating audit evidence relating to the significant assumptions with respect to future metal prices, operating and capital costs, weighted average costs of capital, NAV multiples, market values expressed as dollar per ounce of measured and indicated resources, and the estimated quantities of ore reserves and mineral resources, including expected conversions of resources to reserves as compiled by management’s specialists; and (iii) audit effort included the involvement of professionals with specialized skill and knowledge.
Addressing the matter involved performing procedures and evaluating audit evidence in connection with forming our overall opinion on the consolidated financial statements. These procedures included testing the effectiveness of controls relating to management’s impairment and impairment reversal assessments, including controls relating to the significant assumptions used in management’s estimates of the FVLCDs of the CGUs. These procedures also included, among others: testing management’s process for determining the FVLCDs for CGUs with goodwill and for each CGU that was tested for impairment; evaluating the appropriateness of the discounted cash flow models or market approach by considering observable market values for comparable assets; testing the completeness, accuracy, and relevance of underlying data used in the models and evaluating the reasonableness of the significant assumptions used by management in the estimate of FVLCD, including future metal prices, operating and capital costs, weighted average costs of capital, NAV multiples, market values expressed as dollar per ounce of measured and indicated resources, and the estimated quantities of ore reserves and mineral resources, including the expected conversions of resources to reserves. Evaluating the reasonableness of future metal price assumptions involved comparing those prices to external benchmarking data. Evaluating the reasonableness of estimated operating and capital costs was

done by comparing those costs to recent actual operating and capital expenditures incurred, assessing the consistency of these costs with related assumptions and comparing them to third-party information, where available. Evaluating the NAV multiple assumptions and market values expressed as dollar per ounce of measured and indicated resources was done by comparing them to evidence of value from recent comparable market information. The work of management’s specialists was used in performing the procedures to evaluate the reasonableness of the ore reserve and mineral resources estimate and the estimated operating and capital costs and the expected conversions of resources to reserves. As a basis for using this work, the qualifications and objectivity of management’s specialists were understood, as well as their methods and assumptions. The procedures performed included tests of the data used by management’s specialists and evaluation of their findings. Professionals with specialized skill and knowledge assisted us in evaluating the reasonableness of the weighted average costs of capital, NAV multiples, and market values expressed as dollar per ounce of measured and indicated resources.
Chartered Professional Accountants, Licensed Public Accountants
Toronto, Canada February 20, 2020
We have served as the Company’s auditor since at least 1982. We have not been able to determine the specific year we began serving as auditor of the Company.
(signed) “PricewaterhouseCoopers LLP”

BARRICK YEAR-END 2019 110 FINANCIAL STATEMENTS
Consolidated Statements of Income
Barrick Gold Corporation For the years ended December 31 (in millions of United States dollars, except per share data) 2019 2018
Revenue (notes 5 and 6) $9,717 $7,243Costs and expenses
Cost of sales (notes 5 and 7) 6,911 5,220
General and administrative expenses (note 11) 212 265
Exploration, evaluation and project expenses (notes 5 and 8) 342 383
Impairment (reversals) charges (note 10) (1,423) 900
Loss on currency translation 109 136
Closed mine rehabilitation (note 27b) 5 (13)
Income from equity investees (note 16) (165) (46)
Other (income) expense (note 9) (3,100) 90Income before finance items and income taxes 6,826 308
Finance costs, net (note 14) (469) (545)Income (loss) before income taxes 6,357 (237)
Income tax expense (note 12) (1,783) (1,198)Net income (loss) $4,574 ($1,435)Attributable to:
Equity holders of Barrick Gold Corporation $3,969 ($1,545)
Non-controlling interests (note 32) $605 $110Earnings (loss) per share data attributable to the equity holders of Barrick Gold Corporation (note 13)Net income (loss)
Basic $2.26 ($1.32)Diluted $2.26 ($1.32)
The accompanying notes are an integral part of these consolidated financial statements.

BARRICK YEAR-END 2019 111 FINANCIAL STATEMENTS
Consolidated Statements of Comprehensive IncomeBarrick Gold Corporation For the years ended December 31 (in millions of United States dollars) 2019 2018Net income (loss) $4,574 ($1,435)Other comprehensive income (loss), net of taxesItems that may be reclassified subsequently to profit or loss:
Unrealized gains (losses) on derivatives designated as cash flow hedges, net of tax $nil and ($12) — 8Realized (gains) losses on derivatives designated as cash flow hedges, net of tax $nil and $3 — (2)Currency translation adjustments, net of tax $nil and $nil (6) (9)
Items that will not be reclassified to profit or loss:Actuarial gain (loss) on post-employment benefit obligations, net of tax ($3) and $nil (6) (2)Net change on equity investments, net of tax $nil and $nil 48 16
Total other comprehensive income 36 11Total comprehensive income (loss) $4,610 ($1,424)Attributable to:Equity holders of Barrick Gold Corporation $4,005 ($1,534)
Non-controlling interests $605 $110
The accompanying notes are an integral part of these consolidated financial statements.

BARRICK YEAR-END 2019 112 FINANCIAL STATEMENTS
Consolidated Statements of Cash FlowBarrick Gold Corporation
For the years ended December 31 (in millions of United States dollars) 2019 2018OPERATING ACTIVITIES
Net income (loss) $4,574 ($1,435)Adjustments for the following items:
Depreciation 2,032 1,457
Finance costs (note 14) 500 560
Impairment (reversals) charges (note 10) (1,423) 900
Income tax expense (note 12) 1,783 1,198
Loss on currency translation 109 136
Gain on sale of non-current assets (note 9) (441) (68)
Remeasurement of Turquoise Ridge to fair value (note 4) (1,886) —
Change in working capital (note 15) (357) (173)
Other operating activities (note 15) (1,113) (62)Operating cash flows before interest and income taxes 3,778 2,513Interest paid (333) (350)Income taxes paid (612) (398)Net cash provided by operating activities 2,833 1,765INVESTING ACTIVITIES
Property, plant and equipment
Capital expenditures (note 5) (1,701) (1,400)Sales proceeds 41 70
Divestitures (note 4) 750 —
Investment purchases (4) (159)
Cash acquired in merger (note 4) 751 —
Other investing activities (note 15) 213 (5)Net cash provided by (used in) investing activities 50 (1,494)FINANCING ACTIVITIES
Lease repayments (28) —
Debt repayments (281) (687)
Dividends (note 31) (548) (125)
Funding from non-controlling interests (note 32) 140 24
Disbursements to non-controlling interests (note 32) (421) (108)Other financing activities (1) (29)Net cash used in financing activities (1,139) (925)Effect of exchange rate changes on cash and equivalents (1) (9)Net increase (decrease) in cash and equivalents 1,743 (663)
Cash and equivalents at beginning of year (note 25a) 1,571 2,234Cash and equivalents at the end of year $3,314 $1,571
The accompanying notes are an integral part of these consolidated financial statements.

BARRICK YEAR-END 2019 113 FINANCIAL STATEMENTS
Consolidated Balance Sheets
As atDecember 31,
2019
As atDecember 31,
2018
Barrick Gold Corporation
(in millions of United States dollars)ASSETSCurrent assets
Cash and equivalents (note 25a) $3,314 $1,571
Accounts receivable (note 18) 363 248
Inventories (note 17) 2,289 1,852
Other current assets (note 18) 565 307Total current assets (excluding assets classified as held-for-sale) 6,531 3,978
Assets classified as held-for-sale (note 4) 356 —Total current assets 6,887 3,978
Non-current assets
Non-current portion of inventory (note 17) 2,300 1,696
Equity in investees (note 16) 4,527 1,234
Property, plant and equipment (note 19) 24,141 12,826
Intangible assets (note 20a) 226 227
Goodwill (note 20b) 4,769 1,176
Deferred income tax assets (note 30) 235 259
Other assets (note 22) 1,307 1,235Total assets $44,392 $22,631LIABILITIES AND EQUITYCurrent liabilities
Accounts payable (note 23) $1,155 $1,101
Debt (note 25b) 375 43Current income tax liabilities 224 203
Other current liabilities (note 24) 622 321Total current liabilities (excluding liabilities classified as held-for-sale) 2,376 1,668
Liabilities classified as held-for-sale (note 4) — —Total current liabilities 2,376 1,668
Non-current liabilities
Debt (note 25b) 5,161 5,695
Provisions (note 27) 3,114 2,904
Deferred income tax liabilities (note 30) 3,091 1,236
Other liabilities (note 29) 823 1,743Total liabilities 14,565 13,246
Equity
Capital stock (note 31) 29,231 20,883Deficit (9,722) (13,453)Accumulated other comprehensive loss (122) (158)Other 2,045 321Total equity attributable to Barrick Gold Corporation shareholders 21,432 7,593
Non-controlling interests (note 32) 8,395 1,792Total equity 29,827 9,385
Contingencies and commitments (notes 2, 17, 19 and 36)Total liabilities and equity $44,392 $22,631
The accompanying notes are an integral part of these consolidated financial statements.
Signed on behalf of the Board,
/s/ Mark Bristow /s/ J. Brett Harvey
Mark Bristow, Director J. Brett Harvey, Director

BARRICK YEAR-END 2019 114 FINANCIAL STATEMENTS
Consolidated Statements of Changes in Equity
Barrick Gold Corporation Attributable to equity holders of the Company
(in millions of United States dollars)
CommonShares (in
thousands)Capital
stock
Retainedearnings
(deficit)
Accumulated other
comprehensive income (loss)1 Other2
Total equityattributable toshareholders
Non-controlling
interestsTotal
equityAt January 1, 2019 1,167,847 $20,883 ($13,453) ($158) $321 $7,593 $1,792 $9,385
Net income (loss) — — 3,969 — — 3,969 605 4,574Total other comprehensive income — — — 36 — 36 — 36Total comprehensive income (loss) — $— $3,969 $36 $— $4,005 $605 $4,610Transactions with owners
Dividends (note 31) — — (218) — — (218) — (218)Merger with Randgold ResourcesLimited (note 4) 583,669 7,903 — — — 7,903 872 8,775Nevada Gold Mines JV withNewmont Goldcorp Corporation(note 4) — — — — 1,645 1,645 5,910 7,555Acquisition of 36.1% of AcaciaMining plc (note 4) 24,837 423 — — 70 493 (495) (2)Issued on exercise of stockoptions 131 2 — — — 2 — 2Funding from non-controllinginterests (note 32) — — — — — — 140 140Other decrease in non-controllinginterests (note 32) — — — — — — (429) (429)Dividend reinvestment plan (note31) 1,443 20 (20) — — — — —Share-based payments — — — — 9 9 — 9
Total transactions with owners 610,080 $8,348 ($238) $— $1,724 $9,834 $5,998 $15,832At December 31, 2019 1,777,927 $29,231 ($9,722) ($122) $2,045 $21,432 $8,395 $29,827
At December 31, 2017 1,166,577 $20,893 ($11,759) ($169) $321 $9,286 $1,781 $11,067Impact of adopting IFRS 15 onJanuary 1, 2018 — — 64 — — 64 — 64
At January 1, 2018 (restated) 1,166,577 $20,893 ($11,695) ($169) $321 $9,350 $1,781 $11,131Net (loss) income — — (1,545) — — (1,545) 110 (1,435)Total other comprehensive income — — — 11 — 11 — 11Total comprehensive (loss) income — $— ($1,545) $11 $— ($1,534) $110 ($1,424)Transactions with owners
Dividends — — (199) — — (199) — (199)Issued on exercise of stockoptions 20 — — — — — — —Funding from non-controllinginterests — — — — — — 24 24Other decrease in non-controllinginterests — — — — — — (123) (123)Dividend reinvestment plan 1,250 14 (14) — — — — —Other3 — (24) — — — (24) — (24)
Total transactions with owners 1,270 ($10) ($213) $— $— ($223) ($99) ($322)At December 31, 2018 1,167,847 $20,883 ($13,453) ($158) $321 $7,593 $1,792 $9,385
1 Includes cumulative translation adjustments as at December 31, 2019: $88 million loss (December 31, 2018: $82 million loss). 2 Includes additional paid-in capital as at December 31, 2019: $2,007 million (December 31, 2018: $283 million). 3 Represents a reversal of a previously recognized deferred tax asset, which was originally recognized in capital stock.
The accompanying notes are an integral part of these consolidated financial statements.

BARRICK YEAR-END 2019 115 NOTES TO FINANCIAL STATEMENTS
NOTES TO CONSOLIDATED FINANCIAL STATEMENTSBarrick Gold Corporation. Tabular dollar amounts in millions of United States dollars, unless otherwise shown. References to A$, ARS, C$, CLP, DOP, EUR, GBP, PGK, SAR, TZS, XOF, ZAR, and ZMW are to Australian dollars, Argentine pesos, Canadian dollars, Chilean pesos, Dominican pesos, Euros, British pound sterling, Papua New Guinea kina, Saudi riyal, Tanzanian shilling, West African CFA franc, South African rand, and Zambian kwacha, respectively.
1 > CORPORATE INFORMATIONBarrick Gold Corporation (“Barrick”, “we” or the “Company”) is a corporation governed by the Business Corporations Act (British Columbia). The Company’s corporate office is located at Brookfield Place, TD Canada Trust Tower, 161 Bay Street, Suite 3700, Toronto, Ontario, M5J 2S1. The Company’s registered office is 925 West Georgia Street, Suite 1600, Vancouver, British Columbia, V6C 3L2. We are principally engaged in the production and sale of gold and copper, as well as related activities such as exploration and mine development. We sell our gold and copper into the world market.
We have ownership interests in producing gold mines that are located in Argentina, Canada, Côte d’Ivoire, the Democratic Republic of Congo, the Dominican Republic, Mali, Papua New Guinea, Tanzania and the United States. We have ownership interests in producing copper mines in Chile, Saudi Arabia and Zambia. We also have various projects located throughput the Americas and Africa. Refer to note 4 for information on acquisitions and divestments occurring during the 2019 year.
2 > SIGNIFICANT ACCOUNTING POLICIES
a) Statement of ComplianceThese consolidated financial statements have been prepared in accordance with International Financial Reporting Standards (“IFRS”) as issued by the International Accounting Standards Board (“IASB”) under the historical cost convention, as modified by revaluation of derivative contracts and certain financial assets. Accounting policies are consistently applied to all years presented, unless otherwise stated. These consolidated financial statements were approved for issuance by the Board of Directors on February 20, 2020.
b) Basis of Preparation
SubsidiariesThese consolidated financial statements include the accounts of Barrick and its subsidiaries. All intercompany balances, transactions, income and expenses, and profits or losses have been eliminated on consolidation. We consolidate subsidiaries where we have the ability to exercise control. Control of an investee is defined to exist when we are exposed to variable returns from our involvement with the investee and have the ability to affect those returns through our power over the investee. Specifically, we control an investee if, and only if, we have all of the following: power over the investee (i.e., existing rights that give us the current ability to direct the relevant activities of the investee); exposure, or rights, to variable returns from our involvement with the investee; and the ability to use our power over the investee to affect its returns. For non wholly-owned, controlled subsidiaries, the net assets attributable to outside equity shareholders are presented as “non-controlling interests” in the equity section of the consolidated balance sheet. Profit or loss for the period that is attributable to non-controlling interests is calculated based on the ownership of the minority shareholders in the subsidiary.
Joint ArrangementsA joint arrangement is defined as one over which two or more parties have joint control, which is the contractually agreed sharing of control over an arrangement. This exists only when the decisions about the relevant activities (being those that significantly affect the returns of the arrangement) require the unanimous consent of the parties sharing control. There are two types of joint arrangements: joint operations (“JO”) and joint ventures (“JV”).
A JO is a joint arrangement whereby the parties that have joint control of the arrangement have rights to the assets and obligations for the liabilities, relating to the arrangement. In relation to our interests in joint operations, we recognize our share of any assets, liabilities, revenues and expenses of the JO.
A JV is a joint arrangement whereby the parties that have joint control of the arrangement have rights to the net assets of the joint venture. Our investments in JVs are accounted for using the equity method.
On acquisition, an equity method investment is initially recognized at cost. The carrying amount of equity method investments includes goodwill identified on acquisition, net of any accumulated impairment losses. The carrying amount is adjusted by our share of post-acquisition net income or loss; depreciation, amortization or impairment of the fair value adjustments made on the underlying balance sheet at the date of acquisition; dividends; cash contributions; and our share of post-acquisition movements in Other Comprehensive Income (“OCI”). If the carrying value in an equity method investment is reduced to zero, additional losses are not provided for, and a liability is not recognized, unless the Company has incurred legal or constructive obligations, or made payments on behalf of the equity method investment.

BARRICK YEAR-END 2019 116 NOTES TO FINANCIAL STATEMENTS
Outlined below is information related to our joint arrangements and entities other than 100% owned Barrick subsidiaries at December 31, 2019:
Place of business Entity type Economic interest1 Method2
Nevada Gold Mines3,4,5,6,7 United States Subsidiary 61.5% Consolidation
Loulo-Gounkoto3 Mali Subsidiary 80% Consolidation
Tongon3 Côte d’Ivoire Subsidiary 89.7% Consolidation
Pueblo Viejo3 Dominican Republic Subsidiary 60% Consolidation
Norte Abierto Project Chile JO 50% Our share Donlin Gold Project United States JO 50% Our share
Porgera Mine8 Papua New Guinea JO 47.5% Our share
Veladero Argentina JO 50% Our share
Kibali9 Democratic Republic of Congo JV 45% Equity MethodMorila9 Mali JV 40% Equity Method
GNX9,10 Chile JV 50% Equity Method
Jabal Sayid9 Saudi Arabia JV 50% Equity Method
Kabanga Project9,10 Tanzania JV 50% Equity Method
Zaldívar9 Chile JV 50% Equity Method 1 Unless otherwise noted, all of our joint arrangements are funded by contributions made by the parties sharing joint control in proportion to their
economic interest.2 For our JOs, we recognize our share of any assets, liabilities, revenues and expenses of the JO.3 We consolidate our interests in Carlin, Cortez, Turquoise Ridge, Phoenix, Long Canyon, Loulo-Gounkoto, Tongon and Pueblo Viejo and record
a non-controlling interest for the 38.5%, 38.5%, 38.5%, 38.5%, 38.5%, 20%, 10.3% and 40%, respectively, that we do not own. On September 17, 2019, Barrick acquired all of the shares of Acacia it did not own, bringing our ownership from 63.9% to 100%. When the Government of Tanzania’s 16% free-carried interest is made effective, which is expected to be as of January 1, 2020, our ownership will be brought down to 84%.
4 On July 1, 2019, Barrick’s Goldstrike (including 60% of South Arturo) and Newmont’s Carlin were contributed to Nevada Gold Mines, a joint venture with Newmont, and are now referred to as Carlin. This brought our ownership to 61.5% of Carlin (including 36.9% of South Arturo).
5 On July 1, 2019, Cortez was contributed to Nevada Gold Mines bringing our ownership down to 61.5%.6 Barrick owned 75% of Turquoise Ridge through to the end of the second quarter of 2019, with our joint venture partner, Newmont, owning the
remaining 25%. Turquoise Ridge was proportionately consolidated on the basis that the joint venture partners that have joint control have rights to the assets and obligations for the liabilities relating to the arrangement. On July 1, 2019, Barrick’s 75% interest in Turquoise Ridge and Newmont’s Twin Creeks and 25% interest in Turquoise Ridge were contributed to Nevada Gold Mines. This brought our ownership to 61.5%of Turquoise Ridge and Twin Creeks, now referred to as Turquoise Ridge.
7 Phoenix and Long Canyon were acquired as a result of the formation of Nevada Gold Mines on July 1, 2019, resulting in an ownership of 61.5%.
8 We have joint control given that decisions about relevant activities require unanimous consent of the parties to the joint operation.9 Barrick has commitments of $324 million relating to its interest in the joint ventures.10 These JVs are early stage exploration projects and, as such, do not have any significant assets, liabilities, income, contractual commitments
or contingencies.
c) Business CombinationsOn the acquisition of a business, the acquisition method of accounting is used, whereby the purchase consideration is allocated to the identifiable assets and liabilities on the basis of fair value at the date of acquisition. Provisional fair values allocated at a reporting date are finalized as soon as the relevant information is available, within a period not to exceed 12 months from the acquisition date with retroactive restatement of the impact of adjustments to those provisional fair values effective as at the acquisition date. Incremental costs related to acquisitions are expensed as incurred.
When the cost of the acquisition exceeds the fair value of the identifiable net assets acquired, the difference is recorded as goodwill. If the fair value attributable to Barrick’s share of the identifiable net assets exceeds the cost of acquisition, the difference is recognized as a gain in the consolidated statement of income.
Non-controlling interests represent the fair value of net assets in subsidiaries, as at the date of acquisition, that are not held by Barrick and are presented in the equity section of the consolidated balance sheet.

BARRICK YEAR-END 2019 117 NOTES TO FINANCIAL STATEMENTS
d) Non-current Assets and Disposal Groups Held-for-Sale and Discontinued OperationsNon-current assets and disposal groups are classified as assets held-for-sale (“HFS”) if it is highly probable that the value of these assets will be recovered primarily through sale rather than through continuing use. They are recorded at the lower of carrying amount and fair value less cost of disposal. Impairment losses on initial classification as HFS and subsequent gains and losses on remeasurement are recognized in the income statement. Once classified as HFS, property, plant and equipment are no longer amortized. The assets and liabilities are presented as HFS in the consolidated balance sheet when the sale is highly probable, the asset or disposal group is available for immediate sale in its present condition and management is committed to the sale, which should be expected to be completed within one year from the date of classification.
A discontinued operation is a component of the Company that can be clearly distinguished from the rest of the Company and represents a major line of business or geographic area, and the value of this component is expected to be recovered primarily through sale rather than continuing use.
Results of operations and any gain or loss from disposal are excluded from income before finance items and income taxes and are reported separately as income/loss from discontinued operations.
e) Foreign Currency TranslationThe functional currency of the Company, for each subsidiary of the Company, and for joint arrangements and associates, is the currency of the primary economic environment in which it operates. The functional currency of all of our operations is the US dollar. We translate non-US dollar balances for these operations into US dollars as follows:• Property, plant and equipment (“PP&E”), intangible
assets and equity method investments using the rates at the time of acquisition;
• Fair value through other comprehensive income (“FVOCI”) equity investments using the closing exchange rate as at the balance sheet date with translation gains and losses permanently recorded in Other Comprehensive Income (“OCI”);
• Deferred tax assets and liabilities using the closing exchange rate as at the balance sheet date with translation gains and losses recorded in income tax expense;
• Other assets and liabilities using the closing exchange rate as at the balance sheet date with translation gains and losses recorded in other income/expense; and
• Income and expenses using the average exchange rate for the period, except for expenses that relate to non-monetary assets and liabilities measured at historical rates, which are translated using the same historical rate as the associated non-monetary assets and liabilities.
f) Revenue RecognitionWe record revenue when evidence exists that all of the following criteria are met:• The significant risks and rewards of ownership of the
product have been transferred to the buyer;• Neither continuing managerial involvement to the degree
usually associated with ownership, nor effective control over the goods sold, has been retained;
• The amount of revenue can be reliably measured;• It is probable that the economic benefits associated with
the sale will flow to us; and• The costs incurred or to be incurred in respect of the sale
can be reliably measured.
These conditions are generally satisfied when title passes to the customer.
Gold Bullion SalesGold bullion is sold primarily in the London spot market. The sale price is fixed on the date of sale based on the gold spot price. Generally, we record revenue from gold bullion sales at the time of physical delivery, which is also the date that title to the gold passes.
Concentrate SalesUnder the terms of concentrate sales contracts with independent smelting companies, gold and copper sales prices are provisionally set on a specified future date after shipment based on market prices. We record revenues under these contracts at the time of shipment, which is also when the risk and rewards of ownership pass to the smelting companies, using forward market gold and copper prices on the expected date that final sales prices will be determined. Variations between the price recorded at the shipment date and the actual final price set under the smelting contracts are caused by changes in market gold and copper prices, which result in the existence of an embedded derivative in accounts receivable. The embedded derivative is recorded at fair value each period until final settlement occurs, with changes in fair value classified as provisional price adjustments and included in revenue in the consolidated statement of income and presented separately in note 6 of these consolidated financial statements.
Streaming ArrangementsAs the deferred revenue on streaming arrangements is considered variable consideration, an adjustment is made to the transaction price per unit each time there is a change in the underlying production profile of a mine (typically in the fourth quarter of each year). The change in the transaction price per unit results in a cumulative catch-up adjustment to revenue in the period in which the change is made, reflecting the new production profile expected to be delivered under the streaming agreement. A corresponding cumulative catch-up adjustment is made to accretion expense, reflecting the impact of the change in the deferred revenue balance. g) Exploration and EvaluationExploration expenditures are the costs incurred in the initial search for mineral deposits with economic potential or in the process of obtaining more information about existing mineral deposits. Exploration expenditures typically include costs associated with prospecting, sampling, mapping, diamond drilling and other work involved in searching for ore.
Evaluation expenditures are the costs incurred to establish the technical and commercial viability of developing mineral deposits identified through exploration activities or by acquisition. Evaluation expenditures include the cost of (i) establishing the volume and grade of deposits through drilling of core samples, trenching and sampling activities in an ore body that is classified as either a mineral resource or a proven and probable reserve; (ii) determining the optimal

BARRICK YEAR-END 2019 118 NOTES TO FINANCIAL STATEMENTS
methods of extraction and metallurgical and treatment processes; (iii) studies related to surveying, transportation and infrastructure requirements; (iv) permitting activities; and (v) economic evaluations to determine whether development of the mineralized material is commercially justified, including scoping, prefeasibility and final feasibility studies.
Exploration and evaluation expenditures are expensed as incurred unless management determines that probable future economic benefits will be generated as a result of the expenditures. Once the technical feasibility and commercial viability of a program or project has been demonstrated with a prefeasibility study, and we have recognized reserves in accordance with the Canadian Securities Administrators’ National Instrument 43-101, we account for future expenditures incurred in the development of that program or project in accordance with our policy for Property, Plant and Equipment, as described in note 2n. h) Production StageA mine that is under construction is determined to enter the production stage when the project is in the location and condition necessary for it to be capable of operating in the manner intended by management. We use the following factors to assess whether these criteria have been met: (1) the level of capital expenditures compared to construction cost estimates; (2) the completion of a reasonable period of testing of mine plant and equipment; (3) the ability to produce minerals in saleable form (within specifications); and (4) the ability to sustain ongoing production of minerals.
When a mine construction project moves into the production stage, the capitalization of certain mine construction costs ceases and costs are either capitalized to inventory or expensed, except for capitalizable costs related to property, plant and equipment additions or improvements, open pit stripping activities that provide a future benefit, underground mine development or expenditures that meet the criteria for capitalization in accordance with IAS 16 Property, Plant and Equipment. i) Earnings per Share Earnings per share is computed by dividing net income available to common shareholders by the weighted average number of common shares outstanding for the period. Diluted earnings per share reflects the potential dilution that could occur if additional common shares are assumed to be issued under securities that entitle their holders to obtain common shares in the future. For stock options, the number of additional shares for inclusion in diluted earnings per share calculations is determined using the treasury stock method. Under this method, stock options that have an exercise price less than the average market price of our common shares are assumed to be exercised and the proceeds are used to repurchase common shares at the average market price for the period. The incremental number of common shares issued under stock options and repurchased from proceeds is included in the calculation of diluted earnings per share. j) TaxationCurrent tax for each taxable entity is based on the local taxable income at the local statutory tax rate enacted or substantively enacted at the balance sheet date and includes adjustments to tax payable or recoverable in respect of previous periods.
Deferred tax is recognized using the balance sheet method in respect of all temporary differences between the tax bases of assets and liabilities, and their carrying amounts for financial reporting purposes, except as indicated below.
Deferred income tax liabilities are recognized for all taxable temporary differences, except:• Where the deferred income tax liability arises from the
initial recognition of goodwill, or the initial recognition of an asset or liability in an acquisition that is not a business combination and, at the time of the acquisition, affects neither the accounting profit nor taxable profit or loss; and
• In respect of taxable temporary differences associated with investments in subsidiaries and interests in joint arrangements, where the timing of the reversal of the temporary differences can be controlled and it is probable that the temporary differences will not reverse in the foreseeable future.
Deferred income tax assets are recognized for all deductible temporary differences and the carry forward of unused tax assets and unused tax losses, to the extent that it is probable that taxable profit will be available against which the deductible temporary differences and the carry forward of unused tax assets and unused tax losses can be utilized, except:• Where the deferred income tax asset relating to the
deductible temporary difference arises from the initial recognition of an asset or liability in an acquisition that is not a business combination and, at the time of the acquisition, affects neither the accounting profit nor taxable profit or loss; and
• In respect of deductible temporary differences associated with investments in subsidiaries and interests in joint arrangements, deferred tax assets are recognized only to the extent that it is probable that the temporary differences will reverse in the foreseeable future and taxable profit will be available against which the temporary differences can be utilized.
The carrying amount of deferred income tax assets is reviewed at each balance sheet date and reduced to the extent that it is no longer probable that sufficient taxable profit will be available to allow all or part of the deferred income tax asset to be utilized. To the extent that an asset not previously recognized fulfills the criteria for recognition, a deferred income tax asset is recorded.
Deferred tax is measured on an undiscounted basis at the tax rates that are expected to apply in the periods in which the asset is realized or the liability is settled, based on tax rates and tax laws enacted or substantively enacted at the balance sheet date.
Current and deferred tax relating to items recognized directly in equity are recognized in equity and not in the income statement.
Royalties and Special Mining TaxesIncome tax expense includes the cost of royalties and special mining taxes payable to governments that are calculated based on a percentage of taxable profit whereby taxable profit represents net income adjusted for certain items defined in the applicable legislation.

BARRICK YEAR-END 2019 119 NOTES TO FINANCIAL STATEMENTS
Indirect TaxesIndirect tax recoverable is recorded at its undiscounted amount, and is disclosed as non-current if not expected to be recovered within twelve months. k) Other Investments Investments in publicly quoted equity securities that are neither subsidiaries nor associates are categorized as FVOCI pursuant to the irrevocable election available in IFRS 9 for these instruments. FVOCI equity investments (referred to as “other investments”) are recorded at fair value with all realized and unrealized gains and losses recorded permanently in OCI. l) InventoryMaterial extracted from our mines is classified as either ore or waste. Ore represents material that, at the time of extraction, we expect to process into a saleable form and sell at a profit. Raw materials are comprised of both ore in stockpiles and ore on leach pads as processing is required to extract benefit from the ore. Ore is accumulated in stockpiles that are subsequently processed into gold/copper in a saleable form. The recovery of gold and copper from certain oxide ores is achieved through the heap leaching process. Work in process represents gold/copper in the processing circuit that has not completed the production process, and is not yet in a saleable form. Finished goods inventory represents gold/copper in saleable form.
Metal inventories are valued at the lower of cost and net realizable value. Cost is determined on a weighted average basis and includes all costs incurred, based on a normal production capacity, in bringing each product to its present location and condition. Cost of inventories comprises direct labor, materials and contractor expenses, including non-capitalized stripping costs; depreciation on PP&E including capitalized stripping costs; and an allocation of general and administrative costs. As ore is removed for processing, costs are removed based on the average cost per ounce/pound in the stockpile. Net realizable value is determined with reference to relevant market prices less applicable variable selling and processing costs.
Mine operating supplies represent commodity consumables and other raw materials used in the production process, as well as spare parts and other maintenance supplies that are not classified as capital items. Provisions are recorded to reduce mine operating supplies to net realizable value, which is generally calculated by reference to its salvage or scrap value, when it is determined that the supplies are obsolete. Provisions are reversed to reflect subsequent recoveries in net realizable value where the inventory is still on hand. m) RoyaltiesCertain of our properties are subject to royalty arrangements based on mineral production at the properties. The primary type of royalty is a net smelter return (NSR) royalty. Under this type of royalty we pay the holder an amount calculated as the royalty percentage multiplied by the value of gold production at market gold prices less third-party smelting, refining and transportation costs. Royalty expense is recorded on completion of the production or sales process in cost of sales. Other types of royalties include:• Net profits interest (NPI) royalty to other than a
government,
• Modified net smelter return (NSR) royalty,• Net smelter return sliding scale (NSRSS) royalty,• Gross proceeds sliding scale (GPSS) royalty,• Gross smelter return (GSR) royalty,• Net value (NV) royalty,• Land tenement (LT) royalty, and a• Gold revenue royalty. n) Property, Plant and Equipment
Estimated useful lives of Major Asset Categories
Buildings, plant and equipment 1 – 28 years
Underground mobile equipment 5 - 7 years
Light vehicles and other mobile equipment 1 - 7 years
Furniture, computer and office equipment 1 - 7 years
Buildings, Plant and EquipmentAt acquisition, we record buildings, plant and equipment at cost, including all expenditures incurred to prepare an asset for its intended use. These expenditures consist of: the purchase price; brokers’ commissions; and installation costs including architectural, design and engineering fees, legal fees, survey costs, site preparation costs, freight charges, transportation insurance costs, duties, testing and preparation charges.
We capitalize costs that meet the asset recognition criteria. Costs incurred that do not extend the productive capacity or useful economic life of an asset are considered repairs and maintenance expense and are accounted for as a cost of the inventory produced in the period.
Buildings, plant and equipment are depreciated on a straight-line basis over their expected useful life, which commences when the assets are considered available for use. Once buildings, plant and equipment are considered available for use they are measured at cost less accumulated depreciation and applicable impairment losses. Depreciation on equipment utilized in the development of assets, including open pit and underground mine development, is recapitalized as development costs attributable to the related asset.
Mineral PropertiesMineral properties consist of: the fair value attributable to mineral reserves and resources acquired in a business combination or asset acquisition; underground mine development costs; open pit mine development costs; capitalized exploration and evaluation costs; and capitalized interest. In addition, we incur project costs which are generally capitalized when the expenditures result in a future benefit.
i) Acquired Mining PropertiesOn acquisition of a mining property, we prepare an estimate of the fair value attributable to the proven and probable mineral reserves, mineral resources and exploration potential attributable to the property. The estimated fair value attributable to the mineral reserves and the portion of mineral resources considered to be probable of economic extraction at the time of the acquisition is depreciated on a units of production (“UOP”) basis whereby the denominator is the proven and probable reserves and the portion of mineral

BARRICK YEAR-END 2019 120 NOTES TO FINANCIAL STATEMENTS
resources considered to be probable of economic extraction based on the current life of mine (“LOM”) plan that benefit from the development and are considered probable of economic extraction. The estimated fair value attributable to mineral resources that are not considered to be probable of economic extraction at the time of the acquisition is not subject to depreciation until the resources become probable of economic extraction in the future. The estimated fair value attributable to exploration licenses is recorded as an intangible asset and is not subject to depreciation until the property enters production.
ii) Underground Mine Development CostsAt our underground mines, we incur development costs to build new shafts, drifts and ramps that will enable us to physically access ore underground. The time over which we will continue to incur these costs depends on the mine life. These underground development costs are capitalized as incurred.
Capitalized underground development costs are depreciated on a UOP basis, whereby the denominator is the estimated ounces/pounds of gold/copper in proven and probable reserves and the portion of resources considered probable of economic extraction based on the current LOM plan that benefit from the development and are considered probable of economic extraction.
iii) Open Pit Mine Development CostsIn open pit mining operations, it is necessary to remove overburden and other waste materials to access ore from which minerals can be extracted economically. The process of mining overburden and waste materials is referred to as stripping. Stripping costs incurred in order to provide initial access to the ore body (referred to as pre-production stripping) are capitalized as open pit mine development costs. Pre-production stripping costs are capitalized until an “other than de minimis” level of mineral is extracted, after which time such costs are either capitalized to inventory or, if it qualifies as an open pit stripping activity that provides a future benefit, to PP&E. We consider various relevant criteria to assess when an “other than de minimis” level of mineral is produced. Some of the criteria considered would include, but are not limited to, the following: (1) the amount of minerals mined versus total ounces in LOM ore; (2) the amount of ore tonnes mined versus total LOM expected ore tonnes mined; (3) the current stripping ratio versus the LOM strip ratio; and (4) the ore grade versus the LOM grade. Stripping costs incurred during the production stage of a pit are accounted for as costs of the inventory produced during the period that the stripping costs are incurred, unless these costs are expected to provide a future economic benefit to an identifiable component of the ore body. Components of the ore body are based on the distinct development phases identified by the mine planning engineers when determining the optimal development plan for the open pit. Production phase stripping costs generate a future economic benefit when the related stripping activity: (1) improves access to a component of the ore body to be mined in the future; (2) increases the fair value of the mine (or pit) as access to future mineral reserves becomes less costly; and (3) increases the productive capacity or extends the productive life of the mine (or pit). Production phase stripping
costs that are expected to generate a future economic benefit are capitalized as open pit mine development costs. Capitalized open pit mine development costs are depreciated on a UOP basis whereby the denominator is the estimated ounces/pounds of gold/copper in proven and probable reserves and the portion of resources considered probable of economic extraction based on the current LOM plan that benefit from the development and are considered probable of economic extraction.
Construction-in-ProgressAssets under construction are capitalized as construction-in-progress until the asset is available for use. The cost of construction-in-progress comprises its purchase price and any costs directly attributable to bringing it into working condition for its intended use. Construction-in-progress amounts related to development projects are included in the carrying amount of the development project. Construction-in-progress amounts incurred at operating mines are presented as a separate asset within PP&E. Construction-in-progress also includes deposits on long lead items. Construction-in-progress is not depreciated. Depreciation commences once the asset is complete and available for use.
Leasing ArrangementsLeases are recognized as a right-of-use asset and a corresponding liability at the date at which the leased asset is available for use by the Company. Each lease payment is allocated between the liability and finance cost. The finance cost is charged to profit or loss over the lease period so as to produce a constant periodic rate of interest on the remaining balance of the liability for each period. The right-of-use asset is depreciated over the shorter of the asset's useful life and the lease term on a straight-line basis.
Assets and liabilities arising from a lease are initially measured on a present value basis. Lease liabilities include the net present value of the following lease payments:
• fixed payments (including in-substance fixed payments), less any lease incentives receivable;
• variable lease payments that are based on an index or a rate;
• amounts expected to be payable by the lessee under residual value guarantees;
• the exercise price of a purchase option if the lessee is reasonably certain to exercise that option; and
• payments of penalties for terminating the lease, if the lease term reflects the lessee exercising that option.
The lease payments are discounted using the interest rate implicit in the lease. If that rate cannot be determined, the lessee’s incremental borrowing rate is used, being the rate that the lessee would have to pay to borrow the funds necessary to obtain an asset of similar value in a similar economic environment with similar terms and conditions.
Right-of-use assets are measured at cost comprising the following:
• the amount of the initial measurement of the lease liability;• any lease payments made at or before the
commencement date less any lease incentives received;• any initial direct costs; and• restoration costs.

BARRICK YEAR-END 2019 121 NOTES TO FINANCIAL STATEMENTS
Payments associated with short-term leases and leases of low-value assets are recognized on a straight-line basis as an expense in profit or loss. Short-term leases are leases with a lease term of 12 months or less. Low-value assets are generally comprised of IT equipment and small items of office furniture.
Capitalized InterestWe capitalize interest costs for qualifying assets. Qualifying assets are assets that require a significant amount of time to prepare for their intended use, including projects that are in the exploration and evaluation, development or construction stages. Qualifying assets also include significant expansion projects at our operating mines. Capitalized interest costs are considered an element of the cost of the qualifying asset which is determined based on gross expenditures incurred on an asset. Capitalization ceases when the asset is substantially complete or if active development is suspended or ceases. Where the funds used to finance a qualifying asset form part of general borrowings, the amount capitalized is calculated using a weighted average of rates applicable to the relevant borrowings during the period. Where funds borrowed are directly attributable to a qualifying asset, the amount capitalized represents the borrowing costs specific to those borrowings. Where surplus funds available out of money borrowed specifically to finance a project are temporarily invested, the total capitalized interest is reduced by income generated from short-term investments of such funds.
InsuranceWe record losses relating to insurable events as they occur. Proceeds receivable from insurance coverage are recorded at such time as receipt is receivable or virtually certain and the amount receivable is fixed or determinable. For business interruption insurance the amount recoverable is only recognized when receipt is virtually certain, as supported by notification of a minimum or proposed settlement amount from the insurance adjuster. o) Impairment (and Reversals of Impairment) of Non-Current AssetsWe review and test the carrying amounts of PP&E and intangible assets with finite lives when an indicator of impairment is considered to exist. Impairment assessments on PP&E and intangible assets are conducted at the level of the cash generating unit (“CGU”), which is the lowest level for which identifiable cash flows are largely independent of the cash flows of other assets and includes most liabilities specific to the CGU. For operating mines and projects, the individual mine/project represents a CGU for impairment testing. The recoverable amount of a CGU is the higher of Value in Use (“VIU”) and Fair Value Less Costs of Disposal (“FVLCD”). We have determined that the FVLCD is greater than the VIU amounts and is therefore used as the recoverable amount for impairment testing purposes. An impairment loss is recognized for any excess of the carrying amount of a CGU over its recoverable amount where both the recoverable amount and carrying value include the associated other assets and liabilities, including taxes where applicable, of the CGU. Where it is not appropriate to allocate the loss to a separate asset, an impairment loss related to a CGU is allocated to the carrying amount of the assets of the CGU on a pro rata basis based on the carrying amount of its non-monetary assets.
Impairment ReversalAn assessment is made at each reporting date to determine whether there is an indication that previously recognized impairment losses may no longer exist or may have decreased. A previously recognized impairment loss is reversed only if there has been a change in the assumptions used to determine the CGU’s recoverable amount since the last impairment loss was recognized. This reversal is recognized in the consolidated statements of income and is limited to the carrying value that would have been determined, net of any depreciation where applicable, had no impairment charge been recognized in prior years. When an impairment reversal is undertaken, the recoverable amount is assessed by reference to the higher of VIU and FVLCD. We have determined that the FVLCD is greater than the VIU amounts and is therefore used as the recoverable amount for impairment testing purposes. p) Intangible AssetsIntangible assets acquired by way of an asset acquisition or business combination are recognized if the asset is separable or arises from contractual or legal rights and the fair value can be measured reliably on initial recognition. On acquisition of a mineral property in the exploration stage, we prepare an estimate of the fair value attributable to the exploration licenses acquired, including the fair value attributable to mineral resources, if any, of that property. The fair value of the exploration license is recorded as an intangible asset (acquired exploration potential) as at the date of acquisition. When an exploration stage property moves into development, the acquired exploration potential attributable to that property is transferred to mining interests within PP&E.
We also have water rights associated with our mineral properties. Upon acquisition, they are measured at initial cost and are depreciated when they are being used. They are also subject to impairment testing when an indicator of impairment is considered to exist.
q) GoodwillUnder the acquisition method of accounting, the costs of business combinations are allocated to the assets acquired and liabilities assumed based on the estimated fair value at the date of acquisition. The excess of the fair value of consideration paid over the fair value of the identifiable net assets acquired is recorded as goodwill. Goodwill is not amortized; instead it is tested for impairment in the fourth quarter and also when there is an indicator of impairment. At the date of acquisition, goodwill is assigned to the CGU or group of CGUs that is expected to benefit from the synergies of the business combination. For the purposes of impairment testing, goodwill is allocated to the Company’s operating segments, which are our individual minesites, and corresponds to the level at which goodwill is internally monitored by the Chief Operating Decision Maker (“CODM”). The recoverable amount of an operating segment is the higher of VIU and FVLCD. A goodwill impairment is recognized for any excess of the carrying amount of the operating segment over its recoverable amount. Goodwill impairment charges are not reversible.

BARRICK YEAR-END 2019 122 NOTES TO FINANCIAL STATEMENTS
r) DebtDebt is recognized initially at fair value, net of financing costs incurred, and subsequently measured at amortized cost. Any difference between the amounts originally received and the redemption value of the debt is recognized in the consolidated statements of income over the period to maturity using the effective interest method.
s) Derivative Instruments and Hedge AccountingDerivative InstrumentsDerivative instruments are recorded at fair value on the consolidated balance sheet, classified based on contractual maturity. Derivative instruments are classified as either hedges of the fair value of recognized assets or liabilities or of firm commitments (“fair value hedges”), hedges of highly probable forecasted transactions (“cash flow hedges”) or non-hedge derivatives. Derivatives designated as either a fair value or cash flow hedge that are expected to be highly effective in achieving offsetting changes in fair value or cash flows are assessed on an ongoing basis to determine that they actually have been highly effective throughout the financial reporting periods for which they were designated. Derivative assets and derivative liabilities are shown separately in the balance sheet unless there is a legal right to offset and intent to settle on a net basis.
Fair Value HedgesChanges in the fair value of derivatives that are designated and qualify as fair value hedges are recorded in the consolidated statements of income, together with any changes in the fair value of the hedged asset or liability or firm commitment that is attributable to the hedged risk.
Cash Flow HedgesThe effective portion of changes in the fair value of derivatives that are designated and qualify as cash flow hedges is recognized in equity. The gain or loss relating to the ineffective portion is recognized in the consolidated statements of income. Amounts accumulated in equity are transferred to the consolidated statements of income in the period when the forecasted transaction impacts earnings. When the forecasted transaction that is hedged results in the recognition of a non-financial asset or a non-financial liability, the gains and losses previously deferred in equity are transferred from equity and included in the measurement of the initial carrying amount of the asset or liability.
When a derivative designated as a cash flow hedge expires or is sold and the forecasted transaction is still expected to occur, any cumulative gain or loss relating to the derivative that is recorded in equity at that time remains in equity and is recognized in the consolidated statements of income when the forecasted transaction occurs. When a forecasted transaction is no longer expected to occur, the cumulative gain or loss that was recorded in equity is immediately transferred to the consolidated statements of income.
Non-Hedge DerivativesDerivative instruments that do not qualify as either fair value or cash flow hedges are recorded at their fair value at the balance sheet date, with changes in fair value recognized in the consolidated statements of income.
t) Embedded DerivativesDerivatives embedded in other financial instruments or executory contracts are accounted for as separate derivatives when their risks and characteristics are not closely related to their host financial instrument or contract. In some cases, the embedded derivatives may be designated as hedges and are accounted for as described above. u) Environmental Rehabilitation ProvisionMining, extraction and processing activities normally give rise to obligations for environmental rehabilitation. Rehabilitation work can include facility decommissioning and dismantling; removal or treatment of waste materials; site and land rehabilitation, including compliance with and monitoring of environmental regulations; security and other site-related costs required to perform the rehabilitation work; and operation of equipment designed to reduce or eliminate environmental effects. The extent of work required and the associated costs are dependent on the requirements of relevant authorities and our environmental policies. Routine operating costs that may impact the ultimate closure and rehabilitation activities, such as waste material handling conducted as an integral part of a mining or production process, are not included in the provision. Abnormal costs arising from unforeseen circumstances, such as the contamination caused by unplanned discharges, are recognized as an expense and liability when the event that gives rise to an obligation occurs and reliable estimates of the required rehabilitation costs can be made. Provisions for the cost of each rehabilitation program are normally recognized at the time that an environmental disturbance occurs or a new legal or constructive obligation is determined. When the extent of disturbance increases over the life of an operation, the provision is increased accordingly. The major parts of the carrying amount of provisions relate to closure/rehabilitation of tailings facilities, heap leach pads and waste dumps; demolition of buildings/mine facilities; ongoing water treatment; and ongoing care and maintenance and security of closed mines. Costs included in the provision encompass all closure and rehabilitation activity expected to occur progressively over the life of the operation at the time of closure and post-closure in connection with disturbances as at the reporting date. Estimated costs included in the determination of the provision reflect the risks and probabilities of alternative estimates of cash flows required to settle the obligation at each particular operation. The expected rehabilitation costs are estimated based on the cost of external contractors performing the work or the cost of performing the work internally depending on management’s intention. The timing of the actual rehabilitation expenditure is dependent upon a number of factors such as the life and nature of the asset, the operating license conditions and the environment in which the mine operates. Expenditures may occur before and after closure and can continue for an extended period of time depending on rehabilitation requirements. Rehabilitation provisions are measured at the expected value of future cash flows, which exclude the effect of inflation, discounted to their present value using a current US dollar real risk-free pre-tax discount rate. The unwinding of the discount, referred to as accretion expense, is included in finance costs and results in an increase in the amount of the provision. Provisions are updated each reporting period

BARRICK YEAR-END 2019 123 NOTES TO FINANCIAL STATEMENTS
for changes to expected cash flows and for the effect of changes in the discount rate, and the change in estimate is added or deducted from the related asset and depreciated over the expected economic life of the operation to which it relates. Significant judgments and estimates are involved in forming expectations of future activities, the amount and timing of the associated cash flows and the period over which we estimate those cash flows. Those expectations are formed based on existing environmental and regulatory requirements or, if more stringent, our environmental policies which give rise to a constructive obligation. When provisions for closure and rehabilitation are initially recognized, the corresponding cost is capitalized as an asset, representing part of the cost of acquiring the future economic benefits of the operation. The capitalized cost of closure and rehabilitation activities is recognized in PP&E and depreciated over the expected economic life of the operation to which it relates.
Adjustments to the estimated amount and timing of future closure and rehabilitation cash flows are a normal occurrence in light of the significant judgments and estimates involved. The principal factors that can cause expected cash flows to change are: the construction of new processing facilities; changes in the quantities of material in reserves and resources with a corresponding change in the life of mine plan; changing ore characteristics that impact required environmental protection measures and related costs; changes in water quality that impact the extent of water treatment required; changes in discount rates; changes in foreign exchange rates; changes in Barrick’s closure policies; and changes in laws and regulations governing the protection of the environment. Rehabilitation provisions are adjusted as a result of changes in estimates and assumptions. Those adjustments are accounted for as a change in the corresponding cost of the related assets, including the related mineral property, except where a reduction in the provision is greater than the remaining net book value of the related assets, in which case the value is reduced to nil and the remaining adjustment is recognized in the consolidated statements of income. In the case of closed sites, changes in estimates and assumptions are recognized immediately in the consolidated statements of income. For an operating mine, the adjusted carrying amount of the related asset is depreciated prospectively. Adjustments also result in changes to future finance costs. v) Litigation and Other ProvisionsProvisions are recognized when a present obligation exists (legal or constructive), as a result of a past event, for which it is probable that an outflow of resources will be required to settle the obligation, and a reliable estimate can be made of the amount of the obligation. Provisions are discounted to their present value using a current US dollar real risk-free pre-tax discount rate and the accretion expense is included in finance costs.
Certain conditions may exist as of the date the financial statements are issued, which may result in a loss to the Company, but which will only be resolved when one or more future events occur or fail to occur. In assessing loss
contingencies related to legal proceedings that are pending against us or unasserted claims that may result in such proceedings, the Company with assistance from its legal counsel evaluates the perceived merits of any legal proceedings or unasserted claims as well as the perceived merits of the amount of relief sought or expected to be sought. If the assessment of a contingency suggests that a loss is probable, and the amount can be reliably estimated, then a loss is recorded. When a contingent loss is not probable but is reasonably possible, or is probable but the amount of loss cannot be reliably estimated, then details of the contingent loss are disclosed. Loss contingencies considered remote are generally not disclosed unless they involve guarantees, in which case we disclose the nature of the guarantee. Legal fees incurred in connection with pending legal proceedings are expensed as incurred. Contingent gains are only recognized when the inflow of economic benefits is virtually certain. w) Stock-Based CompensationWe recognize the expense related to these plans over the vesting period, beginning once the grant has been approved and announced to the beneficiaries. Cash-settled awards are measured at fair value initially using the market value of the underlying shares on the day preceding the date of the grant of the award and are required to be remeasured to fair value at each reporting date until settlement. The cost is then recorded over the vesting period of the award. This expense, and any changes in the fair value of the award, is recorded to the same expense category as the award recipient’s payroll costs. The cost of a cash-settled award is recorded within liabilities until settled. Barrick offers cash-settled (Restricted Share Units (“RSU”), Deferred Share Units (“DSU”), Performance Restricted Share Units (“PRSU”) and Performance Granted Share Units (“PGSU”)) awards to certain employees, officers and directors of the Company. Equity-settled awards are measured at fair value, using the Lattice model for stock options, with market related inputs as of the date of the grant. The cost is recorded over the vesting period of the award to the same expense category as the award recipient’s payroll costs (i.e., cost of sales or general and administrative) and the corresponding entry is recorded in equity. Equity-settled awards are not remeasured subsequent to the initial grant date. Barrick offers equity-settled (Employee Stock Option Plan (“ESOP”), Global Employee Share Plan (“GESP”), Long-Term Incentive Plan “LTIP”) and Barrick Share Purchase Plan (“BSPP”)) awards to certain employees, officers and directors of the Company.
We use the accelerated method (also referred to as ‘graded’ vesting) for attributing stock option expense over the vesting period. Stock option expense incorporates an expected forfeiture rate. The expected forfeiture rate is estimated based on historical forfeiture rates and expectations of future forfeiture rates. We make adjustments if the actual forfeiture rate differs from the expected rate.
Employee Stock Option PlanUnder Barrick’s ESOP, certain officers and key employees of the Corporation may purchase common shares at an exercise price that is equal to the closing share price on the day before the grant of the option. The grant date is the date when the

BARRICK YEAR-END 2019 124 NOTES TO FINANCIAL STATEMENTS
details of the award, including the number of options granted to the individual and the exercise price, are approved. Stock options vest equally over four years, beginning in the year after granting. The ESOP arrangement has graded vesting terms, and therefore multiple vesting periods must be valued and accounted for separately over their respective vesting periods. The compensation expense of the instruments issued for each grant under the ESOP is calculated using the Lattice model. The compensation expense is adjusted by the estimated forfeiture rate which is estimated based on historical forfeiture rates and expectations of future forfeiture rates. We make adjustments if the actual forfeiture rate differs from the expected rate.
Restricted Share UnitsUnder our RSU plan, selected employees are granted RSUs where each RSU has a value equal to one Barrick common share. RSUs generally vest within three years and upon vesting the employee will receive either cash or common shares purchased on the open market, depending on the terms of the grant. Additional RSUs are credited to reflect dividends paid on Barrick common shares over the vesting period. A liability for RSUs is measured at fair value on the grant date and is subsequently adjusted for changes in fair value. The liability is recognized on a straight-line basis over the vesting period, with a corresponding charge to compensation expense, as a component of corporate administration and operating segment administration. Compensation expenses for RSUs incorporate an estimate for expected forfeiture rates based on which the fair value is adjusted.
Deferred Share UnitsUnder our DSU plan, Directors must receive at least 63.6% of their basic annual retainer in the form of DSUs or cash to purchase common shares that cannot be sold, transferred or otherwise disposed of until the Director leaves the Board. Each DSU has the same value as one Barrick common share. DSUs must be retained until the Director leaves the Board, at which time the cash value of the DSUs is paid out. Additional DSUs are credited to reflect dividends paid on Barrick common shares. The initial fair value of the liability is calculated as of the grant date and is recognized immediately. Subsequently, at each reporting date and on settlement, the liability is remeasured, with any change in fair value recorded as compensation expense in the period. Officers may also elect to receive a portion or all of their incentive compensation in the form of DSUs. We also allow granting of DSUs to other officers and employees at the discretion of the Board Compensation Committee.
Performance Restricted Share UnitsUnder our PRSU plan, selected employees are granted PRSUs, where each PRSU has a value equal to one Barrick common share. PRSUs vest at the end of a three-year period and are settled in cash on the third anniversary of the grant date. Additional PRSUs are credited to reflect dividends paid on Barrick common shares over the vesting period. Vesting, and therefore the liability, is based on the achievement of performance goals and the target settlement ranges from 0% to 200% of the original grant of units. The value of a PRSU reflects the value of a Barrick common share and the number of share units issued is adjusted for its
relative performance against certain competitors and other internal financial performance measures. Therefore, the fair value of the PRSUs is determined with reference to the closing stock price at each remeasurement date. The initial fair value of the liability is calculated as of the grant date and is recognized within compensation expense using the straight-line method over the vesting period. Subsequently, at each reporting date and on settlement, the liability is remeasured, with any changes in fair value recorded as compensation expense. The fair value is adjusted for the revised estimated forfeiture rate.
Performance Granted Share UnitsUnder our PGSU plan, selected employees are granted PGSUs, where each PGSU has a value equal to one Barrick common share. Annual PGSU awards are determined based on a multiple ranging from one to six times base salary (depending on position and level of responsibility) multiplied by a performance factor. The number of PGSUs granted to a plan participant is determined by dividing the dollar value of the award by the closing price of Barrick common shares on the day prior to the grant, or if the grant date occurs during a blackout period, by the greater of (i) the closing price of Barrick common shares on the day prior to the grant date and (ii) the closing price of Barrick Common Shares on the first day following the expiration of the blackout.
For all PGSUs that were outstanding as at December 31, 2019, upon vesting the after-tax value of the award is used to purchase common shares and generally these shares cannot be sold until the employee retires or leaves Barrick. These PGSUs vest at the end of the third year from the date of the grant. The initial fair value of the liability is calculated as of the grant date and is recognized within compensation expense using the straight-line method over the vesting period. Subsequently, at each reporting date and on settlement, the liability is remeasured, with any changes in fair value recorded as compensation expense.
Long-Term Incentive Plan (Employees)Under our LTIP plan, restricted shares are issued to selected employees, subject to a satisfactory performance level being achieved during the 12 month period prior to the exercise date of each tranche of shares as well as a number of company related performance criteria. All employees to whom restricted shares have been granted are expected to meet this level of performance. The performance period is up to three years where the employee must remain in employment for the shares to vest. There are no market based vesting conditions on the share awards.
Long-Term Incentive Plan (Executive Directors)The LTIP is subject to three performance conditions: relative total shareholder return compared to the Euromoney Global Gold Index, total cash cost per ounce and reserve replacement ratio. No dividends are attributable during the vesting period.
BARRICK YEAR-END 2019 125 NOTES TO FINANCIAL STATEMENTS
Barrick Share Purchase PlanUnder our BSPP plan, certain Barrick employees can purchase Company shares through payroll deduction. Each year, employees may contribute 1%-10% of their combined base salary and annual short-term incentive, and Barrick will match 100% of the contribution, up to a maximum of C$5,000 or US$4,000 per year. Both Barrick and the employee make the contributions with the funds being transferred to a custodian who purchases Barrick Common Shares in the open market. Shares purchased with employee and Barrick contributions have no vesting requirement. Barrick recognizes the expense when Barrick contributions are made and has no ongoing liability.
Global Employee Share PlanUnder our GESP plan, Barrick employees are awarded Company Common Shares. These shares vest immediately, but must be held until the employee ceases to be employed by the Company. Barrick recognizes the expense when the award is announced and has no ongoing liability. x) Post-Retirement Benefits
Defined Contribution Pension PlansCertain employees take part in defined contribution employee benefit plans whereby we contribute up to a certain percentage of the employee’s annual salary. We also have a retirement plan for certain officers of Barrick under which we contribute 15% of the officer’s annual salary and annual short-term incentive. The contributions are recognized as compensation expense as incurred. The Company has no further payment obligations once the contributions have been paid.
Defined Benefit Pension PlansWe have qualified defined benefit pension plans that cover certain former United States and Canadian employees and provide benefits based on employees’ years of service. Our policy is to fund the amounts necessary on an actuarial basis to provide enough assets to meet the benefits payable to plan members. Independent trustees administer assets of the plans, which are invested mainly in fixed-income and equity securities. As well as the qualified plans, we have non-qualified defined benefit pension plans covering certain employees and former directors of Barrick. No funding is done on these plans and contributions for future years are required to be equal to benefit payments. Actuarial gains and losses arising from experience adjustments and changes in actuarial assumptions are charged or credited to equity in OCI in the period in which they arise. Our valuations are carried out using the projected unit credit method. We record the difference between the fair value of the plan assets and the present value of the plan obligations as an asset or liability on the consolidated balance sheets.
Pension Plan Assets and LiabilitiesPension plan assets, which consist primarily of fixed-income and equity securities, are valued using current market quotations. Plan obligations and the annual pension expense are determined on an actuarial basis and are affected by numerous assumptions and estimates including the market value of plan assets, estimates of the expected return on plan assets, discount rates, future wage increases and other assumptions. The discount rate and life expectancy are the assumptions that generally have the most significant impact on our pension cost and obligation.
Other Post-Retirement BenefitsWe provide post-retirement medical, dental, and life insurance benefits to certain employees. Actuarial gains and losses resulting from variances between actual results and economic estimates or actuarial assumptions are recorded in OCI. y) New Accounting Standards Effective in 2019
IFRS 16 LeasesWe have adopted the requirements of IFRS 16 Leases (“IFRS 16”) as of January 1, 2019. IFRS 16 specifies how to recognize, measure, present and disclose leases. The standard provides a single lessee accounting model, requiring lessees to recognize assets and liabilities for all major leases where a lessee has the right to control the use of an identified asset. We elected to apply IFRS 16 using the modified retrospective approach and therefore the comparative information has not been restated and continues to be reported under IAS 17 Leases and IFRIC 4: Determining Whether an Arrangement Contains a Lease. The details of accounting policy changes and the quantitative impact of these changes are described below.
In the previous year, the Company only recognized lease assets and lease liabilities in relation to leases that were classified as ‘finance leases’ under IAS 17. The assets were presented in property, plant and equipment and the liabilities as part of the Company’s borrowings. From January 1, 2019, leases are recognized as a right-of-use asset and a corresponding liability at the date at which the leased asset is available for use by the Company.
Assets and liabilities arising from a lease are initially measured on a present value basis. Lease liabilities include the net present value of the following lease payments:
• fixed payments (including in-substance fixed payments), less any lease incentives receivable;
• variable lease payments that are based on an index or a rate;
• amounts expected to be payable by the lessee under residual value guarantees;
• the exercise price of a purchase option if the lessee is reasonably certain to exercise that option; and
• payments of penalties for terminating the lease, if the lease term reflects the lessee exercising that option.
The lease payments are discounted using the interest rate implicit in the lease. If that rate cannot be determined, the lessee’s incremental borrowing rate is used, being the rate that the lessee would have to pay to borrow the funds

BARRICK YEAR-END 2019 126 NOTES TO FINANCIAL STATEMENTS
necessary to obtain an asset of similar value in a similar economic environment with similar terms and conditions.
Right-of-use assets are measured at cost comprising the following:
• the amount of the initial measurement of lease liability;• any lease payments made at or before the
commencement date less any lease incentives received;• any initial direct costs; and• restoration costs.
The finance cost is charged to profit or loss over the lease period so as to produce a constant periodic rate of interest on the remaining balance of the liability for each period. The right-of-use asset is depreciated over the shorter of the asset's useful life and the lease term on a straight-line basis.
Payments associated with short-term leases and leases of low-value assets are recognized on a straight-line basis as an expense in profit or loss. Short-term leases are leases with a lease term of 12 months or less. Low-value assets are generally comprised of IT equipment and small items of office furniture.
Impact on consolidated financial statementsOn adoption of IFRS 16, we recognized lease liabilities in relation to leases which had previously been classified as operating leases. These liabilities were measured at the present value of the remaining lease payments, discounted using the weighted average incremental borrowing rate as of January 1, 2019 of 5.83%.
For leases previously classified as finance leases the entity recognized the carrying amount of the lease asset and lease liability immediately before transition as the carrying amount of the right-of-use asset and the lease liability at the date of initial application. The measurement principles of IFRS 16 are applied after the date of initial application. The following table reconciles the Company’s operating lease obligations as at December 31, 2018 as previously disclosed in the Company’s 2018 Annual Financial Statements, to the lease obligations recognized on initial application of IFRS 16 at January 1, 2019:
Barrick operating lease commitments disclosed as atDecember 31, 2018 $ 167Add: embedded service contracts not previouslyassessed as a lease 38(Less): contracts reassessed as service agreements (130)(Less): short-term leases recognized on a straight-linebasis as expense (6)(Less): low-value leases recognized on a straight-linebasis as expense (1)(Less): discounting using the lessee’s incrementalborrowing rate of at January 1, 2019 (4)
Discounted leases recognized as at January 1, 2019 $ 64Add: finance lease liabilities recognized as atDecember 31, 2018 19Add: leases acquired as part of the merger withRandgold on January 1, 2019 28Discounted lease liability recognized as at January 1, 2019 $ 111Of which are:Current lease liabilities 37Non-current lease liabilities $ 74
The recognized right-of-use assets relate to the following types of assets:
December31, 2019
January 1,2019
Buildings, Plant & Equipment $ 63 $ 69Underground mobile equipment 7 7Light vehicles and other mobileequipment 5 9Total right-of-use assets $ 75 $ 85
Right-of-use assets were measured at the amount equal to the lease liability, except for onerous contracts.
The change in accounting policy affected the following items in the balance sheet on January 1, 2019:
• property, plant and equipment - increase by $85 million • deferred income tax assets - $nil.• debt - increase by $92 million
There was no net impact on deficit on January 1, 2019.
Consolidated net income decreased by $3 million for the year ended December 31, 2019 as a result of the adoption of IFRS 16. Additions to the right-of-use assets during the year ended December 31, 2019 were $49 million.
Practical expedients applied In applying IFRS 16 for the first time, we have used the following practical expedients permitted by the standard:
• the accounting for operating leases with a remaining lease term of less than 12 months as at January 1, 2019 as short-term leases;
• the exclusion of initial direct costs for the measurement of the right-of-use asset at the date of initial application;
• the adjustment of the right-of-use assets at the date of initial application by the amount of any provision for onerous contracts recognized immediately before the date of initial application; and
• to not separate non-lease components from lease components, and instead account for each lease component and any associated non-lease components as a single lease component.
z) New Accounting Standards Issued But Not Yet Effective
Certain new accounting standards and interpretations have been published that are not mandatory for the current period and have not been early adopted. These standards are not expected to have a material impact on Barrick in the current or future reporting periods.
3 > CRITICAL JUDGMENTS, ESTIMATES, ASSUMPTIONS AND RISKSMany of the amounts included in the consolidated balance sheet require management to make judgments and/or estimates. These judgments and estimates are continuously evaluated and are based on management’s experience and knowledge of the relevant facts and circumstances. Actual results may differ from the estimates. Information about such judgments and estimates is contained in the description of our accounting policies and/or other notes to the financial statements. The key areas where judgments, estimates and assumptions have been made are summarized below.

BARRICK YEAR-END 2019 127 NOTES TO FINANCIAL STATEMENTS
Life of Mine (“LOM”) Plans and Reserves and ResourcesEstimates of the quantities of proven and probable mineral reserves and mineral resources form the basis for our LOM plans, which are used for a number of important business and accounting purposes, including: the calculation of depreciation expense; the capitalization of production phase stripping costs; and forecasting the timing of the payments related to the environmental rehabilitation provision. In addition, the underlying LOM plans are used in the impairment tests for goodwill and non-current assets. In certain cases, these LOM plans have made assumptions about our ability to obtain the necessary permits required to complete the planned activities. We estimate our ore reserves and mineral resources based on information compiled by qualified persons as defined in accordance with the Canadian Securities Administrators’ National Instrument 43-101 Standards of Disclosure for Mineral Projects requirements. To calculate our gold reserves, as at December 31, 2019 we have used a gold price assumption of $1,200 per ounce, consistent with the prior year. To calculate our measured, indicated, and inferred gold resources, as at December 31, 2019 we have used a gold price assumption of $1,500 per ounce, consistent with the prior year. Refer to notes 19 and 21.
InventoryThe measurement of inventory including the determination of its net realizable value, especially as it relates to ore in stockpiles, involves the use of estimates. Net realizable value is determined with reference to relevant market prices less applicable variable selling expenses. Estimation is also required in determining the tonnage, recoverable gold and copper contained therein, and in determining the remaining costs of completion to bring inventory into its saleable form. Judgment also exists in determining whether to recognize a provision for obsolescence on mine operating supplies, and estimates are required to determine salvage or scrap value of supplies. Estimates of recoverable gold or copper on the leach pads are calculated from the quantities of ore placed on the leach pads (measured tonnes added to the leach pads), the grade of ore placed on the leach pads (based on assay data) and a recovery percentage (based on ore type).
Impairment and Reversal of Impairment for Non-Current Assets and Impairment of GoodwillGoodwill and non-current assets are tested for impairment if there is an indicator of impairment or reversal of impairment, and in the case of goodwill annually during the fourth quarter, for all of our operating segments. We consider both external and internal sources of information for indications that non-current assets and/or goodwill are impaired. External sources of information we consider include changes in the market, economic and legal environment in which the CGU operates that are not within its control and affect the recoverable amount of mining interests and goodwill. Internal sources of information we consider include the manner in which mining properties and plant and equipment are being used or are expected to be used and indications of economic performance of the assets. Calculating the FVLCD of CGUs for non-current asset and goodwill impairment tests requires management to make estimates and assumptions with respect to future production levels, operating, capital and closure costs in our LOM plans, future metal prices, foreign exchange rates, Net Asset Value (“NAV”) multiples, value of reserves outside LOM
plans in relation to the assumptions related to comparable entities and the market values per ounce and per pound and discount rates. Changes in any of the assumptions or estimates used in determining the fair values could impact the impairment analysis. Refer to notes 2o, 2q and 21 for further information.
Provisions for Environmental Rehabilitation Management assesses its provision for environmental rehabilitation on an annual basis or when new information becomes available. This assessment includes the estimation of the future rehabilitation costs, the timing of these expenditures, and the impact of changes in discount rates and foreign exchange rates. The actual future expenditures may differ from the amounts currently provided if the estimates made are significantly different than actual results or if there are significant changes in environmental and/or regulatory requirements in the future. Refer to notes 2u and 27 for further information.
With respect to our U.S. properties, under the Comprehensive Environmental Response, Compensation, and Liability Act of 1980 (“CERCLA”) and its state law equivalents, present or past owners of a property may be held jointly and severally liable for cleanup costs or forced to undertake remedial actions in response to unpermitted releases of hazardous substances at such property, in addition to, among other potential consequences, potential liability to governmental entities for the cost of damages to natural resources, which may be substantial. These subject properties are referred to as “superfund” sites. In addition to properties that have previously been designated as such, there is a chance that our current or legacy operations not currently designated as superfund sites in the U.S. could also be so designated as a superfund site in the future, exposing Barrick to potential further liability under CERCLA. In 2017, the U.S. Environmental Protection Agency announced it is considering listing on the CERCLA National Priorities List a 322-square-mile site in the San Mateo basin in New Mexico (“San Mateo Site”) due to alleged surface and groundwater contamination from past uranium mining. The San Mateo Site includes legacy operations of our wholly-owned subsidiary Homestake Mining Company of California (“Homestake”). In the fourth quarter of 2019, Homestake entered into a voluntary Administrative Order on Consent obligating Homestake and two other potentially responsible companies to conduct a study of groundwater conditions in a portion of the San Mateo uranium mining district. The Company has made an accrual for the estimated cost of completing this work.
TaxesManagement is required to make estimations regarding the tax basis of assets and liabilities and related deferred income tax assets and liabilities, amounts recorded for uncertain tax positions, the measurement of income tax expense and indirect taxes such as royalties and export duties, and estimates of the timing of repatriation of earnings, which would impact the recognition of withholding taxes and taxes related to the outside basis on subsidiaries/associates. While these amounts represent management’s best estimate based on the laws and regulations that exist at the time of preparation, we operate in certain jurisdictions that have an increased degree of political and sovereign risk and while host governments have historically supported the development of natural resources by foreign companies, there is a risk that fiscal reform changes with respect to existing investments
BARRICK YEAR-END 2019 128 NOTES TO FINANCIAL STATEMENTS
could unexpectedly impact the tax basis of assets and liabilities, and related deferred income tax assets and liabilities, and estimates of the timing of repatriation of earnings. This could necessitate future adjustments to tax income and expense already recorded. A number of these estimates require management to make estimates of future taxable profit, as well as the recoverability of indirect taxes, and if actual results are significantly different than our estimates, the ability to realize the deferred tax assets and indirect tax receivables recorded on our balance sheet could be impacted. Refer to notes 2j, 12 and 30 for further information.
ContingenciesContingencies can be either possible assets or possible liabilities arising from past events which, by their nature, will only be resolved when one or more future events not wholly within our control occur or fail to occur. The assessment of such contingencies inherently involves the exercise of significant judgment and estimates of the outcome of future events. In assessing loss contingencies related to legal proceedings that are pending against us or unasserted claims that may result in such proceedings or regulatory or government actions that may negatively impact our business or operations, the Company with assistance from its legal counsel evaluates the perceived merits of any legal proceedings or unasserted claims or actions as well as the perceived merits of the nature and amount of relief sought or expected to be sought, when determining the amount, if any, to recognize as a contingent liability or assessing the impact on the carrying value of assets. Contingent assets are not recognized in the consolidated financial statements. Refer to note 36 for more information.
Pascua-LamaThe Pascua-Lama project received $424 million as at December 31, 2019 ($443 million as at December 31, 2018) in value added tax (“VAT”) refunds in Chile relating to the development of the Chilean side of the project. Under the current arrangement this amount must be repaid if the project does not evidence exports for an amount of $3,538 million within a term that expires on December 31, 2026, unless extended. Interest on this amount would accrue from the date of non-compliance.
In addition, we have recorded $72 million in VAT recoverable in Argentina as at December 31, 2019 ($112 million as at December 31, 2018) relating to the development of the Argentinean side of the project. These amounts may not be fully recoverable if the project does not enter into production and are subject to foreign currency risk as the amounts are recoverable in Argentine pesos.
Streaming TransactionsThe upfront cash deposit received from Royal Gold on the gold and silver streaming transaction for production linked to Barrick’s 60% interest in the Pueblo Viejo mine has been accounted for as deferred revenue since we have determined that it is not a derivative as it will be satisfied through the delivery of non-financial items (i.e., gold and silver) rather than cash or financial assets. It is our intention to settle the obligations under the streaming arrangement through our own production and if we were to fail to settle the obligations with Royal Gold through our own production, this would lead to the streaming arrangement becoming a derivative. This would cause a change to the accounting treatment, resulting in the revaluation of the fair value of the agreement through profit
and loss on a recurring basis. Refer to note 29 for further details.
The deferred revenue component of our streaming agreements is considered variable and is subject to retroactive adjustment when there is a change in the timing of the delivery of ounces or in the underlying production profile of the relevant mine. The impact of such a change in the timing or quantity of ounces to be delivered under a streaming agreement will result in retroactive adjustments to both the deferred revenue recognized and the accretion recorded prior to the date of the change. Refer to note 2f. There was a $22million cumulative catch-up adjustment recorded in the fourth quarter of 2019 related to this streaming transaction as that is when the updated LOM was completed.
Our silver sale agreement with Wheaton Precious Metals Corp. (“Wheaton”) requires us to deliver 25% of the life of mine silver production from the Pascua-Lama project once it is constructed and required delivery of 100% of our silver production from Lagunas Norte, Pierina and Veladero mines until March 31, 2018. The completion date for Pascua-Lama was originally December 31, 2015 but was subsequently extended to June 30, 2020. Per the terms of the amended silver purchase agreement, if the requirements of the completion guarantee have not been satisfied by June 30, 2020, the agreement may be terminated by Wheaton, in which case, they will be entitled to the return of the upfront consideration paid less credit for silver delivered up to the date of that event. The residual liability at December 31, 2019is $253 million.
In the fourth quarter of 2019, we completed a study of the Pascua-Lama project and concluded that we do not have a plan that meets our investment criteria under our current assumptions. As a result, the deferred revenue liability was derecognized, and a current liability was recognized for the cash liability payable to Wheaton of $253 million. This adjustment resulted in $628 million recorded in Other Income (refer to note 9) and recognizes the significant uncertainty with the timing and quantity of the delivery of any future silver production from Pascua-Lama.
Zambian Tax MattersThe mining taxes assessed to the Lumwana Mine have contradicted the Development Agreement that was finalized between Lumwana Mining Company Limited (“LMC”) and the Government of Zambia on December 16, 2005. In 2015, the Company began to take steps to preserve its rights under the Development Agreement and started to engage in formal discussions with the government to redress historical tax issues relating to the Development Agreement. On October 3, 2018, a deed of settlement was signed by the Government of Zambia and LMC. The deed provided that, within 30 days of the deed, LMC shall file tax returns for 2012 through 2017, and the government shall have the right to conduct and complete an audit of the returns. The audit of these tax returns by the Zambian tax authority was completed in the fourth quarter of 2019 and we recorded a $50 million asset reflecting the final settlement of this matter. We also released historical accruals related to customs duty and indirect taxes resulting in a total of $216 million recognized in Other Income in 2019 (refer to note 9).
Business CombinationsBusiness combinations are accounted for using the acquisition method of accounting. The determination of fair
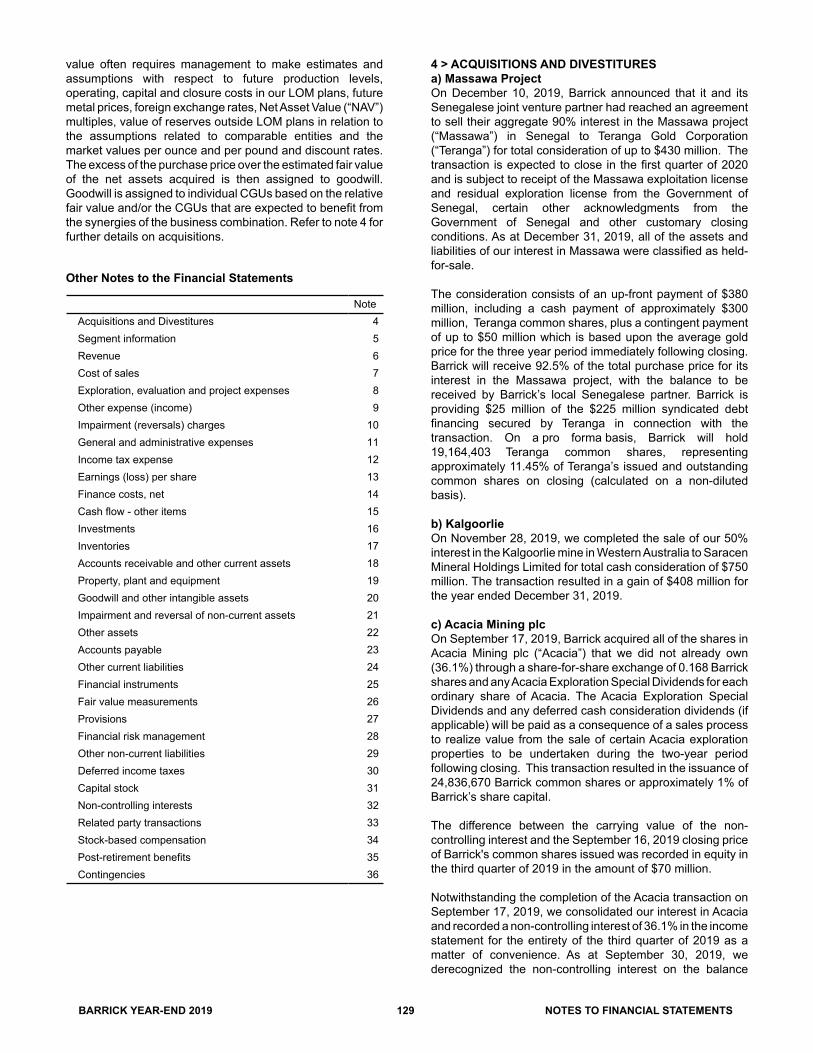
BARRICK YEAR-END 2019 129 NOTES TO FINANCIAL STATEMENTS
value often requires management to make estimates and assumptions with respect to future production levels, operating, capital and closure costs in our LOM plans, future metal prices, foreign exchange rates, Net Asset Value (“NAV”) multiples, value of reserves outside LOM plans in relation to the assumptions related to comparable entities and the market values per ounce and per pound and discount rates. The excess of the purchase price over the estimated fair value of the net assets acquired is then assigned to goodwill. Goodwill is assigned to individual CGUs based on the relative fair value and/or the CGUs that are expected to benefit from the synergies of the business combination. Refer to note 4 for further details on acquisitions.
Other Notes to the Financial Statements
NoteAcquisitions and Divestitures 4Segment information 5Revenue 6Cost of sales 7Exploration, evaluation and project expenses 8Other expense (income) 9Impairment (reversals) charges 10General and administrative expenses 11Income tax expense 12Earnings (loss) per share 13Finance costs, net 14Cash flow - other items 15Investments 16Inventories 17Accounts receivable and other current assets 18Property, plant and equipment 19Goodwill and other intangible assets 20Impairment and reversal of non-current assets 21Other assets 22Accounts payable 23Other current liabilities 24Financial instruments 25Fair value measurements 26Provisions 27Financial risk management 28Other non-current liabilities 29Deferred income taxes 30Capital stock 31Non-controlling interests 32Related party transactions 33Stock-based compensation 34Post-retirement benefits 35Contingencies 36
4 > ACQUISITIONS AND DIVESTITURESa) Massawa ProjectOn December 10, 2019, Barrick announced that it and its Senegalese joint venture partner had reached an agreement to sell their aggregate 90% interest in the Massawa project (“Massawa”) in Senegal to Teranga Gold Corporation (“Teranga”) for total consideration of up to $430 million. The transaction is expected to close in the first quarter of 2020 and is subject to receipt of the Massawa exploitation license and residual exploration license from the Government of Senegal, certain other acknowledgments from the Government of Senegal and other customary closing conditions. As at December 31, 2019, all of the assets and liabilities of our interest in Massawa were classified as held-for-sale.
The consideration consists of an up-front payment of $380 million, including a cash payment of approximately $300 million, Teranga common shares, plus a contingent payment of up to $50 million which is based upon the average gold price for the three year period immediately following closing. Barrick will receive 92.5% of the total purchase price for its interest in the Massawa project, with the balance to be received by Barrick’s local Senegalese partner. Barrick is providing $25 million of the $225 million syndicated debt financing secured by Teranga in connection with the transaction. On a pro forma basis, Barrick will hold 19,164,403 Teranga common shares, representing approximately 11.45% of Teranga’s issued and outstanding common shares on closing (calculated on a non-diluted basis).
b) KalgoorlieOn November 28, 2019, we completed the sale of our 50%interest in the Kalgoorlie mine in Western Australia to Saracen Mineral Holdings Limited for total cash consideration of $750 million. The transaction resulted in a gain of $408 million for the year ended December 31, 2019.
c) Acacia Mining plcOn September 17, 2019, Barrick acquired all of the shares in Acacia Mining plc (“Acacia”) that we did not already own (36.1%) through a share-for-share exchange of 0.168 Barrick shares and any Acacia Exploration Special Dividends for each ordinary share of Acacia. The Acacia Exploration Special Dividends and any deferred cash consideration dividends (if applicable) will be paid as a consequence of a sales process to realize value from the sale of certain Acacia exploration properties to be undertaken during the two-year period following closing. This transaction resulted in the issuance of 24,836,670 Barrick common shares or approximately 1% of Barrick’s share capital.
The difference between the carrying value of the non-controlling interest and the September 16, 2019 closing price of Barrick's common shares issued was recorded in equity in the third quarter of 2019 in the amount of $70 million.
Notwithstanding the completion of the Acacia transaction on September 17, 2019, we consolidated our interest in Acacia and recorded a non-controlling interest of 36.1% in the income statement for the entirety of the third quarter of 2019 as a matter of convenience. As at September 30, 2019, we derecognized the non-controlling interest on the balance

BARRICK YEAR-END 2019 130 NOTES TO FINANCIAL STATEMENTS
sheet related to our former 63.9% ownership of Acacia to reflect our current 100% interest.
On January 24, 2020, Barrick announced that the Company had ratified the creation of Twiga Minerals Corporation (“Twiga”) at a signing ceremony with the President of Tanzania, formalizing the establishment of a joint venture between Barrick and the Government of Tanzania (“GoT”) and resolution of all outstanding disputes between Barrick and the GoT, including the lifting of the previous concentrate export ban, effective immediately. The GoT will receive a free carried shareholding of 16% in each of the former Acacia mines (Bulyanhulu, Buzwagi and North Mara), and will receive its half of the economic benefits from taxes, royalties, clearing fees and participation in all cash distributions made by the mines and Twiga, after the recoupment of capital investments. Twiga will provide management services to the mines.
Barrick and the GoT continue to fulfill their respective obligations to satisfy all conditions of the signed agreement, primarily with respect to the execution and delivery of formal termination documents for the settlement of all outstanding disputes between the two parties.
Operating results are included at 100% from October 1, 2019 up until the GoT's 16% free-carried interest is made effective, which is expected to be January 1, 2020, and on an 84% basis thereafter. Refer to note 36 for further details on the agreement and impact on outstanding contingencies.
d) Nevada Joint VentureOn March 10, 2019, we entered into an implementation agreement with Newmont Mining Corporation, now Newmont Corporation, ("Newmont ") to create a joint venture combining our respective mining operations, assets, reserves and talent in Nevada, USA. This includes Barrick's Cortez, Goldstrike, Turquoise Ridge and Goldrush properties and Newmont's Carlin, Twin Creeks, Phoenix, Long Canyon and Lone Tree properties. Barrick is the operator of the joint venture and owns 61.5%, with Newmont owning the remaining 38.5% of the joint venture. On July 1, 2019, the transaction concluded establishing Nevada Gold Mines LLC ("Nevada Gold Mines"). Barrick, as the majority joint venture partner, has the right to appoint a majority of the board members and can therefore control decisions requiring majority approval including, but not limited to, LOM plans, budgets and capital projects. Therefore, we have determined that Barrick controls Nevada Gold Mines and began consolidating the operating results, cash flows and net assets from July 1, 2019 with a 38.5% non-controlling interest.
We have determined that the transaction to acquire the Newmont mines represents a business combination with Barrick identified as the acquirer. We have undertaken a purchase price exercise to determine the fair value of the Newmont mines acquired and the fair value of the non-controlling interest of the Barrick mines contributed as consideration. The table below presents the final allocation of the purchase price to the assets and liabilities acquired. This allocation was completed in the fourth quarter of 2019. The $1,645 million difference between the carrying value and the fair value of the non-controlling interest in the Barrick mines contributed was recorded in equity in the third quarter of 2019.
millions
Fair value of non-controlling interest of Barrickmines contributed $ 3,897
Final fair value allocation of Newmont mines acquiredCurrent assets $ 149Inventory 970Property, plant and equipment 3,534Goodwill 2,520Total assets $ 7,173
Current liabilities $ 119Deferred income tax liabilities 268Provisions 449Total liabilities $ 836Non-controlling interests 2,440Net assets acquired $ 3,897
The Barrick mines in which we held 100% prior to the creation of Nevada Gold Mines (Cortez, Goldstrike and Goldrush) will continue to be accounted for at historical cost and continue to be consolidated with a non-controlling interest in these mines recorded as of July 1, 2019. Prior to July 1, 2019, our 75% interest in the Turquoise Ridge mine was accounted for as a joint operation and following its contribution to Nevada Gold Mines it has been consolidated with a non-controlling interest. It was determined that the contribution of our 75%share of the assets and liabilities of Turquoise Ridge to Nevada Gold Mines resulted in a requirement to remeasure our retained interest at fair value as Turquoise Ridge was previously accounted for as a joint operation and we now have control and consolidate. As a result, we recognized a gain of $1.9 billion in the third quarter of 2019.
We primarily used a discounted cash flow model (being the net present value of expected future cash flows) to determine the fair value of the mining interests and used a replacement cost approach in determining the fair value of buildings, plant and equipment. Expected future cash flows are based on estimates of future gold prices inclusive of a $1,300 gold price and projected future revenues, estimated quantities of ore reserves and mineral resources, including expected conversions of resources to reserves, expected future production costs and capital expenditures based on the life of mine plans for the mines as at the acquisition date.
Goodwill arose on the acquisition principally because of the following factors: 1) it combines high-quality gold reserves in one of the world’s most prolific gold districts, positioning the Company for sustainable growth; 2) the ability to optimize ore sources and production schedules across the joint venture; and 3) the recognition of a deferred tax liability for the difference between the assigned values and the tax bases of assets acquired and liabilities assumed at amounts that do not reflect fair value. The goodwill is not deductible for income tax purposes.
Since July 1, 2019, the Newmont mines acquired contributed revenue of $1,184 million and net income of $322 million for the year ended December 31, 2019. If the acquisition had occurred on January 1, 2019, consolidated revenue and

BARRICK YEAR-END 2019 131 NOTES TO FINANCIAL STATEMENTS
consolidated net income would have been $10,745 million and $4,500 million, respectively.
Acquisition-related costs of approximately $30 million were expensed in 2019 and were presented as part of corporate development costs in exploration, evaluation & project expense.
e) Randgold Resources Limited (“Randgold”) MergerOn January 1, 2019, we acquired 100% of the issued and outstanding shares of Randgold Resources Limited (the “Merger”). Each Randgold shareholder received 6.1280 common shares of Barrick for each Randgold share, which resulted in the issuance of 583,669,178 Barrick common shares. After this share issuance, Barrick shareholders owned 66.7%, while former Randgold shareholders owned 33.3%, of the shares of the combined company. We have determined that this transaction represents a business combination with Barrick identified as the acquirer. Based on the December 31, 2018 closing share price of Barrick’s common shares, the total consideration of the acquisition was $7.9 billion. We began consolidating the operating results, cash flows and net assets of Randgold from January 1, 2019.
Randgold was a publicly traded mining company with ownership interests in the following gold mines: Kibali in the Democratic Republic of Congo; Tongon in Côte d’Ivoire; Loulo-Gounkoto and Morila in Mali; and the Massawa project in Senegal.
The table below presents the purchase cost and our allocation of the purchase price to the assets acquired and liabilities assumed. This allocation was finalized in the fourth quarter of 2019.
millionsPurchase Cost Fair value of equity shares issued $ 7,903Fair value of restricted shares issued 6Fair value of consideration $ 7,909
Final Fair Value at AcquisitionCash $ 751Other current assets 319Equity in investees 3,253Property, plant and equipment 3,869Other assets 230Goodwill 1,672Total assets $10,094
Current liabilities $ 539Deferred income tax liabilities 688Provisions 55Debt1 31Total liabilities $ 1,313Non-controlling interests 872Net assets $ 7,909
1 Debt mainly relates to leases as a result of adopting IFRS16.
In accordance with the acquisition method of accounting, the acquisition cost has been allocated to the underlying assets
acquired and liabilities assumed, based primarily upon their estimated fair values at the date of acquisition. We primarily used a discounted cash flow model (being the net present value of expected future cash flows) to determine the fair value of the mining interests and used a replacement cost approach in determining the fair value of buildings, plant and equipment. Expected future cash flows are based on estimates of future gold prices and projected future revenues, estimated quantities of ore reserves and mineral resources, including expected conversions of resources to reserves, expected future production costs and capital expenditures based on the life of mine plans as at the acquisition date. The excess of acquisition cost over the net identifiable assets acquired represents goodwill.
Goodwill arose on the acquisition principally because of the following factors: 1) it significantly strengthened Barrick’s position in the industry relative to high-quality gold reserves in many of the world’s most prolific gold districts, positioning the Company for sustainable growth; 2) it included the acquisition of a proven management team, with a shared vision and commitment to excellence, and a powerful financial base that will support sustainable investment in growth; and 3) the recognition of a deferred tax liability for the difference between the assigned values and the tax bases of assets acquired and liabilities assumed at amounts that do not reflect fair value. The goodwill is not deductible for income tax purposes.
The fair value of accounts receivable was $193 million as at January 1, 2019, which was equivalent to the contractual amount.
Prior to the Merger, Randgold had received various tax claims from the State of Mali in respect of its Mali operations, which totaled $267.7 million as at January 1, 2019. The total amount of the various tax claims, not including advances made in good faith to date, stood at $275 million as at December 31, 2019. During 2016, Randgold received payment demands in respect of certain of these disputed amounts, and consequently, from 2016 up to December 2018, Randgold paid tax advances to the State of Mali to support the resolution of the tax disputes; which, after offsetting other tax payments, resulted in a receiving being recorded of $41.1 million. As part of the purchase price allocation for the Merger, the fair value of this receivable was reduced to nil. In 2019, a further $60 millionwas paid as part of a settlement proposal to resolve outstanding assessments with respect to 2016 and prior year periods. This amount was recorded as a provision in the purchase price allocation. Refer to note 36 for further details.
Since it has been consolidated from January 1, 2019, Randgold contributed revenue of $1,390 million and net income of $241 million for the year ended December 31, 2019.
Acquisition-related costs of approximately $37 million were expensed in 2018 and were presented as part of corporate development costs in exploration, evaluation & project expense.
f) Investment in Shandong Gold MiningOn September 24, 2018, we entered into a mutual investment agreement with Shandong Gold Group Co., Ltd. (“Shandong Gold”), further strengthening Barrick’s partnership with one of China’s leading mining companies. Under the agreement,

BARRICK YEAR-END 2019 132 NOTES TO FINANCIAL STATEMENTS
Shandong Gold was able to purchase up to $300 million of Barrick shares, and Barrick was able to invest an equivalent amount in shares of Shandong Gold Mining Co., Ltd., a publicly listed company controlled by Shandong Gold within a 12-month period. Shares were purchased on the open market and purchases made by Barrick were accounted for
as other investments with changes in fair value recorded in OCI. As at December 31, 2019, Barrick has purchased approximately $120 million of shares of Shandong Gold Mining Co., Ltd.
5 > SEGMENT INFORMATIONStarting in the first quarter of 2019, management reviews the operating results and assesses performance of our operations in Nevada at an individual minesite level; therefore our Cortez and Goldstrike minesites, previously presented as Barrick Nevada, have been presented separately. Barrick’s business is organized into nineteen minesites and two projects. Barrick’s CODM reviews the operating results, assesses performance and makes capital allocation decisions at the minesite, Company and/or project level. Upon completion of the Merger, Mark Bristow, as President and Chief Executive Officer, has assumed this role. Each individual minesite and the Pascua-Lama project are operating segments for financial reporting purposes. Following the Merger and the Nevada Gold Mines and Acacia transactions, we re-evaluated our reportable operating segments and no longer report on our interests in the following non-core properties: Lagunas Norte and Pascua-Lama. Our presentation of our reportable operating segments consists of nine gold mines (Carlin, Cortez, Turquoise Ridge, Pueblo Viejo, Loulo-Gounkoto, Kibali, Veladero, Porgera and North Mara). The remaining operating segments, including our remaining gold mines, copper mines and projects, have been grouped into an “other” category and will not be reported on individually. Segment performance is evaluated based on a number of measures including operating income before tax, production levels and unit production costs. Certain costs are managed on a consolidated basis and are therefore not reflected in segment income. Prior period figures have been restated to reflect this disaggregation.

BARRICK YEAR-END 2019 133 NOTES TO FINANCIAL STATEMENTS
Consolidated Statements of Income Information
Cost of Sales
For the year ended December 31, 2019 Revenue
Direct mining,royalties and
communityrelations Depreciation
Exploration,evaluation and
project expenses
Other expenses (income)1
Segmentincome
(loss)Carlin2,3 $1,862 $998 $312 $17 $4 $531Cortez2 1,325 511 240 8 16 550Turquoise Ridge2,4 688 285 140 4 — 259Pueblo Viejo2 1,409 525 196 12 — 676Loulo-Gounkoto2 1,007 456 295 12 6 238Kibali 505 207 196 3 (9) 108Veladero 386 208 115 3 3 57Porgera 403 242 42 2 4 113North Mara2 462 213 97 — 6 146Other Mines2 2,175 1,426 554 19 46 130Reportable segment income $10,222 $5,071 $2,187 $80 $76 $2,808Share of equity investee (505) (207) (196) (3) 9 (108)Segment income $9,717 $4,864 $1,991 $77 $85 $2,700
Consolidated Statements of Income Information
Cost of Sales
For the year ended December 31, 2018 Revenue
Direct mining,royalties and
communityrelations Depreciation
Exploration,evaluation and
project expenses
Other expenses (income)1
Segmentincome (loss)
Carlin2,3 $1,066 $624 $262 $19 ($5) $166Cortez2 1,589 442 386 16 19 726Turquoise Ridge2,4 331 178 28 — (1) 126Pueblo Viejo2 1,333 547 185 21 1 579Loulo-Gounkoto2 — — — — — —Kibali — — — — — —Veladero 366 189 121 2 1 53Porgera 269 170 42 — 1 56North Mara2 423 202 62 — 12 147Other Mines2 1,866 1,401 334 14 69 48Reportable segment income $7,243 $3,753 $1,420 $72 $97 $1,901Share of equity investee — — — — — —Segment income $7,243 $3,753 $1,420 $72 $97 $1,901
1 Includes accretion expense, which is included with finance costs in the consolidated statements of income. For the year ended December 31, 2019, accretion expense was $53 million (2018: $53 million).
2 Includes non-controlling interest portion of revenues, cost of sales and segment income (loss) for the year ended December 31, 2019, for Pueblo Viejo, $566 million, $286 million, $274 million (2018: $535 million, $289 million, $237 million), Nevada Gold Mines, $1,049 million, $704 million, $329 million(2018:$nil, $nil, $nil), Tanzania mines, $169 million, $125 million, $31 million (2018: $240 million, $163 million, $61 million), Loulo-Gounkoto $201 million, $150 million, $48 million (2018: $nil, $nil, $nil) and Tongon $39 million, $41 million, $(2) million (2018: $nil, $nil, $nil).
3 On July 1, 2019, Barrick's Goldstrike and Newmont's Carlin mines were contributed to Nevada Gold Mines and are now operated as one segment referred to as Carlin. As a result, the amounts presented represent Goldstrike (including South Arturo) up until June 30, 2019, and the combined results of Carlin (including Goldstrike) thereafter including non-controlling interest. Refer to note 4.
4 Barrick owned 75% of Turquoise Ridge up until June 30, 2019, with our joint venture partner, Newmont, owning the remaining 25%. Turquoise Ridge was accounted for as a joint operation and proportionately consolidated. On July 1, 2019, Barrick's 75% interest in Turquoise Ridge and Newmont's Twin Creeks and 25% interest in Turquoise Ridge were contributed to Nevada Gold Mines and are now operated as one segment referred to as Turquoise Ridge. The figures presented in this table are based on our 75% interest in Turquoise Ridge until June 30, 2019 and the combined results of Turquoise Ridge (including Twin Creeks) thereafter including non-controlling interest. Refer to note 4.

BARRICK YEAR-END 2019 134 NOTES TO FINANCIAL STATEMENTS
Reconciliation of Segment Income to Income from Continuing Operations Before Income Taxes
For the years ended December 31 2019 2018Segment income $2,700 $1,901Other cost of sales/amortization1 (56) (47)Exploration, evaluation and project expenses not attributable to segments (265) (311)General and administrative expenses (212) (265)Other (expense) income not attributable to segments 3,132 (46)Impairment reversals (charges) 1,423 (900)Loss on currency translation (109) (136)Closed mine rehabilitation (5) 13Income from equity investees 165 46Finance costs, net (includes non-segment accretion)2 (416) (492)Gain on non-hedge derivatives3 — —Income (loss) before income taxes4 $6,357 ($237)
1 Includes realized hedge losses of $nil (2018: $4 million losses).2 Includes debt extinguishment losses of $3 million (2018: $29 million losses).3 Includes unrealized non-hedge losses of $nil (2018: $1 million losses).4 Includes non-controlling interest portion of revenues, cost of sales and non-segment income (loss) for the year ended December 31, 2019, for Tanzania,
$nil, $nil, $(17) million (2018: $nil, $1 million, $2 million) and Nevada Gold Mines, $nil, $6 million, $1 million (2018: $nil, $nil, $nil).
Geographic Information
Non-current assets Revenue1
As at December31, 2019
As at December31, 2018 2019 2018
United States $16,514 $6,857 $4,190 $3,025Mali 4,662 — 1,007 —Dominican Republic 4,303 3,468 1,409 1,334Democratic Republic of Congo 3,218 — — —Chile 2,158 2,679 — —Zambia 1,705 735 393 502Argentina 1,571 1,723 386 366Tanzania 1,009 1,059 671 664Canada 490 368 305 226Côte d'Ivoire 424 — 384 —Saudi Arabia 368 408 — —Papua New Guinea 361 348 403 269Peru 170 145 279 449Australia — 396 290 408Unallocated 552 467 — —Total $37,505 $18,653 $9,717 $7,243
1 Presented based on the location from which the product originated.

BARRICK YEAR-END 2019 135 NOTES TO FINANCIAL STATEMENTS
Capital Expenditures Information
Segment Capital Expenditures1
As at December 31, 2019 As at December 31, 2018Carlin $303 $195Cortez 327 349Turquoise Ridge 125 62Pueblo Viejo 107 145Loulo-Gounkoto 198 —Kibali 43 —Veladero 95 143Porgera 50 62North Mara 57 82Other Mines 384 284Reportable segment total $1,689 $1,322Other items not allocated to segments 110 121Total $1,799 $1,443Share of equity investee (43) —Total $1,756 $1,443
1 Segment capital expenditures are presented for internal management reporting purposes on an accrual basis. Capital expenditures in the consolidated statements of cash flow are presented on a cash basis. In 2019, cash expenditures were $1,701 million (2018: $1,400 million) and the increase in accrued expenditures was $55 million (2018: $43 million increase).
6 > REVENUE
For the years ended December 31 2019 2018Gold sales1
Spot market sales $9,084 $6,575Concentrate sales 101 25Provisional pricing adjustments 1 —
$9,186 $6,600Copper sales1
Copper concentrate sales $371 $549Provisional pricing adjustments 22 (37)
$393 $512Other sales2 $138 $131Total $9,717 $7,243
1 Revenues include amounts transferred from OCI to earnings for commodity cash flow hedges.
2 Revenues from the sale of by-products from our gold and copper mines including silver revenue of $97 million (2018: $121 million).
Principal ProductsAll of our gold mining operations produce gold in doré form, except Porgera and Phoenix, which produce both gold doré and gold concentrate. Gold doré is unrefined gold bullion bars usually consisting of 90% gold that is refined to pure gold bullion prior to sale to our customers. Concentrate is a processing product containing the valuable ore mineral from which most of the waste mineral has been eliminated. Our Lumwana and Phoenix mines produce a concentrate that primarily contains copper. Incidental revenues from the sale of by-products, primarily copper, silver and energy at our gold mines, are classified within other sales.
Provisional Copper and Gold SalesWe have provisionally priced sales for which price finalization, referenced to the relevant copper and gold index, is outstanding at the balance sheet date. Our exposure at December 31, 2019 to the impact of movements in market commodity prices for provisionally priced sales is set out in the following table:
Volumes subject tofinal pricing
Copper (millions) Gold (000s)
Impact on net incomebefore taxation of10% movement inmarket price US$
As at December 31 2019 2018 2019 2018Copper pounds 39 51 $11 $14Gold ounces 15 — 2 —
At December 31, 2019, our provisionally priced copper sales subject to final settlement were recorded at average prices of $2.80/lb (2018: $2.71/lb). At December 31, 2019, our provisionally priced gold sales subject to final settlement were recorded at an average price of $1,524/oz. The sensitivities in the above tables have been determined as the impact of a 10% change in commodity prices at each reporting date, while holding all other variables, including foreign currency exchange rates, constant.

BARRICK YEAR-END 2019 136 NOTES TO FINANCIAL STATEMENTS
7 > COST OF SALES
Gold Copper Other4 Total
For the years ended December 31 2019 2018 2019 2018 2019 2018 2019 2018
Direct mining cost1,2,3 $4,274 $3,130 $224 $344 $6 $7 $4,504 $3,481Depreciation 1,902 1,253 100 170 30 34 2,032 1,457Royalty expense 308 196 34 39 — — 342 235Community relations 30 42 3 5 — — 33 47Total $6,514 $4,621 $361 $558 $36 $41 $6,911 $5,220
1 Direct mining cost related to gold and copper includes charges to reduce the cost of inventory to net realizable value of $26 million (2018: $199million). Refer to note 17.
2 Direct mining cost related to gold includes the costs of extracting by-products and export duties paid in Argentina.3 Includes employee costs of $1,350 million (2018: $1,001 million).4 Other includes realized hedge gains and losses and corporate amortization.
8 > EXPLORATION, EVALUATION AND PROJECTEXPENSES
For the years ended December 31 2019 2018Global exploration and evaluation1 $143 $121Advanced project costs:
Pascua-Lama 49 77 Other 20 36
Corporate development2 51 60Business improvement and innovation 10 44Minesite exploration and evaluation1 69 45Total exploration, evaluation and projectexpenses $342 $383
1 Approximates the impact on operating cash flow.2 2019 includes $44 million in transaction costs related to the
Nevada Gold Mines, Acacia and Kalgoorlie transactions. 2018 includes $37 million in transaction costs related to the merger with Randgold.
9 > OTHER EXPENSE (INCOME)
For the years ended December 31 2019 2018Other Expense:
Litigation1 26 68Write-offs2 3 51Bulyanhulu reduced operations program costs3 24 29Bank charges 16 22Insurance payment to Porgera JV — 13Acacia transaction costs4 18 —Tanzania - other 11 11Other 28 28
Total other expense $126 $222Other Income:
Gain on sale of long-lived assets5 ($441) ($68)Remeasurement of Turquoise Ridge to fair value6 (1,886) —Remeasurement of silver sale liability7 (628) —Lumwana customs duty and indirect taxes settlement8 (216) —Peru tax disputes settlement (18) —Insurance proceeds related to Kalgoorlie — (24)Interest Income (20) (22)Other (17) (18)
Total other income ($3,226) ($132)Total ($3,100) $90
1 2018 primarily consists of Tanzania legal fees, and a settlement dispute regarding a historical supplier contract acquired as part of the Equinox acquisition in 2011.
2 2018 primarily relates to a $43 million write-off of a Western Australia long-term stamp duty receivable.
3 Primarily relates to care and maintenance costs.4 Incurred by Acacia Mining Plc. 5 2019 includes a gain of $408 million from the sale of
Kalgoorlie (refer to note 4). 2018 includes a gain of $45 million from the sale of a royalty asset at Acacia.
6 Refer to note 4 for further details.7 Refer to note 29 for further details. 8 Refer to note 3 for further details.

BARRICK YEAR-END 2019 137 NOTES TO FINANCIAL STATEMENTS
10 > IMPAIRMENT (REVERSALS) CHARGES
For the years ended December 31 2019 2018Impairment charges (reversals) of long-lived assets1 ($1,423) $722
Impairment of intangibles1 — 24
Impairment of goodwill1 — 154
Total ($1,423) $9001 Refer to note 21 for further details.
11 > GENERAL AND ADMINISTRATIVE EXPENSES
For the years ended December 31 2019 2018
Corporate administration1 $185 $239Operating segment administration 27 26
Total2 $212 $2651 Includes $18 million (2018: $63 million) related to one-time
severance payments.2 Includes employee costs of $131 million (2018: $156 million).
12 > INCOME TAX EXPENSE
For the years ended December 31 2019 2018Tax on profitCurrent tax
Charge for the year $685 $423Adjustment in respect of prior years 25 45
$710 $468Deferred tax
Origination and reversal of temporarydifferences in the current year $1,112 $821Adjustment in respect of prior years (39) (91)
$1,073 $730Income tax expense $1,783 $1,198Tax expense related to continuing operationsCurrent
Canada $5 $—International 705 468
$710 $468Deferred
Canada $— $628International 1,073 102
$1,073 $730Income tax expense $1,783 $1,198
Reconciliation to Canadian Statutory RateFor the years ended December 31 2019 2018At 26.5% statutory rate $1,684 ($63)Increase (decrease) due to:
Allowances and special tax deductions1 (129) (59)Impact of foreign tax rates2 (264) (4)Expenses not tax deductible 78 74Impairment charges not recognized indeferred tax assets 45 168Goodwill impairment charges not taxdeductible — 54Net currency translation losses on deferredtax balances 43 41Tax impact from pass-through entities andequity accounted investments (140) (15)Current year tax losses not recognized indeferred tax assets 8 100Sale of 50% interest in Kalgoorlie 12 —De-recognition of deferred tax assets 4 814United States adjustment to one-time tollcharge — (49)Adjustments in respect of prior years (13) 3Increase to income tax related contingentliabilities 21 —Impact of tax rate changes (35) —Dominican Republic tax audit — 42United States withholding taxes 30 (107)Other withholding taxes 24 14Mining taxes 412 184Other items 3 1Income tax expense $1,783 $1,198
1 We are able to claim certain allowances and tax deductions unique to extractive industries that result in a lower effective tax rate.
2 We operate in multiple foreign tax jurisdictions that have tax rates different than the Canadian statutory rate.
Currency TranslationDeferred tax balances are subject to remeasurement for changes in currency exchange rates each period. This is required in countries where tax is paid in local currency and accounts are prepared in local GAAP. The most significant balances are Argentine deferred tax liabilities. In 2019 and 2018, tax expense of $75 million and $41 million, respectively,primarily arose from translation losses due to the weakening of the Argentine peso against the US dollar. These translation losses are included within deferred tax expense (recovery). In 2019, deferred tax balances for legacy Randgold assets in Mali and Côte d’Ivoire required remeasurement at year end.
De-recognition of Deferred Tax AssetsIn the fourth quarter of 2018, we recorded a deferred tax expense of $673 million related to de-recognition of the deferred tax asset in Canada, and a deferred tax expense of $141 million related to de-recognition of the deferred tax asset in Peru. The de-recognition of the deferred tax asset in Canada follows the merger with Randgold and management’s focus on growing the business globally, particularly on assets outside of Canada. This required us to reassess the level of repatriated earnings expected in Canada, and Canadian income thereon to support the deferred tax asset. The de-recognition of the deferred tax asset does not constrain our

BARRICK YEAR-END 2019 138 NOTES TO FINANCIAL STATEMENTS
ability to use Canadian carry forward tax losses against future income in Canada; however, we did not expect to be able to use these losses in the foreseeable future as a result of the change in strategy in the fourth quarter of 2018. The de-recognition of the deferred tax asset in Peru in the fourth quarter of 2018 follows management’s review of expected future earnings. The associated impairment of inventory at Lagunas Norte was also driven by the fourth quarter of 2018 change in our expected approach to financing future reclamation activities in Peru. Based on these reviews in Canada and Peru, it was determined that the realizability of these deferred tax assets was no longer probable.
United States Withholding TaxesIn the fourth quarter of 2018, primarily due to restructuring associated with the merger with Randgold, we concluded that going forward, we would reinvest our future undistributed earnings of our United States subsidiaries in the foreseeable future. As a result of our reassessment, we recorded a deferred tax recovery of $107 million.
In 2019, we reassessed our intentions on the current and future undistributed earnings of our United States subsidiaries due to the formation of Nevada Gold Mines. Based on the free cash flow that we expect Nevada Gold Mines to generate, together with other factors, we concluded that it was no longer our intent to indefinitely reinvest our current and future undistributed earnings of our United States subsidiaries. Therefore in the fourth quarter of 2019, we recognized an increase in our income tax provisions in the amount of $30 million, representing withholding tax on undistributed United States earnings.
Framework for former Acacia Mining Operations in Tanzania On October 20, 2019, Barrick announced that it had reached an agreement with the GoT to settle all disputes between the GoT and the mining companies formerly operated by Acacia but now managed by Barrick. The final agreements were submitted to the Tanzanian Attorney General for review and legalization.
On January 24, 2020, Barrick announced that the Company had ratified the creation of Twiga at a signing ceremony with the President of Tanzania, formalizing the establishment of a joint venture between Barrick and the GoT and resolution of all outstanding disputes between Barrick and the GoT, including the lifting of the previous concentrate export ban, effective immediately
The terms of the signed agreement are consistent with those previously announced, including the payment of $300 millionto settle all outstanding tax and other disputes (the “Settlement Payment”); the lifting of the concentrate export ban; the sharing of future economic benefits from the mines on a 50/50 basis; and a dispute resolution mechanism that provides for binding international arbitration. The 50/50 division of economic benefits will be maintained through an annual true-up mechanism, which will not account for the Settlement Payment.
The Settlement Payment will be paid in installments, with an initial payment of $100 million to the GoT following the resumption of mineral concentrate exports. Five subsequent annual payments of $40 million each will be made, starting on the first anniversary of the fulfillment of all conditions of the signed agreement, subject to certain cash flow conditions.
A tax provision of $128 million had been recorded prior to December 31, 2016 in respect of tax disputes related to Acacia. Of this amount, $70 million was recorded in 2016. In the third quarter of 2017, an additional amount of $172 millionwas recorded as current tax expense. See note 36 for further information with respect to these matters.
Zambian Tax MattersThe mining taxes assessed to the Lumwana Mine have contradicted the Development Agreement that was finalized between Lumwana Mining Company Limited (“LMC”) and the Government of Zambia on December 16, 2005. In 2015, the Company began to take steps to preserve its rights under the Development Agreement and started to engage in formal discussions with the government to redress historical tax issues relating to the Development Agreement. On October 3, 2018, a deed of settlement was signed by the Government of Zambia and LMC. The deed provided that, within 30 days of the deed, LMC shall file tax returns for 2012 through 2017, and the government shall have the right to conduct and complete an audit of the returns. The audit of these tax returns by the Zambian tax authority was completed in the fourth quarter of 2019 and we recorded a $50 million asset reflecting the final settlement of this matter. We also released historical accruals related to customs duty and indirect taxes resulting in a total of $216 million recognized in Other Income in 2019 (refer to note 9).
13 > EARNINGS (LOSS) PER SHARE
For the years ended December 31 ($ millions, except shares in millions and per shareamounts in dollars)
2019 2018
Basic Diluted Basic DilutedNet (loss) income $4,574 $4,574 ($1,435) ($1,435)Net income attributable to non-controlling interests (605) (605) (110) (110)Net (loss) income attributable to the equity holders of Barrick Gold Corporation $3,969 $3,969 ($1,545) ($1,545)Weighted average shares outstanding 1,758 1,758 1,167 1,167Basic and diluted earnings (loss) per share data attributable to the equity holders of BarrickGold Corporation $2.26 $2.26 ($1.32) ($1.32)

BARRICK YEAR-END 2019 139 NOTES TO FINANCIAL STATEMENTS
14 > FINANCE COSTS, NET
For the years ended December 31 2019 2018Interest1 $435 $452Amortization of debt issue costs 2 5Amortization of discount (premium) (1) (1)Interest on lease liabilities 6 —Gain on interest rate hedges (6) (3)Interest capitalized2 (14) (9)Accretion 75 87Loss on debt extinguishment3 3 29Finance income (31) (15)Total $469 $545
1 Interest in the consolidated statements of cash flow is presented on a cash basis. In 2019, cash interest paid was $333 million (2018: $350 million).
2 For the year ended December 31, 2019, the general capitalization rate was 6.30% (2018: 6.10%).3 2018 loss arose from a make-whole repurchase of the outstanding principal on the 4.40% notes due 2021.
15 > CASH FLOW – OTHER ITEMS
Operating Cash Flows - Other Items
For the years ended December 31 2019 2018
Adjustments for non-cash income statement items:Stock-based compensation expense $71 $33Income from investment in equity investees (note 16) (165) (46)Increase (decrease) in estimate of rehabilitation costs at closed mines 5 (13)Net inventory impairment charges (note 17) 26 199Remeasurement of silver sale liability (note 29) (628) —Lumwana customs duty and indirect taxes settlement (note 3) (216) —
Change in other assets and liabilities (113) (169)Settlement of rehabilitation obligations (93) (66)Other operating activities ($1,113) ($62)Cash flow arising from changes in:
Accounts receivable ($118) ($9)Inventory 9 (111)Other current assets (89) (109)Accounts payable (108) 19Other current liabilities (51) 37
Change in working capital ($357) ($173)
Investing Cash Flows – Other Items For the years ended December 31 2019 2018Dividends received from equity method investments (note 16) $ 125 $ —Shareholder loan repayments from equity method investments 92 —Funding of equity method investments (note 16) (2) (5)Other (2) —Other investing activities $ 213 $ (5)

BARRICK YEAR-END 2019 140 NOTES TO FINANCIAL STATEMENTS
16 > INVESTMENTS
Equity Accounting Method Investment Continuity
Kibali Jabal Sayid Zaldívar Other TotalAt January 1, 2018 $— $206 $975 $32 $1,213Equity pick-up (loss) from equity investees — 39 14 (7) 46Funds invested — — — 5 5Impairment charges — — — (30) (30)At December 31, 2018 $— $245 $989 $— $1,234Acquisitions 3,195 — — 58 3,253Equity pick-up from equity investees 98 51 16 — 165Funds invested — — — 2 2
Dividends paid (75) — (50) — (125)Shareholder loan repayment — — — (2) (2)At December 31, 2019 $3,218 $296 $955 $58 $4,527
Summarized Equity Investee Financial Information Kibali Jabal Sayid ZaldívarFor the years ended December 31 2019 2018 2019 2018 2019 2018Revenue $1,123 $— $315 $296 $685 $599Cost of sales (excluding depreciation) 460 — 133 158 442 404Depreciation 435 — 53 39 172 118Finance expense — — 1 2 12 —Other expense (income) 18 — (2) 9 10 25Income from continuing operations before tax $210 $— $130 $88 $49 $52Income tax expense (16) — (27) (10) (17) (24)Income from continuing operations after tax $194 $— $103 $78 $32 $28Total comprehensive income $194 $— $103 $78 $32 $28
Summarized Balance Sheet Kibali Jabal Sayid ZaldívarFor the years ended December 31 2019 2018 2019 2018 2019 2018Cash and equivalents $453 $— $43 $128 $139 $129Other current assets1 338 — 67 68 632 602Total current assets $791 $— $110 $196 $771 $731Non-current assets 4,623 — 464 482 1,823 1,927Total assets $5,414 $— $574 $678 $2,594 $2,658Current financial liabilities (excluding trade, other payables & provisions) $11 $— $— $48 $19 $18Other current liabilities 35 — 63 41 99 85Total current liabilities $46 $— $63 $89 $118 $103Non-current financial liabilities (excluding trade, other payables & provisions) 44 — 150 331 11 12Other non-current liabilities 648 — 14 14 536 546Total non-current liabilities $692 $— $164 $345 $547 $558Total liabilities $738 $— $227 $434 $665 $661Net assets $4,676 $— $347 $244 $1,929 $1,997
1 Zaldívar other current assets include inventory of $543 million (2018: $533 million).
The information above reflects the amounts presented in the financial information of the joint venture adjusted for differences between IFRS and local GAAP.

BARRICK YEAR-END 2019 141 NOTES TO FINANCIAL STATEMENTS
Reconciliation of Summarized Financial Information to Carrying Value Kibali Jabal Sayid1 ZaldívarOpening net assets $— $244 $1,997Acquisition 4,632 — —Income for the period 194 103 32Dividend (150) — (100)Closing net assets, December 31 $4,676 $347 $1,929Barrick's share of net assets 2,107 173 965Equity earnings adjustment — — (10)Goodwill recognition 1,111 123 —Carrying value $3,218 $296 $955
1 A $75 million non-interest bearing shareholder loan due from the Jabal Sayid JV is presented as part of Other Assets (refer to note 22).
17 > INVENTORIES
Gold Copper As at
December 31,2019
As atDecember
31, 2018
As atDecember 31,
2019
As atDecember
31, 2018Raw materials
Ore in stockpiles $2,794 $2,106 $155 $151 Ore on leach pads 507 405 — —
Mine operating supplies 617 496 52 66Work in process 141 146 — —Finished products 220 176 103 2
$4,279 $3,329 $310 $219Non-current ore in stockpiles1 (2,300) (1,696) — — $1,979 $1,633 $310 $219
1 Ore that we do not expect to process in the next 12 months is classified within other long-term assets.
Inventory Impairment ChargesFor the years ended December 31 2019 2018Pierina $12 $4Carlin 6 —Cortez 4 —Golden Sunlight 4 10Lagunas Norte — 166Lumwana — 18Porgera — 1Inventory impairment charges1 $26 $199
1 Impairment charges in 2018 primarily relate to stockpiles at Lagunas Norte (refer to note 21).

BARRICK YEAR-END 2019 142 NOTES TO FINANCIAL STATEMENTS
Ore in Stockpiles As at December31, 2019
As at December31, 2018
GoldCarlin $1,136 $841Pueblo Viejo 649 603Turquoise Ridge 258 13Cortez 174 242Loulo-Gounkoto 167 —North Mara 136 70Lagunas Norte 73 49Veladero 52 39Buzwagi 47 83Phoenix 39 —Porgera 33 37Tongon 29 —Kalgoorlie — 125Other 1 4
CopperLumwana 155 151
$2,949 $2,257
Ore on Leach pads As at December31, 2019
As at December31, 2018
GoldLagunas Norte $148 $168Veladero 123 138Carlin 64 —Cortez 50 81Phoenix 44 —Long Canyon 43 —Turquoise Ridge 33 —Pierina 2 18
$507 $405
Purchase CommitmentsAt December 31, 2019, we had purchase obligations for supplies and consumables of approximately $1,681 million (2018: $1,972million).
18 > ACCOUNTS RECEIVABLE AND OTHER CURRENT ASSETS
As at December31, 2019
As at December31, 2018
Accounts receivable Amounts due from concentrate sales $68 $76 Other receivables 295 172
$363 $248Other current assets
Derivative assets $1 $2 Goods and services taxes recoverable1 302 182 Prepaid expenses 174 72 Other2 88 51
$565 $3071 Primarily includes VAT and fuel tax recoverables of $141 million in Mali, $61 million in Tanzania, $50 million in Zambia, $26 million in Argentina,
and $10 million in the Dominican Republic (Dec. 31, 2018: $nil, $67 million, $60 million, $22 million, and $12 million, respectively).2 2019 balance includes $50 million asset reflecting the final settlement of Zambian tax matters. Refer to note 3 for further details.

BARRICK YEAR-END 2019 143 NOTES TO FINANCIAL STATEMENTS
19 > PROPERTY, PLANT AND EQUIPMENT
Buildings, plant and
equipment1
Mining property costs
subject to depreciation2,4
Mining property costs not subject to
depreciation2,3 TotalAt January 1, 2019Net of accumulated depreciation $3,600 $6,258 $2,968 $12,826Additions5,6 298 3,458 1,371 5,127Capitalized interest — — 14 14Acquisitions8 3,473 2,270 1,660 7,403Divestiture9 (127) (106) (27) (260)Disposals (22) — — (22)Depreciation (1,107) (907) — (2,014)Impairment reversals (charges) 990 742 (309) 1,423Transfers7 648 573 (1,221) —Assets held for sale — — (356) (356)At December 31, 2019 $7,753 $12,288 $4,100 $24,141
At December 31, 2019 Cost $18,544 $27,268 $16,050 $61,862Accumulated depreciation and impairments (10,791) (14,980) (11,950) (37,721)Net carrying amount – December 31, 2019 $7,753 $12,288 $4,100 $24,141
Buildings, plant and
equipment1Mining property costs subject to depreciation2,4
Mining property costs not subject to depreciation2,3 Total
At January 1, 2018Cost $14,209 $20,938 $14,637 $49,784Accumulated depreciation and impairments (9,996) (14,416) (11,566) (35,978)Net carrying amount – January 1, 2018 $4,213 $6,522 $3,071 $13,806Additions6 (21) 199 1,050 1,228Capitalized interest — — 9 9Disposals (7) — — (7)Depreciation (790) (772) — (1,562)Impairment reversals (charges) (394) (178) (76) (648)Transfers7 599 487 (1,086) —At December 31, 2018 $3,600 $6,258 $2,968 $12,826
At December 31, 2018 Cost $14,750 $21,624 $14,610 $50,984Accumulated depreciation and impairments (11,150) (15,366) (11,642) (38,158)Net carrying amount – December 31, 2018 $3,600 $6,258 $2,968 $12,826
1 Additions include $85 million of transitional adjustments for the recognition of leased right-of-use assets upon the Company’s adoption of IFRS 16 on January 1, 2019 (refer to note 2), as well as $49 million of right-of-use assets for lease arrangements entered into during the year ended December 31, 2019. Depreciation includes depreciation for leased right-of-use assets of $25 million for the year ended December 31, 2019. The net carrying amount of leased right-of-use assets was $75 million as at December 31, 2019.
2 Includes capitalized reserve acquisition costs, capitalized development costs and capitalized exploration and evaluation costs other than exploration license costs included in intangible assets.
3 Assets not subject to depreciation include construction-in-progress, projects and acquired mineral resources and exploration potential at operating minesites and development projects.
4 Assets subject to depreciation include the following items for production stage properties: acquired mineral reserves and resources, capitalized mine development costs, capitalized stripping and capitalized exploration and evaluation costs.
5 Additions include $3,422 million of remeasurement gain related to the change in ownership of Turquoise Ridge acquired though the Nevada Joint Venture. Refer to note 4 for further details.
6 Additions include revisions to the capitalized cost of closure and rehabilitation activities.7 Primarily relates to long-lived assets that are transferred between categories within PP&E once they are placed into service.8 Acquisitions include assets acquired as part of the Merger and the establishment of Nevada Gold Mines. Refer to note 4 for further details.9 Relates to the sale of our 50% interest in Kalgoorlie. Refer to note 4 for further details.

BARRICK YEAR-END 2019 144 NOTES TO FINANCIAL STATEMENTS
a) Mineral Property Costs Not Subject to Depreciation
Carryingamount at
Dec. 31,2019
Carryingamount at
Dec. 31,2018
Construction-in-progress1 $1,009 $786Acquired mineral resources andexploration potential 1,504 124Projects
Pascua-Lama 754 1,245 Norte Abierto 649 639 Donlin Gold 184 174
$4,100 $2,9681 Represents assets under construction at our operating minesites.
b) Changes in Gold and Copper Mineral Life of Mine PlanAs part of our annual business cycle, we prepare updated estimates of proven and probable gold and copper mineral reserves and the portion of resources considered probable of economic extraction for each mineral property. This forms the basis for our LOM plans. We prospectively revise calculations
of amortization expense for property, plant and equipment amortized using the UOP method, where the denominator is our LOM ounces. The effect of changes in our LOM on amortization expense for 2019 was a $49 million decrease(2018: $85 million decrease).
c) Capital CommitmentsIn addition to entering into various operational commitments in the normal course of business, we had commitments of approximately $383 million at December 31, 2019 (2018: $82million) for construction activities at our sites and projects.
d) Other Lease DisclosureThe Company leases various buildings, plant and equipment as part of the normal course of operations. Lease terms are negotiated on an individual basis and contain a wide range of different terms and conditions. Refer to note 25 for the lease maturity analysis. Included in net income for 2019 are short-term payments and variable lease payments not included in the measurement of lease liabilities of $56 million and $97 million, respectively.
20 > GOODWILL AND OTHER INTANGIBLE ASSETS
a) Intangible Assets
Water rights1 Technology2Supply
contracts3Exploration
potential4 TotalOpening balance January 1, 2018 $71 $9 $11 $164 $255Amortization and impairment losses5 — (1) (3) (24) (28)Closing balance December 31, 2018 $71 $8 $8 $140 $227Additions 1 — — — 1Amortization — (1) (1) — (2)Closing balance December 31, 2019 $72 $7 $7 $140 $226Cost $72 $17 $39 $298 $426Accumulated amortization and impairment losses — (10) (32) (158) (200)Net carrying amount December 31, 2019 $72 $7 $7 $140 $226
1 Relates to water rights in South America, and will be amortized through cost of sales when we begin using these in the future.2 The amount is amortized through cost of sales using the UOP method over LOM ounces of the Pueblo Viejo mine, with no assumed residual
value.3 Relates to a supply agreement with Michelin North America Inc. to secure a supply of tires and is amortized over the effective term of the
contract through cost of sales.4 Exploration potential consists of the estimated fair value attributable to exploration licenses acquired as a result of a business combination or
asset acquisition. The carrying value of the licenses will be transferred to PP&E when the development of attributable mineral resources commences.
5 Exploration potential impairment losses in 2018 relate to the Nyanzaga project in Tanzania.

BARRICK YEAR-END 2019 145 NOTES TO FINANCIAL STATEMENTS
b) Goodwill
Closing balanceDecember 31, 2018 Additions Disposals
Closing balanceDecember 31, 2019
Carlin $— $1,294 $— $1,294Cortez 514 210 — 724Turquoise Ridge 528 194 — 722Phoenix — 119 — 119Goldrush — 175 — 175Hemlo 63 — — 63Kalgoorlie 71 — (71) —Loulo-Gounkoto — 1,672 — 1,672Total $1,176 $3,664 ($71) $4,769
On a total basis, the gross amount and accumulated impairment losses are as follows:
Cost $12,211Accumulated impairment losses December 31, 2019 (7,442)Net carrying amount December 31, 2019 $4,769
21 > IMPAIRMENT AND REVERSAL OF NON-CURRENT ASSETS
Summary of impairments (reversals)For the year ended December 31, 2019, we recorded net impairment reversals of $1,423 million (2018: impairment losses of $746 million) for non-current assets and impairment charges of $nil (2018: $154 million) for goodwill, as summarized in the following table:
For the years ended December 31 2019 2018Lumwana ($947) $—Pueblo Viejo (865) —Pascua-Lama 296 (7)Cortez 57 9Lagunas Norte 12 405Golden Sunlight 9 —Veladero 3 246Carlin 2 5Equity method investments — 30Acacia exploration sites — 24Other 10 34Total impairment (reversals) lossesof long-lived assets ($1,423) $746Veladero goodwill — 154Total goodwill impairment losses $— $154Total impairment (reversals) losses ($1,423) $900
2019 Indicators of Impairment/ReversalFourth Quarter 2019In the fourth quarter of 2019, as per our policy, we performed our annual goodwill impairment test and identified no impairments. Also in the fourth quarter, we reviewed the updated LOM plans for our other operating minesites for indicators of impairment or reversal. We noted an indicator of impairment at Pascua-Lama and an indicator of impairment reversal at Pueblo Viejo.
Pascua-Lama In the fourth quarter of 2019, we completed a study of the Pascua-Lama project and concluded that we do not have a plan that meets our investment criteria under our current assumptions. It is our intention to update our geological understanding of the orebody and this process is expected to take a number of years to complete. We determined that this was an indicator of impairment and concluded that the carrying value of Pascua-Lama exceeded the FVLCD and we recorded a non-current asset impairment of $296 million, based on a FVLCD of $398 million.
In a related matter, we have updated the Wheaton silver sale obligation due to the significant uncertainty with the timing and quantity of the delivery of any future silver production from Pascua-Lama. Refer to note 29 for further details.
Pueblo Viejo The progression of our engineering and evaluation work on the process plant expansion and additional tailings facility at Pueblo Viejo represented an impairment reversal trigger in the fourth quarter. In conjunction with the increase in the long-term gold price assumption, this has resulted in an improvement in the life of mine cash flows for the mine site. We have also included an additional risk premium of 2% in the calculation of FVLCD given the expansion project has not been fully permitted nor approved for investment. Upon review of these changes and associated sensitivities, we concluded that the mine’s FVLCD exceeded its carrying value and we recorded a non-current asset impairment reversal of $865 million, which represents a full reversal of the non-current asset impairment recorded in 2015.
Third Quarter 2019Lumwana On September 28, 2018, as part of their 2019 budget, the Zambian government introduced changes to the current mining tax regime. The changes included an increase in royalty rates by 1.5%, the introduction of a 10% royalty on copper production if the copper price increases above a certain price, the imposition of a 5% import duty on copper

BARRICK YEAR-END 2019 146 NOTES TO FINANCIAL STATEMENTS
concentrates, the non-deductibility of mineral royalties paid or payable for income tax purposes, and the replacement of the VAT with a non-refundable sales tax, although any outstanding VAT claims will be settled through the current refund mechanism. In the fourth quarter of 2018, the Zambian government finalized the changes to the current tax regime, which was effective January 1, 2019, with the exception of the changes to the non-refundable sales tax. In August 2019, the Zambian government alleviated this fiscal uncertainty by withdrawing the legislative Bill relating to the non-refundable sales tax and introduced a new Bill in September 2019 which contains measures to limit the claiming of VAT on certain items used by Lumwana.
In addition to these external impacts, we have updated our LOM plan for Lumwana based on the significant reductions achieved in 2019 in unit mining costs and improvements in plant availability. This reduction in the cost base has allowed us to lower the cut-off grade which is expected to deliver a 5-year increase in the mine life of Lumwana. Finally, during the third quarter of 2019, we also updated our long-term copper price assumption to $3.00 per pound (previously $2.85 per pound). As a result of these indicators of impairment reversal, an assessment was undertaken and a partial non-current asset impairment reversal of $947 million was recognized in the third quarter of 2019, as we identified that Lumwana’s fair value less costs of disposal ("FVLCD") of $1.4 billion exceeded its carrying value. The key assumptions and estimates used in determining the FVLCD are long-term copper prices of $3.00 per pound and a weighted average cost of capital (“WACC”) of 10.4%.
Nevada Gold Mines On July 1, 2019 we formed Nevada Gold Mines, a joint venture combining the respective mining operations, assets, reserves and talent from Barrick and Newmont in Nevada, USA. This includes Barrick's Cortez, Goldstrike, Turquoise Ridge and Goldrush properties and Newmont's Carlin, Twin Creeks, Phoenix, Long Canyon and Lone Tree properties. Through the purchase price allocation exercise, we identified various assets with fair values less than their carrying values. Although IFRS did not require us to remeasure the net assets of Goldstrike, Cortez and Goldrush to fair value, we identified indicators of impairment for certain land holdings and specific Cortez Hills Open Pit infrastructure assets and an impairment of $60 million was recorded in the third quarter of 2019. Refer to note 4 for further information.
Second Quarter 2019Acacia On May 21, 2019, Barrick met with the Directors and senior management of Acacia and presented a proposal to acquire all of the shares it did not already own in Acacia through a share for share exchange of 0.153 Barrick shares for each ordinary share of Acacia. The exchange ratio was based on the 20-day volume weighted average trading prices of Acacia and Barrick as at market close in London and New York on May 20, 2019 and implied a value for 100% of Acacia of $787 million.
On July 19, 2019, we announced that the Boards of Barrick and Acacia reached an agreement on the terms of a recommended offer by Barrick for the 36.1% of Acacia that we did not own at that time. Under the terms of the agreement, the minority shareholders would exchange each Acacia share
for 0.168 Barrick shares and would also be entitled to special dividends under certain conditions. The offer received shareholder approval in the third quarter of 2019 and the transaction closed on September 17, 2019.
During the second quarter of 2019, Acacia updated its life of mine plans and subsequent to that, the Barrick technical team had an opportunity to conduct detailed due diligence on the updated life of mine plans for the Acacia assets and risk adjust the value of the assets. The value implied by Barrick's adjusted life of mine plans was deemed to be an indicator of impairment in the second quarter of 2019.
An impairment assessment was undertaken in the second quarter and Barrick assessed the carrying value of the individual cash generating units within Acacia (Bulyanhulu, North Mara and Buzwagi) and determined that the carrying amounts were recoverable. Therefore, no impairment was recognized.
The key assumptions and estimates used in determining the fair value less cost to dispose are short-term and long-term gold prices of $1,250 per ounce, NAV multiples of 1.0-1.1 and a WACC of 6.5%-6.9%. Other assumptions include a 50%economic share of future economic benefits generated by the mines for the GoT, which includes taxes, royalties, tolls and 16% free carry interest in the mines. Management assumed the resumption of concentrate sales and exports commencing in Q3 2019 and the resumption of production from underground mining at Bulyanhulu in 2020. The WACC applied was lower than the 2018 and 2017 impairment tests for the Acacia CGUs, based on lower risk levels given the state of Barrick’s negotiations with the GoT at that time and the expectation that an agreement would be signed once the recommended offer to purchase the minority shareholdings of Acacia as described above had closed, and because the economic sharing of benefits had been modeled into the cash flows.
2018 Indicators of Impairment/ReversalThird and Fourth Quarter 2018In the fourth quarter of 2018, as per our policy, we performed our annual goodwill impairment test and identified an impairment at our Veladero mine. Also in the fourth quarter, we reviewed the updated LOM plans for our other operating minesites for indicators of impairment or reversal. We noted an indicator of impairment at Acacia and at our Lagunas Norte and Lumwana mines and no indicators of impairment reversal.
VeladeroIn the third quarter of 2018, the Argentine government re-established customs duties for all exports from Argentina. Effective for the period of September 2018 to December 31, 2020, exports of doré are subject to a 12% duty, capped at ARS 4.00 per USD exported. Based on our initial analysis performed in the third quarter of 2018, the re-establishment of the customs duties was not expected to have a significant adverse effect on the long-term fair value of the mine and the Company was engaged in ongoing discussions with the federal government to clarify the impact of the export duty on Veladero’s operations given the existing tax stability agreement As such, no indicator of impairment was identified in the third quarter of 2018.
Upon the finalization of Veladero’s updated LOM plan in the fourth quarter of 2018, we observed a decrease in the mine’s

BARRICK YEAR-END 2019 147 NOTES TO FINANCIAL STATEMENTS
cash flows reflecting a higher cost structure related to increasing government imposts (including new conditions associated with the heap leach permits that require the contribution of 1.5% of the mine’s revenues towards a trust commencing when Phase 6 of the leach pad begins production and the re-establishment of the export duties for all exports from Argentina effective September 2018), country risk and increasing energy costs. Upon performing our goodwill impairment test in the fourth quarter of 2018, we identified that the mine’s carrying value exceeded its FVLCD and we recorded a goodwill impairment of $154 million and a non-current asset impairment of $246 million, based upon a FVLCD of $674 million.
Lagunas NorteIn the third quarter of 2018, we updated a feasibility study for proposed projects relating to the processing of carbonaceous materials ("CMOP") and the treatment of refractory sulfide ore ("PMR") at Lagunas Norte in Peru. Based upon the findings of the feasibility study, it was determined not to proceed with the PMR project at that time. As a result, an impairment assessment was undertaken and a non-current asset impairment of $405 million was recognized in the third quarter of 2018, as we identified that Lagunas Norte's carrying value exceeded its FVLCD of $150 million. The key assumptions and estimates used in determining the FVLCD are short-term and long-term gold prices of $1,200 per ounce, NAV multiple of 1.1-1.2 and a weighted average cost of capital (“WACC”) of 3.8%.
In the fourth quarter of 2018, we determined that the proposed project relating to CMOP at Lagunas Norte in Peru was not feasible in its current form and that more detailed studies and analysis are required before proceeding with the project. As such, a decision was made to not proceed with the CMOP project at this time and an inventory impairment of $166 million was recorded at December 31, 2018 to reduce the carrying value of the CMOP ounces in inventory to nil. The decision to not proceed with the CMOP project was considered an indicator of impairment at December 31, 2018 and an impairment assessment was performed using the fourth quarter 2018 gold price assumption of $1,250 per ounce. No further impairment was identified for the CGU as the carrying value of the mine subsequent to the inventory impairment was nil and no impairment reversal was identified as the mine’s FVLCD was negative.
LumwanaOn September 28, 2018, as part of their 2019 budget, the Zambian government introduced changes to the current mining tax regime. The changes included an increase in royalty rates by 1.5%, the introduction of a 10% royalty on copper production if the copper price increases above a certain price, the imposition of a 5% import duty on copper concentrates, the non-deductibility of mineral royalties paid or payable for income tax purposes, and the replacement of the VAT with a non-refundable sales tax, although any outstanding VAT claims will be settled through the current refund mechanism. The new mining tax regime had a proposed effective date of January 1, 2019; however, discussions were ongoing with the Zambian government in an effort to mitigate some of the impact prior to the proposed changes being enacted. However, based upon our initial analysis, it was our expectation that Lumwana would remain cash flow positive at current copper prices even if a positive outcome was not reached through the discussions with the government. Given the uncertainty over the final outcome of the tax changes and the need to assess the full impact to the
life of mine plan once those tax changes were finalized, no indicator of impairment was identified in the third quarter of 2018.
In the fourth quarter of 2018, the Zambian government finalized the changes to the current tax regime, which were expected to be effective January 1, 2019, with the exception of the changes to the non-refundable sales tax, which were expected to be finalized in the first quarter of 2019 and become effective April 1, 2019. The finalization of the changes to the mining tax regime was considered an indicator of impairment in the fourth quarter of 2018 and as such an impairment assessment was performed for Lumwana. Although the increase in the royalty rates negatively impacted the cash flows of the mine, this impact was largely offset by improvements in Lumwana’s cost structure arising primarily from the re-negotiation of contracts with suppliers under more favorable terms. As a result, no impairment was identified as the FVCLD exceeded the carrying value. We determined we would reassess the impact of the non-refundable sales tax on the mine’s cash flows once the outcome was finalized.
Acacia In the fourth quarter of 2018, potential indicators of impairment were identified in relation to Acacia, specifically the ongoing uncertainty surrounding a potential resolution of the dispute between Acacia and the GoT, the revised Bulyanhulu business model, the updated geological models at North Mara and Bulyanhulu as well as the decline in Acacia’s market capitalization below its carrying value throughout 2018. As a result, an impairment assessment was undertaken in the fourth quarter, with no impairment loss identified.
The assessment assumed the resumption of concentrate sales and of operations at Bulyanhulu will occur in the first quarter of 2020 and in late 2020, respectively, which is a further six month delay from the assumptions used in the impairment assessment carried out in the second quarter of 2018. The assessment also reflected the targeted outcome for a negotiated resolution in line with the proposed framework as reflected in the most recent LOM, and that VAT refunds will recommence and historic carried forward tax losses will continue to be available to offset against future taxable profits from January 1, 2020.
Second Quarter 2018Acacia In the second quarter of 2018, potential indicators of impairment were identified in relation to Acacia, specifically the ongoing uncertainty surrounding a potential resolution between Barrick and the GoT as well as the sustained decline in Acacia's market capitalization below its carrying value over the first half of 2018. As a result, an impairment assessment was undertaken in the second quarter, with no impairment loss identified.
The assessment assumed that the resumption of concentrate sales and of operations at Bulyanhulu will occur in the second quarter of 2019 and in late 2019, respectively. The assessment also reflected the targeted outcome for a negotiated resolution in line with the proposed framework as reflected in the most recent LOM.
The key assumptions and estimates used in determining the FVLCD are short– and long-term gold prices of $1,200 per ounce and a WACC of 11%, consistent with the rate used for the impairment assessment completed at December 31, 2017 in the calculation of FVLCD. FVLCD is most sensitive to

BARRICK YEAR-END 2019 148 NOTES TO FINANCIAL STATEMENTS
changes in these key assumptions and to the timing of resolution of the export ban; therefore, a sensitivity analysis was performed based on a decrease in the long-term gold price of $100 per ounce and an increase in the WACC of 1%, and a further six-month delay in the resolution of the export ban. A $100 per ounce decrease in the long-term gold price would result in the recognition of a non-current asset impairment at Bulyanhulu of $98 million, net of tax. A 1% increase in the WACC and a further delay of six months in the resolution of the export ban would not result in the recognition of an impairment. However, should a negotiated resolution not eventuate, the recoverable value of Bulyanhulu may be further impacted, resulting in a review at such time.
Subsequent to the second quarter close, OreCorp, which is Acacia's joint venture partner in the Nyanzaga project in Tanzania, executed its option under the earn-in agreement to increase its ownership in the project to 51% through a $3 million payment to Acacia. Furthermore, Acacia signed a conditional agreement to sell its remaining 49% interest in the project to OreCorp for $7 million and a net smelter royalty capped at $15 million based on future production. As a result of the agreement, and Acacia's commitment to a sale, Acacia expects to recover the value of the asset through sale and not value in use and as such has valued the asset at FVLCD of $10 million, resulting in the recognition of an impairment loss of $24 million in the second quarter of 2018.
KabangaIn January 2018, new mining regulations relating to mineral rights were issued in Tanzania. These regulations canceled all retention licenses and declared that they no longer have legal effect and any previous holder, along with any third party, of a retention license would need to apply for a new prospecting or mining license for that area. Our 50% interest in the Kabanga project (a joint venture between Barrick and Glencore) was affected by these changes. While we have now submitted our application for a prospecting license, the operating environment for mining projects in Tanzania remains challenging and we have determined that our carrying amount for the project is not recoverable under the current circumstances. As such, we considered this an indicator of impairment, resulting in the recognition of a $30 million impairment in the second quarter of 2018, which is equal to the full carrying value of our equity method investment in the Kabanga JV.
Key AssumptionsThe recoverable amount has been determined based on its estimated FVLCD, which has been determined to be greater than the VIU amounts. The key assumptions and estimates used in determining the FVLCD are related to commodity prices, discount rates, NAV multiples for gold assets, operating costs, exchange rates, capital expenditures, the LOM production profile, continued license to operate, evidence of value from current year disposals and for our projects the expected start of production. In addition, assumptions are related to observable market evaluation metrics, including identification of comparable entities, and associated market values per ounce and per pound of reserves and/or resources, as well as the valuation of resources beyond what is included in LOM plans.
GoldFor the gold segments where a recoverable amount was required to be determined, FVLCD was determined by calculating the net present value (“NPV”) of the future cash
flows expected to be generated by the mines and projects within the segments (level 3 of the fair value hierarchy). The estimates of future cash flows were derived from the most recent LOM plans and, where the LOM plans exclude a material portion of total reserves and resources, we assign value to reserves and resources not considered in these models. Based on observable market or publicly available data, including forward prices and equity sell-side analyst forecasts, we make an assumption of future gold and silver prices to estimate future revenues. The future cash flows for each gold mine are discounted using a real WACC, which reflects specific market risk factors for each mine. Some gold companies trade at a market capitalization greater than the NPV of their expected cash flows. Market participants describe this as a “NAV multiple”, which represents the multiple applied to the NPV to arrive at the trading price. The NAV multiple is generally understood to take account of a variety of additional value factors such as the exploration potential of the mineral property, namely the ability to find and produce more metal than what is currently included in the LOM plan or reserve and resource estimates, and the benefit of gold price optionality. As a result, we applied a specific NAV multiple to the NPV of each CGU within each gold segment based on the NAV multiples observed in the market in recent periods and that we judged to be appropriate to the CGU.
Pascua-Lama The FVLCD for Pascua-Lama was determined by considering observable market values for comparable assets expressed as dollar per ounce of measured and indicated resources (level 3 of the fair value hierarchy). In the absence of a LOM plan for Pascua-Lama, we used the market approach. The observable market values were adjusted, where appropriate, for country risk if the comparable asset was in a different country.
AssumptionsOur gold price assumption used in our fourth quarter 2019 impairment testing is $1,300 per ounce. Our gold price assumption used in our 2018 impairment testing was $1,250 per ounce. The increase in the gold price assumption from 2018 was not considered an indicator of impairment reversal as the increased price would not, in isolation, have resulted in the identification of an impairment reversal at our mines with reversible impairments. The other key assumptions used in our impairment testing, based on the CGUs tested in each year, are summarized in the table below:
2019 2018Copper price per lb (long-term) $3.00 $2.85WACC - gold (range) 3%-7% 4%-11%WACC - gold (avg) 4% 7%WACC - copper n/a 10%NAV multiple - gold (avg) 1.2 1.05LOM years - gold (avg) 19 15Value per ounce of gold $20 - $30 n/aValue per ounce of silver $0.28 - $0.42 n/a
SensitivitiesShould there be a significant increase or decline in commodity prices, we would take actions to assess the implications on our life of mine plans, including the determination of reserves and resources, and the appropriate cost structure for the operating segments. The recoverable amount of the CGUs would be affected by these changes and also be impacted by other market factors such as changes in net asset value

BARRICK YEAR-END 2019 149 NOTES TO FINANCIAL STATEMENTS
multiples and the value per ounce/pound of comparable market entities. We performed a sensitivity analysis on each CGU that was tested as part of the goodwill impairment test, as well as those CGUs which have had an impairment or impairment reversal in recent years. We flexed the gold and copper prices and the WACC, which are the most significant assumptions that impact the impairment calculations. We first assumed a +/- $100 per ounce change in our gold price assumptions or a +/- $0.25 per pound change in copper price assumptions, while holding all other assumptions constant. We then assumed a +/-1% change in our WACC, independent from the change in gold or copper prices, while holding all other assumptions constant. These sensitivities help to determine the theoretical impairment losses or impairment reversals that would be recorded with these changes in gold or copper prices and WACC. If the gold price per ounce was decreased by $100, a goodwill impairment of $529 million would be recognized for Loulo-Gounkoto and the fourth quarter 2019 impairment reversal at Pueblo Viejo would not be recognized. If the gold price was increased by $100 or the WACC was decreased by 1%, a full reversal of the $246 million non-current asset impairment at Veladero would be recognized. If the copper price per pound was decreased by $0.25, the non-current asset impairment reversal recognized for Lumwana in the third quarter of 2019 would have been lower by $390 million, with a similar increase in the copper price per pound resulting in an increase in the impairment reversal by $390 million.
In addition, for our Pascua-Lama project, we have determined our valuation based on a market approach. The key assumption that impacts the impairment calculations is the value per ounce of gold and per ounce of silver based on an analysis of comparable companies. We assumed a negative 10% change for the assumption of gold and silver value per ounce, while holding all other assumptions constant, and based on the results of the impairment testing performed in fourth quarter of 2019 for Pascua-Lama, the fair value of the CGU would have been reduced by approximately $40 million. We note that this sensitivity identifies the decrease in the value that, in isolation, would cause the carrying value of the CGU to exceed its recoverable amount. For Pascua-Lama, this value decrease is linear to the decrease in value per ounce.
The carrying value of the CGUs that are most sensitive to changes in the key assumptions used in the FVLCD calculation are:
As at December 31, 2019 Carrying ValueLoulo-Gounkoto $4,198Lumwana 1,307Veladero 692Bulyanhulu 579Pascua-Lama1 153
1 The carrying value of Pascua-Lama is presented net of the Wheaton streaming liability of $253 million (refer to note 29).

BARRICK YEAR-END 2019 150 NOTES TO FINANCIAL STATEMENTS
22 > OTHER ASSETS
As at December31, 2019
As at December31, 2018
Goods and services taxes recoverable1 $253 $271Other investments 258 209Notes receivable2 202 285Norte Abierto JV partnerreceivable 134 143Restricted cash3 162 121Carlin prepaid royalty 115 —Prepayments 30 37Derivative assets — 1Other 153 168
$1,307 $1,2351 Includes VAT and fuel tax receivables of $70 million in Argentina,
$128 million in Tanzania and $53 million in Chile (Dec. 31, 2018: $110 million, $111 million and $50 million, respectively).
2 Primarily represents the interest bearing promissory note due from NovaGold and the non-interest bearing shareholder loan due from the Jabal Sayid JV as a result of the divestment of 50 percent interest in Jabal Sayid.
3 Primarily represents the cash balance at Pueblo Viejo that is contractually restricted in respect of disbursements for environmental rehabilitation that are expected to occur near the end of Pueblo Viejo’s mine life.
23 > ACCOUNTS PAYABLE
As atDecember
31, 2019
As atDecember
31, 2018Accounts payable $715 $744Accruals 440 357
$1,155 $1,101
24 > OTHER CURRENT LIABILITIES
As atDecember
31, 2019
As atDecember
31, 2018Provision for environmentalrehabilitation (note 27b) $156 $111Deposit on Pascua-Lama silver sale agreement1 253 —Deposit on Pueblo Viejo gold andsilver streaming agreement 75 83Share-based payments (note 34b) 48 30Derivative liabilities — 3Other 90 94
$622 $3211 Reclassified from other non-current liabilities. Refer to note 29.
25 > FINANCIAL INSTRUMENTS
Financial instruments include cash; evidence of ownership in an entity; or a contract that imposes an obligation on one party and conveys a right to a second entity to deliver/receive cash or another financial instrument. Information on certain types of financial instruments is included elsewhere in these consolidated financial statements as follows: accounts receivable (note 18); restricted share units (note 34b).
a) Cash and EquivalentsCash and equivalents include cash, term deposits, treasury bills and money market investments with original maturities of less than 90 days.
As at December 31, 2019 As at December 31, 2018Cash deposits $2,571 $842Term deposits 728 477Money market investments 15 252
$3,314 $1,571
Of total cash and cash equivalents as of December 31, 2019, $nil (2018: $383 million) was held in subsidiaries which have regulatory regulations, contractual restrictions or operate in countries where exchange controls and other legal restrictions apply and are therefore not available for general use by the Company.

BARRICK YEAR-END 2019 151 NOTES TO FINANCIAL STATEMENTS
b) Debt and Interest1
Closing balanceDecember 31, 2018 Proceeds Repayments
Amortization and other2
Closing balanceDecember 31, 2019
5.7% notes3,9 $842 $— $— $— $8423.85%/5.25% notes 1,079 — — — 1,0795.80% notes4,9 395 — — — 3956.35% notes5,9 594 — — — 594Other fixed rate notes6,9 1,326 — (248) 2 1,080Leases7 19 — (28) 105 96Other debt obligations 598 — (4) — 5945.75% notes8,9 842 — — — 842Acacia credit facility10 43 — (29) — 14
$5,738 $— ($309) $107 $5,536Less: current portion11 (43) — — — (375)
$5,695 $— ($309) $107 $5,161
Closing balanceDecember 31, 2017 Proceeds Repayments
Amortization and other2
Closing balanceDecember 31, 2018
4.4%/5.7% notes3,9 $1,468 $— ($629) $3 $8423.85%/5.25% notes 1,079 — — — 1,0795.80% notes4,9 395 — — — 3956.35% notes5,9 593 — — 1 594Other fixed rate notes6,9 1,326 — — — 1,326Leases7 46 — (27) — 19Other debt obligations 603 — (3) (2) 5985.75% notes8,9 842 — — — 842Acacia credit facility10 71 — (28) — 43
$6,423 $— ($687) $2 $5,738Less: current portion11 (59) — — — (43)
$6,364 $— ($687) $2 $5,6951 The agreements that govern our long-term debt each contain various provisions which are not summarized herein. These provisions allow
Barrick, at its option, to redeem indebtedness prior to maturity at specified prices and also may permit redemption of debt by Barrick upon the occurrence of certain specified changes in tax legislation.
2 Amortization of debt premium/discount and increases (decreases) in capital leases.3 Consists of $850 million (2018: $850 million) of our wholly-owned subsidiary Barrick North America Finance LLC (“BNAF”) notes due 2041.4 Consists of $400 million (2018: $400 million) of 5.80% notes which mature in 2034.5 Consists of $600 million (2018: $600 million) of 6.35% notes which mature in 2036.6 Consists of $1.1 billion (2018: $1.3 billion) in conjunction with our wholly-owned subsidiary BNAF and our wholly-owned subsidiary Barrick
(PD) Australia Finance Pty Ltd. (“BPDAF”). This consists of $nil (2018: $248 million) of BPDAF notes due 2020, $250 million (2018: $250 million) of BNAF notes due 2038 and $850 million (2018: $850 million) of BPDAF notes due 2039.
7 Consists primarily of leases at Nevada Gold Mines, $32 million, Loulo-Gounkoto, $32 million, Lumwana, $10 million, Pascua-Lama, $6 million and Porgera, $5 million (2018: $nil, $nil, $3 million, $9 million and $nil, respectively).
8 Consists of $850 million (2018: $850 million) in conjunction with our wholly-owned subsidiary BNAF.9 We provide an unconditional and irrevocable guarantee on all BNAF, BPDAF, Barrick Gold Finance Company (“BGFC”), and Barrick (HMC)
Mining (“BHMC”) notes and generally provide such guarantees on all BNAF, BPDAF, BGFC, and BHMC notes issued, which will rank equally with our other unsecured and unsubordinated obligations.
10 Consists of an export credit backed term loan facility.11 The current portion of long-term debt consists of our 3.85% notes ($336 million; 2018: $nil), leases ($25 million; 2018: $11 million) and Acacia
credit facility ($14 million; 2018: $28 million), and other debt obligations ($nil; 2018: $4 million).

BARRICK YEAR-END 2019 152 NOTES TO FINANCIAL STATEMENTS
4.4%/5.7% NotesIn June 2011, BNAF issued an aggregate of $4.0 billion in debt securities consisting of $1.35 billion of 4.40% notes that mature in 2021 and $850 million of 5.70% notes that mature in 2041 issued by BNAF (collectively, the “BNAF Notes”). Barrick provides an unconditional and irrevocable guarantee of the BNAF Notes, which will rank equally with Barrick’s other unsecured and unsubordinated obligations. During 2016, $721 million of the $1.35 billion of the 4.4% notes was repaid. During 2018, the remaining $629 million of the 4.4% notes was repaid.
3.85% and 5.25% NotesOn April 3, 2012, we issued an aggregate of $2 billion in debt securities comprised of $1.25 billion of 3.85% notes that mature in 2022 and $750 million of 5.25% notes that mature in 2042. During 2015, $913 million of the 3.85% notes was repaid. On January 31, 2020, the remaining $337 million of the 3.85% notes was repaid.
Other Fixed Rate NotesOn October 16, 2009, we issued two tranches of debentures totaling $1.25 billion through our wholly-owned indirect subsidiary Barrick (PD) Australia Finance Pty Ltd. (“BPDAF”) consisting of $850 million of 30-year notes with a coupon rate of 5.95% and $400 million of 10-year notes with a coupon rate of 4.95%. We also provide an unconditional and irrevocable guarantee of these payments, which rank equally with our other unsecured and unsubordinated obligations. During 2016, $152 million of the $400 million of the 4.95% notes was repaid. During 2019, the remaining $248 million of the 4.95% notes was repaid. In September 2008, we issued an aggregate of $1.25 billion of notes through our wholly-owned indirect subsidiaries Barrick North America Finance LLC and Barrick Gold Financeco LLC (collectively, the “LLCs”) consisting of $250 million of 30-year notes with a coupon rate of 7.5%. We also provide an unconditional and irrevocable guarantee of these payments, which rank equally with our other unsecured and unsubordinated obligations.
5.75% NotesOn May 2, 2013, we issued an aggregate of $3 billion in notes through Barrick and our wholly-owned indirect subsidiary BNAF consisting of $850 million of 5.75% notes issued by BNAF that mature in 2043. $2 billion of the net proceeds from this offering was used to repay amounts outstanding under our revolving credit facility at that time. We provided an unconditional and irrevocable guarantee on the $850 millionof 5.75% notes issued by BNAF, which will rank equally with our other unsecured and unsubordinated obligations.
Amendment and Refinancing of the Credit FacilityIn November 2019, we amended and restated the credit and guarantee agreement (the “Credit Facility”) with certain Lenders, which requires such Lenders to make available to us a credit facility of $3.0 billion or the equivalent amount in Canadian dollars. The Credit Facility, which is unsecured, currently has an interest rate of London Interbank Offered Rate (“LIBOR”) plus 1.25% on drawn amounts, and a commitment rate of 0.15% on undrawn amounts and includes terms to replace LIBOR with a suitable replacement as that issue develops. As part of the amendment and restatement, the termination date of the Credit Facility was extended from January 2024 to January 2025. The Credit Facility is undrawn as at December 31, 2019.
Acacia Credit FacilityIn January 2013, Acacia concluded negotiations with a group of commercial banks for the provision of an export credit backed term loan facility (the “Facility”) for the amount of $142 million. The Facility was put in place to fund a substantial portion of the construction costs of the CIL circuit at the process plant at the Bulyanhulu Project. The Facility has a term of seven years and, when drawn, the spread over LIBOR will be 250 basis points. The Facility is repayable in equal installments over the term of the Facility, after a two-year repayment holiday period. At December 31, 2014, the full value of the Facility was drawn. During 2015, $14 million was repaid. During 2016, $29 million was repaid. During 2017, $28million was repaid. During 2018, $28 million was repaid. During 2019, $29 million was repaid. In January 2020, the final installment of $14 million was paid.

BARRICK YEAR-END 2019 153 NOTES TO FINANCIAL STATEMENTS
Interest
2019 2018
For the years ended December 31 Interest cost Effective rate1 Interest cost Effective rate1
4.4%/5.7% notes $49 5.74% $63 5.25%3.85%/5.25% notes 53 4.87% 53 4.87%5.80% notes 23 5.87% 23 5.85%6.35% notes 38 6.41% 39 6.41%Other fixed rate notes 77 6.33% 83 6.16%Leases 6 7.14% 2 6.18%Other debt obligations 34 6.17% 38 6.55%5.75% notes 49 5.79% 49 5.79%Acacia credit facility 3 3.36% 5 3.59%Deposits on Pascua-Lama silver sale agreement (note 29) 70 8.75% 65 8.25%Deposits on Pueblo Viejo gold and silver streaming agreement (note 29) 34 6.79% 33 6.41%
$436 $453Less: interest capitalized (14) (9)
$422 $4441 The effective rate includes the stated interest rate under the debt agreement, amortization of debt issue costs and debt discount/premium and
the impact of interest rate contracts designated in a hedging relationship with debt.
Scheduled Debt Repayments1
IssuerMaturityYear 2020 2021 2022 2023 2024
2025 andthereafter Total
7.31% notes2 BGC 2021 $— $7 $— $— $— $— $73.85% notes BGC 2022 — — 337 — — — 3377.73% notes2 BGC 2025 — — — — — 7 77.70% notes2 BGC 2025 — — — — — 5 57.37% notes2 BGC 2026 — — — — — 32 328.05% notes2 BGC 2026 — — — — — 15 156.38% notes2 BGC 2033 — — — — — 200 2005.80% notes BGC 2034 — — — — — 200 2005.80% notes BGFC 2034 — — — — — 200 2006.45% notes2 BGC 2035 — — — — — 300 3006.35% notes BHMC 2036 — — — — — 600 6007.50% notes3 BNAF 2038 — — — — — 250 2505.95% notes3 BPDAF 2039 — — — — — 850 8505.70% notes BNAF 2041 — — — — — 850 8505.25% notes BGC 2042 — — — — — 750 7505.75% notes BNAF 2043 — — — — — 850 850Other debt obligations2 — — — — — — —Acacia credit facility 14 — — — — — 14 $14 $7 $337 $— $— $5,109 $5,467Minimum annual paymentsunder leases $25 $15 $12 $8 $5 $32 $97
1 This table illustrates the contractual undiscounted cash flows, and may not agree with the amounts disclosed in the consolidated balance sheet.
2 Included in Other debt obligations in the Long-Term Debt table.3 Included in Other fixed rate notes in the Long-Term Debt table.

BARRICK YEAR-END 2019 154 NOTES TO FINANCIAL STATEMENTS
c) Derivative Instruments (“Derivatives”)In the normal course of business, our assets, liabilities and forecasted transactions, as reported in US dollars, are impacted by various market risks including, but not limited to:
Item Impacted by Revenue
Prices of gold, silver and
copper
o Consumption ofdiesel fuel, propane,natural gas, andelectricity
o Prices of diesel fuel,propane, natural gas, andelectricity
o Non-US dollarexpenditures
o Currency exchange rates -US dollar versus A$, ARS, C$,CLP, DOP, EUR, PGK, TZS,ZAR, XOF, and ZMW
administration, explorationand evaluation costs
dollar versus A$, ARS, C$, CLP,DOP, GBP, PGK, TZS, XOF, ZAR,and ZMW
o Non-US dollarcapital expenditures
o Currency exchange rates -US dollar versus A$, ARS, C$,CLP, DOP, EUR, GBP, PGK,XOF, and ZAR
o Consumption ofsteel
o Price of steel
cash and equivalents
rate borrowings
The time frame and manner in which we manage those risks varies for each item based upon our assessment of the risk and available alternatives for mitigating risk. For these particular risks, we believe that derivatives are an appropriate way of managing the risk. We use derivatives as part of our risk management program to mitigate variability associated with changing market values related to the hedged item. Many of the derivatives we use meet the hedge effectiveness criteria and are designated in a hedge accounting relationship. Certain derivatives are designated as either hedges of the fair value of recognized assets or liabilities or of firm commitments (“fair value hedges”) or hedges of highly probable forecasted transactions (“cash flow hedges”), collectively known as “accounting hedges”. Hedges that are expected to be highly effective in achieving offsetting changes in fair value or cash flows are assessed on an ongoing basis to determine that they actually have been highly effective throughout the financial reporting periods for which they were designated. Some of the derivatives we use are effective in achieving our risk management objectives, but they do not meet the strict hedge accounting criteria. These derivatives are considered to be “non-hedge derivatives”.
During 2019, we did not enter into any US dollar interest rate contracts, currency contracts, commodity contracts, or metals contracts. We had no contracts outstanding at December 31, 2019.
26 > FAIR VALUE MEASUREMENTSFair value is the price that would be received to sell an asset or paid to transfer a liability in an orderly transaction between market participants at the measurement date. The fair value hierarchy establishes three levels to classify the inputs to valuation techniques used to measure fair value. Level 1 inputs are quoted prices (unadjusted) in active markets for identical assets or liabilities. Level 2 inputs are quoted prices in markets that are not active, quoted prices for similar assets or liabilities in active markets, inputs other than quoted prices that are observable for the asset or liability (for example, interest rate and yield curves observable at commonly quoted intervals, forward pricing curves used to value currency and commodity contracts and volatility measurements used to value option contracts), or inputs that are derived principally from or corroborated by observable market data or other means. Level 3 inputs are unobservable (supported by little or no market activity). The fair value hierarchy gives the highest priority to Level 1 inputs and the lowest priority to Level 3 inputs.

BARRICK YEAR-END 2019 155 NOTES TO FINANCIAL STATEMENTS
a) Assets and Liabilities Measured at Fair Value on a Recurring Basis
Fair Value Measurements
At December 31, 2019
Quoted Prices inActive Markets for
Identical AssetsSignificant Other
Observable Inputs
SignificantUnobservable
InputsAggregate Fair
Value(Level 1) (Level 2) (Level 3)Cash and equivalents $3,314 $— $— $3,314Other investments 258 — — 258Derivatives — 1 — 1Receivables from provisional copper and gold sales — 68 — 68
$3,572 $69 $— $3,641
Fair Value Measurements
At December 31, 2018
Quoted Prices inActive Markets for
Identical AssetsSignificant Other
Observable InputsSignificant
Unobservable InputsAggregate Fair
Value(Level 1) (Level 2) (Level 3)Cash and equivalents $1,571 $— $— $1,571Other investments 209 — — 209Derivatives — — — —Receivables from provisional copper and gold sales — 76 — 76
$1,780 $76 $— $1,856
b) Fair Values of Financial Assets and Liabilities
At December 31, 2019 At December 31, 2018
Carrying amount Estimated fair value Carrying amount Estimated fair valueFinancial assets
Other assets1 $612 $612 $559 $559Other investments2 258 258 209 209Derivative assets 1 1 3 3
$871 $871 $771 $771Financial liabilities
Debt3 $5,536 $6,854 $5,738 $6,183Derivative liabilities — — 3 3Other liabilities 209 209 297 297
$5,745 $7,063 $6,038 $6,4831 Includes restricted cash and amounts due from our partners.2 Recorded at fair value. Quoted market prices are used to determine fair value.3 Debt is generally recorded at amortized cost except for obligations that are designated in a fair-value hedge relationship, in which case the
carrying amount is adjusted for changes in fair value of the hedging instrument in periods when a hedge relationship exists. The fair value of debt is primarily determined using quoted market prices. Balance includes both current and long-term portions of debt.
We do not offset financial assets with financial liabilities.

BARRICK YEAR-END 2019 156 NOTES TO FINANCIAL STATEMENTS
c) Assets Measured at Fair Value on a Non-Recurring Basis
Quoted prices inactive markets
for identicalassets
Significant otherobservable
inputs
Significantunobservable
inputs
Aggregate fair value(Level 1) (Level 2) (Level 3)Property, plant and equipment1 — — 130 130
1 Property, plant and equipment were written down by $389 million, which was included in earnings in this period.
Valuation TechniquesCash EquivalentsThe fair value of our cash equivalents is classified within Level 1 of the fair value hierarchy because they are valued using quoted market prices in active markets. Our cash equivalents are comprised of U.S. Treasury bills and money market securities that are invested primarily in U.S. Treasury bills.
Other InvestmentsThe fair value of other investments is determined based on the closing price of each security at the balance sheet date. The closing price is a quoted market price obtained from the exchange that is the principal active market for the particular security, and therefore other investments are classified within Level 1 of the fair value hierarchy.
Derivative InstrumentsThe fair value of derivative instruments is determined using either present value techniques or option pricing models that utilize a variety of inputs that are a combination of quoted prices and market-corroborated inputs. The fair value of all our derivative contracts includes an adjustment for credit risk. For counterparties in a net asset position, credit risk is based upon the observed credit default swap spread for each particular counterparty, as appropriate. For counterparties in a net liability position, credit risk is based upon Barrick’s observed credit default swap (“CDS”) spread. The fair value of US dollar interest rate and currency swap contracts is determined by discounting contracted cash flows using a discount rate derived from observed LIBOR and swap rate curves and credit default swap rates. In the case of currency contracts, we convert non-US dollar cash flows into US dollars using an exchange rate derived from currency swap curves and CDS rates. The fair value of commodity forward contracts is determined by discounting contractual cash flows using a discount rate derived from observed LIBOR and swap rate curves and CDS rates. Contractual cash flows are calculated using a forward pricing curve derived from observed forward prices for each commodity. Derivative instruments are classified within Level 2 of the fair value hierarchy.
Receivables from Provisional Copper and Gold SalesThe fair value of receivables arising from copper and gold sales contracts that contain provisional pricing mechanisms is determined using the appropriate quoted forward price from the exchange that is the principal active market for the particular metal. As such, these receivables, which meet the definition of an embedded derivative, are classified within Level 2 of the fair value hierarchy.
Other Long-Term AssetsThe fair value of property, plant and equipment, goodwill, intangibles and other assets is determined primarily using an income approach based on unobservable cash flows and a market multiples approach where applicable, and as a result is classified within Level 3 of the fair value hierarchy. Refer to note 21 for disclosure of inputs used to develop these measures.

BARRICK YEAR-END 2019 157 NOTES TO FINANCIAL STATEMENTS
27 > PROVISIONSa) Provisions
As at December31, 2019
As at December31, 2018
Environmental rehabilitation(“PER”) $2,922 $2,726Post-retirement benefits 43 42Share-based payments 26 26Other employee benefits 19 22Other 104 88
$3,114 $2,904
b) Environmental Rehabilitation
2019 2018At January 1 $2,837 $3,096PERs acquired (divested) during the year 425 —Closed Sites
Impact of revisions to expected cashflows recorded in earnings (75) (30)Settlements
Cash payments (72) (48) Settlement gains (3) (2)
Accretion 18 13Operating Sites
PER revisions in the year (87) (247)Settlements
Cash payments (21) (18) Settlement gains (1) (1)
Accretion 57 74At December 31 $3,078 $2,837Current portion (note 24) (156) (111)
$2,922 $2,726
The eventual settlement of substantially all PERs estimated is expected to take place between 2020 and 2059. The total PER has decreased in the fourth quarter of 2019 by $511 million primarily due to changes in cost estimates at our Pascua-Lama, Carlin, Golden Sunlight and Cortez properties, combined with the divestment of Kalgoorlie. For the year ended December 31, 2019, our PER balance increased by $241 million primarily due to the contribution of Newmont’s assets to Nevada Gold Mines on July 1, 2019, the acquisition of Randgold on January 1, 2019, and a decrease in the discount rate. These were partially offset by changes in cost estimates primarily at our Pascua-Lama, Pierina, Golden Sunlight, Lagunas Note and Pueblo Viejo properties, combined with the divestment of Kalgoorlie. A 1% increase in the discount rate would result in a decrease in PER by $357 million and a 1% decrease in the discount rate would result in an increase in PER by $207 million, while holding the other assumptions constant.
28 > FINANCIAL RISK MANAGEMENT
Our financial instruments are comprised of financial liabilities and financial assets. Our principal financial liabilities, other than derivatives, comprise accounts payable and debt. The main purpose of these financial instruments is to manage short-term cash flow and raise funds for our capital expenditure program. Our principal financial assets, other than derivative instruments, are cash and equivalents and accounts receivable, which arise directly from our operations. In the normal course of business, we use derivative instruments to mitigate exposure to various financial risks. We manage our exposure to key financial risks in accordance with our financial risk management policy. The objective of the policy is to support the delivery of our financial targets while protecting future financial security. The main risks that could adversely affect our financial assets, liabilities or future cash flows are as follows:
a. Market risk, including commodity price risk, foreign currency and interest rate risk;
b. Credit risk;c. Liquidity risk; andd. Capital risk management.
Management designs strategies for managing each of these risks, which are summarized below. Our senior management oversees the management of financial risks. Our senior management ensures that our financial risk-taking activities are governed by policies and procedures and that financial risks are identified, measured and managed in accordance with our policies and our risk appetite. All derivative activities for risk management purposes are carried out by the appropriate personnel.
a) Market RiskMarket risk is the risk that changes in market factors, such as commodity prices, foreign exchange rates or interest rates, will affect the value of our financial instruments. We manage market risk by either accepting it or mitigating it through the use of derivatives and other economic hedging strategies.
Commodity Price RiskGold and CopperWe sell our gold and copper production in the world market. The market prices of gold and copper are the primary drivers of our profitability and ability to generate both operating and free cash flow. Our corporate treasury group implements hedging strategies on an opportunistic basis to protect us from downside price risk on our gold and copper production. We did not enter into any positions during the year and do not have any positions outstanding at December 31, 2019. Our gold and copper production is subject to market prices.
FuelOn average we consume 4 million barrels of diesel fuel annually across all our mines. Diesel fuel is refined from crude oil and is therefore subject to the same price volatility affecting crude oil prices. Therefore, volatility in crude oil prices has a significant direct and indirect impact on our production costs. To mitigate this volatility, we employ a strategy of using financial contracts to hedge our exposure to oil prices.

BARRICK YEAR-END 2019 158 NOTES TO FINANCIAL STATEMENTS
Foreign Currency RiskThe functional and reporting currency for all of our operating segments is the US dollar and we report our results using the US dollar. The majority of our operating and capital expenditures are denominated and settled in US dollars. We have exposure to the Australian dollar and Canadian dollar through a combination of mine operating costs and general and administrative costs; and to the Papua New Guinea kina, Peruvian sol, Chilean peso, Argentine peso, Dominican Republic peso, West African CFA franc, and Zambian kwacha through mine operating costs. Consequently, fluctuations in the US dollar exchange rate against these currencies increase the volatility of cost of sales, general and administrative costs and overall net earnings, when translated into US dollars.
Interest Rate RiskInterest rate risk refers to the risk that the value of a financial instrument or cash flows associated with the instruments will fluctuate due to changes in market interest rates. Currently, our interest rate exposure mainly relates to interest receipts on our cash balances ($3.3 billion at the end of the year); the mark-to-market value of derivative instruments; and to the interest payments on our variable-rate debt ($0.1 billion at December 31, 2019). The effect on net earnings and equity of a 1% change in the interest rate of our financial assets and liabilities as at December 31, 2019 is approximately $18 million (2018: $16 million).
b) Credit RiskCredit risk is the risk that a third party might fail to fulfill its performance obligations under the terms of a financial instrument. Credit risk arises from cash and equivalents, trade and other receivables as well as derivative assets. For cash and equivalents and trade and other receivables, credit risk exposure equals the carrying amount on the balance sheet, net of any overdraft positions. To mitigate our inherent exposure to credit risk we maintain policies to limit the concentration of credit risk, review counterparty creditworthiness on a monthly basis, and ensure liquidity of available funds. We also invest our cash and equivalents in highly rated financial institutions, primarily within the United States and other investment grade countries, which are countries rated BBB- or higher by S&P and include Canada, Chile, Australia and Peru. Furthermore, we sell our gold and copper production into the world market and to private customers with strong credit ratings. Historically, customer defaults have not had a significant impact on our operating results or financial position. For derivatives with a positive fair value, we are exposed to credit risk equal to the carrying value. When the fair value of a derivative is negative, we assume no credit risk. We mitigate credit risk on derivatives by:
• Entering into derivatives with high credit-quality counterparties;
• Limiting the amount of net exposure with each counterparty; and
• Monitoring the financial condition of counterparties on a regular basis.
The Company’s maximum exposure to credit risk at the reporting date is the carrying value of each of the financial assets disclosed as follows:
As at December31, 2019
As at December31, 2018
Cash and equivalents $3,314 $1,571Accounts receivable 363 248Net derivative assets bycounterparty — 2
$3,677 $1,821
c) Liquidity RiskLiquidity risk is the risk of loss from not having access to sufficient funds to meet both expected and unexpected cash demands. We manage our exposure to liquidity risk by maintaining cash reserves, access to undrawn credit facilities and access to public debt markets, by staggering the maturities of outstanding debt instruments to mitigate refinancing risk and by monitoring of forecasted and actual cash flows. Details of the undrawn credit facility are included in note 25. Our capital structure comprises a mix of debt and shareholders’ equity. As at December 31, 2019, our total debt was $5.5 billion (debt net of cash and equivalents was $2.2 billion) compared to total debt as at December 31, 2018 of $5.7 billion (debt net of cash and equivalents was $4.2 billion). Our operating cash flow is dependent on the ability of our operations to deliver projected future cash flows. The market prices of gold, and to a lesser extent copper, are the primary drivers of our operating cash flow. Other options to enhance liquidity include further portfolio optimization and the creation of new joint ventures and partnerships; issuance of equity securities in the public markets or to private investors, which could be undertaken for liquidity enhancement and/or in connection with establishing a strategic partnership; issuance of long-term debt securities in the public markets or to private investors (Moody’s and S&P currently rate Barrick’s outstanding long-term debt as investment grade, with ratings of Baa2 and BBB, respectively); and drawing on the $3.0 billion available under our undrawn credit facility (subject to compliance with covenants and the making of certain representations and warranties, this facility is available for drawdown as a source of financing). The key financial covenant in the Credit Facility (undrawn as at December 31, 2019) requires Barrick to maintain a net debt to total capitalization ratio, as defined in the agreement, of 0.60:1 or lower (Barrick’s net debt to total capitalization ratio was 0.07:1 as at December 31, 2019). The following table outlines the expected maturity of our significant financial assets and liabilities into relevant maturity groupings based on the remaining period from the balance sheet date to the contractual maturity date. As the amounts presented in the table are the contractual undiscounted cash flows, these balances may not agree with the amounts disclosed in the balance sheet.

BARRICK YEAR-END 2019 159 NOTES TO FINANCIAL STATEMENTS
As at December 31, 2019(in $ millions) Less than 1 year 1 to 3 years 3 to 5 years Over 5 years TotalCash and equivalents $3,314 $— $— $— $3,314Accounts receivable 363 — — — 363Derivative assets — — — — —Trade and other payables 1,155 — — — 1,155Debt 39 371 13 5,141 5,564Derivative liabilities — — — — —Other liabilities 55 52 9 93 209
As at December 31, 2018(in $ millions) Less than 1 year 1 to 3 years 3 to 5 years Over 5 years TotalCash and equivalents $1,571 $— $— $— $1,571Accounts receivable 248 — — — 248Derivative assets 2 1 — — 3Trade and other payables 1,101 — — — 1,101Debt 43 275 339 5,110 5,767Derivative liabilities 3 — — — 3Other liabilities 59 80 21 137 297
d) Capital Risk ManagementOur objective when managing capital is to provide value for shareholders by maintaining an optimal short-term and long-term capital structure in order to reduce the overall cost of capital while preserving our ability to continue as a going concern. Our capital management objectives are to safeguard our ability to support our operating requirements on an ongoing basis, continue the development and exploration of our mineral properties and support any expansion plans. Our objectives are also to ensure that we maintain a strong balance sheet and optimize the use of debt and equity to support our business and provide financial flexibility in order to maximize shareholder value. We define capital as total debt less cash and equivalents and it is managed by management subject to approved policies and limits by the Board of Directors. We have no significant financial covenants or capital requirements with our lenders or other parties other than what is discussed under liquidity risk in note 28c.
29 > OTHER NON-CURRENT LIABILITIES
As atDecember 31,
2019
As atDecember 31,
2018Deposit on Pascua-Lama silver sale agreement1,2 $— $811Deposit on Pueblo Viejo gold and silver streaming agreement1 425 426Long-term income tax payable 241 270Derivative liabilities — —Provision for offsiteremediation 52 57Other 105 179
$823 $1,7431 Revenues of $43 million were recognized in 2019 (2018: $76
million) through the draw-down of our streaming liabilities relating to contracts in place at Pueblo Viejo in 2019 and Pueblo Viejo and Pascua-Lama in 2018.
2 Reclassified to other current liabilities. Refer to note 24.
Silver Sale AgreementOur silver sale agreement with Wheaton requires us to deliver 25 percent of the life of mine silver production from the Pascua-Lama project and required delivery of 100 percent of silver production from the Lagunas Norte, Pierina and Veladero mines until March 31, 2018. In return, we were entitled to an upfront cash payment of $625 million payable over three years from the date of the agreement, as well as ongoing payments in cash of the lesser of $3.90 (subject to an annual inflation adjustment of 1 percent starting threeyears after project completion at Pascua-Lama) and the prevailing market price for each ounce of silver delivered under the agreement. An imputed interest expense was being recorded on the liability at the rate implicit in the agreement. The liability plus imputed interest was amortized based on the difference between the effective contract price for silver and the amount of the ongoing cash payment per ounce of silver delivered under the agreement.
In the fourth quarter of 2019, we completed a study of the Pascua-Lama project and concluded that we do not have a plan that meets our investment criteria under our current assumptions. As a result, the deferred revenue liability was derecognized, and a current liability was recognized for the cash liability payable to Wheaton of $253 million. This adjustment resulted in $628 million recorded in Other Income (refer to note 9) and recognizes the significant uncertainty with the timing and quantity of the delivery of any future silver production from Pascua-Lama. Gold and Silver Streaming AgreementOn September 29, 2015, we closed a gold and silver streaming transaction with Royal Gold, Inc. (“Royal Gold”) for production linked to Barrick’s 60 percent interest in the Pueblo Viejo mine. Royal Gold made an upfront cash payment of $610 million and will continue to make cash payments for gold and silver delivered under the agreement. The $610 millionupfront payment is not repayable and Barrick is obligated to deliver gold and silver based on Pueblo Viejo’s production. We have accounted for the upfront payment as deferred revenue and will recognize it in earnings, along with the

BARRICK YEAR-END 2019 160 NOTES TO FINANCIAL STATEMENTS
ongoing cash payments, as the gold and silver is delivered to Royal Gold. We will also be recording accretion expense on the deferred revenue balance as the time value of the upfront deposit represents a significant component of the transaction. Under the terms of the agreement, Barrick will sell gold and silver to Royal Gold equivalent to:
• 7.5 percent of Barrick’s interest in the gold produced at Pueblo Viejo until 990,000 ounces of gold have been delivered, and 3.75 percent thereafter.
• 75 percent of Barrick’s interest in the silver produced at Pueblo Viejo until 50 million ounces have been delivered, and 37.5 percent thereafter. Silver will be delivered based on a fixed recovery rate of 70 percent. Silver above this recovery rate is not subject to the stream.
Barrick will receive ongoing cash payments from Royal Gold equivalent to 30 percent of the prevailing spot prices for the first 550,000 ounces of gold and 23.1 million ounces of silver delivered. Thereafter payments will double to 60 percent of prevailing spot prices for each subsequent ounce of gold and silver delivered. Ongoing cash payments to Barrick are tied to prevailing spot prices rather than fixed in advance, maintaining exposure to higher gold and silver prices in the future.
30 > DEFERRED INCOME TAXES
Recognition and MeasurementWe record deferred income tax assets and liabilities where temporary differences exist between the carrying amounts of assets and liabilities in our balance sheet and their tax bases. The measurement and recognition of deferred income tax assets and liabilities takes into account: substantively enacted rates that will apply when temporary differences reverse; interpretations of relevant tax legislation; estimates of the tax bases of assets and liabilities; and the deductibility of expenditures for income tax purposes. In addition, the measurement and recognition of deferred tax assets takes into account tax planning strategies. We recognize the effect of changes in our assessment of these estimates and factors when they occur. Changes in deferred income tax assets and liabilities are allocated between net income, other comprehensive income, equity and goodwill based on the source of the change. Current income taxes of $33 million have been provided on the undistributed earnings of certain foreign subsidiaries. Deferred income taxes have not been provided on the undistributed earnings of all other foreign subsidiaries for which we are able to control the timing of the remittance, and it is probable that there will be no remittance in the foreseeable future. These undistributed earnings amounted to $16,470 million as at December 31, 2019.
Sources of Deferred Income Tax Assets and Liabilities
As atDecember
31, 2019
As atDecember
31, 2018Deferred tax assetsTax loss carry forwards $511 $537Alternative minimum tax (“AMT”)and other tax credits 28 37Environmental rehabilitation 329 292Post-retirement benefit obligationsand other employee benefits 24 27Accrued interest payable — 1Other working capital 75 32Other 11 12
$978 $938Deferred tax liabilitiesProperty, plant and equipment (3,263) (1,412)Inventory (545) (503)Accrued interest payable (26) —
($2,856) ($977)Classification:
Non-current assets $235 $259Non-current liabilities (3,091) (1,236)
($2,856) ($977)
The deferred tax asset of $235 million includes $218 millionexpected to be realized in more than one year. The deferred tax liability of $3,091 million is expected to be realized in more than one year.
Expiry Dates of Tax Losses
2020 2021 2022 2023 2024+
Noexpiry
date Total
Non-capital tax losses1
Argentina $— $50 $— $— $— $— $50
Barbados — — — 440 1,252 — 1,692Canada — — — — 2,371 — 2,371Chile — — — — — 992 992Tanzania — — — — — 1,566 1,566Zambia 12 259 — — — — 271Other — — — — — 694 694
$12 $309 $— $440 $3,623 $3,252 $7,6361 Represents the gross amount of tax loss carry forwards
translated at closing exchange rates at December 31, 2019.
The non-capital tax losses include $6,037 million of losses which are not recognized in deferred tax assets. Of these, $128 million expire in 2021, $440 million expire in 2023, $3,623 million expire in 2024 or later, and $1,846 million have no expiry date.

BARRICK YEAR-END 2019 161 NOTES TO FINANCIAL STATEMENTS
Recognition of Deferred Tax AssetsWe recognize deferred tax assets taking into account the effects of local tax law. Deferred tax assets are fully recognized when we conclude that sufficient positive evidence exists to demonstrate that it is probable that a deferred tax asset will be realized. The main factors considered are:
• Historic and expected future levels of taxable income;
• Tax plans that affect whether tax assets can be realized; and
• The nature, amount and expected timing of reversal of taxable temporary differences.
Levels of future income are mainly affected by: market gold, copper and silver prices; forecasted future costs and expenses to produce gold and copper reserves; quantities of proven and probable gold and copper reserves; market interest rates; and foreign currency exchange rates. If these factors or other circumstances change, we record an adjustment to the recognition of deferred tax assets to reflect our latest assessment of the amount of deferred tax assets that is probable will be realized. A deferred tax asset totaling $53 million (December 31, 2018: $83 million) has been recorded in a foreign subsidiary. This deferred tax asset primarily arose from a realized loss on internal restructuring of subsidiary corporations. Projections of various sources of income support the conclusion that the realizability of this deferred tax asset is probable and consequently, we have fully recognized this deferred tax asset. In the fourth quarter of 2018, the deferred tax assets in Canada and Peru were derecognized. Refer to note 12 for further details.
Deferred Tax Assets Not Recognized
As at December31, 2019
As at December31, 2018
Argentina $103 $174Australia 15 154Barbados 17 40Canada 1,097 1,087Chile 1,074 1,028Côte d'Ivoire 5 —Dominican Republic — —Mali 8 —Peru 329 310Saudi Arabia 70 70Tanzania 156 156United States 1 —Zambia — 24
$2,875 $3,043
Deferred Tax Assets Not Recognized relate to: non-capital loss carry forwards of $1,058 million (2018: $1,134 million), capital loss carry forwards with no expiry date of $331 million (2018: $447 million), and other deductible temporary differences with no expiry date of $1,486 million (2018: $1,462 million).
Source of Changes in Deferred Tax Balances
For the years ended December 31 2019 2018Temporary differencesProperty, plant and equipment ($1,851) ($15)Environmental rehabilitation 37 (302)Tax loss carry forwards (27) (389)AMT credits (10) —Inventory (42) 5Derivatives — (74)Other 14 (26)
($1,879) ($801)Intraperiod allocation to:Income from continuing operationsbefore income taxes ($1,073) ($730)Allocation to PPA (799) —Sale of 50% interest in Kalgoorlie 12 —Income tax payable (16) (38)Equity — (24)Other comprehensive income (3) (9) ($1,879) ($801)
Income Tax Related Contingent Liabilities2019 2018
At January 1 $306 $306Net additions based on uncertain taxpositions related to prior years 21 —
At December 311 $327 $3061 If reversed, the total amount of $327 million would be recognized
as a benefit to income taxes on the income statement, and therefore would impact the reported effective tax rate.
Tax Years Still UnderExaminationArgentina 2010-2011, 2013-2019Australia 2015-2019Canada 2015-2019Chile 2015-2019Côte d'Ivoire 2018-2019Democratic Republic of Congo 2019Dominican Republic 2015-2019Mali 2017-2019Papua New Guinea 2006-2019Peru 2013-2019Saudi Arabia 2007-2019Tanzania 2018-2019United States 2019Zambia 2018-2019

BARRICK YEAR-END 2019 162 NOTES TO FINANCIAL STATEMENTS
31 > CAPITAL STOCK
Authorized Capital StockOur authorized capital stock is composed of an unlimited number of common shares (issued 1,777,926,611 common shares as at December 31, 2019). Our common shares have no par value.
On January 1, 2019, we issued 583,669,178 common shares to Randgold shareholders as a result of the Merger. Refer to note 4 for further details.
On September 17, 2019, we issued 24,836,670 common shares to the non-controlling shareholders of Acacia in exchange for their shares in Acacia. Refer to note 4 for further details.
DividendsIn 2019, we declared dividends in US dollars totaling $218 million (2018: $199 million) and paid $548 million (2018: $125 million).
The Company’s dividend reinvestment plan resulted in $20 million (2018: $14 million) reinvested into the Company.
32 > NON-CONTROLLING INTERESTS
a) Non-Controlling Interests (“NCI”) Continuity
NevadaGold Mines
PuebloViejo Acacia
Loulo-Gounkoto Tongon Other Total
NCI in subsidiary at December 31, 2019 38.5% 40% —% 20% 10.3% VariousAt January 1, 2018 $— $1,290 $480 $— $— $11 $1,781Share of income (loss) — 89 22 — — (1) 110Cash contributed — — — — — 24 24Disbursements — (108) — — — (15) (123)At December 31, 2018 $— $1,271 $502 $— $— $19 $1,792Acquisitions1 5,910 — — 887 61 (76) 6,782Share of income (loss) 275 311 (7) 30 (3) (1) 605Cash contributed 90 — — — — 50 140Decrease in non-controlling interest1 — — (495) — — (495)Disbursements (236) (158) — (16) (11) (8) (429)At December 31, 2019 $6,039 $1,424 $— $901 $47 ($16) $8,395
1 Refer to note 4 for further details.
b) Summarized Financial Information on Subsidiaries with Material Non-Controlling Interests
Summarized Balance Sheets
Nevada Gold Mines Pueblo Viejo Loulo-Gounkoto Tongon
As atDecember
31, 2019
As atDecember
31, 2018
As atDecember
31, 2019
As atDecember
31, 2018
As atDecember
31, 2019
As atDecember
31, 2018
As atDecember
31, 2019
As atDecember
31, 2018Current assets $10,977 $— $500 $520 $406 $— $158 $—Non-current assets 15,909 — 4,303 3,469 4,662 — 424 —Total assets $26,886 $— $4,803 $3,989 $5,068 $— $582 $—Current liabilities 466 — 428 720 234 — 59 —Non-current liabilities 1,217 — 932 402 634 — 106 —Total liabilities $1,683 $— $1,360 $1,122 $868 $— $165 $—

BARRICK YEAR-END 2019 163 NOTES TO FINANCIAL STATEMENTS
Summarized Statements of Income
Nevada Gold Mines1 Pueblo Viejo Loulo-Gounkoto TongonFor the years ended December 31 2019 2018 2019 2018 2019 2018 2019 2018Revenue $2,707 $— $1,409 $1,333 $1,007 $— $384 $—Income (loss) from continuing operations after tax 739 — 708 206 158 — (29) —Other comprehensive income (loss) — — — — — — — —Total comprehensive income (loss) $739 $— $708 $206 $158 $— ($29) $—Dividends paid to NCI $236 $— $158 $— $16 $— $11 $—
Summarized Statements of Cash Flows
Nevada Gold Mines1 Pueblo Viejo Loulo-Gounkoto TongonFor the years ended December 31 2019 2018 2019 2018 2019 2018 2019 2018Net cash provided by (used in) operating activities $1,296 $— $504 $272 $259 $— $129 $—Net cash used in investing activities (539) — (107) (144) (130) — 61 —Net cash used in financing activities (379) — (397) (108) (80) — (107) —Net increase (decrease) in cash and cashequivalents $378 $— $— $20 $49 $— $83 $—
1 Nevada Gold Mines was formed July 1, 2019 and therefore results are presented from July 1, 2019 onwards.
33 > RELATED PARTY TRANSACTIONS
The Company’s related parties include its subsidiaries, joint operations, joint ventures and key management personnel. During its normal course of operations, the Company enters into transactions with its related parties for goods and services. Transactions between the Company and its subsidiaries and joint operations, which are related parties of the Company, have been eliminated on consolidation and are not disclosed in this note.
Remuneration of Key Management PersonnelKey management personnel include the members of the Board of Directors and the executive leadership team. Compensation for key management personnel (including Directors) was as follows:
For the years ended December 31 2019 2018Salaries and short-term employee benefits1 $22 $19Post-employment benefits2 1 3Termination Benefits — 1Share-based payments and other3 28 11
$51 $341 Includes annual salary and annual short-term incentives/other bonuses earned in the year.2 Represents Company contributions to retirement savings plans.3 Relates to DSU, RSU, PRSU and LTIP grants and other compensation.

BARRICK YEAR-END 2019 164 NOTES TO FINANCIAL STATEMENTS
34 > STOCK-BASED COMPENSATION
a) Global Employee Share Plan (GESP)In 2016, Barrick launched a Global Employee Share Plan. This is a plan awarded to all eligible employees. During 2019, Barrick contributed and expensed $nil to this plan (2018: $12 million).
b) Restricted Share Units (RSUs) and Deferred Share Units (DSUs)Under our RSU plan, selected employees are granted RSUs where each RSU has a value equal to one Barrick common share. RSUs generally vest from two-and-a-half years to three years and are settled in cash upon vesting. Additional RSUs are credited to reflect dividends paid on Barrick common shares over the vesting period. Compensation expense for RSUs incorporates an expected forfeiture rate. The expected forfeiture rate is estimated based on historical forfeiture rates and expectations of future forfeiture rates. We make adjustments if the actual forfeiture rate differs from the expected rate. At December 31, 2019, the weighted average remaining contractual life of RSUs was 0.74 years (2018: 0.93 years). Compensation expense for RSUs was a $9 million charge to earnings in 2019 (2018: $29 million) and is presented as a component of corporate administration and operating segment administration, consistent with the classification of other elements of compensation expense for those employees who had RSUs. Under our DSU plan, Directors must receive a specified portion of their basic annual retainer in the form of DSUs, with the option to elect to receive 100% of such retainer in DSUs. Officers may also elect to receive a portion or all of their incentive compensation in the form of DSUs. Each DSU has the same value as one Barrick common share. DSUs must be retained until the Director or officer leaves the Board or Barrick, at which time the cash value of the DSUs will be paid out. Additional DSUs are credited to reflect dividends paid on Barrick common shares. DSUs are recorded at fair value on the grant date and are adjusted for changes in fair value. The fair value of amounts granted each period together with changes in fair value are expensed.
DSU and RSU Activity (Number of Units in Thousands)
DSUsFairvalue RSUs
Fairvalue
At January 1, 2018 725 $11.6 4,537 $37.7Settled for cash (143) (1.9) (3,089) (34.6)Forfeited — — (731) (7.9)Granted 182 2.3 2,974 35.3Credits for dividends — — 60 0.8Change in value — (0.8) — 4.7At December 31, 2018 764 $11.2 3,751 $36.0Settled for cash (404) (6.5) (2,131) (30.7)Forfeited — — (1,157) (15.8)Granted 116 1.9 2,600 35.3Credits for dividends — — 47 0.8Change in value — 2.2 — 15.9At December 31, 2019 476 $8.8 3,110 $41.5
c) Performance Granted Share Units (PGSUs)In 2014, Barrick launched a PGSU plan. Under this plan, selected employees are granted PGSUs, where each PGSU has a value equal to one Barrick common share. At December 31, 2019, 3,867 thousand units had been granted at a fair value of $33 million (2018: 3,024 thousand units at a fair value of $18 million).
d) Employee Share Purchase Plan (ESPP)In 2008, Barrick launched an Employee Share Purchase Plan. This plan enabled Barrick employees to purchase Company shares through payroll deduction. During 2019, Barrick contributed and expensed $nil to this plan (2018: $0.1 million). This plan was replaced by the Barrick Share Purchase Plan in 2018.
e) Barrick Share Purchase Plan (BSPP)In 2018, Barrick launched a Barrick Share Purchase Plan. This plan encourages Barrick employees to purchase Company shares by matching their contributions one to one up to an annual maximum. During 2019, Barrick contributed and expensed $3 million to this plan (2018: $2 million).
f) Long-Term Incentive Plan (LTIP)In 2019, Barrick assumed the Long-Term Incentive Plan as a result of the Merger. Under this plan, restricted shares are issued to selected employees subject to certain performance criteria. During 2019, Barrick expensed $9 million to this plan. g) Stock OptionsUnder Barrick’s stock option plan, certain officers and key employees of the Company may purchase common shares at an exercise price that is equal to the closing share price on the day before the grant of the option. The grant date is the date when the details of the award, including the number of options granted by individual and the exercise price, are approved. Stock options vest evenly over four years, beginning in the year after granting. Options are exercisable over seven years. At December 31, 2019, 0.3 million (2018: 0.8 million) stock options were outstanding. Compensation expense for stock options was $nil in 2019(2018: $nil), and is presented as a component of corporate administration and operating segment administration, consistent with the classification of other elements of

BARRICK YEAR-END 2019 165 NOTES TO FINANCIAL STATEMENTS
compensation expense for those employees who had stock options. The recognition of compensation expense for stock options had no impact on earnings per share for 2019 and 2018.
Total intrinsic value relating to options exercised in 2019 was $1 million (2018: $nil).
Employee Stock Option Activity (Number of Shares in Millions)
2019 2018
SharesAverage
Price SharesAverage
PriceC$ optionsAt January 1 0.3 $13 0.3 $13Exercised (0.1) 16 — 10At December 31 0.2 $10 0.3 $13US$ optionsAt January 1 0.5 $37 0.7 $40Forfeited — — (0.1) 34Cancelled/expired (0.4) 39 (0.1) 49At December 31 0.1 $32 0.5 $37
Stock Options Outstanding (Number of Shares in Millions)
Outstanding Exercisable
Range of exercise prices Shares Average priceAverage life
(years)Intrinsic value1
($ millions) Shares Average priceIntrinsic value1
($ millions)C$ options$9 - $17 0.2 $10 2.6 $2 0.2 $10 $2US$ options$32 - $41 0.1 $32 0.1 $— 0.1 $32 $—
1 Based on the closing market share price on December 31, 2019 of C$24.12 and US$18.59.
As at December 31, 2019, there was $nil (2018: $nil) of total unrecognized compensation cost relating to unvested stock options.
35 > POST-RETIREMENT BENEFITS
Barrick operates various post-employment plans, including both defined benefit and defined contribution pension plans and other post-retirement plans. The table below outlines where the Company’s post-employment amounts and activity are included in the financial statements:
For the years ended December 31 2019 2018Balance sheet obligations for:
Defined pension benefits $39 $36Other post-retirement benefits 4 6
Liability in the balance sheet $43 $42Income statement charge includedincome statement for:
Defined pension benefits $1 $1Other post-retirement benefits — —
$1 $1Measurements for:
Defined pension benefits ($5) ($4)Other post-retirement benefits 2 —
($3) ($4)
The amounts recognized in the balance sheet are determined as follows:
For the years ended December 31 2019 2018Present value of funded obligations $69 $57Fair value of plan assets (76) (65)(Surplus) deficit of funded plans ($7) ($8)Present value of unfunded obligations 46 44Total deficit of defined benefit pensionplans $39 $36Impact of minimum fundingrequirement/asset ceiling — —Liability in the balance sheet $39 $36
a) Defined Benefit Pension PlansWe have qualified defined benefit pension plans that cover certain of our former United States and Canadian employees and provide benefits based on an employee’s years of service. The plans operate under similar regulatory frameworks and generally face similar risks. The majority of benefit payments are from trustee-administered funds; however, there are also a number of unfunded plans where the Company meets the benefit payment obligation as it falls due. Plan assets held in trust are governed by local regulations and practice in each country. Responsibility for governance of the plans - overseeing all aspects of the plans including investment

BARRICK YEAR-END 2019 166 NOTES TO FINANCIAL STATEMENTS
decisions and contribution schedules - lies with the Company. We have set up pension committees to assist in the management of the plans and have also appointed experienced independent professional experts such as actuaries, custodians and trustees. The significant actuarial assumptions were as follows:
As at December 31Pension Plans
2019
Other Post-Retirement Benefits
2019Pension Plans
2018
Other Post-Retirement Benefits
2018Discount rate 2.50%-3.30% 3.35% 3.75-4.65% 4.45%
b) Other Post-Retirement Benefits We provide post-retirement medical, dental, and life insurance benefits to certain employees in the US. All of these plans are unfunded. The weighted average duration of the defined benefit obligation is 9 years (2018: 14 years).
Less than a year Between 1-2 years Between 2-5 years Over 5 years TotalPension benefits $7 $7 $22 $139 $175Other post-retirement benefits 1 1 2 5 9At December 31, 2018 $8 $8 $24 $144 $184Pension benefits 27 7 20 95 149Other post-retirement benefits — — 1 3 4At December 31, 2019 $27 $7 $21 $98 $153
c) Defined Contribution Pension PlansCertain employees take part in defined contribution employee benefit plans and we also have a retirement plan for certain officers of the Company. Our share of contributions to these plans, which is expensed in the year it is earned by the employee, was $41 million in 2019 (2018: $35 million).

BARRICK YEAR-END 2019 167 NOTES TO FINANCIAL STATEMENTS
36> CONTINGENCIESCertain conditions may exist as of the date the financial statements are issued that may result in a loss to the Company, but which will only be resolved when one or more future events occur or fail to occur. The impact of any resulting loss from such matters affecting these financial statements and noted below may be material.
Litigation and ClaimsIn assessing loss contingencies related to legal proceedings that are pending against us or unasserted claims that may result in such proceedings, the Company with assistance from its legal counsel, evaluates the perceived merits of any legal proceedings or unasserted claims as well as the perceived merits of the amount of relief sought or expected to be sought.
Proposed Canadian Shareholder Class Action (Veladero) On July 28, 2018, Peter Gradja, a purported shareholder of Barrick Gold Corporation, commenced a proposed class action against the Company in the Ontario Superior Court of Justice. The action seeks unspecified damages and other relief, purportedly on behalf of anyone who purchased Barrick shares during the period from February 15, 2017 to April 24, 2017 and held some or all of those shares at the close of trading on April 24, 2017. It was alleged that Barrick made false and misleading statements concerning production estimates and environmental risks at the Veladero mine.
On April 11, 2019, Barrick received an offer from the plaintiff to dismiss the proposed class action lawsuit without costs. The Ontario Superior Court of Justice ordered the dismissal of the proposed class action lawsuit on August 19, 2019, and the matter is now closed.
Proposed Canadian Securities Class Actions (Pascua-Lama) Between April and September 2014, eight proposed class actions were commenced against the Company in Canada in connection with the Pascua-Lama project. Four of the proceedings were commenced in Ontario, two were commenced in Alberta, one was commenced in Saskatchewan, and one was commenced in Quebec. The proceedings alleged that the Company made false and misleading statements to the investing public relating (among other things) to the capital costs of the Pascua-Lama project (the “Project”), the amount of time it would take before production commenced at the Project, and the environmental risks of the Project, as well as alleged internal control failures and certain accounting-related matters.
The first Ontario and Alberta actions were commenced by Statements of Claim on April 15 and 17, 2014, respectively. The same law firm acted for the plaintiffs in these two proceedings, and the Statements of Claim were largely identical. Aaron Regent, Jamie Sokalsky and Ammar Al-Joundi were also named as defendants in the two actions. Both actions purported to be on behalf of anyone who, during the period from May 7, 2009 to May 23, 2013, purchased Barrick securities in Canada. Both actions sought $4.3 billion in general damages and $350 million in special damages for alleged misrepresentations in the Company’s public disclosure. The first Ontario action was subsequently consolidated with the fourth Ontario action, as discussed below. The first Alberta action was discontinued by plaintiffs’ counsel on June 26, 2015.
The second Ontario action was commenced on April 24, 2014. Aaron Regent, Jamie Sokalsky, Ammar Al-Joundi and Peter Kinver were also named as defendants. Following a September 8, 2014 amendment to the Statement of Claim, this action purported to be on behalf of anyone who acquired Barrick securities during the period from October 29, 2010 to October 30, 2013, and sought $3 billion in damages for alleged misrepresentations in the Company’s public disclosure. The amended claim also reflected the addition of a law firm that previously acted as counsel in a third Ontario action, which was commenced by Notice of Action on April 28, 2014 and included similar allegations but was never served or pursued. As a result of the outcome of the carriage motion and appeals described below, the second Ontario action was subsequently stayed.
The Quebec action was commenced on April 30, 2014. Aaron Regent, Jamie Sokalsky, Ammar Al-Joundi and Peter Kinver are also named as defendants. This action purports to be on behalf of any person who resides in Quebec and acquired Barrick securities during the period from May 7, 2009 to November 1, 2013. The action seeks unspecified damages for alleged misrepresentations in the Company’s public disclosure.
The second Alberta action was commenced on May 23, 2014. Aaron Regent, Jamie Sokalsky, Ammar Al-Joundi and Peter Kinver were also named as defendants. This action purported to be on behalf of any person who acquired Barrick securities during the period from May 7, 2009 to November 1, 2013, and sought $6 billion in damages for alleged misrepresentations in the Company's public disclosure. The action was dismissed on consent on June 19, 2017.
The Saskatchewan action was commenced by Statement of Claim on May 26, 2014. Aaron Regent, Jamie Sokalsky, Ammar Al-Joundi and Peter Kinver were also named as defendants. This action purported to be on behalf of any person who acquired Barrick securities during the period from May 7, 2009 to November 1, 2013, and sought $6 billion in damages for alleged misrepresentations in the Company's public disclosure. The action was discontinued by plaintiffs’ counsel on December 19, 2016.
The fourth Ontario action was commenced on September 5, 2014. Aaron Regent, Jamie Sokalsky, Ammar Al-Joundi and Peter Kinver are also named as defendants. This action purports to be on behalf of any person who acquired Barrick securities during the period from May 7, 2009 to November 1, 2013 in Canada, and seeks $3 billion in damages plus an unspecified amount for alleged misrepresentations in the Company's public disclosure. The Statement of Claim was amended on October 20, 2014 to include two additional law firms, one of which was acting as counsel in the first Ontario action referred to above and the other of which no longer exists. In January 2018, plaintiffs’ counsel delivered a consolidated Statement of Claim in this action. The Statement of Claim was amended again in May 2018.
In November 2014, an Ontario court heard a motion to determine which of the competing counsel groups would take the lead in the Ontario litigation. The court issued a decision in December 2014 in favor of the counsel group that commenced the first and fourth Ontario actions, which were

BARRICK YEAR-END 2019 168 NOTES TO FINANCIAL STATEMENTS
then consolidated in a single action. The lower court’s decision was subsequently affirmed by the Divisional Court in May 2015 and the Court of Appeal for Ontario in July 2016 following appeals by the losing counsel group. The losing counsel group sought leave to appeal to the Supreme Court of Canada but later discontinued the application after reaching an agreement with the counsel group that commenced the first and fourth Ontario actions.
The proposed representative plaintiffs in the Quebec and Ontario actions have brought motions seeking: (i) leave to proceed with statutory misrepresentation claims pursuant to provincial securities legislation; and (ii) orders certifying the actions as class actions. In August 2018, the Company and Aaron Regent, Jamie Sokalsky, Ammar Al-Joundi and Peter Kinver delivered their Statement of Defence in the Ontario action.
In May 2019, the motion for leave to proceed with statutory misrepresentation claims and for class certification was heard in the Quebec action. Additional submissions were heard in December 2019. The Quebec court has reserved judgment in this matter.
In July 2019, the motion for leave to proceed with statutory misrepresentation claims was heard in the Ontario action. In October 2019, the Ontario Superior Court of Justice dismissed all but one of those claims. The sole remaining statutory misrepresentation claim pertains to a statement concerning the water management system in Chile made by the Company in its Management's Discussion and Analysis for the second quarter of 2012. The Company has filed a motion in the Divisional Court for leave to appeal the decision to allow the sole remaining statutory misrepresentation claim to proceed. The Plaintiffs have also filed an appeal to the Court of Appeal for Ontario with respect to the claims that were dismissed.
The motion for class certification in Ontario is scheduled to be heard in March 2020.
The Company intends to vigorously defend all of the proposed Canadian securities class actions. No amounts have been recorded for any potential liability arising from any of the proposed class actions, as the Company cannot reasonably predict the outcome.
Pascua-Lama – SMA Regulatory Sanctions In May 2013, Compañía Minera Nevada (“CMN”), Barrick’s Chilean subsidiary that holds the Chilean portion of the Project, received a Resolution (the “Original Resolution”) from Chile’s environmental regulator (the Superintendencia del Medio Ambiente, or “SMA”) that requires CMN to complete the water management system for the Project in accordance with the Project’s environmental permit before resuming construction activities in Chile. The Original Resolution also required CMN to pay an administrative fine of approximately $16 million for deviations from certain requirements of the Project’s Chilean environmental approval, including a series of reporting requirements and instances of non-compliance related to the Project’s water management system. CMN paid the administrative fine in May 2013.
In June 2013, CMN began engineering studies to review the Project’s water management system in accordance with the Original Resolution. The studies were suspended in the
second half of 2015 as a result of CMN’s decision to file a temporary and partial closure plan for the Project. The review of the Project’s water management system may require a new environmental approval and the construction of additional water management facilities.
In June 2013, a group of local farmers and indigenous communities challenged the Original Resolution. The challenge, which was brought in the Environmental Court of Santiago, Chile (the “Environmental Court”), claimed that the fine was inadequate and requested more severe sanctions against CMN including the revocation of the Project’s environmental permit. The SMA presented its defense of the Original Resolution in July 2013. On August 2, 2013, CMN joined as a party to this proceeding and vigorously defended the Original Resolution. On March 3, 2014, the Environmental Court annulled the Original Resolution and remanded the matter back to the SMA for further consideration in accordance with its decision (the “Environmental Court Decision”). In particular, the Environmental Court ordered the SMA to issue a new administrative decision that recalculated the amount of the fine to be paid by CMN using a different methodology and addressed certain other errors it identified in the Original Resolution. The Environmental Court did not annul the portion of the Original Resolution that required the Company to halt construction on the Chilean side of the Project until the water management system is completed in accordance with the Project’s environmental permit. On December 30, 2014, the Chilean Supreme Court declined to consider CMN’s appeal of the Environmental Court Decision on procedural grounds. As a result of the Supreme Court’s ruling, on April 22, 2015, the SMA reopened the administrative proceeding against CMN in accordance with the Environmental Court Decision.
On April 22, 2015, CMN was notified that the SMA had initiated a new administrative proceeding for alleged deviations from certain requirements of the Project’s environmental approval, including with respect to the Project’s environmental impact and a series of monitoring requirements. In May 2015, CMN submitted a compliance program to address certain of the allegations and presented its defense to the remainder of the alleged deviations. The SMA rejected CMN’s proposed compliance program on June 24, 2015, and denied CMN’s administrative appeal of that decision on July 31, 2015. On December 30, 2016, the Environmental Court rejected CMN’s appeal and CMN declined to challenge this decision.
On June 8, 2016, the SMA consolidated the two administrative proceedings against CMN into a single proceeding encompassing both the reconsideration of the Original Resolution in accordance with the decision of the Environmental Court and the alleged deviations from the Project’s environmental approval notified by the SMA in April 2015.
On January 17, 2018, CMN received the revised resolution (the “Revised Resolution”) from the SMA, in which the environmental regulator reduced the original administrative fine from approximately $16 million to $11.5 million and ordered the closure of existing surface facilities on the Chilean side of the Project in addition to certain monitoring activities. The Revised Resolution does not revoke the Project’s environmental approval. CMN filed an appeal of the Revised Resolution on February 3, 2018 with the First Environmental

BARRICK YEAR-END 2019 169 NOTES TO FINANCIAL STATEMENTS
Court of Antofagasta (the “Antofagasta Environmental Court”).
On October 12, 2018, the Antofagasta Environmental Court issued an administrative ruling ordering review of the significant sanctions ordered by the SMA. CMN was not a party to this process. In its ruling, the Antofagasta Environmental Court rejected four of the five closure orders contained in the Revised Resolution and remanded the related environmental infringements back to the SMA for further consideration. A new resolution from the SMA with respect to the sanctions for these four infringements could include a range of potential sanctions, including additional fines, as provided in the Chilean legislation. The Antofagasta Environmental Court upheld the SMA’s decision to order the closure of the Chilean side of the Project for the fifth infringement.
As previously noted, CMN has appealed the Revised Resolution and this appeal remains in place. A hearing on the appeal was held on November 6, 2018, and CMN continues to evaluate all of its legal options. A decision of the Environmental Court on the remaining appeals is still pending.
Following the issuance of the Revised Resolution, the Company reversed the estimated amount previously recorded for any additional proposed administrative fines in this matter. In addition, the Company reclassified Pascua-Lama’s proven and probable gold reserves as measured and indicated resources and recorded a pre-tax impairment of $429 million in the fourth quarter of 2017. No additional amounts have been recorded for any potential liability arising from the Antofagasta Environmental Court’s October 12, 2018 ruling and subsequent review by the SMA, as the Company cannot reasonably predict any potential losses and the SMA has not issued any additional proposed administrative fines.
On March 14, 2019, the Chilean Supreme Court annulled the October 12, 2018 administrative decision of the Antofagasta Environmental Court on procedural grounds and remanded the case back to the Environmental Court for review by a different panel of judges. The Chilean Supreme Court did not review the merits of the Revised Resolution, which remains in effect. CMN’s appeal of the Revised Resolution remains pending before the new panel of judges ordered by the Chilean Supreme Court, which heard arguments on July 23, 2019.
The Company intends to vigorously defend this matter.
Pascua-Lama – Water Quality Review CMN initiated a review of the baseline water quality of the Rio Estrecho in August 2013 as required by a July 15, 2013 decision of the Court of Appeals of Copiapo, Chile. The purpose of the review was to establish whether the water quality baseline has changed since the Pascua-Lama project received its environmental approval in February 2006 and, if so, to require CMN to adopt the appropriate corrective measures. As a result of that study, CMN requested certain modifications to its environmental permit water quality requirements. On June 6, 2016, the responsible agency approved a partial amendment of the environmental permit to better reflect the water quality baseline from 2009. That approval was appealed by certain water users and indigenous residents of the Huasco Valley. On October 19, 2016, the
Chilean Committee of Ministers for the Environment, which has jurisdiction over claims of this nature, voted to uphold the permit amendments. On January 27, 2017, the Environmental Court agreed to consider an appeal of the Chilean Committee’s decision brought by CMN and the water users and indigenous residents. A hearing took place on July 25, 2017. On December 12, 2017, the water users withdrew their appeal. The Environmental Court dismissed that appeal on January 5, 2018. On December 10, 2018, the Environmental Court rejected the remaining challenges and upheld the environmental permit amendment. On December 29, 2018, the indigenous residents appealed the Environmental Court’s decision to the Chilean Supreme Court.
On February 19, 2019, the Chilean Supreme Court accepted the appeal by the indigenous residents of the Environmental Court's decision. The Chilean Supreme Court heard oral arguments on September 10 and 11, 2019. On January 6, 2020, the Chilean Supreme Court affirmed the Environmental Court’s decision, upholding the environmental permit amendment and recognizing the water quality baseline from 2005 to September 2009. The matter is now closed. Veladero – September 2015 Release of Cyanide-Bearing Process Solution
San Juan Provincial Regulatory Sanction Proceeding On September 13, 2015, a valve on a leach pad pipeline at the Company’s Veladero mine in San Juan Province, Argentina failed, resulting in a release of cyanide-bearing process solution into a nearby waterway through a diversion channel gate that was open at the time of the incident. Minera Andina del Sol SRL (formerly, Minera Argentina Gold SRL) (“MAS”), Barrick’s Argentine subsidiary that operates the Veladero mine, notified regulatory authorities of the situation. Environmental monitoring was conducted by MAS and independent third parties following the incident. The Company believes this monitoring demonstrates that the incident posed no risk to human health at downstream communities. A temporary restriction on the addition of new cyanide to the mine’s processing circuit was lifted on September 24, 2015, and mine operations returned to normal. Monitoring and inspection of the mine site continued in accordance with a court order until November 28, 2018 when that order was rescinded. On October 9, 2015, the San Juan Provincial mining authority initiated an administrative sanction process against MAS for alleged violations of the mining code relating to the valve failure and release of cyanide-bearing process solution. On March 15, 2016, MAS was formally notified of the imposition of an administrative fine in connection with the solution release. On April 6, 2016, MAS sought reconsideration of certain aspects of the decision but paid the administrative fine of approximately $10 million (at the then-applicable Argentine peso to U.S. dollar exchange rate) while the request for reconsideration was pending. On July 11, 2017, the San Juan government rejected MAS’ administrative appeal of this decision. On September 5, 2017, the Company commenced a legal action to continue challenging certain aspects of the decision before the San Juan courts. MAS has implemented a remedial action plan at Veladero in response to the incident,as required by the San Juan Provincial mining authority. Criminal Matters

BARRICK YEAR-END 2019 170 NOTES TO FINANCIAL STATEMENTS
Provincial ActionOn March 11, 2016, a San Juan Provincial Court laid criminal charges based on alleged negligence against nine current and former MAS employees in connection with the solution release (the “Provincial Action”). On August 15, 2017, the Court of Appeals confirmed the indictment against eight of the nine individuals that had been charged with alleged negligence in connection with the solution release. MAS is not a party to the Provincial Action. On August 23, 2018, the eight defendants in the Provincial Action were granted probation. The terms of the probation do not require the defendants to recognize any wrongdoing. If the defendants complied with good behavior and community service requirements for one year, the Provincial Action would be dismissed.
All defendants have now completed the probationary period for community service and good behavior and requested dismissal of the charges in the Provincial Action.
Federal InvestigationA federal criminal investigation was initiated by a Buenos Aires federal court based on the alleged failure of certain current and former federal and provincial government officials and individual directors of MAS to prevent the 2015 solution release (the “Federal Investigation”). The federal judge overseeing the Federal Investigation admitted a local group in San Juan Province as a party. In March 2016, this group requested an injunction against the operations of the Veladero mine. The federal judge ordered technical studies to assess the solution release and its impact and appointed a committee to conduct a site visit, which occurred in late April 2016.
On May 5, 2016, the National Supreme Court of Argentina limited the scope of the Federal Investigation to the potential criminal liability of the federal government officials, ruling that the Buenos Aires federal court does not have jurisdiction to investigate the solution release. As a result of this decision, the investigation into the incident continued to be conducted by the San Juan Provincial judge in the Provincial Action.
On April 11, 2018, the federal judge indicted three former federal officials alleging breach of duty in connection with their actions and omissions related to the failure to maintain adequate environmental controls. After an appeal process, on July 10, 2018, the Court of Appeals confirmed the indictments. On October 16, 2018, the investigation into the alleged failure of three former federal government officials to maintain adequate environmental controls during 2015 was concluded and the case was sent to trial.
On June 29, 2018, the federal judge ordered additional environmental studies to be conducted in communities downstream from the Veladero mine as part of the investigation into the alleged failure of three former federal government officials to maintain adequate environmental controls. On July 6, 2018, the Province of San Juan challenged this order on jurisdictional grounds. On August 9, 2018, the Federal Court ordered additional studies. One of the defendants appointed an expert to monitor the sampling and analysis required to perform such studies. The Federal Court rejected the jurisdictional challenge, which resulted in an appeal to the Federal Supreme Court on August 24, 2018 to adjudicate jurisdiction. To date, the studies have not been performed.
Glaciers InvestigationOn October 17, 2016, a separate criminal investigation was initiated by the federal judge overseeing the Federal Investigation based on the alleged failure of federal government officials to regulate the Veladero mine under Argentina’s glacier legislation (the “Glacier Investigation”) (see “Argentine Glacier Legislation and Constitutional Litigation” below). On June 16, 2017, MAS submitted a motion to challenge the federal judge’s decision to assign this investigation to himself. MAS also requested to be admitted as a party to the proceeding in order to present evidence in support of MAS. On September 14, 2017, the Court of Appeals ordered the federal judge to consolidate the two investigations and allowed MAS to participate in the consolidated Federal Investigation. On November 21, 2017, the Court of Appeals clarified that MAS is not a party to the case and therefore did not have standing to seek the recusal of the federal judge. The Court recognized MAS’ right to continue to participate in the case without clarifying the scope of those rights.
On November 27, 2017, the federal judge indicted four former federal government officials, alleging abuse of authority in connection with their actions and omissions related to the enforcement of Argentina’s national glacier legislation including the methodology used to complete the national inventory of glaciers, a portion of which was published on October 3, 2016, and also requiring the National Ministry of the Environment and Sustainable Development to determine if there has been any environmental damage to glaciers since the glacier law went into effect in light of his decision. On December 12, 2017, the National Ministry of the Environment and Sustainable Development clarified that it does not have jurisdiction to audit environmental damage to glaciers, as this is the responsibility of the Provincial authorities.
On March 5, 2018, the Court of Appeals confirmed the indictment against the four former federal officials in relation to the Glacier Investigation. On August 6, 2018, the case related to the enforcement of the national glacier legislation was assigned to a federal trial judge.
In total, six former federal officials were indicted under the Federal Investigation and the Glacier Investigation (one of whom has been indicted on two separate charges) and will face trial. In 2019, the former federal official indicted on separate charges under both the Federal Investigation and the Glacier Investigation passed away. As a result, the charges against him have been dropped.
Oral arguments with respect to the charges for the remaining five former federal officials have been scheduled for February and March 2020, with a final decision expected by July 2020.
No amounts have been recorded for any potential liability arising from these matters, as the Company cannot reasonably predict any potential losses.

BARRICK YEAR-END 2019 171 NOTES TO FINANCIAL STATEMENTS
Veladero – September 2016 Release of Crushed Ore Saturated with Process Solution
Temporary Suspension of Operations and Regulatory Infringement Proceeding
On September 8, 2016, ice rolling down the slope of the leach pad at the Veladero mine damaged a pipe carrying process solution, causing some material to leave the leach pad. This material, primarily crushed ore saturated with process solution, was contained on the mine site and returned to the leach pad. Extensive water monitoring in the area conducted by MAS has confirmed that the incident did not result in any environmental impacts. A temporary suspension of operations at the Veladero mine was ordered by the San Juan Provincial mining authority and a San Juan Provincial court on September 15, 2016 and September 22, 2016, respectively, as a result of this incident. On October 4, 2016, following, among other matters, the completion of certain urgent works required by the San Juan Provincial mining authority and a judicial inspection of the mine, the San Juan Provincial court lifted the suspension of operations and ordered that mining activities be resumed.
On September 14, 2016, the San Juan Provincial mining authority commenced an administrative proceeding in connection with this incident that included, in addition to the issue of the suspension order, an infringement proceeding against MAS. On December 2, 2016, the San Juan Provincial mining authority notified MAS of two charges under the infringement proceeding for alleged violations of the Mining Code. A new criminal judicial investigation has also been commenced by the Provincial prosecutor’s office in the same San Juan Provincial court that is hearing the Provincial Action. The court in this proceeding issued the orders suspending and resuming the operations at the Veladero mine described above.
On September 14, 2017, the San Juan Provincial mining authority consolidated the administrative proceeding into a single proceeding against MAS encompassing both the September 2016 incident and the March 2017 incident described below (see “Veladero - March 2017 Release of Gold-bearing Process Solution” below).
On December 27, 2017, MAS received notice of a resolution from the San Juan Provincial mining authority requiring payment of an administrative fine of approximately $5.6 million (calculated at the prevailing exchange rate on December 31, 2017) encompassing both the September 2016 incident and the March 2017 incident described below. On January 23, 2018, in accordance with local requirements, MAS paid the administrative fine and filed a request for reconsideration with the San Juan Provincial mining authority. On March 28, 2018, MAS was notified that the San Juan Provincial mining authority had rejected the request for reconsideration. A further appeal was filed on April 20, 2018 and will be heard and decided by the Governor of San Juan.
Veladero – Cyanide Leaching Process Civil Action On December 15, 2016, MAS was served notice of a lawsuit by certain persons who claim to be living in Jachal, Argentina and to be affected by the Veladero mine and, in particular, the Valley Leach Facility (“VLF”). In the lawsuit, which was filed in the San Juan Provincial court, the plaintiffs have requested
a court order that MAS cease leaching metals with cyanide solutions, mercury and other similar substances at the Veladero mine and replace that process with one that is free of hazardous substances, that MAS implement a closure and remediation plan for the VLF and surrounding areas, and create a committee to monitor this process. The lawsuit is proceeding as an ordinary civil action. MAS replied to the lawsuit on February 20, 2017. On March 31, 2017, the plaintiffs supplemented their original complaint to allege that the risk of environmental damage had increased as a result of the March 28, 2017 release of gold-bearing process solution incident described below (see “Veladero - March 2017 Release of Gold-bearing Process Solution” below). The Company responded to the new allegations and intends to continue defending this matter vigorously. No amounts have been recorded for any potential liability or asset impairment under this matter, as the Company cannot reasonably predict the outcome.
Veladero – March 2017 Release of Gold-bearing Process Solution
Regulatory Infringement Proceeding and Temporary Suspension of Addition of Cyanide On March 28, 2017, the monitoring system at the Company’s Veladero mine detected a rupture of a pipe carrying gold-bearing process solution on the leach pad. This solution was contained within the operating site; no solution reached any diversion channels or watercourses. All affected soil was promptly excavated and placed on the leach pad. The Company notified regulatory authorities of the situation, and San Juan provincial authorities inspected the site on March 29, 2017.
On March 29, 2017, the San Juan Provincial mining authority issued a violation notice against MAS in connection with the incident and ordered a temporary restriction on the addition of new cyanide to the leach pad until corrective actions on the system were completed. The mining authority lifted the suspension on June 15, 2017, following inspection of corrective actions.
On March 30, 2017, the San Juan Mining Minister ordered the commencement of a regulatory infringement proceeding against MAS as well as a comprehensive evaluation of the mine’s operations to be conducted by representatives of the Company and the San Juan provincial authorities. The Company filed its defense to the regulatory infringement proceeding on April 5, 2017. On September 14, 2017, the San Juan Provincial mining authority consolidated this administrative proceeding into a single proceeding against MAS encompassing both the September 2016 incident described above and the March 2017 incident. On October 10, 2017, the San Juan Provincial mining authority notified MAS of two charges under the infringement proceeding for alleged violations of the Mining Code in connection with the March 2017 incident.
On December 27, 2017, MAS received notice of a resolution from the San Juan Provincial mining authority requiring payment of an administrative fine of approximately $5.6 million (calculated at the prevailing exchange rate on December 31, 2017) encompassing both the September 2016 incident described above and the March 2017 incident. On January 23, 2018, in accordance with local requirements,

BARRICK YEAR-END 2019 172 NOTES TO FINANCIAL STATEMENTS
MAS paid the administrative fine and filed a request for reconsideration with the San Juan Provincial mining authority. On March 28, 2018, MAS was notified that the San Juan Provincial mining authority had rejected the request for reconsideration. A further appeal will be heard and decided by the Governor of San Juan.
Provincial Amparo Action On March 30, 2017, MAS was served notice of a lawsuit, called an “amparo” protection action, filed in the Jachal First Instance Court (the “Jachal Court”) by individuals who claimed to be living in Jachal, Argentina, seeking the cessation of all activities at the Veladero mine. The plaintiffs sought an injunction as part of the lawsuit, requesting, among other things, the cessation of all activities at the Veladero mine or, alternatively, a suspension of the leaching process at the mine. On March 30, 2017, the Jachal Court rejected the request for an injunction to cease all activities at the Veladero mine, but ordered, among other things, the suspension of the leaching process at the Veladero mine and for MAS and the San Juan Provincial mining authority to provide additional information to the Jachal Court in connection with the incident.
The Company filed a defense to the provincial amparo action on April 7, 2017. The Jachal Court lifted the suspension on June 15, 2017, after the San Juan Provincial mining authority provided the required information and a hydraulic assessment of the leach pad and process plant was implemented. Further developments in this case are pending a decision by the Argentine Supreme Court as to whether the Federal Court or Provincial Court has jurisdiction to assess the merits of the amparo remedy. On December 26, 2019, the Argentine Supreme Court ruled on the jurisdictional dispute in favor of the Federal Court (see “Veladero - Release of Gold-bearing Process Solution - Federal Amparo Action” below).
No amounts have been recorded for any potential liability or asset impairment under this matter, as the Company cannot reasonably predict the outcome.
Federal Amparo Action On April 4, 2017, the National Minister of Environment of Argentina filed a lawsuit in the Buenos Aires federal court (the “Federal Court”) in connection with the March 2017 incident described above. The amparo protection action sought a court order requiring the cessation and/or suspension of activities at the Veladero mine. MAS submitted extensive information to the Federal Court about the incident, the then-existing administrative and provincial judicial suspensions, the remedial actions taken by the Company and the lifting of the suspensions as described above. MAS also challenged the jurisdiction of the Federal Court and the standing of the National Minister of Environment of Argentina and requested that the matter be remanded to the Jachal Court. The Province of San Juan also challenged the jurisdiction of the Federal Court in this matter. On June 23, 2017, the Federal Court decided that it was competent to hear the case, and referred the case to the Court of Appeals to determine whether the Federal Court or Provincial Court in the case described above has the authority to assess the merits of the amparo remedy. On July 5, 2017, the Provincial Court issued a request for the Supreme Court of Argentina to resolve the jurisdictional dispute. On July 30, 2017, the Court of Appeals referred the jurisdictional dispute to the Supreme Court and a decision on the matter is pending. On December 26, 2019, the Argentine
Supreme Court ruled on the jurisdictional dispute in favor of the Federal Court.
No amounts have been recorded for any potential liability or asset impairment under this matter, as the Company cannot reasonably predict the outcome.
Veladero – Tax Assessment and Criminal Charges On December 26, 2017, MAS received notice of a tax assessment (the “Tax Assessment”) for 2010 and 2011, amounting to ARS 543 million (approximately $14.1 million at the prevailing exchange rate at December 31, 2018), plus interest and fines. The Tax Assessment primarily claims that certain deductions made by MAS were not properly characterized, including that (i) the interest and foreign exchange on loans borrowed between 2002 and 2006 to fund Veladero’s construction should have been classified as equity contributions, and (ii) fees paid for intercompany services were not for services related to the operation of the Veladero mine. On June 21, 2018, the Argentinean Federal Tax Authority (“AFIP”) confirmed the Tax Assessment, which MAS appealed to the Federal Tax Court on July 31, 2018. A hearing for the appeal has not yet been scheduled.
In November 2018, MAS received notice that AFIP filed criminal charges against current and former employees serving on its board of directors when the 2010 and 2011 tax returns were filed (the “Criminal Tax Case”).
Hearings for the Criminal Tax case were held between March 25 and March 27, 2019. The defendants filed a motion to dismiss based on the statute of limitations, which was granted in part and which has been appealed by the prosecution.
The Company filed Mutual Agreement Procedure applications in Canada on December 21, 2018, and in Argentina on March 29, 2019, pursuant to the Canada-Argentina Income Tax Convention Act (the "Canada-Argentina Tax Treaty") to escalate resolution of the Tax Assessment to the competent authority (as defined in the Canada-Argentina Tax Treaty) in an effort to seek efficient resolution of the matter.
The Company believes that the Tax Assessment and the Criminal Tax Case are without merit and intends to defend the proceedings vigorously. No amounts have been recorded for any potential liability arising from the Tax Assessment or the Criminal Tax Case, as the Company cannot reasonably predict the outcome.
Argentine Glacier Legislation and Constitutional Litigation On September 30, 2010, the National Law on Minimum Requirements for the Protection of Glaciers was enacted in Argentina, and came into force in early November 2010. The federal law banned new mining exploration and exploitation activities on glaciers and in the “peri-glacial” environment, and subjected ongoing mining activities to an environmental audit. If the audit identifies significant impacts on glaciers and peri-glacial environment, the relevant authority is empowered to take action, which according to the legislation could include the suspension or relocation of the activity. In the case of the Veladero mine and the Argentinean side of the Pascua-Lama

BARRICK YEAR-END 2019 173 NOTES TO FINANCIAL STATEMENTS
project, the competent authority is the Province of San Juan. In late January 2013, the Province announced that it had completed the required environmental audit, which concluded that Veladero and Pascua-Lama do not impact glaciers or peri-glaciers. On October 3, 2016, federal authorities published a partial national inventory of glaciers, which included the area where the Veladero mine and Pascua-Lama Project are located. The Company has analyzed the national inventory in the area where Veladero and Pascua-Lama are located and has concluded that this inventory is consistent with the provincial inventory that the Province of San Juan used in connection with its January 2013 environmental audit. On June 11, 2018, the federal authorities published the complete national inventory of glaciers; the complete inventory is consistent with the partial national inventory of glaciers published previously in the area where Veladero and Pascua-Lama are located.
The constitutionality of the federal glacier law was the subject of a challenge before the National Supreme Court of Argentina. On October 27, 2014, the Company submitted its response to a motion by the federal government to dismiss the constitutional challenge to the federal glacier law on standing grounds. On June 4, 2019, the National Supreme Court of Argentina dismissed the case on the basis that no harm deriving from the federal glacier law has been proven and that the federal glacier law does not impact Veladero and Pascua-Lama and the matter is now closed.
Pueblo Viejo – Amparo Action In October 2014, Pueblo Viejo Dominicana Corporation (“PVDC”) received a copy of an action filed in an administrative court (the “Administrative Court”) in the Dominican Republic by Rafael Guillen Beltre (the “Petitioner”), who claims to be affiliated with the Dominican Christian Peace Organization. The action alleges that environmental contamination in the vicinity of the Pueblo Viejo mine has caused illness and affected water quality in violation of the Petitioner’s fundamental rights under the Dominican Constitution and other laws. The primary relief sought in the action, which is styled as an “amparo” remedy, is the suspension of operations at the Pueblo Viejo mine as well as other mining projects in the area until an investigation into the alleged environmental contamination has been completed by the relevant governmental authorities. On November 21, 2014, the Administrative Court granted PVDC’s motion to remand the matter to a trial court in the Municipality of Cotuí (the “Trial Court”) on procedural grounds. On June 25, 2015, the Trial Court rejected the Petitioner’s amparo action, finding that the Petitioner failed to produce evidence to support his allegations. The Petitioner appealed the Trial Court’s decision to the Constitutional Court on July 21, 2015. On July 28, 2015, PVDC filed a motion to challenge the timeliness of this appeal as it was submitted after the expiration of the applicable filing deadline. On April 12, 2019, PVDC's motion to challenge the timeliness of the appeal was accepted by the Constitutional Court, and the matter is now closed.
Perilla Complaint In 2009, Barrick Gold Inc. and Placer Dome Inc. were purportedly served in Ontario with a complaint filed in November 2008 in the Regional Trial Court of Boac (the “Court”), on the Philippine island of Marinduque, on behalf of two named individuals and purportedly on behalf of the approximately 200,000 residents of Marinduque. The
complaint alleges injury to the economy and the ecology of Marinduque as a result of the discharge of mine tailings from the Marcopper mine into Calancan Bay, the Boac River, and the Mogpog River. Placer Dome Inc., which was acquired by the Company in 2006, had been a minority indirect shareholder of the Marcopper mine. The plaintiffs are claiming for abatement of a public nuisance allegedly caused by the tailings discharge and for nominal damages for an alleged violation of their constitutional right to a balanced and healthful ecology. In June 2010, Barrick Gold Inc. and Placer Dome Inc. filed a motion to have the Court resolve their unresolved motions to dismiss before considering the plaintiffs' motion to admit an amended complaint and also filed an opposition to the plaintiffs' motion to admit on the same basis. By Order dated November 9, 2011, the Court granted a motion to suspend the proceedings filed by the plaintiffs. It is not known when these motions or the outstanding motions to dismiss will be decided by the Court. To date neither the plaintiffs nor the Company has advised the Court of an intention to resume the proceedings. The Company intends to defend the action vigorously. No amounts have been recorded for any potential liability under this complaint, as the Company cannot reasonably predict the outcome.
Writ of KalikasanIn February 2011, a Petition for the Issuance of a Writ of Kalikasan with Prayer for Temporary Environmental Protection Order was filed in the Supreme Court of the Republic of the Philippines (the “Supreme Court”) in Eliza M. Hernandez, Mamerto M. Lanete and Godofredo L. Manoy versus Placer Dome Inc. and Barrick Gold Corporation (the “Petitioners”). In March 2011, the Supreme Court issued an En Banc Resolution and Writ of Kalikasan, directed service of summons on Placer Dome Inc. and the Company, ordered Placer Dome Inc. and the Company to make a verified return of the Writ within ten (10) days of service and referred the case to the Court of Appeal for hearing. The Petition alleges that Placer Dome Inc. violated the petitioners’ constitutional right to a balanced and healthful ecology as a result of, among other things, the discharge of tailings into Calancan Bay, the 1993 Maguila-Guila dam break, the 1996 Boac River tailings spill and failure of Marcopper to properly decommission the Marcopper mine. The petitioners have pleaded that the Company is liable for the alleged actions and omissions of Placer Dome Inc., which was a minority indirect shareholder of Marcopper at all relevant times, and is seeking orders requiring the Company to environmentally remediate the areas in and around the mine site that are alleged to have sustained environmental impacts. The petitioners purported to serve the Company in March 2011, following which the Company filed an Urgent Motion For Ruling on Jurisdiction with the Supreme Court challenging the constitutionality of the Rules of Procedure in Environmental Cases (the “Environmental Rules”) pursuant to which the Petition was filed, as well as the jurisdiction of the Supreme Court over the Company. By resolution dated October 12, 2011 the Court of Appeals granted the Petitioners’ October 4, 2011 motion to suspend proceedings to permit the Petitioners to explore the possibility of a settlement. The proceedings are suspended pending further notice from the Petitioners. In November 2011,two local governments, or "baranguays" (Baranguay San Antonio and Baranguay Lobo) filed a motion with the Supreme Court seeking intervenor status with the intention of seeking a dismissal of the proceedings.

BARRICK YEAR-END 2019 174 NOTES TO FINANCIAL STATEMENTS
In December 2016, the Petitioners notified the Court of Appeals that settlement negotiations did not resolve the action. In March 2017, the Court of Appeals required the Petitioners to advise whether they intend to pursue the action. Without responding to the court, Petitioners’ counsel advised the Court of Appeals in July 2017 of their withdrawal as counsel for the Petitioners and informed the Court of Appeals of the death of one of the Petitioners. The Court of Appeals issued a resolution in November 2017 requiring the Petitioners to notify the Court whether they have engaged new counsel. Petitioners’ new counsel filed an entry of appearance in December 2017 with the Court. The Petitioners served a Motion to Lift Order of Suspension of Proceedings dated September 12, 2018 to have the proceedings resume. In September 2018 the Company filed an Opposition to this motion in which it requested that the suspension of proceedings not be lifted and the proceedings instead be dismissed for unreasonable delay and Petitioners’ failure to comply with a direction of the Court.
On March 20, 2019, the Company was notified that the Court of Appeals granted a motion by the Petitioners to lift the Suspension of Proceedings and denied the motion to intervene filed by the two baranguays and set a preliminary case conference. In April 2019, the Company filed a motion for (i) reconsideration of the March 2019 order lifting the Suspension of Proceedings and dismissing the Company's request that the case be dismissed for delay; (ii) a ruling on its pending Urgent Motion for Ruling on Jurisdiction and Motion for a Ruling on Subject-Matter Jurisdiction; and (iii) an order suspending the proceedings pending determination of these motions. The preliminary case conference was subsequently cancelled by the Court of Appeals in April 2019.
On September 12, 2019, the Court of Appeals ruled that the issues raised by the Company should be decided concurrently with a hearing of the merits of the dispute. The Court set a preliminary case conference date of September 18, 2019.
On September 17, 2019, the Company filed a further motion to request that the Court of Appeals determine the Company’s Urgent Motion for Ruling on Jurisdiction and Motion for a Ruling on Subject-Matter Jurisdiction prior to any merits hearing. Consequently, the Court of Appeals adjourned the September 18, 2019 preliminary case conference to October 21, 2019, to further consider the Company’s motion requesting the determination of the Company’s jurisdiction motions prior to any merits hearing.
On October 18, 2019, the Court of Appeals issued a Notice of Resolution, which, among other things, rejected the Company’s constitutional objections and held that the Court of Appeals has jurisdiction based on a “tentative” determination that the Company was doing business in the Philippines made exclusively on the basis of unproved allegations made by the Petitioners in their petition, which “tentative” determination expressly does not foreclose the possibility of a contrary finding on the basis of evidence at a later date. On November 4, 2019 the Company filed a Motion for Reconsideration Ad Cautelam seeking a reversal of the Notice of Resolution dated October 18, 2019.
On October 21, 2019, the Court of Appeals rescheduled the preliminary case conference from October 21, 2019 to January 27, 2020 and, following a request from Petitioners’
counsel, it directed that a court-annexed mediation take place on October 29, 2019. An additional mediation session took place on November 21, 2019.
On November 11, 2019, the Company filed with the Supreme Court a Petition for Certiorari seeking to reverse, annul and set aside the Court of Appeals’ March 18, 2019 Resolution and September 12, 2019 Resolution. To date, the Petition for Certiorari has not yet been resolved.
On November 25, 2019, among other things, the Court of Appeals issued a Resolution dismissing the Company’s Motion for Reconsideration Ad Cautelam dated November 4, 2019.
On January 27, 2020, the Company filed a Petition for Certiorari with the Supreme Court seeking to reserve, annul and set aside, among other things, the rulings of the Court of Appeals in its November 25, 2019 Resolution regarding the Company’s constitutional challenges and jurisdictional challenges. A preliminary case conference was also held on January 27, 2020, at which the parties agreed to a tentative trial date of March 23, 2020.
No amounts have been recorded for any potential liability under this matter, as the Company cannot reasonably predict the outcome. The Company intends to continue to defend the action vigorously.
Malian Tax DisputeEach of Loulo and Gounkoto (which together form the Loulo-Gounkoto complex) and Morila have separate legally binding establishment conventions with the State of Mali, which guarantee fiscal stability, govern applicable taxes and allow for international arbitration in the event of disputes. Despite these establishment conventions, prior to the Merger, Randgold had received various tax claims from the State of Mali in respect of its Mali operations, which totaled $267.7 million at January 1, 2019. As at the end of the second quarter of 2019, the total claim for 2018 and prior year periods had risen to $275 million.
During 2016, Randgold received payment demands in respect of certain of these disputed amounts, and consequently, from 2016 up to December 2018, Randgold paid tax advances to the State of Mali to support the resolution of the tax disputes, which after offsetting other tax payments resulted in a receivable being recorded of $41.1 million. As part of the purchase price allocation for the Merger (see note 4), the fair value of this receivable was reduced to nil. In July 2019, a further advance of $43 million was paid to the State of Mali as part of a settlement proposal to resolve outstanding assessments with respect to 2016 and prior year periods. In addition, a further $17 million was accrued, bringing the total amount recorded for these events to $60 million at the end of the second quarter of 2019. This additional accrual amount was recorded as a further update to the purchase price allocation, and was paid in the fourth quarter of 2019.
The tax exposures to be resolved for 2014 through 2016 total $92 million, and remain under discussion with the State of Mali. The Company has recorded an estimated amount for the potential liability arising from these matters. In the Company’s view, it would be prejudicial to disclose the amount
BARRICK YEAR-END 2019 175 NOTES TO FINANCIAL STATEMENTS
of that estimate as the discussions with the State of Mali are ongoing.
Barrick has been actively engaged with the Malian authorities and is seeking a complete resolution of the various tax claims to avoid protracted arbitration. In January 2020, the Government of Mali signed a protocol, which set forth the terms of its working relationship with the Company, including an agreement on tax principles that effectively reflects the Company’s tax filings in 2017 and subsequent years. For fiscal years 2017, 2018 and 2019, the Company will cooperate with the State of Mali as those years are reviewed in accordance with the terms of the signed protocol. The Company continues to be actively engaged with the Malian authorities with respect to these matters.
Reko Diq ArbitrationBarrick currently indirectly holds 50% of the shares of Tethyan Copper Company Pty Limited (“TCC”), with Antofagasta plc (“Antofagasta”) indirectly holding the other 50%. On November 15, 2011, the Government of the Province of Balochistan notified Tethyan Copper Company Pakistan (Private) Limited (“TCCP”) (the local operating subsidiary of TCC) of the rejection of TCCP’s application for a mining lease for the Reko Diq project, to which TCCP was lawfully entitled subject only to "routine" government requirements. On November 28, 2011, TCC filed a request for international arbitration against the Government of Pakistan (“GOP”) with the International Centre for Settlement of Investment Disputes (“ICSID”) asserting breaches of the Bilateral Investment Treaty (“BIT”) between Australia (where TCC is incorporated) and Pakistan.
On March 20, 2017, the Tribunal issued its decision, rejecting the GOP’s position. In March 2019, ICSID closed the record in the arbitration.
In July 2019, ICSID awarded $5.84 billion in damages to TCC in relation to the arbitration claims and unlawful denial of a mining lease for the Reko Diq project. Damages include compensation of $4.087 billion in relation to the fair market value of the Reko Diq project at the time the mining lease was denied, and interest until the date of the award of $1.753 billion. Compound interest continues to apply at a rate of US Prime +1% per annum until the award is paid.
In November 2019, the GOP applied to annul TCC’s damages award, which resulted in an automatic stay on TCC from pursuing enforcement action. ICSID has constituted a committee to hear the annulment application, consisting of a president from South Korea and additional members from Mexico and Finland. The committee appointed by ICSID to hear the application for annulment will also determine whether the stay on enforcement proceedings should be extended or lifted while it considers the application for annulment. No decision on the GOP’s annulment application or the stay on enforcement proceedings has yet been made.
The Company cannot reasonably estimate the financial effect of the July 2019 settlement award. No amounts have been recognized at this time.
Acacia Mining plc – Concentrate Export Ban and Related Disputes
On March 3, 2017, the GoT announced a general ban on the export of metallic mineral concentrates (the "Ban") following a directive made by the President to promote the creation of a domestic smelting industry. Following the directive, Acacia ceased all exports of its gold/copper concentrate (“concentrate”) including containers previously approved for export prior to the Ban located at the port in Dar es Salaam.
During the second quarter of 2017, the GoT initiated investigations which resulted in allegations of historical undeclared revenue and unpaid taxes by Acacia and its predecessor companies. Acacia subsequently received adjusted assessments for the tax years 2000-2017 from the Tanzania Revenue Authority for a total amount of approximately $190 billion for alleged unpaid taxes, interest and penalties. In addition, following the end of the third quarter of 2017, Acacia was served with notices of conflicting adjusted corporate income tax and withholding tax assessments for tax years 2005 to 2011 with respect to Acacia’s former Tulawaka joint venture, and demands for payment, for a total amount of approximately $3 billion. Acacia disputed these assessments through arbitration and the Tanzanian tax appeals process, respectively.
In addition to the Ban, new and amended legislation was passed in Tanzania in early July 2017, including various amendments to the 2010 Mining Act and a new Finance Act. The amendments to the 2010 Mining Act increased the royalty rate applicable to metallic minerals such as gold, copper and silver to 6% (from 4%), and the new Finance Act imposes a 1% clearing fee on the value of all minerals exported from Tanzania from July 1, 2017. In January 2018, new Mining Regulations were announced by the GoT introducing, among other things, local content requirements, export regulations and mineral rights regulations, the scope and effect of which remain under review. Barrick continues to monitor the impact of all new legislation in light of Acacia's Mineral Development Agreements with the GoT.
On October 19, 2017, Barrick announced that it had agreed with the GoT on a proposed framework for a new partnership between Acacia and the GoT. Acacia did not participate directly in these discussions as the GoT had informed Barrick that it wished to continue dialogue solely with Barrick. Barrick and the GoT also agreed to form a working group that would focus on the resolution of outstanding tax claims against Acacia. Key terms of the proposed framework announced by Barrick and the GoT included (i) the creation of a new Tanzanian company to provide management services to Acacia’s Bulyanhulu, Buzwagi and North Mara mines and all future operations in the country with key officers located in Tanzania and Tanzanian representation on the board of directors; (ii) maximization of local employment of Tanzanians and procurement of goods and services within Tanzania; (iii) economic benefits from Bulyanhulu, Buzwagi and North Mara to be shared on a 50/50 basis, with the GoT’s share delivered in the form of royalties, taxes and a 16% free carry interest in Acacia’s Tanzanian operations; and (iv) in support of the working group’s ongoing efforts to resolve outstanding tax claims, Acacia would make a payment of $300 million to the GoT, staged over time, on terms to be settled by the working

BARRICK YEAR-END 2019 176 NOTES TO FINANCIAL STATEMENTS
group. Barrick and the GoT also reviewed the conditions for the lifting of the Ban.
On February 20, 2019, Barrick announced that it had arrived at a proposal with the GoT that set forth the commercial terms to resolve outstanding disputes concerning Acacia’s operations in Tanzania.
On May 19, 2019, the GoT Negotiating Team wrote to Acacia’s three Tanzanian operating companies (the “TMCs”) to indicate that the GoT had resolved not to proceed to execute final agreements for the resolution of Acacia’s disputes if Acacia was one of the counterparties to the agreements.
On July 12, 2019, Acacia’s North Mara mine received a letter from the Mining Commission of the Tanzanian Ministry of Minerals informing it that the Mining Commission is soon to conduct an inspection of North Mara's gold production (the "No Export Letter"). The No Export Letter stated that export permits for gold shipments from North Mara would be issued following completion of this inspection.
Following an investigation conducted by the Mining Commission on July 30 and 31, 2019, the North Mara mine received a letter from the Mining Commission (the “Inspection Findings Letter”) stating that it believes that certain provisions of the Mining Regulations, 2010 were violated and directing the North Mara mine to submit a feasibility study report and current mine plan for its approval by August 16, 2019. The Inspection Findings Letter also authorized the resumption of gold exports from North Mara subject to its adherence to the export procedure.
On July 19, 2019, the Acacia Transaction Committee Directors and Barrick published a firm offer announcement pursuant to Rule 2.7 of the City Code on Takeovers and Mergers (“Rule 2.7 Announcement”) announcing that they had reached agreement on the terms of a recommended final offer by Barrick for the ordinary share capital of Acacia that Barrick did not already own (see “Key Business Developments - Acacia Mining plc”), with the belief that the recommended final offer would enable Barrick to finalize the terms of a full, final and comprehensive settlement of all of Acacia’s existing disputes with the GoT. To facilitate this and in anticipation of the Rule 2.7 Announcement, on July 17, 2019, Acacia announced that Bulyanhulu Gold Mine Limited and Pangea Minerals Limited would immediately seek a stay of their international arbitration proceedings with the GoT.
On September 12, 2019, the High Court of Justice in England and Wales made an order sanctioning the scheme of arrangement under Part 26 of the Companies Act 2006 (the "Scheme"), and on September 17, 2019, Barrick completed the acquisition of all of the shares of Acacia that the Company did not already own pursuant to the Scheme. Acacia ceased trading on the London Stock Exchange and became a wholly-owned subsidiary of Barrick called Barrick TZ Limited.
On October 20, 2019, Barrick announced that it had reached an agreement with the GoT to settle all disputes between the GoT and the mining companies formerly operated by Acacia but now managed by Barrick. The final agreements were submitted to the Tanzanian Attorney General for review and legalization.
On January 24, 2020, Barrick announced that the Company had ratified the creation of Twiga Minerals Corporation(“Twiga”) at a signing ceremony with the President of Tanzania, formalizing the establishment of a joint venture between Barrick and the GoT and resolution of all outstanding disputes between Barrick and the GoT, including the lifting of the previous concentrate export ban, effective immediately. The GoT will receive a free carried shareholding of 16% in each of the former Acacia mines (Bulyanhulu, Buzwagi and North Mara), and will receive its half of the economic benefits from taxes, royalties, clearing fees and participation in all cash distributions made by the mines and Twiga, after the recoupment of capital investments. Twiga will provide management services to the mines.
The terms of the signed agreement are consistent with those previously announced, including the payment of $300 millionto settle all outstanding tax and other disputes (the “Settlement Payment”); the lifting of the concentrate export ban; the sharing of future economic benefits from the mines on a 50/50 basis; and a dispute resolution mechanism that provides for binding international arbitration. The 50/50 division of economic benefits will be maintained through an annual true-up mechanism, which will not account for the Settlement Payment.
The Settlement Payment will be paid in installments, with an initial payment of $100 million to the GoT following the resumption of mineral concentrate exports. Five subsequent annual payments of $40 million each will be made, starting on the first anniversary of the fulfillment of all conditions of the signed agreement, subject to certain cash flow conditions.
Barrick and the GoT continue to fulfill their respective obligations to satisfy all conditions of the signed agreement, primarily with respect to the execution and delivery of formal termination documents for the settlement of all outstanding disputes between the two parties.
See note 12 of these Financial Statements for information related to income tax expenses recorded with respect to these matters and note 21 of these Financial Statements for impairment losses arising from these matters.
Acacia Mining plc – Tanzanian Revenue Authority Assessments The Tanzanian Revenue Authority (“TRA”) issued a number of tax assessments to Acacia related to past taxation years from 2002 onwards. Acacia believed that the majority of these assessments were incorrect and filed objections and appeals accordingly in an attempt to resolve these matters by means of discussions with the TRA or through the Tanzanian appeals process. Overall, it was Acacia’s assessment that the relevant assessments and claims by the TRA were without merit.
The claims include an assessment issued to Acacia in the amount of $41.3 million for withholding tax on certain historic offshore dividend payments paid by Acacia to its shareholders from 2010 to 2013. Acacia appealed this assessment on the substantive grounds that, as an English incorporated company, it was not resident in Tanzania for taxation purposes. The appeal is currently pending at the Court of Appeal.

BARRICK YEAR-END 2019 177 NOTES TO FINANCIAL STATEMENTS
Further TRA assessments were issued to Acacia in January 2016 in the amount of $500.7 million, based on an allegation that Acacia was resident in Tanzania for corporate and dividend withholding tax purposes. The corporate tax assessments were levied on certain of Acacia’s net profits before tax. Acacia appealed these assessments at the TRA Board level. Acacia’s substantive grounds of appeal were based on the correct interpretation of Tanzanian permanent establishment principles and law, relevant to a non-resident English incorporated company.
In addition, the TRA issued adjusted tax assessments totaling approximately $190 billion for alleged unpaid taxes, interest and penalties, apparently issued in respect of alleged and disputed under-declared export revenues, and appearing to follow on from the announced findings of the First and Second Presidential Committees. For more information about these adjusted tax assessments, see “Acacia Mining plc - Concentrate Export Ban and Related Disputes” above.
On October 20, 2019, Barrick announced that it had reached an agreement with the GoT to settle all disputes between the GoT and the mining companies formerly operated by Acacia but now managed by Barrick. The final agreements were submitted to the Tanzanian Attorney General for review and legalization.
On January 24, 2020, Barrick announced that the Company had ratified the creation of Twiga Minerals Corporation (“Twiga”) at a signing ceremony with the President of Tanzania, formalizing the establishment of a joint venture between Barrick and the Government of Tanzania (“GoT”) and resolution of all outstanding disputes between Barrick and the GoT, including the lifting of the previous concentrate export ban, effective immediately. The GoT will receive a free carried shareholding of 16% in each of the former Acacia mines (Bulyanhulu, Buzwagi and North Mara), and will receive its half of the economic benefits from taxes, royalties, clearing fees and participation in all cash distributions made by the mines and Twiga, after the recoupment of capital investments. Twiga will provide management services to the mines.
The terms of the signed agreement are consistent with those previously announced, including the Settlement Payment; the lifting of the concentrate export ban; the sharing of future economic benefits from the mines on a 50/50 basis; and a dispute resolution mechanism that provides for binding international arbitration. The 50/50 division of economic benefits will be maintained through an annual true-up mechanism, which will not account for the Settlement Payment.
The Settlement Payment will be paid in installments, with an initial payment of $100 million to the GoT following the resumption of mineral concentrate exports. Five subsequent annual payments of $40 million each will be made, starting on the first anniversary of the fulfillment of all conditions of the signed agreement, subject to certain cash flow conditions.
Barrick and the GoT continue to fulfill their respective obligations to satisfy all conditions of the signed agreement, primarily with respect to the execution and delivery of formal termination documents for the settlement of all outstanding disputes between the two parties.
See note 12 of these Financial Statements for information related to income tax expenses recorded with respect to these matters.
North Mara Environmental IssuesDuring 2019, the GoT issued two environmental protection orders and directions to Acacia’s North Mara mine in relation to alleged breaches of environmental regulations relating to seepage from and the discharge of a hazardous substance from the North Mara mine Tailings Storage Facility (“TSF”). In March 2019, the GoT directed the North Mara Mine to resolve an incident that resulted in the spillage of water into the local environment. On July 16, 2019, the Tanzanian National Environment Management Council (“NEMC”) issued a Prohibition Notice (the “Prohibition Notice”) to North Mara Gold Mine Limited (the Tanzanian operating company of the North Mara mine), which ordered the North Mara mine to suspend operations at its TSF on Saturday July 20, 2019. NEMC cited the North Mara mine’s failure to contain and prevent seepage from the TSF as grounds for its issuance of the Prohibition Notice.
On September 17, 2019, following the submission of a detailed action plan to remediate issues related to the TSF and the implementation of remedial measures to contain the seepage from the TSF, the Prohibition Notice was lifted and North Mara was permitted to resume operations at the TSF.
Zaldívar Chilean Tax AssessmentOn August 28, 2019, Barrick's Chilean subsidiary that holds the Company's interest in the Zaldívar mine, Compañía Minera Zaldívar Limitada ("CMZ"), received notice of a tax assessment from the Chilean Internal Revenue Service ("Chilean IRS") amounting to approximately $1 billion in outstanding taxes, including interest and penalties (the "Zaldívar Tax Assessment"). The Zaldívar Tax Assessment primarily claims that CMZ improperly claimed a deduction relating to a loss on an intercompany transaction prior to recognizing and offsetting a capital gain on the sale of a 50%interest by CMZ in the Zaldívar mine to Antofagasta in 2015. CMZ filed an administrative appeal with the Chilean IRS on October 14, 2019. Following initial meetings with CMZ, the Chilean IRS agreed with CMZ’s position and reduced the Assessment to US$ 575 million including interest and penalties. CMZ will continue discussions with the Chilean IRS, prior to the authority's final decision.
The Company believes that the Zaldívar Tax Assessment is without merit and intends to vigorously defend its position. Noamounts have been recorded for any potential liability arising from the Zaldívar Tax Assessment as the Company cannot reasonably predict the outcome.