2019 nygb annual financial metrics - ny green bank
TRANSCRIPT

NY Green Bank
Metrics, Reporting & Evaluation
Annual Financial Metrics Report No. 5
(April 1, 2018 - March 31, 2019)
Case 13-M-0412
June 28, 2019

i
NYGB_Annual_Financial_Metrics_Report_2019_FINAL
Contents
1. Introduction ............................................................................................................. 1
2. Discussion of Annual Performance ...................................................................... 2
3. Annual Financial Metrics ....................................................................................... 5
3.1 General .......................................................................................................................................... 5
3.2 Financial Position .......................................................................................................................... 6
3.2.1 Audited Financials ................................................................................................................. 6
3.3 Investment Quality & Risk ............................................................................................................. 6
3.3.1 Portfolio Impairment .............................................................................................................. 6
3.4 Investment Portfolio Benefits ........................................................................................................ 6
3.4.1 Annual ROI ............................................................................................................................ 7
3.4.2 Cumulative ROI ..................................................................................................................... 8
3.4.3 Capital Redeployment Cycle Time ...................................................................................... 10
4. Glossary & Definitions ......................................................................................... 11
Tables Table 1: Fiscal Year 2018 – 19 Financial Summary ($ thousands) ............................................................. 5 Table 2: Annual Financial Metrics: FY 2018 – 19 vs. FY 2017 – 18 ............................................................ 6 Figures Figure 1: Yearly Revenues vs. Expenses Since Inception .......................................................................... 2 Figure 2: Cumulative Revenues vs. Cumulative Expenses Since Inception ............................................... 3 Figure 3: Annual ROI ................................................................................................................................... 7 Figure 4: Annual Gross ROI Since Inception ............................................................................................... 8 Figure 5: Cumulative ROI ............................................................................................................................. 9 Figure 6: Cumulative Gross ROI Since Inception ...................................................................................... 10 Schedules Schedule 1: NYGB Audited Financial Statements - March 31, 2019 ........................................................ 15

1
NYGB_Annual_Financial_Metrics_Report_2019_FINAL
1. Introduction This annual financial metrics report (“Report”) is filed by NY Green Bank (“NYGB”), a division of the New York State Energy and Research Development Authority (“NYSERDA”), with the New York State Public Service Commission (the “Commission”) pursuant to the Metrics, Reporting & Evaluation Plan (version 3.0) filed with the Commission on June 20, 2016 (the “Metrics Plan”).1 The purpose of this Report is to provide information that is available annually on specific aspects of NYGB’s financial performance in its most recent fiscal year (April 1 through March 31, “FY”). This report also incorporates NYGB’s audited annual financial statements for FY 2018 – 19 in Schedule 1, including management discussion and analysis and all notes to the financial statements. During the FY ended March 31, 2019, NYGB continued its focus on execution and asset management across all aspects of its clean energy and sustainable infrastructure investment business. NYGB received over $3.4 billion in investment proposals from Inception2 through March 31, 2019. Its Active Pipeline was $702.7 million as of March 31, 2019, and remains diversified across technology, location, and end-user segments. During FY 2018 – 19, NYGB closed 15 new transactions totaling $280.1 million, facilitating clean energy development in New York State with an aggregate estimated total project cost in the range of $1.7 billion to $2.0 billion. Through March 31, 2019, NYGB’s overall sustainable infrastructure investments since Inception totaled $737.6 million. At the same date, NYGB’s Current Portfolio was $471.3 million. NYGB continues to execute and plan in a manner aimed at building and maintaining a sizeable Investment Portfolio over the near and medium terms that meets NYGB’s mission and key investment criteria. To that end, NYGB focused its efforts in FY 2018 – 19 on investment origination, credit underwriting and execution, risk management practices and procedures, staff and critical infrastructure development, impact metrics estimation, reporting and evaluation and stakeholder engagement, while continuing to improve its operational frameworks. These efforts position NYGB to not only preserve its capital, but also deliver commercial returns that grow its capital base for reinvestment in the State. Simultaneously, NYGB activities continue to generate energy and environmental impact benefits that contribute to the primary Clean Energy Fund (“CEF”) objectives of GHG emissions reductions, customer bill savings, energy efficiency, clean energy generation and mobilization of private sector capital.3 In turn, the CEF objectives support the State’s aggressive clean energy targets, including under New York’s Green New Deal4 which mandates a significant increase in the State’s Clean Energy Standard (“CES”) with a goal of 70.0% energy generation from renewable sources by 2030 and carbon-free electricity by 2040.5 Further information on NYGB’s activities and performance over the past year are available in its Annual Review 2018 – 19 and Annual Business Plan 2019 – 20 (the “2019 Review and Plan”)6 and in other materials (including Quarterly Metrics Reports) – all available at www.greenbank.ny.gov/Resources/Public-Filings. Defined terms used, but not separately described, in the text of this document have the meanings respectively
given to them in the Metrics Plan or in Section 4.
1 Case 13-M-0412, “NY Green Bank – Metrics, Reporting & Evaluation Plan”, dated June 20, 2016, available at www.greenbank.ny.gov/-
/media/greenbanknew/files/Metrics-Reporting-Evaluation-30.pdf. 2 “Inception” means the inception of NYGB pursuant to, and as of the date of, the Initial Capitalization Order in December 2013. Case 13-
M-0412, “Order Establishing New York Green Bank and Providing Initial Capitalization”, issued and effective December 19, 2013 (the “Initial Capitalization Order”), available at http://documents.dps.ny.gov/public/Common/ViewDoc.aspx?DocRefId=%7BBD3AAFB0-FAA2-4DA6-B56B-0FF22EE34EDF%7D.
3 As set out in the CEF Order (Cases 14-M-0094 et al.) issued and effective on January 21, 2016, page 40, available at http://documents.dps.ny.gov/public/Common/ViewDoc.aspx?DocRefId=%7bB23BE6D8-412E-4C82-BC58-9888D496D216%7d.
4 Announced by Governor Andrew M. Cuomo in the 2019 State of the State. See www.governor.ny.gov/sites/governor.ny.gov/files/atoms/files/2019StateoftheStateBook.pdf.
5 New York’s Green New Deal includes certain critical components, including: (a) quadrupling New York’s offshore wind target to 9,000 MW by 2035 (up from 2,400 MW by 2030); (b) doubling distributed solar deployment to 6,000 MW by 2025 (up from 3,000 MW by 2023); (c) deploying 3,000 MW of energy storage by 2030 (up from 1,500 MW by 2025); (d) more than doubling new large-scale land-based wind and solar resources through the CES; (e) maximizing the contributions and potential of New York’s existing renewable resources; (f) expanding and enhancing the Solar For All Program to increase access to affordable and clean energy for low-income, environmental justice and other underserved communities; and (g) initiatives to achieve carbon neutral building stock Statewide, including through the energy efficiency target to reduce energy consumption by 185 trillion BTUs below forecasted energy use in 2025.
6 Case 13-M-0412, “NY Green Bank Annual Review 2018 – 19 and Annual Business Plan 2019 – 20,” filed June 19, 2019, available at www.greenbank.ny.gov/-/media/greenbanknew/files/nygb-2019-business-plan.pdf.
2
NYGB_Annual_Financial_Metrics_Report_2019_FINAL
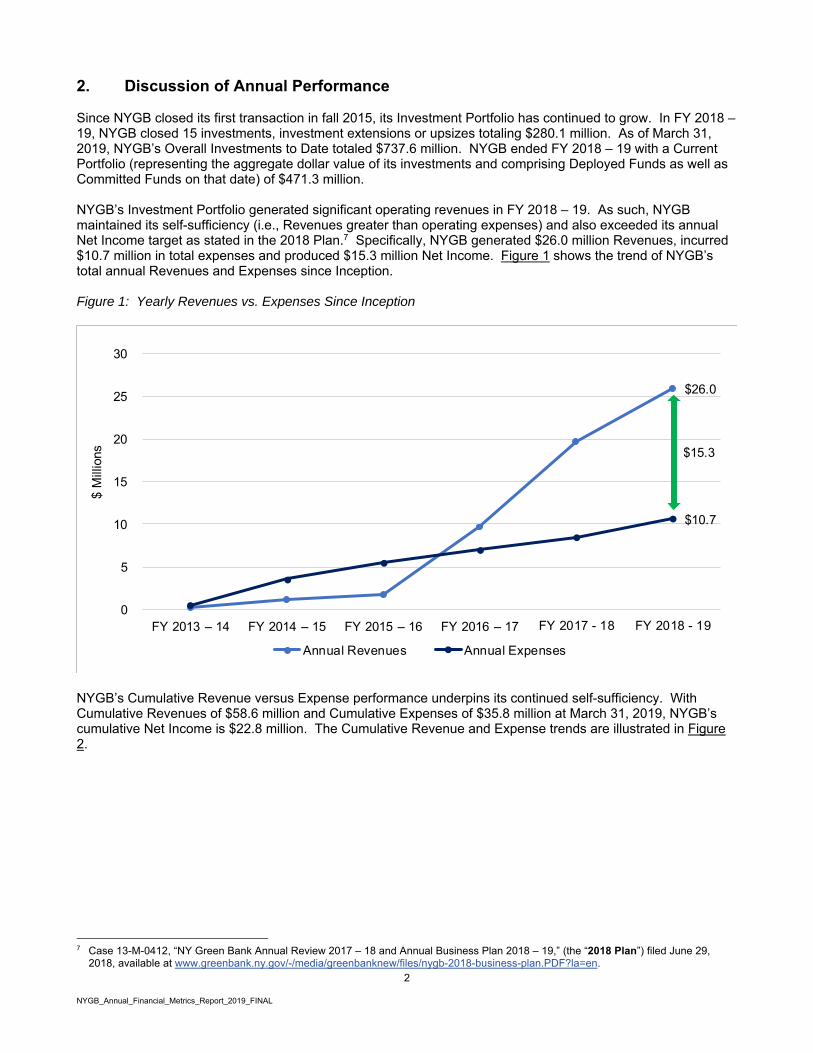
2. Discussion of Annual Performance Since NYGB closed its first transaction in fall 2015, its Investment Portfolio has continued to grow. In FY 2018 – 19, NYGB closed 15 investments, investment extensions or upsizes totaling $280.1 million. As of March 31, 2019, NYGB’s Overall Investments to Date totaled $737.6 million. NYGB ended FY 2018 – 19 with a Current Portfolio (representing the aggregate dollar value of its investments and comprising Deployed Funds as well as Committed Funds on that date) of $471.3 million. NYGB’s Investment Portfolio generated significant operating revenues in FY 2018 – 19. As such, NYGB maintained its self-sufficiency (i.e., Revenues greater than operating expenses) and also exceeded its annual Net Income target as stated in the 2018 Plan.7 Specifically, NYGB generated $26.0 million Revenues, incurred $10.7 million in total expenses and produced $15.3 million Net Income. Figure 1 shows the trend of NYGB’s total annual Revenues and Expenses since Inception. Figure 1: Yearly Revenues vs. Expenses Since Inception
NYGB’s Cumulative Revenue versus Expense performance underpins its continued self-sufficiency. With Cumulative Revenues of $58.6 million and Cumulative Expenses of $35.8 million at March 31, 2019, NYGB’s cumulative Net Income is $22.8 million. The Cumulative Revenue and Expense trends are illustrated in Figure 2.
7 Case 13-M-0412, “NY Green Bank Annual Review 2017 – 18 and Annual Business Plan 2018 – 19,” (the “2018 Plan”) filed June 29,
2018, available at www.greenbank.ny.gov/-/media/greenbanknew/files/nygb-2018-business-plan.PDF?la=en.
$26.0
$10.7
0
5
10
15
20
25
30
FY 2013 – 14 FY 2014 – 15 FY 2015 – 16 FY 2016 – 17 FY 2017 - 18 FY 2018 - 19
$ M
illio
ns
Annual Revenues Annual Expenses
$15.3

3
NYGB_Annual_Financial_Metrics_Report_2019_FINAL
Figure 2: Cumulative Revenues vs. Cumulative Expenses Since Inception
A summary of NYGB’s FY 2018 – 19 financial performance is found in Table 1, together with results from the prior year and variance percentages. Total operating revenues increased $0.5 million (2.6%) from the prior year. A 58.9% increase in fees is primarily attributable to NYGB closing a larger number of transactions during the fiscal year. A decrease in loans and financing receivables interest of 8.7% is due to an increase in loan repayments, which are central to NYGB’s capital preservation and recycling. A provision for losses on loans and financing receivables in the amount of $387,898 has been recorded for the year ending March 31, 2019. As noted in Quarterly Metrics Reports, Impaired amounts (i.e., the amount of any provision for losses) are offset against revenues, such that cumulative revenues in the quarterly reports are stated net of Portfolio Impairments. Total operating expenses increased $0.6 million (6.9%), most significantly driven by increases in Salaries and Benefits; these and other costs are discussed below. Salaries and Benefits, which include NYGB staff salary expenses ($3.0 million), NYSERDA allocated administrative salary expenses ($1.6 million), and allocated fringe benefit expenses ($1.8 million), increased $0.7 million (12.3%) from the prior year. This occurred due to an increase in NYGB’s staffing consistent with plan as well as an increase in the overall pool of allocable NYSERDA expenses of which NYGB pays its pro rata share (which is calculated based on NYGB’s direct staffing costs as a proportion of NYSERDA’s program staffing costs). Investment related expenses, which include legal and other costs incurred for various Portfolio Investments, were 4.8% more than the previous year, which generally reflects transaction volumes and counterparty reimbursement rates. Program Operating Costs decreased $0.4 million (33.6%) due to a decrease in professional service expenses (e.g., consultants and temporary employees). General and Administrative Expenses, which include allocable costs such as rent, utilities and insurance increased $0.2 million (19.6%) due to an increase in the allocable cost as compared to the prior year, generally as a result of the increase in salary costs. Depreciation and NYS Assessments reflect NYGB’s allocable share of NYSERDA’s depreciation and NYSERDA’s cost recovery fee (“CRF”) assessment from the State of New York, respectively. Both of these dollar amounts have increased from the prior year.
$58.6
$35.8
0
10
20
30
40
50
60
70
FY 2013 – 14 FY 2014 – 15 FY 2015 – 16 FY 2016 – 17 FY 2017 - 18 FY 2018 - 19
$ M
illio
ns
Cumulative Revenues Cumulative Expenses
$22.8

4
NYGB_Annual_Financial_Metrics_Report_2019_FINAL
Investment income increased $5.9 million (433.5%), directly reflecting NYGB’s higher average investment, resulting from contributed capital received but not immediately deployed, as well as operating income generated and principal repayments received less capital redemptions.8 Non-operating expenses increased $1.6 million primarily due to capital advisory costs of $1.4 million. In October 2017, Governor Cuomo announced that NYGB would explore options to raise at least an additional $1.0 billion in private sector funds to invest at a portfolio level (the “Capital Initiative”) and would take steps towards exploring a national expansion. In January 2019, Governor Cuomo released the 2019 State of the State book9 and called for the development of terms for a public-private partnership to effectuate NYGB’s third-party capital raise and expansion across North America. NYGB engaged a strategic advisor to assist in the exploration of the Capital Initiative. Separately, program evaluation costs increased $0.2 million; these expenses are attributable to periodic independent assessments of NYGB’s non-financial impact in the marketplace (e.g., energy, environmental and market transformation).
8 Investment Income, or Non-Operating Income, is derived from interest on capital held in low-risk liquid investments. 9 See: www.governor.ny.gov/sites/governor.ny.gov/files/atoms/files/2019StateoftheStateBook.pdf.

5
NYGB_Annual_Financial_Metrics_Report_2019_FINAL
Table 1: Fiscal Year 2018 – 19 Financial Summary ($ thousands)
March 31, 2019 March 31, 2018 % Change
2018 - 2019
Operating revenues:
Fees $3,947 $2,484 58.9% Loans and financing receivables interest 15,253 16,703 (8.7)% Provisions for losses on loans and financing receivables
(388) (844) (54.0)%
Total operating revenues 18,812 18,343 2.6% Operating expenses:
Salaries and benefits 6,421 5,716 12.3% Investment related expenses 456 435 4.8% Other operating costs 765 1,152 (33.6)% General and administrative expenses 1,100 920 19.6% Depreciation 184 154 19.5%
NYS assessments 125 86 45.3% Total operating expenses 9,051 8,463 6.9% Operating income 9,761 9,880 (1.2)%
Non-operating revenues:
Capital contributions10 119,882 9,529 1,158.1% Investment income 7,223 1,354 433.5% Total non-operating revenues 127,105 10,883 1,067.9% Non-operating expenses:
Capital expansion 1,425 - 100.0% Program evaluation 211 - 100.0% Total non-operating expenses 1,636 - 100.0%Income before transfers 135,230 20,763 551.3%Transfers – capital contributions (redemptions) (52,926) 100,152 (152.8)%Change in net position 82,304 120,915 (31.9)%Net position, beginning of year 486,151 365,236 n/aNet position, end of year $568,455 $486,151 16.9% Net Income (Loss) $15,348 11,234 36.6%
Source: NYGB Financial Statements; NYGB Analysis 3. Annual Financial Metrics 3.1 General Required metrics for FY 2018 – 19 and FY 2017 – 18 are set out below in Table 2. The year-on-year changes in NYGB’s annual Return on Investment (“ROI”) contained in Table 2 – on both a gross and net basis – are graphically represented in Figure 3.
10 As part of U.S. generally accepted accounting standards, the Governmental Accounting Standards Board requires capital contributions
made to NYGB from NYSERDA’s available cash and investment balances to be treated as transfers, while those derived directly from the Bill-As-You-Go approach be accounted for as non-operating revenues to NYGB. As a result, additions to NYGB’s capital during the fiscal year equal the sum of “Capital contributions” under Non-operating revenues and “Transfers – capital contributions (redemptions).”

6
NYGB_Annual_Financial_Metrics_Report_2019_FINAL
Table 2: Annual Financial Metrics: FY 2018 – 19 vs. FY 2017 – 18
Annual Metric FY 2018 – 19 FY 2017 – 18Financial Position Audited Financials Included in Schedule 1 of this
Report
See “Audited Financial Statements” available at www.greenbank.ny.gov/Resources/Public-Filings
Investment Quality & Risk Portfolio Impairment 0.1% 0.2%Investment Portfolio Benefits Return on Investment (%) Annual ROI
Gross 4.81% 4.57% Net 2.83% 2.61%
Cumulative ROI Gross 17.40% 11.27% Net 6.76% 2.57%
Capital Redeployment Cycle Time 4.09 years 3.45 years 3.2 Financial Position 3.2.1 Audited Financials NYGB’s Audited Financials are included in Schedule 1, comprising the report of KPMG LLP as independent auditor, management’s discussion and analysis and financial statements (i.e., Statement of Net Position – Proprietary Funds; Statement of Revenues, Expenses and Changes in Fund Net Position – Proprietary Funds; and Statement of Cash Flows – Proprietary Funds), together with all notes to the financial statements. 3.3 Investment Quality & Risk Details of NYGB’s Risk Management and Oversight can be found in Schedule 2 to the 2019 Review and Plan.11 3.3.1 Portfolio Impairment As of March 31, 2019, $387,898 (0.1%) of the total reported value of loans and financing receivables on the Statement of Net Position was recorded as Impaired, which represents a Portfolio Impairment of 0.1% of the Current Portfolio ($471.3 million) consistent with the definition of Portfolio Impairment in the Metrics Plan for the purposes of this Report. Current Portfolio is a larger amount than loans and financing receivables as it includes both Deployed Funds and Committed Funds, whereas loans and financing receivables reflect the outstanding balance of Deployed Funds. 3.4 Investment Portfolio Benefits ROI is a common financial performance metric used by investment and portfolio managers to assess the efficiency of an investment and compare investments. Traditionally, ROI measures the return on an investment, relative to the investment’s cost. The Metrics Plan defines ROI to measure the return on all capital provided to NYGB from New York ratepayers, not a return on just the capital invested by NYGB. ROI, as discussed in this Report, is similar to a traditional return on equity measure. The Gross ROI and Net ROI calculations (including of ROI Capital) used in this Report are defined in Section 4. At the beginning of FY 2018 – 19, NYGB’s ROI Capital was $478.2 million. Through the BAYG process,
11 2019 Review and Plan, Schedule 2, Page 67 available at www.greenbank.ny.gov/-/media/greenbanknew/files/nygb-2019-business-
plan.pdf.

7
NYGB_Annual_Financial_Metrics_Report_2019_FINAL
implemented during FY 2017 – 18 pursuant to the Order of the Commission establishing the CEF12, NYGB continued to receive capital contributions as required to maintain sufficient liquidity. NYGB received additional ratepayer capital during FY 2018 – 19 totaling $119.9 million. NYGB also fulfilled a $52.9 million capital redemption of initial capitalization funded from Regional Greenhouse Gas Initiative (“RGGI”) revenues. These funds were repurposed by NYSERDA to support NYSERDA’s statewide energy storage initiative. NYGB’s total ROI Capital at the end of FY 2018 – 19 was $545.2 million. NYGB’s ROI for FY 2018 – 19 is calculated as a time-weighted average of ROI Capital reflecting the timing of capital contributions and redemption during the year (for annual calculations) or since Inception (for cumulative calculations). 3.4.1 Annual ROI The year-on-year changes in NYGB’s annual ROI contained in Table 2 – on both a gross and net basis – are graphically represented in Figure 3. This figure shows that NYGB’s annual financial performance has consistently improved. The key difference in the components of the calculation between gross and net measures (for both annual and cumulative periods) is that net measures (i.e., Annual Net ROI and Cumulative Net ROI) include Expenses as an offset to Revenues, whereas Gross ROI measures do not. Figure 3: Annual ROI
Annual Gross ROI Annual Gross ROI, illustrated in Figure 4 below, increased from 4.57% to 4.81% in FY 2018 – 19, primarily due to a $6.3 million increase in Revenues from $19.7 million in FY 2017 – 18 to $26.0 million in FY 2018 – 19. This growth in Annual Gross ROI represents a 5.3% increase year-on-year since FY 2017 – 18.
12 CEF Order, page 108.
0.83%
(1.71%)
3.14%
0.86%
4.57%
2.61%
4.81%
2.83%
(3.00%)
(2.00%)
(1.00%)
0.00%
1.00%
2.00%
3.00%
4.00%
5.00%
6.00%Annual Gross ROI Annual Net ROI
FY 2015 – 16 FY 2016 – 17 FY 2017 - 18 FY 2018 - 19

8
NYGB_Annual_Financial_Metrics_Report_2019_FINAL
Figure 4: Annual Gross ROI Since Inception
Annual Net ROI NYGB Expenses rose $2.2 million from $8.5 million in FY 2017 – 18 to $10.7 million in FY 2018 – 19. This increase is driven by increases in Salaries and Benefits ($0.6 million) and non-operating expenses ($1.6 million) and is discussed in Section 2. Annual Net ROI grew from 2.61% in FY 2017 – 18 to 2.83% in FY 2018 – 19, reflecting that the year-on-year revenue growth of 32.0% lessened the impact of a 26.4% increase of expenses on this metric. This growth in Annual Net ROI represents an 8.4% increase year-on-year since FY 2017 – 18. 3.4.2 Cumulative ROI The year-on-year growth in Cumulative ROI – that is, from Inception, is illustrated in Figure 5. NYGB’s Cumulative ROI measures arguably understate NYGB returns, as they include a $21.5 million expense carve-out which was reflected by the Commission in the Initial Capitalization Order.13 Part of NYGB’s establishment involved the authorization of $17.5 million of the initial capitalization of $218.5 million for start-up and administration expenses and $4.0 million for program evaluation activities.14 At March 31, 2019, NYGB’s Cumulative (direct and indirect) Operating Expenses were $35.8 million and for the same period, NYGB’s Cumulative (operating and non-operating) Revenues totaled $58.6 million. Since the $17.5 million in administrative expenses has now been expended, NYGB’s ongoing Expenses are being met by Revenues, with excess revenues being applied to NYGB’s Investment Portfolio activities. At March 31, 2019, such excess revenues totaled $40.3 million (i.e., calculated as the sum of $58.6 million and $17.5 million, less cumulative expenses of $35.8 million).
13 Initial Capitalization Order, page 23. 14 These amounts include administrative and evaluation expenses as described in the Initial Capitalization Order and an allocated portion of
RGGI funds that are described in the Commission Order Approving Additional Capitalization with Modification for NY Green Bank in July 2015. Both filings can be found at www.greenbank.ny.gov/Resources/Public-Filings.
0.10%
0.54%0.83%
3.14%
4.57% 4.81%
0.00%
1.00%
2.00%
3.00%
4.00%
5.00%
6.00%
FY 2013 - 14 FY 2014 - 15 FY 2015 – 16 FY 2016 – 17 FY 2017 - 18 FY 2018 - 19

9
NYGB_Annual_Financial_Metrics_Report_2019_FINAL
Figure 5: Cumulative ROI
Cumulative Gross ROI Cumulative Gross ROI increased from 11.27% in FY 2017 – 18 to 17.40% in FY 2018 – 19, due principally to an increase in Cumulative Revenues from $32.6 million as of March 31, 2018 to $58.6 million as of March 31, 2019. Cumulative Gross ROI since Inception is shown in Figure 6. This growth in Cumulative Gross ROI represents a 54.4% increase year-on-year since FY 2017 – 18.
1.47%
(2.95%)
5.24%
(1.54%)
11.27%
2.57%
17.40%
6.76%
(5.00%)
0.00%
5.00%
10.00%
15.00%
20.00%Cumulative Gross ROI Cumulative Net ROI
FY 2015 – 16 FY 2016 – 17 FY 2017 - 18 FY 2018 - 19

10
NYGB_Annual_Financial_Metrics_Report_2019_FINAL
Figure 6: Cumulative Gross ROI Since Inception
Cumulative Net ROI Cumulative Net ROI improved from 2.57% to 6.76%, as Cumulative Revenue growth (79.8%) exceeded the increase in Cumulative Expenses (42.6%). Cumulative Expenses rose $10.7 million from $25.1 million as of March 31, 2018 to $35.8 million as of March 31, 2019. This growth in Cumulative Net ROI reflects cumulative Net Income of $22.8 million and represents a 163.0% increase year-on-year since FY 2017 – 18. 3.4.3 Capital Redeployment Cycle Time Capital Redeployment Cycle Time (“CRCT”) is broadly a measure of how long it will take for a dollar of NYGB funding to effectively be returned from one investment and available to reinvest into a new one. CRCT will vary by the expected weighted average term remaining of each investment in the Investment Portfolio as calculated at a point-in-time. The CRCT of NYGB’s Current Portfolio, as of March 31, 2019, was 4.09 years.15 This reflects continuing progress towards an expected mobilization ratio of Total Project Costs to NYGB funds of 8:1, manifesting in $8.0 billion of clean energy and sustainable infrastructure projects mobilized in NYS by NYGB activity by the end of the CEF term in December 2025.
15 Assets that have been Impaired are excluded from this calculation. Given that principal is not currently being repaid, it cannot be made
available to a new investment. NYGB will continue to pursue all legal and contractual avenues to collect deployed funds for assets recorded as Impaired.
0.10%0.64%
1.47%
5.24%
11.27%
17.40%
0.00%
2.00%
4.00%
6.00%
8.00%
10.00%
12.00%
14.00%
16.00%
18.00%
20.00%
FY 2013 - 14 FY 2014 - 15 FY 2015 – 16 FY 2016 – 17 FY 2017 - 18 FY 2018 - 19

11
NYGB_Annual_Financial_Metrics_Report_2019_FINAL
4. Glossary & Definitions “2018 Plan” means NYGB’s 2018 Business Plan. “2019 Review and Plan” has the meaning given to that term in Section 1. “Active Pipeline” means, at any time and for any period, the sum (expressed in dollars) of the proposed NYGB investment amount in all NYGB active transactions in the Pipeline where, in relation to each transaction: (a) There is agreement in principle between the parties; (b) There is momentum in moving the transaction forward; (c) Conditions to investment are expected to be met; and (d) NYGB is dynamically proceeding towards and through “greenlight” recommendation, IRC approval and
transaction execution. Unlike other metrics that are cumulative measures since NYGB Inception, “Active Pipeline” is a point-in-time measure. As momentum behind individual transactions fluctuates while advancing towards execution due to various factors, including many not under NYGB’s control, transactions may move in and out of the Active Pipeline at any given time. “Allocated Expenses” means the aggregate of all costs allocated quarterly to NYGB by NYSERDA, generally based on the proportion which NYGB’s direct salary costs bear to the total salary costs of all NYSERDA program staff, expressed in dollars. Allocated Expenses fall into the following categories: (a) Indirect salary allocations, compensating NYSERDA for NYGB’s pro rata portion of all NYSERDA full-time
non-program staff (e.g., executive, operations, regulatory, energy analytics, IT, legal, finance, marketing and communications, etc.);
(b) Employee benefits allocation, a fringe benefits allocation including healthcare, pensions, etc. in relation to
NYSERDA’s indirect labor described in the preceding Clause (a); (c) Indirect cost allocation, compensating NYSERDA for NYGB’s pro rata portion of all non-program
consultants, facilities, office equipment, software and IT upgrades, and similar items that are expensed; (d) Depreciation allocation, compensating NYSERDA for depreciation on all its capital assets (e.g., owned real
estate) and other capitalized items; and (e) New York State Cost Recovery Fee16, a charge levied by the State of New York on all NYGB expenses
(including Allocated Expenses). “Audited Financials” means annual audited financial statements prepared in accordance with applicable accounting standards by a reputable, experienced and independent accounting firm, in consultation with NYGB and NYSERDA staff. “Available Capital” means, at any time or for any period as the context may require, the aggregate amount of capital (expressed in dollars) that is both allocated to NYGB and fully available to it for investment at such time or during such period (i.e., not subject to the occurrence of any funding triggers, milestones or other contingencies). “Available Capital” includes Cumulative Revenues and any Capital Gains, and is net of
16 The New York State Cost Recovery Fee is imposed on public authorities and public benefit corporations pursuant to Section 2975 of the
Public Authorities Law. The fee is intended to reimburse the State for the cost attributable to provision of government services to authorities and public benefit corporations. The amount of the fee imposed on NYSERDA is periodically revised by the State. NYSERDA allocates the cost of the fee to each program it administers as a pass-through overhead cost. Currently, the fee is allocated among the programs in proportion to each program’s expenses (including allocations).

12
NYGB_Annual_Financial_Metrics_Report_2019_FINAL
Cumulative Operating Expenses, any Capital Losses, and Deployed Funds, all at the relevant time. “BAYG” refers to the “Bill-As-You-Go” approach for revenue collection under the CEF, effective January 1, 2016, and established pursuant to the CEF Order. Under this approach, CEF ratepayer collections and the previously approved collections for New York Energy $mart, Energy Efficiency Portfolio Standard, Technology and Market Development, and Renewable Portfolio Standard programs will be held by the electric and gas utilities and used to reimburse NYSERDA for actual CEF program expenses through a monthly reimbursement process, provided that the reimbursement allows NYSERDA to maintain a sufficient cash balance based on projected expenses for the subsequent two-month period, subject to the collection amounts approved in the CEF Order. NYGB receives incremental capital contributions through NYSERDA to meet ongoing liquidity needs. “Capital Gains” means, in any year, the aggregate of all increases in Available Capital that are derived from realized gains on NYGB investments that occur in that year, expressed in dollars. “Capital Initiative” has the meaning given to that term in Section 2. “Capital Losses” means, in any year, the aggregate amount of funding that has been Deployed by NYGB and become due and payable but that has not been repaid to, or recovered by, NYGB pursuant to the terms of the relevant transaction documents, expressed in dollars, and in respect of which NYGB has undertaken commercially reasonable legal remedies and other means of recovery. “Capital Redeployment Cycle Time” means, for any period, the average length of time that it is expected to take for a dollar of Committed Funds or Deployed Funds to be made available to, and repaid17 from, one NYGB investment and further Committed or Deployed to a subsequent NYGB investment, measured across the Current Portfolio in that period. “Capital Redeployment Cycle Time” is a point-in-time measure calculated based on the weighted average of the expected durations of each investment in the Current Portfolio at the end of the relevant period. “CEF” has the meaning given to that term in Section 1. “CES” has the meaning given to that term in Section 1. “Commission” has the meaning given to that term in Section 1. “Committed Funds” means, in any period, the aggregate funds to be provided by NYGB pursuant to executed investment and financing agreements which remain in force during that period, without such funds having been Deployed, expressed in dollars. “Committed” has a corresponding meaning.18
“CRF” has the meaning given to that term in Section 2. “CRCT” has the meaning given to that term in Section 3.4.3. “Cumulative Operating Expenses” means, in any period, the aggregate of all Expenses since Inception. “Cumulative Revenues” means, in any period, the aggregate of all Revenues since Inception. “Current Portfolio” means, at any time, the sum of Committed Funds and Deployed Funds and represents the dollar value of the Investment Portfolio.19
17 Or in the case of any contingent obligations or other unfunded commitments of NYGB, the termination of any commitment in accordance
with its terms. 18 Many NYGB investments involve product types where funds are Committed to support NYGB’s contingent obligations to clean energy
projects and which, by their nature, are not intended to be drawn upon other than in specifically identified circumstances. Thus, not every dollar of Committed Funds will be Deployed.
19 The dollar value of the Current Portfolio fluctuates over time, including to reflect any increases or decreases in Committed Funds and/or Deployed Funds. Committed Funds increase when new transactions are executed with commitments that have not yet been funded, and/or in connection with existing transactions, where repaid amounts may be available to be redrawn pursuant to the terms of investment agreements. Deployed Funds increase where the total dollars funded into investments exceed amounts repaid in the same period. Decreases in Committed Funds occur, for example, in connection with the release of undrawn funds at the end of an availability

13
NYGB_Annual_Financial_Metrics_Report_2019_FINAL
“Deployed Funds” means, in any period, the aggregate funds that have been advanced by NYGB pursuant to the terms of executed investment and financing agreements which remain in force during that period, expressed in dollars. “Deployed” has a corresponding meaning.20 “Direct Operating Expenses” means, during any period, the direct costs incurred by NYGB in day-to-day operations, including all business development, transaction, and general and administrative expenses, expressed in dollars. “Expenses” means, in any period, the aggregate of all Direct Operating Expenses and all Allocated Expenses. “FY” has the meaning given to that term in Section 1. “Gross ROI” refers to NYGB’s overall return on investment and for any period is calculated as follows: Revenue + Capital Gains – Capital Losses
ROI Capital (weighted average) “Impaired” refers to any NYGB asset where: (a) That asset has become non-performing, such that NYGB is no longer receiving all principal, interest, fees
and other revenue due in connection with that asset in accordance with the terms of the applicable transaction documentation; and
(b) NYGB reasonably expects to incur a Capital Loss on recovery of the amount of Deployed Funds
representing that investment asset and has reserved in its accounts accordingly. “Inception” means the inception of NYGB pursuant to, and as of the date of, the Initial Capitalization Order. “Initial Capitalization Order” has the meaning given to that term in footnote 2. “Investment Portfolio” means, at any time, collectively, the investment transactions that NYGB has executed with its counterparties that have not yet matured or otherwise expired in accordance with their respective terms. “Metrics Plan” has the meaning given to that term in Section 1. “Net Income” means, in any period, the excess of Revenues over Expenses. “Net ROI” refers to NYGB’s return on investment net of Direct Operating Expenses and Allocated Expenses and for any period is calculated as follows: Revenue + (Capital Gains – Capital Losses) – (Direct Operating Expenses + Allocated Expenses)
ROI Capital (weighted average) “NYGB” has the meaning given to that term in Section 1. “NYSERDA” has the meaning given to that term in Section 1. “Overall Investments to Date” means, at any time, the aggregate of all Committed Funds since Inception (but excluding approved investments that have not been executed at the relevant time), expressed in dollars.
period or otherwise consistent with the terms of an investment, while decreases in Deployed Funds occur primarily when NYGB investments are repaid from time to time, allowing those monies to be recycled into new clean energy investments in the State, generating further benefits for ratepayers.
20 Deployed Funds reflect only funds actually advanced. Many transactions involve provision of credit enhancements by NYGB that, by their nature, are contingent obligations not generally intended to be fully drawn against or funded. In addition, many NYGB investments are “delayed draw” in that funds are not Deployed until project sponsors meet certain development milestones over a time period necessary to originate, develop and construct a large number of smaller, distributed, clean energy projects.
14
NYGB_Annual_Financial_Metrics_Report_2019_FINAL
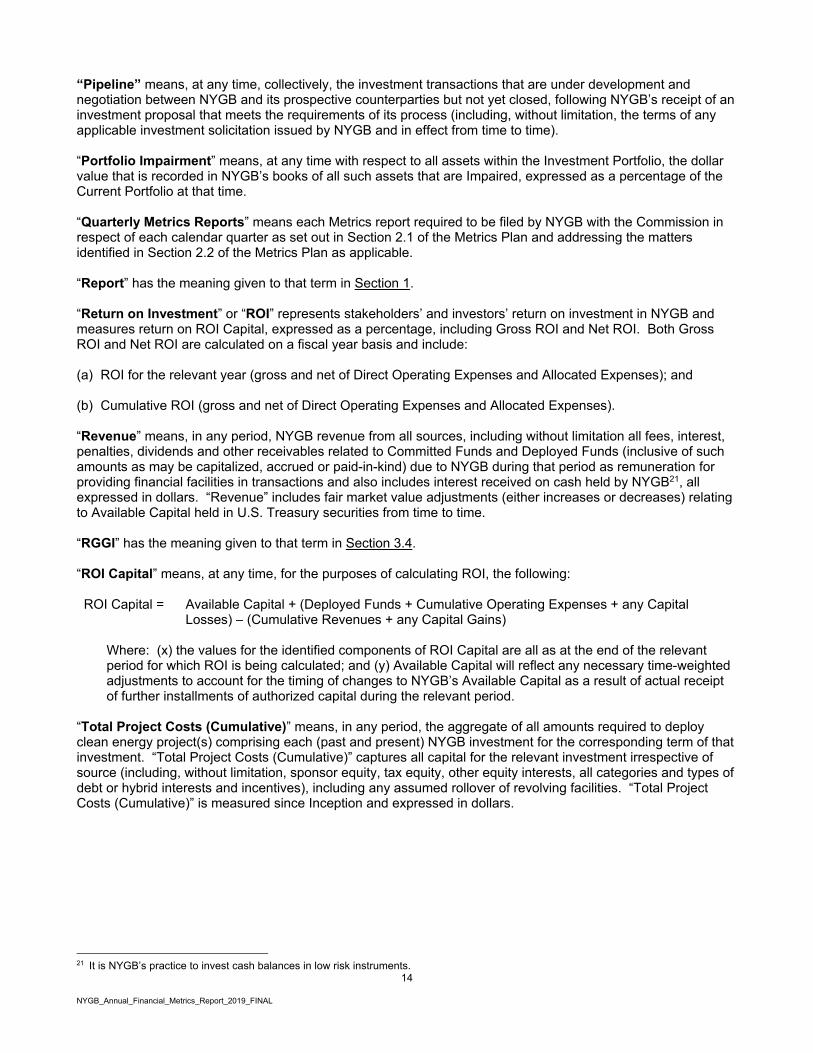
“Pipeline” means, at any time, collectively, the investment transactions that are under development and negotiation between NYGB and its prospective counterparties but not yet closed, following NYGB’s receipt of an investment proposal that meets the requirements of its process (including, without limitation, the terms of any applicable investment solicitation issued by NYGB and in effect from time to time). “Portfolio Impairment” means, at any time with respect to all assets within the Investment Portfolio, the dollar value that is recorded in NYGB’s books of all such assets that are Impaired, expressed as a percentage of the Current Portfolio at that time. “Quarterly Metrics Reports” means each Metrics report required to be filed by NYGB with the Commission in respect of each calendar quarter as set out in Section 2.1 of the Metrics Plan and addressing the matters identified in Section 2.2 of the Metrics Plan as applicable. “Report” has the meaning given to that term in Section 1. “Return on Investment” or “ROI” represents stakeholders’ and investors’ return on investment in NYGB and measures return on ROI Capital, expressed as a percentage, including Gross ROI and Net ROI. Both Gross ROI and Net ROI are calculated on a fiscal year basis and include: (a) ROI for the relevant year (gross and net of Direct Operating Expenses and Allocated Expenses); and (b) Cumulative ROI (gross and net of Direct Operating Expenses and Allocated Expenses). “Revenue” means, in any period, NYGB revenue from all sources, including without limitation all fees, interest, penalties, dividends and other receivables related to Committed Funds and Deployed Funds (inclusive of such amounts as may be capitalized, accrued or paid-in-kind) due to NYGB during that period as remuneration for providing financial facilities in transactions and also includes interest received on cash held by NYGB21, all expressed in dollars. “Revenue” includes fair market value adjustments (either increases or decreases) relating to Available Capital held in U.S. Treasury securities from time to time. “RGGI” has the meaning given to that term in Section 3.4. “ROI Capital” means, at any time, for the purposes of calculating ROI, the following: ROI Capital = Available Capital + (Deployed Funds + Cumulative Operating Expenses + any Capital
Losses) – (Cumulative Revenues + any Capital Gains)
Where: (x) the values for the identified components of ROI Capital are all as at the end of the relevant period for which ROI is being calculated; and (y) Available Capital will reflect any necessary time-weighted adjustments to account for the timing of changes to NYGB’s Available Capital as a result of actual receipt of further installments of authorized capital during the relevant period.
“Total Project Costs (Cumulative)” means, in any period, the aggregate of all amounts required to deploy clean energy project(s) comprising each (past and present) NYGB investment for the corresponding term of that investment. “Total Project Costs (Cumulative)” captures all capital for the relevant investment irrespective of source (including, without limitation, sponsor equity, tax equity, other equity interests, all categories and types of debt or hybrid interests and incentives), including any assumed rollover of revolving facilities. “Total Project Costs (Cumulative)” is measured since Inception and expressed in dollars.
21 It is NYGB’s practice to invest cash balances in low risk instruments.

15
NYGB_Annual_Financial_Metrics_Report_2019_FINAL
SCHEDULE 1
NYGB Audited Financial Statements – March 31, 2019
[See Attached]

NY GREEN BANK (A Division of the New York State Energy Research and Development Authority)
FINANCIAL STATEMENTS
March 31, 2019
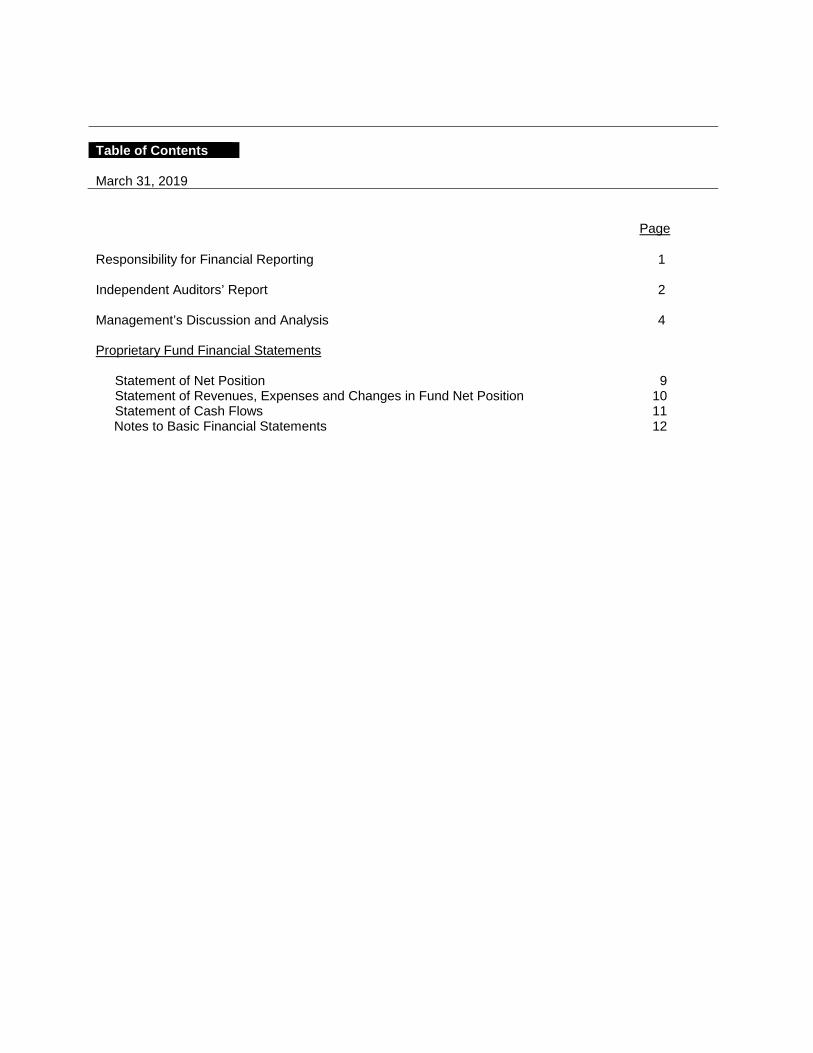
Table of Contents March 31, 2019 Page Responsibility for Financial Reporting 1 Independent Auditors’ Report 2 Management’s Discussion and Analysis 4 Proprietary Fund Financial Statements
Statement of Net Position 9 Statement of Revenues, Expenses and Changes in Fund Net Position 10 Statement of Cash Flows 11
Notes to Basic Financial Statements 12

1
RESPONSIBILITY FOR FINANCIAL REPORTING Management is responsible for the preparation, integrity and objectivity of the financial statements of NY Green Bank, a division of the New York State Energy Research and Development Authority (the Authority), as well as all other information contained in the Authority’s Annual Report. The financial statements of NY Green Bank for the fiscal year ended March 31, 2019 were prepared in conformity with U.S. generally accepted accounting principles (U.S. GAAP). The Board of the Authority (the Board) adopted these financial statements at a meeting on June 26, 2019. The Authority maintains a system of internal controls, the objectives of which are to provide reasonable assurance as to the proper authorization and recording of transactions, the safeguarding of Authority assets, the compliance with applicable laws and regulations, and the reliability of financial records for preparing financial statements. The internal control structure is subject to periodic review by management, internal audit staff and the independent auditors. No internal control system can provide absolute assurance that errors and irregularities will not occur due to the inherent limitations of the effectiveness of internal controls; however, management strives to maintain a balance, recognizing that the cost of such system should not exceed the benefits derived. NY Green Bank’s financial statements have been audited by KPMG LLP, independent auditors appointed by the Members of the Board. Management has made available to the independent auditors all the financial records and related data of NY Green Bank, as well as provided access to all the minutes of the meetings of the Board and its standing committees. The independent auditors periodically meet directly with the Audit and Finance Committee of the Board, which is comprised of Members who are not employees of the Authority. The independent audit included obtaining an understanding of the internal control structure, tests of accounting records, and other procedures which the independent auditors considered necessary in order to express opinions as to the fairness of the presentation of the financial statements. No material weaknesses in internal control or any condition of non-compliance with applicable laws, regulations, or policy were noted by the independent auditors through the execution of their audit procedures. The unmodified independent auditors’ report attests that the financial statements are presented fairly, in all material respects, in accordance with U.S. GAAP.
Alfred W. Griffin Jeffrey J. Pitkin President of Treasurer and NY Green Bank Chief Financial Officer NYSERDA

KPMG LLP is a Delaware limited liability partnership and the U.S. member firm of the KPMG network of independent member firms affiliated with KPMG International Cooperative (“KPMG International”), a Swiss entity.
KPMG LLP515 BroadwayAlbany, NY 12207-2974
2
Independent Auditors’ Report
Members of the Authority New York State Energy Research and Development Authority:
Report on the Financial Statements We have audited the accompanying financial statements of NY Green Bank, an enterprise fund of the New York State Energy Research and Development Authority (the Fund), which comprise the statement of net position as of March 31, 2019, and the related statements of revenue, expenses and changes in fund net position and cash flows for the year then ended, and the related notes to the financial statements, as listed in the table of contents.
Management’s Responsibility for the Financial Statements
Management is responsible for the preparation and fair presentation of these financial statements in accordance with U.S. generally accepted accounting principles; this includes the design, implementation, and maintenance of internal control relevant to the preparation and fair presentation of financial statements that are free from material misstatement, whether due to fraud or error.
Auditors’ Responsibility
Our responsibility is to express an opinion on these financial statements based on our audit. We conducted our audit in accordance with auditing standards generally accepted in the United States of America and the standards applicable to financial audits contained in Government Auditing Standards, issued by the Comptroller General of the United States. Those standards require that we plan and perform the audit to obtain reasonable assurance about whether the financial statements are free from material misstatement.
An audit involves performing procedures to obtain audit evidence about the amounts and disclosures in the financial statements. The procedures selected depend on the auditors’ judgment, including the assessment of
the risks of material misstatement of the financial statements, whether due to fraud or error. In making those risk assessments, the auditors consider internal control relevant to the entity’s preparation and fair presentation
of the financial statements in order to design audit procedures that are appropriate in the circumstances, but not for the purpose of expressing an opinion on the effectiveness of the entity’s internal control. Accordingly, we
express no such opinion. An audit also includes evaluating the appropriateness of accounting policies used and the reasonableness of significant accounting estimates made by management, as well as evaluating the overall presentation of the financial statements.
We believe that the audit evidence we have obtained is sufficient and appropriate to provide a basis for our audit opinion.
Opinion
In our opinion, the financial statements referred to above present fairly, in all material respects, the financial position of the Fund as of March 31, 2019, and the changes in its financial position and its cash flows for the year then ended in accordance with U.S. generally accepted accounting principles.

3
Emphasis of Matter
As discussed in Note 2(a) to the financial statements, the financial statements present only the NY Green Bank Fund and do not purport to and do not present fairly the financial position of the New York State Energy Research and Development Authority as of March 31, 2019, the changes in its financial position, or, where applicable, its cash flows for the year then ended in conformity with U.S. generally accepted accounting principles. Our opinion is not modified with respect to this matter.
Report on Comparative Information
We have previously audited the 2018 financial statements of NY Green Bank, and we expressed an unmodified audit opinion on those audited financial statements in our report dated June 26, 2018. In our opinion, the comparative information presented herein as of and for the year ended March 31, 2018, is consistent, in all material respects, with the audited financial statements from which it has been derived.
Other Matters
Required Supplementary Information
U.S. generally accepted accounting principles require that management’s discussion and analysis be presented to supplement the basic financial statements. Such information, although not a part of the basic financial statements, is required by the Governmental Accounting Standards Board who considers it to be an essential part of financial reporting for placing the basic financial statements in an appropriate operational, economic, or historical context. We have applied certain limited procedures to the required supplementary information in accordance with auditing standards generally accepted in the United States of America, which consisted of inquiries of management about the methods of preparing the information and comparing the information for consistency with management’s responses to our inquiries, the basic financial statements, and other knowledge we obtained during our audit of the basic financial statements. We do not express an opinion or provide any assurance on the information because the limited procedures do not provide us with sufficient evidence to express an opinion or provide any assurance.
Other Information
Our audit was conducted for the purpose of forming an opinion on the Fund’s basic financial statements. The Responsibility for Financial Reporting section is presented for the purpose of additional analysis and is not a required part of the basic financial statements. Such information has not been subjected to the auditing procedures applied in the audit of the basic financial statements, and accordingly, we do not express an opinion or provide any assurance on it.
Other Reporting Required by Government Auditing Standards In accordance with Government Auditing Standards, we have also issued our report dated June 27, 2019 on our consideration of the Fund’s internal control over financial reporting and on our tests of its compliance with certain provisions of laws, regulations, contracts, and grant agreements and other matters. The purpose of that report is solely to describe the scope of our testing of internal control over financial reporting and compliance and the results of that testing, and not to provide an opinion on the effectiveness of the Fund’s internal control over financial reporting or on compliance. That report is an integral part of an audit performed in accordance with Government Auditing Standards in considering the Fund’s internal control over financial reporting and
compliance.
Albany, New York June 27, 2019
NY Green Bank (A Division of the New York State Energy Research and Development Authority)
Management's Discussion and Analysis For the Year Ended March 31, 2019
Unaudited
4
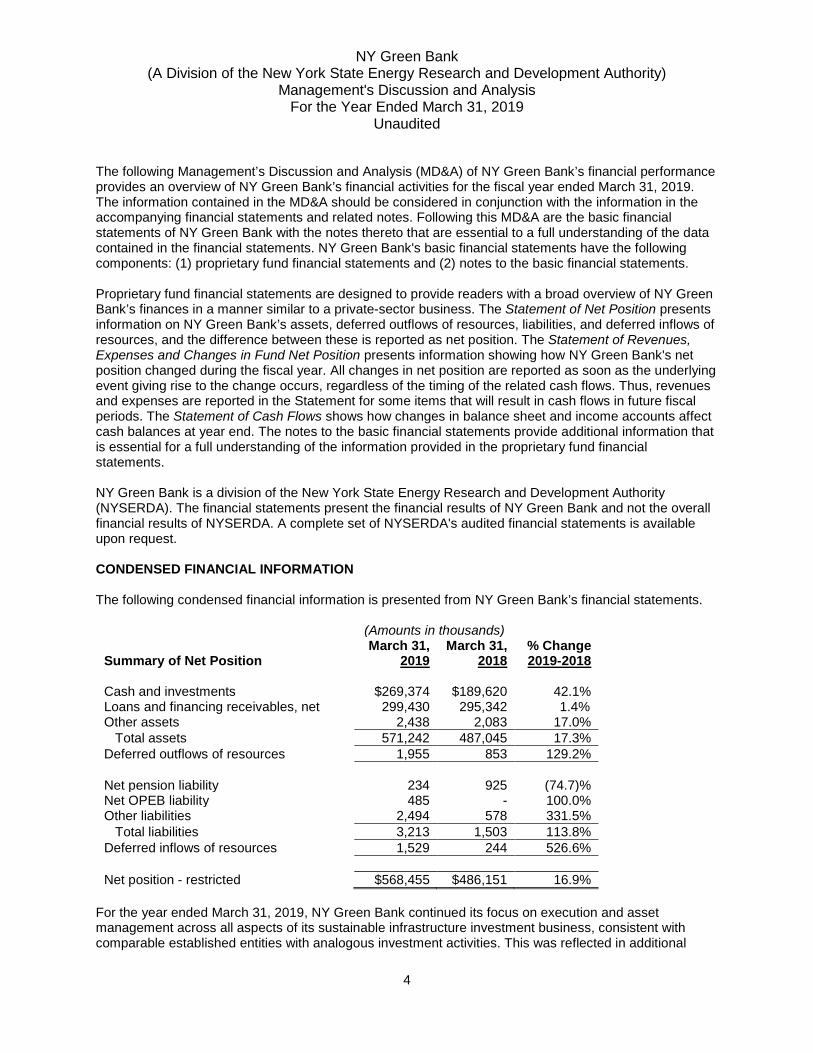
The following Management’s Discussion and Analysis (MD&A) of NY Green Bank’s financial performance provides an overview of NY Green Bank’s financial activities for the fiscal year ended March 31, 2019. The information contained in the MD&A should be considered in conjunction with the information in the accompanying financial statements and related notes. Following this MD&A are the basic financial statements of NY Green Bank with the notes thereto that are essential to a full understanding of the data contained in the financial statements. NY Green Bank's basic financial statements have the following components: (1) proprietary fund financial statements and (2) notes to the basic financial statements. Proprietary fund financial statements are designed to provide readers with a broad overview of NY Green Bank’s finances in a manner similar to a private-sector business. The Statement of Net Position presents information on NY Green Bank’s assets, deferred outflows of resources, liabilities, and deferred inflows of resources, and the difference between these is reported as net position. The Statement of Revenues, Expenses and Changes in Fund Net Position presents information showing how NY Green Bank's net position changed during the fiscal year. All changes in net position are reported as soon as the underlying event giving rise to the change occurs, regardless of the timing of the related cash flows. Thus, revenues and expenses are reported in the Statement for some items that will result in cash flows in future fiscal periods. The Statement of Cash Flows shows how changes in balance sheet and income accounts affect cash balances at year end. The notes to the basic financial statements provide additional information that is essential for a full understanding of the information provided in the proprietary fund financial statements. NY Green Bank is a division of the New York State Energy Research and Development Authority (NYSERDA). The financial statements present the financial results of NY Green Bank and not the overall financial results of NYSERDA. A complete set of NYSERDA's audited financial statements is available upon request. CONDENSED FINANCIAL INFORMATION The following condensed financial information is presented from NY Green Bank’s financial statements.
(Amounts in thousands)
Summary of Net Position March 31,
2019 March 31,
2018 % Change 2019-2018
Cash and investments $269,374 $189,620 42.1% Loans and financing receivables, net 299,430 295,342 1.4% Other assets 2,438 2,083 17.0% Total assets 571,242 487,045 17.3% Deferred outflows of resources 1,955 853 129.2% Net pension liability 234 925 (74.7)% Net OPEB liability 485 - 100.0% Other liabilities 2,494 578 331.5% Total liabilities 3,213 1,503 113.8% Deferred inflows of resources 1,529 244 526.6% Net position - restricted $568,455 $486,151 16.9%
For the year ended March 31, 2019, NY Green Bank continued its focus on execution and asset management across all aspects of its sustainable infrastructure investment business, consistent with comparable established entities with analogous investment activities. This was reflected in additional

NY Green Bank (A Division of the New York State Energy Research and Development Authority)
Management's Discussion and Analysis For the Year Ended March 31, 2019
Unaudited
5
transaction execution activity in the period, increasing NY Green Bank’s Loans and Financing Receivables (hereinafter referred to as “Portfolio Investment(s)”), ongoing business development to maintain a robust pipeline of potential Portfolio Investments, as well as focus on implementing and maintaining operational platforms, policies and practices consistent with industry best practice. NY Green Bank has received over $3.4 billion in Portfolio Investment proposals from inception through March 31, 2019. Its active pipeline of potential Portfolio Investments proceeding towards closing was $702.7 million as of March 31, 2019, continuing to be diversified across technology, location, and end-user segments. During the past fiscal year, NY Green Bank closed fifteen new Portfolio Investment transactions totaling $280.1 million, facilitating clean energy development in New York State with an aggregate estimated total project cost in the range of $1.74 billion to $1.96 billion. Through March 31, 2019, NY Green Bank’s overall sustainable infrastructure investments since inception totaled $737.6 million. At the same date, NY Green Bank’s current portfolio (representing the aggregate dollar value of its sustainable infrastructure investments and comprising deployed as well as committed amounts on that date) was $471.3 million. This is net of all permanent repayments of principal received by NY Green Bank in accordance with the terms of its Portfolio Investments that occurred within the year in the amount of $139.2 million (i.e., does not include paydowns against revolving facilities that remain available for redraw, which aggregated $41.5 million in the fiscal year), and includes capitalized items (e.g., interest and/or fees) to the extent capitalized within the period (i.e., not amounts on account of interest and/or fees that may be capitalized in future periods). Principal repaid, together with net income generated by NY Green Bank becomes immediately available for recycling into further investments, amplifying the positive effects of each dollar of NY Green Bank capital on clean energy markets within the State for the benefit of all New Yorkers. The 42.1% increase in Cash and Investments reflects that NY Green Bank’s portfolio is more established with an increasing volume of investments starting to pay down, and such returned capital being available for recycling into new Portfolio Investment transactions, in addition to funds received on account of further capitalization. NY Green Bank’s cash and invested capital balances reflect $598.6 million in funded capitalization received to date. NY Green Bank receives incremental capital contributions through NYSERDA as capital is committed (taking into account projected liquidity needs) and an additional $401.9 million in capitalization is authorized to be provided based on the New York State Public Service Commission’s (Commission) authorization of $1.0 billion in total funded capitalization. In turn, NYSERDA funds these contributions either from a transfer of existing cash and investment balances (of certain Commission authorized programs), or from the Clean Energy Fund (CEF) ratepayer collections held by the electric utilities under the “Bill-As-You-Go” (BAYG) approach, consistent with the Commission Order establishing the CEF. NY Green Bank’s forecasted liquidity needs are fully addressed through these funded capital contributions, or through the use of a credit facility, if and when required. As part of U.S. generally accepted accounting standards (GAAP), the Governmental Accounting Standards Board (GASB) requires capital contributions made to NY Green Bank from NYSERDA’s available cash and investment balances to be treated as transfers, while those derived directly from the BAYG approach be accounted for as non-operating revenues to NY Green Bank. As a result, additions to NY Green Bank’s capital during the fiscal year equal the sum of “Capital contributions” under Non-operating revenues and “Transfers In-Capital Contributions (Redemptions)” on NY Green Bank’s Statement of Revenues, Expenses and Changes in Fund Net Position. The variance in Deferred Outflows and Inflows of Resources and Net Pension and OPEB Liabilities results from changes in the actuarially-determined amounts determined through separate actuarial valuations, of which NY Green Bank, as a proprietary fund of NYSERDA, is required to record its proportionate share of NYSERDA actuarially determined amounts. Other Liabilities increased 331.5% during the fiscal year, primarily from an increase in accrued operating liabilities.

NY Green Bank (A Division of the New York State Energy Research and Development Authority)
Management's Discussion and Analysis For the Year Ended March 31, 2019
Unaudited
6
It is important to note that, consistent with its business model, not all funds that NY Green Bank commits to sustainable infrastructure and clean energy development in the State are intended to be deployed and disbursed immediately, or in some cases, at all, pursuant to executed contractual arrangements. Many NY Green Bank Portfolio Investments relate to distributed generation or energy efficiency finance, which are most commonly focused on funding portfolios of projects. Once a Portfolio Investment of these types closes, developers begin implementing projects and drawing down on capital over time. These financings are “delayed draw” by design in that funds are not deployed until project sponsors meet certain development milestones over a time period necessary to originate, develop and construct a large number of smaller, distributed clean energy projects. NY Green Bank also enters into transactions that are not expected to be funded, such as those involving credit enhancements that comprise a contingent obligation for NY Green Bank, and where NY Green Bank capital is only drawn if a contingency is triggered. Total Assets and Net Position increased by $84.2 million and $82.3 million, respectively. NY Green Bank’s Net Position as of March 31, 2019 was $569.7 million, reflecting the total capitalization of $598.6 million funded through the end of the period (including $17.5 million as part of its initial funded capitalization authorized for start-up administration expense until such costs could be funded from revenues), less $52.9 million of NYSERDA capital redemptions, plus $22.8 million in cumulative revenues in excess of cumulative expenses. The $52.9 million capital redemption reflects a portion of NY Green Bank’s initial capitalization funded from Regional Greenhouse Gas Initiative revenues repurposed by NYSERDA to provide funding to support NYSERDA’s statewide energy storage initiative.
(Amounts in thousands)
Summary of Changes in Net Position March 31,
2019 March 31,
2018 % Change 2019-2018
Operating revenues:
Fees $3,947 $2,484 58.9% Loans and financing receivables interest 15,253 16,703 (8.7)% Provisions for losses on loans and financing receivables (388) (844) (54.0)% Total operating revenues: 18,812 18,343 2.6% Operating expenses: Salaries and benefits 6,421 5,716 12.3% Investment related expenses 456 435 4.8% Other operating costs 765 1,152 (33.6)% General and administrative expenses 1,100 920 19.6% Depreciation 184 154 19.5%
NY State assessments 125 86 45.3% Total operating expenses 9,051 8,463 6.9% Operating income 9,761 9,880 (1.2)% Non-operating revenues: Capital contributions 119,882 9,529 1,158.1% Investment income 7,223 1,354 433.5% Total non-operating revenues 127,105 10,883 1,067.9% Non-operating expenses: Capital expansion 1,425 - 100.0% Program evaluation 211 - 100.0% Total non-operating expenses 1,636 - 100.0% Income before transfers 135,230 20,763 551.3% Transfers - capital contributions (redemptions) (52,926) 100,152 (152.8)% Change in net position 82,304 120,915 (31.9)% Net position, beginning of year 486,151 365,236 n/a Net position, end of year $568,455 $486,151 16.9%

NY Green Bank (A Division of the New York State Energy Research and Development Authority)
Management's Discussion and Analysis For the Year Ended March 31, 2019
Unaudited
7
Total Operating Revenues increased $0.5 million (2.6%) from the prior year. A 58.9% increase in fees is primarily attributable to NY Green Bank closing a larger number of transactions during the fiscal year. A decrease in loans and financing receivables interest of 8.7% is due to an increase in loan repayments, which are central to NY Green Bank’s capital preservation and recycling. A Provision for losses on Loans and financing receivables in the amount of $387,898 has been recorded for the year ending March 31, 2019. This represents 0.13% of the total Loans and financing receivables balance at March 31, 2019. Total Operating Expenses increased $0.6 million (6.9%), most significantly driven by increases in Salaries and Benefits; these and other costs are discussed below. Salaries and Benefits, which include NY Green Bank staff salary expenses ($3.0 million), NYSERDA allocated administrative salary expenses ($1.6 million), and allocated fringe benefit expenses ($1.8 million), increased $0.7 million (12.3%) from the prior year. This occurred due to an increase in NY Green Bank’s staffing consistent with plan as well as an increase in the overall pool of allocable expenses of which NY Green Bank pays its pro rata share (which is calculated based on NY Green Bank’s direct staffing costs as a proportion of NYSERDA’s program staffing costs). Investment Related Expenses, which include legal and other costs incurred for various Portfolio Investments, were 4.8% more than the previous year, which generally reflects transaction volumes and counterparty reimbursement rates. Program Operating Costs decreased $0.4 million (33.6%) due to a decrease in professional service expenses (e.g., consultants and temporary employees). General and Administrative Expenses, which include allocable costs such as rent, utilities, and insurance increased $0.2 million (19.6%) due to an increase in the allocable cost as compared to the prior year, generally as a result of the increase in salary costs. Depreciation and NY State Assessments reflect NY Green Bank’s allocable share of NYSERDA’s depreciation and NYSERDA’s cost recovery fee (CRF) assessment from the State of New York, respectively. Both of these dollar amounts have increased from the prior year. Investment Income increased $5.9 million (433.5%), directly reflecting NY Green Bank’s higher average investment, resulting from contributed capital received but not immediately deployed, as well as operating income generated and principal payments received less capital redemptions. Non-operating expenses increased $1.6 million primarily due to capital advisory costs of $1.4 million. In October 2017, Governor Cuomo announced that NYGB would explore options to raise at least an additional $1.0 billion in private sector funds to invest at a portfolio level (Capital Initiative) and would take steps toward exploring a national expansion. In January 2019, Governor Cuomo released the 2019 State of the State Book1 and called for the development of terms for a public-private partnership to effectuate NYGB’s third-party capital raise and expansion across North America. NY Green Bank engaged an outside consultant to assist in the exploration of the Capital Initiative. Separately, program evaluation costs increased $0.2 million; these expenses are attributable to periodic independent assessments of NY Green Bank’s non-financial impact in the marketplace (e.g., energy, environmental and market transformation).
1 See www.governor.ny.gov/sites/governor.ny.gov/files/atoms/files/2019StateoftheStateBook.pdf.

NY Green Bank (A Division of the New York State Energy Research and Development Authority)
Management's Discussion and Analysis For the Year Ended March 31, 2019
Unaudited
8
CAPITAL ASSET AND DEBT ADMINISTRATION Capital assets are purchased and owned by NYSERDA. NY Green Bank does not maintain capital assets on its Statement of Net Position, but instead is allocated depreciation expense on capital assets from NYSERDA. ECONOMIC AND OTHER MARKET FACTORS Portfolio Investments in, and funding of, clean energy projects may be impacted by a number of factors including, but not limited to, general economic conditions, energy prices, materials and equipment availability and costs, energy system reliability, energy technology advancements, and regulatory and public policy matters both within and beyond New York State. CONTACT FOR NY GREEN BANK'S FINANCIAL MANAGEMENT This report is designed to provide a general overview of the finances of NY Green Bank, a division of NYSERDA, for interested parties. Questions concerning any information within this report or requests for additional information should be addressed to Jeffrey J. Pitkin, Treasurer and Chief Financial Officer, NYSERDA, 17 Columbia Circle, Albany, NY 12203.

NY Green Bank(A Division of the New York State Energy Research and Development Authority)
Statement of Net PositionMarch 31, 2019
(with comparative totals for March 31, 2018)
March 31, March 31,2019 2018
ASSETS:Current assets:
Cash and investments $174,576 189,620Third-party billings receivable 174 212Interest receivable on loans 2,264 1,871Loans and financing receivables due within one year, net 33,310 48,688
Total current assets 210,324 240,391 Non-current assets: Investments 94,798 - Loans and financing receivables - long term, net 266,120 246,654
Total non-current assets 360,918 246,654 Total assets 571,242 487,045
DEFERRED OUTFLOWS OF RESOURCES: 1,955 853
LIABILITIES:Current liabilities: Accrued liabilities 671 503 Counterparty deposits - 50 Escrow deposits 1,823 25
Total current liabilities 2,494 578 Non-current liabilities: Net pension liability 234 925 Net OPEB liability 485 -
Total non-current liabilities 719 925 Total liabilities 3,213 1,503
DEFERRED INFLOWS OF RESOURCES: 1,529 244
NET POSITION:Net position restricted for specific programs $568,455 486,151
See accompanying notes to the basic financial statements.
(Amounts in thousands)
9

March 31, March 31,2019 2018
OPERATING REVENUES:Closing fees $2,993 1,596 Undrawn fees 382 376 Administrative fees 68 55 Other fees 504 457 Loans and financing receivables interest 15,253 16,703 Provision for losses on loans and financing receivables (388) (844) Total operating revenues 18,812 18,343
OPERATING EXPENSES:Salaries and benefits 6,421 5,716Investment related expenses 456 435 Other operating costs 765 1,152 General & administrative expenses 1,100 920 Depreciation 184 154 NY State assessments 125 86 Total operating expenses 9,051 8,463 OPERATING INCOME 9,761 9,880
NON-OPERATING REVENUES:Capital contributions 119,882 9,529 Investment income 7,223 1,354 Total non-operating revenues 127,105 10,883
NON-OPERATING EXPENSES:Capital expansion 1,425 - Program evaluation 211 - Total non-operating expenses 1,636 -
INCOME BEFORE TRANSFERS 135,230 20,763Transfers- capital contributions (redemptions) (52,926) 100,152 Change in net position 82,304 120,915
Net position, beginning of year 486,151 365,236
Net position, end of year $568,455 486,151
See accompanying notes to the basic financial statements.
(Amounts in thousands)
NY Green Bank(A Division of the New York State Energy Research and Development Authority)
Statement of Revenues, Expenses and Changes in Fund Net PositionFor the year ended March 31, 2019
(with comparative totals for March 31, 2018)
10

March 31, March 31,2019 2018
CASH FLOWS FROM OPERATING ACTIVITIES:Closing fees collected $2,993 1,596 Undrawn fees collected 450 311 Administrative fees collected 68 55 Other fees collected 475 457 Loans and financing receivables interest collected 14,862 16,243 Receipt (Disbursement) of counterparty deposits (50) 50 Receipt (Disbursement) of escrow deposits 1,798 (185) Payments to employees & employee benefit providers (6,444) (5,548)Payments to suppliers (2,367) (2,187)Payment for allocated depreciation (184) (154) Payments to NYS (125) (85) Loans and financing receivables deployed (184,150) (180,872) Loans and financing receivables principal repayments 179,674 143,227
Net cash provided by (used in) operating activities 7,000 (27,092)
Capital contributions 119,882 9,529 Transfers- Capital Contributions (Redemptions) (52,926) 100,152 Capital expansion (1,425) -
Net cash provided by non-capital financing activities 65,531 109,681
Purchase of investments (817,720) (494,866) Proceeds from sale of investments 739,942 424,641 Investment income 4,891 1,208
Net cash used in investing activities (72,887) (69,017)
(356) 13,572 17,196 3,624
$16,840 17,196
Operating income $9,761 9,880
38 (112)(393) (461)
(4,088) (36,801) 168 369 (50) 50
1,798 (185) (23) 168
(211) - Net cash provided by (used in) operating activities $7,000 (27,092)
See accompanying notes to the basic financial statements.
RECONCILIATION OF OPERATING INCOME TO NET CASH PROVIDED BY (USED IN) OPERATING ACTIVITIES:
NY Green Bank(A Division of the New York State Energy Research and Development Authority)
Statement of Cash FlowsFor the year ended March 31, 2019
(with comparative totals for March 31, 2018)(Amounts in thousands)
CASH FLOWS FROM NON-CAPITAL FINANCING ACTIVITIES:
CASH FLOWS FROM INVESTING ACTIVITIES:
NET CHANGE IN CASHCash and cash equivalents, beginning of periodCash and cash equivalents, end of period
Adjustments to reconcile operating income to net cash used in operating activities: (Decrease) increase in third party billings receivable Increase in interest receivable Increase in loans and financing receivables Increase in accrued liabilities (Decrease) increase in counterparty deposits Increase (decrease) in escrow deposits Net change in pension & OPEB related accounts Non-operating expenses unrelated to financing activities
11

NY Green Bank
(A Division of the New York State Energy Research and Development Authority)
Notes to Basic Financial Statements March 31, 2019
12
(1) GENERAL
The $1.0 billion NY Green Bank was established to attract private sector capital to accelerate clean energy deployment in New York State (NYS or the State). To date, NY Green Bank has participated in transactions by providing: construction and longer-term post-construction financing and investment, financing to enable developers to aggregate smaller distributed assets into portfolios at scale, and credit enhancements. NY Green Bank works to increase the size, volume, and breadth of clean energy and sustainable infrastructure investment activity throughout the State, expand the base of investors focused on NYS clean energy, and increase clean energy participants’ access to capital. To do so, NY Green Bank collaborates with the private sector to develop transaction structures and methodologies that overcome typical clean energy investment barriers, such as challenges in evaluating risk and addressing the needs of distributed energy and efficiency projects where underwriting may be geared more towards larger projects and/or groups of somewhat homogeneous investment opportunities. NY Green Bank focuses on opportunities that create attractive precedents, standardized practices, and roadmaps that capital providers can willingly replicate and scale. As funders “crowd in” to a particular area within the sustainable infrastructure and clean energy landscape, NY Green Bank moves on to other areas that have attracted less investor interest. As a key component of New York’s Clean Energy Fund (CEF), NY Green Bank is structured to be self-sustaining in that it must ultimately cover its own costs of operation. The CEF is a $5.3 billion commitment, representing part of Governor Andrew M. Cuomo’s Reforming the Energy Vision (REV) strategy to advance clean energy growth and innovation and drive economic development across the State while reducing ratepayer collections. NY Green Bank is a division of the New York State Energy Research and Development Authority (NYSERDA). NYSERDA is a public benefit corporation established in 1975 pursuant to Title 9 of Article 8 of the Public Authorities Law of the State of New York. NYSERDA is included in the State's basic financial statements as a component unit.
Pursuant to various Orders of the NYS Public Service Commission (Commission), the Commission authorized a total of $1 billion in funded capitalization for NY Green Bank. As of March 31, 2019, total ratepayer funded capitalization provided to NY Green Bank was $598.1 million, resulting in an unfunded amount of $401.9 million that will be subsequently provided through the “Bill As You Go” approach.
Pursuant to BAYG, NY Green Bank receives incremental capital contributions through NYSERDA upon executing new commitments of the authorized capital. In turn, NYSERDA funds these contributions either from a transfer of existing cash and investment balances (of certain Commission authorized programs), or from the CEF ratepayer collections held by the electric utilities. As part of U.S. generally accepted accounting standards (GAAP), the Governmental Accounting Standards Board (GASB) requires capital contributions made to NY Green Bank from NYSERDA’s available cash and investment balances to be treated as transfers, while those derived directly from the BAYG approach be accounted for as non-operating revenues to NY Green Bank. As a result, additions to NY Green Bank’s capital during the fiscal year equal the sum of “Capital contributions” under Non-operating revenues and “Transfers in” on NY Green Bank’s Statement of Revenues, Expenses and Changes in Fund Net Position.

NY Green Bank
(A Division of the New York State Energy Research and Development Authority)
Notes to Basic Financial Statements March 31, 2019
13
(2) SUMMARY OF SIGNIFICANT ACCOUNTING POLICIES (a) Basis of presentation
NY Green Bank is presented as a proprietary fund. Proprietary funds are used to report business-type activities for which a fee is charged to external users for goods or services. NY Green Bank’s proprietary fund financial statements are designed to provide readers with a broad overview of NY Green Bank’s finances in a manner similar to a private-sector business and consist of a Statement of Net Position; a Statement of Revenues, Expenses and Changes in Fund Net Position; and a Statement of Cash Flows.
Net position restricted for specific programs in the proprietary fund financial statements is defined as the amount of restricted assets and deferred outflows of resources reduced by liabilities and deferred inflows of resources related to those assets. The accompanying financial statements present only the activities of NY Green Bank and the results of its operations in conformity with U.S. GAAP and are not intended to present the financial position of NYSERDA. These financial statements include certain prior year comparative information but not at the level of detail required for a presentation in conformity with GAAP. Accordingly, such information should be read in conjunction with NY Green Bank’s financial statements for the year ended March 31, 2019 from which the information was derived.
(b) Basis of accounting Proprietary fund financial statements are prepared using the economic resources measurement focus and accrual basis of accounting. Revenues resulting from exchange transactions are recognized when the exchange takes place. Revenues resulting from non-exchange transactions are recognized when all eligibility requirements (if any) have been met. Expenses are recognized when incurred.
(c) Program operating costs Program operating costs consist of certain costs that can be directly attributed to the NY Green Bank function. Program operating costs include expenses such as professional service costs and staff travel.
(d) Indirect cost allocation method NYSERDA incurs certain indirect costs (e.g., administrative salary expense, fringe benefit expense, and general and administrative expense) that are not directly associated with a specific function/program. Therefore, these costs are allocated in proportion to direct salary expenses of each NYSERDA function/program, including NY Green Bank. Administrative salary expense is comprised of an allocation of NYSERDA’s administrative and support unit salaries and fringe benefit expenses. The administrative salary and fringe benefit expenses allocated to NY Green Bank are included in Salaries and Benefits Expense. General and Administrative Expense includes costs such as rent, equipment and facility costs, and information technology costs allocated to NY Green Bank.
(e) Investments
Investments are recorded at fair value, which reflects quoted market prices for U.S. government obligations.

NY Green Bank
(A Division of the New York State Energy Research and Development Authority)
Notes to Basic Financial Statements March 31, 2019
14
(f) Loans and financing receivables Loans and financing receivables are recorded at their cost basis. A provision for losses is established on any individual loan and financing receivable which:(i) is delinquent by more than 120 days on payment of principal or interest obligations; and (ii) indicates a deficiency in the present value of expected cash flows discounted at its effective interest rate, or a deficiency in the valuation of its collateral, as compared to its outstanding balance plus any accrued interest receivable.
(g) Capital assets
NY Green Bank does not maintain capital assets on its Statement of Net Position, but instead is allocated depreciation expense on NYSERDA capital assets. Depreciation is allocated in proportion to direct salary expenses of each NYSERDA function/program, including NY Green Bank.
(h) Deferred outflows of resources and deferred inflow of resources
Deferred outflows of resources as presented represent a consumption of net assets applicable to a future reporting period. Deferred inflows of resources are defined as an acquisition of net assets applicable to a future reporting period. Deferred outflows of resources and deferred inflow of resources include differences between expected projected results and actual results related to NY Green Bank’s allocated portion of NYSERDA’s net pension and net OPEB liabilities, as well as an allocated portion of retirement plan contributions subsequent to the measurement date.
(i) NY State assessments NY State assessments represent NY Green Bank’s pro-rata share of fees assessed to NYSERDA by the State under Section 2975 of the Public Authorities Law (Governmental Cost Recovery System) for general governmental services, which are allocated in proportion to total expenses of each NYSERDA function/program, including NY Green Bank.
(j) Use of estimates The preparation of financial statements in conformity with GAAP requires management to make estimates and assumptions that affect the reported amounts of assets and liabilities and disclosure of contingencies. Estimates also affect the reported amounts of revenues and expenses during the reporting period. Actual results could differ from those estimates.
(k) Adoption of new accounting pronouncement NYSERDA and NY Green Bank implemented GASB Statement No. 75, Accounting and Financial Reporting for Postemployment Benefits Plans Other than Pensions (GASB 75), for the fiscal year ended March 31, 2019. This statement replaces the requirements of GASB Statement No. 45, Financial Reporting for Post-employment Benefits Other Than Pension Plans and requires employers and nonemployer contributing entities to report their net OPEB liability on their financial statements. NY Green Bank has recorded a participating proportion of the net OPEB liability of the plan and OPEB-related deferred outflows and inflows of resources as a result of adopting this pronouncement.
(3) CASH AND INVESTMENTS
Pursuant to Public Authorities Law Section 1859(1), the Commissioner of the New York State Department of Taxation and Finance (Fiscal Agent) serves as fiscal agent for NYSERDA’s cash and investments, maintaining such funds on NYSERDA’s behalf and implementing investments subject to the Fiscal Agent’s policies and with direction and authorization from NYSERDA. NY Green Bank investments are subject to an investment policy approved by NYSERDA’s Board. The policy permits deposits with financial institutions approved by the Fiscal Agent and permits investments in: certificates of deposit of bank or trust companies located in New York State, obligations of New York State and the U.S. government and certain of their agencies, repurchase agreements subject to

NY Green Bank
(A Division of the New York State Energy Research and Development Authority)
Notes to Basic Financial Statements March 31, 2019
15
certain limitations, and money market funds subject to certain limitations. The following schedule presents NY Green Bank's cash and investments as of March 31, 2019. Fair value is measured using quoted market prices for U.S. government obligations. GASB Statement No. 72, Fair Value Measurement and Application, prescribes three approaches to measuring fair value and requires a government to use valuation techniques consistent with one or more of these approaches. The standard establishes a fair value hierarchy that categorizes the inputs to valuation techniques used to measure fair value into three levels. Level 1 inputs are quoted prices (unadjusted) for identical assets or liabilities in active markets that a government can access at the measurement date. Level 2 inputs are inputs – other than quoted prices included within Level 1 - that are observable for an asset or liability, either directly or indirectly. Level 3 inputs are unobservable inputs for an asset or liability. The fair value hierarchy gives the highest priority to Level 1 inputs and the lowest priority to Level 3 inputs. All NY Green Bank investments are valued based on Level 1 inputs.
Fair Value % of Total
Weighted Average Maturity
(months) Cash and equivalents 16,840 6.3 n/a Money Market Fund 7,439 2.7 n/a U.S. Treasury Bills 50,578 18.8 0.7 U.S. Treasury Strips 194,517 72.2 9.5 Total $269,374 100.0 10.2
Current portion thereof $174,576
In addition to being subject to NYSERDA’s investment policy, NY Green Bank is also subject to the
same interest rate risk, concentration of credit risk, custodial credit risk for deposits, and custodial credit risks for investments.
Interest Rate Risk. NYSERDA’s investment policy limits investment maturities to no longer than five
years as a means of managing its exposure to fair value losses arising from increasing interest rates. Investment maturities are selected based on anticipated cash flow needs.
Concentration of Credit Risk. NYSERDA’s investment policy limits investments with any single eligible banking institution to no more than 35% of its total investment portfolio, except as otherwise required by any policies and practices of the Fiscal Agent. As of March 31, 2019, NYSERDA did not have any investments with institutions that were individually in excess of 5% of total investments.
Custodial Credit Risk for Deposits. Deposits are exposed to custodial credit risk if the deposits are not covered by depository insurance or deposits are uncollateralized, collateralized with securities held by the pledging financial institution, or collateralized with securities held by the pledging institution’s trust department or agent, but not in the name of NYSERDA. In accordance with existing policies and procedures, the Fiscal Agent for NYSERDA monitors deposit balances for the purpose of determining collateralization levels. Collateral sufficient to cover all uninsured deposits is held at the Fiscal Agent’s custodial bank. Custodial Credit Risk for Investments. Investment securities are exposed to custodial credit risk if the securities are uninsured, are not registered in the name of NYSERDA and are held either by the counterparty or the counterparty’s trust department or agent, but not in the name of NYSERDA.

NY Green Bank
(A Division of the New York State Energy Research and Development Authority)
Notes to Basic Financial Statements March 31, 2019
16
Fixed income investments owned directly by NYSERDA including those held on behalf of NY Green Bank, which trade in the U.S. markets, are held at NYSERDA's fiscal agent’s custodian, in separate accounts, in the name of the Comptroller of the State of New York in Trust for NYSERDA. These securities are typically held in electronic form through the Federal Book Entry System and by the Depository Trust Company (DTC) and its subsidiaries acting as an agent of NYSERDA's fiscal agent’s custodian bank. The following is a summary of cash and investments and related committed capital as of March 31, 2019:
(Amounts in thousands)
Cash and Investments
Committed Capital
$269,374 $171,681
NY Green Bank’s investment portfolio at any time consists of two components: committed capital and deployed capital. Committed capital relates to clean energy/sustainable infrastructure investments that NY Green Bank has legally executed, but where capital has not yet been deployed. This is supplemented by capital that has been deployed into NY Green Bank’s clean energy transactions, pursuant to the terms of those arrangements. At March 31, 2019, NY Green Bank committed capital was $171.7 million and deployed capital was $299.7 million, as discussed further in note 4.
(4) LOANS AND FINANCING RECEIVABLES
Loans and financing receivables consist of sustainable infrastructure investments made by NY Green Bank into eligible technologies, consistent with its mission and investment criteria. These loans and financing transactions aim to mobilize private sector capital during the lifecycle of each investment, accelerate the deployment of economically and technically feasible clean energy projects in the State, provide financial returns to NY Green Bank, and contribute to New York’s clean energy policy outcomes. NY Green Bank offers the following categories of capital solutions: construction finance, construction finance & term loan, term loans & investments (which may be debt or equity), warehousing/aggregation, and credit enhancements. NY Green Bank prices its products to reflect its credit underwriting, its risk position in the capital structure and pricing for comparable transactions, as well as internal portfolio return needs taking into account current market rates as well as commercial expectations of rates. For the fiscal years ended March 31, 2019 and March 31, 2018, provision for losses were $0.4 million and $0.8 million, respectively, and are reflected as a reduction of Loans and financing receivables interest on the Statement of Revenues, Expenses and Changes in Fund Net Position.

NY Green Bank
(A Division of the New York State Energy Research and Development Authority)
Notes to Basic Financial Statements March 31, 2019
17
Loans and financing receivables at March 31, 2019 include the following:
Loans and financing receivables at March 31, 2019 mature as follows:
(Amounts in thousands)
Fiscal year ending March 31,
Construction Finance
Construction Finance & Term
Loan Term Loan & Investments
Warehousing /Aggregation Total
2020 $20,634 1,709 9,445 1,522 33,310 2021 - 1,247 27,730 26,137 55,114 2022 10,693 1,326 2,536 1,567 16,122 2023 - 1,476 14,055 13,050 28,581 2024 - 1,573 30,963 37,717 70,253 2024-2029 1,384 12,964 37,022 - 51,370 2029-2034 - 2,479 4,438 - 6,917 2034-2039 - 2,280 483 - 2,763 2039-2050 - - 35,000 - 35,000 Total 32,711 25,054 161,672 79,993 299,430
(5) NON-CURRENT LIABILITIES
GASB Statement No. 68, Accounting and Financial Reporting for Pensions (GASB 68) requires the recognition by NYSERDA and, in turn, NY Green Bank, of its proportionate share of the net pension liability of the New York State and Local Employees’ Retirement System, which is defined as the total pension liability less the plan’s fiduciary net position. As stated in Note 2, NYSERDA and NY Green Bank have adopted GASB Statement No. 75, Accounting and Financial Reporting for Postemployment Benefits Other than Pensions (OPEB), as of and for the year ended March 31, 2019. NY Green Bank’s non-current liability represents the share of NYSERDA’s net pension liability and net OPEB liability which is expected to be paid by NY Green Bank. Pension and OPEB related deferred outflows of resources and deferred inflows of resources are recognized by NY Green Bank to the extent they relate to NY Green Bank’s share of the total amount recognized by NYSERDA as a whole.
(Amounts in thousands)
Number of
Transactions
Loans and Financing Receivables Outstanding
Construction Finance 4 $32,711 Construction Finance & Term Loan 5 25,054 Term Loan & Investments 11 161,672 Warehousing /Aggregation 6 79,993 Total 26 299,430

NY Green Bank
(A Division of the New York State Energy Research and Development Authority)
Notes to Basic Financial Statements March 31, 2019
18
Non-current liability activity for the year ended March 31, 2019 was as follows:
(Amounts in thousands)
Beginning Balance
Additions
Reductions
Ending
Balance Net pension liability $925 1,152 (1,843) 234 Net OPEB liability - 485 - 485
Total non-current liabilities $925 1,637 (1,843) 719 (6) CONTINGENCIES Risk Management
NYSERDA is exposed to various risks of loss related to torts; theft of, damage to, and destruction of assets; errors and omissions; injuries to employees; and natural disasters. NYSERDA maintains commercial insurance coverage for each of those risks of loss. Management believes such coverage is sufficient to preclude any significant uninsured losses to NYSERDA. NYSERDA has not experienced any reductions in coverage and has not had any insurance settlements exceeding the coverage in the past three years. NY Green Bank is covered by NYSERDA's insurance policies.
Contingent Obligations As of March 31, 2019, NY Green Bank has entered into four credit contracts which, consistent with their terms, have not been funded but contain contingent obligations. NY Green Bank capital is only drawn if a contingent obligation under the respective agreement is triggered. The amount of contingent obligations as of March 31, 2019 totaled approximately $4.3 million. Any draws made on the above contingent obligations would be due to be repaid pursuant to the terms of their respective agreements.
(7) TRANSFERS – CAPITAL CONTRIBUTIONS (REDEMPTIONS)
Transfers for the year ending March 31, 2019 represent a $52.9 million capital redemption of NY Green Bank’s initial capitalization funded from Regional Greenhouse Gas Initiative revenues repurposed by NYSERDA to provide funding to support NYSERDA’s statewide energy storage initiative.