2019 ms4 annual report meeting · chapter 2: public education and outreach chapter 3: public...
TRANSCRIPT

2019 MS4 Annual Report
Meeting
Date:
May 21, 2020
Presenter:
S. Shree Dorestant, D.Mgt.
Stormwater Management Program Coordinator
Bureau of Environmental Planning and Analysis
Department of Environmental Protection

Stormwater runoff occurs when rain, snow, sleet,
and other precipitation lands on impervious
surfaces like rooftops, parking lots, streets,
sidewalks.
Stormwater Runoff in NYC
Approximately 72% of NYC is
impervious area
Eventually, this stormwater runoff will reach a catch
basin and enter the sewer system.
2

NYC Storm Sewer Systems
NYC has two types
of sewer systems
Combined Sewer System-
both wastewater and
stormwater are carried by a
single pipe to a wastewater
resource recovery facility.
Separate Storm Sewer System-
wastewater is carried by one pipe to
the wastewater resource recovery
facility and stormwater is carried by a
separate pipe directly to local
waterbodies.
3

NYC MS4
4
The MS4 serves much of Staten Island,
South Brooklyn, Southeast Queens,
and many City-owned parks.
An estimated 30 - 40% of
NYC is served by the
City’s MS4

5
Municipal Separate Storm Sewer System Permit (MS4 Permit)
• Effective Date: August 1, 2015
• Duration: renewal every 5 years
• Issued By: New York State Department of
Environmental Conservation (NYSDEC) as part
of the NYS Pollutant Discharge Elimination
System (SPDES)
• Permit Intent: to require the City to implement
measures to reduce pollution in stormwater
runoff
• Permit Requirement: develop a Stormwater
Management Program (SWMP)
o NYC submitted SWMP Plan to NYSDEC on
August 1, 2018
o NYC received approval of SWMP Plan on
March 14, 2019

Stormwater Management Program (SWMP) Plan
6
Chapter 1: Legal
Authority and Program
Administration
Chapter 2: Public
Education and Outreach
Chapter 3: Public
Involvement and
Participation
Chapter 4: Mapping
Chapter 5: Illicit
Discharge Detection and
Elimination
Chapter 6: Construction
and Post-Construction
Chapter 7: Pollution
Prevention/
Good Housekeeping
Chapter 8: Industrial and Commercial Stormwater
Sources
Chapter 9: Control of
Floatable and Settleable Trash
and Debris
Chapter 10: Monitoring and
Assessment Program
Chapter 11: Special
Conditions for Impaired Waters
Chapter 12: Recordkeeping and Reporting

7
• SWMP Plan approved on March 14, 2019 with two
conditions:
Incorporate a schedule to conduct further analysis with
recommendation of the appropriate threshold for the no net increase
(NNI) requirement for stormwater discharges to impaired waters
without a TMDL in the 2020 permit renewal application
Incorporate a schedule to develop and implement the new 20,000 sf
threshold for the Construction/Post Construction (C/PC) Program in the
2020 permit renewal application
• MS4 Rules published – April 1, 2019
• Effective Date of Rules – June 1, 2019
• DEP began inspecting facilities covered by the Multi-Sector General
Permit in the MS4 area
• DEP began reviewing Stormwater Pollution Prevention Plans for
covered development projects in the MS4 area
General Updates

Legal Authority and Program Administration
8
There are 14 City Agencies with responsibilities under
the MS4 Permit
DEP coordinates program administration
Planned Activities:
• MS4 Permit Renewal (2020 – 2025)
Agencies with MS4 Permit Obligations
Department of Citywide Administrative Services
(DCAS)
Department of City Planning (DCP)
Department of Design and Construction (DDC)
Department of Environmental Protection (DEP)
Department of Buildings (DOB)
Department of Correction (DOC)
Department of Education (DOE)
Department of Health and Mental Hygiene (DOHMH)
Department of Transportation (DOT)
Department of Parks and Recreation (DPR)
Department of Sanitation (DSNY)
Fire Department (FDNY)
Police Department (NYPD)
Small Business Services (SBS)
CollaboratorsNYC Law Department (LAW)
Economic Development Corporation (EDC)
Mayor’s Office of Management and Budget (OMB)
Mayor’s Office of Recovery and Resiliency (ORR)

9
NYC Artists Painted DSNY Trucks
Program Highlights:
• Organized or participated in over 1,700 events that reached 250,000 individuals and 2,500 businesses
• Distributed approximately 4.4 M materials such as flyers, posters, brochures, bookmarks, and grease pouches
Planned Activities:
• Continue implementing various initiatives
• Enhance exhibit at Newtown Creek Visitor Center to include information about stormwater and pollution
Public Education and Outreach
9

10
DPR tables at DOE
Science Showcase
Program
DSNY collects
hazardous
household waste at
a SAFE Event
Public Education and Outreach
DEP begins
expansion of
Newtown Creek
Nature Walk
10

Public Involvement and Participation
In developing the SWMP, the City held over 100 stakeholder meetings and responded to more than 100 public comments.
Program Highlights:
• Held or participated in 10 meetings and webinars to inform and solicit feedback from the public
• Reached over 200 individuals
Planned Activities:
• Continue engagement with local stakeholder groups and active participation in community events
• Provide educational information and webinars on construction and post-construction stormwater controls
Stakeholder reads the NYC SWMP Plan
DEP participates in Coney Island Creek Workshop 11

An interactive preliminary map is available to the public at www.nyc.gov/dep/ms4map.
Program Highlights:
• Published preliminary map August 1, 2018, which included 460 MS4 outfalls
• Identified additional MS4 outfalls to be added to map
Planned Activities:
• Continue to refine the datasets for MS4 outfalls and drainage areas
• Submit final MS4 Map and publish update by August 1, 2020
12NYC Artists Painted DSNY Trucks
Mapping

Illicit Discharge Detection and Elimination
Program Highlights:
• Detected 1,102 illicit discharges citywide
• Eliminated 1,090 illicit discharges citywide
• Inventoried 6% of known MS4 outfalls through the Shoreline Survey
• Conducted a drone survey of Alley Creek
Planned Activities:
• Integrate the Sentinel and Harbor Survey monitoring programs
• Conduct another drone survey that incorporates the lessons learned in 2019
• Partner with the USGS for a microbial source tracking study for Alley Creek
Shoreline Survey
Sentinel Monitoring
Emergency Response
13
311
Harbor Survey
Municipal Facilities

14
DEP uses a drone
to see temperature
differences in
Alley Creek.

Construction/Post-Construction
Program Highlights:
• Rules governing program went into effect on June 1, 2019
• Reviewed 18 SWPPPs and issued 3 approvals
• Held 9 training events on construction site stormwater controls
Planned Activities:
• Continue implementing program
• Develop a schedule for implementing a 20,000 square foot soil disturbance threshold to trigger the C/PC stormwater management requirements
15
Screenshots of Stormwater Permitting Tracking System
Program Highlights:
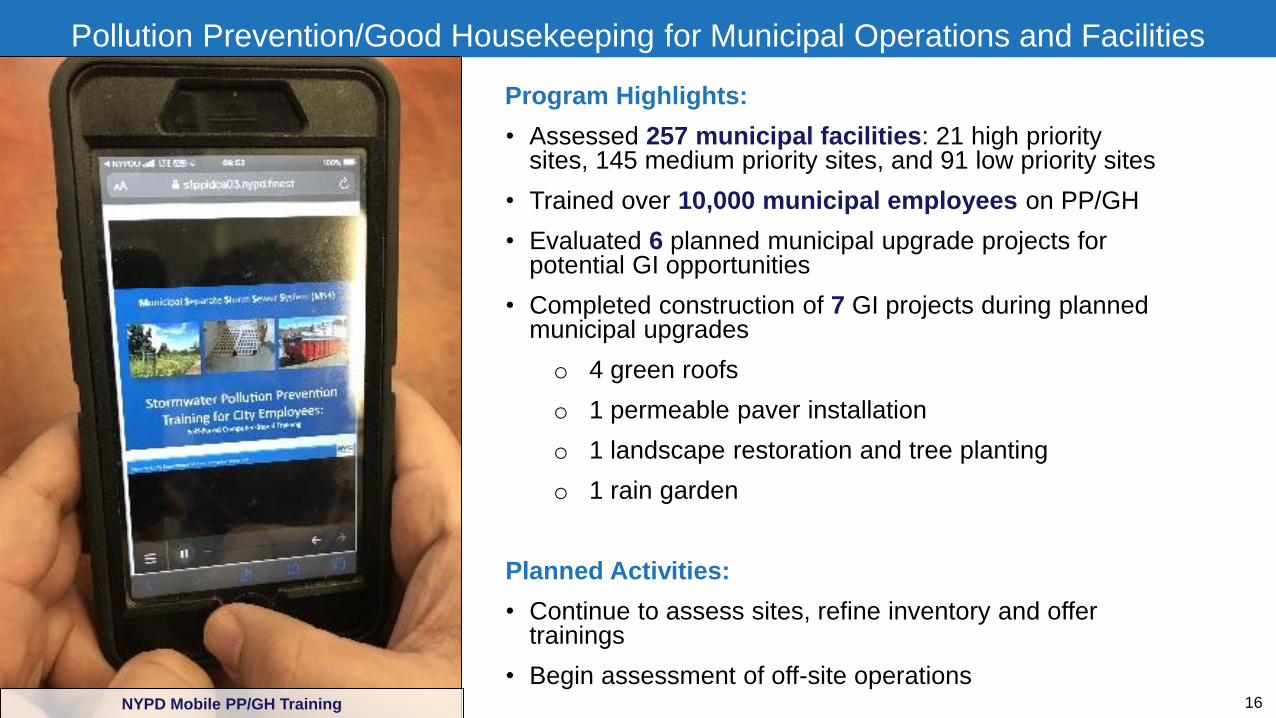
• Assessed 257 municipal facilities: 21 high priority sites, 145 medium priority sites, and 91 low priority sites
• Trained over 10,000 municipal employees on PP/GH
• Evaluated 6 planned municipal upgrade projects for potential GI opportunities
• Completed construction of 7 GI projects during planned municipal upgrades
o 4 green roofs
o 1 permeable paver installation
o 1 landscape restoration and tree planting
o 1 rain garden
Planned Activities:
• Continue to assess sites, refine inventory and offer trainings
• Begin assessment of off-site operations16
Pollution Prevention/Good Housekeeping for Municipal Operations and Facilities
NYPD Mobile PP/GH Training

The City constructed 7 GI projects as
part of municipal upgrades.
17
Rockaway Beach Boardwalk – green roof on beach 9
playground comfort station

Program Highlights:
• Rules governing program went into effect on June 1, 2019
• Inspected 4 permitted facilities
• Assessed 79 unpermitted facilities
• Referred 3 unpermitted facilities to NYSDEC for SPDES no-exposure coverage
Planned Activities:
• Continue assessing unpermitted facilities with a goal of completing 200 assessments by December 31, 2020
o Goal may be impacted by COVID-19
• Continue inspecting permitted facilities
18Joint inspection with DEP, EPA & DEC at a permitted facility
Industrial/Commercial Stormwater Sources
DEP inspectors evaluating fueling area best management practices at a
permitted facility

Control of Floatable and Settleable Trash and Debris
Program Highlights:
• Swept over 500,000 miles of street (including arterial highways)
• Inspected over 9,400 catch basins
• Enacted a styrofoam ban and paper bag fee
• Conducted desktop analysis and field reconnaissance to identify potential sites for the Loading Rate Study
Planned Activities:
• Continue implementing controls such as street sweeping, catch basin inspection and maintenance
• Finalize loading rate study monitoring sites and equipment
19
DPR Clean Up in Jamaica Bay
DEP Catch Basin Cleaning

New "Clean Streets = Clean Beaches" Messaging
20
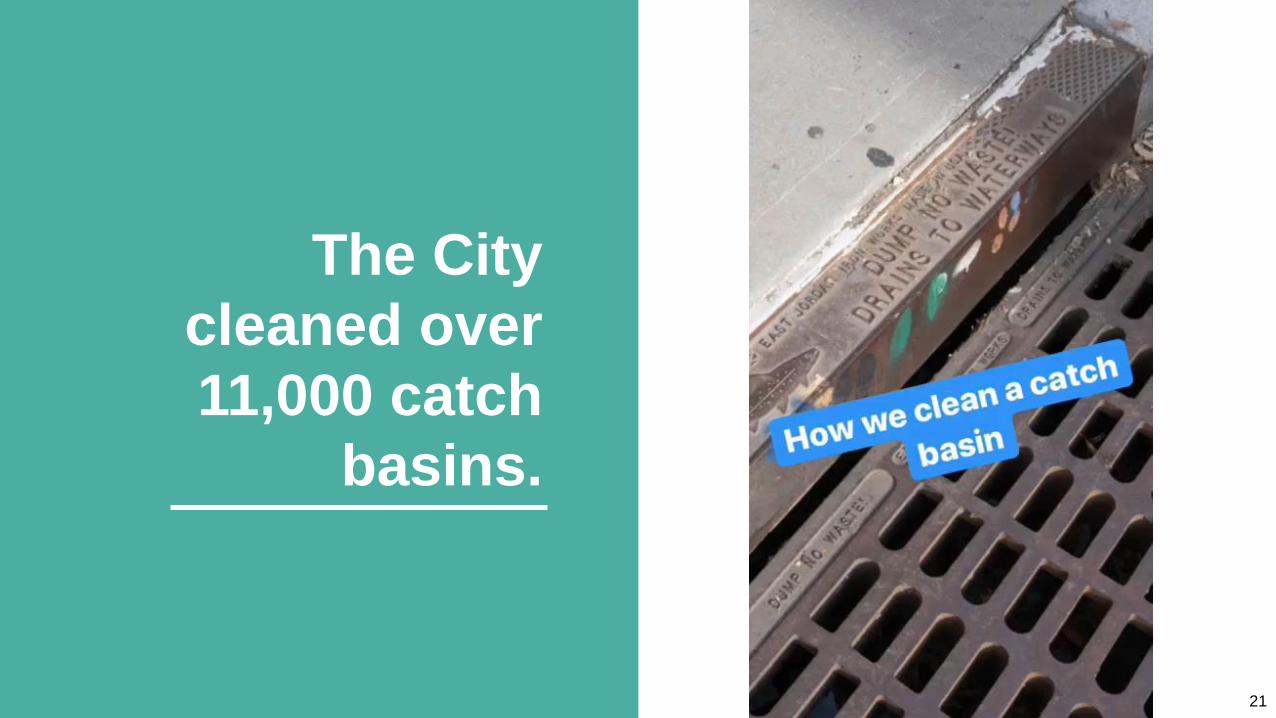
21
The City
cleaned over
11,000 catch
basins.

Monitoring and Assessment of Controls
Program Highlights:
• Collected a total of 23 water quality samples
• Collected flow meter data from 7 out of 8 sites
Planned Activities:
• Continue monitoring weather and collecting samples when feasible
Program Updates:
Based on current trends, it is highly unlikely DEP will collect 64 samples within two years of initiating Phase 1. At the end of the second year of sampling, DEP plans to analyze the data to determine whether to extend sampling beyond two years, or if the number of samples collected is sufficient for DEP to reliably correlate land use and pollutant load.
22Collection of stormwater samples

Outfall Borough Land UseTotal Samples
2019Flow Meter Data
HP-640 Bronx Mixed 3 Yes
HP-627 Bronx Open Space 3 Yes
TI-604 Queens Highway 3 Yes
TI-633 Queens High-Density Residential 3 Yes
TI-658 Queens Low-Density Residential 4 Yes
NCQ-632 Queens Industrial 3 Yes
OH-607 Brooklyn Industrial 1 No
OB-722 Staten Island Low-Density Residential 3 Yes
Monitoring and Assessment of Controls
Table 1: Phase 1 of Monitoring Program: Samples taken during 2019
22

Special Conditions for Impaired Waters
Coney Island Creek:
In 2019, Coney Island Creek was the only waterbody that
met MS4 Permit requirements for additional controls.
Additional Controls:
The City implemented additional programs to address the
pathogens and floatables in Coney Island Creek.
• Pet Waste Management
• Catch Basin Marking
• Signage Deployment
• Monitoring
• Source Tracking
• Public Education and Outreach
• Green Infrastructure
Coney Island Creek 23
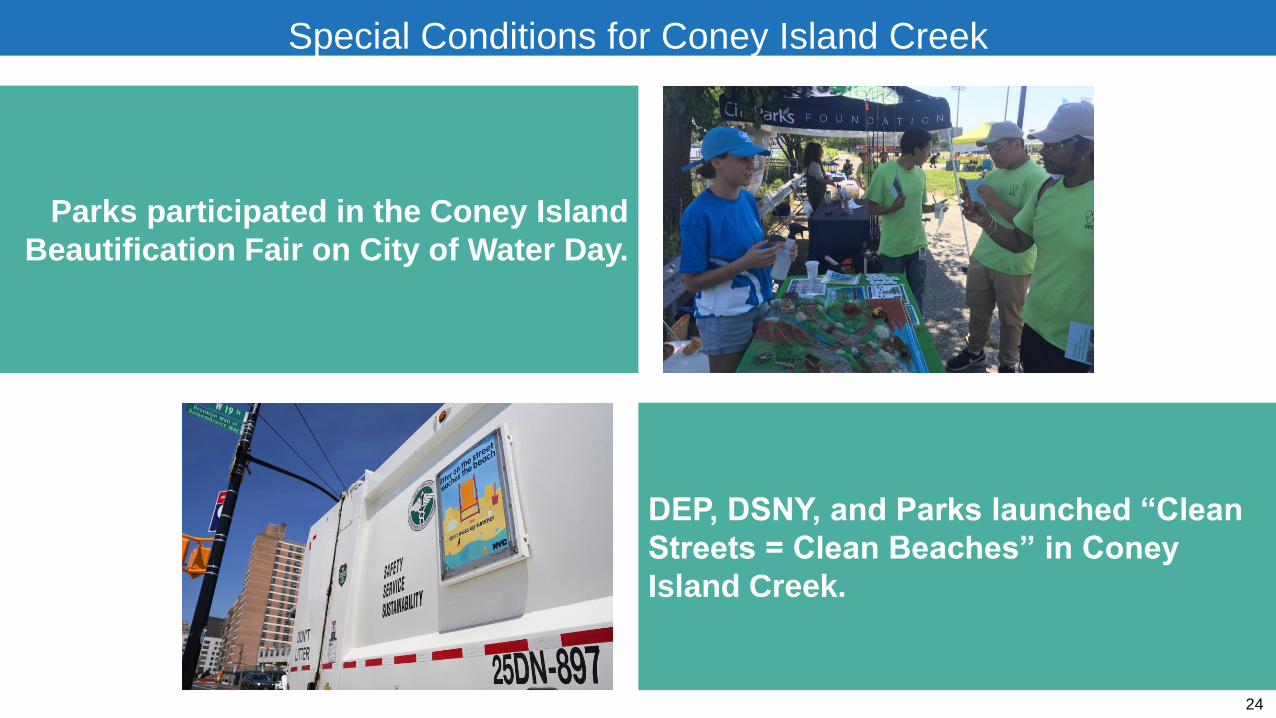
Special Conditions for Coney Island Creek
Parks participated in the Coney Island
Beautification Fair on City of Water Day.
DEP, DSNY, and Parks launched “Clean
Streets = Clean Beaches” in Coney
Island Creek.
24

2019 Case Study
FDNY and DEP partnered to build a water recovery facility at FDNY’s Randall’s Island Training Facility.
The new facility creates a closed loop system to recover and reuse the water needed to test and
calibrate the meters and equipment of the fleet’s pumper truck rig.
This project saves an estimated 30,000 gallons of potable water per day and significantly prevents run-
off and pollutants generated from this operation from getting into the waterways.
25

Examples are listed below:
1. Southeast Queens and Cloudburst Pilot Projects
2. Jamaica Bay CSO Long-Term Control Plan
26
Jamaica Bay CSO Long-Term Control Plan
NYC Green Infrastructure Program: Established in 2010, aims to
reduce CSOs into the waterbodies of NYC. DEP works with
partner agencies to design, construct, and maintain GI on City
streets, sidewalks, and other public property.

Jamaica Bay CSO Long-Term Control Plan
28
Jamaica Bay and Tributaries:
• Additional 379 greened acres in Bergen and
Thurston Basin tributary areas
• 7 acres of ribbed mussel colony creation
• 50,000 CY of environmental dredging in Bergen
Basin
• 50 acres of wetland restoration

• The Unified Stormwater Rule provides alignment of on-site
stormwater management requirements
• The Rule includes considerations for several stormwater related
goals/rules across city and state agencies:
o Water Quality, MS4 areas –retain and/or treat stormwater to
reduce pollutants in runoff
o Water Quality, CSS areas –retain and/or detain stormwater
to reduce CSO volume and occurrence
o Sewer Operations –detain or remove stormwater to maintain
optimal stormwater quantity and flow rates in the sewer
system
o Building/Site Drainage–adequate conveyance of on-site
stormwater to reduce local flooding
o Increase in Green Space –alignment with goals of 2019
Climate Mobilization Act
Unified Stormwater Rule
21

Unified Stormwater Rule
• Agency technical workshops - completed in April
• Intro No. 1851 hearing – pending reschedule date
• Industry outreach – pending reschedule dates
• CAPA initiated – estimated late summer or fall 2020
Original schedule, dates likely to change:
• Published rules: January 1, 2021
• Effective date of rules: July 1, 2021

Next Steps
Draft 2019 MS4 Annual Report
All public comments due to DEP June 25, 2020
Final Annual Report Submittal On or by September 30

For more information, visit our website: nyc.gov/dep/ms4
If you have questions or feedback, please contact the MS4 Team at:

Measurable Goals
Public Education and Outreach
34
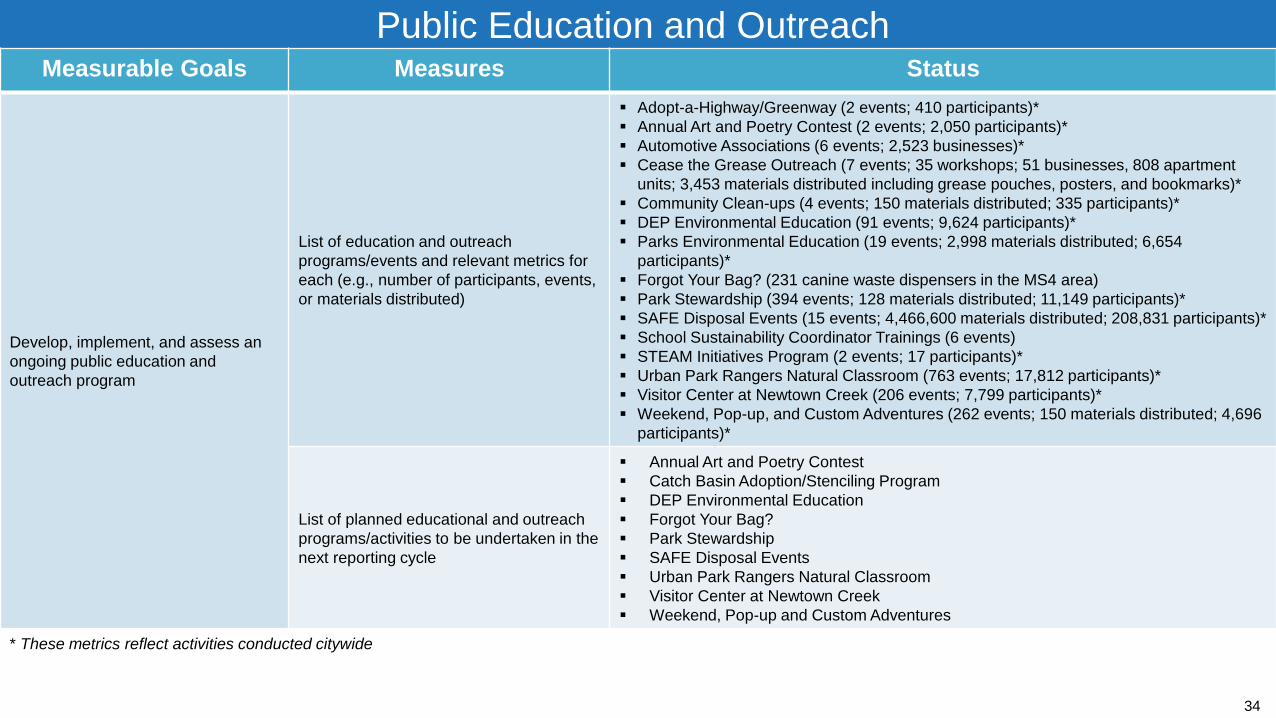
Measurable Goals Measures Status
Develop, implement, and assess an
ongoing public education and
outreach program
List of education and outreach
programs/events and relevant metrics for
each (e.g., number of participants, events,
or materials distributed)
▪ Adopt-a-Highway/Greenway (2 events; 410 participants)*
▪ Annual Art and Poetry Contest (2 events; 2,050 participants)*
▪ Automotive Associations (6 events; 2,523 businesses)*
▪ Cease the Grease Outreach (7 events; 35 workshops; 51 businesses, 808 apartment
units; 3,453 materials distributed including grease pouches, posters, and bookmarks)*
▪ Community Clean-ups (4 events; 150 materials distributed; 335 participants)*
▪ DEP Environmental Education (91 events; 9,624 participants)*
▪ Parks Environmental Education (19 events; 2,998 materials distributed; 6,654
participants)*
▪ Forgot Your Bag? (231 canine waste dispensers in the MS4 area)
▪ Park Stewardship (394 events; 128 materials distributed; 11,149 participants)*
▪ SAFE Disposal Events (15 events; 4,466,600 materials distributed; 208,831 participants)*
▪ School Sustainability Coordinator Trainings (6 events)
▪ STEAM Initiatives Program (2 events; 17 participants)*
▪ Urban Park Rangers Natural Classroom (763 events; 17,812 participants)*
▪ Visitor Center at Newtown Creek (206 events; 7,799 participants)*
▪ Weekend, Pop-up, and Custom Adventures (262 events; 150 materials distributed; 4,696
participants)*
List of planned educational and outreach
programs/activities to be undertaken in the
next reporting cycle
▪ Annual Art and Poetry Contest
▪ Catch Basin Adoption/Stenciling Program
▪ DEP Environmental Education
▪ Forgot Your Bag?
▪ Park Stewardship
▪ SAFE Disposal Events
▪ Urban Park Rangers Natural Classroom
▪ Visitor Center at Newtown Creek
▪ Weekend, Pop-up and Custom Adventures
* These metrics reflect activities conducted citywide

Measurable Goals Measures Status
Develop and implement educational
and informational activities related to
illicit discharges for businesses and
the general public
List of education and outreach
programs/events and relevant
metrics for each (e.g., number of
participants, events, or materials
distributed)
▪ Annual Art and Poetry Contest (2 events, 2,050 participants)*
▪ Cease the Grease Outreach (7 events; 35 workshops; 51 businesses, 808 apartment units;
3,453 materials distributed including grease pouches, posters, and bookmarks)*
▪ Community Clean-ups (4 events; 150 materials distributed; 335 participants)*
▪ DEP Environmental Education (91 events; 9,624 participants)*
▪ Parks Environmental Education (18 events; 2,983 materials distributed; 6,654 participants)*
▪ Forgot Your Bag? (231 canine waste dispensers in the MS4 area)
▪ Park Stewardship (394 events; 128 materials distributed; 11,149 participants)*
▪ SAFE Disposal Events (15 events; 4,466,600 materials distributed; 208,831 participants)*
▪ School Sustainability Coordinator Trainings (5 events)
▪ Urban Park Rangers Natural Classroom (763 events; 17,812 participants)*
▪ Visitor Center at Newtown Creek (206 events; 7,799 participants)*
▪ Weekend, Pop-up, and Custom Adventures (262 events; 150 materials distributed; 4,696
participants)*
List of planned educational and
outreach programs/activities to be
undertaken in the next reporting
cycle
▪ Annual Art and Poetry Contest
▪ DEP Environmental Education
▪ Forgot Your Bag?
▪ Park Stewardship
▪ SAFE Disposal Events
▪ Urban Park Rangers Natural Classroom
▪ Visitor Center at Newtown Creek
▪ Weekend, Pop-up, and Custom Adventures
Facilitate public reporting of illicit
discharges
Summary of public reports received
by 311
The City responded to 100% of the 9,384 service requests it received for the 311 complaint types
listed in this report as relevant to stormwater pollution.
Public Education and Outreach
* These metrics reflect activities conducted citywide
11

Public Involvement and Participation
Measurable Goals Measures Status
Identify mechanism for public to report and
request stormwater related information
including contact process to receive and
respond to requests
Summary of public reports and requests
received by [email protected]
The City responded to inquiries on different SWMP activities including MS4
construction project design standards, MS4 area location questions, PEO
program summary, and the process of uploading industrial facility information to
DEP.
Seek public input on SWMP implementation
and provide public access to Annual Reports
Date and location of draft Annual Report
posted for public review and comment period
On May 8, 2019, the City posted on the DEP website the draft 2018 MS4 Annual
Report. It was available for public comment through June 26, 2019.
Date and time of draft Annual Report
stakeholder meeting, and number of
participants.
May 21, 2019 at 6:30pm. Approximately 25 individuals participated.
Summary of comments received on draft
Annual Report and City responsesAppendix 1 – Public Comments on the 2019 MS4 Annual Report
List of involvement and participation activities
(e.g., programs, events, key stakeholder
meetings)
• 2018 MS4 Annual Report Public Meeting (25 participants)
• Coney Island Creek Community Workshop (50 participants)
• How to Get a Stormwater Construction Permit in NYC (28 participants)
• Overview of New DEP Stormwater Rules for Construction (30 participants)
• How to Use the Stormwater Permitting and Tracking System (6 events, 73
participants)
Status and location of final Annual Report
and the Plan
The SWMP Plan and most recent draft and final MS4 annual reports are available
at www.nyc.gov/dep/ms4
List of planned participation and involvement
programs/activities
• 2019 MS4 Annual Report Meeting
• Staten Island Builders Association Construction/Post-Construction Workshop
36

MappingMeasurable Goals Measures Status
Map in GIS-format, MS4
outfalls, and drainage areas
(Preliminary MS4 Map to be
submitted by August 1, 2018
and Final Map to be
submitted by August 1, 2020
Status and location of the MS4 MapPreliminary MS4 Map is online and available to the public
at nyc.gov/dep/ms4map
Number and percent of MS4 outfalls mapped460; 90.2% *
Update Final MS4 Map every
5 yearsDate of latest MS4 Map updated submittal August 1, 2018
37
*As of March 2018, DEP had classified 460 outfalls as MS4 outfalls. The Preliminary MS4 Map, submitted to NYSDEC in August 2018, included those 460 outfalls. Accordingly,
the 2018 MS4 Annual Report reported that 100% of MS4 outfalls had been mapped. By March 2019, DEP had classified 510 outfalls as MS4 outfalls. Because the City will not
update the MS4 Map until 2020, this 2019 MS4 Annual Report reflects that the current map depicts approximately 90% of known outfalls (the 460 included in the Preliminary
Map out of the 510 classified as MS4). After 2020, the City must update the map every 5 years. In years in which the City does not update the map, similar discrepancies may
exist

Illicit Discharge Detection and EliminationMeasurable Goals Measures Status
Detect and eliminate illicit discharges including illegal
dumping
Number of illicit discharges detected 1,102*
Number of illicit discharges abated 1,090*
Number and type of enforcement actions and
penalties issued
DEP issued 147 summons ($102,645 in
penalties) and 2 Commissioner’s Orders;
DSNY issued 417 summons†
Conduct an outfall reconnaissance inventory with
100% completed every 10 years
Updated outfall spreadsheet submitted to
NYDECAppendix 2 – SPDES outfall listing
Percent of known MS4 outfalls inventoried 6%
Special Report for waterbodies with fecal coliform
above 200 colonies/100ml and for unauthorized non-
stormwater discharges within 3 years of August 1,
2018 and annually thereafter
Date Integrated Sentinel Monitoring Report
submitted to NYSDECExpected June 2020
Implement a public education program on potential
hazards of illicit dischargesList of education activities for public employees PP/GH Agency Staff Training
Implement a staff training program on IDDE
Number of staff training opportunities/events 11 events
Number of DEP staff trained on IDDE 67 participants total§
38
* number includes illicit discharges detected/abated by DEP Emergency Response Unit citywide and by agencies on-site at municipal facilities in the PP/GH inventory† the spreadsheet is a full listing of CSO and MS4 outfalls.‡ number represents January 1 to December 31, 2018
§ participants total includes those who attended multiple training events

Measurable Goals Measures Status
Implement a public
education program on
potential hazards of illicit
discharges
List of education and
outreach
programs/events for
the general public and
businesses, and
relevant metric(s) for
each (e.g., number of
participants, events, or
materials distributed)
• Annual Art and Poetry Contest (2 events, 2,050 participants) ¶
• Cease the Grease (7 events; 35 workshops; 51 businesses, 808 apartment units; 3,453
materials distributed including grease pouches, posters, and bookmarks) ¶
• Community Clean-ups (4 events; 150 materials distributed; 335 participants) ¶
• DEP Environmental Education (91 events; 9,624 participants) ¶
• Parks Environmental Education (18 events; 2,983 materials distributed; 6,654 participants) ¶
• Forgot Your Bag? (231 canine waste dispensers in the MS4 area)
• Park Stewardship (394 events; 128 materials distributed; 11,149 participants) ¶
• SAFE Disposal Events (15 events; 4,466,600 materials distributed; 208,831 participants) ¶
• School Sustainability Coordinator Trainings (5 events) ¶
• Urban Park Rangers Natural Classroom (763 events; 17,812 participants) ¶
• Visitor Center at Newtown Creek (206 events; 7,799 participants)¶
• Weekend, Pop-up, and Custom Adventures (262 events; 150 materials distributed; 4,696
participants) ¶
List of planned
educational and
outreach
programs/activities to
be under- taken in next
reporting cycle
▪ Annual Art and Poetry Contest
▪ DEP Environmental Education
▪ Forgot Your Bag?
▪ Park Stewardship
▪ SAFE Disposal Events
▪ Urban Park Rangers Natural Classroom
▪ Visitor Center at Newtown Creek
▪ Weekend, Pop-up and Custom Adventures
18
Illicit Discharge Detection and Elimination
¶ these metrics reflect activities conducted citywide

Construction/Post-ConstructionMeasurable Goals Measures Status
Review and approve
SWPPPs
Number of SWPPPs reviewed 18
Number of SWPPPs approved with and without post-construction stormwater management
facilities3
Number of Stormwater Construction Permits issued 2
Inspect construction sites
and enforce Stormwater
Construction Permits
Number of active construction sites 1
The percent of active Stormwater Construction Permit sites inspected once 0*
The percent of active Stormwater Construction Permit sites inspected more than once 0*
Number and type of enforcement actions and penalties issued 0
Number of construction site stormwater control trainings planned or completed 9 completed, 1 planned
Inspect post-construction
sites and enforce
Stormwater Maintenance
Permits
Number of Stormwater Maintenance Permits issued 0†
Number of Flood Management Projects and existing structural flood control devices evaluated 0†
Number and type of enforcement actions and penalties issued 0†
Number of post-construction SMPs, including type of practice and contributing impervious area 0†
Number and type of SMPs inspected 0†
Number and type of SMPs properly maintained as determined by inspections 0†
Number of individuals trained in inspection of long-term operation and maintenance of post-
construction SMPs
6 events, 22 participants
total‡
40
* construction at the permitted site did not begin until December 2019
† No projects with MS4 construction permits have reached a stage that would require maintenance of SMPs
‡ participants total includes those who attended multiple training events
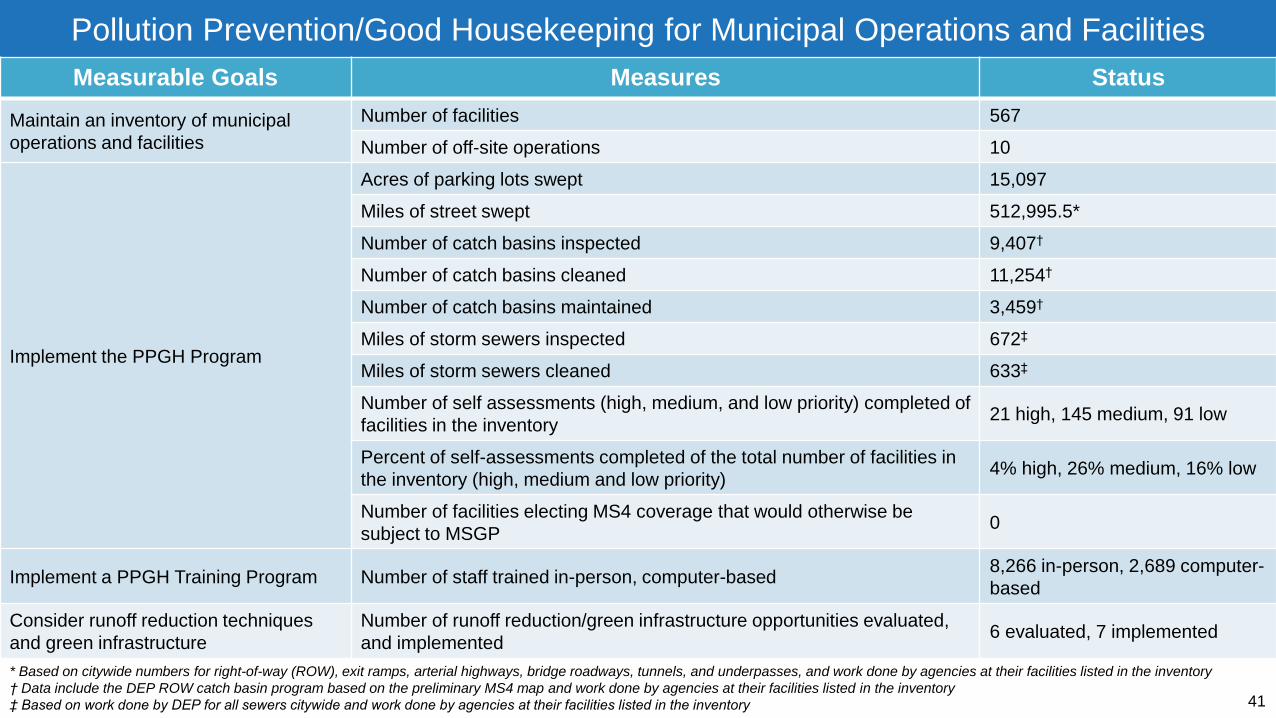
Pollution Prevention/Good Housekeeping for Municipal Operations and Facilities
Measurable Goals Measures Status
Maintain an inventory of municipal
operations and facilities
Number of facilities 567
Number of off-site operations 10
Implement the PPGH Program
Acres of parking lots swept 15,097
Miles of street swept 512,995.5*
Number of catch basins inspected 9,407†
Number of catch basins cleaned 11,254†
Number of catch basins maintained 3,459†
Miles of storm sewers inspected 672‡
Miles of storm sewers cleaned 633‡
Number of self assessments (high, medium, and low priority) completed of
facilities in the inventory21 high, 145 medium, 91 low
Percent of self-assessments completed of the total number of facilities in
the inventory (high, medium and low priority)4% high, 26% medium, 16% low
Number of facilities electing MS4 coverage that would otherwise be
subject to MSGP0
Implement a PPGH Training Program Number of staff trained in-person, computer-based8,266 in-person, 2,689 computer-
based
Consider runoff reduction techniques
and green infrastructure
Number of runoff reduction/green infrastructure opportunities evaluated,
and implemented6 evaluated, 7 implemented
41
* Based on citywide numbers for right-of-way (ROW), exit ramps, arterial highways, bridge roadways, tunnels, and underpasses, and work done by agencies at their facilities listed in the inventory
† Data include the DEP ROW catch basin program based on the preliminary MS4 map and work done by agencies at their facilities listed in the inventory
‡ Based on work done by DEP for all sewers citywide and work done by agencies at their facilities listed in the inventory

Industrial/Commercial Stormwater SourcesMeasurable Goals Measures Status
Implement an inspection and assessment
program for unpermitted industrial and
commercial sources
Status of the inspection program and stormwater
controls for unpermitted industrial and commercial
facilities
DEP performed 79 unpermitted facility
assessments. Three of these facilities were
referred to NYSDEC for SPDES no-exposure
coverage.
Implement an inspection program for MSGP
Permit holders based on priority
Number of SPDES MSGP facilities inspected (high,
medium and low priority)2 high, 0 medium, and 2 low
Number of non-compliant SPDES MSGP facilities 4
Number of repeat noncompliant SPDES MSGP
facilities0
Number and type of enforcement actions completed
and penalties issued0
42

Control of Floatable and Settleable Trash and DebrisMeasurable Goals Measures Status
Determine Loading Rate of
Floatable Trash and Debris
discharged from MS4 to
waterbodies impaired for
floatables
Status of Loading Rate Study
During this reporting period, the City analyzed collected data to identify
catch basins that may be suitable monitoring sites for the Loading Rate
Study, began field reconnaissance of potential monitoring sites, and
conducted equipment testing. The City also submitted a schedule for
the loading rate study which anticipates that the study will commence
by March 14, 2021 and conclude by March 14 2024.
Continue DEP’s Catch Basin
Inspection, Cleaning, and Hood
Replacement Program
Number of catch basins inspected, cleaned
and retrofitted
9,407* catch basins inspected, 11,254* catch basins cleaned, and 0
catch basins retrofitted
Number of catch basins hoods repaired,
installed or replaced872
Continue DEP’s Boom and
Netting Program
Date of Combined Sewer Overflows Best
Management Practices annual report with
Floatables Control Program results
May 1, 2019
Implement a Public Education
Program on Floatables
List of education and outreach
programs/events and relevant metrics for
each.
• Automotive Associations (6 events; 2,523 businesses)†
• Community Clean-ups (4 events; 150 materials distributed; 335
participants)†
• Parks Environmental Education (2 events; 125 materials
distributed; 160 participants)†
• Park Stewardship (15 events; 128 materials
distributed; 1,757 participants)†
• SAFE Disposal Events (15 events; 4,466,600 materials distributed;
208,831 participants)†
43
* Data include the DEP ROW catch basin program based on the preliminary MS4 map and work done by agencies at their facilities listed in the PPGH inventory
† these metrics reflect activities conducted citywide

Special Conditions for Coney Island Creek
Program Update
Pet waste
managementPet waste bag dispensers and signage were maintained in both Calvert Vaux and Kaiser Park.
Catch basin marking
The City continued to include a “no dumping” message on newly installed catch basin curb pieces throughout the City. DEP also
continued to internally explore the feasibility of a volunteer catch basin stenciling program. DEP plans to provide stenciling
materials and guidance to local communities in 2020.
Signage deployment
DEP placed signage at key MS4 outfalls in Coney Island Creek in 2017. The City evaluated the pilot in 2019. Based on the low
volume of 311 reports citywide for dry weather discharges and only one report submitted for Coney Island Creek during the two
years the signs were installed, the City will discontinue with MS4 outfall signage. The City will update the SWMP Plan to include
the results of the pilot.
Monitoring
DEP had identified a location for an additional Sentinel Monitoring station in Coney Island Creek as part of its proposed revisions
to the Sentinel Monitoring Program. Pending approval by NYSDEC, DEP plans to implement the revised program in 2020, which
includes an additional monitoring station in Coney Island Creek.
Source tracking
DEP is assessing a variety of enhanced source trackdown methods for waterbodies that have proven to be particularly
challenging. In these cases, traditional source trackdown methods may benefit from the use of supplemental new technologies or
approaches. DEP may apply lessons learned from that program to future source trackdown efforts, if applicable.34
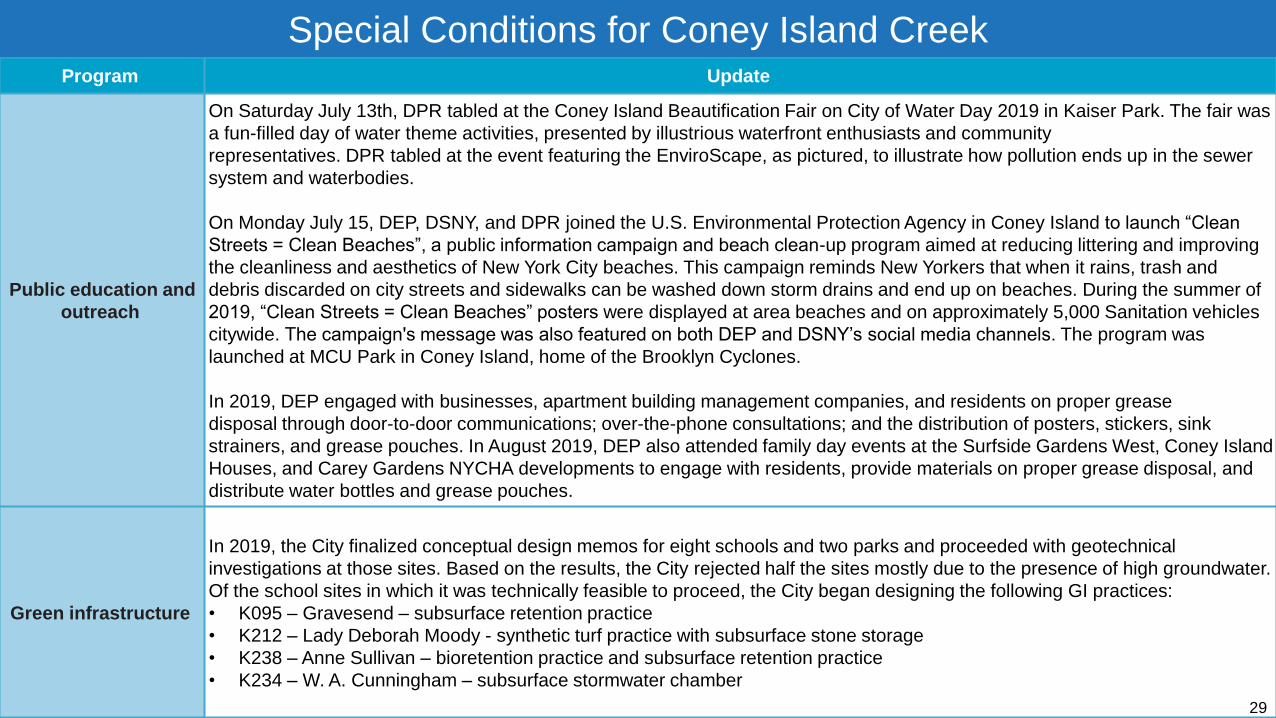
Program Update
Public education and
outreach
On Saturday July 13th, DPR tabled at the Coney Island Beautification Fair on City of Water Day 2019 in Kaiser Park. The fair was
a fun-filled day of water theme activities, presented by illustrious waterfront enthusiasts and community
representatives. DPR tabled at the event featuring the EnviroScape, as pictured, to illustrate how pollution ends up in the sewer
system and waterbodies.
On Monday July 15, DEP, DSNY, and DPR joined the U.S. Environmental Protection Agency in Coney Island to launch “Clean
Streets = Clean Beaches”, a public information campaign and beach clean-up program aimed at reducing littering and improving
the cleanliness and aesthetics of New York City beaches. This campaign reminds New Yorkers that when it rains, trash and
debris discarded on city streets and sidewalks can be washed down storm drains and end up on beaches. During the summer of
2019, “Clean Streets = Clean Beaches” posters were displayed at area beaches and on approximately 5,000 Sanitation vehicles
citywide. The campaign's message was also featured on both DEP and DSNY’s social media channels. The program was
launched at MCU Park in Coney Island, home of the Brooklyn Cyclones.
In 2019, DEP engaged with businesses, apartment building management companies, and residents on proper grease
disposal through door-to-door communications; over-the-phone consultations; and the distribution of posters, stickers, sink
strainers, and grease pouches. In August 2019, DEP also attended family day events at the Surfside Gardens West, Coney Island
Houses, and Carey Gardens NYCHA developments to engage with residents, provide materials on proper grease disposal, and
distribute water bottles and grease pouches.
Green infrastructure
In 2019, the City finalized conceptual design memos for eight schools and two parks and proceeded with geotechnical
investigations at those sites. Based on the results, the City rejected half the sites mostly due to the presence of high groundwater.
Of the school sites in which it was technically feasible to proceed, the City began designing the following GI practices:
• K095 – Gravesend – subsurface retention practice
• K212 – Lady Deborah Moody - synthetic turf practice with subsurface stone storage
• K238 – Anne Sullivan – bioretention practice and subsurface retention practice
• K234 – W. A. Cunningham – subsurface stormwater chamber
29
Special Conditions for Coney Island Creek

Monitoring and Assessment of Controls
Measurable Goals Measures Status
Conduct wet weather sampling from
outfall/manholes
Results of monitoring data collected and
analyzed
Phase 1 monitoring began in February 2019 and
DEP was able to collect 23 samples total.
46

Recordkeeping and ReportingMeasurable Goals Measures Status
Develop Annual Reports after submission of the
Plan due September 30 following each reporting
year
Summary of annual effectiveness assessmentSee effectiveness assessment of each program
under pertinent subsections of this report.
Municipal Compliance Certification submissionAppendix 3 – Municipal Compliance
Certification
30