2019 half year results and amp strategy · 2019. 8. 7. · amp 2019 half year results 10 amp life 1...
TRANSCRIPT
2019 half year results and AMP strategy Francesco De Ferrari, Chief Executive OfficerGordon Lefevre, Chief Financial Officer
8 August 2019
For
per
sona
l use
onl
y
Executive summary
Section 1 AMP 2019 half year results
1H 19 results - Challenging first half as AMP transitions and fundamentally de-risks the business; underlying profit of A$309m (1H 18: A$495m)
- A$2.35b impairments, predominantly non-cash, to address legacy issues and position AMP for the future
- Client remediation program on track and in line with initial estimate
AMP Life update - Revised agreement delivers consideration of A$3.0 billion comprising:
- A$2.5 billion in cash; and
- A$500 million equity interest (expected to be around 20%) in Resolution Life Australia - new Australian-domiciled, Resolution Life-controlled holding company which will become the owner of AMP Life
AMP strategy– Three-year transformational strategy towards a client-led, simpler, growth-oriented business
– A$1.0-1.3b investment program to drive growth, significantly reduce costs and de-risk the business
– Simpler and leaner business, delivering annual run-rate cost savings of approximately A$300m by FY 22
– Reinvigorated culture; client-led, entrepreneurial and accountable
Reinventing Australian wealth management
– Reinvent business to capitalise on industry disruption. Address legacy issues head on; reshape aligned advice and simplify super to improve client outcomes
– Further integrate banking solutions with wealth management to increase client engagement; deliver double digit earnings growth in Bank over medium term
Leading global investment manager (AMP Capital)
– Drive differentiated capabilities and pursue international growth opportunities to deliver double digit earnings growth over medium term (through the cycle)
New Zealand wealth management
– Localise and autonomise; explore options to divest
Capital and dividend – Surplus capital of A$1.7b above minimum regulatory requirements (MRR); in line with AMP Board’s target surplus requirements
– 1H 19 dividend will not be paid; Board to maintain consistent approach to capital management until completion of AMP Life sale; new dividend policy post-sale
– Fully underwritten A$650 million equity capital raising launched via placement to institutional investors and additional share purchase plan. Proceeds to be used to commence implementation of strategy, fund growth in core businesses and provide balance sheet strength ahead of AMP Life sale
– Post-sale and capital raising, proforma eligible capital above MRR expected to be A$2.6b; excess above target surplus will first be used to fund strategy. Beyond this, all capital management options will be assessed and the Board intends to return capital in excess of target surplus to shareholders, subject to unforeseen circumstances
2
For
per
sona
l use
onl
y

Agenda
Section one
Section two
Section three
Section four
1H 19 results
AMP Life update
AMP Strategy
Appendix
For
per
sona
l use
onl
y

1H 19 ResultsSection one
For
per
sona
l use
onl
y

1H 19 profit summary
Section 1 AMP 2019 half year results 5
Notes:
1. Internal distribution fees and product revenues for AMP Life excluded from Australian and New Zealand wealth management businesses from 1H 19
2. AMP Capital is 15% owned by MUFG: Trust Bank (formerly MUTB). AMP Capital results, and any other impacted line items, are shown net of minority interests
3. AMP Life refers to AMP’s wealth protection and mature businesses in Australia and New Zealand which are subject to a sale agreement with Resolution Life
A$m 1H 191 2H 18 1H 18 (%) 1H 19/1H 18
Australian wealth management 103 159 204 (49.5)
New Zealand wealth management 22 25 28 (21.4)
AMP Capital2 120 73 94 27.7
AMP Bank 71 70 78 (9.0)
Retained businesses operating earnings 316 327 404 (21.8)
AMP Life operating earnings 3 31 (102) 99 (68.7)
Business unit operating earnings 347 225 503 (31.0)
Group Office costs (59) (47) (29) (103.4)
Total operating earnings 288 178 474 (39.2)
Underlying investment income 55 44 52 5.8
Interest expense on corporate debt (34) (37) (31) (9.7)
Underlying profit 309 185 495 (37.6)
Items reported below underlying profit (2,549) (285) (425) n/a
Market adjustments (47) (5) 13 n/a
Accounting mismatches (5) 18 32 n/a
Profit/(loss) attributable to shareholders of AMP Limited (2,292) (87) 115 n/a
For
per
sona
l use
onl
y

Australian wealth management
Challenging and competitive environment; focus on improving client outcomes
6Section 1 AMP 2019 half year results
Comparison with prior periods
– Operating earnings impacted by removal of distribution arrangements with AMP Life, margin compression and higher controllable costs
– Decrease in other revenue following removal of distribution arrangements with AMP Life
– Controllable costs increased as a result of the inclusion of regulatory and compliance project costs for implementing major change, as well as higher project costs
Business drivers
– Continued commitment to improving client outcomes including fee reductions for MySuper offer and MyNorth wrap platform
– Margin compression of 6 bps from 2H 18 includes impact of products transferring to Resolution Life (3 bps), MySuper fee reductions (2 bps) and moving clients to contemporary solutions such as MyNorth (1 bps)
– Lower inflows and elevated outflows reflect ongoing reputational impact and adviser focus on client retention
Notes:
1. Investment related revenue refers to revenue on superannuation, retirement income and investment products
2. Operating earnings (restated) excludes internal distribution fees and product revenues that are for the benefit of AMP Life
3. Based on average of monthly average AUM
4. Excludes SuperConcepts AUA
Key performance measures 1H 19 2H 18 1H 18
Investment-related revenue (A$m)1 540 594 619
Other revenue(A$m) 17 39 57
Controllable costs (A$m) (247) (239) (223)
Operating earnings (A$m) 103 159 204
Operating earnings (restated) (A$m)2 103 117 161
Average AUM (A$b)3 128.8 130.0 130.3
Total net cashflows (A$b) (3.1) (3.1) (0.9)
Investment-related revenue to AUM (bps)1 ,3, 4 85 91 96
Cost to income ratio 61.3% 50.1% 42.9%
For
per
sona
l use
onl
y
Resilient business performance
7Section 1 AMP 2019 half year results
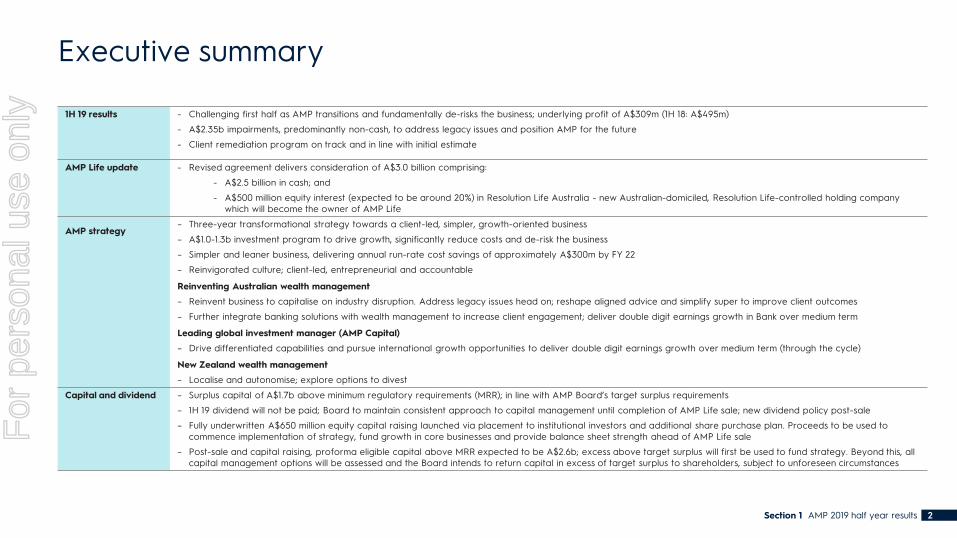
New Zealand wealth management
Comparison with prior periods
– Operating earnings impacted by removal of product revenues transferring with the sale of AMP Life
Business drivers
– Leading provider of KiwiSaver (approximately 10% of the total market), which continues to generate positive cashflows
– Higher cash outflows driven by increased competition and retirement withdrawals
Notes:
1. Operating earnings (restated) excludes product revenues that are for the benefit of AMP Life
2. Based on average of monthly average AUM
Key performance measures 1H 19 2H 18 1H 18
Controllable costs (A$m) (18) (17) (16)
Operating earnings (A$m) 22 25 28
Operating earnings (restated) (A$m)1 22 19 22
Average AUM (A$b)2 11.7 11.2 11.1
Total net cashflows(A$m) (250) 33 50
Operating earnings to AUM (bps)2 37 44 51
Cost to income ratio 36.9% 32.9% 29.1%
For
per
sona
l use
onl
y
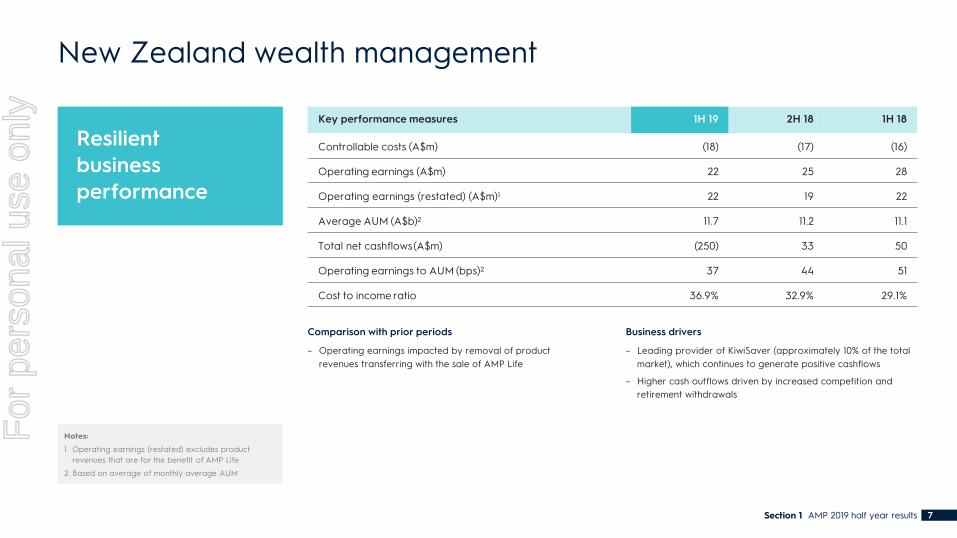
Continued mortgage and deposit growth in slowing housing market
8Section 1 AMP 2019 half year results
AMP Bank
Comparison with prior periods
– Operating profit impacted by inclusion of regulatory and compliance project costs for implementing major change into controllable costs
Business drivers
– Lending market share position maintained in slower housing market; total loan book grew to A$20.2b
– Strong deposit growth of 9% on 1H 18 largely from increased term and at-call deposits; reflects move towards a more deposit-led funded strategy
– 90+ day mortgage arrears increased, but remain below industry average of 1%; strong asset quality maintained
– Net interest margin resilient despite increased funding costs and competitive lending environment
Key performance measures 1H 19 2H 18 1H 18
Operating profit (A$m) 71 70 78
Residential mortgage book (A$m) 19,690 19,460 19,680
Controllable costs (A$m) (55) (50) (45)
Deposits (A$m) 13,868 13,304 12,707
Net interest margin 1.70% 1.67% 1.72%
Cost to income ratio 35.3% 33.6% 28.7%
Return on capital 14.1% 13.5% 16.7%
90+ day mortgage arrears 0.63% 0.47% 0.44%
Liquidity coverage ratio 154% 139% 133%
For
per
sona
l use
onl
y
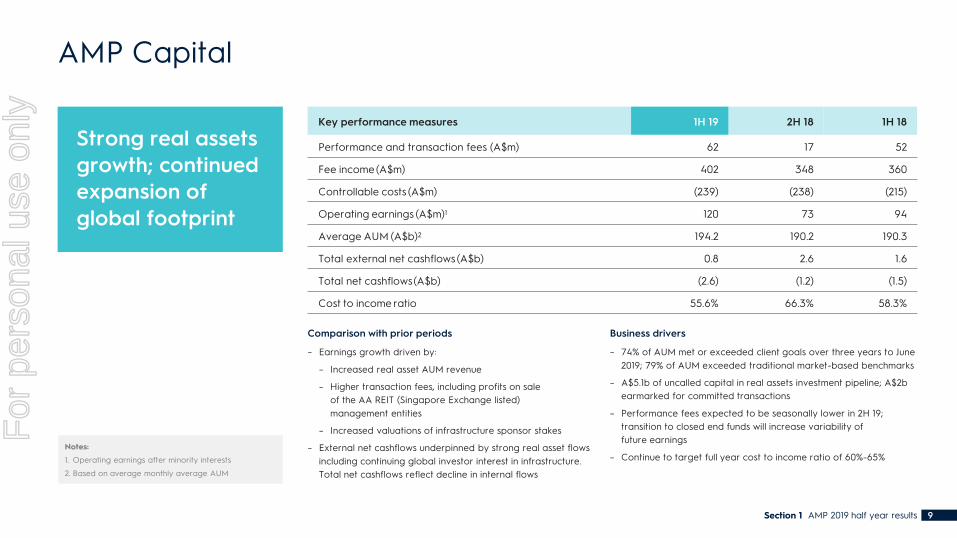
Strong real assets growth; continued expansion of global footprint
9Section 1 AMP 2019 half year results
AMP Capital
Comparison with prior periods
– Earnings growth driven by:
– Increased real asset AUM revenue
– Higher transaction fees, including profits on sale of the AA REIT (Singapore Exchange listed) management entities
– Increased valuations of infrastructure sponsor stakes
– External net cashflows underpinned by strong real asset flows including continuing global investor interest in infrastructure. Total net cashflows reflect decline in internal flows
Business drivers
– 74% of AUM met or exceeded client goals over three years to June 2019; 79% of AUM exceeded traditional market-based benchmarks
– A$5.1b of uncalled capital in real assets investment pipeline; A$2b earmarked for committed transactions
– Performance fees expected to be seasonally lower in 2H 19; transition to closed end funds will increase variability of future earnings
– Continue to target full year cost to income ratio of 60%-65%Notes:
1. Operating earnings after minority interests
2. Based on average monthly average AUM
Key performance measures 1H 19 2H 18 1H 18
Performance and transaction fees (A$m) 62 17 52
Fee income(A$m) 402 348 360
Controllable costs (A$m) (239) (238) (215)
Operating earnings (A$m)1 120 73 94
Average AUM (A$b)2 194.2 190.2 190.3
Total external net cashflows(A$b) 0.8 2.6 1.6
Total net cashflows(A$b) (2.6) (1.2) (1.5)
Cost to income ratio 55.6% 66.3% 58.3%
For
per
sona
l use
onl
y
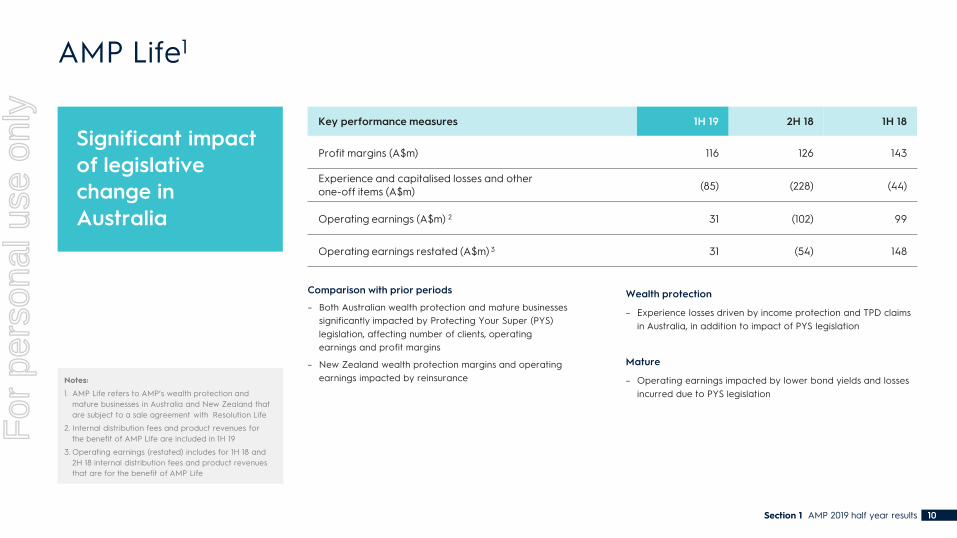
Significant impact of legislative change in Australia
10Section 1 AMP 2019 half year results
AMP Life1
Comparison with prior periods
– Both Australian wealth protection and mature businesses significantly impacted by Protecting Your Super (PYS) legislation, affecting number of clients, operating earnings and profit margins
– New Zealand wealth protection margins and operating earnings impacted by reinsurance
Wealth protection
– Experience losses driven by income protection and TPD claims in Australia, in addition to impact of PYS legislation
Mature
– Operating earnings impacted by lower bond yields and losses incurred due to PYS legislation
Notes:
1. AMP Life refers to AMP’s wealth protection and mature businesses in Australia and New Zealand that are subject to a sale agreement with Resolution Life
2. Internal distribution fees and product revenues for the benefit of AMP Life are included in 1H 19
3. Operating earnings (restated) includes for 1H 18 and 2H 18 internal distribution fees and product revenues that are for the benefit of AMP Life
Key performance measures 1H 19 2H 18 1H 18
Profit margins (A$m) 116 126 143
Experience and capitalised losses and other one-off items (A$m) (85) (228) (44)
Operating earnings (A$m) 2 31 (102) 99
Operating earnings restated (A$m) 3 31 (54) 148
For
per
sona
l use
onl
y

Controllable costs
Section 1 AMP 2019 half year results 11
– Controllable costs (ex AMP Capital) up 17% on 1H 18 reflecting:
– Regulatory and compliance costs for implementing major change now moved into business units. 1H 19 costs were: Australian wealth management (A$4m), AMP Bank (A$7m) and Group Office (A$14m)
– Increase in professional indemnity insurance costs
– CPI and wages growth
– As noted in FY 18 results, FY 19 controllable costs (ex AMP Capital) expected to increase by approximately A$100m
– As part of the new strategy, AMP will create a simpler and leaner business and reduce costs over the medium term
A$m
1H 18 controllable costs ex AMP Capital
1H 19 controllable costs ex AMP Capital
41
18
15
Regulatory, compliance and insurance costs
Project costs
CPI and wages growth
427
1H 18 rebased
controllable costs
468
501
For
per
sona
l use
onl
y

Key financial items outside business unit results
Section 1 AMP 2019 half year results 12
– Client remediation on track and in line with current estimate; 1H 19 spend reflects further half year of client lost earnings and related costs
– Separation costs reflect ramp up of AMP Life separation activities
– Risk management, governance and controls program on track; 1H 19 spend is part of the committed A$100m (pre-tax) investment over two years
– Impairment reflects actions taken to address legacy issues and position AMP for the future
– Market adjustments predominantly due to the impact of falling bond yields on the valuation of risk insurance liabilities
A$m 1H 19 2H 18 1H 18 (%) 1H 19/1H 18
Underlying profit 309 185 495 (37.6)
Client remediation and related costs (41) (157) (312) 86.9
Royal Commission – (19) (13) n/a
Portfolio Review – (10) (19) n/a
Separation costs (89) (19) – n/a
Risk management, governance and controls (17) (8) – n/a
Other items (5) (33) (41) 87.8
Impairments (2,352) - - n/a
Amortisation of acquired intangible assets (45) (39) (40) (12.5)
Profit/(loss) before market adjustments and accounting mismatches (2,240) (100) 70 n/a
Market adjustments (47) (5) 13 n/a
Accounting mismatches (5) 18 32 n/a
Profit/(loss) attributable to shareholders of AMP Limited (2,292) (87) 115 n/a
For
per
sona
l use
onl
y

Client remediation program on track and in line with initial estimate
13Section 1 AMP 2019 half year results
Client remediation and associated costs
– On track to complete remediation program in 2021; program remains in line with initial estimate, including both aligned and employed advisers
– Total program spend (including program costs and money repaid to clients) is A$60m to date
– Program designed to scale post initial design phase; execution accelerated considerably in 1H 19 and will continue to accelerate in 2H 19
– Major policies agreed with ASIC
– AMP has a number of potential recovery options to partially offset these remediation costs in the medium term, which are being actively pursued
Notes:
1. Payments include client payments and program costs
2. Expected total remediation costs include estimates of future lost earnings which are not included in the provision under accounting standards, and other minor methodology differences
A$m Pre-tax
Opening provision balance at 1H 19 656
Less payments made during 1H 191 (31)
Additional lost earnings recognised during 1H 19 11
Net movement in estimation of client remediation payments 3
Additional program costs 33
Closing provision balance at 1H 19 672
Expected total future remediation costs still to be paid2 708
For
per
sona
l use
onl
y
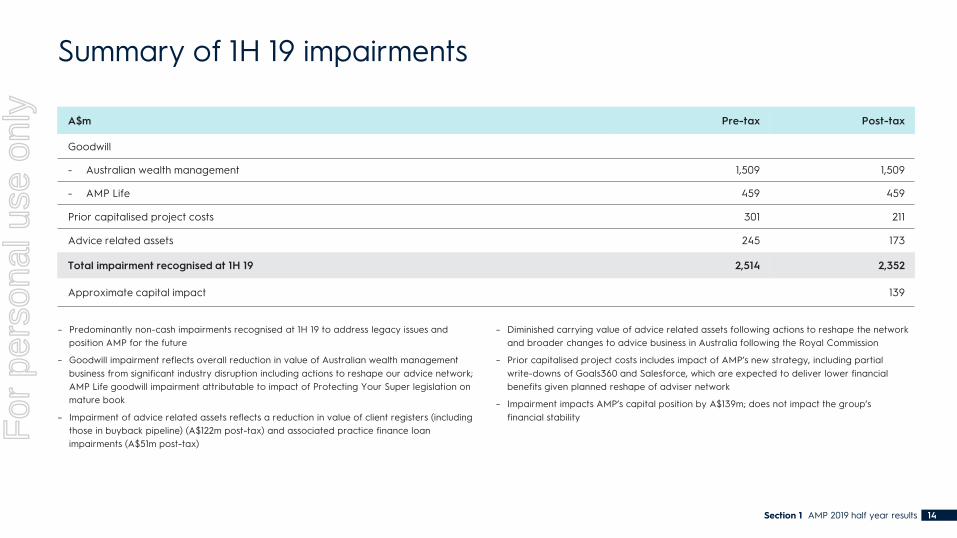
Summary of 1H 19 impairments
Section 1 AMP 2019 half year results 14
A$m Pre-tax Post-tax
Goodwill
- Australian wealth management 1,509 1,509
- AMP Life 459 459
Prior capitalised project costs 301 211
Advice related assets 245 173
Total impairment recognised at 1H 19 2,514 2,352
Approximate capital impact 139
– Predominantly non-cash impairments recognised at 1H 19 to address legacy issues and position AMP for the future
– Goodwill impairment reflects overall reduction in value of Australian wealth management business from significant industry disruption including actions to reshape our advice network; AMP Life goodwill impairment attributable to impact of Protecting Your Super legislation on mature book
– Impairment of advice related assets reflects a reduction in value of client registers (including those in buyback pipeline) (A$122m post-tax) and associated practice finance loan impairments (A$51m post-tax)
– Diminished carrying value of advice related assets following actions to reshape the network and broader changes to advice business in Australia following the Royal Commission
– Prior capitalised project costs includes impact of AMP’s new strategy, including partial write-downs of Goals360 and Salesforce, which are expected to deliver lower financial benefits given planned reshape of adviser network
– Impairment impacts AMP’s capital position by A$139m; does not impact the group’s financial stability
For
per
sona
l use
onl
y

Capital adequacy, funding and liquidity
Section 1 AMP 2019 half year results 15
– Level 3 eligible capital of A$3.0b, with level 3 eligible capital above Minimum Regulatory Requirements (MRR) of A$1.7b at 30 June 2019, in line with the Board’s target surplus requirements. The target surplus in place to protect the adequacy of the capital position by maintaining a sufficient surplus to reduce the risk of breaching the MRR reflecting accepted industry and prudential standards
– Of the total Group Level 3 eligible capital position of A$1.7b, A$821m is attributable to Life participating business
A$m 1H 19 FY 18
Shareholderequity 4,307 6,683
Less: intangibles and other regulatory adjustments (1,267) (3,606)
Level 3 eligible capital 3,040 3,077
Minimum Regulatory Requirements (MRR) 1,346 1,426
Level 3 eligible capital above MRR 1,694 1,651
Debt metrics and liquidity 1H 19 FY 18
Corporate debt(A$m) 1,909 1,849
Undrawn loan facilities (A$m) 1,000 1,000
– A$500m syndicated loan repaid in 1H 19 and replaced by A$623m of bond issuances
– The AMP Board has resolved not to declare a first half 2019 dividend. The Board will maintain a consistent approach to capital management until the completion of the sale of AMP Life
For
per
sona
l use
onl
y
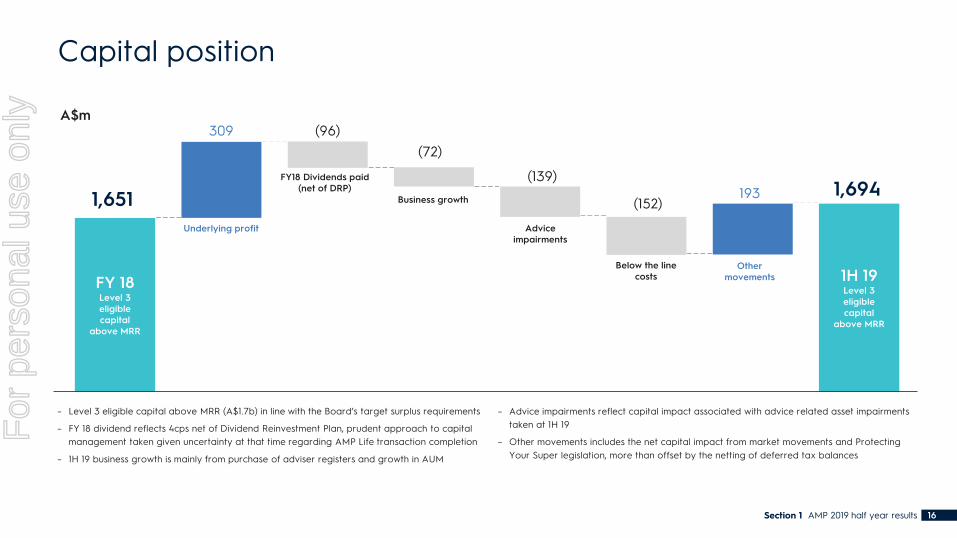
Capital position
Section 1 AMP 2019 half year results 16
– Level 3 eligible capital above MRR (A$1.7b) in line with the Board’s target surplus requirements
– FY 18 dividend reflects 4cps net of Dividend Reinvestment Plan, prudent approach to capital management taken given uncertainty at that time regarding AMP Life transaction completion
– 1H 19 business growth is mainly from purchase of adviser registers and growth in AUM
– Advice impairments reflect capital impact associated with advice related asset impairments taken at 1H 19
– Other movements includes the net capital impact from market movements and Protecting Your Super legislation, more than offset by the netting of deferred tax balances
1H 19Level 3 eligible capital
above MRR
FY 18Level 3 eligible capital
above MRR
309
FY18 Dividends paid (net of DRP)
Business growth
A$m(96)
(72)
(139)193
Underlying profit Advice impairments
Other movements
1,6941,651 (152)
Below the line costs
For
per
sona
l use
onl
y
2019 guidance
Section 1 AMP 2019 half year results 17
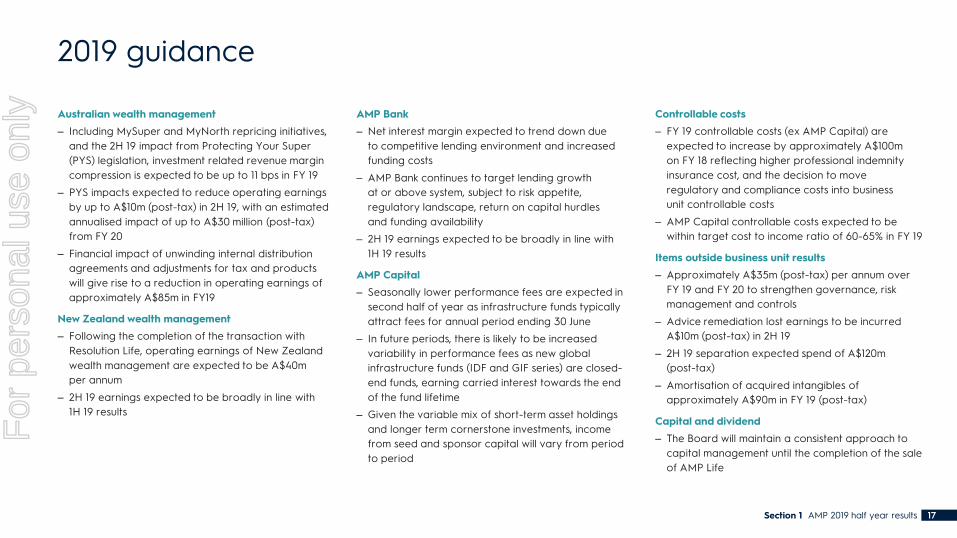
Australian wealth management
– Including MySuper and MyNorth repricing initiatives, and the 2H 19 impact from Protecting Your Super (PYS) legislation, investment related revenue margin compression is expected to be up to 11 bps in FY 19
– PYS impacts expected to reduce operating earnings by up to A$10m (post-tax) in 2H 19, with an estimated annualised impact of up to A$30 million (post-tax) from FY 20
– Financial impact of unwinding internal distribution agreements and adjustments for tax and products will give rise to a reduction in operating earnings of approximately A$85m in FY19
New Zealand wealth management
– Following the completion of the transaction with Resolution Life, operating earnings of New Zealand wealth management are expected to be A$40m per annum
– 2H 19 earnings expected to be broadly in line with 1H 19 results
AMP Bank
– Net interest margin expected to trend down due to competitive lending environment and increased funding costs
– AMP Bank continues to target lending growth at or above system, subject to risk appetite, regulatory landscape, return on capital hurdles and funding availability
– 2H 19 earnings expected to be broadly in line with 1H 19 results
AMP Capital
– Seasonally lower performance fees are expected in second half of year as infrastructure funds typically attract fees for annual period ending 30 June
– In future periods, there is likely to be increased variability in performance fees as new global infrastructure funds (IDF and GIF series) are closed-end funds, earning carried interest towards the end of the fund lifetime
– Given the variable mix of short-term asset holdings and longer term cornerstone investments, income from seed and sponsor capital will vary from period to period
Controllable costs
– FY 19 controllable costs (ex AMP Capital) are expected to increase by approximately A$100m on FY 18 reflecting higher professional indemnity insurance cost, and the decision to move regulatory and compliance costs into business unit controllable costs
– AMP Capital controllable costs expected to be within target cost to income ratio of 60-65% in FY 19
Items outside business unit results
– Approximately A$35m (post-tax) per annum over FY 19 and FY 20 to strengthen governance, risk management and controls
– Advice remediation lost earnings to be incurred A$10m (post-tax) in 2H 19
– 2H 19 separation expected spend of A$120m (post-tax)
– Amortisation of acquired intangibles of approximately A$90m in FY 19 (post-tax)
Capital and dividend
– The Board will maintain a consistent approach to capital management until the completion of the sale of AMP Life
For
per
sona
l use
onl
y

AMP Life updateSection two
For
per
sona
l use
onl
y
AMP Life revised agreement – key terms
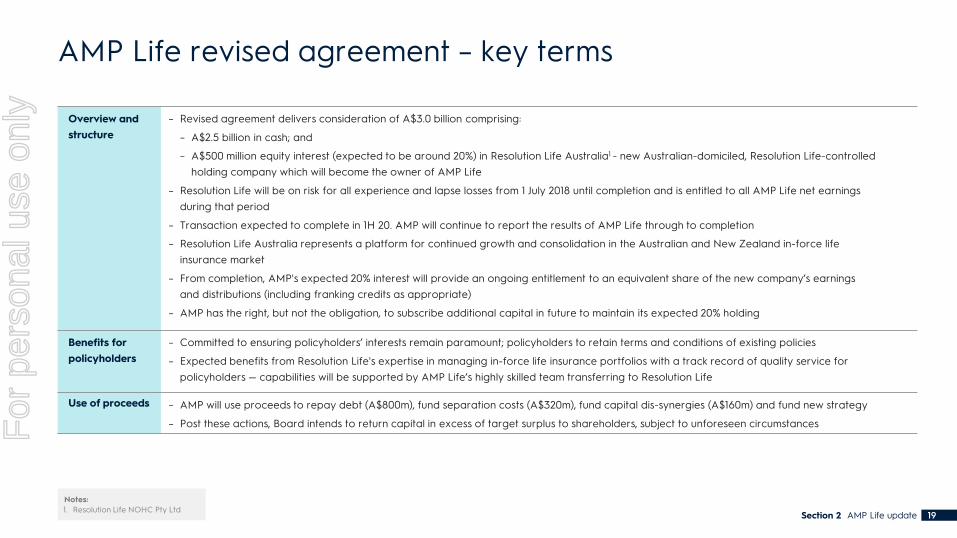
Overview and structure
– Revised agreement delivers consideration of A$3.0 billion comprising:
– A$2.5 billion in cash; and
– A$500 million equity interest (expected to be around 20%) in Resolution Life Australia1 - new Australian-domiciled, Resolution Life-controlled holding company which will become the owner of AMP Life
– Resolution Life will be on risk for all experience and lapse losses from 1 July 2018 until completion and is entitled to all AMP Life net earnings during that period
– Transaction expected to complete in 1H 20. AMP will continue to report the results of AMP Life through to completion
– Resolution Life Australia represents a platform for continued growth and consolidation in the Australian and New Zealand in-force life insurance market
– From completion, AMP's expected 20% interest will provide an ongoing entitlement to an equivalent share of the new company’s earnings and distributions (including franking credits as appropriate)
– AMP has the right, but not the obligation, to subscribe additional capital in future to maintain its expected 20% holding
Benefits for policyholders
– Committed to ensuring policyholders’ interests remain paramount; policyholders to retain terms and conditions of existing policies
– Expected benefits from Resolution Life's expertise in managing in-force life insurance portfolios with a track record of quality service for policyholders — capabilities will be supported by AMP Life’s highly skilled team transferring to Resolution Life
Use of proceeds – AMP will use proceeds to repay debt (A$800m), fund separation costs (A$320m), fund capital dis-synergies (A$160m) and fund new strategy
– Post these actions, Board intends to return capital in excess of target surplus to shareholders, subject to unforeseen circumstances
Section 2 AMP Life update 19
Notes:1. Resolution Life NOHC Pty Ltd
For
per
sona
l use
onl
y

Enabling AMP’s future strategy
– Ensures AMP’s future strategic direction is focused on higher growth, higher return businesses
– Frees up significant capital and avoids investment otherwise required to meet future regulatory requirements (including IFRS 17)
– Removes exposure to ongoing volatility in insurance sector and mitigates against future legislation including Putting Members’ Interests First Bill
– Revised terms take account of the impact of Protecting Your Super legislation and changed best estimate assumptions since July 2018
Strategic alternatives considered
– Full range of strategic options assessed:
– Retain: Inhibits AMP’s strategic transition towards a simpler, client focused group; continued exposure to earnings volatility and new legislation; significant investment required to meet regulatory requirements (including IFRS 17)
– Demerger: Up-front capital injection required to fund separation costs, capital dis-synergies and debt reduction; additional operating costs to run as standalone business; no release of capital to the group to fund new strategy
– Separation and sale of individual AMP Life business units: Not viable due to interdependencies between platforms and systems; requires significant upfront capital injection to support separate businesses; may not be in policyholders’ best interests
– Further reinsurance: AMP Life retail portfolios already effectively 65% reinsured – maximum achievable to ensure interests remain aligned with reinsurers; would further reduce profitability
AMP Life revised agreement – strategic rationale
Section 2 AMP Life update 20
For
per
sona
l use
onl
y
AMP Life revised agreement – regulatory approvals
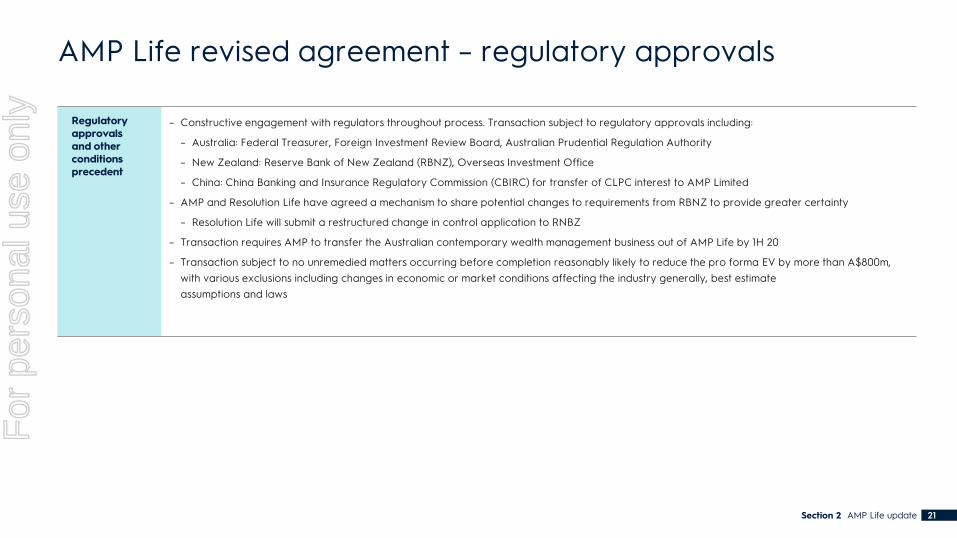
Regulatory approvals and other conditions precedent
– Constructive engagement with regulators throughout process. Transaction subject to regulatory approvals including:
– Australia: Federal Treasurer, Foreign Investment Review Board, Australian Prudential Regulation Authority
– New Zealand: Reserve Bank of New Zealand (RBNZ), Overseas Investment Office
– China: China Banking and Insurance Regulatory Commission (CBIRC) for transfer of CLPC interest to AMP Limited
– AMP and Resolution Life have agreed a mechanism to share potential changes to requirements from RBNZ to provide greater certainty
– Resolution Life will submit a restructured change in control application to RNBZ
– Transaction requires AMP to transfer the Australian contemporary wealth management business out of AMP Life by 1H 20
– Transaction subject to no unremedied matters occurring before completion reasonably likely to reduce the pro forma EV by more than A$800m, with various exclusions including changes in economic or market conditions affecting the industry generally, best estimate assumptions and laws
Section 2 AMP Life update 21
For
per
sona
l use
onl
y
AMP Life revised agreement – summary of differences
Section 2 AMP Life update
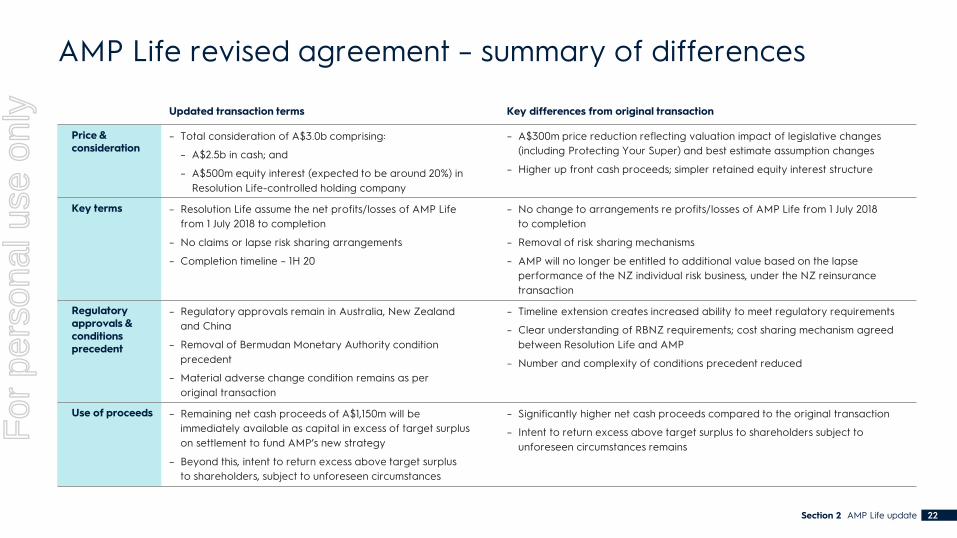
Updated transaction terms Key differences from original transaction
Price & consideration
– Total consideration of A$3.0b comprising:
– A$2.5b in cash; and
– A$500m equity interest (expected to be around 20%) in Resolution Life-controlled holding company
– A$300m price reduction reflecting valuation impact of legislative changes (including Protecting Your Super) and best estimate assumption changes
– Higher up front cash proceeds; simpler retained equity interest structure
Key terms – Resolution Life assume the net profits/losses of AMP Life from 1 July 2018 to completion
– No claims or lapse risk sharing arrangements
– Completion timeline – 1H 20
– No change to arrangements re profits/losses of AMP Life from 1 July 2018 to completion
– Removal of risk sharing mechanisms
– AMP will no longer be entitled to additional value based on the lapse performance of the NZ individual risk business, under the NZ reinsurance transaction
Regulatory approvals & conditions precedent
– Regulatory approvals remain in Australia, New Zealand and China
– Removal of Bermudan Monetary Authority condition precedent
– Material adverse change condition remains as per original transaction
– Timeline extension creates increased ability to meet regulatory requirements
– Clear understanding of RBNZ requirements; cost sharing mechanism agreed between Resolution Life and AMP
– Number and complexity of conditions precedent reduced
Use of proceeds – Remaining net cash proceeds of A$1,150m will be immediately available as capital in excess of target surplus on settlement to fund AMP’s new strategy
– Beyond this, intent to return excess above target surplus to shareholders, subject to unforeseen circumstances
– Significantly higher net cash proceeds compared to the original transaction
– Intent to return excess above target surplus to shareholders subject to unforeseen circumstances remains
22
For
per
sona
l use
onl
y
AMP Life revised agreement – financial implications
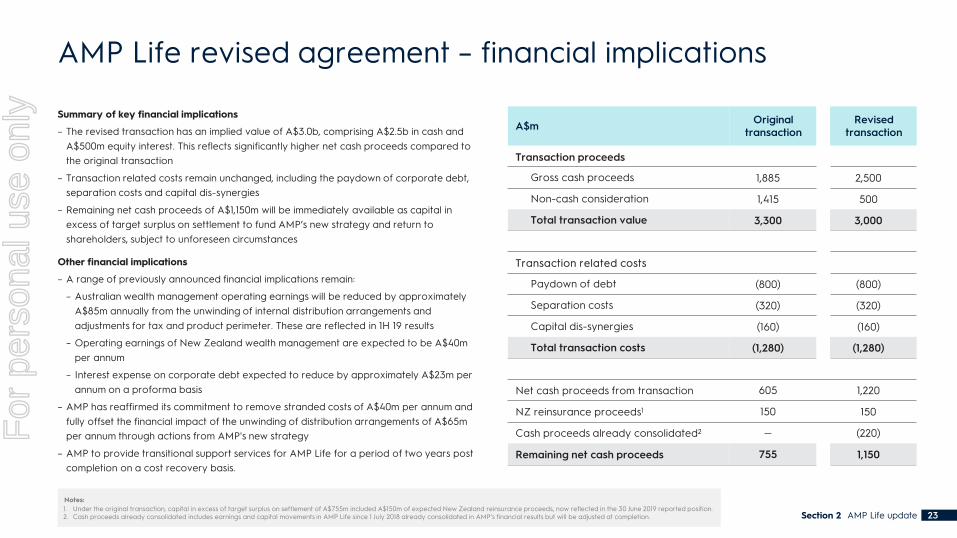
Summary of key financial implications
– The revised transaction has an implied value of A$3.0b, comprising A$2.5b in cash and A$500m equity interest. This reflects significantly higher net cash proceeds compared to the original transaction
– Transaction related costs remain unchanged, including the paydown of corporate debt, separation costs and capital dis-synergies
– Remaining net cash proceeds of A$1,150m will be immediately available as capital in excess of target surplus on settlement to fund AMP’s new strategy and return to shareholders, subject to unforeseen circumstances
Other financial implications
– A range of previously announced financial implications remain:
– Australian wealth management operating earnings will be reduced by approximately A$85m annually from the unwinding of internal distribution arrangements and adjustments for tax and product perimeter. These are reflected in 1H 19 results
– Operating earnings of New Zealand wealth management are expected to be A$40m per annum
– Interest expense on corporate debt expected to reduce by approximately A$23m per annum on a proforma basis
– AMP has reaffirmed its commitment to remove stranded costs of A$40m per annum and fully offset the financial impact of the unwinding of distribution arrangements of A$65m per annum through actions from AMP's new strategy
– AMP to provide transitional support services for AMP Life for a period of two years post completion on a cost recovery basis.
A$m Original transaction
Revised transaction
Transaction proceeds
Gross cash proceeds 1,885 2,500
Non-cash consideration 1,415 500
Total transaction value 3,300 3,000
Transaction related costs
Paydown of debt (800) (800)
Separation costs (320) (320)
Capital dis-synergies (160) (160)
Total transaction costs (1,280) (1,280)
Net cash proceeds from transaction 605 1,220
NZ reinsurance proceeds1 150 150
Cash proceeds already consolidated2 — (220)
Remaining net cash proceeds 755 1,150
Section 2 AMP Life update 23
Notes:1. Under the original transaction, capital in excess of target surplus on settlement of A$755m included A$150m of expected New Zealand reinsurance proceeds, now reflected in the 30 June 2019 reported position.2. Cash proceeds already consolidated includes earnings and capital movements in AMP Life since 1 July 2018 already consolidated in AMP’s financial results but will be adjusted at completion.
For
per
sona
l use
onl
y
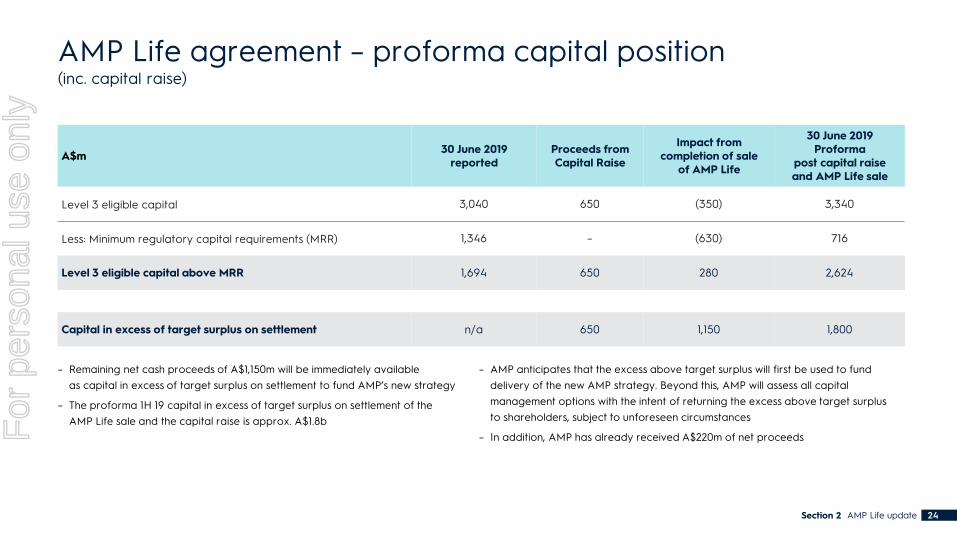
AMP Life agreement – proforma capital position(inc. capital raise)
– Remaining net cash proceeds of A$1,150m will be immediately available as capital in excess of target surplus on settlement to fund AMP’s new strategy
– The proforma 1H 19 capital in excess of target surplus on settlement of the AMP Life sale and the capital raise is approx. A$1.8b
Section 2 AMP Life update 24
A$m 30 June 2019 reported
Proceeds from Capital Raise
Impact from completion of sale
of AMP Life
30 June 2019 Proforma
post capital raise and AMP Life sale
Level 3 eligible capital 3,040 650 (350) 3,340
Less: Minimum regulatory capital requirements (MRR) 1,346 – (630) 716
Level 3 eligible capital above MRR 1,694 650 280 2,624
Capital in excess of target surplus on settlement n/a 650 1,150 1,800
– AMP anticipates that the excess above target surplus will first be used to fund delivery of the new AMP strategy. Beyond this, AMP will assess all capital management options with the intent of returning the excess above target surplus to shareholders, subject to unforeseen circumstances
– In addition, AMP has already received A$220m of net proceedsFor
per
sona
l use
onl
y
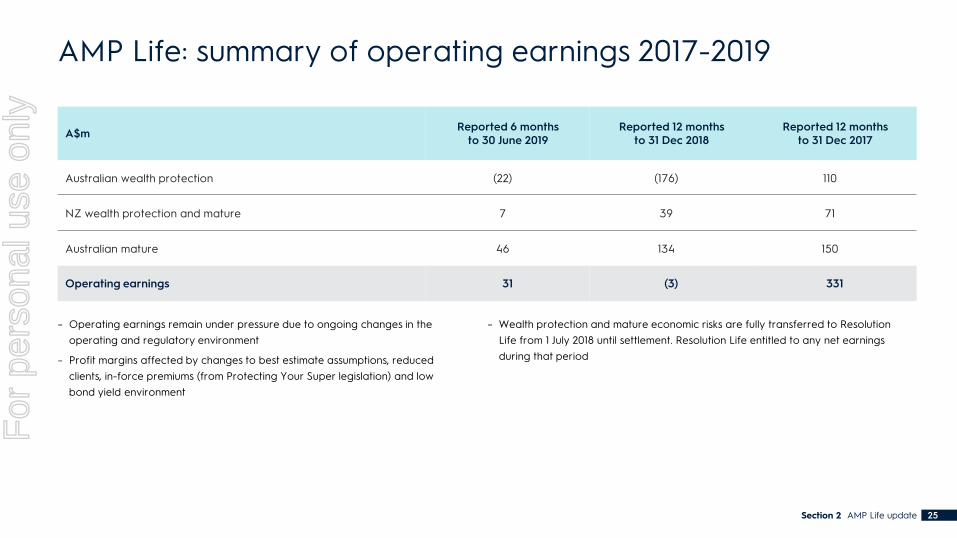
AMP Life: summary of operating earnings 2017-2019
A$m Reported 6 months to 30 June 2019
Reported 12 months to 31 Dec 2018
Reported 12 months to 31 Dec 2017
Australian wealth protection (22) (176) 110
NZ wealth protection and mature 7 39 71
Australian mature 46 134 150
Operating earnings 31 (3) 331
– Operating earnings remain under pressure due to ongoing changes in the operating and regulatory environment
– Profit margins affected by changes to best estimate assumptions, reduced clients, in-force premiums (from Protecting Your Super legislation) and low bond yield environment
– Wealth protection and mature economic risks are fully transferred to Resolution Life from 1 July 2018 until settlement. Resolution Life entitled to any net earnings during that period
Section 2 AMP Life update 25
For
per
sona
l use
onl
y

AMP strategySection three
For
per
sona
l use
onl
y
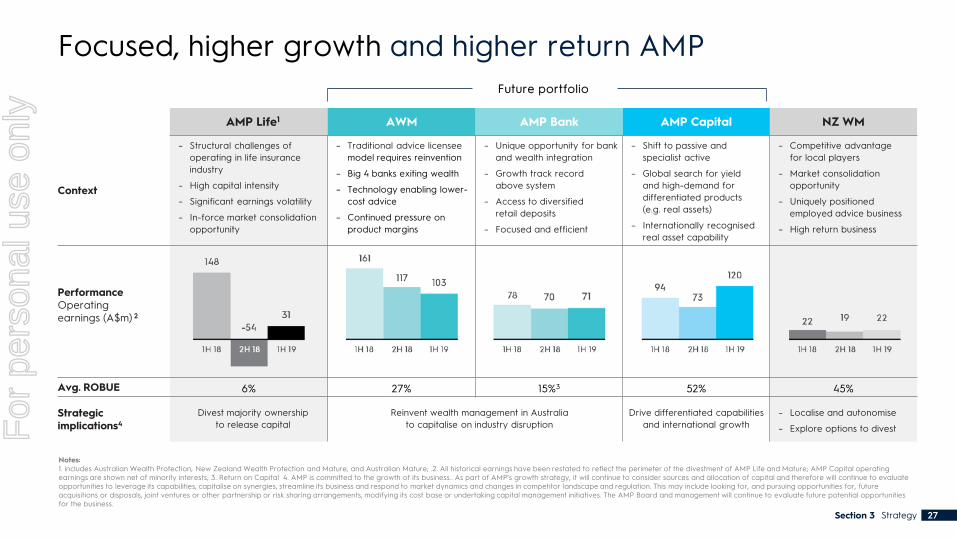
Focused, higher growth and higher return AMP
Section 3 Strategy 27
AMP Life1 AWM AMP Bank AMP Capital NZ WM
Context
– Structural challenges of operating in life insurance industry
– High capital intensity
– Significant earnings volatility
– In-force market consolidation opportunity
– Traditional advice licensee model requires reinvention
– Big 4 banks exiting wealth
– Technology enabling lower-cost advice
– Continued pressure on product margins
– Unique opportunity for bank and wealth integration
– Growth track record above system
– Access to diversified retail deposits
– Focused and efficient
– Shift to passive and specialist active
– Global search for yield and high-demand for differentiated products (e.g. real assets)
– Internationally recognised real asset capability
– Competitive advantage for local players
– Market consolidation opportunity
– Uniquely positioned employed advice business
– High return business
PerformanceOperatingearnings (A$m) 2
Avg. ROBUE 6% 27% 15%3 52% 45%
Strategicimplications4
Divest majority ownership to release capital
Reinvent wealth management in Australia to capitalise on industry disruption
Drive differentiated capabilities and international growth
– Localise and autonomise
– Explore options to divest
Notes:1. includes Australian Wealth Protection, New Zealand Wealth Protection and Mature, and Australian Mature; .2. All historical earnings have been restated to reflect the perimeter of the divestment of AMP Life and Mature; AMP Capital operating earnings are shown net of minority interests; 3. Return on Capital 4. AMP is committed to the growth of its business.. As part of AMP’s growth strategy, it will continue to consider sources and allocation of capital and therefore will continue to evaluateopportunities to leverage its capabilities, capitalise on synergies, streamline its business and respond to market dynamics and changes in competitor landscape and regulation. This may include looking for, and pursuing opportunities for, future acquisitions or disposals, joint ventures or other partnership or risk sharing arrangements, modifying its cost base or undertaking capital management initiatives. The AMP Board and management will continue to evaluate future potential opportunities for the business.
Future portfolio
For
per
sona
l use
onl
y
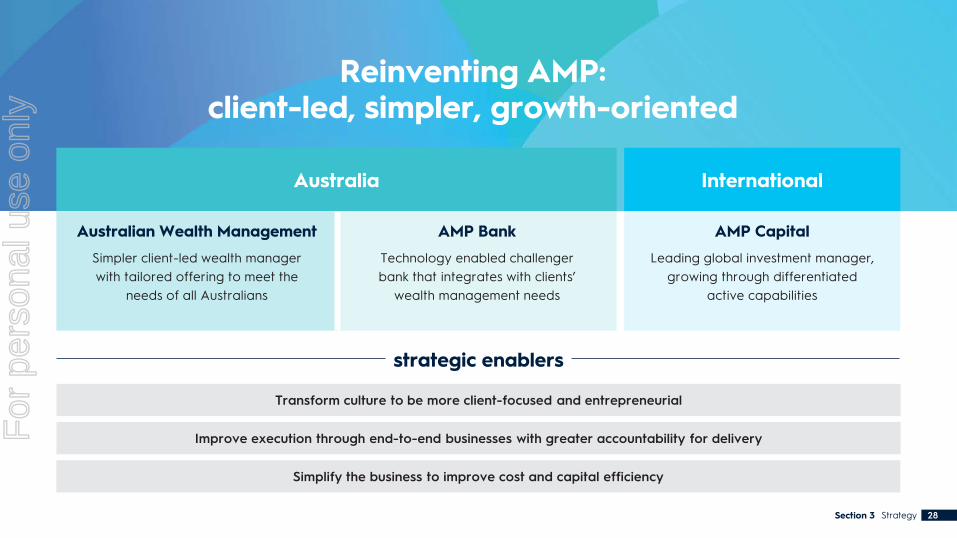
Australia
Australian Wealth Management
Simpler client-led wealth manager with tailored offering to meet the
needs of all Australians
AMP Bank
Technology enabled challenger bank that integrates with clients’
wealth management needs
International
AMP Capital
Leading global investment manager, growing through differentiated
active capabilities
Reinventing AMP:client-led, simpler, growth-oriented
Transform culture to be more client-focused and entrepreneurial
Improve execution through end-to-end businesses with greater accountability for delivery
Simplify the business to improve cost and capital efficiency
strategic enablers
Section 3 Strategy 28
For
per
sona
l use
onl
y
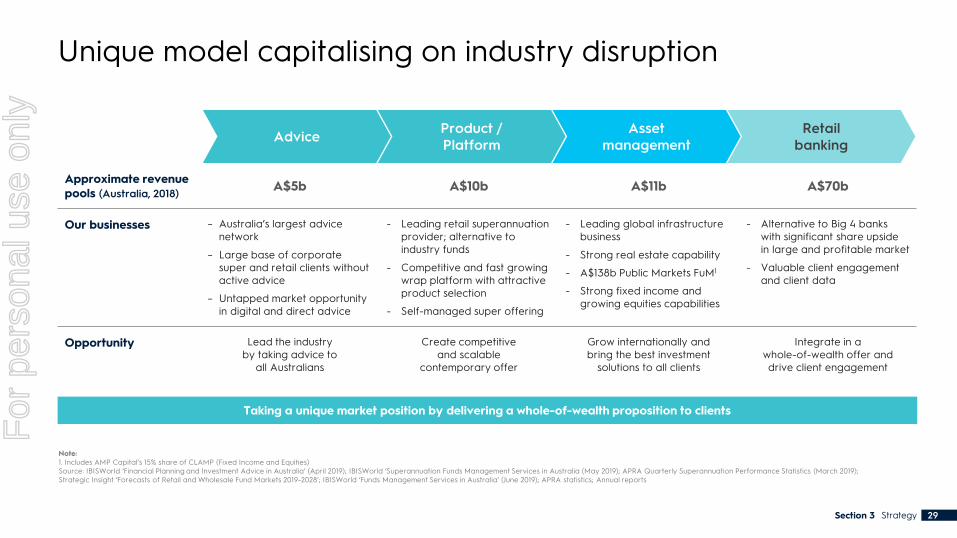
Unique model capitalising on industry disruption
Section 3 Strategy 29
Note:1. Includes AMP Capital’s 15% share of CLAMP (Fixed Income and Equities)Source: IBISWorld ‘Financial Planning and Investment Advice in Australia’ (April 2019); IBISWorld ‘Superannuation Funds Management Services in Australia (May 2019); APRA Quarterly Superannuation Performance Statistics (March 2019); Strategic Insight ‘Forecasts of Retail and Wholesale Fund Markets 2019-2028’; IBISWorld ‘Funds Management Services in Australia’ (June 2019); APRA statistics; Annual reports
Approximate revenue pools (Australia, 2018) A$5b A$10b A$11b A$70b
Our businesses – Australia’s largest advice network
– Large base of corporate super and retail clients without active advice
– Untapped market opportunity in digital and direct advice
- Leading retail superannuation provider; alternative to industry funds
- Competitive and fast growing wrap platform with attractive product selection
- Self-managed super offering
- Leading global infrastructure business
- Strong real estate capability
- A$138b Public Markets FuM1
- Strong fixed income and growing equities capabilities
- Alternative to Big 4 banks with significant share upside in large and profitable market
- Valuable client engagement and client data
Opportunity Lead the industry by taking advice to
all Australians
Create competitive and scalable
contemporary offer
Grow internationally and bring the best investment
solutions to all clients
Integrate in a whole-of-wealth offer and drive client engagement
Advice Product / Platform
Asset management
Retail banking
Taking a unique market position by delivering a whole-of-wealth proposition to clients
For
per
sona
l use
onl
y

Reinventing wealth management in Australia
For
per
sona
l use
onl
y

Helping clients realise their ambitions
Section 3 Strategy 31
Improve financial literacy
Provide holistic solutions for client needs
Make adviceaccessible to all
For
per
sona
l use
onl
y

Reinventing our business in Australia
Strategy 32
Strategy Objectives Outcomes
Fix Legacy
– Reshape aligned advice to be more professional, compliant, and productive
– Simplify super1 to improve client outcomes
– BOLR risk mitigation
– Fewer, more productive, professional advisers
– Fewer admin systems and simpler products
– Stronger governance and compliance processesSubdued performance until contemporary business reaches scale
Grow contemporary
– Provide wealth management for the needs of all Australians
– Shift focus toward direct to client channels
– Offer simpler, best-of-breed products
– Build digital from strong technology foundations
– Scaled direct to client channels
– Increased adviser productivity (~50% increase in average FuA2 per adviser both internal and external)
– Increased client engagement and experience
Further integrate banking solutions
– Continue strong growth and further diversify channel mix
– Improve integration with wealth management and increase client engagement
– Scale through re-platforming, digitisation and automation
– Increase deposit funding
– Increased market penetration of broker, adviser and direct channel
– Uplift in client experience and engagement whilst delivering positive jaws
Double digit earnings growth over the medium term
Aus
tral
ian
wea
lth m
anag
emen
t
Notes:1. Mastertrust products2. FUA = Funds under advice
AM
P Ba
nk
Section 3
For
per
sona
l use
onl
y

Reshaping aligned advice
Section 3 Strategy 33
Notes:1. Retention and support is capex investment required to reshape the network, in a FOFA compliant manner, e.g. Salesforce. These are also captured on the ‘Investing to build the new AMP’ page (page 45)
1Reshape the network
– Retain professional, client-focused and compliant advisers. Productivity a key driver (~20% of adviser practices account for ~60% of revenue and AuM)
– Proactively manage adviser transition in clients’ best interests
2 Reset commercial terms
– Reset client register buy-back valuations to market-based multiples
– Redesign licensee offer to rebalance risk and return
3 Improve productivity and compliance
– Standardise process with technology, including embedding Salesforce
Retention and support1
Register acquisitions
Majority expected to be spent in the next 18-24 months
Estimated capital outlay
~A$550m
For
per
sona
l use
onl
y

Simplifying super to improve client outcomes
Strategy 34
Notes:1. ‘Simpler governance and better client outcomes’ metrics are for AMP’s Mastertrust business2. All changes are subject to trustee approval3. Investment menus evolve over time – number of options will fluctuate, but it is our intention to reduce significantly from today
Trustees
2
1
Superfunds
6
1
Product adminsystems
9
2
Products
72
5
Investmentoptions3
170
~50
Simpler governance structure
Competitive pricing and performance
Strengthened trustee operating model
Easy to understand client propositions
Majority of grandfathered commissions cease in Q1 2020
Fewer mastertrustproducts and platforms2
Rationalise legacy products and platforms
Unlock value chain efficiencies
Lower fixed cost
Simpler governance and better client outcomes1,2
Today
End 2020
Section 3
For
per
sona
l use
onl
y
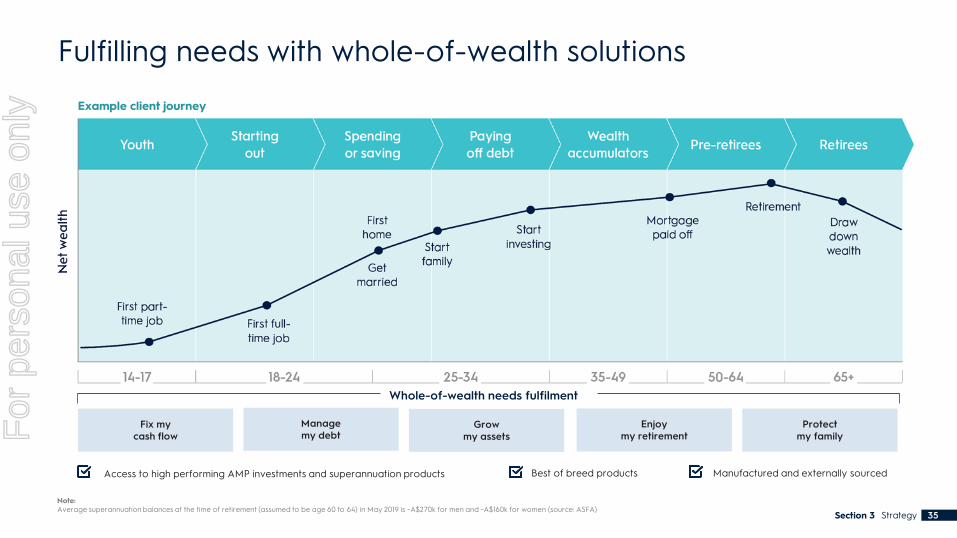
Fulfilling needs with whole-of-wealth solutions
Section 3 Strategy 35
Fix my cash flow
Manage my debt
Growmy assets
Enjoymy retirement
Protectmy family
Whole-of-wealth needs fulfilment
Best of breed products Manufactured and externally sourcedAccess to high performing AMP investments and superannuation products
Example client journey
Note: Average superannuation balances at the time of retirement (assumed to be age 60 to 64) in May 2019 is ~A$270k for men and ~A$160k for women (source: ASFA)
35
For
per
sona
l use
onl
y
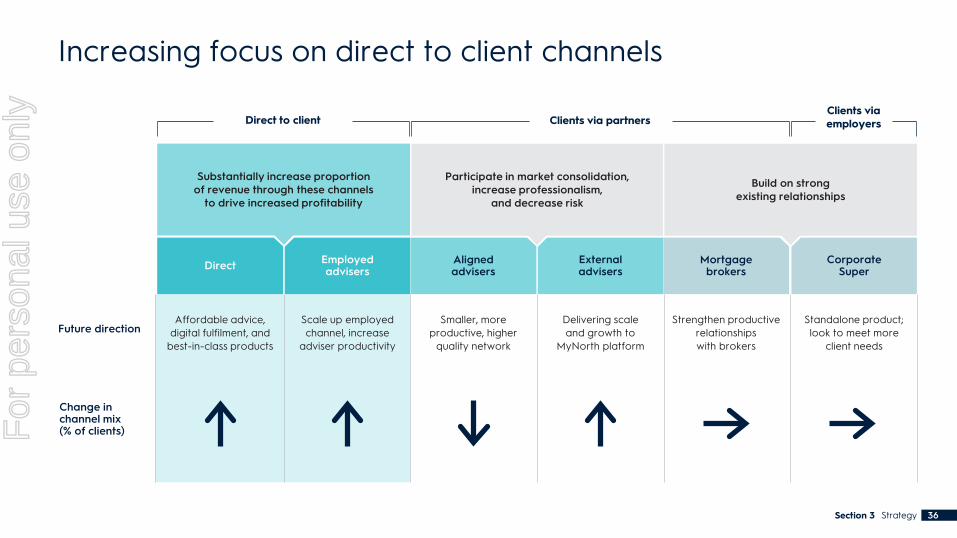
Increasing focus on direct to client channels
Strategy 36
Future direction
Change in channel mix (% of clients)
Substantially increase proportion of revenue through these channels
to drive increased profitability
CorporateSuper
Externaladvisers
Employedadvisers
AlignedadvisersDirect Mortgage
brokers
Direct to client Clients via partnersClients via employers
Standalone product; look to meet more
client needs
Strengthen productive relationships with brokers
Delivering scale and growth to
MyNorth platform
Smaller, more productive, higher
quality network
Scale up employed channel, increase
adviser productivity
Affordable advice, digital fulfilment, and
best-in-class products
Section 3
Participate in market consolidation, increase professionalism,
and decrease risk
Build on strong existing relationships
For
per
sona
l use
onl
y

Financial dashboard, timeline, and tools– Goals, budgeting, financial literacy (e.g. MoneyBrilliant)
Self-directed– Automated guidance (digital and human)
On-demand– Event driven advice supported remotely by AMP experts
Full service– Dedicated ongoing personal relationship with an Adviser
Creating a tiered service delivery
Section 3 Strategy 37
Common technology architecture
Move between as needs change C
lient
pri
ce ►
For
per
sona
l use
onl
y
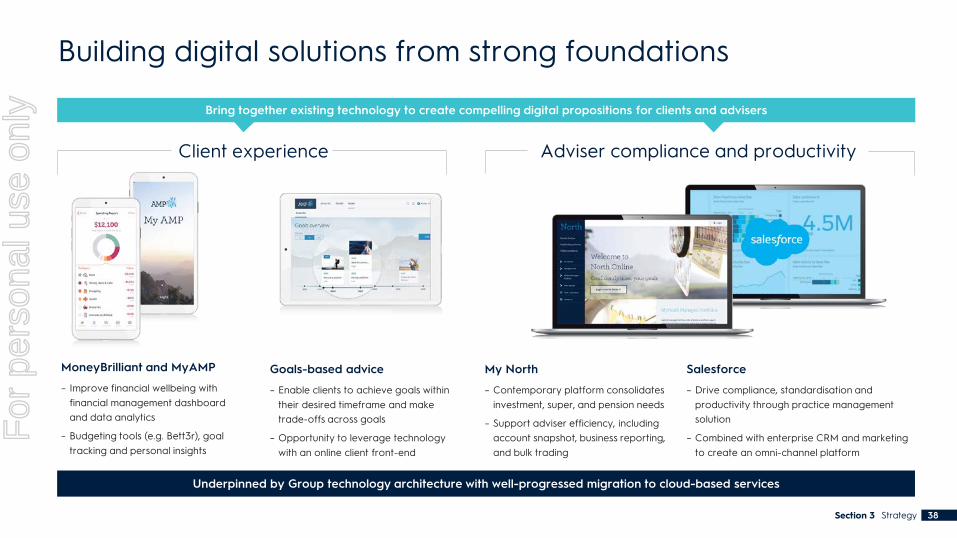
Building digital solutions from strong foundations
Section 3 Strategy 38
MoneyBrilliant and MyAMP
– Improve financial wellbeing with financial management dashboard and data analytics
– Budgeting tools (e.g. Bett3r), goal tracking and personal insights
Goals-based advice
– Enable clients to achieve goals within their desired timeframe and make trade-offs across goals
– Opportunity to leverage technology with an online client front-end
My North
– Contemporary platform consolidates investment, super, and pension needs
– Support adviser efficiency, including account snapshot, business reporting, and bulk trading
Salesforce
– Drive compliance, standardisation and productivity through practice management solution
– Combined with enterprise CRM and marketing to create an omni-channel platform
Client experience Adviser compliance and productivity
Underpinned by Group technology architecture with well-progressed migration to cloud-based services
Bring together existing technology to create compelling digital propositions for clients and advisers
For
per
sona
l use
onl
y

Leading global investment manager
For
per
sona
l use
onl
y

Growing through differentiated capabilities
Section 3 Strategy 40
Notes:1. Includes AMP Capital’s 24.9% share of PCCP (Real Estate)2. Total fee income of $708m FY183. Includes AMP Capital’s 15% share of CLAMP Fixed Income and Equities)4. Inception date is 30 March 2017. Returns are calculated net of fees, before tax and assume all distributions are reinvested. Peer universe is the Evestment Global Large Cap Growth Equity peer set. Market return is MSCI World AC Index (AUD)
Strategy Objectives Outcomes
AM
P C
apita
l
Real assets
A$50b FuM1
57% of fee income1,2
– Continue to expand our global footprint building on strong track record, reputation, longstanding relationships and distribution network
– Address global demand for yield with customised real asset solutions
– Significant earnings growth in infrastructure and real estate
– Double digit acceleration in international FuM
– Double digit earnings growth over the medium term (through the cycle)
– 75% of FuM delivering at or above clients’ goals
Public markets
A$138b FuM3
43% of fee income2,3
– Simplify product set and operating model to drive efficiency
– Grow solutions and high alpha offerings, such as AMP Capital’s global equities capabilities, which has delivered top percentile performance vs peers since inception4 (31.0% pa vs market return 13.4% pa)
– Improved efficiency supported by contemporary technology
– Optimised investment capabilities delivering high quality outcomes for clients
For
per
sona
l use
onl
y
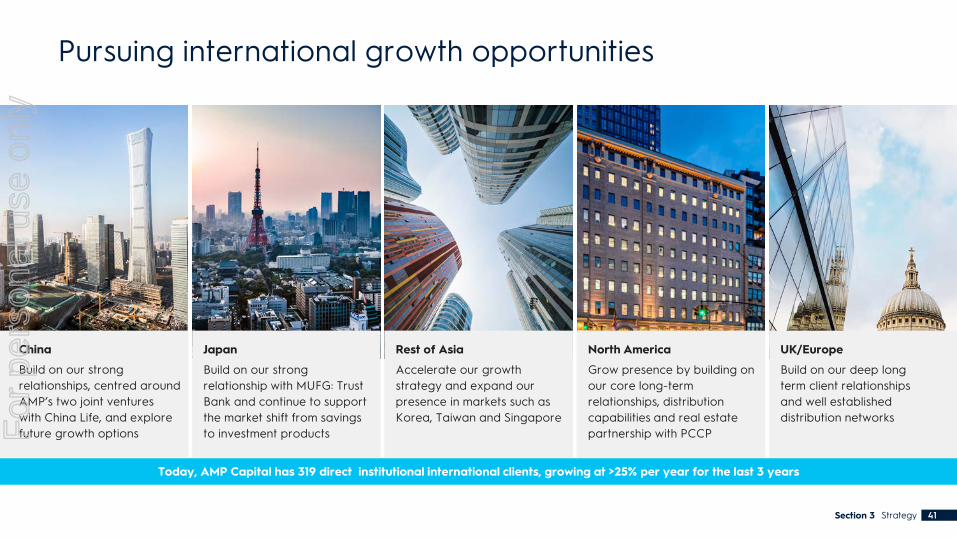
Pursuing international growth opportunities
Section 3 Strategy 41
Japan
Build on our strong relationship with MUFG: Trust Bank and continue to support the market shift from savings to investment products
Rest of Asia
Accelerate our growth strategy and expand our presence in markets such as Korea, Taiwan and Singapore
North America
Grow presence by building on our core long-term relationships, distribution capabilities and real estate partnership with PCCP
UK/Europe
Build on our deep long term client relationships and well established distribution networks
China
Build on our strong relationships, centred around AMP’s two joint ventures with China Life, and explore future growth options
Today, AMP Capital has 319 direct institutional international clients, growing at >25% per year for the last 3 years
For
per
sona
l use
onl
y

Transform culture, improve execution and simplify
For
per
sona
l use
onl
y
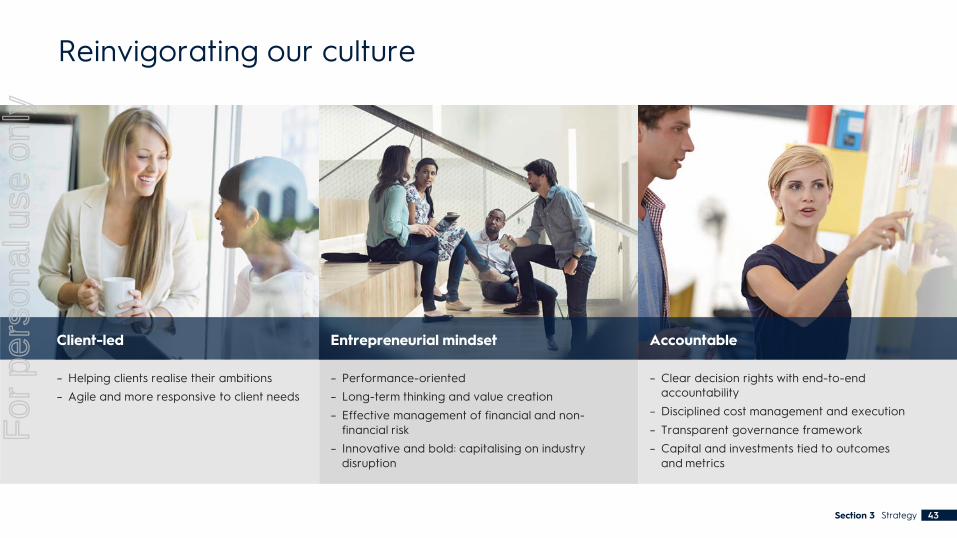
Reinvigorating our culture
Section 3 Strategy 43
Client-led Entrepreneurial mindset Accountable
– Helping clients realise their ambitions– Agile and more responsive to client needs
– Performance-oriented– Long-term thinking and value creation– Effective management of financial and non-
financial risk– Innovative and bold: capitalising on industry
disruption
– Clear decision rights with end-to-end accountability
– Disciplined cost management and execution– Transparent governance framework– Capital and investments tied to outcomes
and metrics
For
per
sona
l use
onl
y
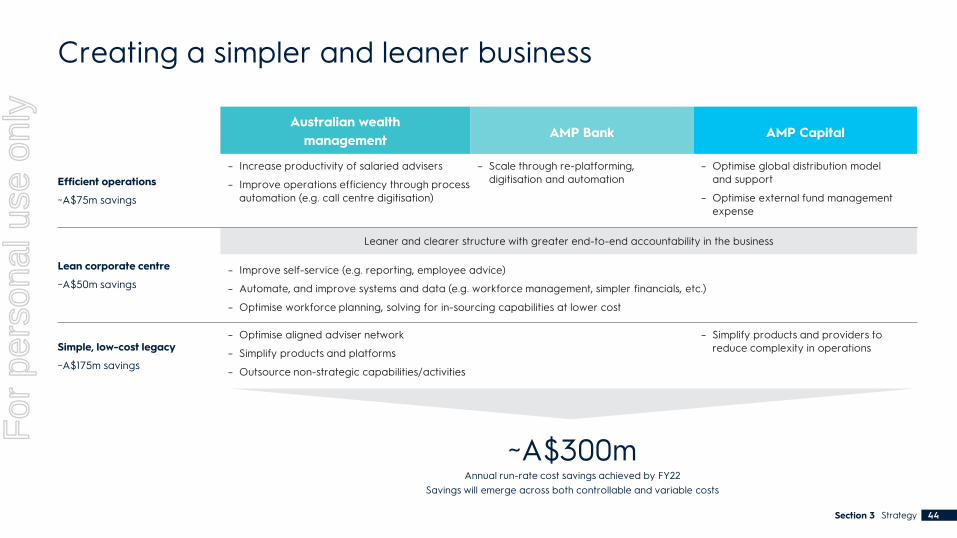
Creating a simpler and leaner business
Australian wealth management AMP Bank AMP Capital
Efficient operations
~A$75m savings
– Increase productivity of salaried advisers
– Improve operations efficiency through process automation (e.g. call centre digitisation)
– Scale through re-platforming, digitisation and automation
– Optimise global distribution model and support
– Optimise external fund management expense
Lean corporate centre
~A$50m savings
Leaner and clearer structure with greater end-to-end accountability in the business
– Improve self-service (e.g. reporting, employee advice)
– Automate, and improve systems and data (e.g. workforce management, simpler financials, etc.)
– Optimise workforce planning, solving for in-sourcing capabilities at lower cost
Simple, low-cost legacy
~A$175m savings
– Optimise aligned adviser network
– Simplify products and platforms
– Outsource non-strategic capabilities/activities
– Simplify products and providers to reduce complexity in operations
Section 3 Strategy 44
~A$300mAnnual run-rate cost savings achieved by FY22
Savings will emerge across both controllable and variable costs
For
per
sona
l use
onl
y
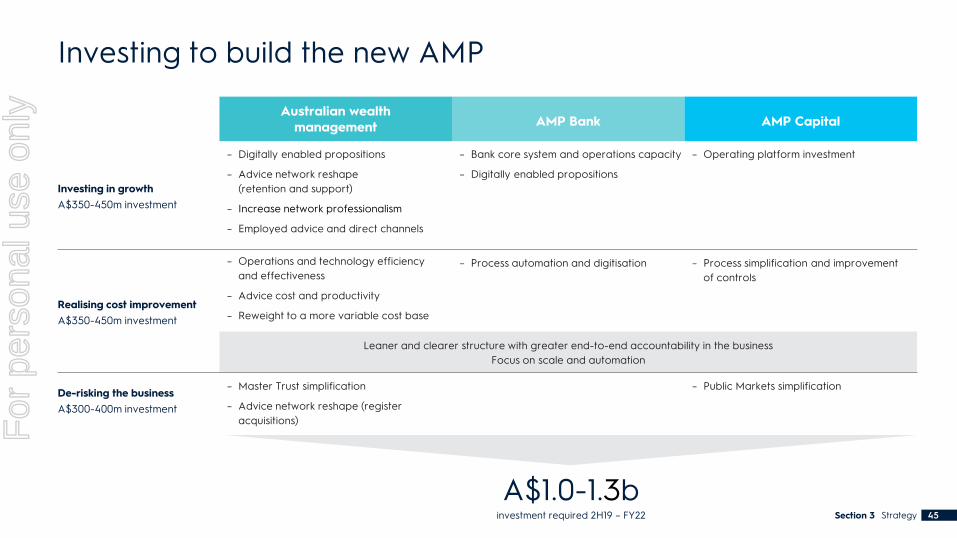
Investing to build the new AMP
Australian wealth management AMP Bank AMP Capital
Investing in growthA$350-450m investment
– Digitally enabled propositions
– Advice network reshape (retention and support)
– Increase network professionalism
– Employed advice and direct channels
– Bank core system and operations capacity
– Digitally enabled propositions
– Operating platform investment
Realising cost improvementA$350-450m investment
– Operations and technology efficiency and effectiveness
– Advice cost and productivity
– Reweight to a more variable cost base
– Process automation and digitisation – Process simplification and improvementof controls
Leaner and clearer structure with greater end-to-end accountability in the businessFocus on scale and automation
De-risking the businessA$300-400m investment
– Master Trust simplification
– Advice network reshape (register acquisitions)
– Public Markets simplification
Section 3 Strategy 45
A$1.0-1.3binvestment required 2H19 – FY22
For
per
sona
l use
onl
y
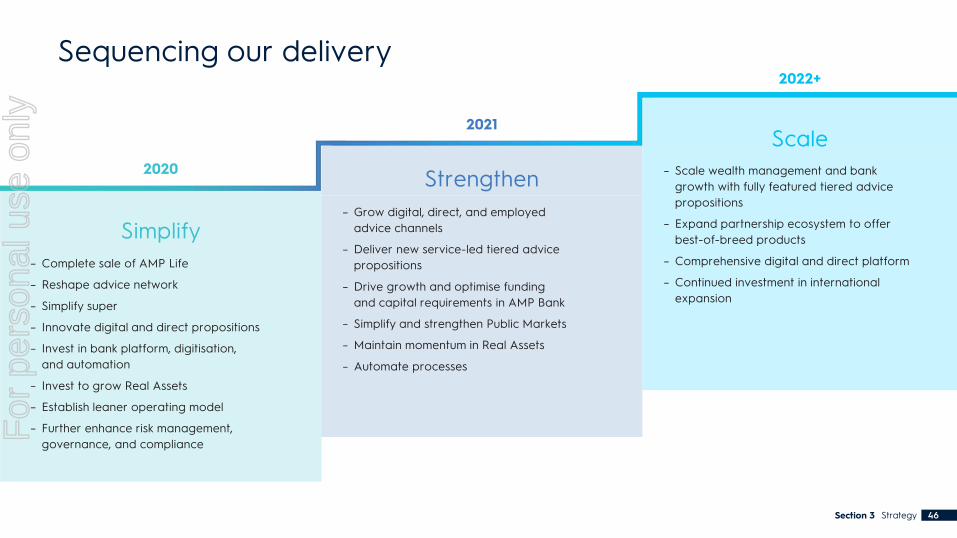
Sequencing our delivery
Section 3 Strategy 46
Simplify– Complete sale of AMP Life
– Reshape advice network
– Simplify super
– Innovate digital and direct propositions
– Invest in bank platform, digitisation, and automation
– Invest to grow Real Assets
– Establish leaner operating model
– Further enhance risk management, governance, and compliance
Strengthen– Grow digital, direct, and employed
advice channels
– Deliver new service-led tiered advice propositions
– Drive growth and optimise funding and capital requirements in AMP Bank
– Simplify and strengthen Public Markets
– Maintain momentum in Real Assets
– Automate processes
Scale– Scale wealth management and bank
growth with fully featured tiered advice propositions
– Expand partnership ecosystem to offer best-of-breed products
– Comprehensive digital and direct platform
– Continued investment in international expansion
2020
2021
2022+
For
per
sona
l use
onl
y
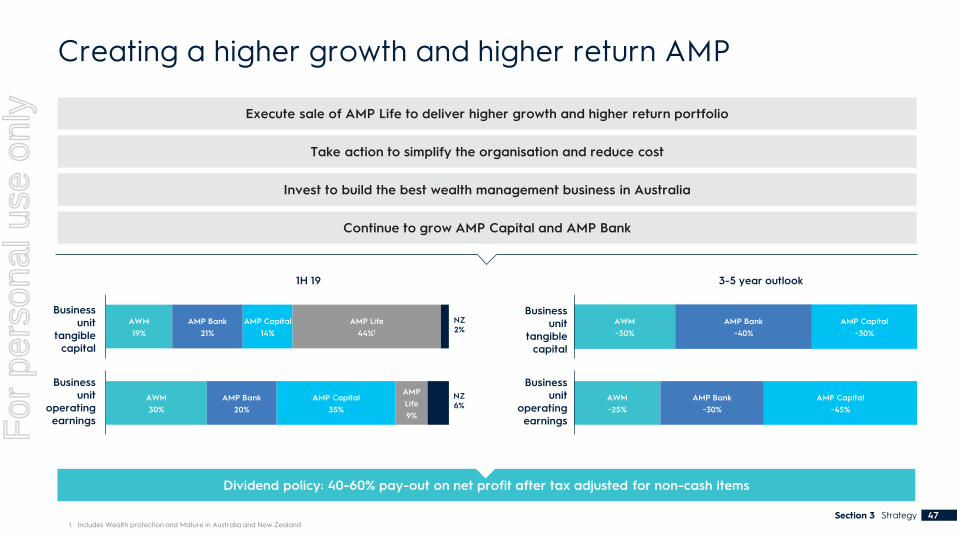
Execute sale of AMP Life to deliver higher growth and higher return portfolio
Take action to simplify the organisation and reduce cost
Invest to build the best wealth management business in Australia
Continue to grow AMP Capital and AMP Bank
Creating a higher growth and higher return AMP
1H 19 3-5 year outlook
1. Includes Wealth protection and Mature in Australia and New ZealandSection 3 Strategy 47
Dividend policy: 40-60% pay-out on net profit after tax adjusted for non-cash items
AWM 19%
AMP Bank21%
AMP Capital14%
AMP Life 44%1
AWM30%
AMP Bank20%
AMP Capital35%
AMP Life 9%
AWM~30%
AMP Bank~40%
AMP Capital~30%
AWM~25%
AMP Bank~30%
AMP Capital~45%
Business unit
operating earnings
Business unit
tangiblecapital
Business unit
operating earnings
Business unit
tangiblecapital
NZ2%
NZ6%
For
per
sona
l use
onl
y
1. Overview of AMP’s capital position
2. Business metrics and growthAustralian wealth management, AMP Bank and AMP Capital
3. Legislative and regulatory environment
AppendixSection four
For
per
sona
l use
onl
y
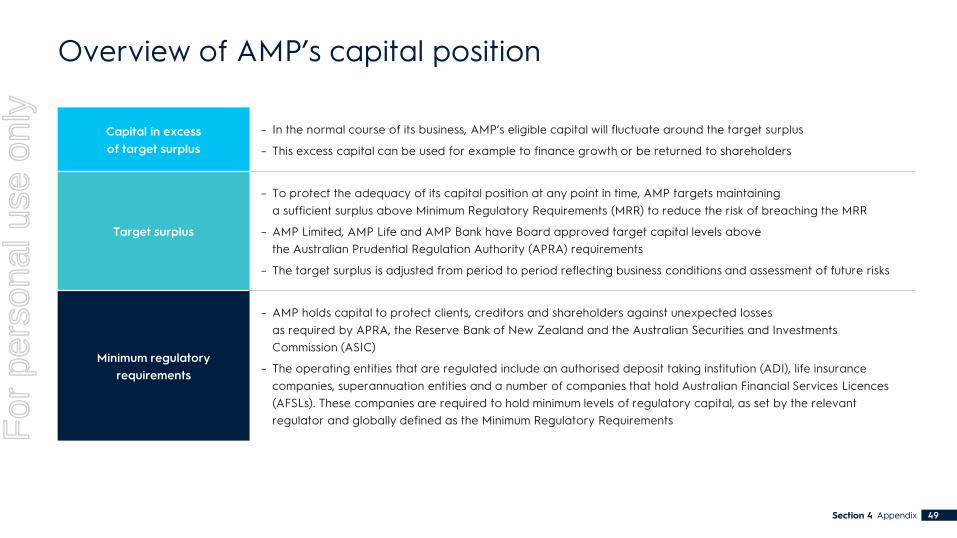
Overview of AMP’s capital position
Section 4 Appendix 49
Capital in excess of target surplus
– In the normal course of its business, AMP’s eligible capital will fluctuate around the target surplus
– This excess capital can be used for example to finance growth or be returned to shareholders
Target surplus
– To protect the adequacy of its capital position at any point in time, AMP targets maintaining a sufficient surplus above Minimum Regulatory Requirements (MRR) to reduce the risk of breaching the MRR
– AMP Limited, AMP Life and AMP Bank have Board approved target capital levels above the Australian Prudential Regulation Authority (APRA) requirements
– The target surplus is adjusted from period to period reflecting business conditions and assessment of future risks
Minimum regulatory requirements
– AMP holds capital to protect clients, creditors and shareholders against unexpected losses as required by APRA, the Reserve Bank of New Zealand and the Australian Securities and Investments Commission (ASIC)
– The operating entities that are regulated include an authorised deposit taking institution (ADI), life insurance companies, superannuation entities and a number of companies that hold Australian Financial Services Licences (AFSLs). These companies are required to hold minimum levels of regulatory capital, as set by the relevant regulator and globally defined as the Minimum Regulatory RequirementsF
or p
erso
nal u
se o
nly
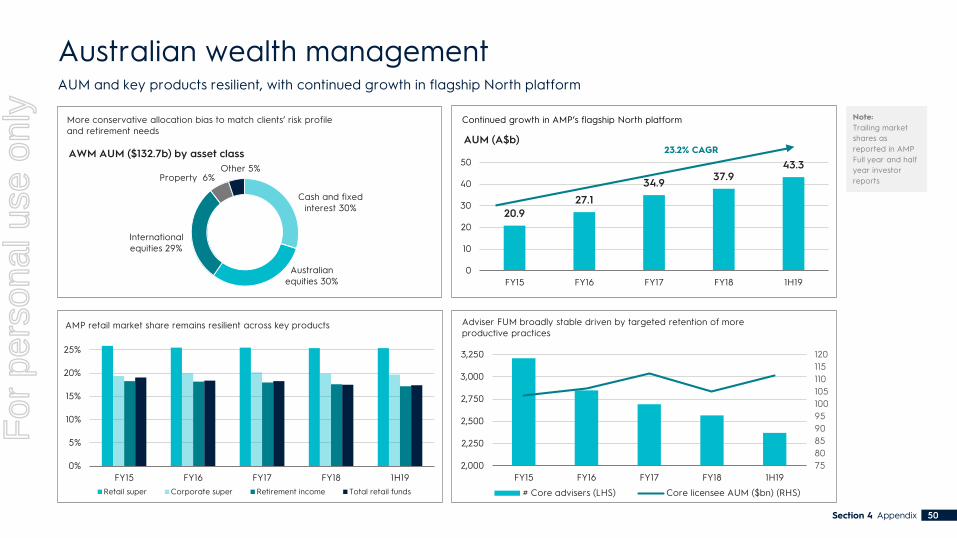
Australian wealth management
Section 4 Appendix 50
Cash and fixed interest 30%
Australian equities 30%
International equities 29%
Property 6%Other 5%
AWM AUM ($132.7b) by asset class
More conservative allocation bias to match clients’ risk profile and retirement needs
AUM and key products resilient, with continued growth in flagship North platform
0%
5%
10%
15%
20%
25%
FY15 FY16 FY17 FY18 1H19Retail super Corporate super Retirement income Total retail funds
AMP retail market share remains resilient across key products
20.927.1
34.9 37.943.3
0
10
20
30
40
50
FY15 FY16 FY17 FY18 1H19
AUM (A$b)23.2% CAGR
Continued growth in AMP’s flagship North platform
7580859095100105110115120
2,000
2,250
2,500
2,750
3,000
3,250
FY15 FY16 FY17 FY18 1H19
# Core advisers (LHS) Core licensee AUM ($bn) (RHS)
Adviser FUM broadly stable driven by targeted retention of more productive practices
Note: Trailing market shares as reported in AMP Full year and half year investor reports
For
per
sona
l use
onl
y

AMP Bank
Section 4 Appendix 51
171
194201
200 202
1H17 2H17 1H18 2H18 1H19
Revenue (A$m) 8.7% CAGR
7.9% 8.3%9.7%
10.9% 11.1%
0%
2%
4%
6%
8%
10%
12%
FY15 FY16 FY17 FY18 1H19
Common Equity Tier 1 (%)
AMP Regional Peer Avg. *Regional Peer Avg. 1
AMP Bank has consistently delivered higher returns on capital than its peer group AMP Bank remains well capitalised compared to peers and regulatory requirements
AMP Bank has achieved strong growth in revenue, mortgage lending and deposit funding over time
$14.6 $16.5 $18.9 $19.5 $19.7
FY15 FY16 FY17 FY18 1H19
Residential mortgage portfolio (A$b)
8.9% CAGR
$9.6
$11.5 $12.4
$13.3 $13.9
FY15 FY16 FY17 FY18 1H19
Total deposits (A$b) 11.0% CAGR
A well capitalised bank delivering an attractive return on capital
Note:
1. Based on current disclosure of regional bank peers
16.3% 16.6% 16.7%
13.5% 14.1%
0%
5%
10%
15%
20%
1H17 2H17 1H18 2H18 1H19
Return on capital (%)
AMP Regional Peer Avg. *Regional Peer Avg. 1
For
per
sona
l use
onl
y
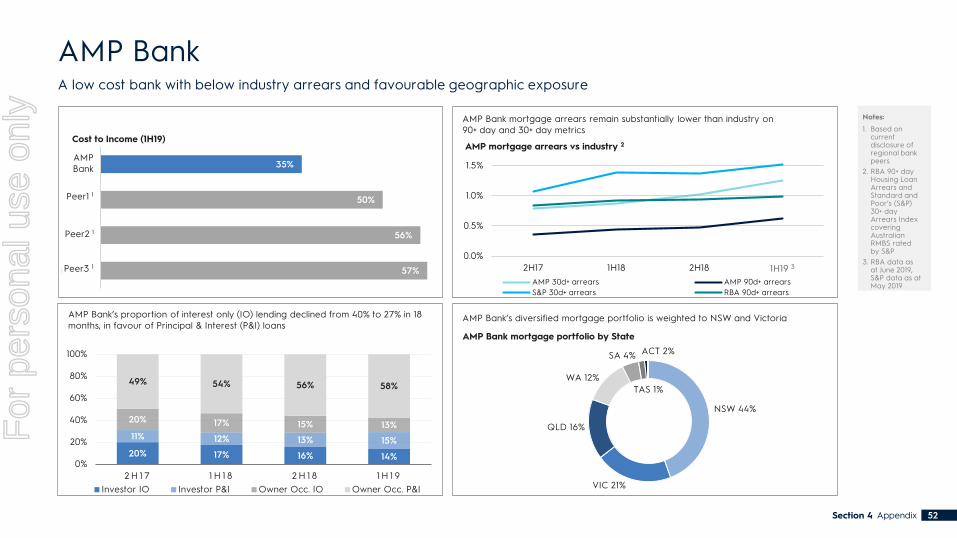
AMP Bank
Section 4 Appendix 52
20% 17% 16% 14%
11% 12% 13% 15%
20% 17% 15% 13%
49% 54% 56% 58%
0%
20%
40%
60%
80%
100%
2 H 1 7 1 H 1 8 2 H 1 8 1 H 1 9Investor IO Investor P&I Owner Occ. IO Owner Occ. P&I
AMP Bank has a leading cost to income ratio versus its peer group
0.0%
0.5%
1.0%
1.5%
2H17 1H18 2H18 1H19 ^
AMP mortgage arrears vs industry 2
AMP 30d+ arrears AMP 90d+ arrearsS&P 30d+ arrears RBA 90d+ arrears
1H19 3
NSW 44%
VIC 21%
QLD 16%
WA 12%
SA 4% ACT 2%
TAS 1%
AMP Bank mortgage portfolio by State
AMP Bank mortgage arrears remain substantially lower than industry on 90+ day and 30+ day metrics
AMP Bank’s diversified mortgage portfolio is weighted to NSW and VictoriaAMP Bank’s proportion of interest only (IO) lending declined from 40% to 27% in 18 months, in favour of Principal & Interest (P&I) loans
A low cost bank with below industry arrears and favourable geographic exposure
Notes:
1. Based on current disclosure of regional bank peers
2. RBA 90+ day Housing Loan Arrears and Standard and Poor’s (S&P) 30+ day Arrears Index covering Australian RMBS rated by S&P
3. RBA data as at June 2019, S&P data as at May 2019
57%
56%
50%
35%
Peer3 *
Peer2 *
Peer1 *
AMPbank
Cost to Income (1H19)
Peer1 1
Peer2 1
Peer3 1
AMPBank
For
per
sona
l use
onl
y
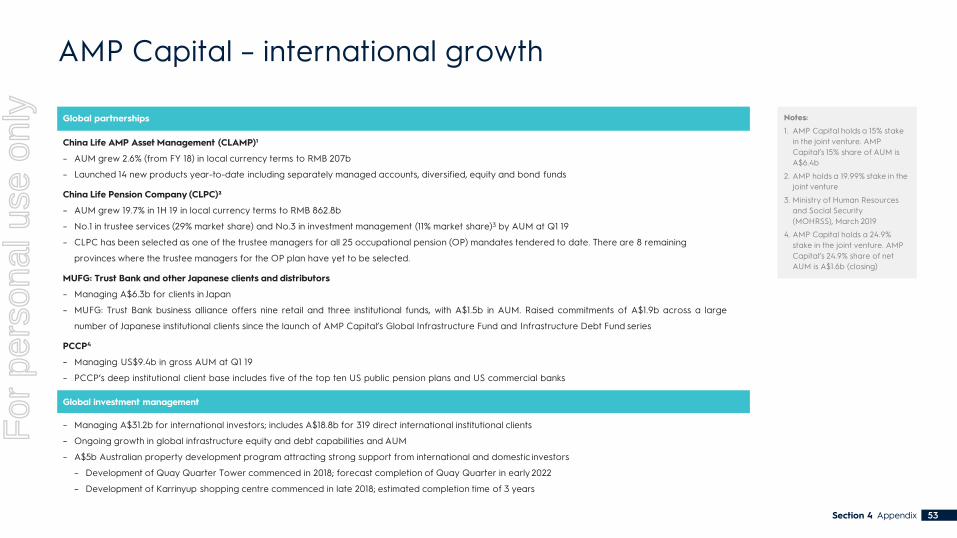
AMP Capital – international growth
Global partnerships
China Life AMP Asset Management (CLAMP)¹
– AUM grew 2.6% (from FY 18) in local currency terms to RMB 207b
– Launched 14 new products year-to-date including separately managed accounts, diversified, equity and bond funds
China Life Pension Company (CLPC)²
– AUM grew 19.7% in 1H 19 in local currency terms to RMB 862.8b
– No.1 in trustee services (29% market share) and No.3 in investment management (11% market share)3 by AUM at Q1 19
– CLPC has been selected as one of the trustee managers for all 25 occupational pension (OP) mandates tendered to date. There are 8 remaining
provinces where the trustee managers for the OP plan have yet to be selected.
MUFG: Trust Bank and other Japanese clients and distributors
– Managing A$6.3b for clients in Japan
– MUFG: Trust Bank business alliance offers nine retail and three institutional funds, with A$1.5b in AUM. Raised commitments of A$1.9b across a large
number of Japanese institutional clients since the launch of AMP Capital’s Global Infrastructure Fund and Infrastructure Debt Fund series
PCCP4
– Managing US$9.4b in gross AUM at Q1 19
– PCCP’s deep institutional client base includes five of the top ten US public pension plans and US commercial banks
Global investment management
– Managing A$31.2b for international investors; includes A$18.8b for 319 direct international institutional clients
– Ongoing growth in global infrastructure equity and debt capabilities and AUM
– A$5b Australian property development program attracting strong support from international and domestic investors
– Development of Quay Quarter Tower commenced in 2018; forecast completion of Quay Quarter in early 2022
– Development of Karrinyup shopping centre commenced in late 2018; estimated completion time of 3 years
Notes:
1. AMP Capital holds a 15% stakein the joint venture. AMP Capital’s 15% share of AUM isA$6.4b
2. AMP holds a 19.99% stake in thejoint venture
3. Ministry of Human Resources and Social Security (MOHRSS), March 2019
4. AMP Capital holds a 24.9% stake in the joint venture. AMP Capital’s 24.9% share of net AUM is A$1.6b (closing)
Section 4 Appendix 53
For
per
sona
l use
onl
y
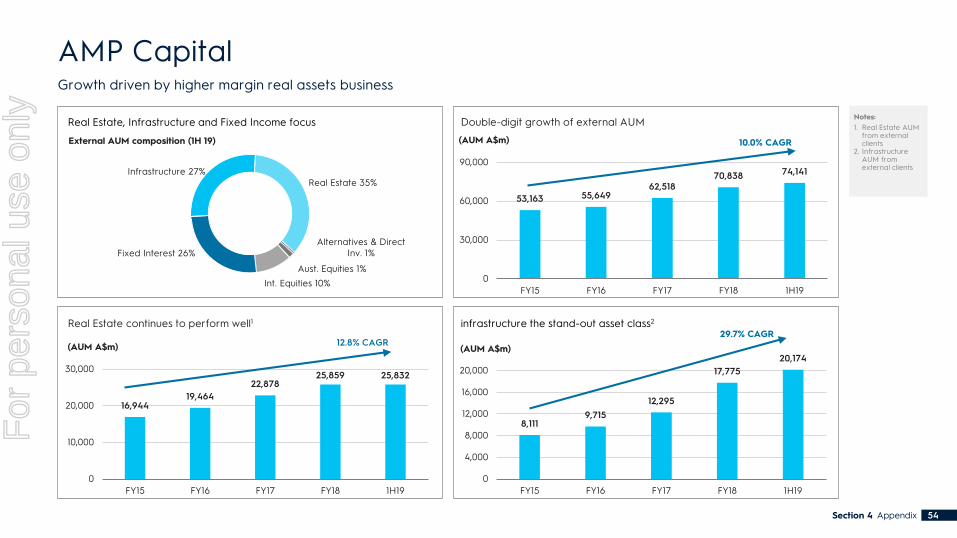
Notes:1. Real Estate AUM
from external clients
2. Infrastructure AUM from external clients
AMP Capital
Appendix 54Section 4
16,94419,464
22,87825,859 25,832
0
10,000
20,000
30,000
FY15 FY16 FY17 FY18 1H19
(AUM A$m) 12.8% CAGR
Aust. Equities 1%Int. Equities 10%
Fixed Interest 26%
Infrastructure 27%Real Estate 35%
Alternatives & Direct Inv. 1%
External AUM composition (1H 19)
Real Estate continues to perform well1
53,163 55,64962,518
70,838 74,141
0
30,000
60,000
90,000
FY15 FY16 FY17 FY18 1H19
(AUM A$m) 10.0% CAGR
8,1119,715
12,295
17,77520,174
0
4,000
8,000
12,000
16,000
20,000
FY15 FY16 FY17 FY18 1H19
(AUM A$m)29.7% CAGR
Double-digit growth of external AUM
infrastructure the stand-out asset class2
Growth driven by higher margin real assets business
Real Estate, Infrastructure and Fixed Income focus
For
per
sona
l use
onl
y

Proposed reform AMP position
Royal Commission into Misconduct in the Banking, Superannuation and Financial Services Industry (Final Report issued 4 February 2019)
– AMP continues to work with Government to ensure that recommendations are consistently applied and implemented with adequate timeframes to achieve intended client outcomes
Putting Members’ Interests First (PMIF)
Draft legislation introduced into Parliament on 4 July 2019 which aims to protect superannuation savings from undue erosion by insurance premiums, requiring that insurance be provided on an opt-in basis for clients with balances below $6,000 and any new clients who are under the age of 25
– AMP supports initiatives that aim to reduce erosion of superannuation balances – AMP believes more time is required for clients to make informed decisions about their arrangements so soon
after the commencement of the Protecting Your Super (PYS) reforms. AMP has raised this issue with Government.
Productivity Commission Final Report: Superannuation
Review of the competitiveness and efficiency of the superannuation system including an assessment of alternative default models (Final Report issued 10 January 2019)
– The Government has not formally responded to the Productivity Commission’s recommendations but has referred to some of them as part of its response to the Royal Commission Final Report
– We understand that the Government intends to conduct a Retirement Incomes Review. This review and the Terms of Reference are yet to be announced. When this occurs, AMP will participate in the consultation process
Design and distribution obligations for financial products
Legislation has been passed to require design and distribution obligations for financial products issuers and distributors to ensure that products are targeted and offered to the right clients – commences April 2021
– AMP supports in-principle the legislation and believes it will improve consumer protection and strengthen product and distribution governance.
– AMP has some implementation concerns, which were publicly raised in the consultation process and we continue to engage with Government and industry bodies on this matter
Improving Accountability and Member Outcomes in Superannuation
Legislation has been passed to require measures including but not limited to an annual member outcomes assessment for all MySuper and Choice products in superannuation (commences January 2020)
– AMP supports measures with the objective of improving member outcomes in superannuation. We are participating in the consultation process with the Government, regulators and the industry in relation to draft regulations and regulatory guidance
Consumer Data Right – open banking regime
Legislation has been passed to allow clients, at their request, to share their personal information with accredited institutions including other banks, to allow them to find a better deal on their banking products – commences July 2020
– AMP supports the implementation of a safe and secure open banking regime to increase competition and improve client outcomes
– We are participating in the industry consultation process in relation to associated regulatory guidance
Legislative and regulatory environment
Section 4 Appendix 55
For
per
sona
l use
onl
y

Important notice
Summary information This presentation has been prepared by AMP Limited (ABN 49 079 354 519) (“AMP"). It is a presentation of general background information about AMP’s activities current at the date of this presentation, which may be subject to change. The information is in a summary form and does not purport to be complete, comprehensive or to comprise all the information which a securityholder or potential investor in AMP may require in order to determine whether to deal in AMP securities, nor does it contain all the information which would be required in a disclosure document prepared in accordance with the Corporations Act 2001 (Cth) (“Corporations Act”). It is to be read in conjunction with AMP’s other announcements released to the Australian Securities Exchange (available at www.asx.com.au).
Nothing contained in this presentation constitutes financial product, investment, legal, tax or other advice or any recommendation. It does not take into account the investment objectives, financial situation or needs of any particular investor. The appropriateness of the information in this presentation should be considered by you having regard to your own investment objectives, financial situation and needs and with your own professional advice, when deciding if an investment is appropriate.
Forward-looking statement This presentation contains forward looking statements, including statements regarding the financial condition, results of operations and business of AMP, the sale of AMP Life and the implementation of AMP’s announced strategy. These statements relate to expectations, beliefs, intentions or strategies regarding the future. Forward looking statements may be identified by the use of words like ‘anticipate’, ‘believe’, ‘aim’, ‘estimate’, ‘expect’, ‘intend’, ‘may’, ‘plan’, ‘project’, ‘will’, ‘should’, ‘seek’ and similar expressions.
Indications of, and guidance on, future earnings and financial position and performance are also forward-looking statements, as well as statements about market and industry trends, which are based on interpretations of current market conditions. The forward-looking statements reflect views and assumptions with respect to future events as of the date of this presentation. However, they are not guarantees of future performance. They involve known and unknown risks, uncertainties, assumptions, contingencies and other factors, many of which are beyond the control of AMP and its related bodies corporate and affiliates and each of their respective directors, securityholders, officers, employees, partners, agents, advisers and management, and may involve significant elements of subjective judgement and assumptions as to future events that may or may not be correct. Forward-looking statements speak only as of the date of this presentation and there can be no assurance that actual outcomes will not differ materially. Past performance is not indicative of future performance.
No guarantee, representation or warranty, express or implied, is made as to the accuracy, likelihood of achievement or reasonableness of any forecasts, prospects, returns, statements or tax treatment in relation to future matters contained in this presentation. Readers are cautioned not to place undue reliance on the forward-looking statements, which are based only on information currently available to AMP. Except as required by applicable laws or regulations, AMP does not undertake to publicly update or revise the forward-looking statements or other statements in this presentation, whether as a result of new information or future events or circumstances.
Section 4 Appendix 56
For
per
sona
l use
onl
y

Important notice (continued)
Financial dataInvestors should note that this presentation contains proforma historical financial information. The proforma financial information provided in this presentation is for illustrative purposes only and is not represented as being indicative of AMP’s, nor anyone else’s, views on its future financial condition and/or performance. The proforma financial information has been prepared on the basis set out on page 58. Investors should also note that the proforma financial information does not purport to be in compliance with Article 11 of Regulation S-X of the rules and regulations of the U.S. Securities and Exchange Commission.
Investors should be aware that certain financial measures included in this presentation are ‘non-IFRS financial information’ under ASIC Regulatory Guide 230: ‘Disclosing non-IFRS financial information’ published by ASIC and also ‘non-GAAP financial measures’ within the meaning of Regulation G under the U.S. Securities Exchange Act of 1934, as amended, and are not recognised under Australian Accounting Standards (“AAS”) and International Financial Reporting Standards (“IFRS”). The non-IFRS financial information/non-GAAP financial measures include, amongst others, underlying profit, various regulatory capital measures and key operational metrics. The disclosure of non-GAAP financial measures in the manner included in this presentation may not be permissible in a registration statement under the U.S. Securities Act of 1933, as amended (“U.S. Securities Act”). Those non-IFRS financial information/non-GAAP financial measures do not have a standardised meaning prescribed by AAS or IFRS. Therefore, the non-IFRS financial information/non-GAAP financial measures may not be comparable to similarly titled measures presented by other entities and should not be construed as an alternative to other financial measures determined in accordance with AAS or IFRS. Although AMP believes these non-IFRS financial information/non-GAAP financial measures provide useful information to investors in measuring the financial performance and condition of its business, investors are cautioned not to place undue reliance on any non-IFRS financial information/non-GAAP financial measures included in this presentation. The financial information in this presentation is presented in an abbreviated form insofar as it does not include all of this presentation and disclosures required by the AAS and other mandatory professional reporting requirements applicable to general purpose financial reports prepared in accordance with the Corporations Act.
Section 4 Appendix 57
For
per
sona
l use
onl
y

Important notice (continued)
Financial data and rounding All dollar values are in Australian dollars ($) and financial data is presented as at 30 June 2019 unless stated otherwise. A number of figures, amounts, percentages estimates, calculations of value and other fractions used in this presentation are subject to the effect of rounding. Accordingly, the actual calculation of these figures may differ from the figures set out in this presentation.
No offer or sale The securities mentioned herein have not been, and will not be, registered under the U.S. Securities Act, and may not be offered or sold in the United States absent registration or an exemption from the registration requirements of the U.S. Securities Act.
Disclaimer To the maximum extent permitted by law, AMP and its affiliates and related bodies corporate and each of their respective directors, officers, partners, employees, agents and advisers exclude and expressly disclaim:
– all duty and liability (including, without limitation, any liability arising from fault, negligence or negligent misstatement) for any expenses, losses, damage or costs incurred by you as a result of the information in this presentation being inaccurate or incomplete in any way for any reason, whether by negligence or otherwise;
– any obligations or undertaking to release any updates or revisions to the information in this presentation to reflect any change in expectations or assumptions; and
– all liabilities in respect of, and make no representation or warranty, express or implied, as to the currency, accuracy, reliability or completeness of information in this presentation or that this presentation contains all material information about AMP or which a prospective investor or purchaser may require in evaluating a possible investment in AMP or acquisition of securities in AMP, or likelihood of fulfilment of any forward-looking statement or any event or results expressed or implied in any forward-looking statement.
Statements made in this presentation are made only as at the date of this presentation. The information in this presentation remains subject to change without notice. AMP may in its absolute discretion, but without being under any obligation to do so, update or supplement this presentation. Any further information will be provided subject to the terms and conditions contained in this Important Notice.
In consideration for being given access to this presentation, you confirm, acknowledge and agree to the matters set out in this Important Notice and any modifications notified to you.
Section 4 Appendix 58
For
per
sona
l use
onl
y

Thank you
For
per
sona
l use
onl
y