2019 half y ear - bic
TRANSCRIPT

20 19 Ha l f Yea r
F i n a n c i a l R epo r t •

MANAGEMENT REPORT OF THE BOARD OF DIRECTORS FOR THE 6-MONTH PERIOD ENDED JUNE 30, 2019 1
Key figures1.1 2H1 2019 Highlights1.2 3H1 2019 Group operational trends1.3 4H1 2019 operational trends by category1.4 6BIC Group Net Sales by geography1.5 8Impact of change in perimeter and currency 1.6fluctuations on net sales (excludes Argentinian Peso) 8Reconciliation with alternative performance 1.7measures 9Share repurchase program – cancelled shares1.8 10Related-party transactions1.9 10Capital evolution1.10 10Material events that occurred in H1 20191.11 11Material events that occurred after June 30, 20191.12 11Description of the principal risks and uncertainties 1.13for H2 2019 11Full-Year 2019 Outlook1.14 12Glossary1.15 12
HALF-YEAR CONSOLIDATED FINANCIAL STATEMENTS 13
Consolidated income statement2.1 14Consolidated statement of comprehensive income2.2 15Consolidated statement of financial position2.3 16Consolidated statement of changes in equity2.4 18Consolidated cash flow statement2.5 19Notes to the half-year consolidated financial 2.6statements 21
AUDITOR'S REPORT 37
STATEMENT ON THE HALF-YEARLY REPORT 2019 39

1• GROUPE BIC - 2019 HALF-YEAR FINANCIAL REPORT •
MANAGEMENT REPORT OF THE BOARD OF DIRECTORS FOR THE 6-MONTH PERIOD ENDED JUNE 30, 2019
KEY FIGURES1.1 2
H1 2019 HIGHLIGHTS1.2 3
H1 2019 GROUP OPERATIONAL TRENDS1.3 4
H1 2019 OPERATIONAL TRENDS BY CATEGORY1.4 6
BIC GROUP NET SALES BY GEOGRAPHY1.5 8
IMPACT OF CHANGE IN PERIMETER AND CURRENCY FLUCTUATIONS 1.6ON NET SALES (EXCLUDES ARGENTINIAN PESO) 8
RECONCILIATION WITH ALTERNATIVE PERFORMANCE MEASURES1.7 9
SHARE REPURCHASE PROGRAM – CANCELLED SHARES1.8 10
RELATED-PARTY TRANSACTIONS1.9 10
CAPITAL EVOLUTION1.10 10
MATERIAL EVENTS THAT OCCURRED IN H1 20191.11 11
MATERIAL EVENTS THAT OCCURRED AFTER JUNE 30, 20191.12 11
DESCRIPTION OF THE PRINCIPAL RISKS AND UNCERTAINTIES FOR H2 20191.13 11
FULL-YEAR 2019 OUTLOOK1.14 12
GLOSSARY1.15 12
MANAGEMENT REPORT OF THE BOARD OF DIRECTORS FOR THE 6-MONTH PERIOD ENDED JUNE 30, 2019
Key figures
2 • GROUPE BIC - 2019 HALF-YEAR FINANCIAL REPORT •
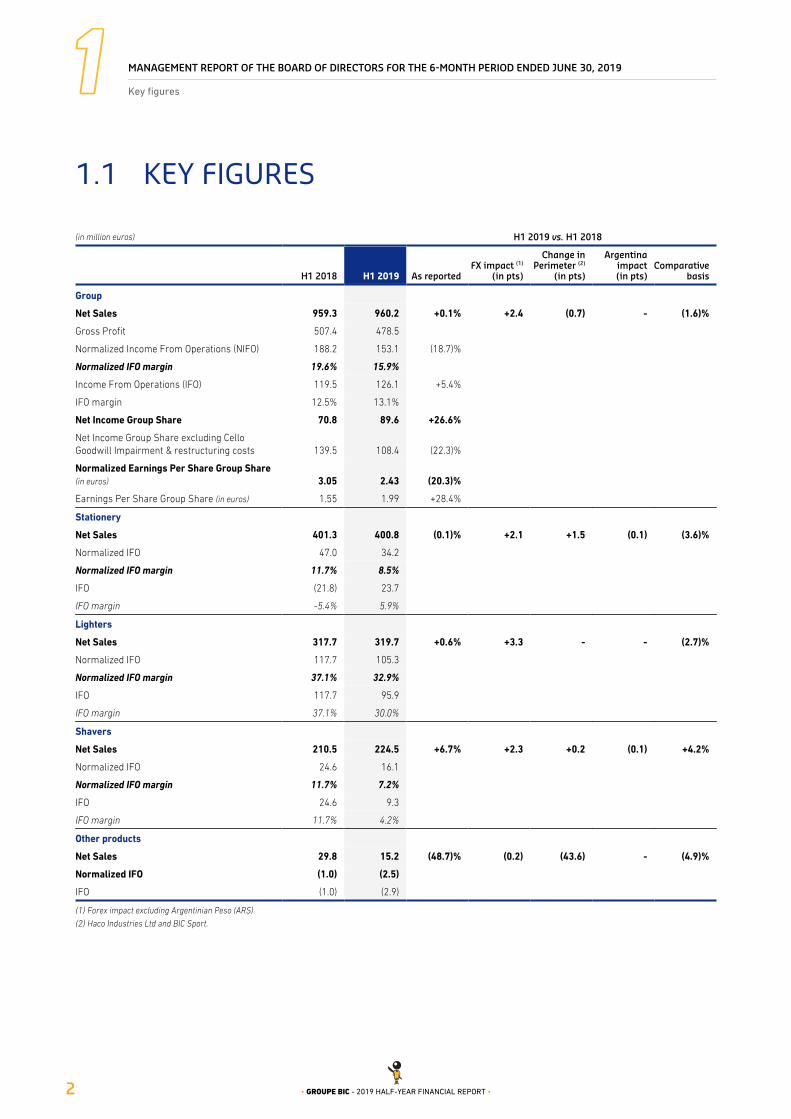
KEY FIGURES1.1
(in million euros) H1 2019 vs. H1 2018
H1 2018 H1 2019 As reportedFX impact (1)
(in pts)
Change inPerimeter (2)
(in pts)
Argentinaimpact(in pts)
Comparativebasis
Group
Net Sales 959.3 960.2 +0.1% +2.4 (0.7) - (1.6)%
Gross Profit 507.4 478.5
Normalized Income From Operations (NIFO) 188.2 153.1 (18.7)%
Normalized IFO margin 19.6% 15.9%
Income From Operations (IFO) 119.5 126.1 +5.4%
IFO margin 12.5% 13.1%
Net Income Group Share 70.8 89.6 +26.6%
Net Income Group Share excluding Cello Goodwill Impairment & restructuring costs 139.5 108.4 (22.3)%
Normalized Earnings Per Share Group Share (in euros) 3.05 2.43 (20.3)%
Earnings Per Share Group Share (in euros) 1.55 1.99 +28.4%
Stationery
Net Sales 401.3 400.8 (0.1)% +2.1 +1.5 (0.1) (3.6)%
Normalized IFO 47.0 34.2
Normalized IFO margin 11.7% 8.5%
IFO (21.8) 23.7
IFO margin -5.4% 5.9%
Lighters
Net Sales 317.7 319.7 +0.6% +3.3 - - (2.7)%
Normalized IFO 117.7 105.3
Normalized IFO margin 37.1% 32.9%
IFO 117.7 95.9
IFO margin 37.1% 30.0%
Shavers
Net Sales 210.5 224.5 +6.7% +2.3 +0.2 (0.1) +4.2%
Normalized IFO 24.6 16.1
Normalized IFO margin 11.7% 7.2%
IFO 24.6 9.3
IFO margin 11.7% 4.2%
Other products
Net Sales 29.8 15.2 (48.7)% (0.2) (43.6) - (4.9)%
Normalized IFO (1.0) (2.5)
IFO (1.0) (2.9)
Forex impact excluding Argentinian Peso (ARS).(1)
Haco Industries Ltd and BIC Sport. (2)

MANAGEMENT REPORT OF THE BOARD OF DIRECTORS FOR THE 6-MONTH PERIOD ENDED JUNE 30, 2019
H1 2019 Highlights
3• GROUPE BIC - 2019 HALF-YEAR FINANCIAL REPORT •
H1 2019 HIGHLIGHTS1.2
NET SALES
Stationery: 400.8 million euros (-3.6% on a comparative basis)●
Lighters: 319.7 million euros (-2.7% on a comparative basis)●
Shavers: 224.5 million euros (+4.2% on a comparative basis)●
RESULTS
Normalized Income From Operations (NIFO): 153.1 million euros (-18.7% as reported)●
Normalized IFO margin: 15.9% compared to 19.6% in H1 2018●
Reported Income From Operations (IFO): 126.1 million euros (+5.4% as reported)●
Earnings Per Share Group share: 1.99 euros (+28.4% as reported)●
Normalized Earning Per Share Group share: 2.43 euros (-20.3% as reported)●
Net cash position as of June 30, 2019: -11.0 million euros●
MANAGEMENT REPORT OF THE BOARD OF DIRECTORS FOR THE 6-MONTH PERIOD ENDED JUNE 30, 2019
H1 2019 Group operational trends
4 • GROUPE BIC - 2019 HALF-YEAR FINANCIAL REPORT •
H1 2019 GROUP OPERATIONAL TRENDS1.3
NET SALES
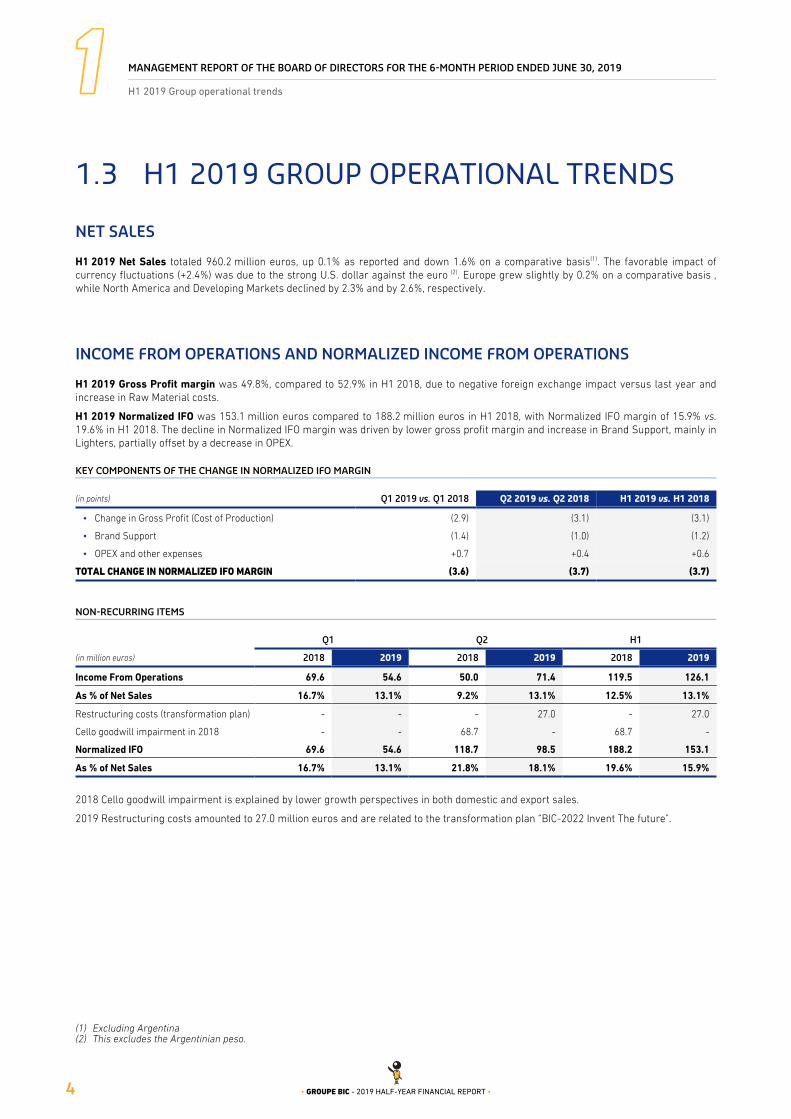
H1 2019 Net Sales totaled 960.2 million euros, up 0.1% as reported and down 1.6% on a comparative basis(1). The favorable impact ofcurrency fluctuations (+2.4%) was due to the strong U.S. dollar against the euro (2). Europe grew slightly by 0.2% on a comparative basis ,while North America and Developing Markets declined by 2.3% and by 2.6%, respectively.
INCOME FROM OPERATIONS AND NORMALIZED INCOME FROM OPERATIONS
H1 2019 Gross Profit margin was 49.8%, compared to 52.9% in H1 2018, due to negative foreign exchange impact versus last year andincrease in Raw Material costs.
H1 2019 Normalized IFO was 153.1 million euros compared to 188.2 million euros in H1 2018, with Normalized IFO margin of 15.9% vs.19.6% in H1 2018. The decline in Normalized IFO margin was driven by lower gross profit margin and increase in Brand Support, mainly inLighters, partially offset by a decrease in OPEX.
KEY COMPONENTS OF THE CHANGE IN NORMALIZED IFO MARGIN
(in points) Q1 2019 vs. Q1 2018 Q2 2019 vs. Q2 2018 H1 2019 vs. H1 2018
Change in Gross Profit (Cost of Production)• (2.9) (3.1) (3.1)
Brand Support• (1.4) (1.0) (1.2)
OPEX and other expenses• +0.7 +0.4 +0.6
TOTAL CHANGE IN NORMALIZED IFO MARGIN (3.6) (3.7) (3.7)
NON-RECURRING ITEMS
(in million euros)
Q1 Q2 H1
2018 2019 2018 2019 2018 2019
Income From Operations 69.6 54.6 50.0 71.4 119.5 126.1
As % of Net Sales 16.7% 13.1% 9.2% 13.1% 12.5% 13.1%
Restructuring costs (transformation plan) - - - 27.0 - 27.0
Cello goodwill impairment in 2018 - - 68.7 - 68.7 -
Normalized IFO 69.6 54.6 118.7 98.5 188.2 153.1
As % of Net Sales 16.7% 13.1% 21.8% 18.1% 19.6% 15.9%
2018 Cello goodwill impairment is explained by lower growth perspectives in both domestic and export sales.
2019 Restructuring costs amounted to 27.0 million euros and are related to the transformation plan “BIC-2022 Invent The future".
Excluding Argentina(1)This excludes the Argentinian peso.(2)

MANAGEMENT REPORT OF THE BOARD OF DIRECTORS FOR THE 6-MONTH PERIOD ENDED JUNE 30, 2019
H1 2019 Group operational trends
5• GROUPE BIC - 2019 HALF-YEAR FINANCIAL REPORT •
NET INCOME AND EPS
H1 2019 Income before tax was at 124.4 million euros, compared to 125.3 million euros in H1 2018. Net finance revenue was negative1.7 million euros compared to a positive 5.8 million euros in H1 2018. H1 2018 benefited from a favorable impact of the fair valueadjustments to financial assets denominated in USD (BRL and €), while H1 2019 is negatively impacted by hyperinflation accountingrelated to Argentina.
H1 2019 Net Income Group Share was 89.6 million euros as reported, compared to 70.8 million euros in H1 2018. H1 Net Income Groupshare excluding restructuring costs and Cello goodwill impairment was 108.4 million euros compared to 139.5 million euros last year.The effective tax rate was 28.0%.
Q2 2019 Net Income Group Share was 50.3 million euros compared to 22.2 million euros in Q2 2018. Q2 2019 Net Income Group Shareexcluding restructuring costs and Cello goodwill impairment was 69.1 million euros compared to 90.9 million euros last year.
H1 2019 EPS Group share was 1.99 euros, up 28.4%, compared to 1.55 euros in H1 2018. Normalized H1 2019 EPS Group sharedecreased 20.3% to 2.43 euros, compared to 3.05 euros last year.
Q2 2019 EPS Group Share was 1.11 euros up 126.5%, compared to 0.49 euros in Q2 2018. Normalized Q2 2019 EPS Group sharedecreased 22.1% to 1.55 euros, compared to 1.99 euros last year.
NET CASH POSITION
At the end of June 2019, the Group’s net cash position stood at -11.0 million euros.
CHANGE IN NET CASH POSITION
(in million euros) 2018 2019
NET CASH POSITION (BEGINNING OF PERIOD - DECEMBER) 204.9 161.5
Net cash from operating activities• +83.1 +79.6
Of which operating cash flow• +197.7 +164.7
Of which change in working capital and others• (114.6) (85.1)
CAPEX• (51.6) (47.5)
Dividend payment• (157.8) (155.2)
Share buyback program• (23.9) (39.2)
Net cash from the exercise of stock options and the liquidity contract• +1.4 (0.8)
Haco Industries Ltd acquisition• - (1.8)
Proceeds from the sale of BIC Graphic North America and Asian Sourcing• +9.2 -
Others• (10.2) (7.6)
NET CASH POSITION (END OF PERIOD - JUNE) 55.1 (11.0)
Net cash from operating activities was +79.6 million euros, including +164.7 million euros in operating cash flow. The negative 85.1million euros change in working capital, and others was notably driven by accounts receivables and inventory increased when comparedto December 2018 mainly due to preparation for Back-to-School season reinforced by a negative phasing impact from June to July. Netcash was also negatively impacted by investments in CAPEX as well as the dividend payments and share buybacks.
SHAREHOLDERS’ REMUNERATION
Ordinary dividend of 3.45 euros per share paid in June 2019.●
39.2 million euros in share buy-backs by Société BIC at the end of June 2019 (478,667 shares purchased at an average price of●
81.83 euros).

MANAGEMENT REPORT OF THE BOARD OF DIRECTORS FOR THE 6-MONTH PERIOD ENDED JUNE 30, 2019
H1 2019 operational trends by category
6 • GROUPE BIC - 2019 HALF-YEAR FINANCIAL REPORT •
H1 2019 OPERATIONAL TRENDS 1.4BY CATEGORY
StationeryStationery H1 2019 Net Sales were flat as reported, down 1.1%at constant currency and down 3.6% on a comparative basis. Q22019 Net Sales were up 1.2% as reported, down 0.6% atconstant currency and 2.3% on a comparative basis.
In Europe, in a slightly growing market up 1.8% in value(1), BIC●
gained 0.1 points in value share. H1 Net Sales were downlow-single digit impacted by a negative Back-to-Schoolphasing in France during Q2, with shipments to customerspostponed from June to July . This more than offset the goodperformance of our added-value products such as BIC®Gelocity Quick Dry and recently launched BIC® IntensityMedium felt pen.
In North America, we performed in line with a flattish U.S.●
Stationery market and we were able to gain shares inadded-value segments such as Gel and Permanent Markerand in e-commerce (+0.7 points in value)(2). H1 Net Sales wereflat, impacted by a negative phasing of Back-to-Schoolshipments from June to July. We continued to see newproducts such as BIC® Gelocity Ultra and BIC® BodyMarktattoo marker performing successfully.
distributor of adhesive labels) in Q1 as well as by weakperformance in Ecuador during H1. In Mexico, despite ahighly competitive environment, BIC is outperforming themarket(3) notably in Ball Pen and Marking. In Brazil ourperformance was fueled by distribution gains in Ball Pen andGraphite segments as we gained 0.8 pts in value(4) in adeclining market.
H1 Net Sales in Latin America were down mid-single digit as●
we were overall impacted by Pimaco (our manufacturer and
In the Middle-East and Africa region, we continued to see the●
benefits from the transfer of Haco Industries Ltd’manufacturing facilities and distribution activities during H1.Our change in route-to-market in East Africa drove adouble-digit increase in Net Sales in the region.
Cello Pens H1 Domestic Sales were down low-double digit as●
we were negatively impacted by our initiative to reduceshipments to superstockists in India to support our change inroute-to-market strategy. However, as expected we started torecover in Q2, with Domestic Net Sales growing mid-singledigit, fueled by the performance of our Champion Brands suchas Butterflow.
H1 2019 Normalized IFO margin for Stationery was 8.5%,compared to 11.7% in H1 2018 mainly driven by higher RawMaterial costs, unfavorable forex trends and higher Brand Supportinvestments. Q2 2019 Normalized IFO margin was 12.8%,compared to 15.0% in Q2 2018.
GFK YTD May 2019 in value.(1)NPD YTD June 2019 in value.(2)Nielsen YTD June 2019 (Home panel - 25% coverage), in value(3)Nielsen YTD June 2019 (Home panel - 10% coverage), in value(4)

MANAGEMENT REPORT OF THE BOARD OF DIRECTORS FOR THE 6-MONTH PERIOD ENDED JUNE 30, 2019
H1 2019 operational trends by category
7• GROUPE BIC - 2019 HALF-YEAR FINANCIAL REPORT •
LightersLighters H1 2019 Net Sales increased by 0.6% as reported, down1.9% at constant currency, and down by 2.7% on a comparativebasis. Second Quarter 2019 Net Sales were up by 3.0% asreported, by 0.7% at constant currency, and flat on acomparative basis.
H1 Net Sales were up low-single digit in Europe as we●
progressively implemented price adjustments acrosscountries and distribution channels. Our first majoradvertising campaign launched in France, Belgium andGermany to address directly our consumers showedencouraging results and reinforced BIC’s brand image ofquality and safety.
The U.S. Non-Refillable Pocket lighter market declined by●
5.0% in value year-to-date(1), in which BIC gained 0.2 points inmarket share. In this challenging environment, following aweak Q1, North America H1 Net Sales decreased mid-singledigit.
In Latin America, H1 Net Sales were up low-single digit fueled●
by Brazil. Both customer pre-buys ahead of the April priceincrease and further distribution gains drove overallperformance in the region.
H1 2019 Normalized IFO margin for Lighters was 32.9%,compared to 37.1% in H1 2018, the decrease was mainly driven byunfavorable forex trend and higher Brand Support investments inparticular with the lighter campaign in Europe. Q2 2019Normalized IFO margin was 34.5%, compared to 38.4% in Q22018.
ShaversShavers H1 2019 Net Sales increased by 6.7% as reported, by5.6% at constant currency, and also increased by 4.2% on acomparative basis. Q2 2019 Net Sales increased by 1.8% asreported, by 0.8% at constant currency and decreased by 0.7%on a comparative basis.
In Europe, BIC outperformed a flat market, gaining 0.5 points●
in value(2), while H1 Net Sales were up mid-single digit. InWestern Europe, performance was driven by bothadded-value products such as BIC® Flex 3, BIC® Miss Soleiland BIC® Flex 5, and by recent launches with BIC® Miss SoleilSensitive. In Russia, the continued momentum of BIC® Flex 3Hybrid and successful launch of BIC® Flex 5 Hybrid, coupledwith further distribution gains drove growth during H1.
North America H1 Net Sales were up low-single digit,●
propelled by both value and high-end products. In a decliningU.S. one-piece market (down by 5% in value (3), BIC gained 1.9points thanks to Women one-piece segment with theintroduction of commercial innovations on BIC® Silky Touch,solid performance of our BIC® Soleil franchise (BIC® SoleilSensitive, BIC® Soleil Bella, BIC® Soleil Balance), in addition tothe successful launch of BIC® Soleil Click 5.
Latin America H1 Net Sales were up mid-single digit. BIC●
outperformed in a relatively flat market in Mexico, gaining1.1 points in value (4) driven by further product premiumizationtowards the three-blade offering with BIC® Miss SoleilSensitive and BIC® Flex 3. Brazil performance was also key asBIC gained 0.3 points in a declining market (down by 1.1% invalue), with continued distribution gains, in line with ourproduct trade-up strategy.
H1 Net Sales were up low double digit in Middle-East and●
Africa, fueled by the Flex range in Morocco and South Africa,and by strong promotional activities with BIC®1 during theAfrican Cup of Nations in West African countries and in SouthAfrica.
H1 2019 Normalized IFO margin for Shavers was 7.2% comparedto 11.7% in H1 2018. Sales volume increase were offset byunfavorable forex trends as well as by higher Raw Material costsand increase in Brand Support. Q2 2019 Normalized IFO marginwas 7.3%, compared to 14.9% in Q2 2018.
Other ProductsH1 2019 Net Sales of Other Products decreased by 48.7% asreported and by 4.9% on a comparative basis. Q2 2019 Net Salesdecreased by 56.3% as reported and by 4.3% on a comparativebasis.
H1 2019 Normalized IFO for Other Products was negative2.5 million euros, compared to a negative 1.0 million euros inH1 2018 including BIC Sport for a positive 1.0 million euros. Q22019 Normalized IFO for Other Products was negative0.9 million euros, compared to positive 1.2 million euros last yearincluding BIC Sport for a positive 1.1 million euros.
IRI YTD Period ending June 30, 2019, in value(1)Nielsen YTD April 2019 – Total disposable Market – EU 5 average : France, Italy, Poland, UK and Russia - in value(2)IRI YTD Period ending June 30, 2019 - in value(3)Nielsen – Shaver Disposable – YTD May 2019 - in value(4)
MANAGEMENT REPORT OF THE BOARD OF DIRECTORS FOR THE 6-MONTH PERIOD ENDED JUNE 30, 2019
BIC Group Net Sales by geography
8 • GROUPE BIC - 2019 HALF-YEAR FINANCIAL REPORT •
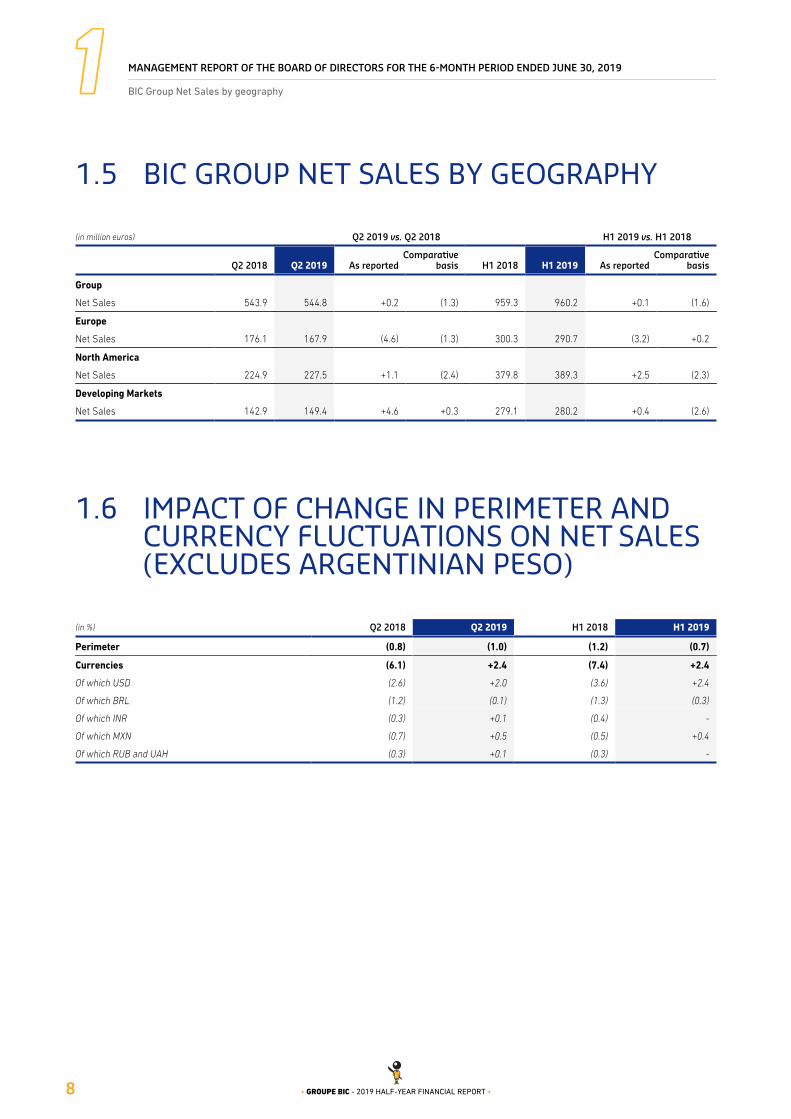
BIC GROUP NET SALES BY GEOGRAPHY1.5
(in million euros) Q2 2019 vs. Q2 2018 H1 2019 vs. H1 2018
Q2 2018 Q2 2019 As reportedComparative
basis H1 2018 H1 2019 As reportedComparative
basis
Group
Net Sales 543.9 544.8 +0.2 (1.3) 959.3 960.2 +0.1 (1.6)
Europe
Net Sales 176.1 167.9 (4.6) (1.3) 300.3 290.7 (3.2) +0.2
North America
Net Sales 224.9 227.5 +1.1 (2.4) 379.8 389.3 +2.5 (2.3)
Developing Markets
Net Sales 142.9 149.4 +4.6 +0.3 279.1 280.2 +0.4 (2.6)
IMPACT OF CHANGE IN PERIMETER AND 1.6CURRENCY FLUCTUATIONS ON NET SALES (EXCLUDES ARGENTINIAN PESO)
(in %) Q2 2018 Q2 2019 H1 2018 H1 2019
Perimeter (0.8) (1.0) (1.2) (0.7)
Currencies (6.1) +2.4 (7.4) +2.4
Of which USD (2.6) +2.0 (3.6) +2.4
Of which BRL (1.2) (0.1) (1.3) (0.3)
Of which INR (0.3) +0.1 (0.4) -
Of which MXN (0.7) +0.5 (0.5) +0.4
Of which RUB and UAH (0.3) +0.1 (0.3) -
MANAGEMENT REPORT OF THE BOARD OF DIRECTORS FOR THE 6-MONTH PERIOD ENDED JUNE 30, 2019
Reconciliation with alternative performance measures
9• GROUPE BIC - 2019 HALF-YEAR FINANCIAL REPORT •
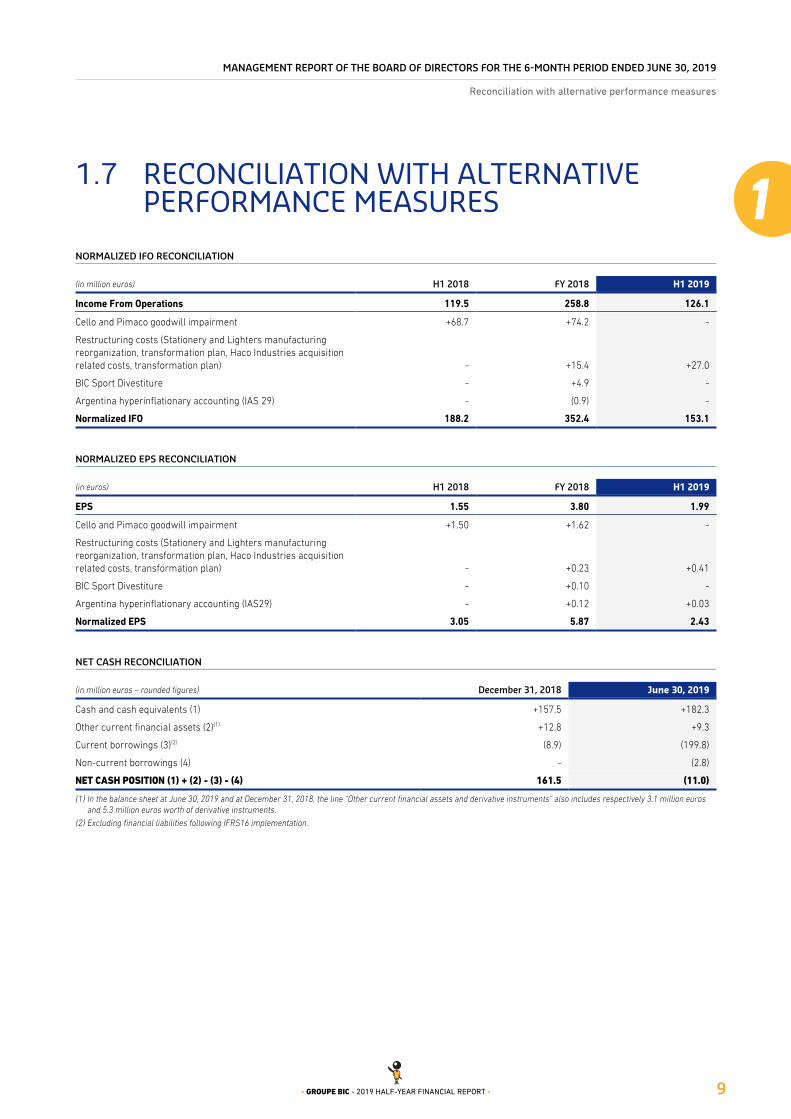
RECONCILIATION WITH ALTERNATIVE 1.7PERFORMANCE MEASURES
NORMALIZED IFO RECONCILIATION
(in million euros) H1 2018 FY 2018 H1 2019
Income From Operations 119.5 258.8 126.1
Cello and Pimaco goodwill impairment +68.7 +74.2 -
Restructuring costs (Stationery and Lighters manufacturing reorganization, transformation plan, Haco Industries acquisition related costs, transformation plan) - +15.4 +27.0
BIC Sport Divestiture - +4.9 -
Argentina hyperinflationary accounting (IAS 29) - (0.9) -
Normalized IFO 188.2 352.4 153.1
NORMALIZED EPS RECONCILIATION
(in euros) H1 2018 FY 2018 H1 2019
EPS 1.55 3.80 1.99
Cello and Pimaco goodwill impairment +1.50 +1.62 -
Restructuring costs (Stationery and Lighters manufacturing reorganization, transformation plan, Haco Industries acquisition related costs, transformation plan) - +0.23 +0.41
BIC Sport Divestiture - +0.10 -
Argentina hyperinflationary accounting (IAS29) - +0.12 +0.03
Normalized EPS 3.05 5.87 2.43
NET CASH RECONCILIATION
(in million euros – rounded figures) December 31, 2018 June 30, 2019
Cash and cash equivalents (1) +157.5 +182.3
Other current financial assets (2)(1) +12.8 +9.3
Current borrowings (3)(2) (8.9) (199.8)
Non-current borrowings (4) - (2.8)
NET CASH POSITION (1) + (2) - (3) - (4) 161.5 (11.0)
In the balance sheet at June 30, 2019 and at December 31, 2018, the line “Other current financial assets and derivative instruments” also includes respectively 3.1 million euros (1)and 5.3 million euros worth of derivative instruments.
Excluding financial liabilities following IFRS16 implementation.(2)
MANAGEMENT REPORT OF THE BOARD OF DIRECTORS FOR THE 6-MONTH PERIOD ENDED JUNE 30, 2019
Share repurchase program – cancelled shares
10 • GROUPE BIC - 2019 HALF-YEAR FINANCIAL REPORT •
SHARE REPURCHASE PROGRAM – 1.8CANCELLED SHARES
SOCIÉTÉ BIC obtained at the Annual Shareholders’ Meeting onMay 22, 2019 to renew its shares repurchase program.
During the First Half of 2019:
Meeting held on May 16, 2018, excluding shares acquiredunder the liquidity agreement;
SOCIÉTÉ BIC repurchased 478,667 shares under the share●
repurchase program authorized by the Annual Shareholders’
SOCIÉTÉ BIC repurchased, under the liquidity agreement●
Natixis - ODDO BHF, 97,014 shares for a total value of7.66 million euros and sold 79,208 shares for a total value of6.34 million euros.
SHARE BUY-BACK PROGRAM – SOCIÉTÉ BIC
Number of shares acquired Average weighted price (in euros) Amount (in million euros)
February 2019 272,388 83.24 22.7
March 2019 126,408 82.41 10.4
April 2019 44,871 76.63 3.4
May 2019 35,000 75.42 2.6
June 2019 - - -
TOTAL 478,667 81.83 39.2
The number of free, performance-based shares transferred tobeneficiaries by SOCIÉTÉ BIC was 114,755 during the first half of2019. The number of free, non-performance-based sharestransferred to beneficiaries by SOCIÉTÉ BIC was 14,350.
Moreover, SOCIÉTÉ BIC proceeded to 162,025 free performance-based share grants and 17,550 non-performance-based sharegrants in 2019.
RELATED-PARTY TRANSACTIONS1.9
This paragraph is aimed at ensuring transparency in therelationship between the Group and its Shareholders (and theirrepresentatives), as well as in the links between the Group andrelated companies that the Group does not exclusively control (i.e.joint ventures or investments in associates).
Significant related-party transactions are described in the Note 24– Related parties on page 240 of the Group BIC 2018 registrationdocument filed with the Autorité des Marchés Financiers (AMF) onMarch 20, 2019. During the First Half of 2019, no other significantrelated-party transactions have been identified.
CAPITAL EVOLUTION1.10
As of June 30, 2019, the total number of issued shares of SOCIÉTÉ BIC was 46,010,907 shares, representing:
67,688,129 voting rights;●
66,668,443 voting rights excluding shares without voting rights.●
Total number of treasury shares held at the end of June 2019: 1,019,686.

MANAGEMENT REPORT OF THE BOARD OF DIRECTORS FOR THE 6-MONTH PERIOD ENDED JUNE 30, 2019
Material events that occurred in H1 2019
11• GROUPE BIC - 2019 HALF-YEAR FINANCIAL REPORT •
MATERIAL EVENTS THAT OCCURRED 1.11IN H1 2019
On June 6th 2019, BIC took the next step in its “BIC 2022-Invent The protect margin sustainability during the plan. A total of 45 millionFuture” transformation plan with additional annualized savings of euros of annualized savings by 2022 is now expected.25 million euros by 2022, to be reinvested in growth and help
MATERIAL EVENTS THAT OCCURRED 1.12AFTER JUNE 30, 2019
On July 25th, 2019 BIC announced it has signed a definitive agreement to acquire 100% of Lucky Stationery Nigeria Ltd (LSNL). The closingis expected end of 2019.
DESCRIPTION OF THE PRINCIPAL RISKS 1.13AND UNCERTAINTIES FOR H2 2019
BIC pursues an active and dynamic approach to risk management.The purpose of this approach is to enhance the Group’s capacity inidentifying, managing and monitoring major risks that could affect:
its personnel, assets, environment or reputation;●
the Group’s ability to reach its objectives and abide by its●
values, ethics or laws and regulations.
the following areas: financial markets, legal, industry andenvironment, strategy and operations.
The approach is based on identification and analysis of the mainrisks to which the Group is exposed, particularly those related to
A description of the main risks identified by the BIC Group isavailable in the section entitled “Risks” of the 2018 registrationdocument (page 37) filed with the Autorité des Marchés Financiers(AMF) on March 20, 2019 and which is available online, followingthis link: http://www.bicworld.com/en/finance/publications/.
No additional significant risk or uncertainties have been identifiedfor the second half of 2019.

MANAGEMENT REPORT OF THE BOARD OF DIRECTORS FOR THE 6-MONTH PERIOD ENDED JUNE 30, 2019
Full-Year 2019 Outlook
12 • GROUPE BIC - 2019 HALF-YEAR FINANCIAL REPORT •
FULL-YEAR 2019 OUTLOOK1.14
We expect 2019 Group Net Sales to grow slightly on acomparative basis(1) :
In a continued challenging trading environment, overall sales●
performance will continue to be subject to macro-economicuncertainties and continued competitive pressure;
H2 performance will be driven by favorable Back-to-School●
phasing, continuous growth in e-commerce, furtherdistribution gains and the success of our added-valueproducts in Stationery and Shavers. While the U.S. marketwill continue to be challenging, Lighters Net Sales shouldbenefit from the positive impact of the price increase in Brazil.
Full Year 2019 Normalized Income from Operations margin isexpected to be between 16.5% and 18%:
While Full Year Gross Margin will continue to be impacted by●
unfavorable foreign exchange trends, H2 should benefit frommore favorable Raw Material costs and positive fixed costsabsorption;
Brand Support should be lower in H2 vs H1, notably in●
Lighters.
GLOSSARY1.15
Constant currency basis: constant currency figures are●
calculated by translating the current year figures at prior yearmonthly average exchange rates.
Organic change or Comparative basis: at constant●
currencies and constant perimeter. Figures at constantperimeter exclude the impacts of acquisitions and/ordisposals that occurred during the current year and/or duringthe previous year, until their anniversary date. All Net Salescategory comments are made on a comparative basis.Organic change excludes Argentina Net Sales for both 2018and 2019.
Gross profit is the margin that the Group realizes after●
deducting its manufacturing costs.
Normalized IFO: normalized means excluding non-recurring●
items.
Normalized IFO margin: Normalized IFO as a percentage of●
Net Sales.
Net cash from operating activities: principal●
revenue-generating activities of the entity and other activitiesthat are not investing or financing activities.
Net cash position: Cash and cash equivalents + Other current●
financial assets - Current borrowings - Non-current borrowings(except financial liabilities following IFRS 16 implementation).
For 2019 Net Sales, on a comparative basis will exclude Full Year 2018 BIC Sport’s Net Sales and 2019 Haco Industries Ltd incremental Net(1)Sales.

13• GROUPE BIC - 2019 HALF-YEAR FINANCIAL REPORT •
HALF-YEAR CONSOLIDATED FINANCIAL STATEMENTS
CONSOLIDATED INCOME STATEMENT2.1 14
CONSOLIDATED STATEMENT OF COMPREHENSIVE INCOME2.2 15
CONSOLIDATED STATEMENT OF FINANCIAL POSITION2.3 16
CONSOLIDATED STATEMENT OF CHANGES IN EQUITY2.4 18
CONSOLIDATED CASH FLOW STATEMENT2.5 19
NOTES TO THE HALF-YEAR CONSOLIDATED FINANCIAL STATEMENTS2.6 21

HALF-YEAR CONSOLIDATED FINANCIAL STATEMENTS
Consolidated income statement
14 • GROUPE BIC - 2019 HALF-YEAR FINANCIAL REPORT •
CONSOLIDATED INCOME STATEMENT2.1
(condensed financial statements)
(in thousand euros) Notes June 30, 2018 June 30, 2019
Net sales 2-2 959,294 960,200
Cost of goods 4 (451,864) (481,654)
Gross profit(a) 507,430 478,546
Distribution costs 4 (138,969) (145,333)
Administrative expenses 4 (105,156) (96,234)
Other operating expenses 4 (73,435) (82,741)
Other income 5 1,424 5,742
Other expenses 5 (71,754) (33,929)
Income from operations 119,540 126,051
Income from cash and cash equivalents 6 3,348 2,725
Net finance income/(Net finance costs) 6 2,426 (4,342)
Income before tax 125,314 124,434
Income tax expense 7 (54,520) (34,841)
Net income from consolidated entities 70,794 89,593
Net income from continuing operations 8 70,794 89,593
Net income from discontinued operations - -
Consolidated income of which: 70,794 89,593
Non-controlling interests - -
Net income Group share 8 70,794 89,593
Earnings per share Group share (in euros) 1.55 1.99
Continuing operations 8 1.55 1.99
Discontinued operations - -
Diluted earnings per share Group share (in euros)(b) 1.54 1.97
Continuing operations 8 1.54 1.97
Discontinued operations - -
Average number of shares outstanding net of treasury shares over the period 8 45,755,483 45,120,558
Gross profit is the margin that the Group realizes after deducting its manufacturing costs.(a)
The dilutive elements taken into account are stock options and free shares.(b)

HALF-YEAR CONSOLIDATED FINANCIAL STATEMENTS
Consolidated statement of comprehensive income
15• GROUPE BIC - 2019 HALF-YEAR FINANCIAL REPORT •
CONSOLIDATED STATEMENT 2.2OF COMPREHENSIVE INCOME
(condensed financial statements)
(in thousand euros) Notes June 30, 2018 June 30, 2019
GROUP NET INCOME A 70,794 89,593
OTHER COMPREHENSIVE INCOME
Actuarial differences on post-employment benefits not recyclable to the income statement(a) 21,942 (6,477)
Deferred tax on actuarial differences on post-employment benefits (4,911) 1,555
Total actuarial differences not recyclable to the income statement – Net of tax B 17,031 (4,921)
Gain/(Loss) on cash flow hedge (17,254) (2,257)
Exchange differences arising on translation of overseas operations(b) (31,564) 14,067
Equity instruments at fair value (3) 3
Deferred tax and current tax recognized on other comprehensive income 7,221 397
Other comprehensive income recyclable to the income statement – Net of tax C (41,600) 12,210
TOTAL COMPREHENSIVE INCOME D = A + B + C 46,225 96,881
Attributable to:
BIC Group• 46,225 96,881
Non-controlling interests• - -
TOTAL 46,225 96,881
The impact of actuarial differences is mainly due to U.S. plans.(a)
The main items impacting the translation reserve variance for the period, by currency, are as follows: Brazilian real 4.6 million euros, U.S. dollar 1.6 million euros,(b)
Indian rupee 2.2 million euros, Argentinian peso -1.3 million euros and Mexican peso 3.8 million euros.
HALF-YEAR CONSOLIDATED FINANCIAL STATEMENTS
Consolidated statement of financial position
16 • GROUPE BIC - 2019 HALF-YEAR FINANCIAL REPORT •
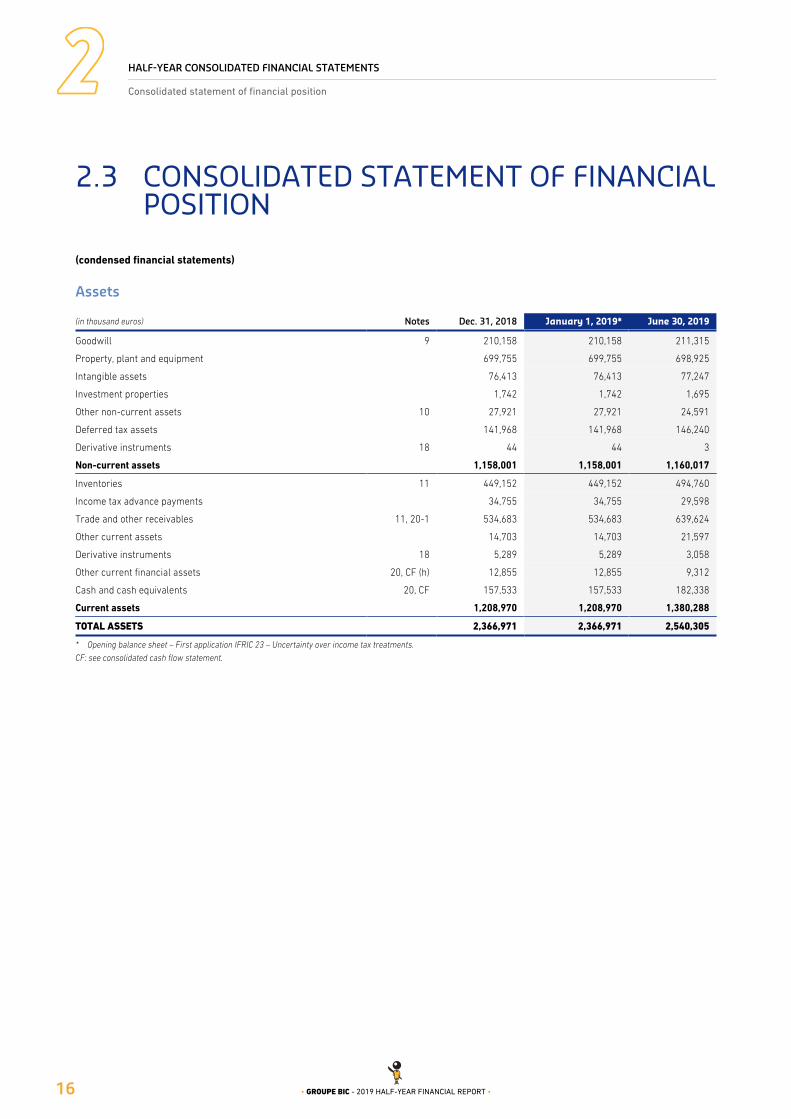
CONSOLIDATED STATEMENT OF FINANCIAL 2.3POSITION
(condensed financial statements)
Assets
(in thousand euros) Notes Dec. 31, 2018 January 1, 2019* June 30, 2019
Goodwill 9 210,158 210,158 211,315
Property, plant and equipment 699,755 699,755 698,925
Intangible assets 76,413 76,413 77,247
Investment properties 1,742 1,742 1,695
Other non-current assets 10 27,921 27,921 24,591
Deferred tax assets 141,968 141,968 146,240
Derivative instruments 18 44 44 3
Non-current assets 1,158,001 1,158,001 1,160,017
Inventories 11 449,152 449,152 494,760
Income tax advance payments 34,755 34,755 29,598
Trade and other receivables 11, 20-1 534,683 534,683 639,624
Other current assets 14,703 14,703 21,597
Derivative instruments 18 5,289 5,289 3,058
Other current financial assets 20, CF (h) 12,855 12,855 9,312
Cash and cash equivalents 20, CF 157,533 157,533 182,338
Current assets 1,208,970 1,208,970 1,380,288
TOTAL ASSETS 2,366,971 2,366,971 2,540,305
Opening balance sheet – First application IFRIC 23 – Uncertainty over income tax treatments.*
CF: see consolidated cash flow statement.

HALF-YEAR CONSOLIDATED FINANCIAL STATEMENTS
Consolidated statement of financial position
17• GROUPE BIC - 2019 HALF-YEAR FINANCIAL REPORT •
Equity and liabilities
(in thousand euros) Notes Dec. 31, 2018 January 1, 2019* June 30, 2019
Share capital 12-1 173,269 173,269 171,866
Accumulated profits 1,464,857 1,451,455 1,356,577
Shareholders’ equity Group share 1,638,126 1,624,724 1,528,443
Non-controlling interests - - -
Shareholders’ equity SHEQ 1,638,126 1,624,724 1,528,443
Non-current borrowings 13, 20-2 32,032 32,032 32,420
Other non-current liabilities 994 994 6,247
Employee benefits obligation 163,823 163,823 171,871
Provisions 14 43,507 56,909 80,231
Deferred tax liabilities 41,735 41,735 24,424
Derivative instruments 18 37 37 100
Non-current liabilities 282,127 295,529 315,293
Trade and other payables 11 137,729 137,729 151,031
Current borrowings 13 22,580 22,580 213,607
Current tax due 15,869 15,869 40,188
Other current liabilities 15 259,107 259,107 279,696
Derivative instruments 18 11,433 11,433 12,047
Current liabilities 446,718 446,718 696,570
TOTAL EQUITY AND LIABILITIES 2,366,971 2,366,971 2,540,305
Opening balance sheet – First application IFRIC 23 – Uncertainty over income tax treatments.*
SHEQ: See consolidated statement of changes in equity.

HALF-YEAR CONSOLIDATED FINANCIAL STATEMENTS
Consolidated statement of changes in equity
18 • GROUPE BIC - 2019 HALF-YEAR FINANCIAL REPORT •
CONSOLIDATED STATEMENT OF CHANGES 2.4IN EQUITY
(in thousand euros) NotesShare
capital
Accu-mulated
profits
Addi-tionnalpaid incapital
Actuarialdifferencesrecognized
in equity
Trans-lation
reserve
Cash flowhedge
derivatives
Share-holders’
equityGroupshare
Non-controlling
interests
Share-holders’
equity
December 31, 2017 175,141 1,693,439 7,851 (99,387) (85,697) 10,823 1,702,170 - 1,702,170
IFRS 9 adjustment – Financial assets depreciation - (3,583) - - - - (3,583) - (3,583)
Hyperinflation impact in Argentina on the opening*** - 3,239 - - - - 3,239 - 3,239
At January 1, 2018 restated 175,141 1,693,095 7,851 (99,387) (85,697) 10,823 1,701,826 - 1,701,826
Dividends paid CF, 16 - (157,762) - - - - (157,762) - (157,762)
Decrease in share capital(a) (2,626) (51,399) - - - - (54,025) - (54,025)
Increase in share capital 261 4,096 - - - - 4,357 - 4,357
Treasury shares 493 (930) - - - - (437) - (437)
Recognition of share-based payments CF, 17 - - 8,404 - - - 8,404 - 8,404
Hyperinflation impact in Argentina - 4,999 - - - - 4,999 4,999
Other - (2) - - (2) (4) (8) - (8)
Total transactions with Shareholders (1,871) (200,998) 8,404 - (2) (4) (194,472) - (194,472)Net income for the period - 173,350 - - - - 173,350 - 173,350
Other comprehensive income - 1,394 - 4,439 (33,244) (15,166) (42,578) - (42,578)
Total comprehensive income - 174,744 - 4,439 (33,244) (15,166) 130,772 - 130,772
At December 31, 2018 173,269 1,666,841 16,255 (94,948) (118,943) (4,347) 1,638,126 - 1,638,126
First application IFRIC 23 – Uncertainty over income tax treatments impact
- (13,404) - - - - (13,404) - (13,404)
At January 1, 2019 restated 173,269 1,653,437 16,255 (94,948) (118,943) (4,347) 1,624,724 - 1,624,724
Dividends paid CF, 16 - (155,228) - - - - (155,228) - (155,228)
Decrease in share capital(a) - - - - - - - - -
Increase in share capital - - - - - - - - -
Treasury shares ( 1,403) ( 38,967) - - - - (40,370) - (40,370)
Recognition of share-based payments CF, 17 - - 113 - - - 113 - 113
Hyperinflation impact in Argentina - 2,334 - - - - 2,334 - 2,334
Other - (6) - - (5) - (11) - (11)
Total transactions with Shareholders (1,403) (191,867) 113 - (5) - (193,161) - (193,161)Net income for the period - 89,593 - - - - 89,593 - 89,593
Other comprehensive income - (205) - (4,921) 14,067 (1,652) 7,288 - 7,288
Total comprehensive income - 89,387 - (4,921) 14,067 (1,652) 96,881 - 96,881
At June 30, 2019 171,866 1,550,921 16,368 (99,869) (104,845) (5,998) 1,528,443 - 1,528,443
No share has been cancelled during the first half 2019.(a)CF: see consolidated cash flow statement.

HALF-YEAR CONSOLIDATED FINANCIAL STATEMENTS
Consolidated cash flow statement
19• GROUPE BIC - 2019 HALF-YEAR FINANCIAL REPORT •
CONSOLIDATED CASH FLOW STATEMENT2.5
(in thousand euros) Notes June 30, 2018 June 30, 2019
Operating activities
Net income Group share IS 70,794 89,593
Income and expense without cash impact:
Non-controlling interests IS - -
Argentina hyperinflationary accounting - 1,460
Depreciation and amortization of intangible and tangible assets and investment properties 2 53,001 57,110
Impairment loss (47) (280)
Goodwill impairment 9, (a) 68,709 -
Provision for employee benefits 8,953 8,723
Other provisions (excluding provisions on current assets) 14 790 36,947
Unrealized foreign currency gain/loss (b) (4,938) 1,246
Hedging and derivative instruments 18 929 762
Option premium expense 18 560 1,033
Recognition of share-based payments 17, SHEQ 5,614 113
Deferred tax variation (6,631) (32,270)
(Gain)/Loss from disposal of fixed assets 5, (c) (50) 218
Cash flow from operations 197,684 164,655
(Increase)/Decrease in net working capital 11, (d) (134,405) (106,263)
Payments related to employee benefits (e) (6,843) (7,869)
Financial expense/(income) 6 (1,244) (385)
Interest (paid)/received 1,365 450
Income tax expense 61,151 53,710
Income tax paid (34,592) (24,666)
NET CASH FROM OPERATING ACTIVITIES 83,116 79,633
Investing activities
Disposal of fixed assets (c) 603 136
Purchases of property, plant and equipment (g) (48,324) (44,777)
Purchases of intangible assets (g) (3,281) (2,766)
(Increase)/Decrease in other investments 73 30
Sale of other current financial assets (h) 5,021 3,587
Purchase of Haco Industries Kenya (i) - (1,807)
NET CASH FROM INVESTING ACTIVITIES (45,908) (45,596)
Financing activities
Dividends paid SHEQ, 16, (j) (157,762) (155,228)
Borrowings/(Repayments) 13, (k) 100,929 103,835
Payments of obligations under leases (7,292) (8,294)
Purchase of financial instruments 18 (659) (1,102)
Increase in treasury shares (l) (23,919) (39,995)
Exercise of stock options (l) 1,444 -
NET CASH FROM FINANCING ACTIVITIES (87,259) (100,784)
Net cash variation (50,051) (66,747)
Opening cash and cash equivalents net of bank overdrafts BS, 13 186,969 149,795
Exchange difference (3,189) 1,582
CLOSING CASH AND CASH EQUIVALENTS NET OF BANK OVERDRAFTS BS, 13 133,729 84,629
IS: See consolidated income statement.SHEQ: See consolidated statement of changes in equity.BS: See consolidated balance sheet.

HALF-YEAR CONSOLIDATED FINANCIAL STATEMENTS
Consolidated cash flow statement
20 • GROUPE BIC - 2019 HALF-YEAR FINANCIAL REPORT •
As of June 30, 2019 cash and cash equivalents amounted to182.3 million euros and bank overdrafts to 97.7 million euros.
Net Cash From Operating ActivitiesH1 2019 net cash from operating activities amounted to79.6 million euros and included 3.0 million euros in paymentsrelated to restructuring (1.9 million euros during the first half2018).
During the first half 2018, a partial Cello goodwill impairment wasbooked for 68.7 million euros (see Note 9)(a) and constituted anon-cash event.
The Group recorded foreign exchange (gains)/losses with no cashimpact in financial income and restated these in the consolidatedcash flow statement(b).
There was no significant disposal of fixed assets during the firsthalf 2018 and 2019(c).
The working capital (see Note 11 for the definition) increaseamounted to 106.3 million euros compared to an increase duringthe first half 2018 of 134.4 million euros. The 2019 variance ismainly explained by an increase in trade receivables(d).
The payments related to employee benefits were mainly driven bythe U.S. (e).
Net Cash From Investing ActivitiesNet cash from investing activities amounted to -45.6 million eurosduring the first half 2019 compared to -45.9 million euros duringthe first half 2018.
During the first half 2019 and 2018, there was no disposal ofindividually significant fixed assets(c).
During the first half of 2019, the BIC Group disbursed 47.5 millioneuros of property, plant and equipment and intangible assets(including 2.5 millions euros related to assets payables variance)(g).
Purchases of property, plant and equipment do not include financeleases booked as a counterpart to a financial debt, as thesetransactions do not have any impact on cash(g).
The amount of financial assets classified under “Other currentfinancial assets” refers to investments not eligible for classificationas cash & cash equivalents under IAS 7. As of June 30, 2019, theseinvestments consisted of units of UCITS and negotiable debtsecurities, all of which are liquid within 5 days(h).
End of 2018, the transfer of Haco Industries Kenya Ltd stationerymanufacturing and distribution to BIC was completed (i). 1.8 millioneuros were paid during the first half 2019.
Net Cash From Financing ActivitiesNet cash from financing activities amounted to -100.8 million eurosduring the first half 2019 compared to -87.3 million euros duringthe first half 2018.
The dividends paid represent the dividends paid by SOCIÉTÉ BIC toits Shareholders (see Note 16)(j).
As of June 30, 2019, new borrowings amounted to 103.8 millioneuros compared to 100.9 million euros during the first half 2018.They are short-term financing to ensure the ad hoc liquidity needsof SOCIÉTÉ BIC (k).
During the first half 2019, 478,667 shares were repurchased bySOCIÉTÉ BIC for 39.2 million euros (l). Under the liquidityagreement, SOCIÉTÉ BIC bought 97,014 shares for 7.7 millioneuros and sold 79,208 shares for 6.3 million euros.
During the first half 2018, 296,932 shares were repurchased bySOCIÉTÉ BIC for 23.8 million euros and 1,706 shares wererepurchased by BIC Corporation for an amount of 0.2 million euros.Under the liquidity agreement, SOCIÉTÉ BIC bought 314,097 sharesfor 26.6 million euros and sold 312,216 shares for 26.5 millioneuros. In addition, 15,526 options were exercised in the period for1.0 million euros, including 0.1 million euros which have not yetbeen received at end of June 2018. Moreover, in early 2018,SOCIÉTÉ BIC received 0.7 million euros related to stock optionsexercised at the end of 2017(I).

HALF-YEAR CONSOLIDATED FINANCIAL STATEMENTS
Notes to the half-year consolidated financial statements
21• GROUPE BIC - 2019 HALF-YEAR FINANCIAL REPORT •
NOTES TO THE HALF-YEAR CONSOLIDATED 2.6FINANCIAL STATEMENTS
General
MAIN RULES AND ACCOUNTING POLICIESNOTE 1 22
Accounting policies1-1 22Change in Group structure1-2 22Subsequent events1-3 22
OPERATING SEGMENTSNOTE 2 23
General information2-1 23Information on the income statement and 2-2assets by activity 23Information by geography2-3 23
EXCHANGE RATES OF FOREIGN CURRENCIESNOTE 3 24
Income statement
OPERATING EXPENSESNOTE 4 25
OTHER INCOME AND EXPENSESNOTE 5 25
FINANCIAL INCOMENOTE 6 26
INCOME TAXNOTE 7 26
Income tax expense7-1 26Deferred and current tax recognized in other 7-2comprehensive income 26
EARNINGS PER SHARE GROUP SHARENOTE 8 27
Balance sheet - Assets
GOODWILLNOTE 9 28
OTHER NON-CURRENT ASSETSNOTE 10 29
CHANGE IN NET WORKING CAPITALNOTE 11 29
Balance sheet - Liabilities
SHARE CAPITALNOTE 12 30
Share capital12-1 30SOCIÉTÉ BIC shares held in treasury stock and 12-2share repurchase program as of June 30, 2019 30
BORROWINGS AND FINANCIAL LIABILITIESNOTE 13 31
PROVISIONSNOTE 14 32
OTHER CURRENT LIABILITIESNOTE 15 33
Additional information
DIVIDENDSNOTE 16 33
SHARE BASED PAYMENTSNOTE 17 33
FINANCIAL INSTRUMENTSNOTE 18 33
Impact of interest rate and foreign exchange 18-1risk hedging on the consolidated financial statements as of June 30, 2019 33Impact of interest rate and foreign exchange 18-2risk hedging on the consolidated financial statements as of December 31, 2018 34
CONTINGENT LIABILITIESNOTE 19 34
EXPOSURE TO MARKET RISKSNOTE 20 34
Credit risk20-1 34Fair value of financial assets and liabilities20-2 35

HALF-YEAR CONSOLIDATED FINANCIAL STATEMENTS
Notes to the half-year consolidated financial statements
22 • GROUPE BIC - 2019 HALF-YEAR FINANCIAL REPORT •
MAIN RULES AND ACCOUNTING POLICIESNOTE 1
Accounting policies1-1
General1-1-1Pursuant to European regulation n°1606/2002 of July 19, 2002concerning international accounting standards, the consolidatedfinancial statements of the BIC Group have been prepared inaccordance with accounting principles as defined by theInternational Accounting Standards Board (IASB) as adopted by theEuropean Union. International Financial Reporting Standards areavailable on the European Union website athttp://ec.europa.eu/internal_market/accounting/ias/index_en.htm.
The international standards include the IFRS (InternationalFinancial Reporting Standards), the IAS (International AccountingStandards), as well as their SIC (Standing InterpretationCommittee) and IFRIC (International Financial ReportingInterpretations Committee) interpretations.
The condensed half-year consolidated financial statements as ofJune 30, 2018 and June 30, 2019 have been prepared incompliance with IAS 34 – Interim financial reporting. The financialstatements have been prepared on the historical cost basis, exceptfor the valuation of certain financial instruments.
IAS 34 allows presentation of a selection of notes to the condensedhalf-year consolidated financial statements that should be read inconjunction with the consolidated financial statements ofDecember 31, 2018.
The measurement procedures used for the interim condensedconsolidated financial statements are as follows:
interim period income tax expense results from the estimated●
annual Group effective income tax rate applied to the pre-taxresult of the interim period excluding non recurring materialitems. The income tax charge related to any unusual item inthe period is accrued using its actual tax expense;
regarding the main pension plans and other employee benefits●
(United States, Canada), actuarial valuations are performedevery six months. Amounts recognized in the interim statementof financial position are based on estimates made at the end ofthe previous year and on the discount rates as of June 30.Regarding share-based payments and other benefits plans,expenses are recognized in the period on a pro rata basis of theestimated costs for the year.
The principal accounting policies remain unchanged compared tolast year except for adoption of the following standard, effectivesince January 1, 2019.
Adoption of new and revised International 1-1-2Financial Reporting Standards, interpretations and amendments
New standards, amendments and interpretations of mandatory application for financial years beginning on or after January 1, 2019
The following standards and amendments are effective sinceJanuary 1, 2019 and have been applied to the consolidatedfinancial statement as of June 30, 2019:
IFRIC 23 – Uncertainty over Income Tax Treatments.●
IFRIC 23 is an interpretation which provides guidance onhow to account for uncertain tax treatments and positions.
It clarifies and set up principles for recognition andmeasurement of assets and liabilities over income tax relatedrisks, when there is uncertainty over tax positions taken. Onlyincome tax is in the scope.
This Interpretation is effective for annual reporting beginningJanuary 1, 2019 using the partial retrospective method.
We have adjusted negatively the Shareholders’ equity from13 million euros as of January 1, 2019 (counterpart provisionfor risks and charges see Note 14). This risk relates to a taxuncertainty on one of our Brazilian subsidiaries and the taxdeductibility of certain expenses recognized in the financialstatements of this subsidiary.
Amendments to IAS 19 – Employee Benefits – Plan●
Amendment, Curtailment or Settlement;
Annual improvements to IFRSs 2015-2017 Cycle:●
IAS 12 – Income Taxes,•IFRS 3 – Business Combinations.•
New standards, interpretations and amendments that may be applied early for financial years beginning on or after January 1, 2019
As of June 30, 2019, the Group did not elect to early apply anystandard, interpretation or amendment.
Standards, interpretations and amendments that may not be applied early for financial years beginning on or after January 1, 2019
Amendment of the references of the conceptual framework•in ifrs standards.
Analysis on the practical consequences of these new regulations isin progress.
Change in Group structure1-2
No significant change in Group structure.
Subsequent events1-3
No subsequent event occurred between July 1, 2019 and thereporting date.

HALF-YEAR CONSOLIDATED FINANCIAL STATEMENTS
Notes to the half-year consolidated financial statements
23• GROUPE BIC - 2019 HALF-YEAR FINANCIAL REPORT •
OPERATING SEGMENTSNOTE 2
General information2-1
BIC Group operating segments have been determined based on thereports regularly provided to the management and used to makestrategic decisions.
The management, composed of operational representativesresponsible for the continent, representatives of the categories andcross-functional functions, considers the business from a productcategory perspective, knowing that each category can be reviewedfor a specific geographic area if necessary.
The categories are as follows: Stationery, Lighters, Shavers, OtherProducts.
These operating segments receive their revenues from theproduction and distribution of each product category.
Information on the income statement 2-2and assets by activity
All indicators are determined according to IFRS, except for:
normalized income from operations, which is the income from●
operations restated for non-recurring items (in particular realestate gains, the gain or loss on the sale of businesses andrestructuring costs). It constitutes the key financial metricsused within the Group;
capital additions, which are the purchases and internal●
generation of property, plant and equipment and intangiblefixed assets for the period.
(in million euros)
June 30, 2018 June 30, 2019
Stationery Lighters ShaversOther
Products Total Stationery Lighters ShaversOther
Products Total
Income Statement
Net sales• 401 318 210 30 959 401 320 224 15 960
Depreciation and amortization• (16) (11) (15) (11) (53) (16) (12) (17) (12) (57)
Impairment loss• (69) - - - (69) - - - - -
Income from operations• (22) 118 24 (1) 119 24 96 9 (3) 126
Restatements made to obtain the normalized income from operations
Cello Goodwill impairment• 69 - - - 69 - - - - -
restructuring costs• - - - - - 10 9 7 - 27
Normalized income from operations 47 118 24 (1) 188 34 105 16 (2) 153
As of June 30, 2019, the BIC Group had not identified any major customer with which it realized more than 10% of its net sales over theperiod.
(in million euros)
June 30, 2018 June 30, 2019
Stationery Lighters ShaversOther
Products Total Stationery Lighters ShaversOther
Products Total
Capital additions(1) 11 19 13 9 51 13 13 11 8 45
Net inventories 216 132 106 17 470 242 141 103 9 495
Excluding capital additions cashed out in 2019 related to 2018 amounting 2.5 million euros.(1)
Information by geography2-3
The geographies identified by the management are: France, Europe (excluding France), North America and Developing markets.
(in million euros)
June 30, 2018 June 30, 2019
France
Europeexcluding
FranceNorth
AmericaDeveloping
markets Total France
Europeexcluding
FranceNorth
AmericaDeveloping
markets TOTAL
Net sales 109 191 380 279 959 95 196 389 280 960

HALF-YEAR CONSOLIDATED FINANCIAL STATEMENTS
Notes to the half-year consolidated financial statements
24 • GROUPE BIC - 2019 HALF-YEAR FINANCIAL REPORT •
(in million euros)
June 30, 2018 June 30, 2019
France
Europeexcluding
FranceNorth
AmericaDeveloping
markets Total France
Europeexcluding
FranceNorth
AmericaDeveloping
markets TOTAL
Non-current assets* 262 203 231 297 993 261 204 222 326 1 013
Other than financial instruments (3 thousand euros in 2019 and 136 thousand euros in 2018), deferred tax assets (146.2 million euros in 2019 and 105.0 million euros in 2018).*
EXCHANGE RATES OF FOREIGN CURRENCIESNOTE 3
The following table shows foreign currency equivalents of one euro (for instance: average 2019 is 1 euro = 1.13 U.S. dollars).
Average Average June 30, 2018 June 30, 2019
Foreign currencies Euro Euro Euro Euro
U.S. dollar – USD 1.21 1.13 1.17 1.14
Australian dollar – AUD 1.57 1.60 1.58 1.62
Canadian dollar – CAD 1.55 1.51 1.54 1.49
Swiss franc – CHF 1.17 1.13 1.16 1.11
Chinese renminbi – CNY 7.70 7.67 7.72 7.82
British pound – GBP 0.88 0.87 0.89 0.90
Hong Kong dollar – HKD 9.48 8.86 9.15 8.89
Indian rupee – INR 79.53 79.10 79.81 78.52
Japanese yen – JPY 131.46 124.10 129.04 122.60
Korean won – KRW 1,302.30 1,295.42 1,297.00 1,315.00
Malaysian ringgit – MYR 4.77 4.65 4.71 4.71
New Zealand dollar – NZD 1.69 1.68 1.72 1.70
Philippine peso – PHP 62.97 58.97 62.17 58.34
Polish zloty – PLN 4.22 4.29 4.37 4.25
Swedish krona – SEK 10.16 10.52 10.45 10.56
South African rand – ZAR 14.89 16.05 16.05 16.12
Argentinian peso – ARS 26.26 47.45 34.43 48.44
Brazilian real – BRL 4.15 4.34 4.49 4.35
Mexican peso – MXN 23.09 21.65 22.88 21.82
Ukrainian hryvnia – UAH 32.33 30.42 30.70 29.78
Russian ruble – RUB 71.96 73.70 73.16 71.60
To date we do not see any significant impact attributable to Brexit.The British subsidiary of the BIC Group, BIC UK, has been importingmost of its products from BIC factories located in the Euro zone foryears and is invoiced in euros by these entities.
The fluctuation of the exchange rate of the British Pound againstthe Euro is fully integrated into our foreign exchange riskmanagement processes.
The exposure of our british perimeter amounts 15.4 million eurosas of June 30, 2019.

HALF-YEAR CONSOLIDATED FINANCIAL STATEMENTS
Notes to the half-year consolidated financial statements
25• GROUPE BIC - 2019 HALF-YEAR FINANCIAL REPORT •
OPERATING EXPENSESNOTE 4
(in thousand euros) June 30, 2018 June 30, 2019
Raw materials, consumables used and change in inventory 228,455 239,100
Staff costs 262,838 262,025
Depreciation and amortization expenses 53,001 57,110
Other operating expenses 225,130 242,708
Impairment loss on manufacturing equipment - (172)
Profit on operational foreign currency translation - 5,191
TOTAL 769,424 805,962
Other income and expenses are not included in the total amountand are disclosed in Note 5.
Other operating expenses mainly include outside services.
Research and development costs recognized under operatingexpenses for the first semester of 2019 amounted to 15.3 millioneuros as for 2018.
They include the French research tax credit for 1.4 million euros asfor 2018.
OTHER INCOME AND EXPENSESNOTE 5
(in thousand euros) June 30, 2018 June 30, 2019
Royalties income 5 102
Gain on disposal of fixed assets 50 -
Other 1,369 5,640
Other income 1,424 5,742
Impairment loss on goodwill (68,661) -
Cost reduction plans - (27,006)
Other (3,093) (6,923)
Other expenses (71,754) (33,929)
TOTAL (70,330) (28,187)
Other income and expenses incurred in the first half 2019 mainly Note 14), 3 million euros has been cashed out (see cash flowinclude the restructuring costs amounting 27 million euros related statement) and 1.4 million euros is recorded as a current liability.to deploying the second phase of the transformation planannounced on June 6th, 2019. Out of the 27 million euros, 22.6million euros is classified as a provision for risks and charges (see
Other income and expenses incurred in the first half 2018 mainlyinclude the partial Cello goodwill impairment amounting to68.7 million euros.
HALF-YEAR CONSOLIDATED FINANCIAL STATEMENTS
Notes to the half-year consolidated financial statements
26 • GROUPE BIC - 2019 HALF-YEAR FINANCIAL REPORT •
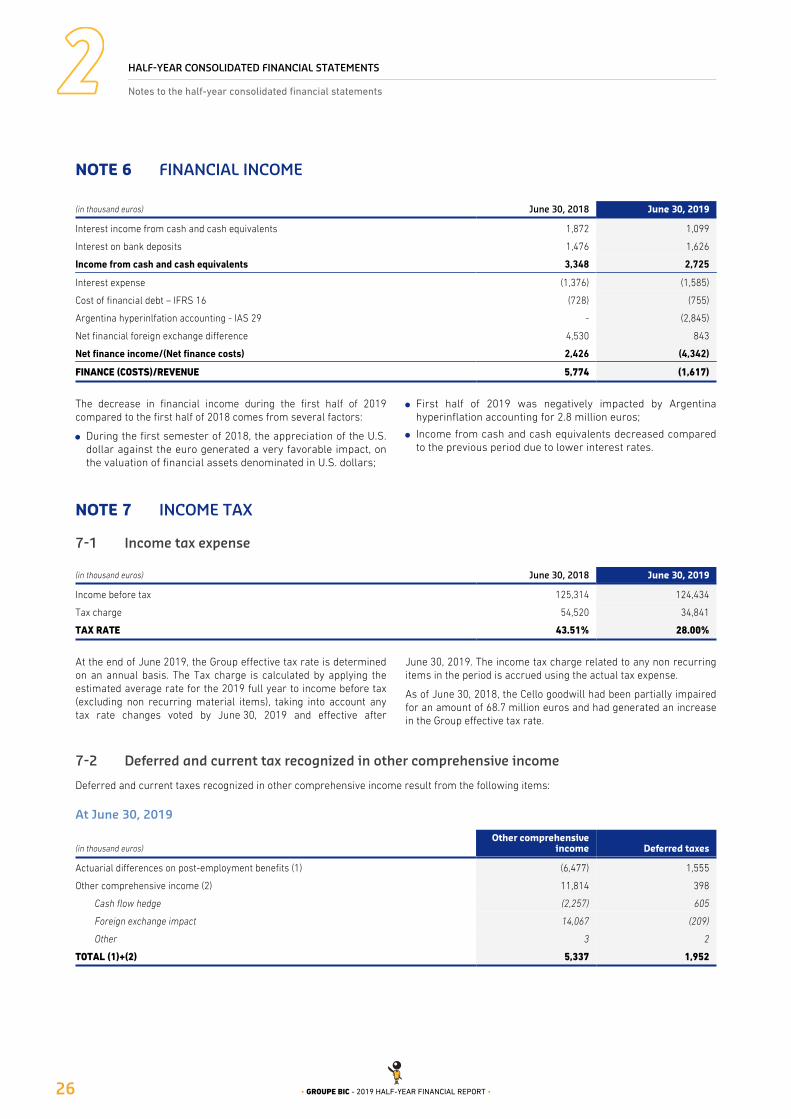
FINANCIAL INCOMENOTE 6
(in thousand euros) June 30, 2018 June 30, 2019
Interest income from cash and cash equivalents 1,872 1,099
Interest on bank deposits 1,476 1,626
Income from cash and cash equivalents 3,348 2,725
Interest expense (1,376) (1,585)
Cost of financial debt – IFRS 16 (728) (755)
Argentina hyperinlfation accounting - IAS 29 - (2,845)
Net financial foreign exchange difference 4,530 843
Net finance income/(Net finance costs) 2,426 (4,342)
FINANCE (COSTS)/REVENUE 5,774 (1,617)
The decrease in financial income during the first half of 2019compared to the first half of 2018 comes from several factors:
During the first semester of 2018, the appreciation of the U.S.●
dollar against the euro generated a very favorable impact, onthe valuation of financial assets denominated in U.S. dollars;
First half of 2019 was negatively impacted by Argentina●
hyperinflation accounting for 2.8 million euros;
Income from cash and cash equivalents decreased compared●
to the previous period due to lower interest rates.
INCOME TAXNOTE 7
Income tax expense7-1
(in thousand euros) June 30, 2018 June 30, 2019
Income before tax 125,314 124,434
Tax charge 54,520 34,841
TAX RATE 43.51% 28.00%
At the end of June 2019, the Group effective tax rate is determined June 30, 2019. The income tax charge related to any non recurringon an annual basis. The Tax charge is calculated by applying the items in the period is accrued using the actual tax expense.estimated average rate for the 2019 full year to income before tax(excluding non recurring material items), taking into account anytax rate changes voted by June 30, 2019 and effective after
As of June 30, 2018, the Cello goodwill had been partially impairedfor an amount of 68.7 million euros and had generated an increasein the Group effective tax rate.
Deferred and current tax recognized in other comprehensive income7-2
Deferred and current taxes recognized in other comprehensive income result from the following items:
At June 30, 2019
(in thousand euros)Other comprehensive
income Deferred taxes
Actuarial differences on post-employment benefits (1) (6,477) 1,555
Other comprehensive income (2) 11,814 398
Cash flow hedge (2,257) 605
Foreign exchange impact 14,067 (209)
Other 3 2
TOTAL (1)+(2) 5,337 1,952
HALF-YEAR CONSOLIDATED FINANCIAL STATEMENTS
Notes to the half-year consolidated financial statements
27• GROUPE BIC - 2019 HALF-YEAR FINANCIAL REPORT •
At June 30, 2018
(in thousand euros)Other comprehensive
income Deferred taxes
Actuarial differences on post-employment benefits (1) 21,942 (4,911)
Other comprehensive income (2) (48,821) 7,221
Cash flow hedge (17,254) 5,974
Foreign exchange impact (31,564) 558
Other (3) 689
TOTAL (1)+(2) (26,879) 2,310
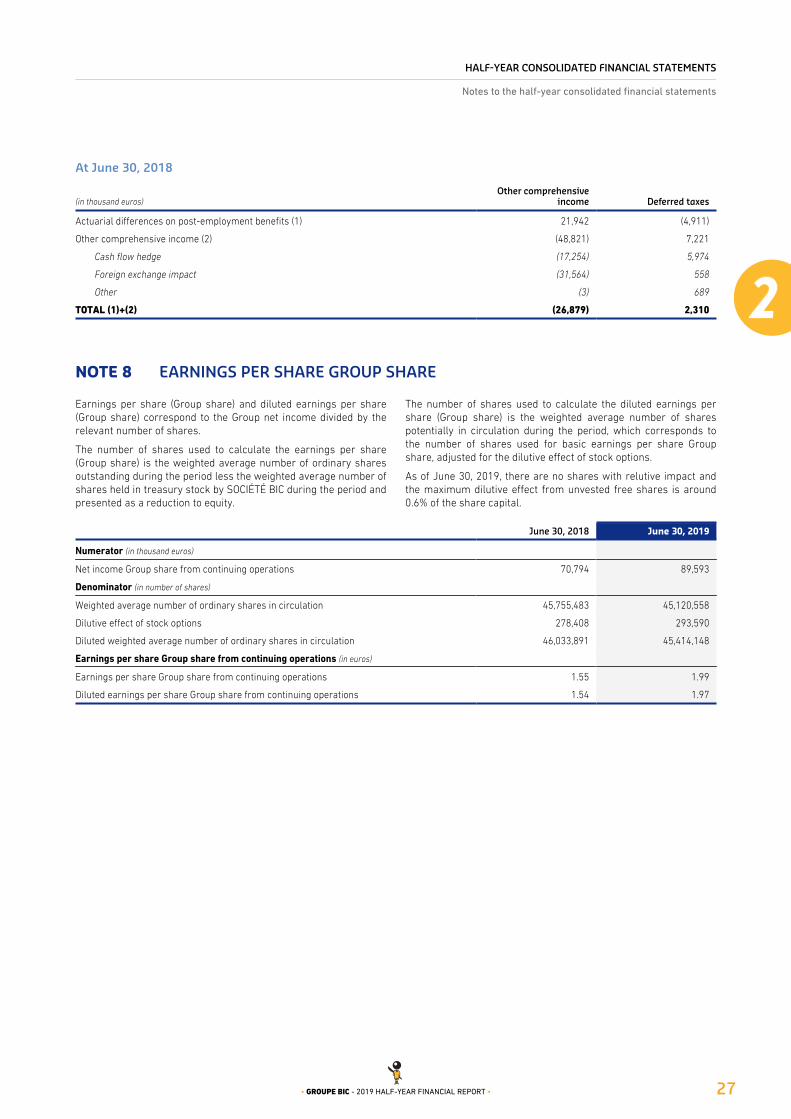
EARNINGS PER SHARE GROUP SHARENOTE 8
Earnings per share (Group share) and diluted earnings per share(Group share) correspond to the Group net income divided by therelevant number of shares.
The number of shares used to calculate the earnings per share(Group share) is the weighted average number of ordinary sharesoutstanding during the period less the weighted average number ofshares held in treasury stock by SOCIÉTÉ BIC during the period andpresented as a reduction to equity.
The number of shares used to calculate the diluted earnings pershare (Group share) is the weighted average number of sharespotentially in circulation during the period, which corresponds tothe number of shares used for basic earnings per share Groupshare, adjusted for the dilutive effect of stock options.
As of June 30, 2019, there are no shares with relutive impact andthe maximum dilutive effect from unvested free shares is around0.6% of the share capital.
June 30, 2018 June 30, 2019
Numerator (in thousand euros)
Net income Group share from continuing operations 70,794 89,593
Denominator (in number of shares)
Weighted average number of ordinary shares in circulation 45,755,483 45,120,558
Dilutive effect of stock options 278,408 293,590
Diluted weighted average number of ordinary shares in circulation 46,033,891 45,414,148
Earnings per share Group share from continuing operations (in euros)
Earnings per share Group share from continuing operations 1.55 1.99
Diluted earnings per share Group share from continuing operations 1.54 1.97

HALF-YEAR CONSOLIDATED FINANCIAL STATEMENTS
Notes to the half-year consolidated financial statements
28 • GROUPE BIC - 2019 HALF-YEAR FINANCIAL REPORT •
GOODWILLNOTE 9
(in thousand euros) Gross value Impairment loss Net value
At January 1, 2019 297,459 (87,301) 210,158
Argentina hyperinflation (2) - (2)
Exchange differences 2,332 (1,173) 1,159
At June 30, 2019 299,789 (88,474) 211,315
The balance, as of June 30, 2019, includes the following principal net goodwill:
(in thousand euros) At December 31, 2018 June 30, 2019
BIC CORPORATION – stationery(a) 51,904 52,156
BIC CORPORATION – lighter(a) 41,190 41,408
Cello Pens 23,919 24,277
BIC Violex 70,516 70,630
Kenya 5,550 5,575
PIMACO(a) - -
Others(a) 17,080 17,269
TOTAL 210,158 211,315
These goodwill amounts are linked to cash-generating units represented by distribution subsidiaries.(a)
To perform the impairment tests, the Group used the following discount and perpetual growth rates:
Weighted average cost
of capital (WACC) before taxPerpetual
growth rate
2018 2019 2018 2019
BIC CORPORATION
Stationery 9.7% 9.5% 1.5% 1.5%
Lighter 9.4% 9.2% 1.5% 1.5%
Cello Pens 14.9% 14.1% 4.8% 4.8%
BIC Violex 14.3% 13.1% 1.9% 1.9%
Kenya - 15.7% - 5.0%
PIMACO 23.9% 20.4% -15.0% -1.5%
Each goodwill item has been allocated to a cash-generating unit(“CGU”) representing the lowest level at which goodwill ismonitored by the Group.
The goodwill on BIC CORPORATION is thus mainly allocated tocash-generating units linked to the distribution by BICCORPORATION of stationery products and lighters.
The goodwill on Cello Pens is allocated to the cash-generatingunits linked to the production and distribution of stationeryproducts by Cello.
also includes the portion of BIC CORPORATION goodwill allocated toshavers.
The remaining goodwill on BIC Violex is allocated to thecash-generating unit linked to shavers developed and/or producedby BIC Violex and sold all over the world. This cash-generating unit
The goodwill on Kenya is allocated to the cash-generating unitslinked to the production and distribution of stationery products byBIC East Africa.
As every year, as of June 30, 2019, the Group performed annualimpairment tests on these goodwill amounts.
The goodwill impairment test methodology is based on acomparison between the recoverable amount of each of theGroup’s cash-generating units and the corresponding assets’ netbook value (including goodwill).
HALF-YEAR CONSOLIDATED FINANCIAL STATEMENTS
Notes to the half-year consolidated financial statements
29• GROUPE BIC - 2019 HALF-YEAR FINANCIAL REPORT •
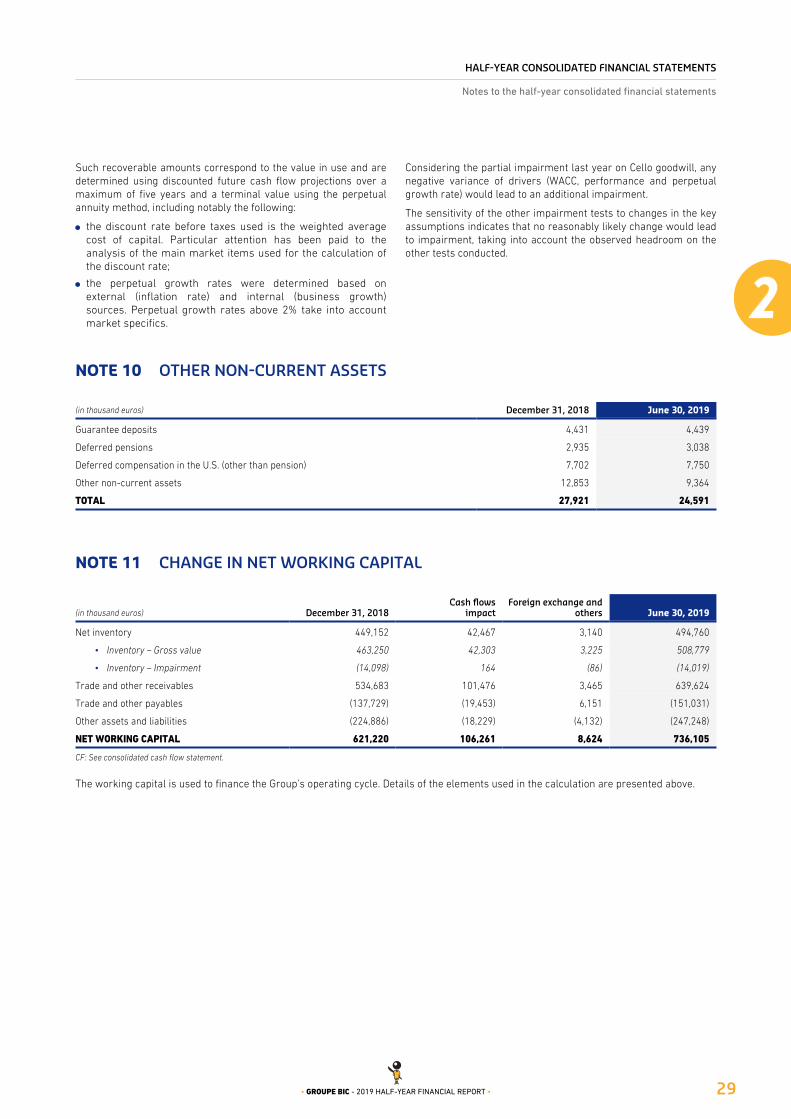
Such recoverable amounts correspond to the value in use and aredetermined using discounted future cash flow projections over amaximum of five years and a terminal value using the perpetualannuity method, including notably the following:
the discount rate before taxes used is the weighted average●
cost of capital. Particular attention has been paid to theanalysis of the main market items used for the calculation ofthe discount rate;
the perpetual growth rates were determined based on●
external (inflation rate) and internal (business growth)sources. Perpetual growth rates above 2% take into accountmarket specifics.
Considering the partial impairment last year on Cello goodwill, anynegative variance of drivers (WACC, performance and perpetualgrowth rate) would lead to an additional impairment.
The sensitivity of the other impairment tests to changes in the keyassumptions indicates that no reasonably likely change would leadto impairment, taking into account the observed headroom on theother tests conducted.
OTHER NON-CURRENT ASSETSNOTE 10
(in thousand euros) December 31, 2018 June 30, 2019
Guarantee deposits 4,431 4,439
Deferred pensions 2,935 3,038
Deferred compensation in the U.S. (other than pension) 7,702 7,750
Other non-current assets 12,853 9,364
TOTAL 27,921 24,591
CHANGE IN NET WORKING CAPITALNOTE 11
(in thousand euros) December 31, 2018Cash flows
impactForeign exchange and
others June 30, 2019
Net inventory 449,152 42,467 3,140 494,760
Inventory – Gross value• 463,250 42,303 3,225 508,779
Inventory – Impairment• (14,098) 164 (86) (14,019)
Trade and other receivables 534,683 101,476 3,465 639,624
Trade and other payables (137,729) (19,453) 6,151 (151,031)
Other assets and liabilities (224,886) (18,229) (4,132) (247,248)
NET WORKING CAPITAL 621,220 106,261 8,624 736,105
CF: See consolidated cash flow statement.
The working capital is used to finance the Group’s operating cycle. Details of the elements used in the calculation are presented above.

HALF-YEAR CONSOLIDATED FINANCIAL STATEMENTS
Notes to the half-year consolidated financial statements
30 • GROUPE BIC - 2019 HALF-YEAR FINANCIAL REPORT •
SHARE CAPITALNOTE 12
Share capital12-1
(in thousand euros) December 31, 2018 June 30, 2019
Authorized, issued and fully paid-up share capital 175,762 175,762
Repurchase of shares of the Company (2,492) (3,895)
SHARE CAPITAL 173,269 171,866
As of June 30, 2019, the registered share capital of SOCIÉTÉ BICwas 175,761,664.74 euros divided into 46,010,907 shares of 3.82euros each. Registered shares held for more than two years carrydouble voting rights.
In addition, SOCIÉTÉ BIC holds 1,019,686 treasury shares, acquiredat an average price of 84.93 euros in accordance with Article L.225-209 of the French Commercial Code, which represent 2.22% ofthe share capital.
SOCIÉTÉ BIC shares held in treasury stock and share repurchase program 12-2as of June 30, 2019
Purpose of the repurchase Number of sharesAverage acquisition
price (in euros) % of the share capital
Liquidity agreement (a) 32,539 70.39 0.07%
Free share grants (a) 987,147 85.41 2.15%
TOTAL 1,019,686 84.93 2.22%
Article L. 225-209 of the French Commercial Code.(a)
In accordance with the liquidity agreement, transferred by Natixisto ODDO on June 27, 2018 in respect of SOCIÉTÉ BIC shares, as ofJune 30, 2019, the liquidity account contained the following:
32,539 BIC shares;●
910,195.55 euros.●
At initial set-up, the liquidity account contained the following:
2,312 BIC shares;●
912,744.48 euros.●
SOCIÉTÉ BIC obtained authorization from the Annual Shareholders’Meeting on May 22, 2019, to renew its share repurchase program(see 2018 registration document, section 8, p.288).
Number of shares purchased in 2019 (b)
Share repurchase program authorized by the Annual Shareholders’ Meeting held on May 16, 2018• 478,667
Share repurchase program authorized by the Annual Shareholders’ Meeting held on May 22, 2019• -
Average share repurchase price for the purchases during the first half of 2019 (in euros) 81.83
Excluding shares repurchased under the liquidity contract.(b)
During the first half of 2019, SOCIÉTÉ BIC cancelled no shares.
To the best of the Company’s knowledge, as of June 30, 2019, Shareholders holding more than 5%, 10%, 15%, 20%, 25%, 33.33%, 50%,66.66%, 90% or 95% of the share capital and/or of the voting rights of the Company were as follows:
June 30, 2019
% of shares(approx.)
% of voting rights(approx.)
SOCIÉTÉ M.B.D. 27.68% 37.75%
Bich Family 17.09% 23.18%
HALF-YEAR CONSOLIDATED FINANCIAL STATEMENTS
Notes to the half-year consolidated financial statements
31• GROUPE BIC - 2019 HALF-YEAR FINANCIAL REPORT •
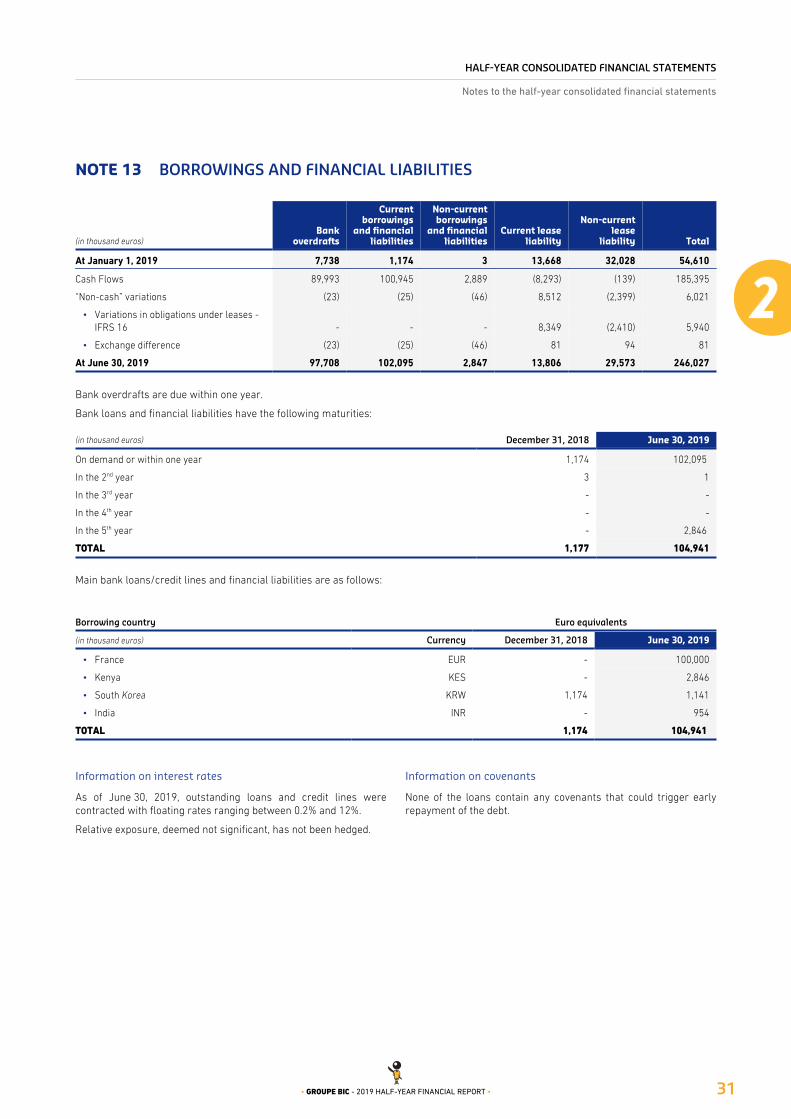
BORROWINGS AND FINANCIAL LIABILITIESNOTE 13
(in thousand euros)Bank
overdrafts
Currentborrowings
and financialliabilities
Non-currentborrowings
and financialliabilities
Current leaseliability
Non-currentlease
liability Total
At January 1, 2019 7,738 1,174 3 13,668 32,028 54,610
Cash Flows 89,993 100,945 2,889 (8,293) (139) 185,395
“Non-cash” variations (23) (25) (46) 8,512 (2,399) 6,021
Variations in obligations under leases - •IFRS 16 - - - 8,349 (2,410) 5,940
Exchange difference• (23) (25) (46) 81 94 81
At June 30, 2019 97,708 102,095 2,847 13,806 29,573 246,027
Bank overdrafts are due within one year.
Bank loans and financial liabilities have the following maturities:
(in thousand euros) December 31, 2018 June 30, 2019
On demand or within one year 1,174 102,095
In the 2nd year 3 1
In the 3rd year - -
In the 4th year - -
In the 5th year - 2,846
TOTAL 1,177 104,941
Main bank loans/credit lines and financial liabilities are as follows:
Borrowing country Euro equivalents
(in thousand euros) Currency December 31, 2018 June 30, 2019
France• EUR - 100,000
Kenya• KES - 2,846
South Korea• KRW 1,174 1,141
India• INR - 954
TOTAL 1,174 104,941
Information on interest rates
As of June 30, 2019, outstanding loans and credit lines werecontracted with floating rates ranging between 0.2% and 12%.
Relative exposure, deemed not significant, has not been hedged.
Information on covenants
None of the loans contain any covenants that could trigger earlyrepayment of the debt.

HALF-YEAR CONSOLIDATED FINANCIAL STATEMENTS
Notes to the half-year consolidated financial statements
32 • GROUPE BIC - 2019 HALF-YEAR FINANCIAL REPORT •
PROVISIONSNOTE 14
(in thousand euros)
Tax and socialrisks andlitigation Llitigation Product liability
Other risks andcharges Total
At January 1, 2018 27,052 10,129 1,151 3,837 42,170
Additional provisions 7,055 8,301 1,014 1,021 17,390
Reversals of provisions utilized (3,573) (2,508) (985) (1,225) (8,291)
Reversals of provisions not utilized (4,610) (2,410) - (476) (7,496)
Exchange differences (79) (177) 25 (570) (801)
BIC Sport divestiture - (180) - (35) (215)
Reclassification (8) (19) - 777 750
At December 31, 2018 25,837 13,136 1,205 3,329 43,507
First application IFRIC 23 – Uncertainty over income tax treatments impact (see Note 1) 13,404 - - - 13,404
At January 1, 2019 39,241 13,136 1,205 3,329 56,911
Additional provisions 768 3,114 1 22,900 26,783
Reversals of provisions utilized (713) (148) - (148) (1,009)
Reversals of provisions not utilized (102) (2,098) - (31) (2,231)
Exchange differences (36) (113) 8 (81) (222)
Reclassification (10) - - 10 -
At June 30, 2019 39,147 13,892 1,213 25,979 80,231
As of June 30, 2019, it was not deemed necessary to bookprovisions for the risks described in the Part 1 “GroupPresentation” that could affect:
the Company’s personnel, assets, environment or reputation;●
the Group’s ability to reach its objectives and abide by its●
values, ethics or the laws and regulations.
Tax and social risks and litigationProvisions for tax and social risks and litigation relate mainly to:
tax risks;●
U.S. workers’ compensation.●
Tax audits are carried out regularly by local tax authorities whichmay dispute positions taken by Group subsidiaries. In accordancewith the Group’s accounting policies, it may be decided to recordprovisions when tax-related risks are considered likely to generatea payment to local tax authorities.
The Group reviews the evaluation of all its tax positions on aregular basis, using external counsels and considers that its taxpositions are adequately provided for. However, the Group cannotpredict the ultimate outcome of future audits.
LitigationAs of June 30, 2019, the litigation provision mainly representsdistributor and commercial agent risks for 2.2 million euros, as atDecember 31, 2018.
Other risks and chargesAs of June 30, 2019, other provisions for risks and charges aremainly related to the restructuring provision for an amount of 22.6million euros (see Note 5).
Product liabilityProduct liability mainly relates to the U.S.
HALF-YEAR CONSOLIDATED FINANCIAL STATEMENTS
Notes to the half-year consolidated financial statements
33• GROUPE BIC - 2019 HALF-YEAR FINANCIAL REPORT •
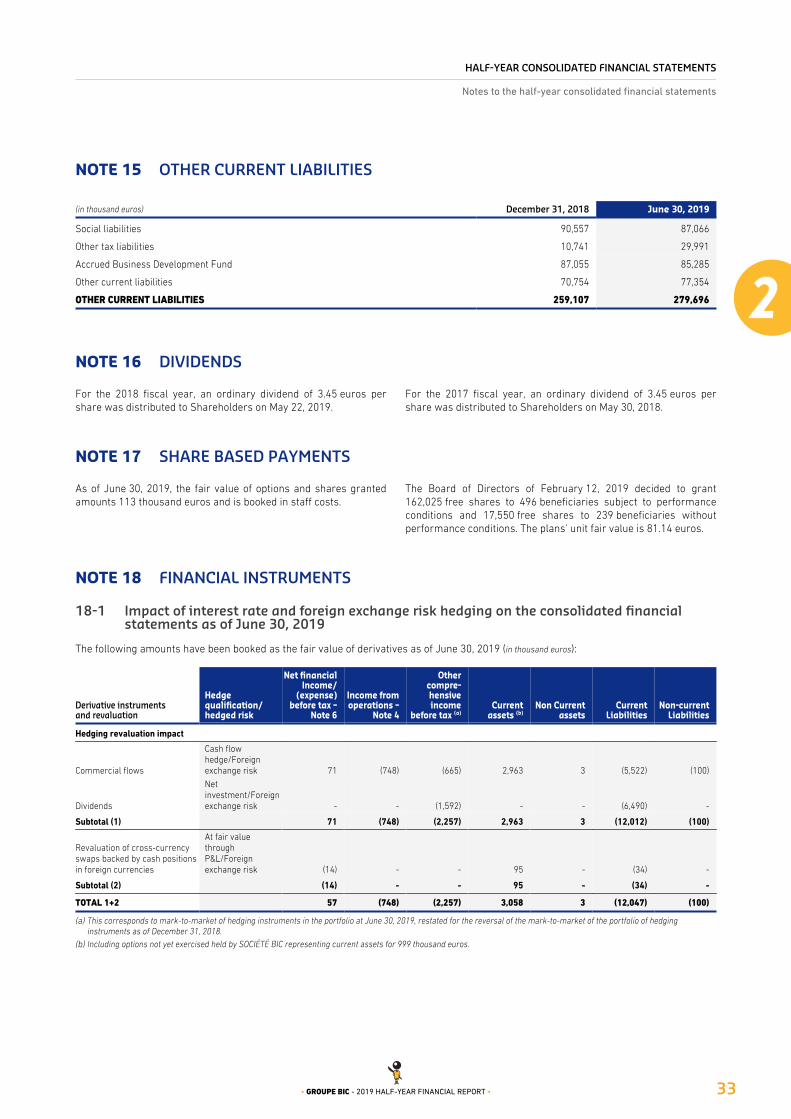
OTHER CURRENT LIABILITIESNOTE 15
(in thousand euros) December 31, 2018 June 30, 2019
Social liabilities 90,557 87,066
Other tax liabilities 10,741 29,991
Accrued Business Development Fund 87,055 85,285
Other current liabilities 70,754 77,354
OTHER CURRENT LIABILITIES 259,107 279,696
DIVIDENDSNOTE 16
For the 2018 fiscal year, an ordinary dividend of 3.45 euros pershare was distributed to Shareholders on May 22, 2019.
For the 2017 fiscal year, an ordinary dividend of 3.45 euros pershare was distributed to Shareholders on May 30, 2018.
SHARE BASED PAYMENTSNOTE 17
As of June 30, 2019, the fair value of options and shares grantedamounts 113 thousand euros and is booked in staff costs.
The Board of Directors of February 12, 2019 decided to grant162,025 free shares to 496 beneficiaries subject to performanceconditions and 17,550 free shares to 239 beneficiaries withoutperformance conditions. The plans’ unit fair value is 81.14 euros.
FINANCIAL INSTRUMENTSNOTE 18
Impact of interest rate and foreign exchange risk hedging on the consolidated financial 18-1statements as of June 30, 2019
The following amounts have been booked as the fair value of derivatives as of June 30, 2019 (in thousand euros):
Derivative instruments and revaluation
Hedge qualification/ hedged risk
Net financialIncome/
(expense)before tax –
Note 6
Income fromoperations –
Note 4
Othercompre-hensiveincome
before tax (a)Current
assets (b)Non Current
assetsCurrent
LiabilitiesNon-current
Liabilities
Hedging revaluation impact
Commercial flows
Cash flow hedge/Foreign exchange risk 71 (748) (665) 2,963 3 (5,522) (100)
Dividends
Net investment/Foreign exchange risk - - (1,592) - - (6,490) -
Subtotal (1) 71 (748) (2,257) 2,963 3 (12,012) (100)
Revaluation of cross-currency swaps backed by cash positions in foreign currencies
At fair value through P&L/Foreign exchange risk (14) - - 95 - (34) -
Subtotal (2) (14) - - 95 - (34) -
TOTAL 1+2 57 (748) (2,257) 3,058 3 (12,047) (100)
This corresponds to mark-to-market of hedging instruments in the portfolio at June 30, 2019, restated for the reversal of the mark-to-market of the portfolio of hedging (a)instruments as of December 31, 2018.Including options not yet exercised held by SOCIÉTÉ BIC representing current assets for 999 thousand euros.(b)

HALF-YEAR CONSOLIDATED FINANCIAL STATEMENTS
Notes to the half-year consolidated financial statements
34 • GROUPE BIC - 2019 HALF-YEAR FINANCIAL REPORT •
Impact of interest rate and foreign exchange risk hedging on the consolidated financial 18-2statements as of December 31, 2018
The following amounts have been booked as the fair value of derivatives as of December 2018 (in thousand euros):
Derivative instruments and revaluation
Hedge income qualification/ hedged risk
Net financialIncome/
(expense)before tax –
Note 6
Income fromoperations –
Note 4
Othercompre-hensiveincome
before tax (a)Current
assets (b)Non-current
assetsCurrent
LiabilitiesNon-current
Liabilities
Hedging revaluation impact
Commercial flows
Cash flow hedge/Foreign exchange risk - (4,608) (19,411) 5,058 44 (7,346) (37)
Dividends
Net investment/Foreign exchange risk - (3,932) - - (3,930) -
Subtotal (1) (4,608) (23,344) 5,058 44 (11,276) (37)
Revaluation of cross-currency swaps backed by cash positions in foreign currencies
At fair value through P&L/Foreign exchange risk
Subtotal (2) 249 - - 231 - (157) -
TOTAL 1+2 249 (4,608) (23,344) 5,289 44 (11,433) (37)
This corresponds to mark-to-market of hedging instruments in the portfolio at December 31, 2018, restated for the reversal of the mark-to-market of the portfolio of hedging (a)instruments as of December 31, 2017.Including options not yet exercised held by SOCIÉTÉ BIC representing current assets for 928 thousand euros.(b)
CONTINGENT LIABILITIESNOTE 19
As of June 30, 2019, neither SOCIÉTÉ BIC nor its subsidiaries had no knowledge of any contingent liabilities.
EXPOSURE TO MARKET RISKSNOTE 20
Credit risk20-1
(in thousand euros) Note December 31, 2018 June 30, 2019
Gross trade receivables
Not yet due or past due for less than 60 days 451,856 548,832
Past due for 60 to 90 days 11,309 7,334
Past due for 90 to 120 days 7,740 6,622
Past due for more than 120 days 23,602 25,678
Total gross trade receivables 494,507 588,466
Doubtful receivables 11,987 12,912
TOTAL BEFORE ALLOWANCE (A) 506,494 601,378
Allowance on trade receivables not yet due or for less than 60 days past due (4,644) (4,913)
Allowance on trade receivables for 60 to 90 days past due (284) (709)
Allowance on trade receivables for 90 to 120 days past due (396) (853)
Allowance on trade receivables for more than 120 days past due (20,679) (21,926)
TOTAL ALLOWANCE (B) (26,003) (28,412)
Allowance on specific trade receivables (21,387) (22,254)
Allowance on statistically calculated trade receivables (4,616) (6,158)
Other receivables (C) 54,192 66,658
TRADE AND OTHER RECEIVABLES – NET (A)+(B)+(C) 11 534,683 639,624
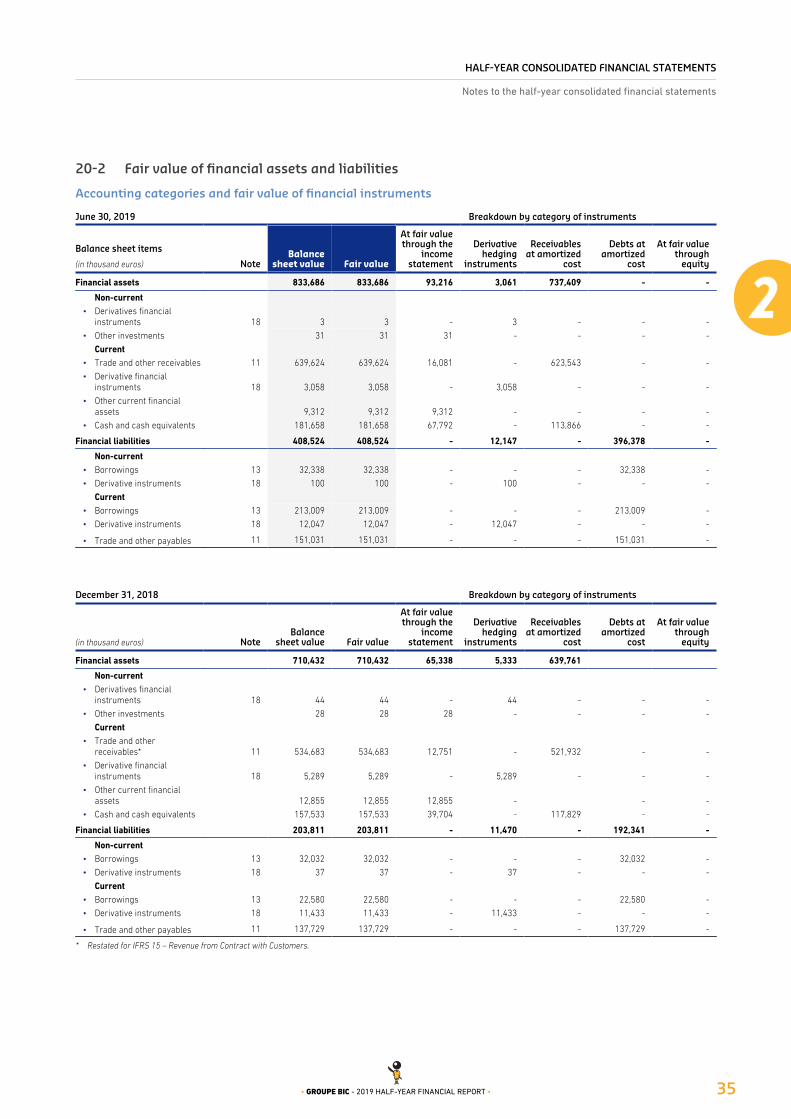
HALF-YEAR CONSOLIDATED FINANCIAL STATEMENTS
Notes to the half-year consolidated financial statements
35• GROUPE BIC - 2019 HALF-YEAR FINANCIAL REPORT •
Fair value of financial assets and liabilities20-2
Accounting categories and fair value of financial instruments
June 30, 2019 Breakdown by category of instruments
Balance sheet items
(in thousand euros) NoteBalance
sheet value Fair value
At fair valuethrough the
incomestatement
Derivativehedging
instruments
Receivablesat amortized
cost
Debts atamortized
cost
At fair valuethrough
equity
Financial assets 833,686 833,686 93,216 3,061 737,409 - -
Non-currentDerivatives financial •instruments 18 3 3 - 3 - - -
Other investments• 31 31 31 - - - -
CurrentTrade and other receivables• 11 639,624 639,624 16,081 - 623,543 - -
Derivative financial •instruments 18 3,058 3,058 - 3,058 - - -
Other current financial •assets 9,312 9,312 9,312 - - - -
Cash and cash equivalents• 181,658 181,658 67,792 - 113,866 - -
Financial liabilities 408,524 408,524 - 12,147 - 396,378 -
Non-currentBorrowings• 13 32,338 32,338 - - - 32,338 -
Derivative instruments• 18 100 100 - 100 - - -
CurrentBorrowings• 13 213,009 213,009 - - - 213,009 -
Derivative instruments• 18 12,047 12,047 - 12,047 - - -
Trade and other payables• 11 151,031 151,031 - - - 151,031 -
December 31, 2018 Breakdown by category of instruments
(in thousand euros) NoteBalance
sheet value Fair value
At fair valuethrough the
incomestatement
Derivativehedging
instruments
Receivablesat amortized
cost
Debts atamortized
cost
At fair valuethrough
equity
Financial assets 710,432 710,432 65,338 5,333 639,761
Non-currentDerivatives financial •instruments 18 44 44 - 44 - - -
Other investments• 28 28 28 - - - -
CurrentTrade and other •receivables* 11 534,683 534,683 12,751 - 521,932 - -
Derivative financial •instruments 18 5,289 5,289 - 5,289 - - -
Other current financial •assets 12,855 12,855 12,855 - - -
Cash and cash equivalents• 157,533 157,533 39,704 - 117,829 - -
Financial liabilities 203,811 203,811 - 11,470 - 192,341 -
Non-currentBorrowings• 13 32,032 32,032 - - - 32,032 -
Derivative instruments• 18 37 37 - 37 - - -
CurrentBorrowings• 13 22,580 22,580 - - - 22,580 -
Derivative instruments• 18 11,433 11,433 - 11,433 - - -
Trade and other payables• 11 137,729 137,729 - - - 137,729 -
Restated for IFRS 15 – Revenue from Contract with Customers.*

HALF-YEAR CONSOLIDATED FINANCIAL STATEMENTS
Notes to the half-year consolidated financial statements
36 • GROUPE BIC - 2019 HALF-YEAR FINANCIAL REPORT •
The valuation methods adopted for financial instruments are asfollows:
Financial instruments other than derivatives recorded in the●
balance sheet:
The book values used are reasonable estimates of theirmarket value except for marketable securities whose carryingvalues used are determined based on the last known netasset values as of June 30, 2019.
Derivative financial instruments:●
Market values were calculated internally or by an externalthird-party on the basis of last-known closing prices as ofJune 30, 2019. They are consistent with valuation reportsprovided by financial institutions.
Fair value valuation methodThe tables below set out the fair value method for valuing financialinstruments, using the following three levels:
level 1 (quoted prices in active markets): money market UCITS●
and other current financial assets;
level 2 (observable inputs): derivatives – hedge accounting;●
level 3 (non-observable inputs): no such instruments are held●
as of June 30, 2019.
June 30, 2019
Category of instruments
(in thousand euros) Total Level 1 Level 2 Level 3
At fair value through the income statement – Assets 93,216 93,216 - -
Derivative hedges – Assets 3,061 - 3,061 -
Derivative hedges – Liabilities 12,147 - 12,147 -

37• GROUPE BIC - 2019 HALF-YEAR FINANCIAL REPORT •
AUDITOR'S REPORT

AUDITOR'S REPORT
38 • GROUPE BIC - 2019 HALF-YEAR FINANCIAL REPORT •
For the period from January 1 to June 30, 2019This is a translation into English of the statutory auditors' review report on the half-yearly financial information issued in French and is providedsolely for the convenience of English-speaking users. This report includes information relating to the specific verification of information given inthe Group’s half-yearly management report. This report should be read in conjunction with, and construed in accordance with, French law andprofessional standards applicable in France.
To the Shareholders,
In compliance with the assignment entrusted to us by your Annual General Meeting and in accordance with the requirements of Article L.451-1-2 III of the French monetary and financial Code (Code monétaire et financier), we hereby report to you on:
the review of the accompanying condensed interim consolidated financial statements of SOCIETE BIC, for the period from January 1●
to June 30, 2019;
the verification of the information presented in the half-year management report.●
These condensed interim consolidated financial statements are your Board of Directors’ responsibility. Our role is to express a conclusionon these financial statements based on our review.
I - Conclusion on the financial statements
We conducted our review in accordance with professional standards applicable in France. A review of interim financial informationconsists of making inquiries, primarily of persons responsible for financial and accounting matters, and applying analytical and otherreview procedures. A review is substantially less in scope than an audit conducted in accordance with professional standards applicable inFrance and consequently does not enable us to obtain assurance that we would become aware of all significant matters that might beidentified in an audit. Accordingly, we do not express an audit opinion.
Based on our review, nothing has come to our attention that causes us to believe that the accompanying condensed interim consolidatedfinancial statements are not prepared, in all material respects, in accordance with IAS 34 – standard of the IFRSs as adopted by theEuropean Union applicable to interim financial information.
Without qualifying our conclusion expressed above, we draw your attention to the note 1.1.2 to the condensed interim consolidatedfinancial statements, which describes the impacts related to the first application of the standard IFRIC 23 - Uncertainty over Income TaxTreatments, as of January 1, 2019.
II - Specific verification
We have also verified the information presented in the half-yearly management report on the condensed interim consolidated financialstatements subject to our review. We have no matters to report as to its fair presentation and consistency with the condensed interimconsolidated financial statements.
Neuilly-sur-Seine and Paris La Défense, July 31, 2019
The Statutory Auditors
French original signed by
Grant Thornton
French member of Grant Thornton International
Vianney Martin
Deloitte & Associés
François Buzy

39• GROUPE BIC - 2019 HALF-YEAR FINANCIAL REPORT •
STATEMENT ON THE HALF-YEARLY REPORT 2019

STATEMENT ON THE HALF-YEARLY REPORT 2019
40 • GROUPE BIC - 2019 HALF-YEAR FINANCIAL REPORT •
NAME AND FUNCTION
Gonzalve Bich
Chief Executive Officer
DECLARATION BY RESPONSIBLE PERSON OF THE HALF-YEAR REPORT
"I hereby declare that, to the best of my knowledge, the condensed consolidated financial statements for the half-year ended June 30, 2019have been prepared in accordance with applicable accounting standards and give a true and fair view of the assets, liabilities, financialposition and the profit of the Company and the entities included in the scope of consolidation of the Group and that the First HalfManagement Report includes a faithful representation of the major events which occurred during the first six months of the financial year,their impact on the financial statements, of the main related-party transactions, as well as a description of the major risks anduncertainties for the remaining six months of the year. "
On July 31, 2019
Gonzalve Bich
Chief Executive Officer


• SOCIÉTÉ B IC
92611 CL ICHY
CEDEX (FRANCE)
www.bicworld .com