2019 essa indicators and calculations - arkansas
TRANSCRIPT

2019 ESSA Indicators and Calculations
Louis FerrenDirector of Data Quality for School Performance
Public School AccountabilityArkansas Department of Education
June 19, 2019
Vision
The Arkansas Department of Education is transforming Arkansas to lead the nation in student-focused education.
Mission
The Arkansas Department of Education provides leadership, support, and service to schools, districts, and communities so every student graduates prepared for college, career, and community engagement.
Finding the Business Rules for Calculating the 2019 ESSA School
Index Scores
Find Informational Documents at the following link:
http://www.arkansased.gov/divisions/public-school-accountability/every-student-succeeds-act-essa/informational-documents


ESSA Index Indicators

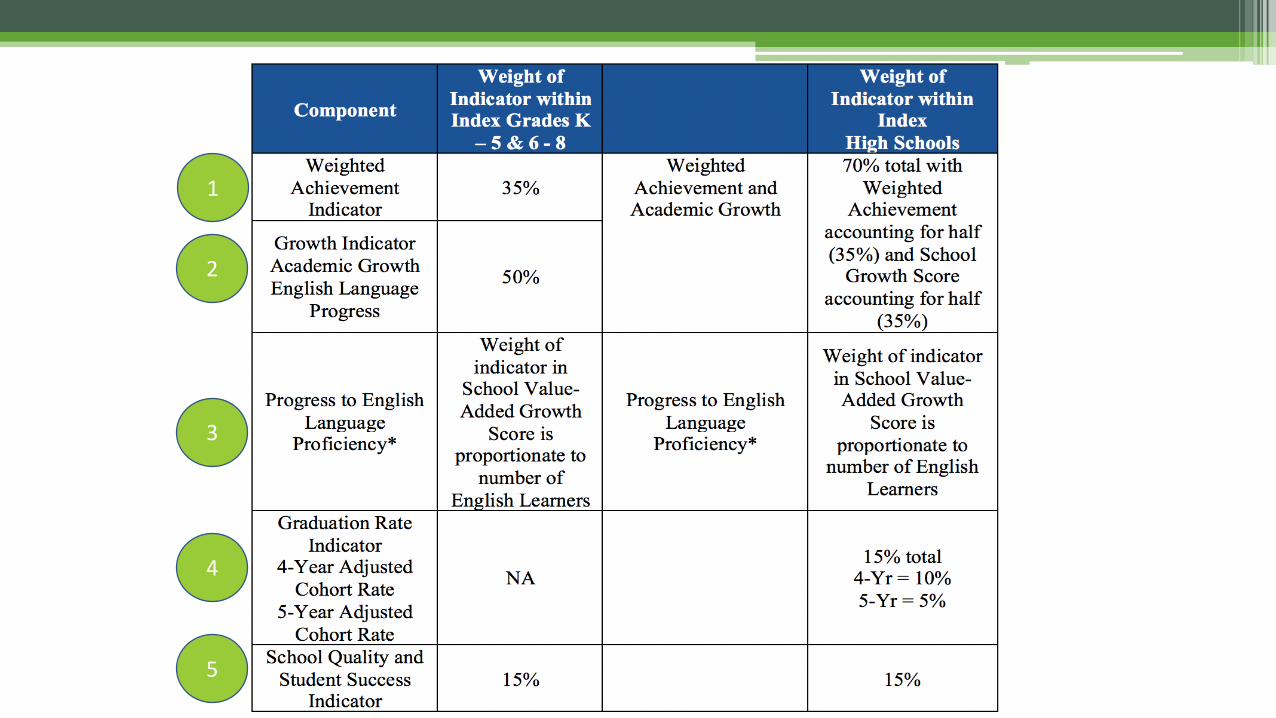
What is the ESSA School Index?The Every Student Succeeds Act (2015) provided states the opportunity to engage stakeholders in the development of the states’ accountability systems. ESSA required states to include at least five indicators for success:
1. Achievement,2. Growth,3. English learner progress toward
English language proficiency, 4. Graduation rate, and5. School Quality and Student Success
(SQSS)
Stakeholder Designed
Accountability System
1
2
3
4
5

Understanding Weighted Achievement
Indicator 1
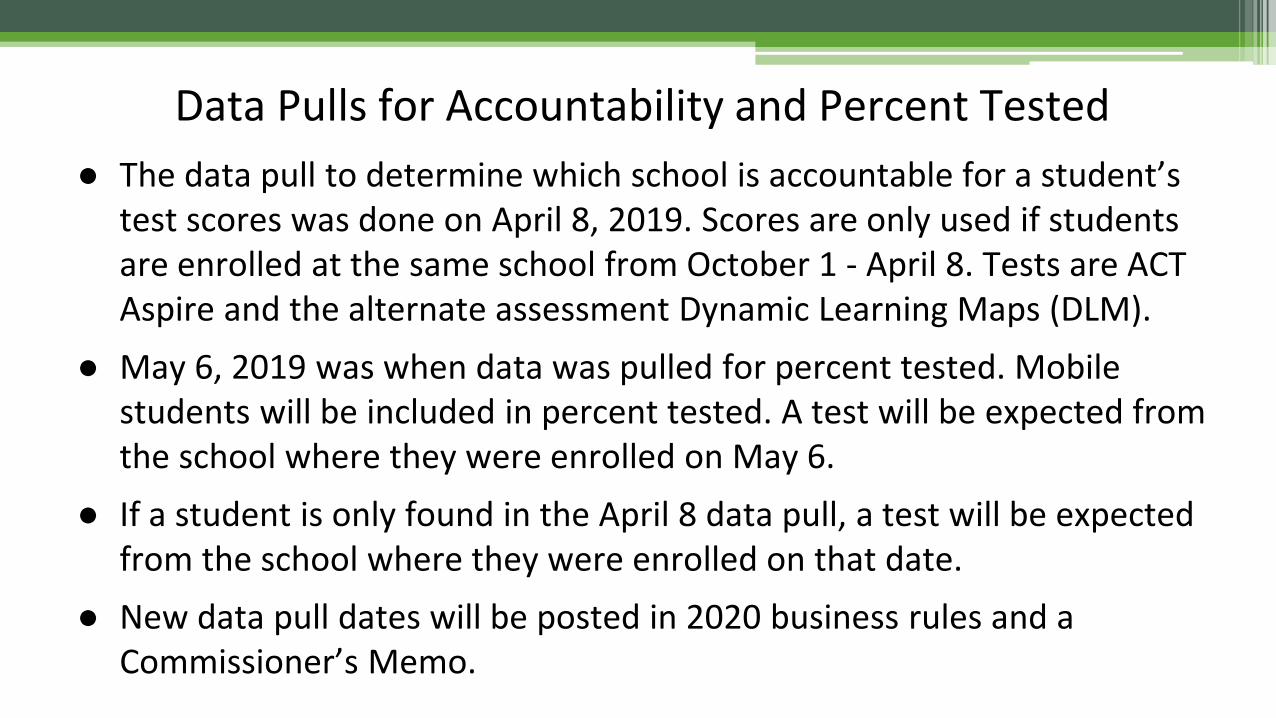
Data Pulls for Accountability and Percent Tested● The data pull to determine which school is accountable for a student’s
test scores was done on April 8, 2019. Scores are only used if students are enrolled at the same school from October 1 - April 8. Tests are ACT Aspire and the alternate assessment Dynamic Learning Maps (DLM).
● May 6, 2019 was when data was pulled for percent tested. Mobile students will be included in percent tested. A test will be expected from the school where they were enrolled on May 6.
● If a student is only found in the April 8 data pull, a test will be expected from the school where they were enrolled on that date.
● New data pull dates will be posted in 2020 business rules and a Commissioner’s Memo.
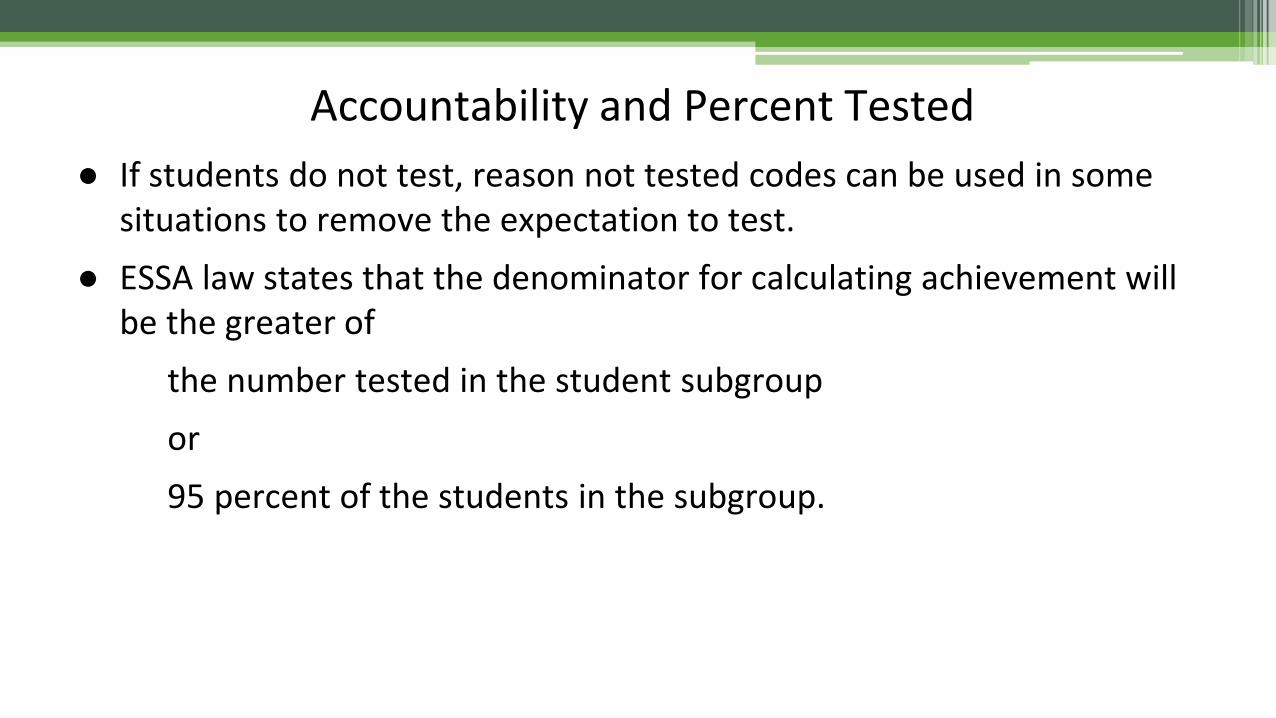
Accountability and Percent Tested● If students do not test, reason not tested codes can be used in some
situations to remove the expectation to test.● ESSA law states that the denominator for calculating achievement will
be the greater ofthe number tested in the student subgroup or 95 percent of the students in the subgroup.

Recently Arrived English LearnersRecently arrived English Learners (first year in the U.S.) are required to test. The scores will not be used to calculate achievement. The scores will be used to calculate growth when the students test in the second year. Test scores for the students will be used for achievement calculations in the third year.

Weighted Achievement PointsAchievement Level ACT Aspire Achievement Level DLM Designation Points Earned for Each Level
In Need of Support Emerging Level 1 (L1) 0.00
Close Approaching Target Level 2 (L2) 0.50
Ready At Target Level 3 (L3) 1.00
Exceeds Step one:Number of students in Level 4 is less than or equal to the number in Level 1.
Advanced Step one:Number of students in Level 4 is less than or equal to the number in Level 1.
Level 4 (L4) 1.00
Exceeds Step two:Number of students in Level 4 is greater than the number in Level 1.
Advanced Step two:Number of students in Level 4 is greater than the number in Level 1.
Level 4 (L4) 1.25

Determining Weighted Achievement: Example 1
*Sum at L1 = 9 = Sum at L4. Subtract #L1s from #L4s. 9 – 9 =0. Therefore, #L4 multiplied by 1.00 point. 9*1.00 = 9 points for L4.
#L1 students #L2 students #L3 students #L4 students
ELA 2 3 4 7
Math 7 4 3 2
SUM at each level 9 7 7 9*
Points at each level 9*0.00 =0.00 7*0.50 = 3.50 7*1.00= 7.00 9*1.00 = 9.00

Determining Weighted Achievement: Example 2
Sum at L1 = 5 < Sum at L4 = 13. Subtract #L1 from #L4. The difference is multiplied by 1.25. Since there are 5 L1s then 5L4s must be multiplied by 1.00 and the remaining L4s are multiplied by 1.25.(5L4s*1.00) + (8L4s*1.25) points = 15 points for L4.
#L1 students #L2 students #L3 students #L4 students
ELA 2 3 4 7Math 3 2 5 6SUM at each Level 5 5 9 13*Multiply # at each level to get Points at each level
5*0.00 = 0.00 5*0.50 = 2.50 9*1.00 = 9.00 (5*1.00) + (8*1.25) = (5 + 10)
= 15


Corrections Process

Where are Corrections Entered?
https://adedata.arkansas.gov/
The Assessment Correction Engine (ACE) interface will be available to all districts from August 1 through August 14 at the following link: https://adedata.arkansas.gov/ . Users will be directed to the ADE Data Center to log in. District or School Level users should use their TRIAND login credentials to log in. Scroll down to the “ADE Systems of Support” tiles, then toward the bottom right of the page click on “Assessment Correction Engine”, which is on the “Systems of Accountability: ESSA” tile.


Corrections and Appeals ➢Data teams and school leaders can
enter reason not tested codes and documentation from August 1 through August 14, 2019.
➢Evidence supporting each reason not tested code must be uploaded in ACE.
➢Late submissions are not accepted.

What Are Some Exemptions From Requirement To Test?
Following are examples of reasons not tested used to exclude students from enrollment expected to test: Medical Emergency/Extended Hospitalization; Resident code ‘X’ for students in a residential facility; Resident code ‘1’, ‘2’, ‘4’ and ‘5’ for home-schooled or private school students; Incarcerated, Deceased; and Withdrew from school.Commissioner’s Memo COM-19-102 at the following link has information about using the Assessment Correction Engine (ACE) and an attachment with the reason not tested codes and required documentation. http://adecm.arkansas.gov/ViewApprovedMemo.aspx?Id=3977


Assessment Correction Engine – District User Guide
The current Reason Not Tested code
‘??’ indicates no RNT code has been provided for the record.
Navigation Tabs for toggling between subjects.

Assessment Correction Engine – District User Guide
The current Reason Not Tested code
‘??’ indicates no RNT code has been provided for the record.
Assessment Status Indicators specify what assessment the student was expected to take, the RNT Code (if specified) and the exclusion status of the record.
Navigation Tabs for toggling between subjects.
To provide or modify a Reason Not Tested code, or to upload documentation for a non-tested enrollment record, click the ‘Action’ button located in the last column of the associated record. A dropdown menu will appear, allowing you to click an ‘Update / Upload Document’ item.
When ‘Update / Upload Document’ is selected, you will be presented with a popup screen allowing you to select the appropriate RNT code for the record, and to provide documentation supporting the change.

To Change 1st Year in the United StatesSelect Review Demographics for Tested Students
Value Added GrowthIndicators 2 & 3
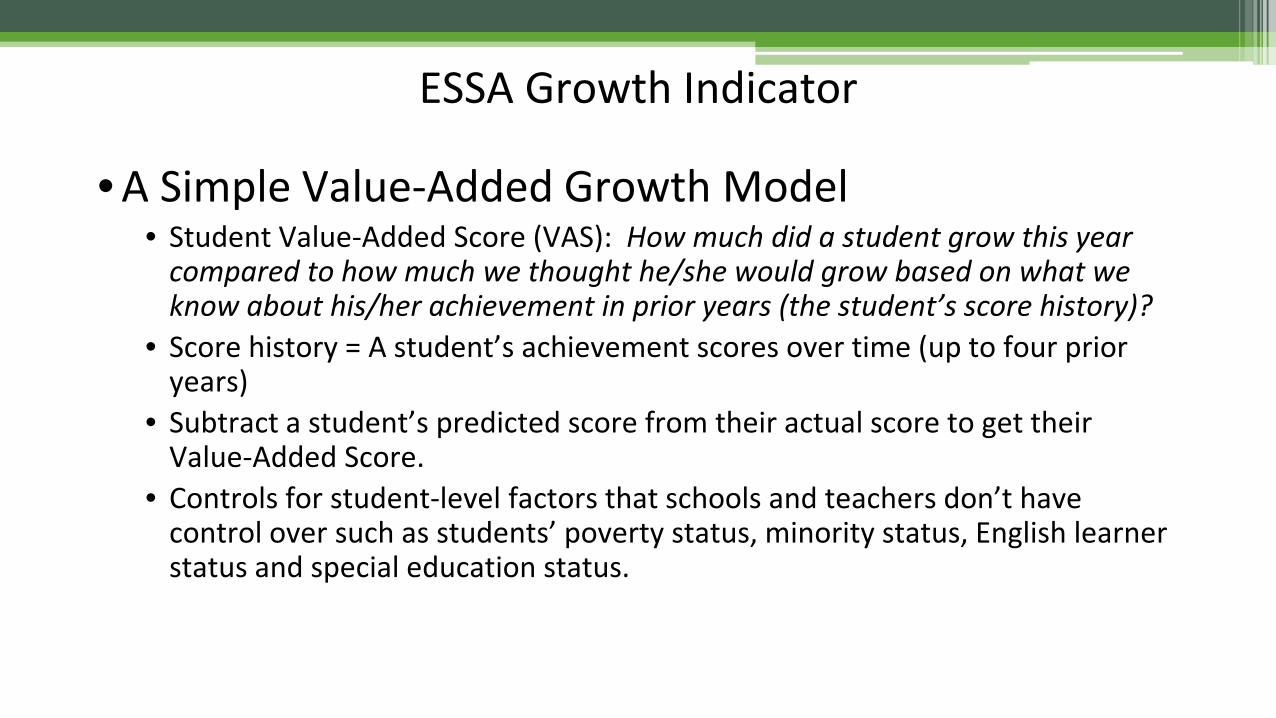
ESSA Growth Indicator
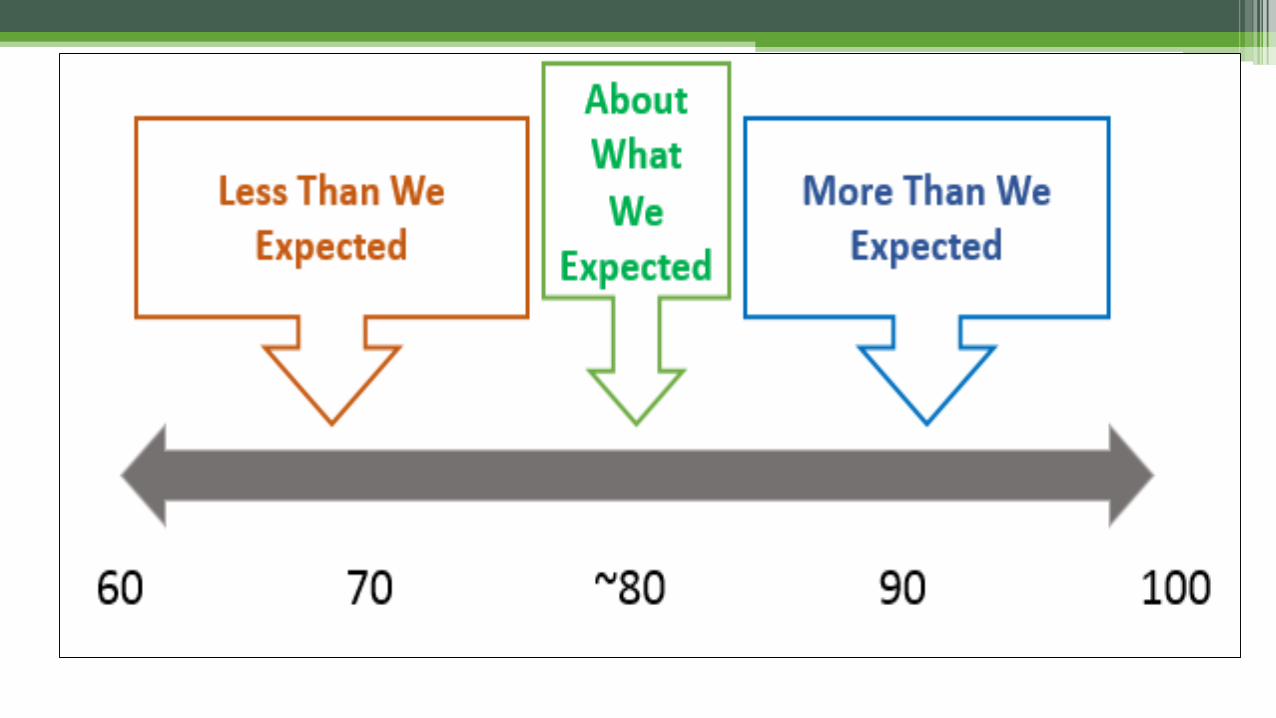
• A Simple Value-Added Growth Model• Student Value-Added Score (VAS): How much did a student grow this year
compared to how much we thought he/she would grow based on what we know about his/her achievement in prior years (the student’s score history)?
• Score history = A student’s achievement scores over time (up to four prior years)
• Subtract a student’s predicted score from their actual score to get their Value-Added Score.
• Controls for student-level factors that schools and teachers don’t have control over such as students’ poverty status, minority status, English learner status and special education status.

Student’s Scores are Placed on a Standard Scale
• To calculate growth across different tests use a standard score (z score)
Construct a score history using students’ z scores
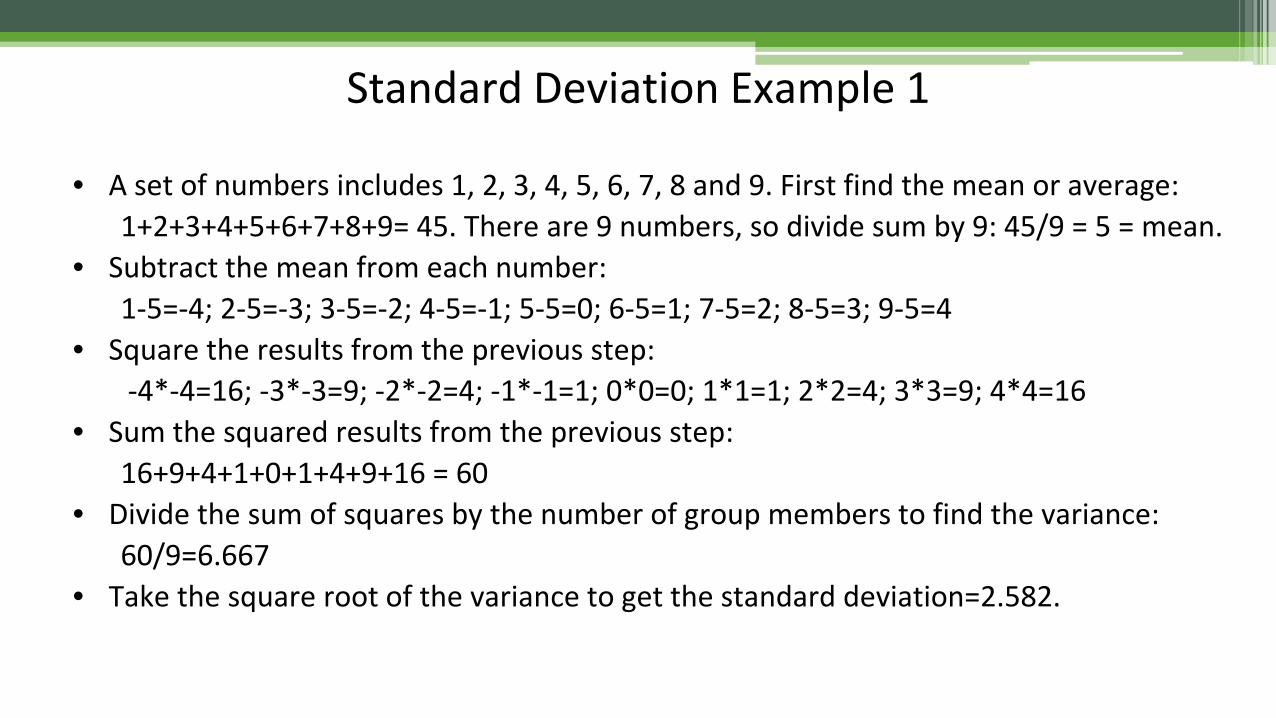
Standard Deviation Example 1
• A set of numbers includes 1, 2, 3, 4, 5, 6, 7, 8 and 9. First find the mean or average:1+2+3+4+5+6+7+8+9= 45. There are 9 numbers, so divide sum by 9: 45/9 = 5 = mean.
• Subtract the mean from each number:1-5=-4; 2-5=-3; 3-5=-2; 4-5=-1; 5-5=0; 6-5=1; 7-5=2; 8-5=3; 9-5=4
• Square the results from the previous step:-4*-4=16; -3*-3=9; -2*-2=4; -1*-1=1; 0*0=0; 1*1=1; 2*2=4; 3*3=9; 4*4=16
• Sum the squared results from the previous step:16+9+4+1+0+1+4+9+16 = 60
• Divide the sum of squares by the number of group members to find the variance:60/9=6.667
• Take the square root of the variance to get the standard deviation=2.582.

Standard Deviation Example 2
• A set of numbers includes 6, 7, 8, 9, 8 and 10. First find the mean or average. 6 + 7 + 8 + 9 + 8 +10 = 48. There are 6 numbers, so divide by 6: 48/6 = 8 = mean.
• Subtract the mean from each number:6-8=-2; 7-8=-1; 8-8=0; 9-8=1; 8-8=0; 10-8=2
• Square the results from the previous step:-2*-2=4; -1*-1=1; 0*0=0; 1*1=1; 0*0=0; 2*2=4
• Sum the squared results from the previous step:4+1+0+1+0+4 = 10
• Divide the sum of squares by the number of group members to find the variance:10/6=1.6666667
• Take the square root of the variance to get the standard deviation = 1.291
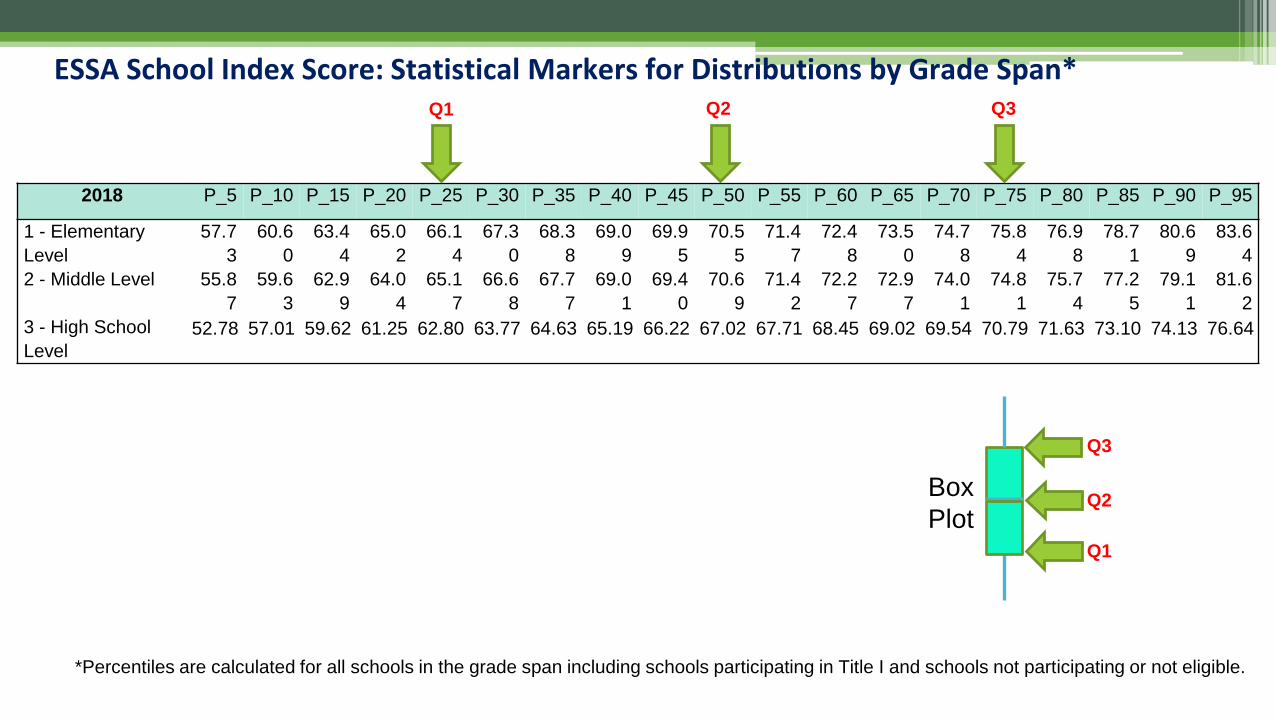
ESSA School Index Score: Statistical Markers for Distributions by Grade Span*
*Percentiles are calculated for all schools in the grade span including schools participating in Title I and schools not participating or not eligible.
2018 P_5 P_10 P_15 P_20 P_25 P_30 P_35 P_40 P_45 P_50 P_55 P_60 P_65 P_70 P_75 P_80 P_85 P_90 P_95
1 - Elementary Level
57.73
60.60
63.44
65.02
66.14
67.30
68.38
69.09
69.95
70.55
71.47
72.48
73.50
74.78
75.84
76.98
78.71
80.69
83.64
2 - Middle Level 55.87
59.63
62.99
64.04
65.17
66.68
67.77
69.01
69.40
70.69
71.42
72.27
72.97
74.01
74.81
75.74
77.25
79.11
81.62
3 - High School Level
52.78 57.01 59.62 61.25 62.80 63.77 64.63 65.19 66.22 67.02 67.71 68.45 69.02 69.54 70.79 71.63 73.10 74.13 76.64
Q1 Q2 Q3
Q1
Q2
Q3
BoxPlot

If a student is declining, will he/she be expected to keep declining? Won’t the expected growth keep going down?
• Not necessarily, even though the student’s score history helps set the expectation for growth…
• The achievement of other students at the same grade level in the current year helps adjust the expectation when the student is further away from the mean.

If a student is consistently really high achieving, can he/she meet or exceed expected growth?
• Yes, the score history will help set the expectation to continue to achieve at high levels…
• AND, the achievement of other students at the same grade level in the current year help adjust the expectation when the student is further away from the mean.
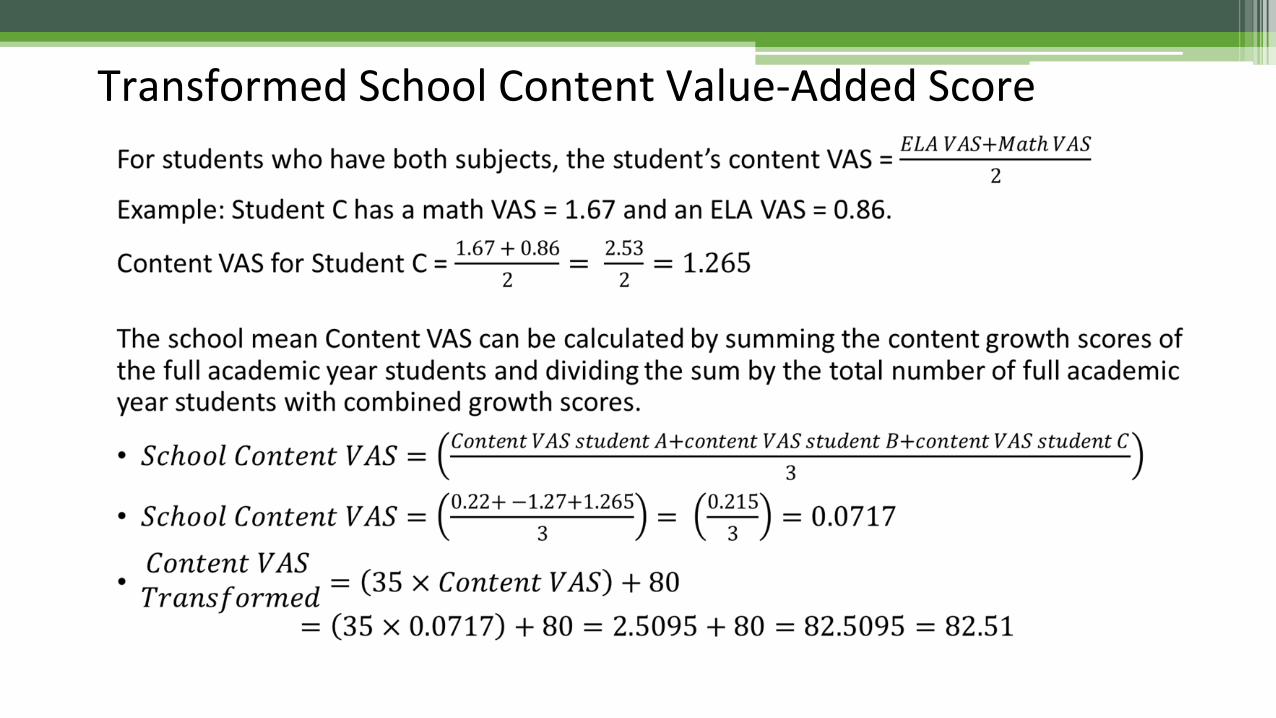
Transformed School Content Value-Added Score

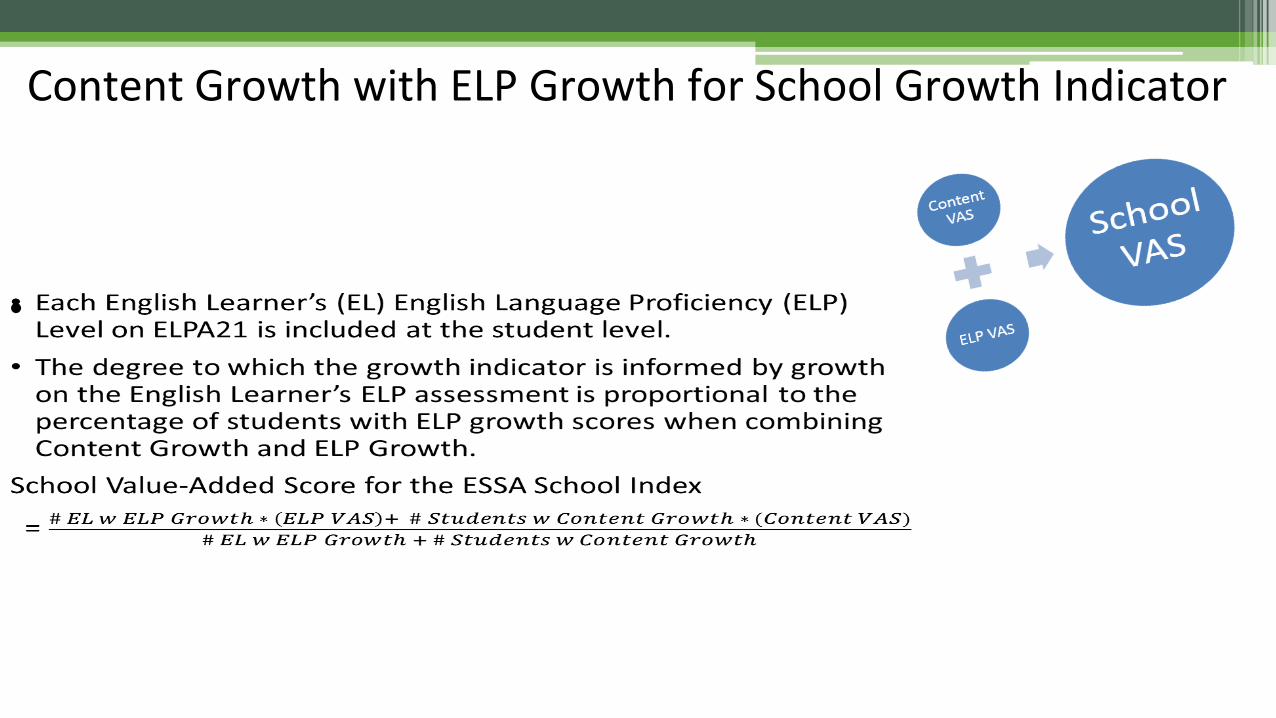
Content Growth with ELP Growth for School Growth Indicator
•

Example: Elementary School with High Proportion of ELs•65 English learners with
ELP Growth Scores
• N ELs is 43.33% of Total Growth N
• 84.25 ELP Growth Score
85 students with math and/or ELA
Growth Scores*
• N Content is 56.67% of Total Growth N
• 82.09 Math + ELA Content Growth Score
*This includes the ~65 ELs’ math and/or ELA scores for content.
# ELs w ELP ≈ # ELs w Math and/or ELA content growth. Same students but due to different testing windows may or may not have all scores for both assessments (ELP and content).
Graduation RatesIndicator 4

4 Year Cohorts Calculation Calculation
# 𝑎𝑎𝑐𝑐𝑡𝑡𝑢𝑢𝑎𝑎𝑙𝑙 𝑔𝑔𝑟𝑟𝑎𝑎𝑑𝑑𝑢𝑢𝑎𝑎𝑡𝑡𝑒𝑒𝑠𝑠 𝑖𝑖𝑖𝑖 4 𝑦𝑦𝑒𝑒𝑎𝑎𝑟𝑟𝑠𝑠 (𝑎𝑎𝑠𝑠 𝑟𝑟𝑒𝑒𝑝𝑝𝑜𝑜𝑟𝑟𝑡𝑡𝑒𝑒𝑑𝑑𝑖𝑖𝑖𝑖 𝐶𝐶𝑦𝑦𝑐𝑐𝑙𝑙𝑒𝑒 9 𝐺𝐺𝑟𝑟𝑎𝑎𝑑𝑑𝑢𝑢𝑎𝑎𝑡𝑡𝑒𝑒𝑠𝑠 𝑡𝑡𝑎𝑎𝑏𝑏𝑙𝑙𝑒𝑒)--------------------------------------
# 𝑖𝑖𝑖𝑖𝑖𝑖𝑡𝑡𝑖𝑖𝑎𝑎𝑙𝑙 𝑐𝑐𝑜𝑜ℎ𝑜𝑜𝑟𝑟𝑡𝑡 + # 𝑜𝑜𝑖𝑖𝑡𝑡𝑖𝑖𝑚𝑚𝑒𝑒 𝑡𝑡𝑟𝑟𝑎𝑎𝑖𝑖𝑠𝑠𝑓𝑓𝑒𝑒𝑟𝑟𝑠𝑠 𝑖𝑖𝑖𝑖 − # 𝑜𝑜𝑓𝑓 𝑠𝑠𝑡𝑡𝑢𝑢𝑑𝑑𝑒𝑒𝑖𝑖𝑡𝑡𝑠𝑠 𝑤𝑤ℎ𝑜𝑜 𝑡𝑡𝑟𝑟𝑎𝑎𝑖𝑖𝑠𝑠𝑓𝑓𝑒𝑒𝑟𝑟 𝑜𝑜𝑢𝑢𝑡𝑡 𝑜𝑜𝑓𝑓 𝑐𝑐𝑜𝑜ℎ𝑜𝑜𝑟𝑟t
(Expected)
Cohort Years
2017-2018= 12th Grade
2016-2017= 11th Grade
2015-2016= 10th Grade
2014-2015= 9th Grade
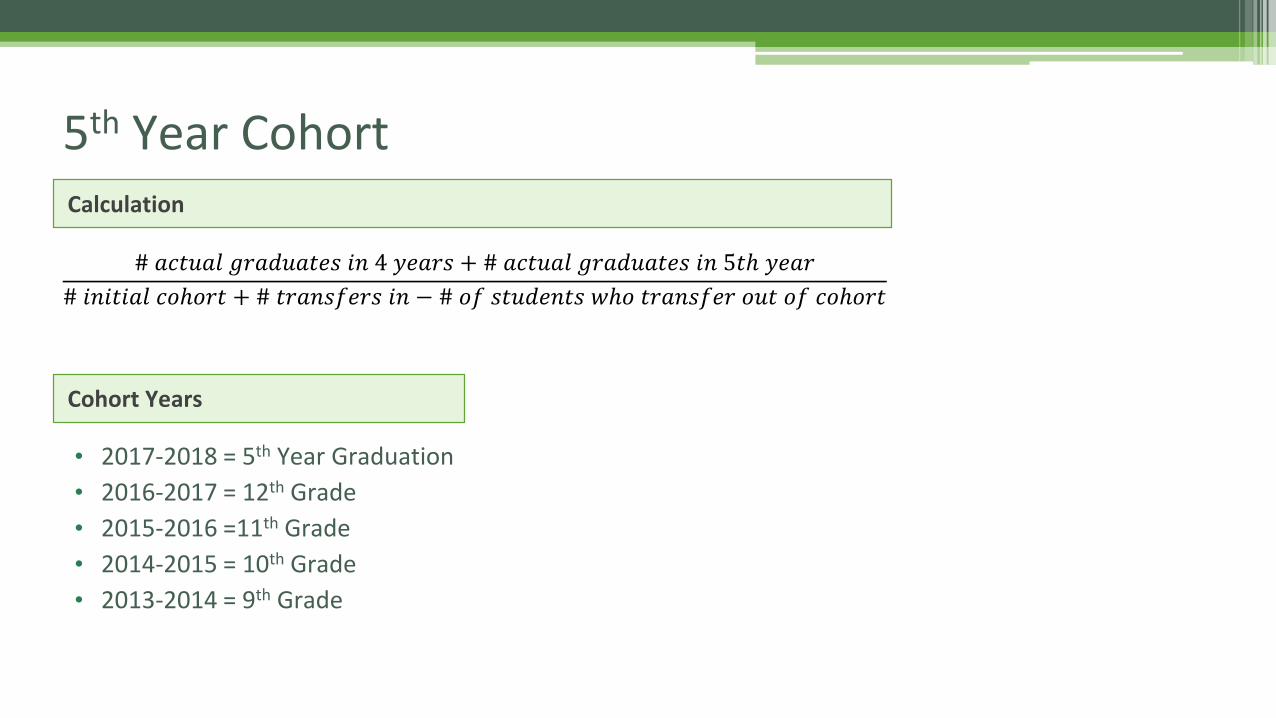
5th Year Cohort Calculation
Cohort Years
• 2017-2018 = 5th Year Graduation• 2016-2017 = 12th Grade• 2015-2016 =11th Grade• 2014-2015 = 10th Grade• 2013-2014 = 9th Grade
# 𝑎𝑎𝑐𝑐𝑡𝑡𝑢𝑢𝑎𝑎𝑙𝑙 𝑔𝑔𝑟𝑟𝑎𝑎𝑑𝑑𝑢𝑢𝑎𝑎𝑡𝑡𝑒𝑒𝑠𝑠 𝑖𝑖𝑖𝑖 4 𝑦𝑦𝑒𝑒𝑎𝑎𝑟𝑟𝑠𝑠 + # 𝑎𝑎𝑐𝑐𝑡𝑡𝑢𝑢𝑎𝑎𝑙𝑙 𝑔𝑔𝑟𝑟𝑎𝑎𝑑𝑑𝑢𝑢𝑎𝑎𝑡𝑡𝑒𝑒𝑠𝑠 𝑖𝑖𝑖𝑖 5𝑡𝑡ℎ 𝑦𝑦𝑒𝑒𝑎𝑎𝑟𝑟# 𝑖𝑖𝑖𝑖𝑖𝑖𝑡𝑡𝑖𝑖𝑎𝑎𝑙𝑙 𝑐𝑐𝑜𝑜ℎ𝑜𝑜𝑟𝑟𝑡𝑡 + # 𝑡𝑡𝑟𝑟𝑎𝑎𝑖𝑖𝑠𝑠𝑓𝑓𝑒𝑒𝑟𝑟𝑠𝑠 𝑖𝑖𝑖𝑖 − # 𝑜𝑜𝑓𝑓 𝑠𝑠𝑡𝑡𝑢𝑢𝑑𝑑𝑒𝑒𝑖𝑖𝑡𝑡𝑠𝑠 𝑤𝑤ℎ𝑜𝑜 𝑡𝑡𝑟𝑟𝑎𝑎𝑖𝑖𝑠𝑠𝑓𝑓𝑒𝑒𝑟𝑟 𝑜𝑜𝑢𝑢𝑡𝑡 𝑜𝑜𝑓𝑓 𝑐𝑐𝑜𝑜ℎ𝑜𝑜𝑟𝑟𝑡𝑡
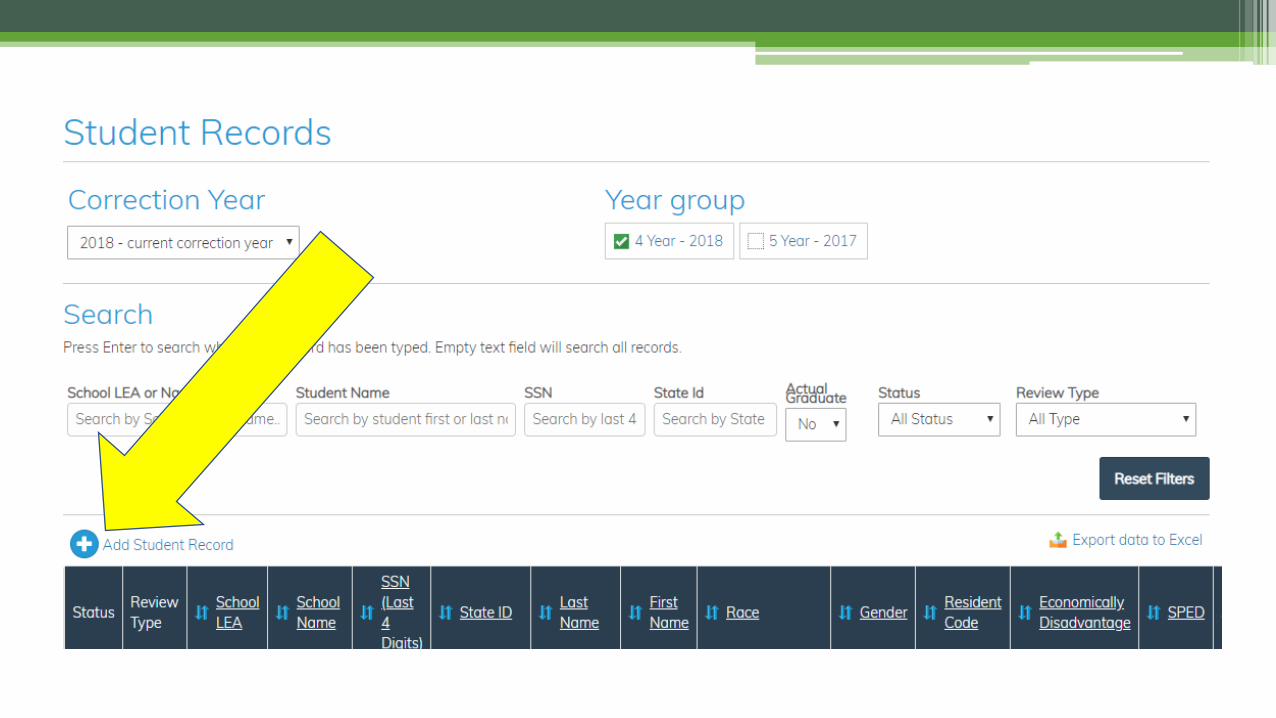
Graduation Rate Corrections

Guidance from the U.S. Department of EducationAdjusted Cohort Graduation Rate (ACGR) is defined by USDE in official guidance to ensure comparability across states. • https://www2.ed.gov/policy/elsec/leg/essa/essagradrateguidance.pdf
• ESSA Graduation Rate Guidance B3 - What is the definition of a “transfer”?▫ A State may not count as a transfer a student who is retained in grade, enrolls in a general
equivalency diploma program, is transferred to a prison or juvenile facility that does not provide (or from which the student is not expected to receive) a regular high school diploma or a State defined alternate diploma that meets the requirements described in question A-16, or leaves high school for any other reason in the four-year or extended-year graduation rate; such students must remain in the adjusted cohort (i.e., must be included in the denominator of the graduation rate for that cohort). (ESEA section 8101(23)(C) and (25)(C); 34 C.F.R. § 200.34(b)(2)-(3)).
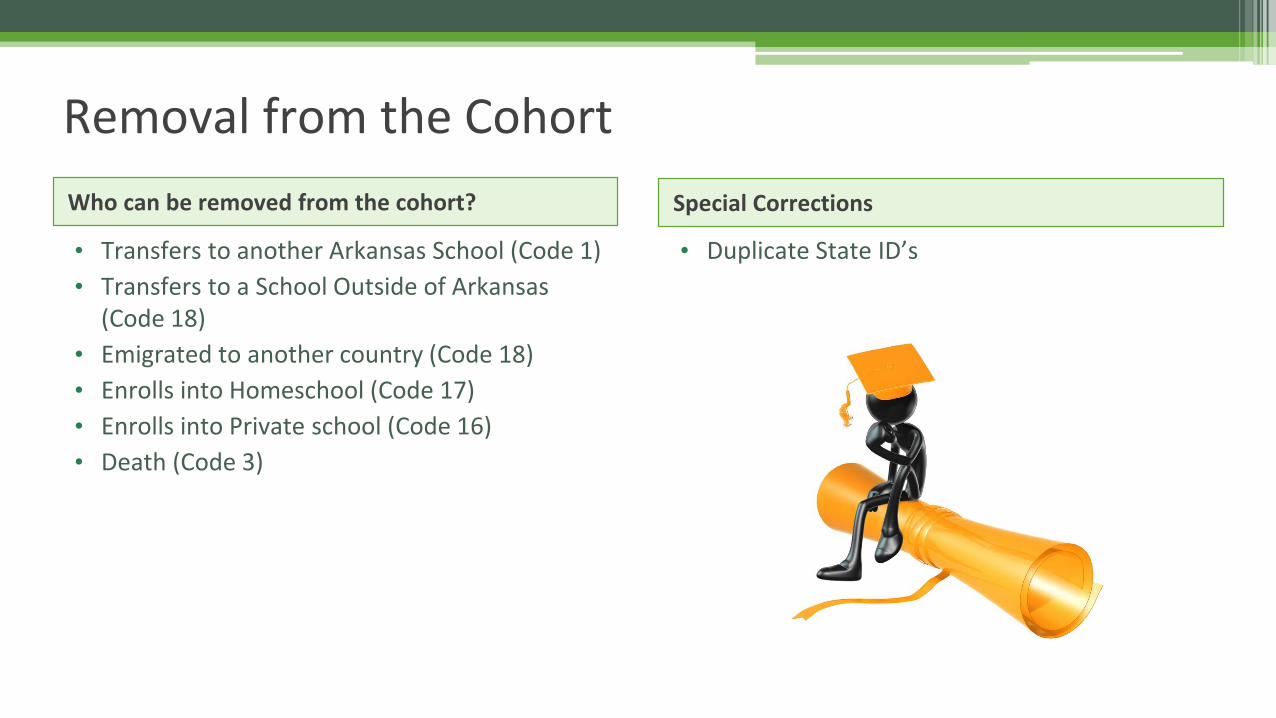
Removal from the CohortWho can be removed from the cohort?
• Transfers to another Arkansas School (Code 1)• Transfers to a School Outside of Arkansas
(Code 18)• Emigrated to another country (Code 18)• Enrolls into Homeschool (Code 17)• Enrolls into Private school (Code 16)• Death (Code 3)
Special Corrections
• Duplicate State ID’s
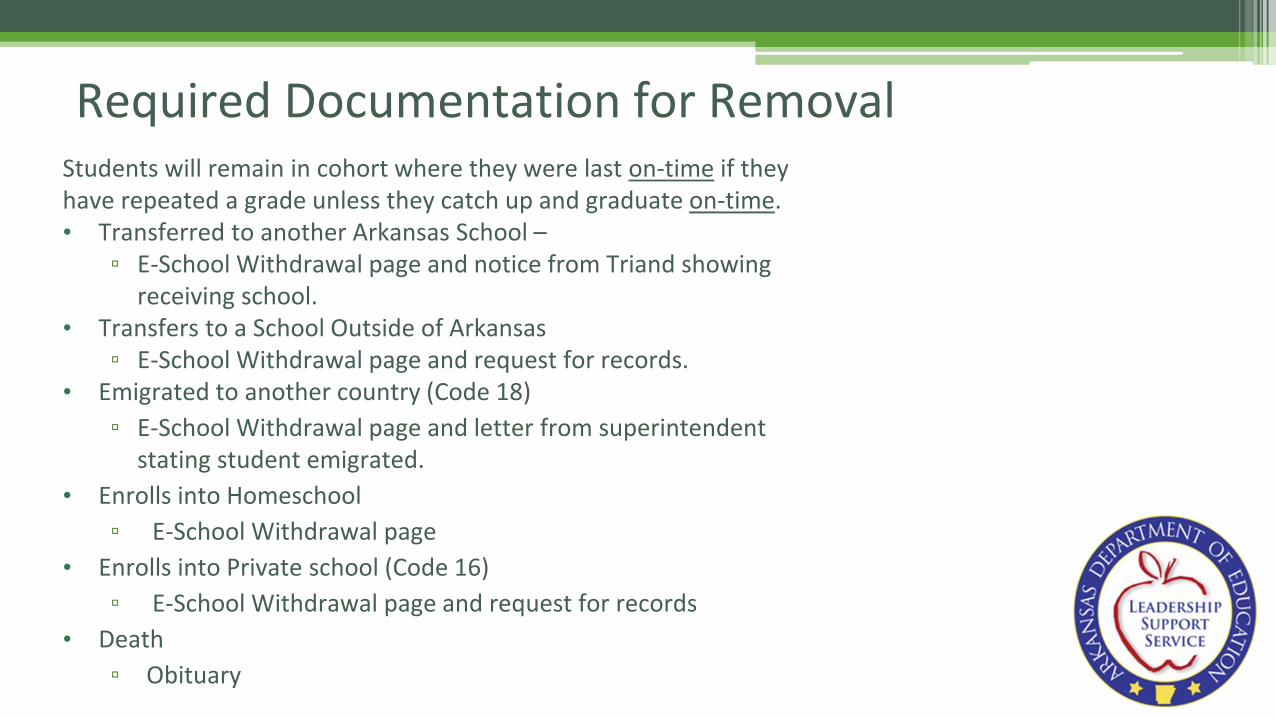
Required Documentation for RemovalStudents will remain in cohort where they were last on-time if they have repeated a grade unless they catch up and graduate on-time.• Transferred to another Arkansas School –
▫ E-School Withdrawal page and notice from Triand showing receiving school.
• Transfers to a School Outside of Arkansas▫ E-School Withdrawal page and request for records.
• Emigrated to another country (Code 18)▫ E-School Withdrawal page and letter from superintendent
stating student emigrated.• Enrolls into Homeschool
▫ E-School Withdrawal page• Enrolls into Private school (Code 16)
▫ E-School Withdrawal page and request for records• Death
▫ Obituary
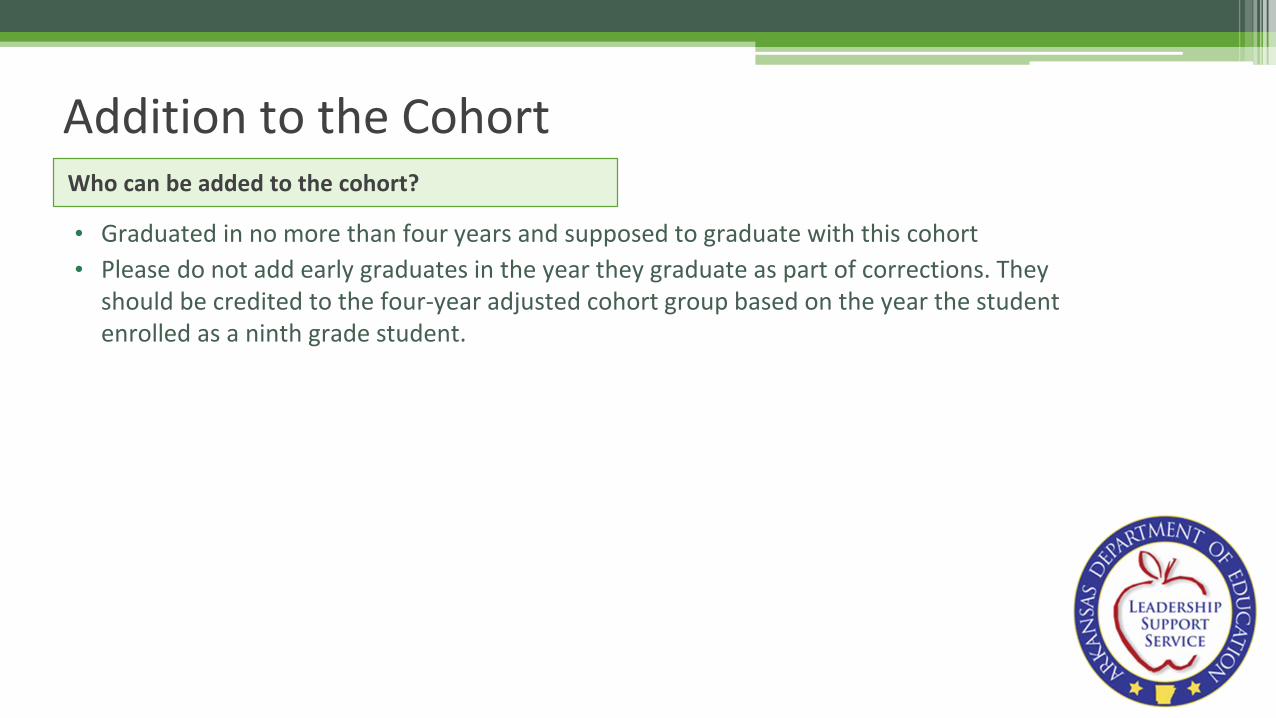
Addition to the CohortWho can be added to the cohort?
• Graduated in no more than four years and supposed to graduate with this cohort• Please do not add early graduates in the year they graduate as part of corrections. They
should be credited to the four-year adjusted cohort group based on the year the student enrolled as a ninth grade student.

Graduation Corrections


School Quality and Student SuccessIndicator 5

Student Engagement: Student Risk Due to Chronic Absence• Number of Students Enrolled (Cycle 7 Certified Submission) Grades K-11
• Days Absent and Days Present for Enrolled Students (Cycles 3, 5, 6, 7)
• Risk is (total present days) / (total present days + total absent days).
• Number of Points Possible for Student Engagement (Number enrolled)• Mobile students are included. • Students who were enrolled for a minimum of 10 days.• If a student was enrolled in multiple schools during the school year, the
student would be included in each school.• For juvenile justice school (DYS) and department of health services
schools, students must have been enrolled for a minimum of 60 days.
• Number of Points Earned Per Student for Engagement (sum of points for risk level of students)
• Exclude home schooled or private school students receiving services or enrolled in courses (Resident Code = 1, 2, 4 and 5) if student state ID and LEA are accurate for match to enrollment data downloaded from TRIAND.
Risk Level Description Points Earned per Student
Low Risk Absent less than 5% of
days enrolled
1.0
Moderate Risk
Absent 5% to less than 10%
of days enrolled
0.5
High Risk = Chronic Absence
Absent 10% or more of days
enrolled
0.0

Reading Achievement: Students Reading at Grade Level
Achievement Levels
Description Points Earned per
Student
On or Above Grade Level for Reading
ACT Aspire: Ready or Exceeds
1.0
Not at Grade Level for Reading
ACT Aspire: Close or In Need of Support
0.0
• Students tested in reading on required statewide ACT Aspire (Grades 3-10)
• Student full academic year status (not highly mobile)• Number of Points Possible for Reading at Grade Level
▫ number of full academic year students tested in reading
• Number of Points Earned Per Student for Reading at Grade Level▫ sum of points for students scoring at Ready or
Exceeds achievement levels • Note: DLM does not provide a separate score or
achievement level for reading and thus, students completing alternate assessment for ELA cannot be included in this component at this time.

Science Achievement : Students Achieving Readiness in Science
• Students Tested in Science on required statewide ACT Aspire or Alternate Assessment (Grades 3-10)
• Student full academic year status (not highly mobile)
• Number of Points Possible for Science at Grade Level ▫ number of full academic year students
tested in science• Number of Points Earned Per Student for
Science Readiness ▫ sum of points for students scoring at Ready or
Exceeds achievement levels and At Target or Advanced on the Alternate Assessment
Achievement Levels
DescriptionPoints
Earned per Student
On or Above Grade Level for Science
ACT Aspire: Ready or ExceedsDLM Science Levels:
At Targetor Advanced
1.0
Not at Grade Level for Science
ACT Aspire Close or In Need of Support
DLM Science Levels: Emerging or Approaching Target
0.0

Science Growth: Students Meeting or Exceeding Expected Growth in Science Achievement
• Students’ science value-added scores from all schools having science growth in a grade level are ordered within the grade level from lowest to highest.
• Students Tested in Science on required statewide ACT Aspire
• Growth scores for students in Grades 4 – 10• Student full academic year status (not highly mobile)• Number of Points Possible
• number of full academic year students with science growth scores
• Number of Points Earned Per Student for Science Growth
• sum of points for students’ value-added science growth scores
Quartile DescriptionPoints Earned
per Student
Growth in Top
Quartile
Science Value-Added Score at/above 75th percentile of growth of students in same
grade
1.0
Growth in Middle
Quartiles
Science Value-Added Score At/Above 25th percentile to less than 75th percentile of growth of
students in same grade
0.5
Growth in Bottom Quartile
Science Value-added score is below the 25th percentile of growth of students in same
grade
0.0

On-time Credits: Students in Grades 9 – 11 Earning at Least 5.5 Credits each Year
• Number of active students enrolled in School (Cycle 7 Certified Submission)
• Student Course Completion (Cycle 7 Certified Submission)
• Grade Level• Student Full Academic Year status• Number of Points Possible for On-Time Credits
• Number of full academic year students enrolled in grades 9, 10, and/or 11
• Number of Points Earned Per Student On-Time Credits
• Sum of points for students enrolled in grades 9, 10, and/or 11 at school
Credit Earning Points Earned
per Student
Grade 9 completed ≥ 5.5 creditGrade 10 completed ≥ 11.0 creditsGrade 11 completed ≥ 16.5 credits
1.0
Fewer credits earned than those listed above
0.0

ACT Composite: Students Earning at Least 19 as Their Best ACT Score Anytime in High School
• Number of active Grade 12 Students Enrolled in School (Cycle 7 Certified Submission)
• ACT Scores for 3 years from national and state administrations
• Full Academic Year Status• Number of Points Possible for ACT Composite
• Number of Grade 12 full academic year students • Number of Points Earned for ACT Composite
• Sum of points Grade 12 students with ACTs• ASMSA students’ scores are counted at the high
school listed as resident high school by ASMSA.
Achievement Levels Points Earned per Student
Best ACT Composite Score at/above 19
1.0
Best ACT Composite Score below 19
0.0

ACT College Readiness Benchmark: Students Earning ACT Scores that Indicate Readiness for College Coursework
• Number of active Grade 12 Students Enrolled in School (Cycle 7 Certified Submission)
• Find best composite ACT Score for each student from 3 years of national and state administrations. Use Reading, Math and Science scores from best composite.
• Full Academic Year Status• Number of Points Possible for ACT Readiness
• Number of full academic year Grade 12 students• Number of Points Earned for ACT Readiness Benchmarks
• sum of points Grade 12 students with ACTs• ASMSA students’ scores are counted at the high school
listed as resident high school by ASMSA.
Achievement Levels
Points Earned per Student
ACT Reading Score ≥ 22
0.5
ACT Math Score ≥ 22
0.5
ACT Science Score ≥ 23
0.5

State Cumulative GPA: Students Earning a GPA of 2.8 or Higher by the End of Grade 12
• Number of active Grade 12 Students Enrolled in School (Cycle 7 Certified Submission)
• Final High School GPA submitted for Grade 12 students in Cycle 7 Certified Submission
• Full Academic Year Status• Number of Points Possible for High School
GPA • Number of full academic year Grade 12
students enrolled• Number of Points Earned for High School GPA
• Sum of points Grade 12 students
Achievement Levels
Points Earned per Student
High School GPA ≥ 2.8
1.0
High School GPA < 2.8
0.0
The Course Code Lists Have Been Updated
Appendix B has updated course code lists for Advanced Placement, International Baccalaureate Courses, Concurrent Credit Courses, and Computer Science.

Advanced Placement/International Baccalaureate/Concurrent Credit: Students Completing Credits in Courses With Post-High School Rigor
• Number of active Grade 12 Students Enrolled in School (Cycle 7 Certified Submission)
• Course Credits Earned for each high school year for Grade 12 class
• Number of Points Possible for AP/IB/Concurrent Credit
• Number of full academic year Grade 12 students enrolled
• Number of Points Earned for AP/IB/Concurrent Credit
• Sum of points Grade 12 students
Achievement Levels Points Earned
per Student
Completing 1 or more credits in grades 9 – 12
1.0
No credits earned in grades 9 - 12
0.0
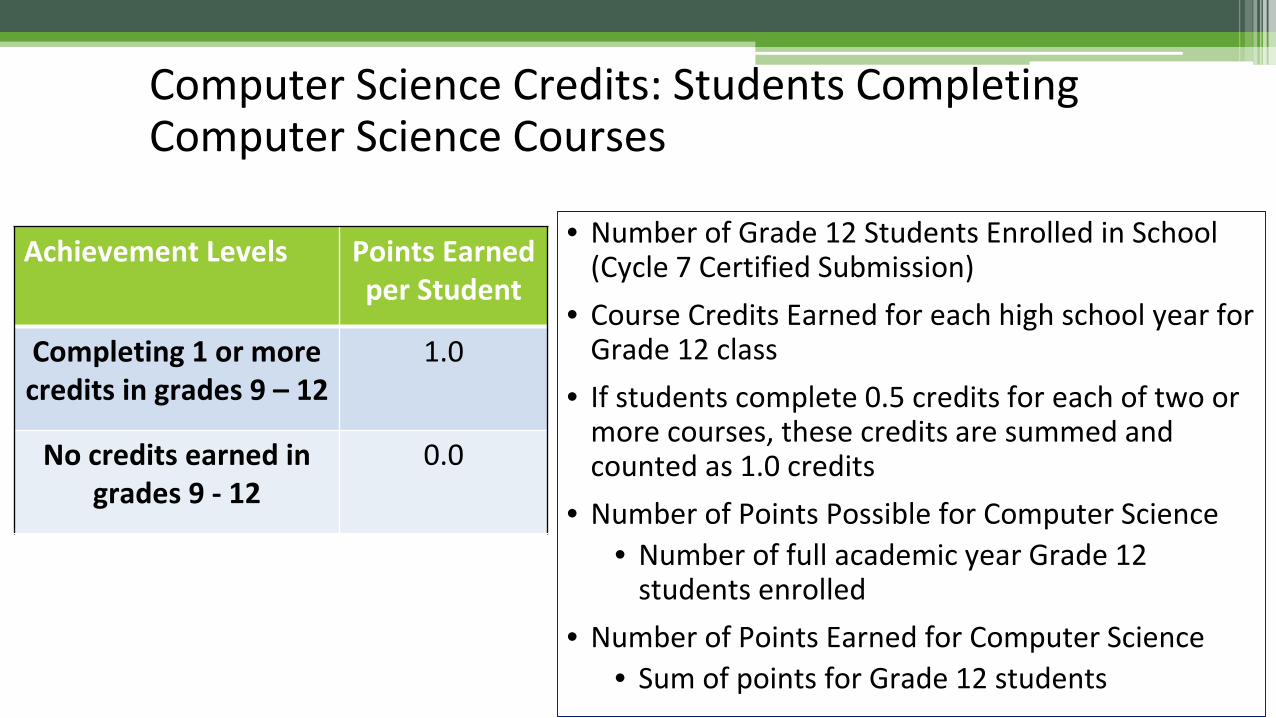
Computer Science Credits: Students CompletingComputer Science Courses
• Number of Grade 12 Students Enrolled in School (Cycle 7 Certified Submission)
• Course Credits Earned for each high school year for Grade 12 class
• If students complete 0.5 credits for each of two or more courses, these credits are summed and counted as 1.0 credits
• Number of Points Possible for Computer Science • Number of full academic year Grade 12
students enrolled• Number of Points Earned for Computer Science
• Sum of points for Grade 12 students
Achievement Levels Points Earned per Student
Completing 1 or more credits in grades 9 – 12
1.0
No credits earned in grades 9 - 12
0.0
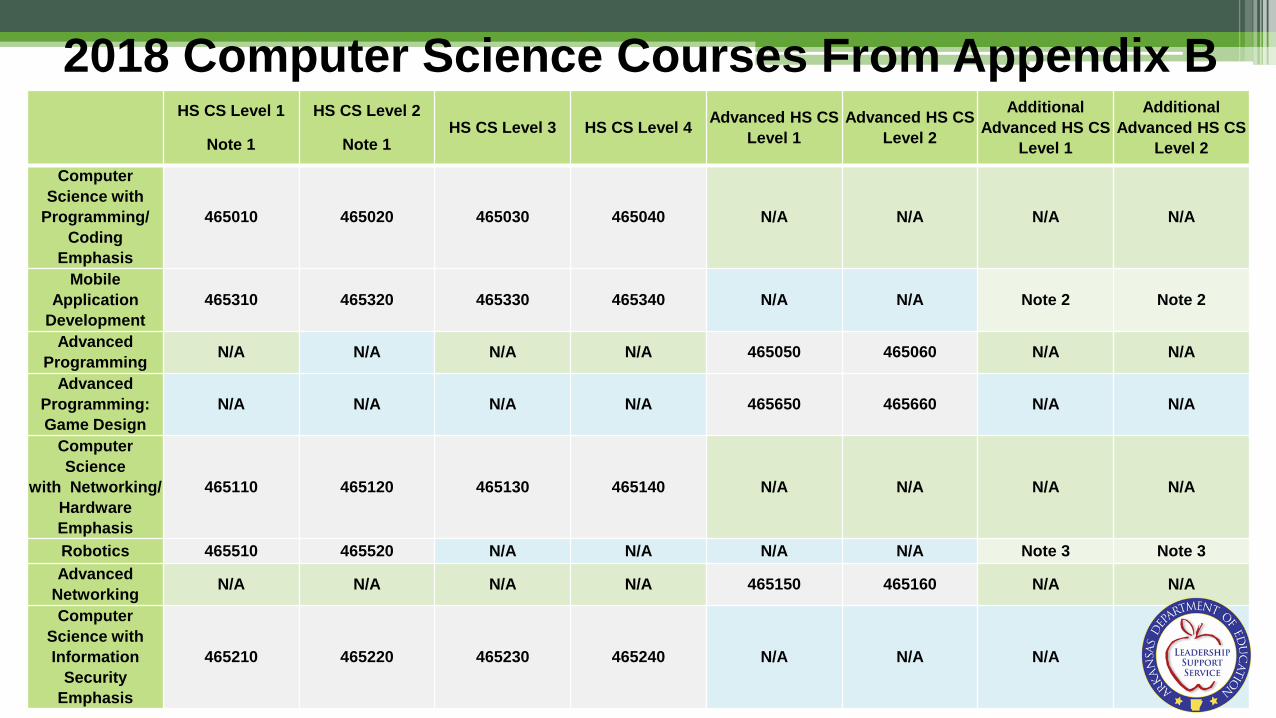
2018 Computer Science Courses From Appendix BHS CS Level 1
Note 1
HS CS Level 2
Note 1HS CS Level 3 HS CS Level 4 Advanced HS CS
Level 1Advanced HS CS
Level 2
Additional Advanced HS CS
Level 1
Additional Advanced HS CS
Level 2Computer
Science with Programming/
Coding Emphasis
465010 465020 465030 465040 N/A N/A N/A N/A
Mobile Application
Development465310 465320 465330 465340 N/A N/A Note 2 Note 2
Advanced Programming N/A N/A N/A N/A 465050 465060 N/A N/A
Advanced Programming: Game Design
N/A N/A N/A N/A 465650 465660 N/A N/A
Computer Science
with Networking/ Hardware Emphasis
465110 465120 465130 465140 N/A N/A N/A N/A
Robotics 465510 465520 N/A N/A N/A N/A Note 3 Note 3Advanced
Networking N/A N/A N/A N/A 465150 465160 N/A N/A
Computer Science with Information
Security Emphasis
465210 465220 465230 465240 N/A N/A N/A N/A

Students Completing 75 Certified Hours of Community Service in an Approved Community Service Learning Program
• Number of active Grade 12 Students Enrolled in School (Cycle 7 Certified Submission)
• Course Credits Earned for each high school year for Grade 12 class• Course Code 496010 is used.• See Commissioner’s Memo for details:
http://adecm.arkansas.gov/ViewApprovedMemo.aspx?Id=3575• Number of Points Possible for Community Service
• Number of Grade 12 students enrolled• Number of Points Earned for Community Service
• Sum of points Grade 12 students
Achievement Levels Points Earned per
StudentCompleting 1 or more
credits in grades 9 – 121.0
No credits earned in grades 9 - 12
0.0

Components Are Aggregated into a School Quality and Student Success Score
• Calculate possible points and earned points for each component for each student. • Students may have different components due to different grade levels so the points
possible provides a way to make the denominator comparable statewide within grade spans.
• Calculate SQSS points for each student and at the school level : • the total possible points of SQSS are the sum of the possible points of all components, and • the total earned points of SQSS are the sum of the earned points of all components.
• Calculate percentage SQSS score at the school level: the percentage score is equal to (total earned points / total possible points)*100.
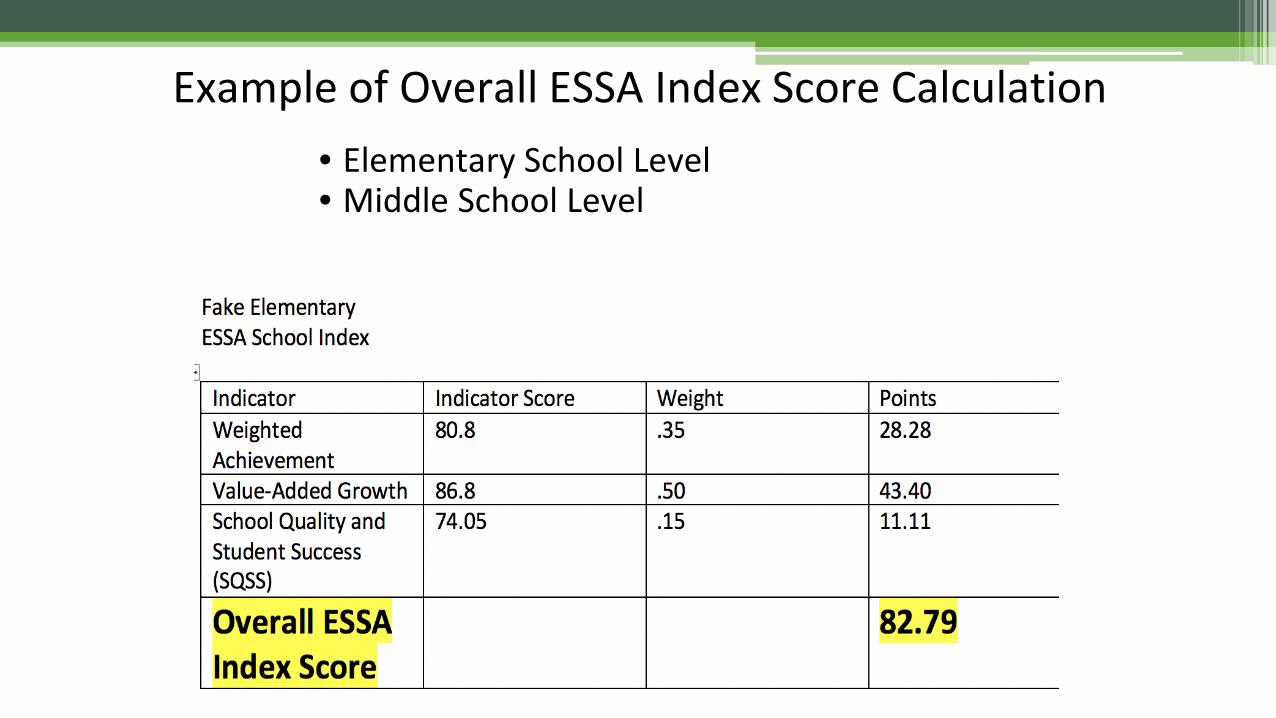
Example of Overall ESSA Index Score Calculation • Elementary School Level• Middle School Level

Example of Overall ESSA Index Score Calculation • High School Level


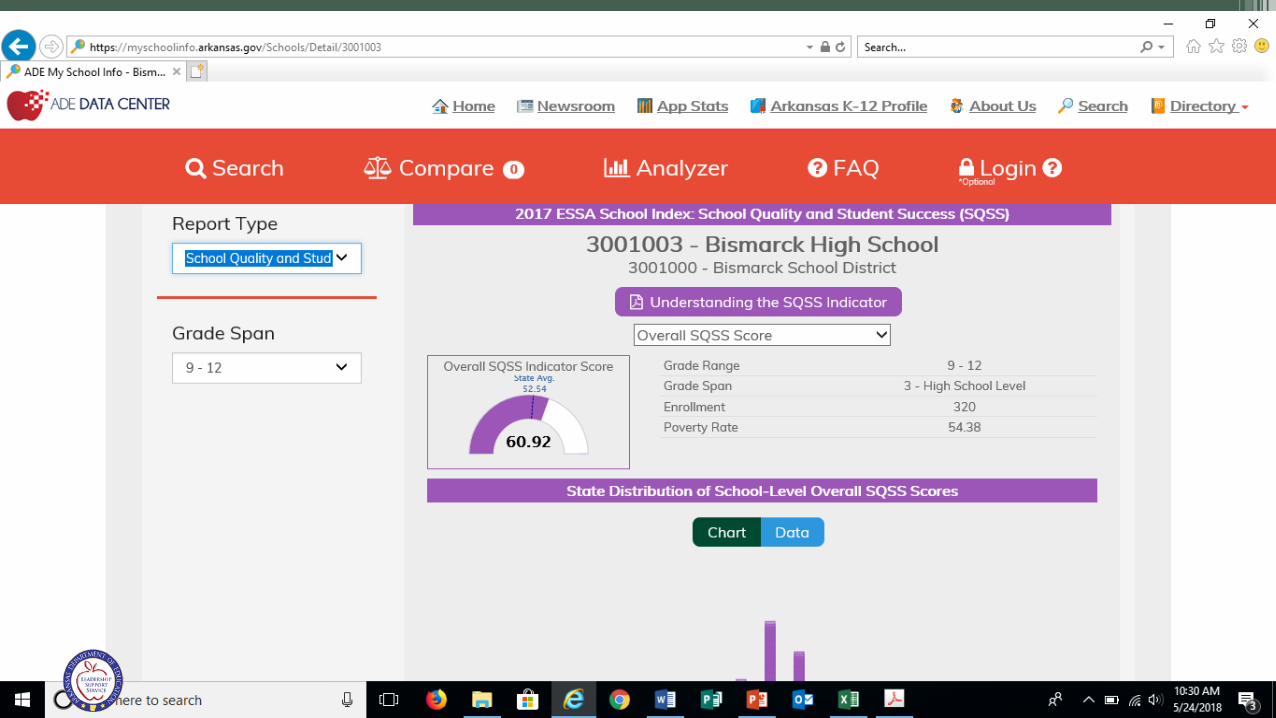
My School Info - Search


CONTACTS -
Arkansas Department of Education - Public School Accountability
74
Alexandra Boyd, [email protected]
School Performance,Public School Accountability
Coordinator of Evaluation and School Performance
501-683-1024
Louis [email protected]
School Performance, Public School Accountability
Director of Data Quality501-682-4208
Kevin [email protected]
School Performance, Public School Accountability
Systems Analyst 501-682-0689
Fred [email protected]
School Performance,Public School Accountability
Administrative Analyst (501) 682-7339
Dr. Mitzi [email protected]
School Performance,Public School Accountability
Special Projects Advisor501-683-0785
Renee Austin-Banks Renee.Austin-
[email protected] Performance,
Public School AccountabilityPublic School Program Advisor
501-682-7380