2019 annual report - .net framework
TRANSCRIPT

2019ANNUAL REPORT

“We’re proud of our storied Canadian heritage, our strong market position, the positive impacts we make in the communities in which we live and work, our fi rst-rate safety culture, and we’re proud to profi tably and sustainably build some of this generation’s most impactful projects.”
Cover: Eglinton Crosstown Light Rail Transit ProjectToronto, ON
This Page: Aecon-Six Nations Watermain Extension ProjectSix Nations of the Grand River, ON

1 2019 Annual Report
Dear Fellow Shareholders, This past year Aecon continued our drive forward to be the #1 Canadian Infrastructure Company. Aecon’s financial success in 2019 demonstrates this momentum, underscored by continued growth and margin improvement across our diversified portfolio of projects. We were pleased to see revenue of $3.5 billion and Adjusted EBITDA of $222 million reach record levels, while maintaining near-record backlog of $6.8 billion at year-end. With Aecon’s Board of Directors approving an increase in the quarterly dividend to 16 cents per share from 14.5 cents per share previously – the eighth increase in the past nine years – there are many reasons we can all be Aecon Proud. Aecon’s achievements in 2019 were underpinned by our focus on strong execution and being the Preferred Contractor for our clients across our key markets, as well as the First-Choice Employer in our industry. We’re proud of our storied Canadian heritage, our strong market position, the positive impacts we make in the communities in which we live and work, our first-rate safety culture, and we’re proud to profitably and sustainably build some of this generation’s most impactful projects. Aecon’s projects are well-balanced by sector, geography, size, and duration illustrating the soundness of our strategy that continued with key new contract awards in 2019. Subsequent to quarter-end, we announced the acquisition of Voltage Power, an electrical transmission and substation contractor headquartered in Winnipeg, Manitoba for a base purchase price of $30 million. This acquisition brings key medium to high-voltage power transmission and distribution capabilities to Aecon. Voltage Power is the third strategic, tuck-in acquisition Aecon has made over the past 18 months, extending our integrated, self-perform capabilities to our core clients and in our diverse end markets. Additionally, subsequent to year-end, Aecon was pleased to be awarded the Pattullo Bridge Replacement project in British Columbia, further diversifying Aecon’s balanced project portfolio, while maintaining our strong backlog position. In 2019, we adopted the Aecon Forward 2022 Strategic Plan, highlighted by four key focus areas:
! Taking care of Aecon’s people; ! Improving project efficiency and maximizing profitability; ! Balancing agility and process; and ! Investing in tomorrow’s growth.
These key focus areas are centred around the goal of creating a framework that motivates a culture of innovation, operational excellence and risk management to achieve best-in-class operating margins, prudent and balanced growth, and discipline in the allocation of capital – all with the collective effort of our devoted employees focused on delivering superior shareholder value.
Thank you for your continued support, or as we like to say – thank you for joining us in being #AeconProud. Sincerely,
John M. Beck Jean-Louis Servranckx Chairman President and Chief Executive Officer

Aecon Group Inc.
Management’s Discussion and Analysis of Operating Results and Financial Condition
December 31, 2019
2019 Annual Report2

Management’s Discussion and Analysis of Operating Results and Financial Condition (“MD&A”) The following discussion and analysis of the consolidated results of operations and financial condition of Aecon Group Inc. (“Aecon” or the “Company”) should be read in conjunction with the Company’s December 31, 2019 consolidated financial statements and notes. This MD&A has been prepared as at March 3, 2020. Additional information on Aecon is available through the System for Electronic Document Analysis and Retrieval (“SEDAR”) at www.sedar.com and includes the Company’s Annual Information Form and other securities and continuous disclosure filings. Introduction Commencing in 2019, Aecon’s Infrastructure and Industrial segments were combined into a Construction segment to align with Aecon’s new operating management structure. The progress Aecon has made in recent years with respect to the “One Aecon” strategy has increasingly allowed for integrated project management and systems, allowing Aecon to capitalize on those markets providing the greatest opportunity at any point in time. This trend is expected to continue going forward, seeing Aecon’s services and resources becoming increasingly mobile between end markets. Aecon has migrated its overall management and operating structure to reflect this increasingly flexible model. Prior year comparative figures have been restated to conform to the presentation adopted in the current year. Aecon currently operates in two principal segments within the infrastructure development industry: Construction and Concessions. The Construction segment includes all aspects of the construction of both public and private infrastructure, primarily in Canada, and on a selected basis, internationally and focuses primarily on the following market sectors: Civil Infrastructure; Urban Transportation Systems; Nuclear Power Infrastructure; Utility Infrastructure; and Conventional Industrial Infrastructure.
Activities within the Concessions segment include the development, financing, build and operation of construction projects by way of public-private partnership contract structures, as well as integrating the services of all project participants, and harnessing the strengths and capabilities of Aecon. The Concessions segment focuses primarily on providing the following services: Development of domestic and international Public-Private Partnership (“P3”) projects; Private finance solutions; Developing effective strategic partnerships; Leading and/or actively participating in development teams; and Operations and maintenance.
The infrastructure development industry in Canada is seasonal in nature for companies like Aecon that perform a significant portion of their work outdoors, particularly road construction and utilities work. As a result, less work is performed in the winter and early spring months than in the summer and fall months. Accordingly, Aecon has historically experienced a seasonal pattern in its operating results, with the first half of the year, and
Aecon Group Inc. 3
particularly the first quarter, typically generating lower revenue and profit than the second half of the year. Therefore, results in any one quarter are not necessarily indicative of results in any other quarter, or for the year as a whole. FORWARD-LOOKING INFORMATION The information in this Management’s Discussion and Analysis includes certain forward-looking statements. Although these forward-looking statements are based on currently available competitive, financial and economic data and operating plans, they are subject to risks and uncertainties. In addition to events beyond Aecon’s control, there are factors which could cause actual or future results, performance or achievements to differ materially from those expressed or inferred herein including risks associated with an investment in the common shares of Aecon and the risks related to Aecon's business, including, but not limited to, the timing of projects, unanticipated costs and expenses, general market and industry conditions, climate change and operational and reputational risks, including Large Project Risk and Contractual Factors. Risk factors are discussed in greater detail in the section on “Risk Factors” later in this MD&A. Forward-looking statements may include, without limitation, statements regarding the operations, business, financial condition, expected financial results, performance, prospects, ongoing objectives, strategies and outlook for Aecon. Forward-looking statements may in some cases be identified by words such as “will”, “plans”, “believes”, “expects”, “anticipates”, “estimates”, “projects”, “intends”, “should” or the negative of these terms, or similar expressions. Other important factors, in addition to those discussed in this document, could affect the future results of Aecon and could cause its results to differ materially from those expressed in any forward-looking statements. Except as required by applicable securities laws, forward-looking statements speak only as of the date on which they are made and Aecon undertakes no obligation to publicly update or revise any forward-looking statements, whether as a result of new information, future events or otherwise.
FINANCIAL REPORTING STANDARDS The Company prepares its consolidated financial statements in accordance with International Financial Reporting Standards (“IFRS”). NON-GAAP AND ADDITIONAL GAAP FINANCIAL MEASURES The MD&A presents certain non-GAAP and additional GAAP (GAAP refers to Canadian Generally Accepted Accounting Principles) financial measures to assist readers in understanding the Company’s performance. These non-GAAP measures do not have any standardized meaning and therefore are unlikely to be comparable to similar measures presented by other issuers and should not be considered in isolation or as a substitute for measures of performance prepared in accordance with GAAP. Management uses these non-GAAP and additional GAAP measures to analyze and evaluate operating performance. Aecon also believes the non-GAAP and additional GAAP financial measures below are commonly used by the investment community for valuation purposes, and are useful complementary measures of profitability, and provide metrics useful in the construction industry. The most directly comparable measures calculated in accordance with GAAP are profit (loss) attributable to shareholders or earnings (loss) per share.
2019 Annual Report4

Throughout this MD&A, the following terms are used, which are not found in the Chartered Professional Accountants of Canada Handbook and do not have a standardized meaning under GAAP. Non-GAAP Financial Measures Non-GAAP financial measures are measures that either exclude or include amounts that are not excluded or included in the most directly comparable measures calculated and presented in accordance with GAAP in the consolidated financial statements. “Adjusted EBITDA” represents operating profit (loss) adjusted to exclude depreciation and amortization,
the gain (loss) on sale of assets and investments, and net income (loss) from projects accounted for using the equity method, but including “Equity Project EBITDA” from projects accounted for using the equity method.
“Equity Project EBITDA” represents Aecon’s proportionate share of the earnings or losses from projects accounted for using the equity method before depreciation and amortization, net financing expense and income taxes.
“Adjusted EBITDA margin” represents Adjusted EBITDA as a percentage of revenue.
“Backlog” means the total value of work that has not yet been completed that: (a) has a high certainty of being performed as a result of the existence of an executed contract or work order specifying job scope, value and timing; or (b) has been awarded to Aecon, as evidenced by an executed binding letter of intent or agreement, describing the general job scope, value and timing of such work, and where the finalization of a formal contract in respect of such work is reasonably assured. Operations and maintenance (“O&M”) activities are provided under contracts that can cover a period of up to 30 years. In order to provide information that is comparable to the backlog of other categories of activity, Aecon limits backlog for O&M activities to the earlier of the contract term and the next five years.
Additional GAAP Financial Measures Additional GAAP financial measures are presented on the face of the Company’s consolidated statements of income and are not meant to be a substitute for other subtotals or totals presented in accordance with IFRS, but rather should be evaluated in conjunction with such IFRS measures. “Gross profit” represents revenue less direct costs and expenses. Not included in the calculation of gross
profit are marketing, general and administrative expenses (“MG&A”), depreciation and amortization, income or losses from projects accounted for using the equity method, foreign exchange, net financing expense, gain (loss) on sale of assets and investments, income taxes, and non-controlling interests.
“Gross profit margin” represents gross profit as a percentage of revenue.
“Operating profit (loss)” represents the profit (loss) from operations, before net financing expense, income taxes and non-controlling interests.
“Operating margin” represents operating profit (loss) as a percentage of revenue.
Aecon Group Inc. 5

RECENT DEVELOPMENTS Aecon Announces John M. Beck Transition from Executive Chairman to Non-Executive Chairman On January 10, 2020, Aecon announced that John M. Beck, Founder, former Chief Executive Officer and Executive Chairman has transitioned to the role of non-executive Chairman. Jean-Louis Servranckx, President and Chief Executive Officer assumed full executive responsibility. Aecon Acquires Medium to High-Voltage Electrical Transmission Contractor Voltage Power On February 3, 2020, Aecon announced that it has acquired Voltage Power (“Voltage”), an electrical transmission and substation contractor headquartered in Winnipeg, Manitoba. The base purchase price is $30 million in cash, with additional earnout payments possible based on achieving minimum EBITDA targets over the next three years. Previously a private, employee-owned company, Voltage brings key medium to high-voltage power transmission and distribution capabilities to Aecon. With average annual revenue of approximately $60 million over the past three years, Voltage has successfully completed over 20 projects in the past four years with an aggregate value of $200 million spanning Alberta, Saskatchewan, Manitoba, Ontario and Newfoundland. BUSINESS STRATEGY Aecon’s overall strategic goal is to clearly be the number one Canadian infrastructure company that safely, profitably, and sustainably delivers integrated services, products and solutions to meet its clients’ needs. Current Position Aecon has made significant progress over the past ten years, building scale in core markets, achieving diversity and balance in geographic and end-market sectors, and focusing on a strategic path that builds a culture of operating excellence and consistent performance using a “One Aecon” approach in executing large, sophisticated turnkey projects for clients. In recent years, this has been highlighted by the development of a growing portfolio of concession investments tied to major Canadian and international infrastructure projects, the creation of an Urban Transportation Systems team focusing solely on meeting client needs in this rapidly expanding sector, and through divestiture of a number of non-core operations to allow for an increased focus on Aecon’s chosen end-markets. Looking forward, the core of Aecon’s strategy continues to be to differentiate its service offering and execution capability, which will lead to opportunities to secure higher-return projects by increasing the sophistication of the work being performed and limiting the ability of others to match what Aecon delivers to its clients. The progress Aecon has made in recent years with respect to the “One Aecon” strategy has increasingly allowed for the seamless transition of resources, project management, and systems from one sector to another, allowing Aecon to capitalize on those markets providing the greatest opportunity at any point in time. This trend is expected to continue going forward, seeing Aecon’s services and resources becoming increasingly balanced across geographies, contract models, project sizes and end markets. Aecon continues to optimize its overall management and operating structure to reflect this increasingly flexible model.
2019 Annual Report6

Aecon Forward 2022 Strategic Plan In 2019, Aecon adopted the Aecon Forward 2022 Strategic Plan (the “Strategic Plan”) outlining an ambition to clearly be the number one Canadian infrastructure company. The Strategic Plan outlines four key focus areas, and specific priority actions within each area, that Aecon will undertake throughout the organization in pursuit of this ambition. The four key focus areas of the Strategic Plan are as follows: 1) Taking Care of Aecon’s People The Company is committed to the development of its employees to build its leadership position in the industry in Canada and to be the first-choice employer wherever Aecon works. This means ensuring a safe, sustainable, and inclusive work environment for all of Aecon’s people while promoting and living Aecon’s core values with a focus on career development, performance, and accountability. This is especially important as competition in Canada for the best talent can be intense. A company’s ability to demonstrate that it has industry leading safety programs, and a culture that puts safety first, is an important competitive differentiator in the construction industry. For many clients, a contractor’s demonstrated commitment to safety throughout the organization is as important to selecting a contractor as their commitment to schedule, quality and price. This focus on safety is one of the reasons that maintaining and strengthening the Company’s industry-leading safety program and culture is a key element of the Strategic Plan. 2) Improving Project Efficiency and Maximizing Profitability Aecon embraces project complexity and is focused on ensuring a continuous risk management culture, including capturing and formalizing lessons learned across its portfolio of projects. To achieve this, the Company has established centres of excellence focused on the lifecycle of a project, encompassing commercial management, engineering and design management, proactive project planning, and project controls. A key component of Aecon’s strategy is to drive continuous improvement in project efficiency, and therefore profitability, through vertical and horizontal integration. This provides an ability to self-perform services required at virtually every stage of a project and is a competitive advantage for Aecon. Efficiencies are also derived from the depth and breadth of Aecon’s capabilities, allowing it to participate in projects beyond the scope of any one discipline or business unit. Further, leveraging capabilities and ensuring collaboration across diverse businesses allows for synergies and cost savings for both Aecon and its clients through economies of scale, strategic sourcing and procurement, and resource sharing. The Company is committed to being results oriented and maximizing profitability in a responsible and sustainable way. Aecon has set a goal of ongoing margin improvement and has a focus on the bottom line throughout the organization, rather than just top-line growth.
Aecon Group Inc. 7

3) Balancing Agility and Process Aecon is committed to exceptional delivery across projects of all sizes and contract models within its chosen end-market sectors. The diversity of what Aecon does in these sectors allows for significant agility in meeting the needs of clients, an ability to quickly adapt to changing market conditions and opportunities, and a way to train and develop best in class project managers, supervision, and field personnel as they move across a wide range of project types. Maintaining an entrepreneurial attitude and fostering and rewarding innovative thinking to add value for clients provides a competitive advantage for Aecon in the industry. As procurement models emerge, develop and change in both the private and public sectors, it is important to be agile and nimble. From traditional bid-build projects to complex public private partnerships, Aecon has the capability and expertise to compete for and execute projects across a wide range of procurement models. New trends in the Canadian market, such as unsolicited proposals and alliance models, among others, are areas where Aecon can add significant value through its financial capacity, self-perform capability, and entrepreneurial approach. The ability to be innovative and agile in responding to market trends, something that is core to Aecon’s DNA, is complemented by a focus on effectively identifying, mitigating and managing the construction risk inherent in every project the Company undertakes. The ability to deliver those projects in a manner that appropriately protects the safety of employees, stakeholders, and the public are key elements of success in the construction industry. Developing industry leading processes and capabilities in these areas, while remaining agile, is a fundamental part of Aecon’s strategy. 4) Investing in Tomorrow’s Growth Aecon is seeking to leverage its combination of construction and concessions expertise to secure new alternative finance projects with both government and private clients in Canada and internationally. Aecon has historically participated in the design, build, finance, maintenance and operations of Canadian, and a select number of international, infrastructure development opportunities, through both its construction and concession capabilities. Aecon intends to selectively increase the number of these project opportunities going forward and is continuing to build capacity in this area, including a focused international development team to bring Aecon’s capabilities to an increasing number of such opportunities. In Canada, niche, tuck-in acquisitions of specialty businesses to complement self-perform capabilities or geographic coverage continue to provide opportunities to grow in Aecon’s chosen end-markets and this remains part of the strategic focus going forward. In addition, Aecon views the U.S. infrastructure development and construction market as an important longer-term opportunity to continue to diversify the business and provide both growth and earnings stability through long-term economic cycles. As such, Aecon intends to assess opportunities to establish a longer-term presence in the U.S. market over time.
2019 Annual Report8

Strategic Plan Economic Goals The strategy outlined in the four key focus areas is centred around the goal of creating a framework that motivates a culture of innovation, operational excellence, and risk management towards achieving best in class operating margins, prudent and balanced growth, and discipline in the allocation of capital, all ultimately designed to deliver superior shareholder value: Profit: Achieve best-in-class operating margin in the Construction segment relative to Canadian and
international peers; Growth Capacity and Risk Management: Maintain prudent balance sheet leverage and liquidity while
maintaining Aecon’s current balanced and diversified revenue risk profile; Success Sharing: Foster an ownership culture across the Company and a rewarding profit-sharing structure;
and Shareholder Return: Drive improvements in return on equity and consistent dividend increases through
growth in Earnings Per Share. Particular Focus for 2020 – the Company is focused on a number of programs and key initiatives to advance its overall strategy this year, including: 1) ongoing implementation of the Strategic Plan to become clearly the number one Canadian infrastructure
company; 2) recruitment, retention, and engagement of professional staff through enhanced career mobility and
development programs; 3) establishment of a project management academy to further develop a world class project delivery capability
through facilitating the enhancement of skills, experience, and collaboration of the Company’s project management talent;
4) formalization of best practices and lessons learned into a set of “Golden Rules” to align and enforce key processes across all operations;
5) leveraging digital design and construction tools with innovative construction technologies to increase productivity, quality, and risk management while providing an integrated digital delivery for Aecon’s clients on major projects;
6) ISO certification of Aecon’s data and systems governance and protection as part of an ongoing drive to enhance the Company’s cybersecurity program;
7) further investment in environmental, social, and governance initiatives, including publishing Aecon’s inaugural sustainability report in the second quarter of 2020;
8) centralization of strategic sourcing, supply chain management, and procurement to drive cost savings across Aecon’s operations;
9) investment in international business development and ongoing assessment of the U.S. market and related opportunities to diversify Aecon’s geographical presence over time; and
10) building on Aecon’s P3 expertise through targeted strategic concession opportunities in Canada, and on a select basis internationally, in conjunction with the Company’s construction capabilities.
Aecon Group Inc. 9

CONSOLIDATED FINANCIAL HIGHLIGHTS
Three months ended Year ended $ millions (except per share amounts) December 31 December 31 2019 2018 2019 2018
Revenue $ 917.3 $ 948.5 $ 3,460.4 $ 3,266.3 Gross profit 103.9 105.6 367.6 357.1
Marketing, general and administrative expense (52.6) (44.3) (183.4) (178.5)
Income from projects accounted for using the equity method 3.5 6.2 12.5 13.2
Other income 1.3 0.4 4.7 1.5 Depreciation and amortization (24.9) (25.3) (94.1) (103.8) Operating profit 31.1 42.6 107.3 89.4 Financing expense, net (5.8) (6.9) (20.5) (22.4) Profit before income taxes 25.3 35.7 86.8 67.0 Income tax expense (5.1) (7.9) (13.9) (8.0) Profit $ 20.2 $ 27.9 $ 72.9 $ 59.0 Gross profit margin 11.3% 11.1% 10.6% 10.9%
MG&A as a percent of revenue 5.7% 4.7% 5.3% 5.5%
Adjusted EBITDA 61.7 72.4 221.9 207.0
Adjusted EBITDA margin 6.7% 7.6% 6.4% 6.3%
Operating margin 3.4% 4.5% 3.1% 2.7%
Earnings per share - basic $ 0.33 $ 0.46 $ 1.20 $ 0.99 Earnings per share - diluted $ 0.31 $ 0.41 $ 1.12 $ 0.94 Backlog $ 6,790 $ 6,821
Revenue for the year ended December 31, 2019 of $3,460 million was $194 million, or 6%, higher compared to 2018. This revenue increase occurred in the Construction segment ($206 million) driven by higher revenue in civil operations and urban transportation systems ($426 million) and nuclear operations ($144 million). These increases were partially offset by lower revenue in utilities ($110 million) and conventional industrial operations ($254 million). The decline in revenue in conventional industrial operations was primarily caused by the sale of Aecon’s contract mining business in November 2018. Revenue was lower in the Concessions segment ($5 million) and inter-segment revenue eliminations increased by $7 million primarily due to revenue between the Concessions and Construction segments related to the Bermuda International Airport Redevelopment Project. Operating profit of $107.3 million for the year ended December 31, 2019 increased by $17.9 million compared to operating profit of $89.4 million in 2018. The largest driver of this increase was higher gross profit of $10.5 million. In the Construction segment, gross profit was negatively impacted year-over-year by the sale of contract mining in November 2018 which reported gross profit of $27.3 million in 2018. In the balance of the Construction segment, gross profit increased by $41.7 million primarily from increased volume and gross profit margin in civil operations and urban transportation systems. In the Concessions segment, gross profit decreased by $4.9 million, primarily due to lower management and development fees for Canadian concessions compared to 2018.
2019 Annual Report10

Marketing, general and administrative expense (“MG&A”) increased in 2019 by $4.9 million compared to 2018. This increase was the result of a charge of $7.0 million recorded in the fourth quarter of 2019 in connection with the transition of John M. Beck from Executive Chairman to the role of non-executive Chairman. Partially offsetting this increase was the impact of expenses incurred in 2018 as a result of the subsequently discontinued sale process and proposed arrangement with CCCC International Holdings Limited ($4.1 million). MG&A as a percentage of revenue decreased from 5.5% in 2018 to 5.3% in 2019, which reflects the impact of higher revenue in 2019.
Aecon’s participation in projects that are classified for accounting purposes as a joint venture or an associate, as opposed to a joint operation, are accounted for using the equity method of accounting. Aecon reported income of $12.5 million in 2019 from projects accounted for using this method of accounting, compared to $13.2 million in 2018. The lower income in 2019 was driven by a decrease in the Construction segment ($1.4 million) primarily from its asphalt cement joint venture ($1.1 million). This decrease was partially offset by higher income in the Concessions segment in 2019 from light rail transit (“LRT”) projects in Ontario ($0.7 million). Depreciation and amortization expense of $94.1 million in 2019 was $9.7 million lower than 2018, driven by the Construction segment ($13.8 million) due to the sale of the contract mining business in November 2018. In the Concessions segment, higher amortization expense in 2019 of $3.1 million was related to the Bermuda International Airport Redevelopment Project. Corporate depreciation and amortization expense included in “Other & Eliminations” was also higher in 2019 by $1.0 million compared to 2018. The sale of Aecon’s contract mining business in November 2018 and the one-time charge related to executive transition impacted Aecon’s operating results for 2019 when compared to 2018. A summary of these impacts is included below:
$ millions Three months ended
December 31Twelve months ended
December 31 2019 2018 Change 2019 2018 Change
Revenue as reported $ 917.3 948.5 (31.2) 3,460.4 3,266.3 194.1 Exclude: Contract Mining revenue - 41.1 (41.1) - 208.5 (208.5)
Revenue excluding Contract Mining $ 917.3 907.4 9.9 3,460.4 3,057.8 402.6
Adjusted EBITDA as reported $ 61.7 72.4 (10.7) 221.9 207.0 14.9 Exclude: Contract Mining Adjusted EBITDA - 5.0 (5.0) - 21.3 (21.3) Exclude: One-time executive transition charge (7.0) - (7.0) (7.0) - (7.0) Adjusted EBITDA excluding Contract Mining and one-time executive transition charge $ 68.7 67.4 1.3 228.9 185.7 43.2
Operating profit as reported $ 31.1 42.6 (11.5) 107.3 89.4 17.9 Exclude: Contract Mining operating loss - (3.0) 3.0 - (10.9) 10.9 Exclude: One-time executive transition charge (7.0) - (7.0) (7.0) - (7.0) Operating profit excluding Contract Mining and one-time executive transition charge $ 38.1 45.6 (7.5) 114.3 100.3 14.0
Adjusted EBITDA margin as reported 6.7% 7.6% (0.9)% 6.4% 6.3% 0.1% Adjusted EBITDA margin excluding Contract Mining and one-time executive transition charge 7.5% 7.4% 0.1% 6.6% 6.1% 0.5%
Operating profit margin as reported 3.4% 4.5% (1.1)% 3.1% 2.7% 0.4% Operating profit margin excluding Contract Mining and one-time executive transition charge 4.2% 5.0% (0.8)% 3.3% 3.3% - %
Aecon Group Inc. 11

Financing expenses, net of interest income, of $20.5 million in 2019 were $1.9 million lower than the same period in 2018, primarily from lower borrowings on Aecon’s revolving credit facility during the year and lower interest expense from convertible debentures, partially offset by an increase in interest expense from finance leases. Set out in Note 21 of the December 31, 2019 consolidated financial statements is a reconciliation between the expected income tax for 2019 and 2018 based on statutory income tax rates and the actual income tax expense reported for both these periods. Reported backlog as at December 31, 2019 of $6,790 million compares to backlog of $6,821 million as at December 31, 2018. New contract awards of $3,429 million were booked in 2019 compared to $5,840 million in 2018. Backlog As at $ millions December 31
2019 2018 Construction $ 6,735 $ 6,784 Concessions 55 37 Consolidated $ 6,790 $ 6,821 Estimated backlog duration $ millions As at December 31 2019 2018 Next 12 months $ 2,830 42% $ 2,012 29%
Next 13-24 months 1,550 23% 1,771 26%
Beyond 2,410 35% 3,038 45%
$ 6,790 100% $ 6,821 100%
Aecon does not report as backlog the significant number of contracts and arrangements in hand where the exact amount of work to be performed cannot be reliably quantified or where a minimum number of units at the contract specified price per unit is not guaranteed. Examples include time and material and some cost-plus and unit priced contracts where the extent of services to be provided is undefined or where the number of units cannot be estimated with reasonable certainty. Other examples include the value of construction work managed under construction management advisory contracts, concession agreements, multi-year operating and maintenance service contracts where the value of the work is not specified, supplier of choice arrangements and alliance agreements where the client requests services on an as-needed basis. None of the expected revenue from these types of contracts and arrangements is included in backlog. Therefore, Aecon’s anticipated future work to be performed at any given time is greater than what is reported as backlog. Reported backlog includes the revenue value of backlog that relates to projects that are accounted for using the equity method. The equity method reports a single amount (revenue less expenses) on Aecon’s consolidated statement of income, and as a result the revenue component of backlog for these projects is not included in
2019 Annual Report12

Aecon’s reported revenue. As at December 31, 2019, reported backlog from projects that are accounted for using the equity method was $nil (December 31, 2018 - $nil). Further detail for each segment is included in the discussion below under Reporting Segments. REPORTING SEGMENTS
CONSTRUCTION
Financial Highlights
Three months ended Year ended
$ millions December 31 December 31
2019 2018 2019 2018
Revenue $ 901.6 $ 924.8 $ 3,386.8 $ 3,180.9
Gross profit $ 92.7 $ 88.5 $ 314.8 $ 300.4 Adjusted EBITDA $ 60.5 $ 53.9 $ 185.4 $ 168.3 Operating profit $ 43.5 $ 35.6 $ 126.0 $ 93.0
Gross profit margin 10.3% 9.6% 9.3% 9.4% Adjusted EBITDA margin 6.7% 5.8% 5.5% 5.3% Operating margin 4.8% 3.9% 3.7% 2.9% Backlog $ 6,735 $ 6,784
For the year ended December 31, 2019, revenue in the Construction segment of $3,387 million was $206 million, or 6%, higher than in 2018. Construction segment revenue was higher in civil operations and urban transportation systems by $426 million driven by increases in major projects and transportation operations in both eastern and western Canada. Revenue was also higher from nuclear operations by $144 million related to refurbishment work in Ontario. These increases were partially offset by lower volume in conventional industrial ($254 million) primarily due to a decrease of $209 million following the sale of the contract mining business in November 2018, and utilities operations ($110 million) due to decreased activity on mainline pipeline projects in western Canada.
Operating profit in the Construction segment of $126.0 million in 2019 increased by $33.0 million compared to 2018. Part of the operating profit improvement was due to the sale of contract mining in November 2018, as that business contributed an operating loss of $10.9 million in 2018. An improvement in operating profit from the balance of the Construction segment of $22.1 million in 2019 was primarily due to a combination of higher revenue and improved gross profit margin from civil operations and urban transportation systems. Construction backlog as at December 31, 2019 was $6,735 million, which was $49 million lower than the same time last year. Backlog decreased year-over-year in civil operations and urban transportation systems ($759 million), while backlog was higher in nuclear operations ($197 million), utilities operations ($388 million) and conventional industrial ($125 million). New contract awards in 2019 totalled $3,337 million compared to $5,777 million in 2018. The decrease in new awards in 2019 is due mainly to the number of large project awards in 2018, primarily the Site C Generating Station and Spillways Civil Works, the Réseau express métropolitain Montreal LRT, the Finch West LRT, and the Gordie Howe International Bridge project.
Aecon Group Inc. 13

As discussed in the Consolidated Financial Highlights section, the Construction segment’s anticipated future work to be performed at any given time is greater than what is reported as backlog. CONCESSIONS
Financial Highlights
Three months ended Year ended
$ millions December 31 December 31
2019 2018 2019 2018
Revenue $ 38.5 $ 68.6 $ 218.2 $ 223.4 Gross profit $ 11.3 $ 17.5 $ 52.8 $ 57.7
Income from projects accounted for using the equity method $ 3.1 $ 5.3 $ 10.8 $ 10.1
Adjusted EBITDA $ 19.8 $ 27.5 $ 83.0 $ 79.7 Operating profit $ 6.8 $ 16.6 $ 29.2 $ 38.0 Backlog $ 55 37
Aecon holds a 100% interest in Bermuda Skyport Corporation Limited (“Skyport”), the concessionaire responsible for the Bermuda airport's operations, maintenance and commercial functions, and the entity that will manage and coordinate the overall delivery of the Bermuda International Airport Redevelopment Project over a 30-year concession term. Aecon’s participation in Skyport is consolidated and, as such, is accounted for in the consolidated financial statements by reflecting, line by line, the assets, liabilities, revenue and expenses of Skyport. However, Aecon’s concession participation in the Eglinton Crosstown LRT, Finch West LRT, Gordie Howe International Bridge, and Waterloo LRT projects are joint ventures that are accounted for using the equity method. For the year ended December 31, 2019, revenue in the Concessions segment of $218 million was $5 million lower than in 2018, driven by lower management and development fees recognized in 2019 compared to 2018 ($6 million). Development fees received in 2018 were higher due to the commencement of the Finch West LRT and Gordie Howe International Bridge concessions in 2018. Partially offsetting this decrease was higher revenue from the Bermuda International Airport Redevelopment Project ($1 million). Included in Concessions’ revenue for 2019 was $136 million of construction revenue that was eliminated on consolidation as inter-segment revenue (compared to $134 million in 2018). Operating profit of $29.2 million for the year ended December 31, 2019, decreased by $8.8 million compared to 2018 primarily due to the above noted lower management and development fees for Canadian concessions. In addition, operating profit related to the Bermuda International Airport Redevelopment Project was lower due to higher amortization expense in 2019. Except for “O&M” activities under contract for the next five years and that can be readily quantified, Aecon does not include in its reported backlog expected revenue from concession agreements. As such, while Aecon expects future revenue from its concession assets, no concession backlog, other than from such O&M activities for the next five years, is reported.
2019 Annual Report14

Quarterly Financial Data Set out below is quarterly financial data for the most recent eight quarters: $ millions (except per share amounts)
2019 2018
Quarter 4 Quarter 3 Quarter 2 Quarter 1 Quarter 4 Quarter 3 Quarter 2 Quarter 1
Revenue $ 917.3 $ 1,025.4 $ 867.3 $ 650.3 $ 948.5 $ 1,019.7 $ 754.8 $ 543.3
Adjusted EBITDA 61.7 91.1 57.3 11.9 72.4 89.5 41.4 3.7
Earnings (loss) before income taxes 25.3 53.2 23.2 (14.9) 35.7 51.0 7.4 (27.1)
Profit (loss) 20.2 42.1 20.4 (9.8) 27.9 42.0 8.4 (19.2)
Earnings (loss) per share:
Basic 0.33 0.69 0.34 (0.16) 0.46 0.70 0.14 (0.32)
Diluted 0.31 0.60 0.31 (0.16) 0.41 0.60 0.13 (0.32)
Earnings (loss) per share for each quarter has been computed using the weighted average number of shares issued and outstanding during the respective quarter. Any dilutive securities, which increase the earnings per share or decrease the loss per share, are excluded for purposes of calculating diluted earnings per share. Due to the impacts of dilutive securities, such as convertible debentures, and share issuances and repurchases throughout the periods, the sum of the quarterly earnings (losses) per share will not necessarily equal the total for the year.
Set out below is the calculation of Adjusted EBITDA for the most recent eight quarters: $ millions
2019 2018
Quarter 4 Quarter 3 Quarter 2 Quarter 1 Quarter 4 Quarter 3 Quarter 2 Quarter 1
Operating profit (loss) $ 31.1 $ 58.8 $ 28.1 $ (10.8) $ 42.6 $ 56.2 $ 12.8 $ (22.2)
Depreciation and amortization 24.9 26.8 23.9 18.5 25.3 29.5 25.4 23.7
(Gain) loss on sale of assets (1.0) (0.7) (1.1) (0.5) 0.1 (0.2) (0.1) (0.3)
Income from projects accounted for using the equity method (3.5) (4.3) (2.2) (2.5) (6.2) (3.9) (2.2) (0.8)
Equity Project EBITDA 10.1 10.6 8.6 7.2 10.6 7.9 5.5 3.3
Adjusted EBITDA $ 61.7 $ 91.1 $ 57.3 $ 11.9 $ 72.4 $ 89.5 $ 41.4
$ 3.7
Set out below is the calculation of Equity Project EBITDA for the most recent eight quarters:
$ millions
2019 2018
Aecon's proportionate share of projects accounted for using the equity method (1) Quarter 4 Quarter 3 Quarter 2 Quarter 1 Quarter 4 Quarter 3 Quarter 2 Quarter 1
Operating profit $ 10.0 $ 10.4 $ 8.4 $ 7.1 $ 10.5 $ 7.8 $ 5.4 $ 3.2
Depreciation and amortization 0.1 0.2 0.2 0.1 0.1 0.1 0.1 0.1
Equity Project EBITDA 10.1 10.6 8.6 7.2 10.6 7.9 5.5 3.3
(1) Refer to Note 12 “Projects Accounted for Using the Equity Method” in the December 31, 2019 consolidated financial statements.
Aecon Group Inc. 15

Quarterly Financial Highlights $ millions Three months ended December 31 Revenue Operating profit (loss) 2019 2018 2019 2018
Construction $ 901.6 $ 924.8 $ 43.5 $ 35.6 Concessions 38.5 68.6 6.8 16.6
Other costs and eliminations (22.8) (44.9) (19.2) (9.6)
Consolidated $ 917.3 $ 948.5 $ 31.1 $ 42.6 The analysis of operating results for each of the first three quarters of 2019 is included in Management’s Discussion and Analysis incorporated in the Interim Reports to Shareholders for each respective quarter. For the three months ended December 31, 2019, revenue in the Construction segment of $902 million was $23 million, or 3%, lower than the fourth quarter of 2018. Construction segment revenue was higher in civil operations and urban transportation systems by $76 million driven by increases in major projects and transportation operations in eastern Canada. Revenue was also higher from nuclear operations by $23 million related to refurbishment work in Ontario. These increases were more than offset by lower volume in conventional industrial ($68 million) primarily due to a decrease of $41 million due to the sale of the contract mining business in November 2018, and utilities operations ($54 million) due to decreased activity on mainline pipeline projects in western Canada in the quarter. Operating profit in the Construction segment of $43.5 million in the fourth quarter of 2019 increased by $7.9 million compared to $35.6 million in the fourth quarter of 2018. Part of the operating profit improvement resulted from the sale of the contract mining business in November 2018 which contributed an operating loss of $3.0 million in the fourth quarter of 2018. An improvement in operating profit from the balance of the Construction segment in 2019 of $4.9 million was due to a combination of higher revenue and improved gross profit margin from civil operations, urban transportation systems and nuclear operations. This offset lower operating profit from utilities operations due to lower revenue and gross profit margin as a result of lower mainline pipeline activity. Revenue in the Concessions segment in the fourth quarter of 2019 of $39 million was lower by $30 million when compared to the same period in 2018. The lower revenue was primarily driven by the Bermuda International Airport Redevelopment Project and resulted from the impact of decreased construction activity related to the new terminal at the airport as the project moves closer to completion. Revenue was also lower due to a decrease in management and development fees in the fourth quarter of 2019 of $6 million due to the impact of fees received in the fourth quarter of 2018 on commencement of the Finch West LRT and Gordie Howe International Bridge concessions in 2018. Included in Concessions’ revenue for the three months ended December 31, 2019 was $21 million of construction revenue that was eliminated on consolidation as inter-segment revenue (2018 - $43 million). Concessions segment operating profit of $6.8 million in the fourth quarter of 2019 represents a $9.8 million decrease over the same three-month period in 2018 due primarily to lower management and development fees as noted above.
2019 Annual Report16
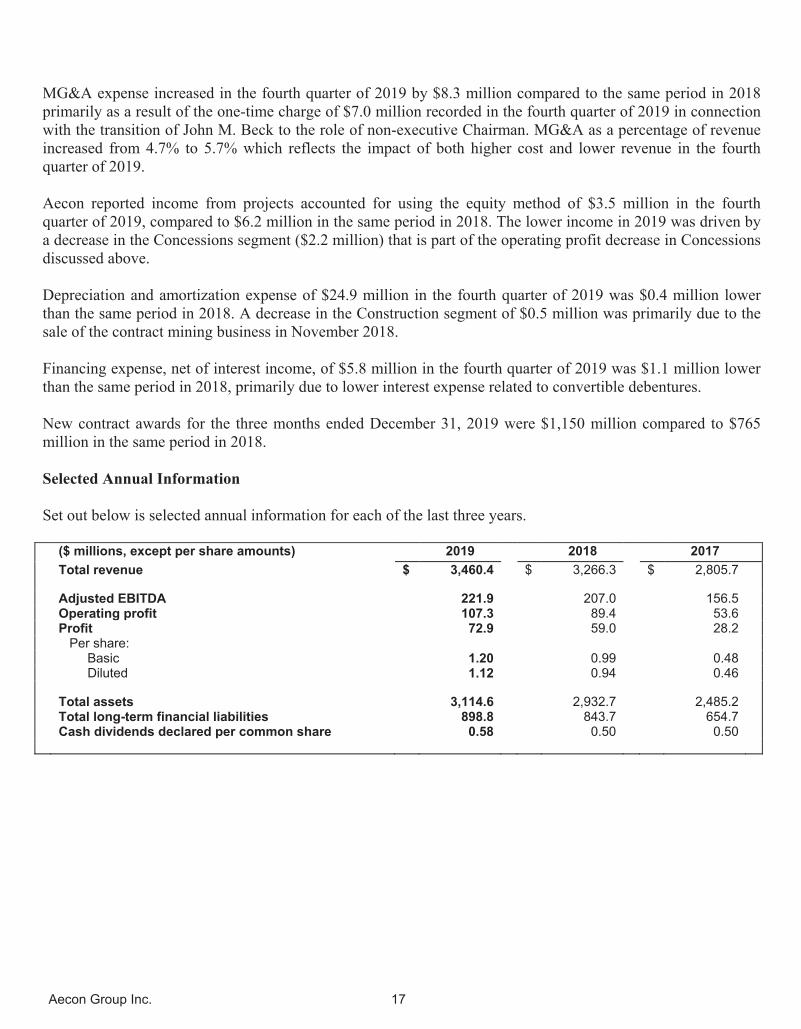
MG&A expense increased in the fourth quarter of 2019 by $8.3 million compared to the same period in 2018 primarily as a result of the one-time charge of $7.0 million recorded in the fourth quarter of 2019 in connection with the transition of John M. Beck to the role of non-executive Chairman. MG&A as a percentage of revenue increased from 4.7% to 5.7% which reflects the impact of both higher cost and lower revenue in the fourth quarter of 2019. Aecon reported income from projects accounted for using the equity method of $3.5 million in the fourth quarter of 2019, compared to $6.2 million in the same period in 2018. The lower income in 2019 was driven by a decrease in the Concessions segment ($2.2 million) that is part of the operating profit decrease in Concessions discussed above. Depreciation and amortization expense of $24.9 million in the fourth quarter of 2019 was $0.4 million lower than the same period in 2018. A decrease in the Construction segment of $0.5 million was primarily due to the sale of the contract mining business in November 2018. Financing expense, net of interest income, of $5.8 million in the fourth quarter of 2019 was $1.1 million lower than the same period in 2018, primarily due to lower interest expense related to convertible debentures. New contract awards for the three months ended December 31, 2019 were $1,150 million compared to $765 million in the same period in 2018. Selected Annual Information Set out below is selected annual information for each of the last three years.
($ millions, except per share amounts) 2019 2018 2017
Total revenue $ 3,460.4 $ 3,266.3 $ 2,805.7
Adjusted EBITDA 221.9 207.0 156.5 Operating profit 107.3 89.4 53.6 Profit 72.9 59.0 28.2 Per share:
Basic 1.20 0.99 0.48 Diluted 1.12 0.94 0.46
Total assets 3,114.6 2,932.7 2,485.2 Total long-term financial liabilities 898.8 843.7 654.7 Cash dividends declared per common share 0.58 0.50 0.50
Aecon Group Inc. 17

FINANCIAL CONDITION, LIQUIDITY AND CAPITAL RESOURCES Aecon’s participation in joint arrangements classified as joint operations is accounted for in the consolidated financial statements by reflecting, line by line, Aecon’s share of the assets held jointly, liabilities incurred jointly, and revenue and expenses arising from the joint operations. Aecon’s participation in joint arrangements classified as joint ventures, as well as Aecon’s participation in project entities where Aecon exercises significant influence over the entity, but does not control or jointly control the entity (i.e. associates), is accounted for using the equity method. For further information, see Note 12 to the December 31, 2019 consolidated financial statements. During the second quarter of 2018, the Company filed a statement of claim in the Court of Queen's Bench for Saskatchewan (the "Court") against K+S Potash Canada ("KSPC") and KSPC filed a statement of claim in the Court against the Company. Both actions relate to the Legacy mine project in Bethune, Saskatchewan. The Company is seeking $180 million in payments due to it pursuant to agreements entered into between the Company and KSPC with respect to the project plus approximately $14 million in damages. The Company has recorded $136 million of unbilled revenue and accounts receivable as at December 31, 2019. Offsetting this amount to some extent, the Company has accrued $45 million in trade and other payables for potential payments to third parties pending the outcome of the claim against KSPC. KSPC is seeking an order that the Company repay to KSPC approximately $195 million already paid to the Company pursuant to such agreements. The Company believes that it will be successful in its claim and considers KSPC’s claim to be without merit. These claims may not be resolved for several years. The Company does not expect that the resolution of these claims will cause a material impact to its financial position. Cash and Debt Balances Cash balances at December 31, 2019 and December 31, 2018 are as follows: $ millions December 31, 2019
Balances excluding Joint Operations Joint Operations Consolidated Total
Cash and cash equivalents (1) $ 189 $ 493 $ 682
Restricted cash (2) 77 - 77
December 31, 2018
Balances excluding Joint Operations Joint Operations Consolidated Total
Cash and cash equivalents (1) $ 158 $ 473 $ 631
Restricted cash (2) 193 - 193
(1) Cash and cash equivalents include cash on deposit in bank accounts of joint operations which Aecon cannot access directly.
(2) Restricted cash is cash held by Bermuda Skyport Corporation Limited.
2019 Annual Report18

Total long-term recourse debt of $370.2 million as at December 31, 2019 compares to $262.0 million as at December 31, 2018, the composition of which is as follows: $ millions
December 31, 2019 December 31, 2018 Current portion of long-term debt – recourse $ 60.1 $ 32.5 Long-term debt – recourse 145.7 69.7 Long-term portion of convertible debentures 164.4 159.8 Total long-term recourse debt $ 370.2 $ 262.0 Long-term project debt - non-recourse $ 365.9 $ 383.7
The $108.2 million net increase in total long-term recourse debt primarily results from an increase in finance leases and equipment loans during 2019 of $103.6 million, of which $44.8 million related to new finance leases recorded as at January 1, 2019 as a result of a new IFRS standard that became effective for Aecon on January 1, 2019 (see Note 6 “Changes in Accounting Policies” in Aecon’s December 31, 2019 consolidated financial statements). Convertible debentures also increased by $4.6 million related to the accretion of notional interest. The $17.8 million decrease in long-term non-recourse project debt, which all relates to the financing of the Bermuda International Airport Redevelopment Project, is due to the impact of the change in the US:Canadian dollar exchange rate since December 31, 2018. Aecon’s liquidity position and capital resources are expected to be sufficient to finance its operations and working capital requirements for the foreseeable future. On July 19, 2019, Aecon increased its committed revolving credit facility from $500 million to $600 million and extended its maturity to July 19, 2023, and added a new $100 million uncommitted demand letter of credit facility. Aecon’s liquidity position is strengthened by its ability to draw on this committed revolving credit facility of $600 million, of which $75 million was utilized as at December 31, 2019. When combined with an additional $700 million performance security guarantee facility to support letters of credit provided by Export Development Canada (“EDC”), Aecon’s total committed credit facilities for working capital and letter of credit requirements total $1,300 million. On June 28, 2019, the Company extended the maturity of the EDC facility to June 30, 2021. As at December 31, 2019, Aecon was in compliance with all debt covenants related to its credit facility. In the fourth quarter of 2019, Aecon announced its intention to make a normal course issuer bid (the “NCIB”) commencing on November 5, 2019 and expiring on November 4, 2020. During the period, Aecon is permitted to purchase for cancellation up to a maximum of 5,975,486 common shares on the open market, representing approximately 10% of the issued and outstanding common shares at the time of the announcement of the NCIB. From November 5, 2019 to December 31, 2019, Aecon acquired 399,200 common shares for $7.2 million of which $2.6 million was recorded as a reduction in share capital and $4.6 million recorded as a reduction of retained earnings. All the shares acquired were subsequently cancelled. In the first quarter of 2019, Aecon’s Board of Directors approved an increase in the dividend to be paid to all holders of Aecon common shares. Quarterly dividends increased to $0.145 per share (annual dividend of $0.58 per share). Prior to this increase, Aecon paid a quarterly dividend of $0.125 per share (annual dividend of $0.50 per share). The first quarterly dividend payment of $0.145 per share was paid on April 1, 2019.
Aecon Group Inc. 19

Summary of Cash Flows The construction industry in Canada is seasonal in nature for companies like Aecon that perform a significant portion of their work outdoors, particularly road construction and utilities work. As a result, a larger portion of this work is performed in the summer and fall months than in the winter and early spring months. Accordingly, Aecon has historically experienced a seasonal pattern in its operating cash flow, with cash balances typically being at their lowest levels in the middle of the year as investments in working capital increase. These seasonal impacts typically result in cash balances peaking near year-end or during the first quarter of the year. A summary of sources and uses of cash during 2019 and 2018 are as follows: $ millions Three months ended Year ended December 31 December 31
2019 2018 2019 2018 Operating Activities Cash provided by (used in): Cash flows from operations before changes in working capital $ 57.5 $ 65.7 $ 187.4 $ 186.8 Lower (higher) investments in working capital 218.6 (64.0) 11.1 181.9 Cash provided by operating activities $ 276.1 $ 1.7 $ 198.5 $ 368.7 Investing Activities Cash provided by (used in):
Decrease in restricted cash balances held by Skyport to finance the Bermuda International Airport Redevelopment Project $ 6.6 $ 38.8 $ 109.9 $ 105.1
Expenditures made by Skyport related to the construction of the new airport terminal in Bermuda (40.3) (68.5) (162.0) (163.9)
Expenditures (net of disposals) on property, plant and equipment and intangible assets (6.8) (22.4) (35.6) (43.0)
Increase in other investments - - (3.8) - Proceeds on sale of contract mining business 11.7 150.8 22.0 150.8 Cash distributions received from projects accounted for using the equity method 1.5 0.2 4.9 0.2 Cash provided by (used for) investments in long-term financial assets 1.1 1.1 (1.5) (10.2) Cash provided by (used in) investing activities $ (26.2) $ 100.0 $ (66.1) $ 39.0 Financing Activities Cash provided by (used in):
Decrease in bank indebtedness associated with borrowings under the Company's revolving credit facility $ (23.0) $ - $ - $ (17.9)
Increase in long-term recourse debt borrowings 4.3 6.4 20.1 12.8
Repayments of long-term recourse debt relating primarily to equipment financing arrangements (13.8) (21.8) (54.5) (57.2)
Repayment of convertible debentures - (169.0) - (169.0) Cash provided by the issuance of capital stock - - - 1.4 Stock based compensation settlements and receipts (3.1) (1.3) (2.5) (1.3) Cash used for dividends paid (8.8) (7.5) (34.0) (29.8) Common shares purchased under NCIB (7.2) - (7.2) - Issuance of convertible debentures - 22.3 - 175.9 Cash used in financing activities $ (51.6) $ (170.9) $ (78.1) $ (85.1) Increase (decrease) in cash and cash equivalents 198.3 (69.2) 54.3 322.6 Effects of foreign exchange on cash balances (2.4) 4.2 (3.0) 3.5 Cash and cash equivalents - beginning of period 486.4 696.0 631.0 304.9 Cash and cash equivalents - end of period $ 682.3 $ 631.0 $ 682.3 $ 631.0
2019 Annual Report20

In 2019, Aecon acquired, either through purchase or finance leases, property, plant and equipment totaling $107 million. Most of this investment in property, plant and equipment related to the purchase or lease of new machinery and construction equipment as part of normal ongoing business operations in the Construction segment. In 2018, investments in property, plant and equipment totaled $71 million. NEW ACCOUNTING STANDARDS Note 6 “Changes in Accounting Policies” to the 2019 consolidated financial statements includes new IFRS standards that became effective for the Company on January 1, 2019, and Note 7 discusses IFRS standards and interpretations that are issued, but not yet effective as at January 1, 2019. The main changes in 2019 because of the new IFRS 16 lease accounting standard are as follows:
The definition of a lease has changed under the new standard. Under IFRS 16, a contract is, or contains, a lease if the contract conveys the right to control the use of an identified asset for a period of time in exchange for consideration, as explained further in Note 5, “Summary of Significant Accounting Policies” in the December 31, 2019 consolidated financial statements. Previously, the Company determined at contract inception if an arrangement was or contained a lease based on an assessment of whether fulfillment of the arrangement was dependent on the use of a specific asset or assets, and the arrangement had conveyed a right to use the asset.
Under the new lease accounting standard, the lessee recognizes a right-of-use asset and a lease liability upon lease commencement for leases with a lease term of greater than one year.
As a result of adopting the new lease accounting standard, as at January 1, 2019, long-term assets increased by $45 million, current liabilities and long-term liabilities increased by $7 million and $37 million respectively, while retained earnings increased by $1 million. This new accounting standard had no significant impact on profit (loss), comprehensive income or earnings per share of 2019. SUPPLEMENTAL DISCLOSURES Disclosure Controls and Procedures The Chief Executive Officer (“CEO”) and Chief Financial Officer (“CFO”), together with management, evaluated the design and operating effectiveness of the Company’s disclosure controls and procedures as at the financial year ended December 31, 2019. Based on that evaluation, the CEO and the CFO concluded that the design and operation of these disclosure controls and procedures were effective as at December 31, 2019 to provide reasonable assurance that material information relating to the Company, including its consolidated subsidiaries, would be made known to them by others within those entities and that information required to be disclosed by the Company in its annual and interim filings and other reports submitted under securities legislation was recorded, processed, summarized and reported within the periods specified in securities legislation. Internal Controls over Financial Reporting The CEO and CFO, together with management, evaluated the design and operating effectiveness of the Company’s internal controls over financial reporting as at the financial year ended December 31, 2019. Based on that evaluation, the CEO and the CFO concluded that the design and operation of internal controls over
Aecon Group Inc. 21

financial reporting were effective as at December 31, 2019 to provide reasonable assurance regarding the reliability of financial reporting and the preparation of consolidated financial statements for external purposes in accordance with IFRS. In designing and implementing such controls, it should be recognized that any system of internal control over financial reporting, no matter how well designed and operated, has inherent limitations. Therefore, even those systems determined to be effective can provide only reasonable assurance with respect to consolidated financial statement preparation and presentation and may not prevent or detect all misstatements due to error or fraud. See also the section on “Internal and Disclosure Controls” in the Risk Factors section of this MD&A. Changes in Internal Controls over Financial Reporting There have been no changes in the Company’s internal controls over financial reporting during the year ended December 31, 2019 that have materially affected, or are reasonably likely to materially affect, the Company’s internal controls over financial reporting. Contractual Obligations Aecon has commitments for equipment, premises under finance lease, and convertible debentures as follows: $ millions Finance lease Equipment and Convertible
payments other loans debentures (1)
2020 $ 56.0 $ 9.8 $ 9.2 2021- 2024 103.3 21.1 211.6 Beyond 27.4 6.9 - $ 186.7 $ 37.8 $ 220.8
(1) Assumes all convertible debentures are redeemed at maturity for cash. Commitments related to non-recourse project debt are as follows: $ millions
Non- recourse project debt
2020 $ 21.8 2021- 2024 98.0 Beyond 603.7 $ 723.5
As at December 31, 2019, Aecon had contractual obligations to complete construction contracts that were in progress. The revenue value of these contracts was $6,790 million. Off-Balance Sheet Arrangements Aecon’s defined benefit pension plans (the “Pension Plans”) had a combined surplus of $0.8 million as at December 31, 2019 (2018 – a combined surplus/deficit of $nil). Details relating to Aecon’s defined benefit plans are set out in Note 22 to the 2019 consolidated financial statements.
2019 Annual Report22

The latest actuarial valuation of the Pension Plans for statutory and contribution purposes was completed as at December 31, 2017. Under current pension benefits regulations, the next actuarial valuation of the Pension Plans must be performed with a valuation date of no later than December 31, 2020. Accordingly, unless an earlier valuation date is adopted, no change in contributions will be required before 2021 and any changes thereafter will reflect December 31, 2020 market conditions. The defined benefit obligations and benefit cost levels will change as a result of future changes in the actuarial methods and assumptions, the membership data, the plan provisions and the legislative rules, or as a result of future remeasurement gains or losses, none of which have been anticipated at this time. Emerging experience, differing from the assumptions, will result in gains or losses that will be revealed in future accounting valuations. Consequently, the accounting for Pension Plans involves a number of assumptions including those that are disclosed in Note 22 to the December 31, 2019 consolidated financial statements. As a result of the uncertainty associated with these estimates, there is no assurance that the Pension Plans will be able to earn the assumed rate of return on plan assets, and furthermore, market driven changes may result in changes to discount rates and other variables which would result in Aecon being required to make contributions to the Pension Plans in the future that may differ significantly from estimates. As a result, there is a significant amount of measurement uncertainty involved in the actuarial valuation process. This measurement uncertainty may lead to potential fluctuations in financial results attributable to the selection of actuarial assumptions and other accounting estimates involved in the determination of pension expense and obligations. A significant actuarial and accounting assumption impacting the reporting of Pension Plans is the discount rate assumption. As at December 31, 2019, Aecon used a discount rate of 3.0% in its Pension Plan calculations for consolidated financial statement purposes. The impact of a 0.5% decrease in the discount rate assumption would have resulted in an increase in the pension benefit obligation of approximately $2.2 million as at December 31, 2019 and an increase in the estimated 2020 pension expense of approximately $0.1 million. Further details of contingencies and guarantees are included in the December 31, 2019 consolidated financial statements. Related Party Transactions There were no significant related party transactions in 2019. Critical Accounting Estimates and Judgements The reader is referred to the detailed discussion on critical accounting estimates and judgements found in Note 4 to the December 31, 2019 consolidated financial statements.
Aecon Group Inc. 23

RISK FACTORS
The Company monitors and reviews significant and emerging risks that may affect its future results and takes action to mitigate potential risks as required.
The following risk factors, and the information incorporated by reference herein, should be considered carefully. These risk factors could materially and adversely affect the Company’s future operating results and could cause actual events to differ materially from those described in forward-looking statements relating to the Company. Notwithstanding that certain of these risk factors cross-reference other risk factors, all risk factors herein may be interrelated to some degree and should be read and considered together.
Large Project Risk
A substantial portion of Aecon’s revenue is derived from large projects, some of which are conducted through joint ventures. These projects provide opportunities for significant revenue and profit contributions but, by their nature, carry significant risk and, as such, can result and have occasionally resulted in significant losses. In addition to increased involvement in large projects in response to changing market conditions, Aecon is also active in the P3 market in Canada and internationally. The P3 procurement model typically involves a transfer of certain risks to a contractor beyond those contained in a conventional fixed price contract. As such, a failure to properly execute or complete a P3 project may subject Aecon to significant losses. The risks associated with such large-scale projects are often proportionate to their size and complexity, thereby placing a premium on risk assessment and project execution.
Joint ventures are often formed to undertake a specific project, jointly controlled by the partners, and are dissolved upon completion of the project. Aecon selects its joint venture partners based on a variety of criteria including relevant expertise, past working relationships, as well as analysis of prospective partners’ financial and construction capabilities. Joint venture agreements spread risk between the partners and they generally state that companies will supply their proportionate share of operating funds and share profits and losses in accordance with specified percentages. Nevertheless, each participant in a joint venture is usually liable to the client for completion of the entire project in the event of a default by any of its partners. Therefore, in the event that a joint venture partner fails to perform its obligations due to financial or other difficulties or is disallowed from performing or is otherwise unable to perform its obligations as a result of the client’s determination, whether pursuant to the relevant contract or because of modifications to government or agency procurement policies or rules or for any other reason, Aecon may be required to make additional investments or provide additional services which may reduce or eliminate profit, or even subject Aecon to significant losses with respect to the joint venture. As a result of the complexity and size of such projects that Aecon undertakes or is likely to undertake going forward, the failure of a joint venture partner on a large complex project could have a significant impact on Aecon’s results.
The contract price on large projects is based on cost estimates using a number of assumptions. Given the size of these projects, if assumptions prove incorrect, whether due to faulty estimates, unanticipated circumstances, or a failure to properly assess risk, profit may be materially lower than anticipated or, in a worst-case scenario, result in a significant loss.
The recording of the results of large project contracts can distort revenues and earnings on both a quarterly and an annual basis and can, in some cases, make it difficult to compare the financial results between reporting periods. For greater detail on the potential impact of contractual factors, including unpriced change orders, see “Risk Factors - Contractual Factors” herein.
2019 Annual Report24
Aecon has a number of commitments and contingencies. If Aecon was called upon to honour these contingent obligations, its financial results could be adversely affected. For additional details, see Note 23 “Contingencies”, Note 30 “Financial Instruments” and Note 34 “Remaining Performance Obligations” to the Company’s December 31, 2019 consolidated financial statements filed on Aecon’s SEDAR profile at www.sedar.com.
The failure to replace the revenue generated from large projects on a going forward basis could adversely affect Aecon.
Contractual Factors
Aecon performs construction activities under a variety of contracts including lump sum, unit price, guaranteed maximum price, cost reimbursable, design-build, design-build-finance, design-build-finance-maintain and design-build-finance-operate-maintain. Some forms of construction contracts carry more risk than others. Aecon attempts to maintain a diverse mix of contracts to prevent overexposure to the risk profile of any particular contractual structure; however, conditions influencing both private sector and public authority clients may alter the mix of available projects and contractual structures that Aecon undertakes.
Historically, a substantial portion of Aecon’s revenue is derived from contracts pursuant to which a commitment is provided to the owner to complete the project at a fixed or guaranteed maximum price (“Fixed Price”). In Fixed Price projects, in addition to the risk factors of a unit price contract (as described below), any errors in quantity estimates, schedule delays or productivity losses, for which contracted relief is not available, must be absorbed within the Fixed Price, thereby adding a further risk component to the contract. Such contracts, given their inherent risks, may in the future and from time to time result in significant losses. The failure to properly assess a wide variety of risks, appropriately execute such contracts, or reach satisfactory resolution to contractual disputes may have a material adverse impact on financial results.
Aecon is also involved in fixed unit price construction contracts under which the Company is committed to provide services and materials at a fixed unit price (e.g. dollars per tonne of asphalt or aggregate). While this shifts the risk of estimating the quantity of units to the contract owner, any increase in Aecon’s cost over the unit price bid, whether due to estimating error, inefficiency in project execution, inclement weather, cost escalation, or other factors, will negatively affect Aecon’s profitability.
In certain instances, Aecon guarantees to a client that it will complete a project by a scheduled date or that a facility will achieve certain performance standards. If the project or facility subsequently fails to meet the schedule or performance standards, Aecon could incur additional costs or penalties commonly referred to as liquidated damages. Although Aecon attempts to negotiate waivers of consequential or liquidated damages, on some contracts the Company is required to undertake such damages for failure to meet certain contractual provisions. Such penalties may be significant and could impact Aecon’s financial position or results of future operations. Furthermore, schedule delays may also reduce profitability because staff may be prevented from pursuing and working on new projects. Project delays may also reduce customer satisfaction, which could impact future awards.
Aecon is also involved in design-build contracts under which Aecon takes responsibility for the design in addition to the responsibilities and risks of a unit price or Fixed Price construction contract. This form of contract adds the risk of Aecon’s liability for design errors as well as additional construction costs that might result from such design errors.
Aecon Group Inc. 25

Certain of Aecon’s contractual requirements may also involve financing elements, where Aecon is required to provide one or more letters of credit, performance bonds, financial guarantees or equity investments. For greater detail see “Access to Bonding, Pre-qualification Rating and Letters of Credit” under “Risk Factors” herein.
Change orders, which modify the nature or scope of the work to be completed, are frequently issued by clients. Final pricing of these change orders is often negotiated after the changes have been started or completed. As such, disputes regarding the quantum of unpriced change orders could impact Aecon’s profitability on a particular project, its ability to recover costs or, in a worst-case scenario, result in significant project losses. Until pricing has been agreed, these change orders are referred to as “unpriced change orders.” Revenues from unpriced change orders are recognized to the extent of the costs incurred on executing the change order or, if lower, to the extent to which recovery is probable. Consequently, profit on such change orders is recognized only when pricing is agreed. If, ultimately, there are disputes with clients on the pricing of change orders or disputes regarding additional payments owing as a result of changes in contract specifications, delays, additional work or changed conditions, Aecon’s accounting policy is to record all costs for these changes but not to record any revenues anticipated from these disputes until resolution is probable. The timing of the resolution of such events can have a material impact on income and liquidity and thus can cause fluctuations in the revenue and income of Aecon in any one reporting period.
Aecon Operates in a Highly Competitive Industry
Aecon operates businesses in highly competitive product and geographic markets in Canada, the United States and, on a select basis, internationally. Aecon competes with other major contractors, as well as many mid-size and smaller companies, across a range of industry sectors. In addition, an increase in the number of international companies entering into the Canadian marketplace has made the market more competitive. Each has its own advantages and disadvantages relative to Aecon. New contract awards and contract margin are dependent on the level of competition and the general state of the markets in which the Company operates. Fluctuations in demand in the sectors in which the Company operates may impact the degree of competition for work. Competitive position is based on a multitude of factors including pricing, ability to obtain adequate bonding, backlog, financial strength, appetite for risk, reputation for safety, quality, timeliness and experience. Aecon has little control over and cannot otherwise affect what these competitive factors are. If the Company is unable to effectively respond to these competitive factors, results of operations and financial condition will be adversely impacted. In addition, a prolonged economic slump or slower than anticipated recovery may affect one or more of Aecon’s competitors or the markets in which it operates, resulting in increased competition in certain market sectors, price or margin reductions or decreased demand for services, which may adversely affect results.
Resources and Commodities Sector
Delays, scope reductions and/or cancellations in previously announced or anticipated projects in the resources and commodities sector could be impacted by a variety of factors. General factors include but are not limited to: the pricing of oil, natural gas and other commodities; market volatility; the impact of global economic conditions affecting demand or the worldwide financial markets; cost overruns on announced projects; efforts by owners to contractually shift risk for cost overruns to contractors; fluctuations in the availability of skilled labour; lack of sufficient governmental investment or infrastructure to support growth; the introduction or repeal of climate change or environmentally-focused legislation; negative perception of the oil sands and gas industry and related potential environmental impact; and a shortage of sufficient pipeline capacity to transport production to major markets.
2019 Annual Report26

The prices of oil, natural gas and other commodities are determined based on world demand, supply, production, speculative activities and other factors, all of which are beyond the control of the Company. Investment decisions by some of Aecon’s clients are dependent on the clients’ outlook on the long-term price of commodities. If that outlook is unfavourable it may cause delay, reduction or cancellation of current and future projects, including pipeline projects. A material reduction in the oil and gas development, transportation or distribution activities and capital expenditure plans of some of the Company’s clients, could have a negative effect on the frequency, number and size of the projects for which the Company would bid.
Given the volatility of world oil, natural gas and commodity prices, a sustained period of low prices on a going forward basis may result in material differences in previously projected resource development projects. Postponements or cancellations of investment in existing and new projects could have an adverse impact on Aecon’s business and financial condition.
Economic Factors
Aecon’s profitability is closely tied to the general state of the economy in those geographic areas in which it operates. More specifically, the demand for construction and infrastructure development services, which is the principal component of Aecon’s operations, could be the largest single driver of the Company’s growth and profitability. In periods of strong economic growth, there is generally an increase in the number of opportunities available in the construction and infrastructure development industry as capital spending increases. In periods of weak economic growth, the demand for Aecon’s services from private sector and public authority clients may be adversely affected.
In North America, which tends to have relatively sophisticated infrastructure, Aecon’s profitability is dependent both on the development, rehabilitation and expansion of basic infrastructure (such as, among others, highways, airport terminals, transit systems and power plants) and on the type of infrastructure that flows from commercial and population growth. Commercial growth demands incremental facilities for the movement of goods within and outside of the community, along with water and sewer systems and heat, light and power supplies. Population growth creates a need to move people to and from work, schools and other public facilities, and demands similar services to new homes. Since growth in both of these areas, with the possible exception of road maintenance and construction, is directly affected by the general state of the local economy, a prolonged economic downturn in the markets in which Aecon operates or related constraints on public sector funding, including as a result of government deficits, may have a significant impact on Aecon’s operations.
Concessionaire Risk
In addition to providing design, construction, procurement, operation and other services on a given project, Aecon will sometimes invest as a concessionaire in an infrastructure asset. In such instances, Aecon assumes a degree of risk (essentially equity risk) associated with the performance of the asset during the concession period. The Bermuda International Airport Redevelopment Project is a current example of such a project.
The financing arrangements on concession projects are typically based on a set of projections regarding the cash flow to be generated by the asset during the life of the concession. The ability of the asset to generate the cash flows required to provide a return to the concessionaire can be influenced by a number of factors, some of which are partially beyond the concessionaire’s control, such as, among others, political or legislative changes, traffic demand and thus operating revenues, collection success and operating cost levels.
Aecon Group Inc. 27
While project concession agreements often provide a degree of risk mitigation, and insurance products are available to limit some of the concession risks, the value of Aecon’s investment in these infrastructure assets can be impaired, and certain limited risk guarantees can be called, if the financial performance of the asset does not meet certain requirements.
On a going forward basis, a future economic downturn may directly or indirectly impact the ability of Aecon to make the necessary financing arrangements to pursue all of the concession opportunities it would otherwise be interested in.
Dependence on the Public Sector
A significant portion of Aecon’s revenue is derived from contracts with various levels of government or their agencies. Consequently, any reduction in demand for Aecon’s services by the public sector, whether from traditional funding constraints, the long-term impact of weak economic conditions (including future budgetary constraints, concerns regarding deficits or an eroding tax base), changing political priorities, change in government, cancellation or delays in projects caused by the election process would likely have an adverse effect on the Company if that business could not be replaced from within the private sector.
Large government-sponsored projects typically have lengthy and often unpredictable lead times associated with the government review and political assessment process. The time delays and pursuit costs incurred as a result of this lengthy process, as well as the often-unknown political considerations that can be part of any final decision, constitute a significant risk to those pursuing such projects.
Labour Factors
A significant portion of Aecon’s labour force is unionized and, accordingly, Aecon is subject to the detrimental effects of a strike or other labour action, in addition to competitive cost factors.
The Company’s future prospects depend to a significant extent on its ability to attract and retain sufficient skilled workers. The construction industry is from time to time faced with a shortage of skilled labourers in some areas and disciplines. The resulting competition for labour may limit the ability of the Company to take advantage of opportunities otherwise available or alternatively may impact the profitability of such endeavours. The Company believes that its union relationships, size, and industry reputation will help mitigate this risk but there can be no assurance that the Company will be successful in identifying, recruiting or retaining a sufficient number of skilled workers.
Subcontractor Performance
The profitable completion of some contracts depends to a large degree on the satisfactory performance of the subcontractors, including design and engineering consultants, who complete different elements of the work. If these subcontractors do not perform to accepted standards, Aecon may be required to hire different subcontractors to complete the tasks, which may impact schedule, add costs to a contract, impact profitability on a specific job and, in certain circumstances, lead to significant losses. Disputes with subcontractors may also result in material litigation. See “Risk Factors – Litigation Risk and Claims Risk” herein. A major subcontractor default or failure to properly manage subcontractor performance could materially impact results.
2019 Annual Report28

Climate Change Factors
Global climate change continues to attract considerable public, scientific and regulatory attention, while climate change policy continues to evolve at regional, national and international levels. Aecon carefully considers the physical and non-physical impacts of climate change.
Risks in Transitioning to a Lower Carbon Economy The transition to a lower-carbon economy has the potential to be disruptive to traditional business models and investment strategies. Aecon’s private and/or public-sector clients may shift their infrastructure priorities due to changes in project funding or public perception of sustainable projects. This risk can be mitigated to an extent by identifying changing market demands to offset lower demand in some sectors with opportunities in others, forming strategic partnerships and pursuing sustainable innovations. Government action to address climate change may involve economic instruments such as carbon and energy consumption taxes as well as restrictions on economic sectors, such as cap-and-trade and more stringent regulation of greenhouse gas emissions that could also impact Aecon’s current or potential clients operating in industries that extract, distribute and transport fossil fuels. Financial Risks As new climate change measures are introduced or strengthened, Aecon’s cost of business, including insurance premiums, may increase, and the Company may incur expenses related to complying with environmental regulations and policies in countries or regions where it does business. Such costs may include purchasing new equipment to reduce emissions to comply with new regulatory standards or to mitigate the financial impact of different forms of carbon pricing. In addition, Aecon may incur costs related to engaging with governments, regulators and industry organizations for new mandates on infrastructure projects, proactively and regularly monitoring regulatory trends and implementing adequate compliance processes. Aecon’s inability to comply with climate change laws and regulations could also result in penalties and lawsuits and reputational damage that may impair Aecon’s future prospects. Market and Reputational Risk Investors and other stakeholders in Canada and worldwide are becoming more attuned to climate change action and sustainability matters, including the efforts made by issuers to reduce their carbon footprint. Aecon’s reputation may be harmed if it is not perceived by its stakeholders to be sincere in its sustainability commitment and its long-term results may be impacted as a result. In addition, Aecon’s approach to climate change issues may increasingly influence stakeholders’ views of the company in relation to its peers and their investment decisions. Physical Risks Emanating from Climate Change Many of Aecon’s construction activities are performed outdoors. The probability and unpredictability of extreme weather events and other associated incidents may continue to increase due to climate change and we may continue to see longer-term shifts in climate patterns. Increases in the severity and/or frequency of weather conditions due to climate change such as earthquakes, hurricanes, tornadoes, fires, floods, droughts and similar
Aecon Group Inc. 29

events, may cause more regular and severe interruptions in Aecon’s business. Severe weather events may also impact the availability and cost of raw materials and may impact the raw materials supply chain. See “Risk Factors – Weather-Related Risks” herein for further details. Each of these factors may pose a financial risk to Aecon’s business or otherwise have a material adverse effect on its financial position. Weather-Related Risks
Unfavourable weather conditions represent one of the most significant uncontrollable risks for Aecon to the extent that such risk is not mitigated through contractual terms, insurance or otherwise. Construction projects are susceptible to delays as a result of extended periods of poor weather, which can have an adverse effect on profitability arising from either late completion penalties imposed by the contract or from the incremental costs arising from loss of productivity, compressed schedules, or from overtime work utilized to offset the time lost due to adverse weather and additional costs to modify means and methods to perform work in different-than-expected weather. See “Risk Factors – Climate Change Factors” herein for the discussion of weather risks related to climate change.
Litigation Risk and Claims Risk
Disputes are common in the construction industry and, as such, in the normal course of business, the Company is involved in various legal actions and proceedings that arise from time to time, some of which may involve substantial sums of money. In view of the quantum of the amounts claimed and the insurance coverage maintained by the Company in respect of these matters, management of the Company does not believe that any of the legal actions or proceedings that are presently known or anticipated by the Company are likely to have a material impact on the Company’s financial position. However, there is no assurance that the Company’s insurance arrangements will be sufficient to cover any particular claim or claims that may arise in the future or that a judge or arbitrator will not rule against Aecon in a proceeding with respect to a substantial amount in dispute notwithstanding the Company’s confidence in the merits of its position. Furthermore, the Company is subject to the risk of (i) claims and legal actions for various commercial and contractual matters, primarily arising from construction disputes, in respect of which insurance is not available, including, for example, late completion of a project and (ii) litigation or investigations relating to alleged or suspected violations of anti-corruption laws (see “Risk Factors – International/Foreign Jurisdiction Factors” herein). There can be no guarantee that litigation or disputes will not arise or be finally resolved in Aecon’s favour which, depending on the nature of the litigation, could impact Aecon’s results.
Risk of Non-Payment
Credit risk of non-payment with private owners under construction contracts is to a certain degree minimized by statutory lien rights, which give contractors a high priority in the event of insolvency proceedings as well as progress payments based on percentage completion. However, there is no guarantee that these measures will in all circumstances mitigate the risk of non-payment from private owners and a significant default or bankruptcy by a private owner may significantly and adversely impact results. A greater incidence or magnitude of default (including cash flow problems) or bankruptcy amongst clients, subcontractors or suppliers related to economic conditions could also impact results.
Credit risk is typically less of a concern with public (government) owners, who generally account for a significant portion of Aecon’s business, as funds have generally been appropriated prior to the award or commencement of the project. See “Risk Factors - Dependence on the Public Sector” herein for additional discussion of the risks associated with this type of contract.
2019 Annual Report30

Ongoing Financing Availability
Aecon’s business strategy involves the selective growth of its operations through internal growth and acquisitions. Aecon requires substantial working capital during its peak busy period. Aecon relies on its cash position and the availability of credit and capital markets to meet these working capital demands. As Aecon’s business grows, Aecon is continually seeking to enhance its access to funding in order to finance the working capital associated with this growth. However, given the expected demand for infrastructure services over the next several years and the size of many of these projects, Aecon may be constrained in its ability to capitalize on growth opportunities to the extent that financing is either insufficient or unavailable. Further, instability or disruption of capital markets, or a weakening of Aecon’s cash position could restrict its access to or increase the cost of obtaining financing. Aecon cannot guarantee that it will maintain an adequate cash flow to fund its operations and meet its liquidity needs. Additionally, if the terms of Aecon’s credit facility are not met lenders may terminate Aecon’s right to use its credit facility, or demand repayment of whole or part of all outstanding indebtedness, which could have a material adverse effect on Aecon’s financial position.
One or more third parties drawing on letters of credit or guarantees could have a material adverse effect on Aecon’s cash position and operations.
Some of Aecon’s clients also depend on the availability of credit to finance their projects. If clients cannot arrange financing, projects may be delayed or cancelled, which could have a material adverse effect on Aecon’s growth and financial position. Diminution of a client’s access to credit may also affect Aecon’s ability to collect payments, negotiate change orders, and settle claims with clients which could have a material adverse effect on Aecon’s financial position.
Access to Bonding, Pre-qualification Rating and Letters of Credit
Many of Aecon’s construction contracts require sufficient bonding, pre-qualification rating or letters of credit. The issuance of bonds under surety facilities is at the sole discretion of the surety company on a project by project basis. As such, even sizeable surety facilities are no guarantee of surety support on any specific individual project. Although the Company believes it will be able to continue to maintain surety capacity adequate to satisfy its requirements, should those requirements be materially greater than anticipated, or should sufficient surety capacity not be available to Aecon or its joint venture partners (see “Large Project Risk” under “Risk Factors” herein) for reasons related to an economic downturn or otherwise, or should the cost of bonding rise substantially (whether Aecon specific or industry wide), these events may have an adverse effect on the ability of Aecon to operate its business or take advantage of all market opportunities. The Company also believes that it has sufficient capacity with respect to letters of credit to satisfy its requirements, but should these requirements be materially greater than anticipated or should industry capacity be materially impacted by domestic or international conditions unrelated to Aecon, this may have an adverse effect on the ability of Aecon to operate its business.
Insurance Risk
Aecon maintains insurance in order to both satisfy the requirements of its various construction contracts as well as a corporate risk management strategy. Failure to do so could lead to uninsured losses or limit Aecon’s ability to pursue some construction contracts, both of which could impact results. Insurance products from time to time experience market fluctuations that can impact pricing and availability. Therefore, senior management, through
Aecon Group Inc. 31

Aecon’s insurance broker, monitors developments in the insurance markets to ensure that the Company’s insurance needs are met. If any of Aecon’s third-party insurers fail, refuse to renew or revoke coverage or otherwise cannot satisfy their requirements to Aecon, the Company’s overall risk exposure could be materially increased.
Insurance risk entails inherent unpredictability that can arise from assuming long-term policy liabilities or from uncertainty of future events. Although Aecon has in the past been able to meet its insurance needs, there can be no assurances that Aecon will be able to secure all necessary or appropriate insurance on a going forward basis.
Environmental and Safety Factors
During its history, Aecon has experienced a number of incidents, emissions or spills of a non-material nature in the course of its construction activities. Although none of these environmental incidents to date have resulted in a material liability to the Company, there can be no guarantee that any future incidents will also not be material.
Aecon is subject to, and complies with, federal, provincial and municipal environmental legislation in all of its operations. Aecon recognizes that it must conduct all of its business in such a manner as to both protect and preserve the environment in accordance with this legislation. At each place where work is performed, Aecon develops and implements a detailed quality control plan as the primary tool to demonstrate and maintain compliance with all environmental regulations and conditions of permits and approvals. Given its more than one hundred-year history in the construction industry, the large number of companies incorporated into its present structure, and the fact that environmental regulations tend not to have a statute of limitations, there can be no guarantee that a historical claim may not arise on a go forward basis. Management is not aware of any pending environmental legislation that would be likely to have a material impact on any of its operations, capital expenditure requirements or competitive position, although there can be no guarantee that future legislation (including without limitation the introduction of climate change or environmentally-focused legislation that may impact aspects of Aecon’s business) will not be proposed and, if implemented, might have an impact on the Company and its financial results. Please see “Risk Factors – Climate Change Factors” herein for a discussion of climate-related risks.
Aecon is also subject to, and complies with, health and safety legislation in all of its operations in the jurisdictions in which it operates. The Company recognizes that it must conduct all of its business in such a manner as to ensure the protection of its workforce and the general public. Aecon has developed a comprehensive health and safety program; nevertheless, given the nature of the industry, accidents will inevitably occur from time to time. Management is not aware of any pending health and safety legislation or prior incidents which would be likely to have a material impact on any of its operations, capital expenditure requirements or competitive position. Nevertheless, there can be no guarantee with respect to the impact of future legislation or accidents. Increasingly across the construction industry, safety standards, records and culture are an integral component of winning new work. Should Aecon fail to maintain its safety standards, such failure may impact future job awards, or in a worst-case scenario impact financial results.
Cyclical Nature of the Construction Industry
Fluctuating demand cycles are common in the construction industry and can have a significant impact on the degree of competition for available projects. As such, fluctuations in the demand for construction services or the ability of the private and/or public sector to fund projects in the current economic climate could adversely affect backlog and margin and thus Aecon’s results.
2019 Annual Report32

Given the cyclical nature of the construction industry, the financial results of Aecon, similar to others in the industry, may be impacted in any given period by a wide variety of factors beyond its control (as outlined herein) and, as a result, there may be from time to time, significant and unpredictable variations in Aecon’s quarterly and annual financial results.
Failure of Clients to Obtain Required Permits, Licences and Approvals
The development of construction projects requires Aecon’s clients to obtain regulatory and other permits, licences and approvals from various governmental licencing bodies. Aecon’s clients may not be able to obtain all necessary permits, licences and approvals required for the development of their projects, in a timely manner or at all. These delays are generally outside the Company’s control. The major costs associated with these delays are personnel and associated overhead that is designated for the project which cannot be reallocated effectively to other work. If the client’s project is unable to proceed, it may adversely impact the demand for the Company’s services. Clients may also, from time to time, proceed to award a construction contract while a permit or licence remains pending. Where a client does not obtain a permit or licence as expected or a permit or licence is revoked, the client’s cash flow and project viability may be impacted, which may lead to additional costs or financial loss for Aecon.
International/Foreign Jurisdiction Factors
Aecon is from time to time engaged in projects in foreign jurisdictions. International projects can expose Aecon to risks beyond those typical for its activities in its home market, including without limitation, economic, geopolitical, geotechnical, military, repatriation of undistributed profits, currency and foreign exchange risks, and other risks beyond the Company’s control including the duration and severity of the impact of global economic downturns.
The Canadian Corruption of Foreign Public Officials Act and similar anti-corruption laws in other jurisdictions generally prohibit companies and their intermediaries from making improper payments to public officials or others for the purpose of obtaining or retaining business. While Aecon’s policies mandate compliance with these anti-corruption laws, the Company may in the future operate in parts of the world that have experienced corruption to some degree. Aecon trains its employees with respect to anti-corruption issues and also expects its partners, subcontractors, suppliers, vendors, agents and others who work for Aecon or on its behalf to comply with anti-corruption laws. Aecon has procedures and controls in place to monitor compliance. However, there is no assurance that Aecon’s internal controls and procedures will always protect the Company from possible improper payments made by its employees or agents. If Aecon is found to be liable for violating anti-corruption laws, the Company could suffer from criminal or civil penalties or other sanctions, including contract cancellations or debarment, and loss of reputation, any of which could have a material adverse effect on its business.
Aecon continually evaluates its exposure to unusual risks inherent in international projects and, where deemed appropriate in the circumstances, mitigates these risks through specific contract provisions, insurance coverage and forward exchange agreements. However, there are no assurances that such measures would offset or materially reduce the effects of such risks.
Foreign exchange risks are actively managed and hedged where possible and considered cost effective, when directly tied to quantifiable contractual cash flows accruing directly to Aecon within periods of one or two years. Major projects executed through joint ventures generally have a longer term and result in foreign
Aecon Group Inc. 33

exchange translation exposures that Aecon has not hedged. Such translation exposure will have an impact on Aecon’s consolidated financial results. Practical and cost-effective hedging options to fully hedge this longer-term translational exposure are not generally available.
Cybersecurity Threats
Aecon has established and continues to enhance security controls which protect its information systems and infrastructure, and which meet or exceed its obligations under applicable law or professional standards. The Company’s Information Services Security Group oversees the cybersecurity and risk mitigation strategy in coordination with Information Services and in consultation with the Board. Aecon is IT general controls (“ITGC”) certified and aligns to the National Institute of Standards and Technology Cybersecurity Framework. Aecon annually conducts a comprehensive assessment with third party auditors in order to re-certify its compliance with the ITGC principles. While audits occur annually, information security risk reviews and assessments are conducted more frequently in accordance with established processes to ensure that Aecon’s security controls are protecting the Company’s information systems and infrastructure on an ongoing basis. Aecon has also established safeguards to ensure that appropriate physical access controls are in place to protect the Company’s facilities and information technology resources from unauthorized access. The Company has a cyber insurance policy which provides broad coverage of cyber incidents as well as third party costs as a result of breaches and costs to restore, recreate or recollect electronic data.
Aecon relies on information technology systems to manage its operations, including for reporting its results of operations, collection and storage of client data, personal data of employees and other stakeholders, and various other processes and transactions. Some of these systems are managed by third-party service providers. Aecon has similar exposure to security risks faced by other large companies that have data stored on their information technology systems. Given the rapid evolution and sophisticated level of cyber incidents, all the foregoing security measures and controls may not be sufficient to prevent third party access of digital data from Aecon’s or its third-party service providers’ systems with the intent to misappropriate information, corrupt data or cause operational disruptions. Such incidents could cause delays in the Company’s operations and construction projects, result in lost revenues due to a disruption of activities, lead to the loss, destruction, inappropriate use or theft of confidential data, or result in theft of confidential information, including the Company’s or its clients’ or joint venture partners’ intellectual property. If any of the foregoing events occurs, the Company may be exposed to a number of consequences, including potential litigation or regulatory actions and reputational damage, which could have a material adverse effect on the Company.
Interruption or Failure of Information Systems
Aecon relies extensively on information systems, data and communication networks to effectively manage its operations. Complete, accurate, available and secure information is vital to the Company’s operations and any compromise in such information could result in improper decision making, inaccurate or delayed operational and/or financial reporting, delayed resolution to problems, breach of privacy and/or unintended disclosure of confidential materials. Failure in the completeness, accuracy, availability or security of Aecon’s information systems, the risk of system interruption or failure during system upgrades or implementation, or a breach of data security could adversely affect the Company’s operations and financial results.
2019 Annual Report34

Internal and Disclosure Controls
Inadequate disclosure controls or ineffective internal controls over financial reporting could result in an increased risk of material misstatements in the financial reporting and public disclosure record of Aecon. Inadequate controls could also result in system downtime, give rise to litigation or regulatory investigation, fraud or the inability of Aecon to continue its business as presently constituted. Aecon has designed and implemented a system of internal controls and a variety of policies and procedures to provide reasonable assurance that material misstatements in the financial reporting and public disclosures are prevented and detected on a timely basis and other business risks are mitigated. In accordance with the guidelines adopted in Canada, Aecon assesses the effectiveness of its internal and disclosure controls using a top-down, risk-based approach in which both qualitative and quantitative measures are considered. An internal control system, no matter how well conceived and operated, can provide only reasonable – not absolute – assurance to management and the Board regarding achievement of intended results. Aecon’s current system of internal and disclosure controls places reliance on key personnel across the Company to perform a variety of control functions including key reviews, analysis, reconciliations and monitoring. The failure of individuals to perform such functions or properly implement the controls as designed could adversely impact results.
Integration and Acquisition Risk
The integration of any acquisition raises a variety of issues including, without limitation, identification and execution of synergies, elimination of cost duplication, systems integration (including accounting and information technology), execution of the pre-deal business strategy in an uncertain economic market, development of common corporate culture and values, integration and retention of key staff, retention of current clients as well as a variety of issues that may be specific to Aecon and the industry in which it operates. There can be no assurance that Aecon will maximize or realize the full potential of any of its acquisitions. A failure to successfully integrate acquisitions and execute a combined business plan could materially impact the future financial results of Aecon. Likewise, a failure to expand the existing client base and achieve sufficient utilization of the assets acquired could also materially impact the future financial results of Aecon.
Loss of Key Management and Inability to Attract and Retain Key Staff
The Company’s future prospects depend to a significant extent on the continued service of its key executives and staff. Furthermore, the Company’s continued growth and future success depends on its ability to identify, recruit, assimilate and retain key management, technical, project and business development personnel. The competition for such employees, particularly during periods of high demand in certain sectors, is intense and there can be no assurance that the Company will be successful in identifying, recruiting or retaining such personnel.
Adjustments in Backlog
There can be no assurance that the revenues projected in Aecon’s backlog at any given time will be realized or, if realized, that they will perform as expected with respect to margin. Projects may from time to time remain in backlog for an extended period of time prior to contract commencement, and after commencement may occur unevenly over current and future earnings periods. Project suspensions, terminations or reductions in scope do occur from time to time in the construction industry due to considerations beyond the control of a contractor such as Aecon and may have a material impact on the amount of reported backlog with a corresponding impact on future revenues and profitability. A variety of factors outlined in these “Risk Factors” including, without
Aecon Group Inc. 35

limitation, conditions in the oil sands or other resource related sectors and the impact of economic weakness could lead to project delays, reductions in scope and/or cancellations which could, depending on severity, negatively affect the ability of the Company to replace its existing backlog, which may adversely impact results.
Tax Accrual Risks
Aecon is subject to income taxes in Canada and several foreign jurisdictions. Significant judgment is required in determining the Company’s worldwide provision for income taxes. In the ordinary course of business, there are many transactions and calculations where the ultimate tax determination is uncertain. Although Aecon believes its tax estimates are reasonable, there can be no assurance that the final determination of any tax audits and litigation will not be materially different from that reflected in historical income tax provisions and accruals. Although management believes it adequately provides for any additional taxes that may be assessed as a result of an audit or litigation, the occurrence of either of these events could have a material adverse effect on the Company’s current and future results and financial condition.
Public Procurement Laws and Regulations
As part of its business dealings with governmental bodies, Aecon must comply with public procurement laws and regulations aimed at ensuring that public sector bodies award contracts in a transparent, competitive, efficient, ethical and non-discriminatory way. Although Aecon has adopted control measures and implemented policies and procedures to mitigate such risks, these control measures, policies and procedures may not always be sufficient to protect the Company from the consequences of acts prohibited by public procurement laws and regulations committed by its directors, officers, employees and agents. For a detailed description of the Company’s exposure to corruption and bribery risks, see “Risk Factors – International/Foreign Jurisdiction Factors” herein. If Aecon fails to comply with these laws and regulations it could be subject to administrative or civil liabilities and to mandatory or discretionary exclusion or suspension, on a permanent or temporary basis, from contracting with governmental bodies in addition to other penalties and sanctions that could be incurred by the Company.
Reputation in the Construction Industry
Reputation and goodwill play an important role in the long-term success of any company in the construction industry. Negative opinion may impact long-term results and can arise from a number of factors including perceived competence, losses on specific projects, questions concerning business ethics and integrity, corporate governance, environmental and climate change awareness, the accuracy and quality of financial reporting and public disclosure as well as the quality and timing of the delivery of key products and services. Aecon has implemented various procedures and policies to help mitigate this risk including the adoption of a comprehensive Code which all employees are expected to review and abide by. Nevertheless, the adoption of corporate policies and training of employees cannot guarantee that a future breach or breaches of the Code or other corporate policies will not occur which may or may not impact the financial results of the Company.
Increases in the Cost of Raw Materials
The cost of raw materials represents a significant component of Aecon’s operating expenses. As contractors are not always able to pass such risks on to their customers, unexpected increases in the cost of raw materials may negatively impact the Company’s results. At times, the global availability of basic construction materials such as cement and steel can be impacted by high periods of demand which can result in significant price fluctuations, price escalation and periodic supply shortages. Tariffs on raw materials between nations may also
2019 Annual Report36
impact the cost of raw materials from time to time. Unanticipated fluctuations in the costs of raw materials may add a significant risk to many vendors and subcontractors, some of whom may respond by no longer guaranteeing price or availability on long-term contracts, which in turn increases the risk for contractors who are not always able to pass this risk on to their customers.
Impairment in the Value of Aecon’s Assets
New events or circumstances may lead Aecon to reassess the value of goodwill, property, plant and equipment, and other non-financial assets, and record a significant impairment loss, which could have a material adverse effect on its financial position. Aecon’s financial assets, other than those accounted for at fair value, are assessed for indicators of impairment quarterly. Financial assets are considered impaired when there is objective evidence that estimated future cash flows of the investment have been affected by one or more events that occurred after the initial recognition of the financial asset. In such a case, Aecon may be required to reduce carrying values to their estimated fair value. Aecon’s estimates of future cash flows are inherently subjective which could have a significant impact on the analysis. Further, there could be a material adverse effect on Aecon’s financial position from any future write-offs or write-downs of Aecon’s assets or in the carrying value of its investments.
Force Majeure Events
The Company is exposed to various risks arising out of extraordinary or force majeure events beyond the Company’s control, such as epidemics or pandemics, acts of war, terrorism, strikes, protests or social or political unrest generally. Such events could disrupt the Company’s operations, result in shortages of materials and equipment, cause supply chain delays or delivery failures, or lead to the realization of or exacerbate the impact of other risk factors. To the extent that such risks are not mitigated contractually through provisions that provide the Company with relief from its schedule obligations and/or cost reimbursement, the Company’s financial condition, results of operations or cash flows may be adversely affected.
In particular, reliance on global networks and supply chains, rates of international travel and the significant number of people living in high-density urban environments increase humanity’s susceptibility to infectious disease. Epidemics occurring in regions in which Aecon operates and pandemics that pose a global threat can negatively impact business operations by disrupting the supply chain and causing high absenteeism across the workforce. Similarly, disasters arising from extraordinary or force majeure events may result in disruptions resulting from the evacuation of personnel, cancellation of contracts, or the loss of workforce, contractors or assets. In addition, a disaster may disrupt public and private infrastructure, including communications and financial services, which could disrupt the Company’s normal business operations.
Aecon has implemented a business continuity plan to assist with preparing for, and managing the impact of, an extraordinary or force majeure event by identifying core services, developing a communications strategy and protecting the health and safety of its employees. While the business continuity plan may mitigate the impact of an extraordinary or force majeure event, minimize recovery time and reduce business losses, the plan cannot account for all possible unexpected events. An extraordinary or force majeure event therefore may have material adverse financial implications for the Company.
Aecon Group Inc. 37

Outsourced Software
Aecon relies on third party providers of software and infrastructure to run critical accounting, project management and financial systems. Discontinuation of development or maintenance of third-party software and infrastructure could cause a disruption in Aecon’s systems.
Protection of Intellectual Property and Proprietary Rights
The Company depends, in part, on its ability to protect its intellectual property rights. Aecon relies primarily on patent, copyright, trademark and trade secret laws to protect its proprietary technologies. The failure of any patents or other intellectual property rights to provide protection to Aecon’s technologies would make it easier for competitors to offer similar products, which could result in lower sales or gross margin.
The Company’s trademarks and trade names are registered in Canada and the United States and the Company intends to keep these filings current and seek protection for new trademarks to the extent consistent with business needs. The Company relies on trade secrets and proprietary know-how and confidentiality agreements to protect certain of its technologies and processes.
Outstanding Share Data
Aecon is authorized to issue an unlimited number of common shares. The following are details of common shares outstanding and securities that are convertible into common shares.
In thousands of dollars (except share amounts) March 3, 2020 Number of common shares outstanding 60,328,513 Outstanding securities exchangeable or convertible into common shares:
Principal amount of convertible debentures outstanding
(see Note 19 to the December 31, 2019 consolidated financial statements) $ 177,058
Number of common shares issuable on conversion of convertible debentures 7,666,667
Increase in paid-up capital on conversion of convertible debentures $ 177,058
DSUs and RSUs outstanding under the Long-Term Incentive Plan and the Director DSU Plan 2,723,072
2019 Annual Report38

OUTLOOK Canada continues to see significant infrastructure investment commitments across the country by all levels of government as well as by non-resource driven segments of the private sector. This investment focuses primarily on civil infrastructure, urban transportation systems, nuclear power, and utility and pipeline infrastructure, which aligns with Aecon’s strengths. As a result of this robust demand environment, the Company has a strong program of work going forward, represented by near record backlog at the end of 2019 of $6.8 billion. This is supplemented by significant ongoing revenue from recurring work under long-term agreements and concession arrangements and a strong list of significant project pursuits going forward. Of Aecon’s $6.8 billion of backlog at the end of 2019, approximately 42%, or $2.8 billion, is expected to be worked off in the next 12 months compared to 29%, or $2.0 billion, at the end of 2018. This strong future revenue profile supports an expectation for solid revenue and Adjusted EBITDA growth in 2020. Construction segment backlog at the end of 2019 was $6.7 billion compared to $6.8 billion at the same time last year. Bidding activity continues to be solid with a number of the Company’s larger pursuits expected to be awarded in 2020. Aecon continues to be well positioned to successfully bid on, secure and deliver major infrastructure projects for government and the private sector, as demonstrated by the approximately $1 billion Pattullo Bridge project which was awarded to a joint venture in which Aecon has a 50% interest, in the first quarter of 2020. With strong and diverse backlog in hand, Aecon is focused on ensuring solid execution on its projects and selectively adding backlog through a disciplined bidding approach that supports continued margin improvement in this segment. The Concessions segment continues to partner with Aecon’s Construction segment to focus on the significant number of P3 opportunities in Canada and on a selected basis internationally. The Concessions segment is actively pursuing a number of large-scale infrastructure projects that require private finance solutions as well as participating as a concessionaire on the Finch West LRT, Waterloo LRT, Eglinton Crosstown LRT, Gordie Howe International Bridge and the Bermuda International Airport Redevelopment projects. Construction related to the Bermuda International Airport Redevelopment is expected to be completed during the third or early fourth quarter of 2020. Once construction ends and the new terminal opens, interest related to the non-recourse debt financing of this project will no longer be capitalized and instead will be reported as interest expense. On an annualized basis, this interest expense is approximately $20 million. At the same time, the concession right relating to operation of the previously existing terminal will be fully amortized, and amortization of the newly constructed terminal will begin over the remaining approximate 27-year concession life. The net impact on amortization expense, on an annualized basis, is expected to be a reduction of approximately $10 million. Neither of these accounting changes, driven by opening of the new terminal, will have any impact on Aecon’s cash flow. Capital expenditures in 2020 are expected to be similar to 2019. The overall outlook for 2020 remains strong as Aecon’s current backlog and recurring revenue contracts, robust pipeline of future opportunities, and ongoing concessions are expected to lead to another year of revenue and Adjusted EBITDA growth in 2020.
Aecon Group Inc. 39

AECON GROUP INC.
CONSOLIDATED FINANCIAL STATEMENTS December 31, 2019
2019 Annual Report40

CONSOLIDATED FINANCIAL STATEMENTS DECEMBER 31, 2019 AND 2018 TABLE OF CONTENTS
INDEPENDENT AUDITOR’S REPORT ................................................................................................ 42CONSOLIDATED BALANCE SHEETS ................................................................................................ 45CONSOLIDATED STATEMENTS OF INCOME ................................................................................... 46CONSOLIDATED STATEMENTS OF COMPREHENSIVE INCOME ................................................... 47CONSOLIDATED STATEMENTS OF CHANGES IN EQUITY ............................................................. 48CONSOLIDATED STATEMENTS OF CASH FLOWS .......................................................................... 49NOTES TO THE CONSOLIDATED FINANCIAL STATEMENTS .......................................................... 501. CORPORATE INFORMATION ......................................................................................................... 502. DATE OF AUTHORIZATION FOR ISSUE ........................................................................................ 503. BASIS OF PRESENTATION ............................................................................................................ 504. CRITICAL ACCOUNTING ESTIMATES ........................................................................................... 515. SUMMARY OF SIGNIFICANT ACCOUNTING POLICIES ............................................................... 556. CHANGES IN ACCOUNTING POLICIES ......................................................................................... 717. FUTURE ACCOUNTING CHANGES ............................................................................................... 748. CASH AND CASH EQUIVALENTS, AND RESTRICTED CASH ...................................................... 759. TRADE AND OTHER RECEIVABLES .............................................................................................. 7510. UNBILLED REVENUE AND DEFERRED REVENUE .................................................................... 7611. INVENTORIES ............................................................................................................................... 7612. PROJECTS ACCOUNTED FOR USING THE EQUITY METHOD ................................................. 7713. PROPERTY, PLANT AND EQUIPMENT ........................................................................................ 7914. INTANGIBLE ASSETS ................................................................................................................... 8015. BANK INDEBTEDNESS ................................................................................................................. 8216. TRADE AND OTHER PAYABLES .................................................................................................. 8217. PROVISIONS ................................................................................................................................. 8318. LONG-TERM DEBT AND NON-RECOURSE PROJECT DEBT .................................................... 8419. CONVERTIBLE DEBENTURES ..................................................................................................... 8620. CONCESSION RELATED DEFERRED REVENUE ....................................................................... 8721. INCOME TAXES ............................................................................................................................. 8822. EMPLOYEE BENEFIT PLANS ....................................................................................................... 9023. CONTINGENCIES .......................................................................................................................... 9324. CAPITAL STOCK ............................................................................................................................ 9425. EXPENSES .................................................................................................................................... 9726. OTHER INCOME ............................................................................................................................ 9827. FINANCE COST .............................................................................................................................28. EARNINGS PER SHARE ............................................................................................................... 9929. SUPPLEMENTARY CASH FLOW INFORMATION ........................................................................ 9930. FINANCIAL INSTRUMENTS ........................................................................................................ 10031. CAPITAL DISCLOSURES ............................................................................................................ 10432. OPERATING SEGMENTS ........................................................................................................... 10533. REMAINING PERFORMANCE OBLIGATIONS ........................................................................... 10834. RELATED PARTIES ..................................................................................................................... 10935. SUBSEQUENT EVENT ................................................................................................................ 111
Aecon Group Inc. 41
98

PricewaterhouseCoopers LLP PwC Tower, 18 York Street, Suite 2600, Toronto, Ontario, Canada M5J 0B2 T: +1 416 863 1133, F: +1 416 365 8215
Independent auditor’s report
To the Shareholders of Aecon Group Inc.
Our opinion
In our opinion, the accompanying consolidated financial statements present fairly, in all material respects, the financial position of Aecon Group Inc. and its subsidiaries (together, the Company) as at December 31, 2019 and 2018, and its financial performance and its cash flows for the years then ended in accordance with International Financial Reporting Standards as issued by the International Accounting Standards Board (IFRS).
What we have audited The Company’s consolidated financial statements comprise:
the consolidated balance sheets as at December 31, 2019 and 2018;
the consolidated statements of income for the years then ended;
the consolidated statements of comprehensive income for the years then ended;
the consolidated statements of changes in equity for the years then ended;
the consolidated statements of cash flows for the years then ended; and
the notes to the consolidated financial statements, which include a summary of significant accounting policies.
Basis for opinion
We conducted our audit in accordance with Canadian generally accepted auditing standards. Our responsibilities under those standards are further described in the Auditor’s responsibilities for the audit of the consolidated financial statements section of our report.
We believe that the audit evidence we have obtained is sufficient and appropriate to provide a basis for our opinion.
Independence We are independent of the Company in accordance with the ethical requirements that are relevant to our audit of the consolidated financial statements in Canada. We have fulfilled our other ethical responsibilities in accordance with these requirements.
Other information
Management is responsible for the other information. The other information comprises the Management’s Discussion and Analysis, which we obtained prior to the date of this auditor’s report and the information, other than the consolidated financial statements and our auditor’s report thereon, included in the annual report, which is expected to be made available to us after that date.
“PwC” refers to PricewaterhouseCoopers LLP, an Ontario limited liability partnership.
2019 Annual Report42

Our opinion on the consolidated financial statements does not cover the other information and we do not and will not express an opinion or any form of assurance conclusion thereon.
In connection with our audit of the consolidated financial statements, our responsibility is to read the other information identified above and, in doing so, consider whether the other information is materially inconsistent with the consolidated financial statements or our knowledge obtained in the audit, or otherwise appears to be materially misstated.
If, based on the work we have performed on the other information that we obtained prior to the date of this auditor’s report, we conclude that there is a material misstatement of this other information, we are required to report that fact. We have nothing to report in this regard. When we read the information, other than the consolidated financial statements and our auditor’s report thereon, included in the annual report, if we conclude that there is a material misstatement therein, we are required to communicate the matter to those charged with governance.
Responsibilities of management and those charged with governance for the consolidated financial statements
Management is responsible for the preparation and fair presentation of the consolidated financial statements in accordance with IFRS, and for such internal control as management determines is necessary to enable the preparation of consolidated financial statements that are free from material misstatement, whether due to fraud or error.
In preparing the consolidated financial statements, management is responsible for assessing the Company’s ability to continue as a going concern, disclosing, as applicable, matters related to going concern and using the going concern basis of accounting unless management either intends to liquidate the Company or to cease operations, or has no realistic alternative but to do so.
Those charged with governance are responsible for overseeing the Company’s financial reporting process.
Auditor’s responsibilities for the audit of the consolidated financial statements
Our objectives are to obtain reasonable assurance about whether the consolidated financial statements as a whole are free from material misstatement, whether due to fraud or error, and to issue an auditor’s report that includes our opinion. Reasonable assurance is a high level of assurance, but is not a guarantee that an audit conducted in accordance with Canadian generally accepted auditing standards will always detect a material misstatement when it exists. Misstatements can arise from fraud or error and are considered material if, individually or in the aggregate, they could reasonably be expected to influence the economic decisions of users taken on the basis of these consolidated financial statements.
As part of an audit in accordance with Canadian generally accepted auditing standards, we exercise professional judgment and maintain professional skepticism throughout the audit. We also:
Identify and assess the risks of material misstatement of the consolidated financial statements, whether due to fraud or error, design and perform audit procedures responsive to those risks, and obtain audit evidence that is sufficient and appropriate to provide a basis for our opinion. The risk of not detecting a material misstatement resulting from fraud is higher than for one resulting from error, as fraud may involve collusion, forgery, intentional omissions, misrepresentations, or the override of internal control.
Aecon Group Inc. 43

Obtain an understanding of internal control relevant to the audit in order to design audit procedures that are appropriate in the circumstances, but not for the purpose of expressing an opinion on the effectiveness of the Company’s internal control.
Evaluate the appropriateness of accounting policies used and the reasonableness of accounting estimates and related disclosures made by management.
Conclude on the appropriateness of management’s use of the going concern basis of accounting and, based on the audit evidence obtained, whether a material uncertainty exists related to events or conditions that may cast significant doubt on the Company’s ability to continue as a going concern. If we conclude that a material uncertainty exists, we are required to draw attention in our auditor’s report to the related disclosures in the consolidated financial statements or, if such disclosures are inadequate, to modify our opinion. Our conclusions are based on the audit evidence obtained up to the date of our auditor’s report. However, future events or conditions may cause the Company to cease to continue as a going concern.
Evaluate the overall presentation, structure and content of the consolidated financial statements, including the disclosures, and whether the consolidated financial statements represent the underlying transactions and events in a manner that achieves fair presentation.
Obtain sufficient appropriate audit evidence regarding the financial information of the entities or business activities within the Company to express an opinion on the consolidated financial statements. We are responsible for the direction, supervision and performance of the group audit. We remain solely responsible for our audit opinion.
We communicate with those charged with governance regarding, among other matters, the planned scope and timing of the audit and significant audit findings, including any significant deficiencies in internal control that we identify during our audit.
We also provide those charged with governance with a statement that we have complied with relevant ethical requirements regarding independence, and to communicate with them all relationships and other matters that may reasonably be thought to bear on our independence, and where applicable, related safeguards.
The engagement partner on the audit resulting in this independent auditor’s report is Daniel D’Archivio.
Chartered Professional Accountants, Licensed Public Accountants
Toronto, Ontario March 3, 2020
2019 Annual Report44

CONSOLIDATED BALANCE SHEETS
AS AT DECEMBER 31, 2019 AND DECEMBER 31, 2018
(in thousands of Canadian dollars) December 31 December 31 2019 2018 Note ASSETS Current assets Cash and cash equivalents 8 $ 682,264 $ 630,976 Restricted cash 8 76,595 193,369 Trade and other receivables 9 682,105 697,611 Unbilled revenue 10 598,858 573,678 Inventories 11 24,899 20,751 Income tax recoverable 9,576 3,980 Prepaid expenses 55,107 26,448 2,129,404 2,146,813 Non-current assets Long-term financial assets 7,136 12,055 Projects accounted for using the equity method 12 45,513 39,475 Deferred income tax assets 21 26,725 22,507 Property, plant and equipment 13 351,404 266,199 Intangible assets 14 554,456 445,643 985,234 785,879 TOTAL ASSETS $ 3,114,638 $ 2,932,692
LIABILITIES Current liabilities Trade and other payables 16 773,734 705,760 Provisions 17 20,473 14,695 Deferred revenue 10 483,128 508,306 Income taxes payable 20,437 2,644 Current portion of long-term debt 18 60,071 32,505 1,357,843 1,263,910 Non-current liabilities Provisions 17 6,348 5,514 Non-recourse project debt 18 365,894 383,746 Long-term debt 18 145,682 69,707 Convertible debentures 19 164,351 159,775 Concession related deferred revenue 20 101,369 106,330 Deferred income tax liabilities 21 115,087 117,626 Other liabilities 68 1,022 898,799 843,720 TOTAL LIABILITIES 2,256,642 2,107,630
EQUITY Capital stock 24 394,291 386,453 Convertible debentures 19 12,707 12,707 Contributed surplus 48,858 47,006 Retained earnings 403,821 369,505 Accumulated other comprehensive income (loss) (1,681) 9,391 TOTAL EQUITY 857,996 825,062 TOTAL LIABILITIES AND EQUITY $ 3,114,638 $ 2,932,692
Contingencies (Note 23)
Approved by the Board of Directors John M. Beck, Director Deborah S. Stein, Director
The accompanying notes are an integral part of these consolidated financial statements
Aecon Group Inc. 45

CONSOLIDATED STATEMENTS OF INCOME
FOR THE YEARS ENDED DECEMBER 31, 2019 AND 2018
(in thousands of Canadian dollars, except per share amounts) December 31 December 31 2019 2018 Note Revenue $ 3,460,418 $ 3,266,291 Direct costs and expenses 25 (3,092,814) (2,909,171)Gross profit 367,604 357,120
Marketing, general and administrative expense 25 (183,434) (178,522)Depreciation and amortization 25 (94,127) (103,832)Income from projects accounted for using the equity method 12 12,491 13,150 Other income 26 4,737 1,506 Operating profit 107,271 89,422
Finance income 2,060 1,256 Finance cost 27 (22,557) (23,651)Profit before income taxes 86,774 67,027 Income tax expense 21 (13,921) (8,013)Profit for the year $ 72,853 $ 59,014
Basic earnings per share 28 $ 1.20 $ 0.99 Diluted earnings per share 28 $ 1.12 $ 0.94
The accompanying notes are an integral part of these consolidated financial statements
2019 Annual Report46

CONSOLIDATED STATEMENTS OF COMPREHENSIVE INCOME
FOR THE YEARS ENDED DECEMBER 31, 2019 AND 2018
(in thousands of Canadian dollars) December 31 December 31 2019 2018 Profit for the year $ 72,853 $ 59,014 Other comprehensive income (loss): Items that will not be reclassified to profit or loss: Actuarial gain - employee benefit plans 1,293 1,067 Income taxes on the above (346) (285) 947 782 Items that may be reclassified subsequently to profit or loss: Currency translation differences - foreign operations (4,446) 5,408 Cash flow hedges - equity accounted investees (3,006) (6,085) Cash flow hedges - joint operations (7,298) 10,949 Income taxes on the above 2,731 (1,288)Total other comprehensive income (loss) for the year (11,072) 9,766 Comprehensive income for the year $ 61,781 $ 68,780
The accompanying notes are an integral part of these consolidated financial statements
Aecon Group Inc. 47

CONSOLIDATED STATEMENTS OF CHANGES IN EQUITY
FOR THE YEARS ENDED DECEMBER 31, 2019 AND 2018
(in thousands of Canadian dollars, except per share amounts)
Accumulated other comprehensive
income (loss)
Currency Actuarial Cash
Capital Convertible Contributed Retained translation gains and flow Shareholders'stock debentures surplus earnings differences losses hedges equity
Balance as at December 31, 2018 $ 386,453 $ 12,707 $ 47,006 $ 369,505 $ 3,748 $ 1,227 $ 4,416 $ 825,062
Change in accounting policy (see Note 6) - - - 1,336 - - - 1,336
Adjusted balance as at January 1, 2019 386,453 12,707 47,006 370,841 3,748 1,227 4,416 826,398
Profit for the year - - - 72,853 - - - 72,853
Other comprehensive income (loss):
Currency translation differences - foreign operations - - - - (4,446) - - (4,446)
Actuarial gain - employee benefit plans - - - - - 1,293 - 1,293
Cash flow hedges - equity-accounted investees - - - - - - (3,006) (3,006)
Cash flow hedges - joint operations - - - - - - (7,298) (7,298)
Taxes with respect to above items included in other comprehensive income
- - - - - (346) 2,731 2,385
Total other comprehensive income (loss) for the year - - - - (4,446) 947 (7,573) (11,072)
Total comprehensive income (loss) for the year - - - 72,853 (4,446) 947 (7,573) 61,781
Dividends declared - - - (35,222) - - - (35,222)
Common shares purchased under Normal Course Issuer Bid (2,566) - - (4,651) - - - (7,217)
Stock-based compensation - - 14,769 - - - - 14,769
Shares issued to settle LTIP/Director DSU obligations 10,404 - (10,404) - - - - -
Other LTIP Settlements - - (3,135) - - - - (3,135)
ESU cash receipts - - 622 - - - - 622
Balance as at December 31, 2019 $ 394,291 $ 12,707 $ 48,858 $ 403,821 $ (698) $ 2,174 $ (3,157) $ 857,996
Accumulated other comprehensive
income (loss)
Currency Actuarial Cash
Capital Convertible Contributed Retained translation gains and flow Shareholders'
stock debentures surplus earnings differences losses hedges equity
Balance as at January 1, 2018 $ 367,612 $ 8,664 $ 39,604 $ 340,470 $ (1,660) $ 445 $ 840 $ 755,975
Profit for the year - - - 59,014 - - - 59,014
Other comprehensive income (loss):
Currency translation differences - foreign operations - - - - 5,408 - - 5,408
Actuarial gains - employee benefit plans - - - - - 1,067 - 1,067
Cash flow hedges - equity-accounted investees - - - - - - (6,085) (6,085)
Cash flow hedges - joint operations - - - - - - 10,949 10,949
Taxes with respect to above items included in other comprehensive income
- - - - - (285) (1,288) (1,573)
Total other comprehensive income for the year - - - - 5,408 782 3,576 9,766
Total comprehensive income for the year - - - 59,014 5,408 782 3,576 68,780
Dividends declared - - - (29,979) - - - (29,979)
Common shares issued on exercise of options 1,751 - (319) - - - - 1,432
Repayment of 5.5% Debentures - (8,499) 8,499 - - - - -
Issuance of 5.0% Debentures - 12,707 - - - - - 12,707
Common shares issued on conversion of 5.5% Debentures 3,379 (165) - - - - - 3,214
Stock-based compensation - - 14,222 - - - - 14,222
Shares issued to settle LTIP/Director DSU obligations 13,711 - (13,711) - - - - -
Other LTIP Settlements - - (1,289) - - - - (1,289)
Balance as at December 31, 2018 $ 386,453 $ 12,707 $ 47,006 $ 369,505 $ 3,748 $ 1,227 $ 4,416 $ 825,062
During the year ended December 31, 2019, the Company declared dividends amounting to $0.58 per share (December 31, 2018 - $0.50 per share).
The accompanying notes are an integral part of these consolidated financial statements
2019 Annual Report48

CONSOLIDATED STATEMENTS OF CASH FLOWS
FOR THE YEARS ENDED DECEMBER 31, 2019 AND 2018
(in thousands of Canadian dollars) December 31 December 31 2019 2018 Note CASH PROVIDED BY (USED IN) Operating activities Profit before income taxes $ 86,774 $ 67,027 Income taxes paid (6,739) (1,821) Defined benefit pension 466 (226) Items not affecting cash: Depreciation and amortization 94,127 103,832 Income from projects accounted for using the equity method (12,491) (13,150) Gain on sale of assets (3,700) (466) Income from leasehold inducements - (478) Unrealized foreign exchange (gain) loss (2,773) 985 Increase in provisions 11,846 11,526 Notional interest representing accretion 5,045 5,328 Stock-based compensation 14,769 14,222 Change in other balances relating to operations 29 11,138 181,900 198,462 368,679 Investing activities Decrease in restricted cash balances 109,911 105,135 Purchase of property, plant and equipment (41,841) (47,353) Proceeds on sale of contract mining business 22,000 150,828 Proceeds on sale of property, plant and equipment 7,673 7,669 Investment in concession rights (161,982) (163,872) Increase in intangible assets (1,495) (3,347) Increase in long-term financial assets (1,509) (10,229) Distributions from projects accounted for using the equity method 4,889 200 Increase in other investments (3,751) - (66,105) 39,031 Financing activities Decrease in bank indebtedness - (17,940) Issuance of long-term debt 20,073 12,813 Repayments of lease liabilities (40,450) (25,907) Repayments of long-term debt (13,976) (31,325) Repayment of 5.5% Debentures - (169,022) Issuance of capital stock - 1,432 Stock based compensation settlements and receipts (2,513) (1,289) Dividends paid (33,976) (29,831) Issuance of 5.0% Debentures - 175,940 Common shares purchased under NCIB (7,217) - (78,059) (85,129) Increase in cash and cash equivalents during the year 54,298 322,581 Effect of foreign exchange on cash balances (3,010) 3,513 Cash and cash equivalents - beginning of year 630,976 304,882
Cash and cash equivalents - end of year 8 $ 682,264 $ 630,976
See Note 29 for additional disclosures relating to the Consolidated Statements of Cash Flows.
The accompanying notes are an integral part of these consolidated financial statements
Aecon Group Inc. 49

NOTES TO THE CONSOLIDATED FINANCIAL STATEMENTS DECEMBER 31, 2019 AND 2018 (in thousands of Canadian dollars, except per share amounts)
1. CORPORATE INFORMATION Aecon Group Inc. (“Aecon” or the “Company”) is a publicly traded construction and infrastructure development company incorporated in Canada. Aecon and its subsidiaries provide services to private and public sector clients throughout Canada and on a selected basis internationally. Its registered office is located in Toronto, Ontario at 20 Carlson Court, Suite 105, M9W 7K6. The Company operates in two segments within the infrastructure development industry: Construction and Concessions. Refer to Note 34 “Related Parties,” for further details on the Company’s subsidiaries and significant joint arrangements and associates. 2. DATE OF AUTHORIZATION FOR ISSUE The consolidated financial statements of the Company were authorized for issue on March 3, 2020 by the Board of Directors of the Company. 3. BASIS OF PRESENTATION Basis of presentation The Company prepares its consolidated financial statements in accordance with International Financial Reporting Standards as issued by the International Accounting Standards Board (“IFRS”). Statement of compliance These consolidated financial statements have been prepared in accordance with and comply with IFRS. Basis of measurement The consolidated financial statements have been prepared under the historical cost convention, except for the revaluation of certain financial assets and financial liabilities to fair value, including derivative instruments. Principles of consolidation The consolidated financial statements include the accounts of the Company and all of its subsidiaries. In addition, the Company’s participation in joint arrangements classified as joint operations is accounted for in the consolidated financial statements by reflecting, line by line, the Company’s share of the assets held jointly, liabilities incurred jointly, and revenue and expenses arising from the joint operations. The consolidated financial statements also include the Company’s investment in and share of the earnings of projects accounted for using the equity method.
2019 Annual Report50

NOTES TO THE CONSOLIDATED FINANCIAL STATEMENTS DECEMBER 31, 2019 AND 2018 (in thousands of Canadian dollars, except per share amounts)
4. CRITICAL ACCOUNTING ESTIMATES The preparation of the Company’s consolidated financial statements requires management to make judgments, estimates and assumptions that affect the reported amounts of revenue, expenses, assets and liabilities, and the disclosure of contingent liabilities. Uncertainty about these assumptions and estimates could result in a material adjustment to the carrying value of the asset or liability affected. Critical accounting estimates are those that require management to make assumptions about matters that are highly uncertain at the time the estimate or assumption is made. Critical accounting estimates are also those that could potentially have a material impact on the Company’s financial results were a different estimate or assumption used. Estimates and underlying assumptions are reviewed on an ongoing basis. These estimates and assumptions are subject to change at any time based on experience and new information. Revisions to accounting estimates are recognized in the period in which the estimates are revised and in any future periods affected. Critical accounting estimates are also not specific to any one segment unless otherwise noted below. The Company’s significant accounting policies are described in Note 5, “Summary of Significant Accounting Policies.” The following discussion is intended to describe those judgments and key assumptions concerning major sources of estimation uncertainty at the end of the reporting period that have the most significant risk of resulting in a material adjustment to the carrying amount of assets and liabilities within the next financial year. 4.1 MAJOR SOURCES OF ESTIMATION UNCERTAINTY REVENUE AND GROSS PROFIT RECOGNITION Revenue and income from fixed price construction contracts, including contracts in which the Company participates through joint operations, are determined on the percentage of completion method, based on the ratio of costs incurred to date over estimated total costs. The Company has a process whereby progress on jobs is reviewed by management on a regular basis and estimated costs to complete are updated. However, due to unforeseen changes in the nature or cost of the work to be completed or performance factors, contract profit can differ significantly from earlier estimates. The Company’s estimates of contract revenue and cost are highly detailed. Management believes, based on its experience, that its current systems of management and accounting controls allow the Company to produce materially reliable estimates of total contract revenue and cost during any accounting period. However, many factors can and do change during a contract performance period, which can result in a change to contract profitability from one financial reporting period to another. Some of the factors that can change the estimate of total contract revenue and cost include differing site conditions (to the extent that contract remedies are unavailable), the availability of skilled contract labour, the performance of major material suppliers to deliver on time, the performance of major subcontractors, unusual weather conditions and the accuracy of the original bid estimate. Fixed price contracts are common across all of the Company’s sectors, as are change orders and claims, and therefore these estimates are not unique to one core segment. Because the Company has many contracts in process at any given time, these changes in estimates can offset each other without impacting overall profitability. Changes in cost estimates, which on larger, more complex construction projects can have a material impact on the Company’s consolidated financial statements, are reflected in the results of operations when they become known. A change order results from a change to the scope of the work to be performed compared to the original contract that was signed. Unpriced change orders are change orders that have been approved as to scope but unapproved as to price. Claims are amounts in excess of the agreed contract price, or amounts not included in the original contract price, that the Company seeks to collect from clients for delays, errors in specifications and designs, contract terminations, change orders in dispute or unapproved as to both scope and price, or other causes of unanticipated additional costs. In accordance with the Company’s accounting policy, unpriced change orders and claims are recognized in revenue at the most likely amount the Company expects to be entitled, and to the extent it is highly probable that a significant reversal of cumulative revenue recognized will not occur when the uncertainty associated with the variable consideration is resolved. Therefore, it is possible for the Company to have substantial contract costs recognized in one accounting period with associated revenue recognized in a later period.
Aecon Group Inc. 51

NOTES TO THE CONSOLIDATED FINANCIAL STATEMENTS DECEMBER 31, 2019 AND 2018 (in thousands of Canadian dollars, except per share amounts)
Given the above-noted critical accounting estimates associated with the accounting for construction contracts, including change orders and claims, it is reasonably possible, on the basis of existing knowledge, that outcomes within the next financial year or later could be different from the estimates and assumptions adopted and could require a material adjustment to revenue and/or the carrying amount of the asset or liability affected. The Company is unable to quantify the potential impact to the consolidated financial results from a change in estimate in calculating revenue. LITIGATION RISK AND CLAIMS RISK Disputes are common in the construction industry and as such, in the normal course of business, the Company is involved in various legal actions and proceedings which arise from time to time, some of which may be substantial, including the legal proceedings discussed in Note 23, “Contingencies”. The Company must make certain assumptions and rely on estimates regarding potential outcomes of legal proceedings in order to determine if a provision is required. Estimating and recording the future outcome of litigation proceedings requires management to make significant judgments and assumptions, which are inherently subject to risks and uncertainties. Management regularly analyzes current information about these matters, and internal and external legal counsel are often used for these assessments. In making decisions regarding the need for provisions, management considers the degree of probability of an unfavorable outcome and the ability to make a sufficiently reliable estimate of the amount of loss. The outcome of these matters may have a material effect on the financial position, results of operations or cash flows of the Company, and there is no guarantee that there will not be a future rise in litigation which, depending on the nature of the litigation, could impact the financial position, results of operations, or cash flows of the Company. The Company also pursues claims against project owners for additional costs exceeding the contract price or for amounts not included in the original contract price. When these types of events occur and unresolved claims are pending, the Company may invest significant working capital in projects to cover costs pending the resolution of the relevant claims. A failure to ultimately recover on claims could have a material effect on liquidity and financial results. FAIR VALUING FINANCIAL INSTRUMENTS From time to time, the Company, often through its joint arrangements and equity accounted investees, enters into forward contracts and other foreign exchange hedging products to manage its exposure to changes in exchange rates related to transactions denominated in currencies other than the Canadian dollar, but does not hold or issue such financial instruments for speculative trading purposes. The Company is required to measure certain financial instruments at fair value, using the most readily available market comparison data and where no such data is available, using quoted market prices of similar assets or liabilities, quoted prices in markets that are not active, or other observable inputs that can be corroborated. Further information with regard to the treatment of financial instruments can be found in Note 30, “Financial Instruments.” MEASUREMENT OF RETIREMENT BENEFIT OBLIGATIONS The Company’s obligations and expenses related to defined benefit pension plans, including supplementary executive retirement plans, are determined using actuarial valuations and are dependent on many significant assumptions. The defined benefit obligations and benefit cost levels will change as a result of future changes in actuarial methods and assumptions, membership data, plan provisions, legislative rules, and future experience gains or losses, which have not been anticipated at this time. Emerging experience, differing from assumptions, will result in gains or losses that will be disclosed in future accounting valuations. Refer to Note 22, “Employee Benefit Plans,” for further details regarding the Company’s defined benefit plans as well as the impact to the financial results of a 0.5% change in the discount rate assumption used in the calculations. INCOME TAXES The Company is subject to income taxes in both Canada and several foreign jurisdictions. Significant estimates and judgments are required in determining the Company’s worldwide provision for income taxes. In the ordinary course of business, there are transactions and calculations where the ultimate tax determination is uncertain. The Company recognizes liabilities for anticipated tax audit issues based on estimates of whether additional taxes will be due. Management estimates income taxes for each jurisdiction the Company operates in, taking into consideration different income tax rates, non-deductible expenses, valuation allowances, changes in tax laws, and management’s expectations of future results. Management bases its estimates of deferred income taxes on temporary differences between the assets and liabilities reported in the Company’s consolidated financial statements, and the assets and liabilities determined by
2019 Annual Report52

NOTES TO THE CONSOLIDATED FINANCIAL STATEMENTS DECEMBER 31, 2019 AND 2018 (in thousands of Canadian dollars, except per share amounts)
the tax laws in the various countries in which the Company operates. Although the Company believes its tax estimates are reasonable, there can be no assurance that the final determination of any tax audits and litigation will not be materially different from that reflected in the Company’s historical income tax provisions and accruals. Where the final tax outcome of these matters is different from the amounts that were initially recorded, such differences will impact the Company’s income tax expense and current and deferred income tax assets and liabilities in the period in which such determinations are made. Although management believes it has adequately provided for any additional taxes that may be assessed as a result of an audit or litigation, the occurrence of either of these events could have an adverse effect on the Company’s current and future results and financial condition. The Company is unable to quantify the potential future impact to its consolidated financial results from a change in estimate in calculating income tax assets and liabilities. IMPAIRMENT OF GOODWILL AND OTHER INTANGIBLE ASSETS Intangible assets with finite lives are amortized over their useful lives. Goodwill, which has an indefinite life, is not amortized. Management evaluates intangible assets that are not amortized at the end of each reporting period to determine whether events and circumstances continue to support an indefinite useful life. Intangible assets with finite lives are tested for impairment whenever events or circumstances indicate the carrying value may not be recoverable. Goodwill and intangible assets with indefinite lives, if any, are tested for impairment by applying a fair value test in the fourth quarter of each year and between annual tests if events occur or circumstances change, which suggest the goodwill or intangible assets should be evaluated. Impairment assessments inherently involve management judgment as to the assumptions used to project these amounts and the impact of market conditions on those assumptions. The key assumptions used to estimate the fair value of reporting units under the fair value less cost to disposal approach are: weighted average cost of capital used to discount the projected cash flows; cash flows generated from new work awards; and projected operating margins. The weighted average cost of capital rates used to discount projected cash flows are developed via the capital asset pricing model, which is primarily based on market inputs. Management uses discount rates it believes are an accurate reflection of the risks associated with the forecasted cash flows of the respective reporting units. To develop the cash flows generated from project awards and projected operating margins, the Company tracks prospective work primarily on a project-by-project basis as well as the estimated timing of when new work will be bid or prequalified, started and completed. Management also gives consideration to its relationships with prospective customers, the competitive landscape, changes in its business strategy, and the Company’s history of success in winning new work in each reporting unit. With regard to operating margins, consideration is given to historical operating margins in the end markets where prospective work opportunities are most significant, and changes in the Company’s business strategy. Unanticipated changes in these assumptions or estimates could materially affect the determination of the fair value of a reporting unit and, therefore, could reduce or eliminate the excess of fair value over the carrying value of a reporting unit entirely and could potentially result in an impairment charge in the future. Refer to Note 14, “Intangible Assets”, for further details regarding goodwill and other intangible assets. LEASES The application of IFRS 16 “Leases” requires significant judgments and certain key estimations to be made. Critical judgments required in the application of IFRS 16 include the following: Identifying whether a contract (or part of a contract) includes a lease; Determining whether it is reasonably certain that an extension or termination option will be exercised; Determining whether variable payments are in-substance fixed; Establishing whether there are multiple leases in an arrangement; and Determining the stand-alone selling price of lease and non-lease components.
Aecon Group Inc. 53

NOTES TO THE CONSOLIDATED FINANCIAL STATEMENTS DECEMBER 31, 2019 AND 2018 (in thousands of Canadian dollars, except per share amounts)
Key sources of estimation uncertainty in the application of IFRS 16 include the following: Estimating the lease term; Determining the appropriate rate to discount lease payments; and Assessing whether a right-of-use asset is impaired. Unanticipated changes in these judgments or estimates could affect the identification and determination of the value of lease liabilities and right-of-use assets at initial recognition, as well as the subsequent measurement of lease liabilities and right-of-use assets. These items could potentially result in changes to amounts reported in the consolidated statements of income and consolidated balance sheets in a given period.
further details regarding leases. 4.2 JUDGMENTS The following are critical judgments management has made in the process of applying accounting policies and that have the most significant effect on how certain amounts are reported in the consolidated financial statements. BASIS FOR CONSOLIDATION AND CLASSIFICATION OF JOINT ARRANGEMENTS Assessing the Company’s ability to control or influence the relevant financial and operating policies of another entity may, depending on the facts and circumstances, require the exercise of significant judgment to determine whether the Company controls, jointly controls, or exercises significant influence over the entity performing the work. This assessment of control impacts how the operations of these entities are reported in the Company’s consolidated financial statements (i.e., full consolidation, equity investment or proportional share). The Company performs the majority of its construction projects through wholly owned subsidiary entities, which are fully consolidated. However, a number of projects, particularly some larger, multi-year, multi-disciplinary projects, are executed through partnering agreements. As such, the classification of these entities as a subsidiary, joint operation, joint venture, associate or financial instrument requires judgment by management to analyze the various indicators that determine whether control exists. In particular, when assessing whether an entity is classified as either a joint operation, joint venture or associate, management considers the contractual rights and obligations, voting shares, share of board members and the legal structure of the joint arrangement. Subject to reviewing and assessing all the facts and circumstances of each joint arrangement, joint arrangements contracted through agreements and general partnerships would generally be classified as joint operations whereas joint arrangements contracted through corporations would be classified as joint ventures. The majority of the current partnering agreements are classified as joint operations. The application of different judgments when assessing control or the classification of joint arrangements could result in materially different presentations in the consolidated financial statements. SERVICE CONCESSION ARRANGEMENTS The accounting for concession arrangements requires the application of judgment in determining if the project falls within the scope of IFRIC Interpretation 12, “Service Concession Arrangements”, (“IFRIC 12”). Additional judgments are needed when determining, among other things, the accounting model to be applied under IFRIC 12, the allocation of the consideration receivable between revenue-generating activities, the classification of costs incurred on such activities, as well as the effective interest rate to be applied to the financial asset. As the accounting for concession arrangements under IFRIC 12 requires the use of estimates over the term of the arrangement, any changes to these long-term estimates could result in a significant variation in the accounting for the concession arrangement. DISCONTINUED OPERATIONS The determination of whether a component of the Company, that either has been disposed of or is classified as held for sale, should be classified as a discontinued operation requires the exercise of judgment by management. The classification can have a significant impact on the presentation in the consolidated financial statements. In 2018, the Company sold substantially all of the assets related to Aecon’s contract mining business in the Alberta oil sands (see Note 26, “Other Income”). In management’s judgment, this operation does not meet the criteria for classification as a discontinued operation. In making such determination, management examined all the lines of business the Company currently operates in, and the geographic markets the Company participates in. With respect to contract mining, the
2019 Annual Report54
Refer to Note 13, “Property, plant and equipment”, and Note 18, “Long-term debt and non-recourse project debt” for
NOTES TO THE CONSOLIDATED FINANCIAL STATEMENTS DECEMBER 31, 2019 AND 2018 (in thousands of Canadian dollars, except per share amounts)
Company continues to provide numerous construction related services to the oil and gas industry across Canada, including earthworks, foundations, and site installation services in the mining sector; utility construction services across Canada including gas pipeline construction for distribution and transmission; and earthworks on various roadbuilding and tunneling projects on an on-going basis. As such, Aecon continues to operate in mining and related businesses and services the same clients as well as others in the industry, both in Alberta and across Canada. 5. SUMMARY OF SIGNIFICANT ACCOUNTING POLICIES 5.1 REVENUE RECOGNITION
Identification of a contract with a customer A construction contract is a contract specifically negotiated for the construction of an asset or combination of assets, including contracts for the rendering of services directly related to the construction of the asset. Such contracts include fixed-price and cost-plus contracts. When determining the proper revenue recognition method for contracts, the Company evaluates whether two or more contracts should be combined and accounted for as one single contract and whether the combined or single contract should be accounted for as more than one performance obligation. This evaluation requires significant judgment and the decision to combine a group of contracts or to separate a single contract into multiple performance obligations could affect the amount of revenue and profit recorded in a given period. The Company accounts for a contract when it has commercial substance, the parties have approved the contract in accordance with customary business practices and are committed to their obligations, the rights of the parties and payment terms are identified, and collectability of consideration is probable. Identifying performance obligations in a contract For most of the Company’s contracts, the customer contracts with the Company to provide a significant service of integrating a complex set of tasks and components into a single project. Consequently, the entire contract is accounted for as one performance obligation. Less frequently, however, the Company may provide several distinct goods or services as part of a contract, in which case the Company separates the contract into more than one performance obligation. If a contract is separated into more than one performance obligation, the total transaction price is allocated to each performance obligation in an amount based on the estimated relative standalone selling prices of the promised goods or services underlying each performance obligation. The expected cost plus a margin approach is typically used to estimate the standalone selling price of each performance obligation. On occasion, the Company will sell standard products, such as aggregates and other materials, with observable standalone sales. In these cases, the observable standalone sales are used to determine the standalone selling price. Performance obligations satisfied over time The Company typically transfers control of goods or services, and satisfies performance obligations, over time. Therefore, the Company recognizes revenue over time as these performance obligations are satisfied. This continuous transfer of control to the customer is often supported by the customer’s physical possession or legal title to the work in process, as well as contractual clauses that provide the Company with a present right to payment for work performed to date plus a reasonable profit in the event a customer unilaterally terminates the contract for convenience. As a result of control transferring over time, revenue is recognized based on the extent of progress towards completion of the performance obligation. The Company generally uses the cost-to-cost measure of progress for its contracts because it best reflects the transfer of an asset to the customer which occurs as costs are incurred on the contract. Under the cost-to-cost measure of progress, the extent of progress towards completion is measured based on the ratio of costs incurred to date to the total estimated costs at completion of the performance obligation. Revenues, including estimated fees or profits, are recorded proportionally as costs are incurred. Costs to fulfill contracts may include labour, materials, subcontractor, equipment costs, and other direct costs, as well as an allocation of indirect costs. Determining the transaction price It is common for the Company’s contracts to contain incentive fees or other provisions that can either increase or decrease the transaction price. These variable amounts generally are awarded upon achievement of certain performance
Aecon Group Inc. 55
NOTES TO THE CONSOLIDATED FINANCIAL STATEMENTS DECEMBER 31, 2019 AND 2018 (in thousands of Canadian dollars, except per share amounts)
metrics, program milestones or cost targets and can be based upon customer discretion. Variable consideration also includes change orders that have not been approved as to price, as well as claims. Claims are amounts in excess of the agreed contract price, or amounts not included in the original contract price, that the Company seeks to collect from clients for delays, errors in specifications and designs, contract terminations, change orders in dispute or unapproved as to both scope and price, or other causes of unanticipated additional costs. The Company estimates variable consideration at the most likely amount it expects to be entitled. The Company includes these estimated amounts in the transaction price to the extent it is highly probable that a significant reversal of cumulative revenue recognized will not occur when the uncertainty associated with the variable consideration is resolved. The estimates of variable consideration and determination of whether to include estimated amounts in the transaction price are based largely on an assessment of the Company’s anticipated performance and all information, historical, current and forecasted, that is reasonably available. Contracts are often modified to account for changes in contract specifications and requirements. Contract modifications exist when the change either creates new, or changes existing, enforceable rights and obligations. Most of the Company’s contract modifications are for goods or services that are not distinct from the existing contract due to the significant integration service provided in the context of the contract and are accounted for as if they were part of that existing contract. The effect of these contract modifications on the transaction price and the measure of progress for the performance obligation to which it relates, is recognized as a cumulative adjustment to revenue as either an increase or decrease in revenue. However, if a contract modification is for distinct goods and services from the existing contract and the pricing of the contract modification reflects the standalone selling pricing of the additional goods or services, then the contract modification is treated as a separate contract. Due to the nature of many of the Company’s performance obligations, the estimation of total revenue and costs at completion is complex, subject to many variables, and requires significant judgment. These areas of measurement uncertainty are discussed further in Note 4.1, “Major Sources of Estimation Uncertainty”. Any changes to the estimates of forecasted revenue and total costs are recognized on a cumulative basis, which recognizes in the current period the cumulative effect of the changes based on a performance obligation's percentage of completion. A significant change in one or more of these estimates could affect the profitability of one or more of the Company’s performance obligations. When estimates of total costs to be incurred on a performance obligation exceed the total estimated revenue to be earned, a provision for the entire loss on the performance obligation is recognized in the period the loss is determined. Revenue recognition – other Upfront costs are those costs that the Company incurs to pursue a contract with a customer that it would not have incurred if the contract had not been awarded. The Company recognizes upfront costs as an asset if it expects to recover those costs. Costs to pursue a contract that would have been incurred regardless of whether the contract was awarded are recognized as an expense when incurred, unless those costs are explicitly chargeable to the customer regardless of whether the contract is obtained. Mobilization costs are non-recurring set up costs incurred to facilitate performance obligations under customer contracts. Mobilization costs are expensed as incurred unless they are capital in nature, in which case they are capitalized in accordance with the relevant accounting standard, or there is a contractual entitlement to recover such costs from the customer, in which case the costs are capitalized and amortized to the income statement over the contract period. Contract revenues are measured at the fair value of the consideration received or receivable. Where deferral of payment has a material effect on the determination of such fair value, the amount at which revenues are recognized is adjusted to account for the time-value-of-money. Trade and other receivables include amounts billed and currently due from customers. The Company maintains an allowance for expected credit losses to provide for the estimated amount of receivables that will not be collected. The allowance is based upon an assessment of creditworthiness of the portfolio of customers, historical payment experience, the age of outstanding receivables, collateral to the extent applicable, and forward-looking information regarding collectability. Unbilled revenue represents revenue earned in excess of amounts billed on uncompleted contracts. Unbilled revenue typically results from sales under construction contracts when the cost-to-cost method of revenue recognition is utilized
2019 Annual Report56

NOTES TO THE CONSOLIDATED FINANCIAL STATEMENTS DECEMBER 31, 2019 AND 2018 (in thousands of Canadian dollars, except per share amounts)
and revenue recognized exceeds the amount billed to the customer. Unbilled revenue amounts are adjusted for expected credit losses. Deferred revenue represents the excess of amounts billed to customers over revenue earned on uncompleted contracts. Where advance payments are received from customers for the mobilization of project staff, equipment and services, the Company recognizes these amounts as liabilities and includes them in deferred revenue. Deferred revenue on construction contracts is classified as a current liability. Unbilled revenue and deferred revenue are accounted for on a contract-by-contract basis at the end of each reporting period. The operating cycle, or duration, of many of the Company’s contracts exceeds one year. All contract related assets and liabilities are classified as current as they are expected to be realized or satisfied within the operating cycle of the contract. The Company normally does not have any construction contracts where the period up to the transfer of the promised goods or services to the customer represents a financing component. As such, the transaction price is not adjusted for the time value of money. For long-term receivables under Service Concession Arrangements, see section 5.12, “Service Concession Arrangements”. If the Company receives an advance payment, a future obligation is recognized and the recognition and measurement principles of IFRS 15 are applied to determine an appropriate basis for recognizing revenue. Generally, construction and services contracts include defect and warranty periods following completion of the project. These obligations are not deemed to be separate performance obligations and are therefore estimated and included in the total cost of the contracts. Where required, amounts are recognized according to IAS 37 “Provisions, Contingent Liabilities and Contingent Assets”. Other revenue types Revenue related to the sale of aggregates and other materials is recognized at a point in time, and the performance obligation is typically satisfied on the delivery of the product to the customer. Revenue related to operations and maintenance (“O&M”) is recognized over time, as the performance obligations are satisfied by the Company. Remaining performance obligations Backlog (i.e. remaining performance obligations) is the total value of work that has not yet been completed that: (a) has a high certainty of being performed as a result of the existence of an executed contract or work order specifying job scope, value and timing; or (b) has been awarded to the Company, as evidenced by an executed binding letter of intent or agreement, describing the general job scope, value and timing of such work, and where the finalization of a formal contract in respect of such work is reasonably assured. O&M activities are provided under contracts that can cover a period of up to 30 years. In order to provide information that is comparable to the backlog of other categories of activity, the Company limits backlog for O&M activities to the earlier of the contract term and the next five years. 5.2 CASH AND CASH EQUIVALENTS Cash and cash equivalents consist of cash at banks and on hand, cash in joint operations, demand deposits, and short-term highly liquid investments that are readily convertible into known amounts of cash and that are subject to an insignificant risk of changes in value. The Company considers investments purchased with original maturities of three months or less to be cash equivalents. 5.3 RESTRICTED CASH Restricted cash is cash where specific restrictions exist on the Company’s ability to use this cash.
Aecon Group Inc. 57

NOTES TO THE CONSOLIDATED FINANCIAL STATEMENTS DECEMBER 31, 2019 AND 2018 (in thousands of Canadian dollars, except per share amounts)
Restricted cash consists of cash held by Bermuda Skyport Corporation Limited (“Skyport”). Proceeds from non-recourse project debt and equity in Skyport, as well as net cash generated from Skyport’s operations, are available to fund airport construction activities and to fund reserves required by the non-recourse project debt agreement. Skyport is not permitted to declare dividends during construction of the new airport terminal. 5.4 FINANCIAL INSTRUMENTS – CLASSIFICATION AND MEASUREMENT The Company classifies its financial assets into one of three categories: measured at amortized cost, fair value through other comprehensive income (“FVTOCI”) and fair value through profit and loss (“FVTPL”). The classification of financial assets under IFRS 9 is generally based on the business model in which a financial asset is managed and its contractual cash flow characteristics. Recognition and initial measurement Financial assets and financial liabilities are recognized in the statement of financial position when the Company becomes party to the contractual provisions of a financial instrument. All financial instruments are measured at fair value on initial recognition. Financial instruments related to all contract assets and liabilities are classified as current as they are expected to be realized or satisfied within the operating cycle of the contract. All other financial instruments are considered non-current if they are expected to be realized more than 12 months after the reporting period. Transaction costs that are directly attributable to the acquisition or issuance of financial assets and financial liabilities, other than financial assets and financial liabilities classified as FVTPL, are added to or deducted from the fair value on initial recognition. Transaction costs directly attributable to the acquisition of financial assets or financial liabilities classified as FVTPL are recognized immediately in net income. Classification and subsequent measurement The Company classifies financial assets, at the time of initial recognition, according to the Company’s business model for managing the financial assets and the contractual terms of the cash flows. Financial assets are classified in the following measurement categories:
(a) Amortized cost; and
(b) Fair value.
When assets are measured at fair value, gains and losses are either recognized entirely in profit or loss (i.e. FVTPL), or recognized in other comprehensive income (i.e. FVTOCI). Financial assets are subsequently measured at amortized cost if both the following conditions are met and they are not designated as FVTPL:
(a) the financial asset is held within a business whose objective is to hold financial assets to collect contractual cash flows; and
(b) the contractual terms of the financial asset give rise on specified dates to cash flows that are solely payments of principal and interest on the principal amount outstanding. These assets are subsequently measured at amortized cost using the effective interest rate method, less any impairment, with gains and losses recognized in net income in the period that the asset is derecognized or impaired.
Financial liabilities are subsequently measured at amortized cost using the effective interest rate method with gains and losses recognized in net income in the period that the liability is derecognized, except for financial liabilities classified as FVTPL. These financial liabilities are subsequently measured at fair value with changes in fair value recorded in net income in the period in which they arise to the extent they are not part of a designated hedging relationship.
2019 Annual Report58
NOTES TO THE CONSOLIDATED FINANCIAL STATEMENTS DECEMBER 31, 2019 AND 2018 (in thousands of Canadian dollars, except per share amounts)
The following table outlines the classification of financial instruments under IFRS 9:
Classification Financial assets Cash and cash equivalents Amortized cost Restricted cash Amortized cost Trade and other receivables Amortized cost Unbilled revenue Amortized cost Long-term financial assets- derivative assets FVTPL, unless designated in a hedging relationship in which case
classified as FVTOCI Long-term financial assets- other receivables Amortized cost Financial liabilities Bank indebtedness Amortized cost Trade and other payables Amortized cost Current portion of long-term debt Amortized cost Convertible debentures Amortized cost Non-recourse project debt Amortized cost Long-term debt Amortized cost Other liabilities- derivative liabilities FVTOCI The convertible debentures are accounted for as a compound financial instrument with a debt component and a separate equity component. The debt component of these compound financial instruments is measured at fair value on initial recognition by discounting the stream of future interest and principal payments at the rate of interest prevailing at the date of issue for instruments of similar term and risk. The debt component is subsequently deducted from the total carrying value of the compound instrument to derive the equity component. The debt component is subsequently measured at amortized cost using the effective interest rate method. Interest expense based on the coupon rate of the debenture and the accretion of the liability component to the amount that will be payable on redemption are recognized through profit or loss as a finance cost. 5.5 DERECOGNITION OF FINANCIAL ASSETS AND LIABILITIES Financial assets The Company derecognizes a financial asset when the contractual rights to the cash flows from the financial asset expire, or it transfers the rights to receive the contractual cash flows in a transaction in which substantially all of the risks and rewards of ownership of the financial asset are transferred or in which the Company neither transfers nor retains substantially all of the risks and rewards of ownership and it does not retain control of the financial asset. Any interest in transferred financial assets that is created or retained by the Company is recognized as a separate asset or liability. Financial liabilities A financial liability is derecognized from the balance sheet when it is extinguished, that is, when the obligation specified in the contract is either discharged, cancelled or expires. Where there has been an exchange between an existing borrower and lender of debt instruments with substantially different terms, or there has been a substantial modification of the terms of an existing financial liability, this transaction is accounted for an extinguishment of the original financial liability and the recognition of a new financial liability. A gain or loss from extinguishment of the original financial liability is recognized in profit or loss.
Aecon Group Inc. 59

NOTES TO THE CONSOLIDATED FINANCIAL STATEMENTS DECEMBER 31, 2019 AND 2018 (in thousands of Canadian dollars, except per share amounts)
5.6 IMPAIRMENT OF FINANCIAL ASSETS The Company uses an expected credit loss (“ECL”) model. This impairment model applies to financial assets measured at amortized cost, and contract assets, but not to investments in equity instruments. The loss allowances are measured on either of the following bases:
12-month ECLs – these are ECLs that result from possible default events within the 12 months after the reporting date; and
Lifetime ECLs – these are ECLs that result from all possible default events over the expected life of a financial instrument.
The Company is using the simplified approach to recognize lifetime expected credit losses for its trade receivables and contract assets that are within the scope of IFRS 15 and that do not have a significant financing component. For long-term receivables under service concession arrangements that have a significant financing component, the Company is recognizing loss allowances using 12-month expected credit losses, or lifetime expected credit losses if there has been a significant increase in the credit risk on the instrument. ECLs are a probability-weighted estimate of credit losses. Credit losses are measured as the present value of all cash shortfalls. ECLs are discounted at the effective interest rate of the financial asset. Credit risk associated with accounts receivable, holdbacks receivable and unbilled revenue is limited by the Company’s diversified customer base and its dispersion across different business and geographic areas, as discussed further in Note 30, “Financial Instruments”. At each reporting date, the Company assesses whether financial assets carried at amortized cost are credit-impaired. A financial asset is “credit-impaired” when one or more events that have a detrimental impact on the estimated future cash flows of the financial asset have occurred. Loss allowances for financial assets measured at amortized cost are deducted from the gross carrying amount of the asset. 5.7 DERIVATIVE FINANCIAL INSTRUMENTS – HEDGE ACCOUNTING The Company, often through its joint arrangements and equity accounted investees, enters into derivative financial instruments, namely interest rate swaps to hedge the variability of interest rates related to the long-term debt of its concession projects and foreign currency forward contracts to hedge foreign currency exposures on select construction projects. For designated hedges, the Company formally documents all relationships between hedging instruments and hedged items, as well as its risk management objective and strategy for undertaking these hedge transactions, and regularly assesses the effectiveness of these hedges. Derivative financial instruments designated as cash flow hedges are measured at fair value established by using valuation techniques based on observable market data and taking into account the credit quality of the instruments. The effective portion of the change in fair value of the derivative financial instrument is recorded in other comprehensive income, while the ineffective portion, if any, of such change is recognized in net income. When ineffective, gains or losses from cash flow hedges included in other comprehensive income are reclassified to net income as an offset to the losses or gains recognized on the underlying hedged items. 5.8 INVENTORIES Inventories are recorded at the lower of cost and net realizable value, with the cost of materials and supplies determined on a first-in, first-out basis and the cost of aggregate inventories determined at weighted average cost. The cost of finished goods and work in progress comprises design costs, raw materials, direct labour, other direct costs and related production overheads based on normal operating capacity. Inventories are written down to net realizable value (“NRV”) if their NRV is less than their carrying amount at the reporting date. If the NRV amount subsequently increases, the amount of the write-down is reversed and recognized as a reduction
2019 Annual Report60

NOTES TO THE CONSOLIDATED FINANCIAL STATEMENTS DECEMBER 31, 2019 AND 2018 (in thousands of Canadian dollars, except per share amounts)
in materials expense. The NRV of inventory is its estimated selling price in the ordinary course of business less applicable selling costs. 5.9 PROPERTY, PLANT AND EQUIPMENT Property, plant and equipment are recorded at historical cost less accumulated depreciation and accumulated impairment losses, if any. The cost of property, plant and equipment includes the purchase price and the directly attributable costs of acquisition or construction costs required to bring the asset to the location and condition necessary for the asset to be capable of operating in the manner intended by management. Right-of-use assets are initially measured at cost, which comprises the initial amount of the lease liability adjusted for any lease payments made at or before the commencement date, plus any initial direct costs incurred and an estimate of costs to dismantle and remove the underlying asset or to restore the underlying asset or the site on which it is located, less any lease incentives received. In subsequent periods, property, plant and equipment are stated at cost less accumulated depreciation and any impairment in value, with the exception of land and assets under construction, which are not depreciated but are stated at cost less any impairment in value. Depreciation is recorded to allocate the cost, less estimated residual values of property, plant and equipment over their estimated useful lives on the following bases: Aggregate properties are depreciated using the unit of extraction method based on estimated economically recoverable reserves, which results in a depreciation charge proportional to the depletion of reserves. All other assets, excluding assets under construction, are depreciated on a straight-line basis over periods that approximate the estimated useful lives of the assets as follows: Assets Term
Land Not depreciated Buildings and leasehold improvements 10 to 40 years Machinery and equipment 2 to 15 years Heavy mining equipment 12,000 - 60,000 hours Office equipment 3 to 5 years Vehicles 1 to 5 years Assets under construction are not depreciated until they are brought into use, at which point they are transferred into the appropriate asset category. The Company reviews the residual value, useful lives and depreciation method of depreciable assets on an annual basis and, where revisions are required, the Company applies such changes in estimates on a prospective basis. The net carrying amounts of property, plant and equipment assets are reviewed for impairment either individually or at the cash-generating unit level when events and changes in circumstances indicate the carrying amount may not be recoverable. To the extent these carrying amounts exceed their recoverable amounts, that excess is fully recognized in profit or loss in the financial year in which it is determined. When significant parts of property, plant and equipment are required to be replaced and it is probable that future economic benefits associated with the item will be available to the Company, the expenditure is capitalized and the carrying amount of the item replaced is derecognized. Similarly, maintenance and inspection costs associated with major overhauls are capitalized and depreciated over their useful lives where it is probable that future economic benefits will be available and any remaining carrying amounts of the cost of previous overhauls are derecognized. All other costs are expensed as incurred.
Aecon Group Inc. 61

NOTES TO THE CONSOLIDATED FINANCIAL STATEMENTS DECEMBER 31, 2019 AND 2018 (in thousands of Canadian dollars, except per share amounts)
5.10 BORROWING COSTS Borrowing costs attributable to the acquisition, construction or production of qualifying assets are added to the cost of those assets for periods preceding the dates the assets are available for their intended use. All other borrowing costs are recognized as interest expense in the period in which they are incurred. 5.11 GOODWILL AND INTANGIBLE ASSETS Goodwill Goodwill represents the future economic benefits arising from other assets acquired in a business combination that are not individually identified and separately recognized. Goodwill relating to the acquisition of subsidiaries is included on the consolidated balance sheets in intangible assets. Goodwill relating to the acquisition of associates is included in the investment of the associate and therefore tested for impairment in conjunction with the associate investment balance. Goodwill is not amortized but is reviewed for impairment at least annually and whenever events or circumstances indicate the carrying amount may be impaired. Goodwill is allocated to cash-generating units for the purpose of impairment testing. The allocation is made to the cash-generating units or groups of cash-generating units that are expected to benefit from the business combination in which the goodwill arose. The Company’s cash-generating units generally represent either individual business units, or groups of business units that are all below the level of the Company’s operating segments. In a business combination, when the fair value attributable to the Company’s share of the net identifiable assets acquired exceeds the cost of the business combination, the excess is recognized immediately in profit or loss. Internally generated goodwill is not recognized. Gains and losses on the disposal of an entity include the carrying amount of goodwill relating to the entity sold. Intangible assets Intangible assets acquired as part of a business combination are recorded at fair value at the acquisition date if the asset is separable or arises from contractual or legal rights and the fair value can be measured reliably on initial recognition. Separately acquired intangible assets are recorded initially at cost and thereafter are carried at cost less accumulated amortization and impairment if the asset has a finite useful life. Intangible assets are amortized over their estimated useful lives. Intangible assets under development are not amortized until put into use. Estimated useful lives are determined as the period over which the Company expects to use the asset and for which the Company retains control over benefits derived from use of the asset. For intangible assets with a finite useful life, the amortization method and period are reviewed annually and impairment testing is undertaken when circumstances indicate the carrying amounts may not be recoverable. Amortization expense on intangible assets with finite lives is recognized in profit or loss as an expense item. The major types of intangible assets and their amortization periods are as follows: Assets Amortization basis Acquired customer backlog Pro rata basis as backlog revenue is worked off Licences, software and other rights 1 - 10 years Aggregate permits Units of extraction
2019 Annual Report62

NOTES TO THE CONSOLIDATED FINANCIAL STATEMENTS DECEMBER 31, 2019 AND 2018 (in thousands of Canadian dollars, except per share amounts)
5.12 SERVICE CONCESSION ARRANGEMENTS The Company accounts for Service Concession Arrangements in accordance with “IFRIC 12”. IFRIC 12 provides guidance on the accounting for certain qualifying public-private partnership arrangements, whereby the grantor (i.e., usually a government) (a) controls or regulates what services the operator (i.e. “the concessionaire”) must provide with the infrastructure, to whom it must provide those services, and at what price; and (b) controls any significant residual interest in the infrastructure at the end of the term of the arrangement. Under such concession arrangements, the concessionaire accounts for the infrastructure asset by applying one of the following accounting models depending on the allocation of the demand risk through the usage of the infrastructure between the grantor and the concessionaire: Accounting Model (a) Financial Asset Model Applicable when the concessionaire does not bear demand risk through the usage of the infrastructure (i.e., it has an unconditional right to receive cash irrespective of the usage of the infrastructure, for example through availability payments). When the Company delivers more than one category of activity in a service concession arrangement, the consideration received or receivable is allocated by reference to the relative fair values of the activity delivered, when the amounts are separately identifiable. Revenue recognized by the Company under the financial asset model is recognized in “Long Term Receivables”, a financial asset that is recovered through payments received from the grantor. (b) Intangible Asset Model Applicable when the concessionaire bears demand risk (i.e., it has a right to charge fees for usage of the infrastructure). The Company recognizes an intangible asset arising from a service concession arrangement when it has a right to charge for usage of the concession infrastructure. The intangible asset received as consideration for providing construction or upgrade services in a service concession arrangement is measured at fair value upon initial recognition. Borrowing costs, if any, are capitalized until the infrastructure is ready for its intended use as part of the carrying amount of the intangible asset. The intangible asset is then amortized over its expected useful life, which is the concession period in a service concession arrangement. The amortization period begins when the infrastructure is available for use. Revenues from service concession arrangements accounted for under IFRIC 12 are recognized as follows: (a) Construction or upgrade activities when a service concession arrangement involves the construction or
upgrade of the public service infrastructure: Revenues relating to construction or upgrade services under a service concession arrangement are recognized based on the stage of completion of the work performed, consistent with the Company’s accounting policy on recognizing revenue applicable to any construction contract (see Section 5.1, “Revenue Recognition”).
Aecon Group Inc. 63

NOTES TO THE CONSOLIDATED FINANCIAL STATEMENTS DECEMBER 31, 2019 AND 2018 (in thousands of Canadian dollars, except per share amounts)
(b) Operations and maintenance activities may include maintenance of the infrastructure and other activities provided directly to the grantor or the users:
Operations and maintenance revenues are recognized in the period in which the activities are performed by the Company, consistent with the Company’s accounting policy on recognizing revenue applicable to any operations and maintenance contract (see Section 5.1, “Revenue Recognition”). (c) Financing (applicable when the financial asset model is applied) Finance income generated on financial assets is recognized using the effective interest method. 5.13 IMPAIRMENT OF NON-FINANCIAL ASSETS Property, plant and equipment and intangible assets that are subject to amortization are reviewed for impairment at the end of each reporting period. If there are indicators of impairment, a review is undertaken to determine whether the carrying amounts are in excess of their recoverable amounts. An asset’s recoverable amount is determined as the higher of its fair value less costs to sell and its value-in-use. Such reviews are undertaken on an asset-by-asset basis, except where assets do not generate cash flows independent of other assets, in which case the review is undertaken at the cash-generating unit (“CGU”) level. Where a CGU, or group of CGUs, has goodwill allocated to it, or includes intangible assets that are either not available-for- use or that have an indefinite useful life (and can only be tested as part of a CGU), an impairment test is performed at least annually or whenever there is an indication the carrying amounts of such assets may be impaired. Corporate assets, where material to the carrying value of a CGU in computing impairment calculations, are allocated to CGUs based on the benefits received by the CGU. If the carrying amount of an individual asset or CGU exceeds its recoverable amount, an impairment loss is recorded in profit or loss to reflect the asset at the lower amount. In assessing the value-in-use, the relevant future cash flows expected to arise from the continuing use of such assets and from their disposal are discounted to their present value using a market determined pre-tax discount rate, which reflects current market assessments of the time-value-of-money and asset-specific risks. Fair value less costs to sell is determined as the amount that would be obtained from the sale of the asset in an arm’s length transaction between knowledgeable and willing parties. Similarly, a reversal of a previously recognized impairment loss is recorded in profit or loss when events or circumstances indicate the estimates used to determine the recoverable amount have changed since the prior impairment loss was recognized and the recoverable amount of the asset exceeds its carrying amount. The carrying amount is increased to the recoverable amount but not beyond the carrying amount net of amortization, which would have arisen if the prior impairment loss had not been recognized. After such a reversal, the amortization charge is adjusted in future periods to allocate the asset’s revised carrying amount, less any residual value, on a systematic basis over its remaining useful life. Goodwill impairments are not reversed. 5.14 JOINT ARRANGEMENTS Under IFRS 11, “Joint Arrangements,” a joint arrangement is a contractual arrangement wherein two or more parties have joint control. Joint control is the contractually agreed sharing of control of an arrangement when the strategic financial and operating decisions relating to the arrangement require the unanimous consent of the parties sharing control. Investments in joint arrangements are classified as either joint operations or joint ventures depending on the contractual rights and obligations of each party. Refer to Note 4 “Critical Accounting Estimates” for significant judgments affecting the classification of joint arrangements as either joint operations or joint ventures. The parties to a joint operation have rights to the assets, and obligations for the liabilities, relating to the arrangement whereas joint ventures have rights to the net assets of the arrangement. In accordance with IFRS 11, the Company accounts for joint operations by recognizing its share of any assets held jointly and any liabilities incurred jointly, along
2019 Annual Report64
NOTES TO THE CONSOLIDATED FINANCIAL STATEMENTS DECEMBER 31, 2019 AND 2018 (in thousands of Canadian dollars, except per share amounts)
with its share of the revenue from the sale of the output by the joint operation, and its expenses, including its share of any expenses incurred jointly. Joint ventures are accounted for using the equity method of accounting in accordance with IAS 28, “Investments in Associates and Joint Ventures.”
Under the equity method of accounting, the Company’s investments in joint ventures and associates are carried at cost and adjusted for post-acquisition changes in the net assets of the investment. Profit or loss reflects the Company’s share of the results of these investments. Distributions received from an investee reduce the carrying amount of the investment. The consolidated statements of comprehensive income also include the Company’s share of any amounts recognized by joint ventures and associates in OCI. Where there has been a change recognized directly in the equity of the joint venture or associate, the Company recognizes its share of that change in equity. The financial statements of the joint ventures and associates are generally prepared for the same reporting period as the Company, using consistent accounting policies. Adjustments are made to bring into line any dissimilar accounting policies that may exist in the underlying records of the joint venture and/or associate. Adjustments are made in the consolidated financial statements to eliminate the Company’s share of unrealized gains and losses on transactions between the Company and its joint ventures and associates. Transactions with joint operations Where the Company contributes or sells assets to a joint operation, the Company recognizes only that portion of the gain or loss that is attributable to the interests of the other parties. Where the Company purchases assets from a joint operation, the Company does not recognize its share of the profit or loss of the joint operation from the transaction until it resells the assets to an independent party. The Company adjusts joint operation financial statement amounts, if required, to reflect consistent accounting policies. 5.15 ASSOCIATES Entities in which the Company has significant influence and which are neither subsidiaries, nor joint arrangements, are accounted for using the equity method of accounting in accordance with IAS 28, “Investments in Associates and Joint Ventures.” This method of accounting is described in Section 5.14, “Joint Arrangements.” The Company discontinues the use of the equity method from the date on which it ceases to have significant influence, and from that date accounts for the investment in accordance with IFRS 9, “Financial Instruments,” (at fair value), provided the investment does not then qualify as a subsidiary or a joint arrangement. 5.16 PROVISIONS General Provisions are recognized when the Company has a present obligation (legal or constructive) as a result of a past event, it is probable that an outflow of resources embodying economic benefits will be required to settle the obligation and a reliable estimate can be made of the amount of the obligation. Where the Company expects some or all of the provision to be reimbursed, the reimbursement is recognized as a separate asset when reimbursement is virtually certain. The expense relating to any provision is presented in profit or loss net of any reimbursement. Where material, provisions are discounted using a current pre-tax discount rate that reflects, where appropriate, the risks specific to the liability. Where discounting is used, the increase in the provision due to the passage of time is recognized as a finance cost. Decommissioning liabilities The Company has legal obligations associated with the retirement of pits and quarries utilized in aggregate mining operations. As a result, a provision is made for close down, restoration and environmental rehabilitation costs (which include the dismantling and demolition of infrastructure, removal of residual materials and remediation of disturbed areas)
Aecon Group Inc. 65

NOTES TO THE CONSOLIDATED FINANCIAL STATEMENTS DECEMBER 31, 2019 AND 2018 (in thousands of Canadian dollars, except per share amounts)
in the financial period when the related environmental disturbance occurs, based on estimated future costs using information available at the consolidated balance sheet dates. The provision is discounted using a current market-based pre-tax discount rate that reflects the average life of the obligations and the risks specific to the liability. An increase in the provision due to the passage of time is recognized as a finance cost and the provision is reduced by actual rehabilitation costs incurred. The present value of the legal obligations incurred is recognized as an inventory production cost and is included in the cost of the aggregates produced. The provision is reviewed at each reporting date for changes to obligations, legislation or discount rates that impact estimated costs or lives of operations. Changes in the amount or timing of the underlying future cash flows or changes in the discount rate are immediately recognized as an increase or decrease in the carrying amounts of related assets and the provision. 5.17 LEASES The Company has applied IFRS 16 “Leases” with an initial application date of January 1, 2019 using the modified retrospective approach. Comparative information has not been restated and continues to be reported under IAS 17
transitional provisions in the standard. Policy applicable from January 1, 2019 At inception of a contract, the Company assesses whether a contract is, or contains, a lease. A contract is, or contains, a lease if the contract conveys the right to control the use of an identified asset for a period of time in exchange for consideration. To assess whether a contract conveys the right to control the use of an identified asset, the Company assesses whether: The contract involves the use of an identified asset – this may be specified explicitly or implicitly, and should be
physically distinct or represent substantially all of the capacity of a physically distinct asset. If the supplier has a substantive substitution right, then the asset is not identified;
The Company has the right to obtain substantially all of the economic benefits from use of the asset throughout the period of use; and
The Company has the right to direct the use of the asset. The Company has this right when it has the decision-making rights that are most relevant to changing how and for what purpose the asset is used. In rare cases where the decision about how and for what purpose the asset is used is predetermined, the Company has the right to direct the use of the asset if either:
o The Company has the right to operate the asset; or o The Company designed the asset in a way that predetermines how and for what purpose it will be used.
At inception or on reassessment of a contract that contains a lease component, the Company allocates the consideration in the contract to each lease component on the basis of their relative stand-alone price. The Company recognizes a right-of-use asset and a lease liability at the lease commencement date. The right-of-use asset is initially measured at cost, which comprises the initial amount of the lease liability adjusted for any lease payments made at or before the commencement date, plus any initial direct costs incurred and an estimate of costs to dismantle and remove the underlying asset or to restore the underlying asset or the site on which it is located, less any lease incentives received. The right-of-use asset is subsequently depreciated using the straight-line method from the commencement date to the earlier of the end of the useful life of the right-of-use asset or the end of the lease term. The estimated useful lives of right-of-use assets are determined on the same basis as those of property, plant and equipment. In addition, the right-of-use asset is periodically reduced by impairment losses, if any, and adjusted for certain remeasurements of the lease liability.
2019 Annual Report66
“Leases” and IFRIC 4 “Determining Whether an Arrangement Contains a Lease” as permitted under the specific

NOTES TO THE CONSOLIDATED FINANCIAL STATEMENTS DECEMBER 31, 2019 AND 2018 (in thousands of Canadian dollars, except per share amounts)
The lease liability is initially measured at the present value of the lease payments that are not paid at the commencement date, discounted using the interest rate implicit in the lease or, if that rate cannot be readily determined, the Company’s incremental borrowing rate. Lease payments included in the measurement of the lease liability comprise the following: Fixed payments, including in-substance fixed payments; Variable lease payments that depend on an index or a rate, initially measured using the relevant index or rate as at
the commencement date; Amounts expected to be payable under a residual value guarantee; and The exercise price under a purchase option that the Company is reasonably certain to exercise, lease payments in an
optional renewal period if the Company is reasonably certain to exercise an extension option, and penalties for early termination of a lease unless the Company is reasonably certain not to terminate early.
The lease liability is measured at amortized cost using the effective interest method. It is remeasured when there is a change in future lease payments arising from a change in the relevant index or rate, if there is a change in the Company’s estimate of the amount expected to be payable under a residual value guarantee, or if the Company changes its assessment of whether it will exercise a purchase, extension or termination option. When the lease liability is remeasured in this way, a corresponding adjustment is made to the carrying amount of the right-of-use asset, or is recorded in profit or loss if the carrying amount of the right-of-use asset has been reduced to zero. The Company presents right-of-use assets in “property, plant and equipment” and lease liabilities in “long-term debt” in the consolidated balance sheets. Short-term leases and leases of low-value assets The Company has elected not to recognize right-of-use assets and lease liabilities for short-term leases of property, plant and equipment that have a lease term of 12 months or less and leases of low-value assets, such as some IT-equipment. The Company recognizes the lease payments associated with these leases as an expense on a straight-line basis over the lease term. Policy applicable before January 1, 2019 For contracts entered into before January 1, 2019, the Company determined whether the arrangement was or contained a lease based on the assessment of whether:
Fulfillment of the arrangement was dependent on the use of a specific asset or assets; and The arrangement had conveyed a right to use the asset. An arrangement conveyed the right to use the asset if
one of the following was met: o The purchaser had the ability or right to operate the asset while obtaining or controlling more than an
insignificant amount of the output; o The purchaser had the ability or right to control physical access to the asset while obtaining or controlling
more than an insignificant amount of the output; or o Facts and circumstances indicated that it was remote that other parties would take more than an
insignificant amount of the output, and the price per unit was neither fixed per unit of output nor equal to the current market price per unit of output.
In the comparative period under IAS 17, the Company classified leases that transfer substantially all of the risks and rewards of ownership as finance leases. When this was the case, the leased assets were measured initially at an amount equal to the lower of their fair value and the present value of the minimum lease payments. Minimum lease payments were the payments over the lease term that the lessee was required to make, excluding any contingent rent. Subsequently, each asset was accounted for in accordance with the accounting policy applicable to how that asset was classified.
Aecon Group Inc. 67

NOTES TO THE CONSOLIDATED FINANCIAL STATEMENTS DECEMBER 31, 2019 AND 2018 (in thousands of Canadian dollars, except per share amounts)
Leases in which a significant portion of the risks and rewards of ownership are retained by the lessor were classified as operating leases, and assets were not recognized in the Company’s consolidated balance sheet. Payments made under operating leases (net of any incentives received from the lessor) were recognized in profit or loss on a straight-line basis over the term of the lease. Nature of leased assets The Company leases various offices, warehouses, land, equipment and vehicles. Contracts are typically made for fixed periods of one to ten years but may have extension options as described below. Lease terms are negotiated on an individual basis and contain a wide range of different terms and conditions. Leased assets may not be used as security for borrowing purposes. Some leases provide for additional payments based on changes in inflation. Extension and termination options Some office leases include an option to renew the lease for an additional period after the non-cancellable contract period. Where practicable, the Company seeks to include extension options in new leases to provide operational flexibility. Extension options are exercisable only by the Company and not by the lessors. The Company assesses at lease commencement whether it is reasonably certain to exercise the extension options. The Company reassesses its portfolio of leases to determine whether it is reasonably certain to exercise the options if there is a significant event or significant change in circumstances within its control. The Company considers all facts and circumstances when making this decision. The Company examines whether there is an economic incentive or penalty that would affect the decision to exercise the option, for example, whether the lease option is below market value or whether the Company has made significant investments in leasehold improvements. Where it is not reasonably certain that the lease will be extended or terminated, the Company will not recognize these options. Variable lease payments Some leases also require the Company to make payments that relate to the property taxes and additional services levied on the lessor and insurance payments made by the lessor; these amounts are generally determined annually. 5.18 EMPLOYEE BENEFIT PLANS The Company recognizes the cost of retirement benefits over the periods in which employees are expected to render services in return for the benefits. The Company sponsors defined benefit pension plans (which had their membership frozen as at January 1, 1998) and defined contribution pension plans for its salaried employees. The Company matches employee contributions to the defined contribution plans, which are based on a percentage of salaries. For the defined contribution pension plans the contributions are recognized as an employee benefit expense when they are earned. For the defined benefit pension plans, current service costs are charged to operations as they accrue based on services rendered by employees during the year. Pension benefit obligations are determined annually by independent actuaries using management’s best estimate assumptions. The plans’ assets are measured at fair value. The present value of the defined benefit obligation is determined by discounting the estimated future cash flows using interest rates of high quality corporate bonds that have terms to maturity approximating the terms of the related pension liability. Actuarial gains and losses are recognized in other comprehensive income as they arise. Past service costs are recognized immediately in profit or loss unless the changes to the pension plan are conditional on the employees remaining in service for a specified period of time (the vesting period). In this case, the past service costs are amortized on a straight-line basis over the vesting period. 5.19 CURRENT AND DEFERRED INCOME TAXES Current income tax is calculated on the basis of tax laws enacted or substantively enacted at the consolidated balance sheet dates in the countries where the Company operates and generates taxable income. Current tax includes adjustments to tax payable or recoverable in respect of previous periods.
2019 Annual Report68
NOTES TO THE CONSOLIDATED FINANCIAL STATEMENTS DECEMBER 31, 2019 AND 2018 (in thousands of Canadian dollars, except per share amounts)
Deferred income tax is provided using the asset and liability method on all temporary differences at the consolidated balance sheet dates between the tax basis of assets and liabilities and their carrying amounts for financial reporting purposes. However, deferred income taxes are not recognized if they arise from the initial recognition of goodwill. Deferred income tax is also not accounted for if it arises from the initial recognition of an asset or liability in a transaction that is not a business combination and, at the time of the transaction, affects neither the accounting profit nor taxable profit or loss. Deferred income tax is provided on temporary differences associated with investments in subsidiaries, associates or joint ventures, except where the timing of the reversal of temporary differences can be controlled and it is probable the temporary differences will not reverse in the foreseeable future. Deferred income tax assets are recognized only to the extent that it is probable that taxable profit will be available against which deductible temporary differences, carried forward tax credits or tax losses can be utilized. Deferred tax is measured on an undiscounted basis at the tax rates that are expected to apply in the periods in which the asset is realized or the liability is settled, based on tax rates and tax laws enacted or substantively enacted at the consolidated balance sheet dates. The carrying amount of deferred income tax assets is reviewed at each consolidated balance sheet date and reduced to the extent that it is no longer probable that sufficient taxable profit will be available to allow all or part of the deferred income tax asset to be utilized. To the extent that an asset not previously recognized fulfills the criteria for recognition, a deferred income tax asset is recorded. Current and deferred taxes relating to items recognized directly in equity and other comprehensive income are recognized in equity and other comprehensive income and not in profit or loss. Current income tax assets and liabilities or deferred income tax assets and liabilities are offset, if a legally enforceable right exists to offset current tax assets against current tax liabilities and the income taxes relate to the same taxable entity and the same tax authority. 5.20 DIVIDENDS A provision is not recorded for dividends unless the dividends have been declared by the Board of Directors on or before the end of the year and not distributed at the reporting date. 5.21 STOCK-BASED COMPENSATION The Company has stock-based compensation plans, as described in Note 24, “Capital Stock.” All transactions involving stock-based payments are recognized as an expense over the vesting period. Equity-settled stock-based payment transactions, such as stock option awards and the Company’s long-term incentive plan, are measured at the grant date fair value of employee services received in exchange for the grant of options or share awards and for non-employee transactions, at the fair value of the goods or services received at the date on which the entity recognizes the goods or services. The total amount of the expense recognized in profit or loss is determined by reference to the fair value of the share awards or options granted, which factors in the number of options expected to vest. Equity-settled share-based payment transactions are not remeasured once the grant date fair value has been determined, except in cases where the stock-based payment is linked to non-market related performance conditions. Cash-settled stock-based payment transactions are measured at the fair value of the liability. The liability is remeasured at each consolidated balance sheet date and at the date of settlement, with changes in fair value recognized in profit or loss. 5.22 EARNINGS PER SHARE Basic earnings per share Basic earnings per share is determined by dividing profit attributable to shareholders of the Company, excluding, if applicable, preferred dividends after-tax, amortization of discounts and premiums on issuance, premiums on repurchases,
Aecon Group Inc. 69

NOTES TO THE CONSOLIDATED FINANCIAL STATEMENTS DECEMBER 31, 2019 AND 2018 (in thousands of Canadian dollars, except per share amounts)
inducements to convert relating to convertible debentures and any costs of servicing equity other than common shares, by the weighted average number of common shares outstanding during the year. Diluted earnings per share Diluted earnings per share adjusts the figures used in the determination of basic earnings per share to take into account the after income tax effect of interest and other financing costs associated with dilutive potential common shares and the weighted average number of shares assumed to have been issued in relation to dilutive potential common shares. Dilutive potential common shares result from issuances of stock options and convertible debentures. 5.23 FOREIGN CURRENCY TRANSLATION Functional and presentation currency Items included in the financial statements of each of the Company’s entities are measured using the currency of the primary economic environment in which the entity operates (“the functional currency”). The consolidated financial statements are presented in thousands of Canadian dollars, which is the Company’s presentation currency. Transactions Foreign currency transactions are translated into the functional currency using the exchange rates prevailing at the dates of the transactions or valuation where items are remeasured. Foreign exchange gains and losses resulting from the settlement of such transactions and resulting from the translation at year-end exchange rates of monetary assets and liabilities denominated in foreign currencies are recognized in profit or loss, except when deferred in other comprehensive income for qualifying cash flow hedges and for qualifying net investment hedges. All foreign exchange gains and losses presented in profit or loss are presented within other income. Changes in the fair value of monetary securities denominated in a foreign currency classified as FVTOCI are separated between translation differences resulting from changes in the amortized cost of the security and other changes in the carrying amount of the security. Translation differences related to changes in amortized cost are recognized in profit or loss, and other changes in the carrying amount are recognized in other comprehensive income. Translation differences on non-monetary financial assets and liabilities such as equities held at fair value through profit or loss are recognized in profit or loss as part of the fair value gain or loss. Translation differences on non-monetary financial assets, such as equities classified as FVTOCI, are included in other comprehensive income.
Translation of foreign entities Assets and liabilities are translated from the functional currency to the presentation currency at the closing rate at the end of the reporting period. The consolidated statements of income are translated at exchange rates at the dates of the transactions or at the average rate if it approximates the actual rates. All resulting exchange differences are recognized in other comprehensive income. On disposal, or partial disposal, of a foreign entity, or repatriation of the net investment in a foreign entity, resulting in a loss of control, significant influence or joint control, the cumulative translation account balance recognized in equity relating to that particular foreign entity is recognized in profit or loss as part of the gain or loss on sale. On a partial disposition of a subsidiary that does not result in a loss of control, the amounts are reallocated to the non-controlling interest in the foreign operation based on its proportionate share of the cumulative amounts recognized in AOCI. On partial dispositions of jointly controlled foreign entities or associates, the proportionate share of translation differences previously recognized in AOCI is reclassified to profit or loss. 5.24 BUSINESS COMBINATIONS The Company uses the acquisition method of accounting to account for business combinations. The consideration transferred for the acquisition of a subsidiary includes the fair values of the assets transferred, the liabilities incurred and the equity interests issued by the Company. The consideration transferred includes the fair value of any asset or liability resulting from a contingent consideration arrangement. Acquisition related costs are expensed as incurred. Identifiable assets acquired, and liabilities and contingent liabilities assumed in a business combination, are measured initially at their
2019 Annual Report70

NOTES TO THE CONSOLIDATED FINANCIAL STATEMENTS DECEMBER 31, 2019 AND 2018 (in thousands of Canadian dollars, except per share amounts)
fair values at the acquisition date. For each acquisition, the Company recognizes any non-controlling interest in the acquiree either at fair value or at the non-controlling interest’s proportionate share of the acquiree’s net assets. The excess of the sum of the consideration transferred, the amount of any non-controlling interest in the acquiree and the acquisition date fair value of any previous equity interest in the acquiree over the fair value of the Company’s share of the identifiable net assets acquired is recorded as goodwill. If this amount is less than the fair value of the net assets of the subsidiary acquired, such as in the case of a bargain purchase, the difference is recognized directly in profit or loss. Non-controlling interests represent the equity in a subsidiary not attributable, directly or indirectly, to a parent and are presented in equity in the consolidated balance sheets, separately from the parent’s shareholders’ equity. 5.25 OPERATING SEGMENTS Operating segments are reported in a manner consistent with the internal reporting provided to the chief operating decision maker. The chief operating decision maker is responsible for allocating resources and assessing the performance of the operating segments and has been identified as the Executive Committee that makes strategic decisions.
6. CHANGES IN ACCOUNTING POLICIES
The following IFRS standards became effective for the Company on January 1, 2019. IFRS 16, Leases The Company has applied IFRS 16 with a date of initial application of January 1, 2019. As a result, the Company has changed its accounting policy for lease contracts as detailed below and in Note 5, “Summary of Significant Accounting Policies”. The Company applied IFRS 16 using the modified retrospective approach, under which the cumulative effect of initial application is recognized in retained earnings as at January 1, 2019, and the comparatives for the 2018 financial reporting period are not restated as permitted under the transition provisions in the standard. The details of the changes in accounting policies are disclosed below. IFRS 16 establishes principles for the recognition, measurement, presentation and disclosure of leases, with the objective of ensuring that lessees and lessors provide relevant information that faithfully represents those transactions. IFRS 16 superseded the current lease recognition guidance including IAS 17 “Leases” and the related interpretations when it became effective. The main changes to lease accounting as a result of IFRS 16 include the following:
The definition of a lease has changed under the new standard. Under IFRS 16, a contract is, or contains, a lease if the contract conveys the right to control the use of an identified asset for a period of time in exchange for consideration, as explained further in Note 5, “Summary of Significant Accounting Policies”. Previously, the Company determined at contract inception whether an arrangement is or contains a lease under IFRIC 4;
Under IFRS 16, the lessee recognizes a right-of-use asset and a lease liability upon lease commencement for leases with a lease term of greater than one year. The right-of-use asset is initially measured at the amount of the lease liability plus any initial direct costs incurred by the lessee. Subsequent measurement is determined based on the nature of the underlying asset. The lease liability is initially measured at the present value of the lease payments payable over the lease term and discounted at the implied lease rate. If the implied lease rate cannot be readily determined, the lessee uses its incremental borrowing rate. Subsequent re-measurement is required under specific circumstances. Previously, the Company classified leases as operating or finance leases based on its assessment of whether the lease transferred significantly all of the risks and rewards incidental to ownership of the underlying asset to the Company;
IFRS 16 provides detailed guidance on determining the lease term when the Company has an option to extend the lease; and
The new standard includes extensive disclosure requirements that differ from previous requirements.
Aecon Group Inc. 71

NOTES TO THE CONSOLIDATED FINANCIAL STATEMENTS DECEMBER 31, 2019 AND 2018 (in thousands of Canadian dollars, except per share amounts)
On transition to IFRS 16, for leases previously classified as finance leases under IAS 17, the Company elected to apply the practical expedient whereby the Company is not required to reassess whether a contract is, or contains, a lease at the date of initial application. As such, the Company applied IFRS 16 only to contracts that were previously identified as leases. Contracts that were not previously identified as leases under IAS 17 and IFRIC 4 were not reassessed. For leases that were previously classified as finance leases under IAS 17, the Company recognized the carrying amount of the lease asset and lease liability immediately before transition as the carrying amount of the right-of-use asset and the lease liability at the date of initial application. The Company also adopted the recognition exemptions permitted for short-term leases (i.e. less than 12 months) and leases for which the underlying asset has a low value, as well as the following practical expedients permitted on initial adoption, under the standard:
Applying a single discount rate to a portfolio of leases with similar characteristics; Using the Company’s previous assessment of impairment under IAS 37 “Provisions, Contingent Liabilities and
Contingent Assets” for onerous contracts instead of re-assessing the right-of-use asset for impairment on January 1, 2019;
Excluding initial direct costs from the measurement of the right-of-use asset at the date of initial application; and Using hindsight in determining the lease term where the contract contains terms to extend or terminate the lease.
The following table reconciles the impact of IFRS 16 on the previously reported Consolidated Balance Sheet as at December 31, 2018:
As reported at December 31,
2018
Impacts from the adoption of
IFRS 16
As adjusted at January 1, 2019
Property, plant and equipment $ 266,199 44,836 $ 311,035Trade and other payables (705,760) 1,817 (703,943)Current portion of long-term debt (32,505) (8,163) (40,668)Long-term debt (69,707) (36,673) (106,380)Deferred income tax liabilities (117,626) (481) (118,107)Retained earnings (369,505) (1,336) (370,841)
2019 Annual Report72

NOTES TO THE CONSOLIDATED FINANCIAL STATEMENTS DECEMBER 31, 2019 AND 2018 (in thousands of Canadian dollars, except per share amounts)
Opening reconciliation of lease liability A reconciliation of the lease liability as at December 31, 2018 compared to January 1, 2019 is as follows: As at January 1, 2019Operating lease commitments as at December 31, 2018 as disclosed in the Company's consolidated financial statements $ 56,803 Operating lease commitments discounted using the weighted average incremental lease borrowing rate of 3.89% as at January 1, 2019
48,558
Less: Recognition exemption for short-term leases and leases of low value assets (3,722)Add: Finance lease liabilities recognized as at December 31, 2018 72,772
Lease liability recognized as at January 1, 2019 117,608 Add: Equipment and other loans as at December 31, 2018 29,440 Total long-term debt as at January 1, 2019 $ 147,048 Reported as: Current portion of long-term debt $ 40,668 Long-term debt 106,380 $ 147,048
Other New Standards, Amendments and Interpretations Adopted In 2019 The following amendments to standards and interpretations also became effective for annual periods beginning on January 1, 2019. The application of these amendments and interpretations had no significant impact on the Company’s consolidated financial position or results of operations. IFRS 3, Business Combinations The amendments to IFRS 3 clarify that when an entity obtains control of a business that is a joint operation, it remeasures previously held interests in that business. IFRS 11, Joint Arrangements The amendments to IFRS 11 clarify that when an entity obtains joint control of a business that is a joint operation, the entity does not remeasure previously held interests in that business. IAS 12, Income Taxes The amendments to IAS 12 clarify that all income tax consequences of dividends (i.e. distribution of profits) should be recognized in profit or loss, regardless of how the tax arises. IAS 23, Borrowing Costs The amendments to IAS 23 clarify that if any specific borrowing remains outstanding after the related asset is ready for its intended use or sale, that borrowing becomes part of the funds that an entity borrows generally when calculating the capitalization rate on general borrowings. IAS 19, Employee Benefits The amendments to IAS 19, Plan Amendment, Curtailment or Settlement, specify how an entity determines pension expenses when changes to a defined benefit pension plan occur. The amendments require an entity to:
Use updated assumptions to determine current service cost and net interest for the remainder of the period after a plan amendment, curtailment or settlement; and
Recognize in profit or loss as part of past service cost, or a gain or loss on settlement, any reduction in a surplus, even if that surplus was not previously recognized because of the impact of the asset ceiling.
Aecon Group Inc. 73

NOTES TO THE CONSOLIDATED FINANCIAL STATEMENTS DECEMBER 31, 2019 AND 2018 (in thousands of Canadian dollars, except per share amounts)
Previously, IAS 19 did not specify how to determine these expenses for the period after the change to the plan. IFRIC 23, Uncertainty over Income Tax Treatments IFRIC 23 clarifies the accounting for uncertainties in income taxes. The interpretation clarifies the application of the recognition and measurement requirements in IAS 12 “Income Taxes” when there is uncertainty over income tax treatments. The interpretation specifically addresses the following:
Whether an entity considers uncertain tax treatments separately; The assumptions an entity makes about the examination of tax treatments by taxation authorities; How an entity determines taxable profit (loss), tax bases, unused tax losses, unused tax credits and tax rates; and How an entity considers changes in facts and circumstances.
7. FUTURE ACCOUNTING CHANGES
IFRS 3, Business Combinations The amendments to IFRS 3 “Business Combinations” seek to improve the definition of a business. The amendments assist companies in determining whether activities and assets acquired are a business or merely a group of assets. The amended definition emphasizes that the output of a business is to provide goods and services to customers, whereas the previous definition focused on returns in the form of dividends, lower costs or other economic benefits to investors and others. Companies are required to apply the amended definition of a business to acquisitions that occur on or after January 1, 2020. The Company does not anticipate any material impact to the Company’s financial position or results of operations as a result of these amendments. IAS 1, Presentation of Financial Statements and IAS 8, Accounting Policies, Changes in Accounting Estimates and Errors The amendments clarify the definition of material and seek to align the definition used in the Conceptual Framework with that in the standards themselves as well as ensuring the definition of material is consistent across all IFRS. The changes are effective from January 1, 2020.
Old definition: Omissions or misstatements of items are material if they could, individually or collectively, influence
Statements”). New definition: Information is material if omitting, misstating or obscuring it could reasonably be expected to
influence the decisions that the primary users of general purpose financial statements make on the basis of those financial statements, which provide financial information about a specific reporting entity.
The Company does not anticipate any material impact to the Company’s financial position or results of operations as a result of these amendments.
IFRS 9, Financial Instruments, IAS 39, Financial Instruments: Recognition and Measurement and IFRS 7, Financial Instruments: Disclosures The International Accounting Standards Board has published “Interest Rate Benchmark Reform” amendments to address the implications of specific hedge accounting requirements in IFRS 9, IAS 39 and IFRS 7. The amendments are effective for annual periods beginning on or after January 1, 2020. The amendments modify specific hedge accounting requirements so that the interest rate benchmark used with the hedged cash flows and the cash flows of the hedging instrument is not altered as a result of the uncertainties with the interest rate benchmark reform. The Company does not anticipate any material impact to the Company’s financial position or results of operations as a result of these amendments.
2019 Annual Report74
the economic decisions that users make on the basis of the financial statements (IAS 1, “Presentation of Financial

NOTES TO THE CONSOLIDATED FINANCIAL STATEMENTS DECEMBER 31, 2019 AND 2018 (in thousands of Canadian dollars, except per share amounts)
8. CASH AND CASH EQUIVALENTS, AND RESTRICTED CASH
December 31 December 31 2019 2018
Cash balances excluding joint operations
$ 188,976 $ 158,452
Cash balances of joint operations 493,288 472,524 $ 682,264 $ 630,976
Restricted cash
$ 76,595 $ 193,369
$ 76,595 $ 193,369
Cash and cash equivalents on deposit in the bank accounts of joint operations cannot be accessed directly by the Company. Restricted cash is cash held by Bermuda Skyport Corporation Limited (“Skyport”). This cash cannot be used by the Company other than to finance the Bermuda International Airport Redevelopment Project.
9. TRADE AND OTHER RECEIVABLES December 31 December 31 2019 2018 Trade receivables $ 399,618 $ 443,571Allowance for expected credit losses (758) (762)
398,860 442,809 Holdbacks receivable 233,260 185,526Other 49,985 69,276
283,245 254,802
Total $ 682,105 $ 697,611
Amounts receivable beyond one year $ 115,809 $ 78,909
Aecon Group Inc. 75

NOTES TO THE CONSOLIDATED FINANCIAL STATEMENTS DECEMBER 31, 2019 AND 2018 (in thousands of Canadian dollars, except per share amounts)
A reconciliation of the beginning and ending carrying amounts of the Company’s allowance for expected credit losses is as follows: December 31 December 31 2019 2018
Balance - beginning of year $ (762) $ (764)
Additional amounts provided for during year (634) (724)Trade receivables written off during year 183 726Amounts recovered 455 -Balance - end of year $ (758) $ (762)
10. UNBILLED REVENUE AND DEFERRED REVENUE A reconciliation of the beginning and ending carrying amounts of unbilled revenue and deferred revenue is as follows:
For the year ended For the year ended December 31, 2019 December 31, 2018
Unbilled revenue
Deferredrevenue
Unbilled revenue
Deferredrevenue
Balance outstanding - beginning of year $ 573,678 $ (508,306) $ 554,039 $ (206,681)Revenue earned in the year 2,709,905 750,513 2,173,177 1,093,114Billings in the year (2,684,725) (725,335) (2,153,538) (1,394,739)
Balance outstanding - end of year $ 598,858 $ (483,128) $ 573,678 $ (508,306)
Revenue was not impacted by performance obligations satisfied in previous periods during the year ended December 31, 2019 (2018 - $3,600 reduction). The amount in 2018 primarily related to the impact of an adjustment to forecasted revenue and cost. Revenue recognized in 2019 from deferred revenue balances existing at the beginning of the year totalled $314,465 (2018 - $176,216).
11. INVENTORIES
December 31 December 31 2019 2018 Raw materials and supplies $ 7,134 $ 5,287Finished goods 17,765 15,464
$ 24,899 $ 20,751
2019 Annual Report76

NOTES TO THE CONSOLIDATED FINANCIAL STATEMENTS DECEMBER 31, 2019 AND 2018 (in thousands of Canadian dollars, except per share amounts)
12. PROJECTS ACCOUNTED FOR USING THE EQUITY METHOD The Company performs some construction and concession related projects through non-consolidated entities. The Company’s participation in these entities is conducted through joint ventures and associates and is accounted for using the equity method. The Company’s joint ventures and associates are private entities and there is no quoted market price available for their shares. The summarized financial information below reflects the Company’s share of the amounts presented in the financial statements of joint ventures and associates: December 31, 2019 December 31, 2018
Joint
Ventures Associates TotalJoint
Ventures Associates Total Cash and cash equivalents $ 4,527 $ 2,054 $ 6,581 $ 9,181 $ 2,150 $ 11,331 Other current assets 27,389 5,860 33,249 69,743 1,296 71,039 Total current assets 31,916 7,914 39,830 78,924 3,446 82,370 Non-current assets 691,163 - 691,163 522,900 - 522,900 Total assets 723,079 7,914 730,993 601,824 3,446 605,270 Trade and other payables and provisions 28,224 765 28,989 59,493 936 60,429 Other current financial liabilities 16,976 - 16,976 - - -Total current liabilities 45,200 765 45,965 59,493 936 60,429 Non-current financial liabilities 635,967 - 635,967 504,199 - 504,199 Other non-current liabilities 3,548 - 3,548 1,167 - 1,167 Total non-current liabilities 639,515 - 639,515 505,366 - 505,366 Total liabilities 684,715 765 685,480 564,859 936 565,795 Net assets $ 38,364 $ 7,149 $ 45,513 $ 36,965 $ 2,510 $ 39,475
For the year ended December 31, 2019 December 31, 2018
Joint
Ventures Associates Total Joint
Ventures Associates Total Revenue $ 492,119 $ 1,564 $ 493,683 $ 544,739 $ 2,344 $ 547,083 Depreciation and amortization (621) - (621) (420) - (420)Other costs and expenses (455,797) (1,449) (457,246) (517,578) (2,158) (519,736)Operating profit 35,701 115 35,816 26,741 186 26,927 Finance costs (21,505) - (21,505) (13,202) - (13,202)Income tax expense (1,820) - (1,820) (575) - (575)Profit for the year 12,376 115 12,491 12,964 186 13,150 Other comprehensive (loss) (2,109) - (2,109) (6,085) - (6,085)Total comprehensive income $ 10,267 $ 115 $ 10,382 $ 6,879 $ 186 $ 7,065
Aecon Group Inc. 77

NOTES TO THE CONSOLIDATED FINANCIAL STATEMENTS DECEMBER 31, 2019 AND 2018 (in thousands of Canadian dollars, except per share amounts)
The movement in the investment in projects accounted for using the equity method is as follows:
For the year ended
December 31 December 31 2019 2018 Projects accounted for using the equity method - as at January 1 $ 39,475 $ 32,610Share of profit for the year 12,491 13,150Share of other comprehensive (loss) for the year (2,109) (6,085)Distributions from projects accounted for using the equity method (4,889) (200)Other investments 545 -Projects accounted for using the equity method - as at December 31 $ 45,513 $ 39,475
The following joint ventures and associates are included in projects accounted for using the equity method:
Name Ownership
interest Joint Venture or
Associate Years included
Yellowline Asphalt Products Ltd. 50% Joint Venture 2019, 2018 Lower Mattagami Project 20% Associate 2019, 2018 Waterloo LRT Concessionaire 10% Joint Venture 2019, 2018 Eglinton Crosstown LRT Concessionaire 25% Joint Venture 2019, 2018 New Post Creek Project 20% Associate 2019, 2018 Finch West LRT Concessionaire 33% Joint Venture 2019, 2018 Gordie Howe International Bridge Concessionaire 20% Joint Venture 2019, 2018 Sky-Tec Fibre JV 50% Joint Venture 2019 Highway 401 Expansion Project SPV 50% Joint Venture 2019 Projects accounted for using the equity method include various concession joint ventures as listed above. However, the construction activities related to these concessions are classified as joint operations which are accounted for in the consolidated financial statements by reflecting, line by line, the Company's share of the assets held jointly, liabilities incurred jointly, and revenue and expenses arising from the joint operations.
2019 Annual Report78

NOTES TO THE CONSOLIDATED FINANCIAL STATEMENTS DECEMBER 31, 2019 AND 2018 (in thousands of Canadian dollars, except per share amounts)
13. PROPERTY, PLANT AND EQUIPMENT
Land
Buildings andleasehold
improvementsAggregate properties
Machinery and construction
equipment
Office equipment,
furniture and fixtures, and
computer hardware Vehicles
Heavy equipment Total
Cost
Balance as at December 31, 2018 $ 28,480 $ 97,430 $ 56,236 $ 281,864 $ 33,931
$ 63,336 $ - $ 561,277
Change in accounting policy (see Note 6) 1,566 34,050 - 9,220 - - - 44,836
Adjusted balance as at January 1, 2019 30,046 131,480 56,236 291,084 33,931 63,336 - 606,113 Additions - purchased assets 6,314 12,012 324 20,049 3,159 293 - 42,151 Additions - right-of-use assets 1,006 8,667 - 44,395 - 10,875 - 64,943 Disposals - - - (30,737) (327) (9,513) - (40,577)Foreign currency translation adjustments - (127) - (317) (39) (40) - (523)
Balance as at December 31, 2019 $ 37,366 $ 152,032 $ 56,560 $ 324,474 $ 36,724
$ 64,951 $ - $ 672,107
Accumulated depreciation and impairment Balance as at January 1, 2019 - 45,379 19,283 158,890 29,381 42,145 - 295,078 Depreciation - purchased assets - 4,902 680 14,605 2,670 695 - 23,552 Depreciation - right-of-use assets (a) 509 5,727 - 15,049 - 8,250 - 29,535 Disposals - - - (17,908) (327) (9,167) - (27,402)Foreign currency translation adjustments - (11) - (20) (15) (14) - (60)
Balance as at December 31, 2019 $ 509 $ 55,997 $ 19,963 $ 170,616 $ 31,709 $ 41,909 $ - $ 320,703
Net book value as at December 31, 2019 $ 36,857 $ 96,035 $ 36,597 $ 153,858
$ 5,015
$ 23,042
$ - $ 351,404
Net book value as at January 1, 2019 $ 30,046 $ 86,101 $ 36,953 $ 132,194
$ 4,550
$ 21,191
$ - $ 311,035
Net book value of right-of-use assets included in property, plant & equipment as at January 1, 2019 $ 1,566 $ 34,050 $ 75 $ 60,166
$ -
$ 19,068
$ - $ 114,925
Net book value of right-of-use assets included in property, plant & equipment as at December 31, 2019 $ 2,063 $ 36,883 $ 75 $ 79,025
$ -
$ 20,877
$ - $ 138,923
(a) Depreciation of land relates to leases of land following the adoption of IFRS 16.
Land
Buildings and leasehold
improvementsAggregate properties
Machinery and construction
equipment
Office equipment,
furniture and fixtures, and
computer hardware Vehicles
Heavy equipment Total
Cost
Balance as at January 1, 2018 $ 33,480 $ 97,732 $ 55,952 $ 293,802 $ 33,003
$ 69,415 $ 269,585 $ 852,969Additions 600 10,839 284 31,741 1,719 9,721 16,276 71,180Disposals (b) (5,600) (11,158) - (43,993) (852) (15,864) (285,861) (363,328)Foreign currency translation adjustments - 17 - 314 61 64 - 456
Balance as at December 31, 2018 $ 28,480 $ 97,430 $ 56,236 $ 281,864 $ 33,931
$ 63,336 $ - $ 561,277
Accumulated depreciation and impairment Balance as at January 1, 2018 - 47,137 18,184 155,463 27,032 48,058 99,944 395,818Depreciation - 4,976 1,099 25,008 3,184 8,279 23,894 66,440Disposals (b) - (6,736) - (21,584) (850) (14,206) (123,838) (167,214)Foreign currency translation adjustments - 2 - 3 15 14 - 34
Balance as at December 31, 2018 $ - $ 45,379 $ 19,283 $ 158,890 $ 29,381 $ 42,145 $ - $ 295,078
Net book value as at December 31, 2018 $ 28,480
$ 52,051
$ 36,953
$ 122,974
$ 4,550
$ 21,191
$ - $ 266,199
Net book value as at January 1, 2018 $ 33,480
$ 50,595
$ 37,768
$ 138,339
$ 5,971
$ 21,357
$ 169,641 $ 457,151
Net book value of assets under finance lease included in property, plant & equipment as at December 31, 2018 $ -
$ -
$ 75
$ 50,946
$ -
$ 19,068
$ - $ 70,089
(b) In 2018, the Company sold the assets of its contract mining business (see Note 26).
Aecon Group Inc. 79

NOTES TO THE CONSOLIDATED FINANCIAL STATEMENTS DECEMBER 31, 2019 AND 2018 (in thousands of Canadian dollars, except per share amounts)
14. INTANGIBLE ASSETS
Concession
rights Goodwill
Licences, software and
other rights Total
Cost
Balance as at January 1, 2019 $ 399,371 $ 47,845 $ 91,871 $ 539,087
Additions
Separately acquired or constructed 142,504 5,048 2,273 149,825
Interest capitalized 20,030 - - 20,030
Disposals - - (686) (686)
Foreign currency translation adjustments (22,579) - (20) (22,599)
Balance as at December 31, 2019 $ 539,326 $ 52,893 $ 93,438 $ 685,657
Accumulated amortization and impairment
Balance as at January 1, 2019 54,738 - 38,706 93,444
Amortization 30,867 - 10,173 41,040
Disposals - - - -
Foreign currency translation adjustments (3,272) - (11) (3,283)
Balance as at December 31, 2019 $ 82,333 $ - $ 48,868 $ 131,201
Net book value as at December 31, 2019 $ 456,993 $ 52,893 $ 44,570 $ 554,456
Net book value as at January 1, 2019 $ 344,633 $ 47,845 $ 53,165 $ 445,643
Concession
Rights Goodwill
Licences, software and
other rights Total Cost
Balance as at January 1, 2018 $ 208,642 $ 49,373 $ 89,112 $ 347,127
Additions Separately acquired or constructed 147,302 - 3,474 150,776 Interest capitalized 16,570 - - 16,570 Disposals - (1,528) (749) (2,277) Foreign currency translation adjustments 26,857 - 34 26,891
Balance as at December 31, 2018 $ 399,371 $ 47,845 $ 91,871 $ 539,087
Accumulated amortization and impairment Balance as at January 1, 2018 23,404 - 29,845 53,249 Amortization 27,921 - 9,471 37,392 Disposals - - (622) (622) Foreign currency translation adjustments 3,413 - 12 3,425
Balance as at December 31, 2018 $ 54,738 $ - $ 38,706 $ 93,444
Net book value as at December 31, 2018 $ 344,633 $ 47,845 $ 53,165 $ 445,643
Net book value as at January 1, 2018 $ 185,238 $ 49,373 $ 59,267 $ 293,878
2019 Annual Report80

NOTES TO THE CONSOLIDATED FINANCIAL STATEMENTS DECEMBER 31, 2019 AND 2018 (in thousands of Canadian dollars, except per share amounts)
Concession rights – Bermuda International Airport Redevelopment Project The Company holds a 100% interest in Bermuda Skyport Corporation Limited (“Skyport”), a Bermudian company undertaking the L.F. Wade International Redevelopment Project in Bermuda (“Bermuda International Airport Redevelopment Project”). Skyport’s main operations consist of: (a) managing and operating the existing L.F Wade International Airport (the “Existing Bermuda Airport”); and
(b) managing the development, financing, construction, operation and maintenance of the new airport terminal and
associated infrastructure (“New Airport Terminal”) under a 30-year concession arrangement.
The right to operate the Existing Bermuda Airport was initially recognized at fair value and assigned an estimated value of $92,994 (US$69,871) at the date of financial close in 2017. As at December 31, 2019 this concession right had a remaining carrying amount of $8,414 (2018 - $40,580). Skyport amortizes this concession right over the remaining term of the right to operate the Existing Bermuda Airport with amortization based on usage (estimated traffic volumes). The New Airport Terminal is expected to open in the third or early fourth quarter of 2020.
At December 31, 2019, the concession right for the New Airport Terminal, representing the costs to construct the New Airport Terminal, had a carrying amount of $448,579 (2018 - $304,053). Amortization of this concession right will commence after construction of the New Airport Terminal is completed. Amortization of intangible assets is included in the depreciation and amortization expense line item on the consolidated statements of income. Goodwill The following CGUs or groups of CGUs have significant amounts of goodwill allocated to them for the purposes of impairment testing: December 31 December 31 2019 2018CGUs: Conventional Industrial $ 30,633 $ 30,633Civil West 11,072 11,072Utilities 7,165 2,117Civil East 4,023 4,023 $ 52,893 $ 47,845
The recoverable amounts of the above listed CGUs were determined based on fair value less costs to sell calculations. Fair value less costs to sell calculations use post-tax cash flow projections expected to be generated by the CGU based on financial budgets approved by management covering a two-year period. For the CGUs noted above, cash flows beyond the two-year period were extrapolated as at December 31, 2019 using a growth rate of 2% (2018 – 2%), which does not exceed the long-term average growth rate for the business in which the CGUs operate. The discount rate applied to cash flow projections as at December 31, 2019 was 8.25% (2018 – 9.25%) based on the Company’s post-tax weighted average cost of capital. Detailed sensitivity analyses were conducted to assess the impact of changes in growth rates, costs of capital and cash flows on the recoverable amount, which has not indicated that the carrying amount of the CGU exceeds the recoverable amount. Budgeted cash flows were determined by management based on the Company’s past performance, backlog currently on hand and future revenue prospects. In 2018, the Company sold the assets of its contract mining business (see Note 26). As a result of this transaction, goodwill was reduced by $1,528 in 2018.
Aecon Group Inc. 81

NOTES TO THE CONSOLIDATED FINANCIAL STATEMENTS DECEMBER 31, 2019 AND 2018 (in thousands of Canadian dollars, except per share amounts)
15. BANK INDEBTEDNESS
As at December 31, 2019, the Company had a committed revolving credit facility of $600,000 (2018 - $500,000), and a $100,000 uncommitted demand letter of credit facility (2018 - $nil). Bank indebtedness representing borrowings on the Company's revolving credit facility as at December 31, 2019 was $nil (2018 - $nil). Letters of credit amounting to $74,772 and $16,325, respectively, were issued against the revolving credit facility and the uncommitted demand letter of credit facility as at December 31, 2019 (2018 - $115,957 and $nil, respectively). Cash drawings under the facility bear interest at rates between prime and prime plus 1.20% per annum. Letters of credit reduce the amount available-for-use under the facility. These facilities mature July 19, 2023. Drawings on the facility are secured by a general security agreement which provides the lenders with a first priority ranking security interest, subject to existing encumbrances, over certain existing and future assets of the Company. Security is also provided by way of a $90,000 collateral mortgage, subject to existing encumbrances, over certain aggregate properties owned by the Company, and by guarantees from all entities that are required to provide security under the general security agreement. The Company also maintains an additional performance security guarantee facility of $700,000 (2018 - $700,000) to support letters of credit provided by Export Development Canada of which $530,295 was utilized as at December 31, 2019 (2018 - $519,561). This performance security guarantee facility matures June 30, 2021.
16. TRADE AND OTHER PAYABLES
December 31 December 31 2019 2018
Trade payables and accrued liabilities $ 674,101 $ 631,231 Holdbacks payable 99,633 74,529
$ 773,734 $ 705,760
Amounts payable beyond one year $ 7,557 $ 1,608
2019 Annual Report82

NOTES TO THE CONSOLIDATED FINANCIAL STATEMENTS DECEMBER 31, 2019 AND 2018 (in thousands of Canadian dollars, except per share amounts)
17. PROVISIONS
Contractrelated
obligations
Asset decommissioning
costsTax
assessments Other Total (a) (b) (c)
Balance as at January 1, 2019 $ 4,443 $ 4,400 $ 6,456 $ 4,910 $ 20,209 Additions made 2,210 524 865 8,888 12,487 Amounts used (636) (149) - (5,314) (6,099)Other changes 48 176 - - 224
Balance as at December 31, 2019 $ 6,065 $ 4,951 $ 7,321 $ 8,484 $ 26,821 Reported as: Current 4,668 - 7,321 8,484 20,473 Non-current 1,397 4,951 - - 6,348
$ 6,065 $ 4,951 $ 7,321 $ 8,484 $ 26,821
(a) Contract related obligations are made up of contract warranty obligations and litigation risks relating to construction operations. Contract warranty obligations relate to warranties provided by the Company in respect of its construction contracts. If not used during the warranty period, these amounts will be reversed into income. Warranty periods range from one to seven years.
(b) Asset decommissioning costs relate to future legal and constructive obligations associated with the retirement of pits and quarries engaged in aggregate mining operations in Ontario and Alberta. Decommissioning obligations are expected to be settled between 2020 and 2108 at which point the amount of the liability will reverse. A 1.50% inflation factor has been applied to obtain the future value of the decommissioning costs, which has been discounted at a rate of 3.98% to obtain the present value of the obligation.
(c) Tax assessments include provisions for specific income tax exposures faced by the Company. Although final federal and provincial reassessments have not yet been issued for certain years, the Company believes that it has adequate provisions to cover the ultimate outcome of this and other tax reassessments.
Aecon Group Inc. 83

NOTES TO THE CONSOLIDATED FINANCIAL STATEMENTS DECEMBER 31, 2019 AND 2018 (in thousands of Canadian dollars, except per share amounts)
18. LONG-TERM DEBT AND NON-RECOURSE PROJECT DEBT
LONG-TERM DEBT December 31 December 31 2019 2018 Long-term debt: Leases $ 171,357 $ 72,772Equipment and other loans 34,396 29,440Total long-term debt $ 205,753 $ 102,212 Reported as: Current liabilities: Current portion of long-term debt $ 60,071 $ 32,505
Non-current liabilities: Long-term debt 145,682 69,707 $ 205,753 $ 102,212 The following describes the components of long-term debt:
(a) As at December 31, 2019, leases of $171,357 (December 31, 2018 - $72,772) bore interest at fixed rates averaging 3.29% (December 31, 2018 – 3.15%) per annum, with specific equipment provided as security.
(b) As at December 31, 2019, equipment and other loans of $34,396 (December 31, 2018 - $29,440) bore interest at
fixed rates averaging 3.02% (December 31, 2018 – 3.10%) per annum, with specific equipment provided as security.
The weighted average interest rate on total long-term debt outstanding (excluding convertible debentures and non-recourse project debt) as at December 31, 2019 was 3.25% (December 31, 2018 – 3.14%). Expenses relating to short-term leases and leases of low-value assets recognized in the statement of income for the year ended December 31, 2019 was $79,665. Variable lease payments of $1,845 related to property taxes levied on lessors and not included in the measurement of lease liabilities were recognized in the statement of income during the year ended December 31, 2019. Total cash outflow related to leases in 2019 was $40,450 (2018 – $25,907).
charged on right-of-use assets during the year ended December 31, 2019. Refer to Note 27, “Finance cost” for further details of interest on lease liabilities recognized during the year ended December 31, 2019. Refer to Note 30, “Financial instruments” for contractual maturities of lease liabilities as at December 31, 2019. Lease extension and termination options are included in a number of property and equipment leases across the Company. As at December 31, 2019, potential future cash outflow of $27,499 related to these extension and termination options are not included in the lease liability because it is not reasonably certain that the leases will be extended (or not terminated).
2019 Annual Report84
Refer to Note 13, “Property, plant and equipment” for further details of additions to right-of-use assets and depreciation

NOTES TO THE CONSOLIDATED FINANCIAL STATEMENTS DECEMBER 31, 2019 AND 2018 (in thousands of Canadian dollars, except per share amounts)
As at December 31, 2019, potential future cash outflow of $9,983 related to variable lease payments for property taxes and/or insurance payments made by lessors have not been reflected in the measurement of lease liabilities. These variable lease payments are recognized in the statement of income in the period in which those payments occur. NON-RECOURSE PROJECT DEBT December 31 December 31 2019 2018 Non-recourse project debt: Bermuda International Airport Redevelopment Project financing (a) $ 365,894 $ 383,746 Total non-recourse project debt $ 365,894 $ 383,746 Reported as: Non-current liabilities: Non-recourse project debt $ 365,894 $ 383,746 $ 365,894 $ 383,746
(a) Included in the Company’s consolidated balance sheet as at December 31, 2019 is debt, net of transaction costs, of
$365,894 (US$281,717) (December 31, 2018 – $383,746, US$281,298) representing the debt of Skyport. This debt is secured by the assets of Skyport and is without recourse to the Company.
The financing is denominated in US dollars and bears interest at 5.90% annually. Debt repayments commence in
2022 and are scheduled to continue until 2042.
The movements in net debt for 2019 are presented below:
Net debt reconciliation
CashBank
indebtednessLong-term
debt Convertible debentures
Non-recourse project debt
Balance as at January 1, 2019 $ 630,976 $ - $ (102,212) $ (159,775) $ 383,746
Cash flows 54,298 - 34,353 - -
Foreign exchange adjustments (3,010) - 82 - (18,405)
Opening impact of adoption of IFRS 16 Leases - - (44,836) - -
Non-cash lease additions - - (88,149) - -
Interest accretion and other non-cash movements - - (4,991) (4,576) 553
Balance as at December 31, 2019 $ 682,264 $ - $ (205,753) $ (164,351) $ 365,894
Aecon Group Inc. 85

NOTES TO THE CONSOLIDATED FINANCIAL STATEMENTS DECEMBER 31, 2019 AND 2018 (in thousands of Canadian dollars, except per share amounts)
19. CONVERTIBLE DEBENTURES Convertible subordinated debentures consist of: December 31 December 31 2019 2018Debt component: Debenture maturing on December 31, 2023 - 5.0% Debentures 164,351 159,775
Total convertible debentures $ 164,351 $ 159,775 Reported as: Non-current liabilities: Convertible debentures 164,351 159,775
$ 164,351 $ 159,775
December 31 December 31 2019 2018Equity component: Debenture maturing on December 31, 2023 - 5.0% Debentures $ 12,707 $ 12,707
On September 26, 2018, the Company issued $160,000 of unsecured subordinated convertible debentures maturing December 31, 2023 and bearing interest at 5.0% per annum payable on a semi-annual basis (the “5.0% Debentures”). On October 1, 2018, an additional $24,000 of debentures were issued pursuant to the exercise of the over-allotment option granted to the syndicate of underwriters, bringing the total aggregate gross proceeds from the offering to $184,000. At the holder’s option, the 5.0% Debentures may be converted into common shares of the Company at any time up to the maturity dates at a conversion price of $24.00 for each common share, subject to adjustment in certain circumstances. The 5.0% Debentures will not be redeemable before December 31, 2021. The Company may, at its option, redeem the 5.0% Debentures from December 31, 2021 to December 31, 2022, in whole or in part, at par plus accrued and unpaid interest, provided that the volume weighted average trading price of the common shares on the Toronto Stock Exchange during a specified period prior to redemption is not less than 125% of the conversion price. From December 31, 2022 through to the maturity date, the Company, at its option, may redeem the 5.0% Debentures, in whole or in part, at par plus accrued and unpaid interest. In 2013, the Company issued $172,500 of unsecured subordinated convertible debentures maturing December 31, 2018 and bearing interest at 5.5% per annum payable on a semi-annual basis (the “5.5% Debentures”). In 2018, 5.5% Debentures with a face value of $3,285 were converted at $19.71 per share by the holders into 166,664 common shares and the remaining 5.5% Debentures with a face value of $169,022 plus accrued and unpaid interest of $3,769 were redeemed. As at December 31, 2019, the face value of the 5.0% Debentures and 5.5% Debentures, which remain outstanding, were $184,000 and $nil, respectively, (2018 – $184,000 and $nil, respectively). For the 5.0% Debentures, subject to specified conditions, the Company has the right to repay the outstanding principal amount of the convertible debentures, on maturity or redemption, through the issuance of common shares of the Company. The Company also has the option to satisfy its obligation to pay interest through the issuance and sale of additional common shares of the Company. The 5.0% Debentures do not contain a cash settlement feature on conversion into common shares of the Company. The debt component of the 5.0% Debentures was measured at fair value on initial recognition. To determine the initial amount of the respective debt and equity components of the 5.0% Debentures issued during 2018, the carrying amount of
2019 Annual Report86
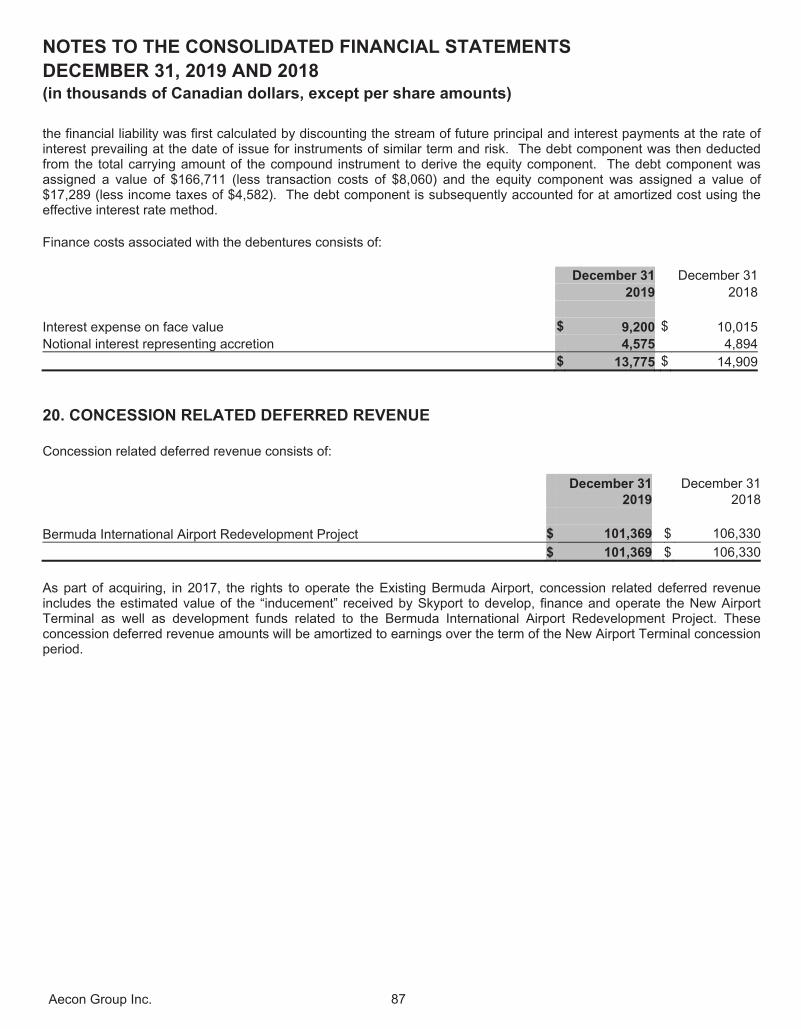
NOTES TO THE CONSOLIDATED FINANCIAL STATEMENTS DECEMBER 31, 2019 AND 2018 (in thousands of Canadian dollars, except per share amounts)
the financial liability was first calculated by discounting the stream of future principal and interest payments at the rate of interest prevailing at the date of issue for instruments of similar term and risk. The debt component was then deducted from the total carrying amount of the compound instrument to derive the equity component. The debt component was assigned a value of $166,711 (less transaction costs of $8,060) and the equity component was assigned a value of $17,289 (less income taxes of $4,582). The debt component is subsequently accounted for at amortized cost using the effective interest rate method. Finance costs associated with the debentures consists of: YTD ended December 31 December 31 2019 2018 Interest expense on face value $ 9,200 $ 10,015 Notional interest representing accretion 4,575 4,894 $ 13,775 $ 14,909
20. CONCESSION RELATED DEFERRED REVENUE Concession related deferred revenue consists of: December 31 December 31 2019 2018 Bermuda International Airport Redevelopment Project $ 101,369 $ 106,330
$ 101,369 $ 106,330
As part of acquiring, in 2017, the rights to operate the Existing Bermuda Airport, concession related deferred revenue includes the estimated value of the “inducement” received by Skyport to develop, finance and operate the New Airport Terminal as well as development funds related to the Bermuda International Airport Redevelopment Project. These concession deferred revenue amounts will be amortized to earnings over the term of the New Airport Terminal concession period.
Aecon Group Inc. 87

NOTES TO THE CONSOLIDATED FINANCIAL STATEMENTS DECEMBER 31, 2019 AND 2018 (in thousands of Canadian dollars, except per share amounts)
21. INCOME TAXES The provision for income taxes differs from the result that would be obtained by applying combined Canadian federal and provincial (Ontario, Alberta, Quebec and British Columbia) statutory income tax rates to profit or loss before income taxes. This difference results from the following:
December 31 December 31
2019 2018 Profit before income taxes $ 86,774 $ 67,027 Statutory income tax rate 26.60% 26.75%Expected income tax expense (23,082) (17,930) Effect on income taxes of: Projects accounted for using the equity method 516 428 Provincial and foreign rate differences 9,578 9,403 Non-taxable portion of capital gains - 470 Other non-deductible expenses (1,442) (1,534) Adjustments in respect of prior years 549 721 Other tax credits (40) (100) Other - 529 9,161 9,917 Income tax expense $ (13,921) $ (8,013)
Deferred taxes have been remeasured to reflect statutory enacted future tax rates.
Income taxes were comprised of the following: December 31 December 31 2019 2018 Current income tax $ (19,708) $ (5,053)Deferred income tax 5,787 (2,939)Other tax (provisions)/credit - (21)Income tax expense $ (13,921) $ (8,013)
2019 Annual Report88

NOTES TO THE CONSOLIDATED FINANCIAL STATEMENTS DECEMBER 31, 2019 AND 2018 (in thousands of Canadian dollars, except per share amounts)
The movement in the components of deferred income taxes is as follows:
2019 2018
(Charged)/ (Charged)/ (Charged)/ (Charged)/
credited credited (Charged)/ credited credited (Charged)/
to the to other credited to the to other credited
income comprehensive to income comprehensive to
January 1 statement income equity December 31 January 1 statement income equity December 31
Canadian components:
Net operating and capital losses carried forward $ 93,229 $ (3,470) $ - $ - $ 89,759 $ 105,832 $ (12,603) $ - $ - $ 93,229
Reserves expensed for financial statement purposes
and deducted for income tax purposes when paid 3,410 807 - - 4,217 2,396 1,014 - - 3,410
Other temporary differences (142) 4 - - (138) (8) (134) - - (142)
Other long-term differences 977 3,129 - - 4,106 1,982 (1,005) - - 977
Actuarial and hedging gains and losses 414 - 1,491 - 1,905 1,987 - (1,573) - 414
Property, plant and equipment: net book value in
excess of tax basis (30,565) 4,360 - (523) (26,728) (51,157) 20,592 - - (30,565)
Long-term contracts, including joint ventures (1) (158,054) 154 - - (157,900) (146,415) (11,639) - - (158,054)
Discounting convertible debentures (4,388) 805 - - (3,583) (640) 836 - (4,584) (4,388)
Deferred income tax asset (liability), net $ (95,119) $ 5,789 $ 1,491 $ (523) $ (88,362) $ (86,023) $ (2,939) $ (1,573) $ (4,584) $ (95,119)
Reported on the consolidated balance sheets
as follows:
Deferred income tax asset $ 26,725 $ 22,507
Deferred income tax liability (115,087) (117,626)
Deferred income tax liability, net $ (88,362) $ (95,119) (1) Results from the difference between the use of the percentage of completion method of reporting for consolidated financial statement purposes and
use of the uncompleted contracts and billings less costs, excluding contractual holdbacks, for tax purposes. Deferred tax assets are offset against deferred tax liabilities within each legal entity. As at December 31, 2019, the Company had $338,000 (2018 - $352,000) of non-capital tax losses carried forward which will expire in varying amounts within 20 years. As at December 31, 2019, a deferred income tax asset of $89,759 (2018 - $93,229) has been recognized on $338,000 (2018 - $352,000) of these losses. The deferred income tax assets are recognized only to the extent that it is probable that taxable income will be available against which the unused tax losses can be utilized. The operations of the Company are complex and related tax interpretations, regulations and legislation are subject to change. The Company believes the amounts reported as deferred income tax liabilities adequately reflect management's current best estimate of its income tax exposures (see Note 17 “Provisions”).
Aecon Group Inc. 89

NOTES TO THE CONSOLIDATED FINANCIAL STATEMENTS DECEMBER 31, 2019 AND 2018 (in thousands of Canadian dollars, except per share amounts)
22. EMPLOYEE BENEFIT PLANS The Company has defined benefit pension plans including supplementary executive retirement plans and defined contribution plans covering substantially all employees, other than union employees who are covered by multi-employer pension plans administered by the unions. Benefits under the defined benefit plans are generally based on the employee’s years of service and level of compensation near retirement. Benefits are not indexed for inflation, except for a supplementary executive retirement plan, which is fully indexed for changes in the consumer price index. The Company does not provide post-employment benefits other than pensions. The measurement date used for financial reporting purposes of the pension plan assets and benefit obligation is December 31. The most recent actuarial valuation filed for funding purposes for the principal defined benefit pension plan was completed as at December 31, 2017 and the next required actuarial valuation will be prepared with an effective date no later than December 31, 2020. The defined benefit pension asset (obligation) is presented as part of Long-term financial assets (Other liabilities) on the consolidated balance sheets as applicable. The financial position and other selected information related to the employee defined benefit pension plans is presented in the tables below:
2019 Annual Report90

NOTES TO THE CONSOLIDATED FINANCIAL STATEMENTS DECEMBER 31, 2019 AND 2018 (in thousands of Canadian dollars, except per share amounts)
December 31 December 31
2019 2018
Change in fair value of plan assets:
Fair value of plan assets - beginning of year $ 39,674 $ 41,388
Return on plan assets greater (less) than discount rate 4,062 (1,239)
Net interest income 1,425 1,301
Plan administration costs (186) (112)
Company contributions 725 825
Plan participant contributions 54 60
Benefits paid (3,171) (2,549)
Fair value of plan assets - end of year $ 42,583 $ 39,674
Change in benefit obligation:
Benefit obligation - beginning of year $ 39,652 $ 42,597
Current service cost 446 527
Actuarial (gain) due to actuarial experience (115) (102)
Actuarial (gain) loss due to financial assumption changes 2,883 (2,204)
Net interest cost 1,408 1,324
Cost of termination benefits 576 -
Benefits paid (3,171) (2,549)
Plan participant contributions 54 60
Benefit obligation - end of year $ 41,733 $ 39,653
Funded status:
Fair value of plan assets $ 42,583 $ 39,674
Defined benefit obligation (41,733) (39,653)
Pension assets at December 31 $ 850 $ 21
2019 2018 Weighted average assumptions used to calculate benefit obligation:
Discount rate 3.00% 3.75%
Rate of increase in future compensation 3.00% 3.00%
Asset categories of pension assets:
Debt securities 64.26% 63.58%
Equity securities 27.76% 28.45%
Cash and short-term notes 7.98% 7.97%
Aecon Group Inc. 91

NOTES TO THE CONSOLIDATED FINANCIAL STATEMENTS DECEMBER 31, 2019 AND 2018 (in thousands of Canadian dollars, except per share amounts)
December 31 December 31
2019 2018
Defined benefit pension expense:
Current service cost, net of employee contributions $ 446 $ 527
Net interest cost (income) (18) 23
Plan administration costs 186 112
Cost of termination benefits 576 -
Defined benefit pension expense recognized in profit or loss 1,190 662
Actuarial (gain) recognized in other comprehensive income (1,293) (1,067)
Defined benefit pension expense $ (103) $ (405)
Other pension expense:
Defined contribution pension expense $ 7,200 $ 6,874
Multi-employer pension plan expense 75,732 77,913
Other pension expense $ 82,932 $ 84,787
Weighted average assumptions used to calculate defined benefit pension expense:
Discount rate 3.75% 3.25%
Rate of increase in future compensation 3.00% 3.00%
During 2020, the Company expects to make contributions of $1,507 to the defined benefit plans.
December 31 December 31
2019 2018
Total cash contribution for employee pension plans:
Defined benefit plans $ 725 $ 825
Defined contribution plans 7,200 6,874
Multi-employer pension plans 75,732 77,913
$ 83,657 $ 85,612
2019 Annual Report92

NOTES TO THE CONSOLIDATED FINANCIAL STATEMENTS DECEMBER 31, 2019 AND 2018 (in thousands of Canadian dollars, except per share amounts)
The defined benefit obligations and benefit cost levels will change as a result of future changes in the actuarial methods and assumptions, the membership data, the plan provisions and the legislative rules, or as a result of future experience gains or losses, none of which have been anticipated at this time. Emerging experience, differing from the assumptions, will result in gains or losses that will be revealed in future accounting valuations. As a result of the uncertainty associated with these estimates, there is no assurance that the plans will be able to earn the assumed rate of return on plan assets. Furthermore, market driven changes may result in changes to discount rates and other variables, which would result in the Company being required to make contributions to the plans in the future that may differ significantly from estimates. As a result, there is a significant amount of measurement uncertainty involved in the actuarial valuation process. This measurement uncertainty may lead to potential fluctuations in financial results attributable to the selection of actuarial assumptions and other accounting estimates involved in the determination of pension expense and obligations. A significant actuarial and accounting assumption impacting the reporting of pension plans is the discount rate assumption. As at December 31, 2019 the Company used a discount rate of 3.0% in its pension plan calculations for consolidated financial statement purposes. The impact of a 0.5% decrease in the discount rate assumption would have resulted in an increase in the pension benefit obligation of approximately $2,152 as at December 31, 2019 and an increase in the estimated 2020 pension expense of approximately $81. The weighted average duration of the defined benefit obligation is 9.9 years.
23. CONTINGENCIES During the second quarter of 2018, the Company filed a statement of claim in the Court of Queen's Bench for Saskatchewan (the "Court") against K+S Potash Canada ("KSPC") and KSPC filed a statement of claim in the Court against the Company. Both actions relate to the Legacy mine project in Bethune, Saskatchewan. The Company is seeking $180,000 in payments due to it pursuant to agreements entered into between the Company and KSPC with respect to the project plus approximately $14,000 in damages. The Company has recorded $136,000 of unbilled revenue and accounts receivable as at December 31, 2019. Offsetting this amount to some extent, the Company has accrued $45,000 in trade and other payables for potential payments to third parties pending the outcome of the claim against KSPC. KSPC is seeking an order that the Company repay to KSPC approximately $195,000 already paid to the Company pursuant to such agreements. The Company believes that it will be successful in its claim and considers KSPC's claim to be without merit. See Note 4, “Critical Accounting Estimates”. The Company is involved in various disputes and litigation both as plaintiff and defendant. In the opinion of management, the resolution of disputes against the Company, including those provided for (see Note 17, “Provisions”), will not result in a material effect on the consolidated financial position of the Company. As part of regular operations, the Company has the following guarantees and letters of credit outstanding:
Project December 31 2019
Letters of credit:
In support of the Company's equity obligations
Bermuda International Airport
Redevelopment Project
$ 76,356
Financial and performance - issued by Export Development Canada Various joint arrangement
projects $ 453,939
Financial and performance - issued in the normal conduct of business Various $ 91,097
Aecon Group Inc. 93

NOTES TO THE CONSOLIDATED FINANCIAL STATEMENTS DECEMBER 31, 2019 AND 2018 (in thousands of Canadian dollars, except per share amounts)
Under the terms of many of the Company’s associate and joint arrangement contracts with project owners, each of the partners is jointly and severally liable for performance under the contracts. As at December 31, 2019, the value of uncompleted work for which the Company’s associate and joint arrangement partners are responsible, and which the Company could be responsible for assuming, amounted to approximately $15,820,740 a portion of which is supported by performance bonds. In the event the Company assumed this additional work, it would have the right to receive the partner’s share of billings to the project owners pursuant to the respective associate or joint arrangement contract.
24. CAPITAL STOCK
For the year ended December 31, 2019
For the year ended December 31, 2018
Number Amount Number Amount
Number of common shares outstanding - beginning of year 60,478,564 $ 386,453 59,298,857 $ 367,612
Common shares issued on exercise of share options - - 120,000 1,750
Common shares issued on conversion of 5.5% debentures - - 166,664 3,379
Shares issued to settle LTIP/Director DSU Obligations 636,261 10,404 893,043 13,712
Common shares purchased under Normal Course Issuer Bid (399,200) (2,566) - -
Number of common shares outstanding - end of year 60,715,625 $ 394,291 60,478,564 $ 386,453
The Company is authorized to issue an unlimited number of common shares.
Normal Course Issuer Bid
In the fourth quarter of 2019, the Company announced its intention to make a normal course issuer bid (the “NCIB”) commencing on November 5, 2019 and expiring on November 4, 2020. During this period, the Company is permitted to purchase for cancellation up to a maximum of 5,975,486 common shares on the open market, representing approximately 10% of the issued and outstanding common shares at the time of the announcement of the NCIB. From November 5, 2019 to December 31, 2019, the Company acquired 399,200 common shares for $7,217 of which $2,566 was recorded as a reduction in share capital and $4,651 recorded as a reduction of retained earnings. All of the shares acquired were subsequently cancelled. STOCK−BASED COMPENSATION
Long-Term Incentive Plan
In 2005 and 2014, the Company adopted Long-Term Incentive Plans (collectively “LTIP” or individually “2005 LTIP” or “2014 LTIP”) to provide a financial incentive for its senior executives to devote their efforts to the long-term success of the Company’s business. Awards to participants are based on the financial results of the Company and are made in the form of Deferred Share Units (“DSUs”) or in the form of Restricted Share Units (“RSUs”). Awards made in the form of DSUs will vest only on the retirement or termination of the participant. Awards made in the form of RSUs will vest annually over three years. Compensation charges related to the LTIP are expensed over the estimated vesting period of the awards in marketing, general and administrative expenses. Awards made to individuals who are eligible to retire under the plan are assumed, for accounting purposes, to vest immediately. For the year ended December 31, 2019, the Company recorded LTIP compensation charges of $12,834 (2018 - $13,105).
2019 Annual Report94

NOTES TO THE CONSOLIDATED FINANCIAL STATEMENTS DECEMBER 31, 2019 AND 2018 (in thousands of Canadian dollars, except per share amounts)
Other Stock-based Compensation – Director DSU Awards In May 2014, the Board of Directors modified the director compensation program by replacing stock option grants to non-management directors with a director deferred share unit plan (the “Director DSU Plan”). A DSU is a right to receive an amount from the Company equal to the value of one common share. Commencing in 2014, directors have the option of receiving up to 50% of their annual retainer fee, that is otherwise payable in cash, in the form of DSUs pursuant to the Director DSU Plan. The number of DSUs awarded to a director is equal to the value of the compensation that a director elects to receive in DSUs or the value awarded by the Company on an annual basis divided by the volume weighted average trading price of a common share on the TSX for the five trading days prior to the date of the award. DSUs are redeemable on the first business day following the date the director ceases to serve on the Board. As equity settled awards, Director DSUs are expensed in full on the date of grant and recognized in marketing, general and administrative expenses in the consolidated statements of income. Director DSUs have accompanying dividend equivalent rights, which are also expensed as earned in marketing, general and administrative expenses. For the year ended December 31, 2019, the Company recorded Director DSU compensation charges of $1,073 (2018 - $1,117). Other Stock-based Compensation – Employee Share Unit (ESU) Awards In April 2019, the Company adopted an Employee Share Unit (“ESU”) plan, an employee benefit program that enables all permanent, non-unionized, Canadian resident employees to become shareholders of the Company. The program includes ESUs gifted to eligible employees, and additional ESUs that may be purchased by eligible employees during a predetermined window each year at a discounted price. ESU awards and purchases vest annually over three years. ESUs are equity settled awards with compensation charges related to ESU awards and purchases expensed over the estimated vesting period in marketing, general and administrative expenses. For the year ended December 31, 2019, the Company recorded an ESU compensation charge of $862 (2018 - $nil).
Aecon Group Inc. 95

NOTES TO THE CONSOLIDATED FINANCIAL STATEMENTS DECEMBER 31, 2019 AND 2018 (in thousands of Canadian dollars, except per share amounts)
Details of the changes in the balance of LTIP awards, Director DSUs, and ESUs outstanding are detailed below:
For the year ended December 31, 2019
LTIP Director DSUs ESUs
Share Units Balance outstanding - beginning of year 2,522,383 278,848 -Granted 618,068 50,644 172,779 Dividend equivalent rights 88,927 8,121 4,931 Settled (719,048) (89,025) -Forfeited (35,846) - (10,844)Balance outstanding - end of year 2,474,484 248,588 166,866 Weighted Average Grant Date Fair Value Per Unit Balance outstanding - beginning of year $ 13.33 $ 15.20 $ -Granted 18.34 18.40 17.65 Dividend equivalent rights 14.12 17.40 17.58 Settled 16.58 15.22 -Forfeited 18.16 - 17.60 Balance outstanding - end of year $ 13.59 $ 15.91 $ 17.65
Amounts included in contributed surplus in the consolidated balance sheets as at December 31, 2019 in respect of LTIP, Director DSUs, and ESUs were $31,149 (December 31, 2018 - $30,500), $3,956 (December 31, 2018 - $4,238), and $1,484 (December 31, 2018 – $nil), respectively.
2019 Annual Report96

NOTES TO THE CONSOLIDATED FINANCIAL STATEMENTS DECEMBER 31, 2019 AND 2018 (in thousands of Canadian dollars, except per share amounts)
25. EXPENSES For the year ended
December 31 December 31 2019 2018 Personnel $ 766,134 $ 894,793Subcontractors 1,306,930 1,115,411Materials 1,063,295 889,649Equipment costs 107,906 156,600Depreciation of property, plant and equipment and amortization of intangible assets 94,127 103,832
Other expenses 31,983 31,240
Total expenses $ 3,370,375 $ 3,191,525
Reported as: For the year ended December 31 December 31 2019 2018 Direct costs and expenses $ 3,092,814 $ 2,909,171Marketing, general and administrative expense 183,434 178,522Depreciation and amortization 94,127 103,832
Total expenses $ 3,370,375 $ 3,191,525
Aecon Group Inc. 97

NOTES TO THE CONSOLIDATED FINANCIAL STATEMENTS DECEMBER 31, 2019 AND 2018 (in thousands of Canadian dollars, except per share amounts)
26. OTHER INCOME For the year ended December 31 December 31 2019 2018 Foreign exchange gain $ 1,336 $ 1,040 Gain on sale of property, plant and equipment 3,401 466 Total other income $ 4,737 $ 1,506
On November 23, 2018, the Company completed the sale of its contract mining business to North American Construction Group (“NACG”), whereby substantially all of the assets related to Aecon’s contract mining business were sold to NACG for proceeds of $197,500 (see Note 13). Aecon's contract mining business provided overburden removal and environmental reclamation services through a fleet of earthmoving equipment, primarily in the oil sands in Fort McMurray, Alberta. As part of the transaction, cash of $150,800 and $22,000 was received in 2018 and 2019, respectively, $12,900 of debt related to certain equipment sold was assumed by the purchaser, and the remaining balance of the purchase price of $11,800 will be paid eighteen months following closing, secured by a charge over certain assets that are the subject of the transaction. The deferred payment is not subject to conditions. No gain or loss on sale was included in the 2018 operating results as a result of the sale of the contract mining assets.
27. FINANCE COST
For the year ended
December 31 December 31 2019 2018
Interest and notional interest on long-term debt and debentures $ 15,208 $ 16,724
Interest on leases 4,013 1,952Interest on short-term debt 3,112 4,746Notional interest on provisions 224 229
Total finance cost
$ 22,557 $ 23,651
2019 Annual Report98

NOTES TO THE CONSOLIDATED FINANCIAL STATEMENTS DECEMBER 31, 2019 AND 2018 (in thousands of Canadian dollars, except per share amounts)
28. EARNINGS PER SHARE
Details of the calculation of earnings per share are set out below:
For the year ended December 31 December 31 2019 2018
Profit attributable to shareholders $ 72,853 $ 59,014Interest on convertible debentures, net of tax (1) 10,125 10,921Diluted net earnings $ 82,978 $ 69,935 Average number of common shares outstanding 60,711,928 59,802,209Effect of dilutive securities:(1) Convertible debentures (1) 10,415,145 11,322,018 Long-term incentive plan 2,723,072 2,801,231Weighted average number of diluted common shares outstanding 73,850,145 73,925,458 Basic earnings per share $ 1.20 $ 0.99Diluted earnings per share (1) $ 1.12 $ 0.94
(1) When the impact of dilutive securities increases the earnings per share or decreases the loss per share, they are excluded for purposes of the calculation of diluted earnings per share.
29. SUPPLEMENTARY CASH FLOW INFORMATION Change in other balances relating to operations For the year ended
December 31 December 31 2019 2018
Decrease (increase) in: Trade and other receivables $ (4,427) $ (161,609) Unbilled revenue 8,353 (19,231) Inventories (4,040) 352 Prepaid expenses (29,057) (13,896)Increase (decrease) in: Trade and other payables 70,982 83,742 Provisions (6,099) (8,675) Deferred revenue (24,574) 301,217 $ 11,138 $ 181,900
Cash flows from interest For the year ended
December 31 December 31 2019 2018
Operating activities Cash interest paid $ (40,743) $ (38,173) Cash interest received 4,733 5,182
Aecon Group Inc. 99

NOTES TO THE CONSOLIDATED FINANCIAL STATEMENTS DECEMBER 31, 2019 AND 2018 (in thousands of Canadian dollars, except per share amounts)
30. FINANCIAL INSTRUMENTS Fair value From time to time, the Company enters into forward contracts and other foreign exchange hedging products to manage its exposure to changes in exchange rates related to transactions denominated in currencies other than the Canadian dollar, but does not hold or issue such financial instruments for speculative trading purposes. As at December 31, 2019, the Company had contracts to buy US$974 and EUR€1,812 (December 31, 2018 - $nil) on which there was a cumulative net unrealized exchange loss of $135 recorded in the consolidated statements of income as at that date (December 31, 2018 - $nil). In addition, as at December 31, 2019, outstanding contracts to buy US$151,479 (December 31, 2018 – buy US$173,500) were designated as cash flow hedges on which there was a cumulative unrealized gain recorded in other comprehensive income of $3,651 (December 31, 2018 - $10,949). The net unrealized exchange gain or loss represents the estimated amount the Company would have received/paid if it terminated the contracts at the end of the respective periods, and is included in other income (loss) in the consolidated statements of income. IFRS 13, “Fair Value Measurement”, enhances disclosures about fair value measurements. Fair value is defined as the amount for which an asset could be exchanged, or a liability settled, between knowledgeable, willing parties in an arm's length transaction. Valuation techniques used to measure fair value must maximize the use of observable inputs and minimize the use of unobservable inputs. The fair value hierarchy is based on three levels of inputs. The first two levels are considered observable and the last unobservable. These levels are used to measure fair values as follows:
Level 1 – Quoted prices (unadjusted) in active markets for identical assets or liabilities that the Company has the ability to access at the measurement date.
Level 2 – Inputs, other than Level 1 inputs, that are observable for assets and liabilities, either directly or indirectly. Level 2 inputs include: quoted market prices for similar assets or liabilities; quoted prices in markets that are not active; or other inputs that are observable or can be corroborated by observable market data for substantially the full term of the assets or liabilities.
Level 3 – Unobservable inputs that are supported by little or no market activity and that are significant to the fair value of the assets or liabilities.
The following table summarizes the fair value hierarchy under which the Company’s financial instruments are valued. As at December 31, 2019 Total Level 1 Level 2 Level 3
Financial assets (liabilities) measured at fair value: Cash flow hedge $ (4,296) $ - $ (4,296) $ -Financial assets (liabilities) disclosed at fair value: Long-term financial assets 3,970 - 3,970 - Current portion of long-term debt (65,211) - (65,211) - Long-term debt (149,376) - (149,376) - Non-recourse project debt (365,894) - (365,894) - Convertible debentures (192,777) (192,777) - -
During the year ended December 31, 2019, there were no transfers between Level 1 and Level 2 fair value measurements, and no transfers into or out of Level 3 fair value measurements. Risk management The main risks arising from the Company’s financial instruments are credit risk, liquidity risk, interest rate risk and currency risk. These risks arise from exposures that occur in the normal course of business and are managed on a consolidated Company basis.
2019 Annual Report100

NOTES TO THE CONSOLIDATED FINANCIAL STATEMENTS DECEMBER 31, 2019 AND 2018 (in thousands of Canadian dollars, except per share amounts)
Credit risk Financial instruments that subject the Company to credit risk consist primarily of cash and cash equivalents, short-term deposits and marketable securities, accounts receivable, holdbacks receivable, unbilled revenues, and foreign exchange contracts. Credit risk associated with cash and short-term deposits is minimized by ensuring these financial assets are placed with financial institutions with investment grade credit ratings and by placing a limit on the amount that can be invested with any single financial institution. The credit risk associated with foreign exchange contracts arises from the possibility the counterparty to one of these contracts fails to perform according to the terms of the contract. Credit risk associated with foreign exchange contracts is minimized by entering into such transactions with major Canadian financial institutions. Concentration of credit risk associated with accounts receivable, holdbacks receivable and unbilled revenue is limited by the Company’s diversified customer base and its dispersion across different business and geographic areas. The credit quality of the Company’s significant customers is monitored on an ongoing basis and allowances are provided for potential losses that have been incurred at the consolidated balance sheet date. Receivables that are neither past due nor impaired are considered by management to have no significant collection risk. The liquidity of customers and their ability to pay receivables are considered in the impairment of such assets. Most trade receivables that are past due are from public-sector clients and infrastructure/industrial companies with strong credit ratings and are subject to lower credit risk. No collateral is held in respect of impaired assets or assets that are past due but not impaired. The Company recognizes loss allowances using 12-month expected credit losses, or lifetime expected credit losses if there has been a significant increase in the credit risk on the instrument. As at December 31, 2019, the Company had $97,661 in trade receivables that were past due. Of this amount, $70,544 was over 60 days past due, against which the Company has recorded an allowance for doubtful accounts of $758. Liquidity risk Liquidity risk is the risk the Company will encounter difficulty in meeting obligations associated with financial liabilities that are settled in cash or another financial asset. The Company’s approach is to ensure it will have sufficient liquidity to meet operational, tax, capital and regulatory requirements and obligations, under both normal and stressed circumstances. Cash flow projections are prepared and reviewed quarterly by the Board of Directors to ensure a sufficient continuity of funding. Long-term debt maturities are spread over a range of dates, thereby ensuring the Company is not exposed to excessive refinancing risk in any one year. The Company’s cash and cash equivalents, short-term deposits and restricted cash are invested in highly liquid interest bearing investments.
Aecon Group Inc. 101
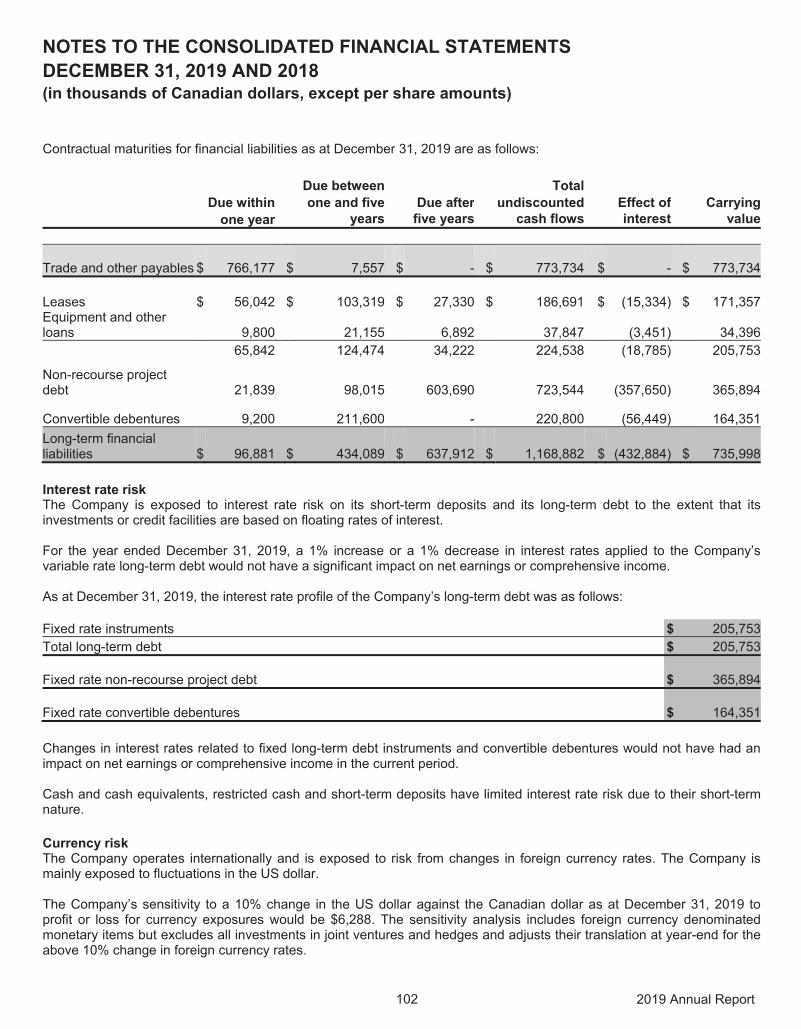
NOTES TO THE CONSOLIDATED FINANCIAL STATEMENTS DECEMBER 31, 2019 AND 2018 (in thousands of Canadian dollars, except per share amounts)
Contractual maturities for financial liabilities as at December 31, 2019 are as follows: Due between Total Due within one and five Due after undiscounted Effect of Carrying
one year years five years cash flows interest value
Trade and other payables $ 766,177 $ 7,557
$ -
$ 773,734
$ -
$ 773,734
Leases $ 56,042 $ 103,319 $ 27,330 $ 186,691 $ (15,334) $ 171,357 Equipment and other loans 9,800 21,155 6,892 37,847 (3,451) 34,396 65,842 124,474 34,222 224,538 (18,785) 205,753
Non-recourse project debt 21,839 98,015 603,690 723,544 (357,650) 365,894
Convertible debentures 9,200 211,600 - 220,800 (56,449) 164,351
Long-term financial liabilities $ 96,881
$ 434,089
$ 637,912
$ 1,168,882
$ (432,884)
$ 735,998
Interest rate risk The Company is exposed to interest rate risk on its short-term deposits and its long-term debt to the extent that its investments or credit facilities are based on floating rates of interest. For the year ended December 31, 2019, a 1% increase or a 1% decrease in interest rates applied to the Company’s variable rate long-term debt would not have a significant impact on net earnings or comprehensive income. As at December 31, 2019, the interest rate profile of the Company’s long-term debt was as follows: Fixed rate instruments $ 205,753Total long-term debt $ 205,753
Fixed rate non-recourse project debt $ 365,894
Fixed rate convertible debentures $ 164,351
Changes in interest rates related to fixed long-term debt instruments and convertible debentures would not have had an impact on net earnings or comprehensive income in the current period. Cash and cash equivalents, restricted cash and short-term deposits have limited interest rate risk due to their short-term nature. Currency risk The Company operates internationally and is exposed to risk from changes in foreign currency rates. The Company is mainly exposed to fluctuations in the US dollar. The Company’s sensitivity to a 10% change in the US dollar against the Canadian dollar as at December 31, 2019 to profit or loss for currency exposures would be $6,288. The sensitivity analysis includes foreign currency denominated monetary items but excludes all investments in joint ventures and hedges and adjusts their translation at year-end for the above 10% change in foreign currency rates.
2019 Annual Report102

NOTES TO THE CONSOLIDATED FINANCIAL STATEMENTS DECEMBER 31, 2019 AND 2018 (in thousands of Canadian dollars, except per share amounts)
Additional information on financial instruments: Fair value Fair value Total Amortized through through carrying Total fair cost profit or loss OCI amount value
Cash and cash equivalents $ 682,264 $ - $ - $ 682,264 $ 682,264
Restricted cash 76,595 - - 76,595 76,595
Trade and other receivables 682,105 - - 682,105 682,105
Unbilled revenue 598,858 - - 598,858 598,858
Long-term financial assets 3,970 - 3,166 7,136 7,136
$ 2,043,792 $ - $ 3,166 $ 2,046,958 $ 2,046,958
Trade and other payables 773,734 - - 773,734 773,734
Current portion of long-term debt 60,071 - - 60,071 65,211
Convertible debentures 164,351 - - 164,351 192,777
Non-recourse project debt 365,894 - - 365,894 365,894
Long-term debt 145,682 - - 145,682 149,376
$ 1,509,732 $ - $ - $ 1,509,732 $ 1,546,992
Cash and cash equivalents, restricted cash, marketable securities, trade receivables, trade payables and accrued liabilities approximate their fair values on a discounted cash flow basis because of the short-term nature of these instruments. In general, investments with original maturities of greater than three months and remaining maturities of less than one year are classified as short-term investments. Investments with maturities beyond one year may be classified as current based on their highly liquid nature and because such marketable securities represent the investment of cash that is available for current operations. Other financial instruments held or issued by the Company include holdbacks receivable, non-interest bearing project advances payable or holdbacks payable, which are amounts directly related to construction contracts. These amounts, by their nature, do not bear interest and consideration for the time value of money is thus negotiated into the price of the contracts. The Company does not have plans to sell these financial instruments to third parties and will realize or settle them in the normal course of business. No quoted market price exists for these instruments because they are not traded in an active and liquid market. Accordingly, the fair values of holdbacks receivable, non-interest bearing project advances payable or holdbacks payable, which are due within one year, are considered to approximate their carrying values. For those financial instruments that are due beyond one year, the Company has valued them to reflect the time value of money and the credit risk or the borrowing risk associated with these financial instruments. The fair value of long-term debt is derived by discounting the remaining principal and interest payments at interest rates reflective of the Company’s current cost of borrowing for similar debt. These interest rates were calculated by using the Canadian interest rate swap yield at year-end and adjusting for the credit spread that reflects the Company’s cost of secured credit. The fair value of the convertible debentures was obtained from quoted prices observable on the Toronto Stock Exchange. Convertible debentures are discussed further in Note 19.
Aecon Group Inc. 103

NOTES TO THE CONSOLIDATED FINANCIAL STATEMENTS DECEMBER 31, 2019 AND 2018 (in thousands of Canadian dollars, except per share amounts)
31. CAPITAL DISCLOSURES For capital management purposes, the Company defines capital as the aggregate of its shareholders’ equity and debt. Debt includes the current and non-current portions of long-term debt (excluding non-recourse debt) and the current and non-current long-term debt components of convertible debentures. The Company’s principal objectives in managing capital are: to ensure sufficient liquidity to adequately fund the ongoing operations of the business; to provide flexibility to take advantage of contract and growth opportunities that are expected to provide
satisfactory returns to shareholders; to maintain a strong capital base so as to maintain client, investor, creditor and market confidence; to provide a superior rate of return to its shareholders; and to comply with financial covenants required under its various borrowing facilities.
The Company manages its capital structure and adjusts it in light of changes in economic conditions. In order to maintain or adjust its capital structure, the Company may issue new debt or repay existing debt, issue new shares, issue convertible debt, or adjust the amount of dividends paid to shareholders. Financing decisions are generally made on a specific transaction basis and depend on such things as the Company’s needs, capital markets and economic conditions at the time of the transaction. Although the Company monitors capital on a number of bases, including liquidity and working capital, total debt (excluding non-recourse debt and drawings on the Company’s credit facility presented as bank indebtedness) as a percentage of total capitalization (debt to capitalization percentage) is considered to be the most important metric in measuring the strength and flexibility of its consolidated balance sheets. As at December 31, 2019, the debt to capitalization percentage including convertible debentures as debt was 30% (December 31, 2018 - 24%). If the convertible debentures were to be excluded from debt and added to equity on the basis that they could be redeemed for equity, either at the Company’s option or at the holder’s option, then the adjusted debt to capitalization percentage would be 17% as at December 31, 2019 (December 31, 2018 - 9%). While the Company believes this debt to capitalization percentage is acceptable, because of the cyclical nature of its business, the Company will continue its current efforts to maintain a conservative capital position. As at December 31, 2019, the Company complied with all of its financial debt covenants.
2019 Annual Report104

NOTES TO THE CONSOLIDATED FINANCIAL STATEMENTS DECEMBER 31, 2019 AND 2018 (in thousands of Canadian dollars, except per share amounts)
32. OPERATING SEGMENTS Segment reporting is based on the Company’s divisional operations. The breakdown by division mirrors the Company’s internal reporting systems. Commencing in 2019, the Company’s Infrastructure and Industrial segments were combined into a Construction segment to align with the Company’s new operating management structure. The progress Aecon has made in recent years with respect to the “One Aecon” strategy has increasingly allowed for integrated project management and systems, allowing Aecon to capitalize on those markets providing the greatest opportunity at any point in time. This trend is expected to continue going forward, seeing the Company’s services and resources becoming increasingly mobile between end markets. The Company has migrated its overall management and operating structure to reflect this increasingly flexible model. Prior year comparative figures have been restated to conform to the presentation adopted in the current year. The Company currently operates in two segments within the infrastructure development industry: Construction and Concessions. The Construction segment includes all aspects of the construction of both public and private infrastructure, primarily in Canada, and on a selected basis, internationally and focuses primarily on the following market sectors:
Civil Infrastructure; Urban Transportation Systems; Nuclear Power Infrastructure; Utility Infrastructure; and Conventional Industrial Infrastructure.
Activities within the Concessions segment include the development, financing, build and operation of construction projects by way of public-private partnership contract structures, as well as integrating the services of all project participants, and harnessing the strengths and capabilities of Aecon.
Aecon Group Inc. 105

NOTES TO THE CONSOLIDATED FINANCIAL STATEMENTS DECEMBER 31, 2019 AND 2018 (in thousands of Canadian dollars, except per share amounts)
For the year ended December 31, 2019
Construction Concessions Other and
eliminations Total
Consolidated statements of income External customer revenue $ 3,242,224 $ 218,194 $ - $ 3,460,418 Inter-segment revenue 144,582 - (144,582) -
Total revenue 3,386,806 218,194 (144,582) 3,460,418 Expenses $ (3,267,587) $ (199,597) $ 96,809 $ (3,370,375) Which include: Depreciation and amortization (61,057) (31,572) (1,498) (94,127) Other income (loss): Foreign exchange gain (loss) $ 1,707 $ (165) $ (206) $ 1,336 Gain on sale of property, plant and equipment 3,401 - - 3,401
Income from projects accounted for using the equity method $ 1,715 $ 10,776 $ - $ 12,491
Operating profit (loss) $ 126,042 $ 29,208 $ (47,979) $ 107,271 Finance income (cost): Finance income $ 2,060 Finance cost (22,557)
Profit before income taxes $ 86,774 Income tax expense (13,921)
Profit for the year $ 72,853
Revenue by contract type Fixed price $ 1,546,100 $ 136,462 $ (135,893) $ 1,546,669 Cost plus/unit price 1,840,706 - (8,689) 1,832,017 Concession operations - 81,732 - 81,732
Total revenue 3,386,806 218,194 (144,582) 3,460,418
Revenue by service type Construction revenue $ 3,386,806 $ - $ (8,689) $ 3,378,117 Concession revenue - 218,194 (135,893) 82,301
Total revenue 3,386,806 218,194 (144,582) 3,460,418
Construction Concessions Other and
eliminations Total
Consolidated balance sheets Segment assets $ 2,682,243 $ 687,072 $ (254,677) $ 3,114,638 Which include: Projects accounted for using the equity method 23,176 22,337 - 45,513 Segment liabilities $ 1,458,002 $ 508,449 $ 290,191 $ 2,256,642
Additions to non-current assets: Property, plant and equipment $ 94,083 $ 709 $ 12,302 $ 107,094 Intangible assets $ 6,820 $ 162,535 $ 500 $ 169,855
2019 Annual Report106

NOTES TO THE CONSOLIDATED FINANCIAL STATEMENTS DECEMBER 31, 2019 AND 2018 (in thousands of Canadian dollars, except per share amounts)
For the year ended December 31, 2018
Construction Concessions Other and
eliminations Total
Consolidated statements of income External customer revenue $ 3,042,938 $ 223,353 $ - $ 3,266,291 Inter-segment revenue 137,929 - (137,929) -
Total revenue 3,180,867 223,353 (137,929) 3,266,291 Expenses $ (3,092,197) $ (195,023) $ 95,695 $ (3,191,525) Which include: Depreciation and amortization (74,803) (28,493) (536) (103,832) Other income (loss): Foreign exchange gain (loss) $ 766 $ (370) $ 644 $ 1,040 Gain on sale of property, plant and equipment 466 - - 466
Income from projects accounted for using the equity method $ 3,074 $ 10,076 $ - $ 13,150
Operating profit (loss) $ 92,976 $ 38,036 $ (41,590) $ 89,422 Finance income (cost): Finance income $ 1,256 Finance cost (23,651)
Profit before income taxes $ 67,027 Income tax expense (8,013)
Profit for the year $ 59,014
Revenue by contract type Fixed price $ 1,361,640 $ 141,553 $ (134,490) $ 1,368,703 Cost plus/unit price 1,819,227 - (3,439) 1,815,788 Concession operations - 81,800 - 81,800
Total revenue 3,180,867 223,353 (137,929) 3,266,291
Revenue by service type Construction revenue $ 3,180,867 $ - $ (3,387) $ 3,177,480 Concession revenue - 223,353 (134,542) 88,811
Total revenue 3,180,867 223,353 (137,929) 3,266,291
Construction Concessions Other and
eliminations Total
Consolidated balance sheets Segment assets $ 2,461,677 $ 678,915 $ (207,900) $ 2,932,692 Which include: Projects accounted for using the equity method 23,501 15,974 39,475
Segment liabilities $ 1,308,570 $ 537,949 $ 261,111 $ 2,107,630
Additions to non-current assets: Property, plant and equipment $ 66,400 $ 303 $ 4,477 $ 71,180 Intangible assets $ 360 $ 163,876 $ 3,110 $ 167,346
Aecon Group Inc. 107
-

NOTES TO THE CONSOLIDATED FINANCIAL STATEMENTS DECEMBER 31, 2019 AND 2018 (in thousands of Canadian dollars, except per share amounts)
Geographic segment information: December 31 December 31 2019 2018 Revenue from external customers: Canada $ 3,193,944 $ 3,045,727 USA 45,976 9,337 International 220,498 211,227 $ 3,460,418 $ 3,266,291 Property, plant, equipment and intangible assets Canada $ 439,898 $ 359,396 USA 7,335 6,332 International 458,627 346,114 $ 905,860 $ 711,842
Revenue from external customers has been attributed to individual countries on the basis of the customer’s location. Revenue from the Company’s largest customer accounted for approximately 15% of consolidated revenue for the year ended December 31, 2019. The customer and its affiliated entities are located in Canada, with revenue recorded primarily in the construction segment.
33. REMAINING PERFORMANCE OBLIGATIONS Backlog (i.e remaining performance obligations) means the total value of work that has not yet been completed that: (a) has a high certainty of being performed as a result of the existence of an executed contract or work order specifying job scope, value and timing; or (b) has been awarded to the company, as evidenced by an executed binding letter of intent or agreement, describing the general job scope, value and timing of such work, and where the finalization of a formal contract in respect of such work is reasonably assured. O&M activities are provided under contracts that can cover a period of up to 30 years. In order to provide information that is comparable to the backlog of other categories of activity, the Company limits backlog for O&M activities to the earlier of the contract term and the next five years. Reported backlog as at December 31, 2019 of $6,789,764 compares to backlog of $6,821,291 as at December 31, 2018. New contract awards of $3,428,891 were booked in 2019 compared to $5,840,238 in 2018. Backlog
As at December 31
2019 2018 Construction $ 6,735,041 $ 6,784,612 Concessions 54,723 36,679 Consolidated $ 6,789,764 $ 6,821,291
2019 Annual Report108
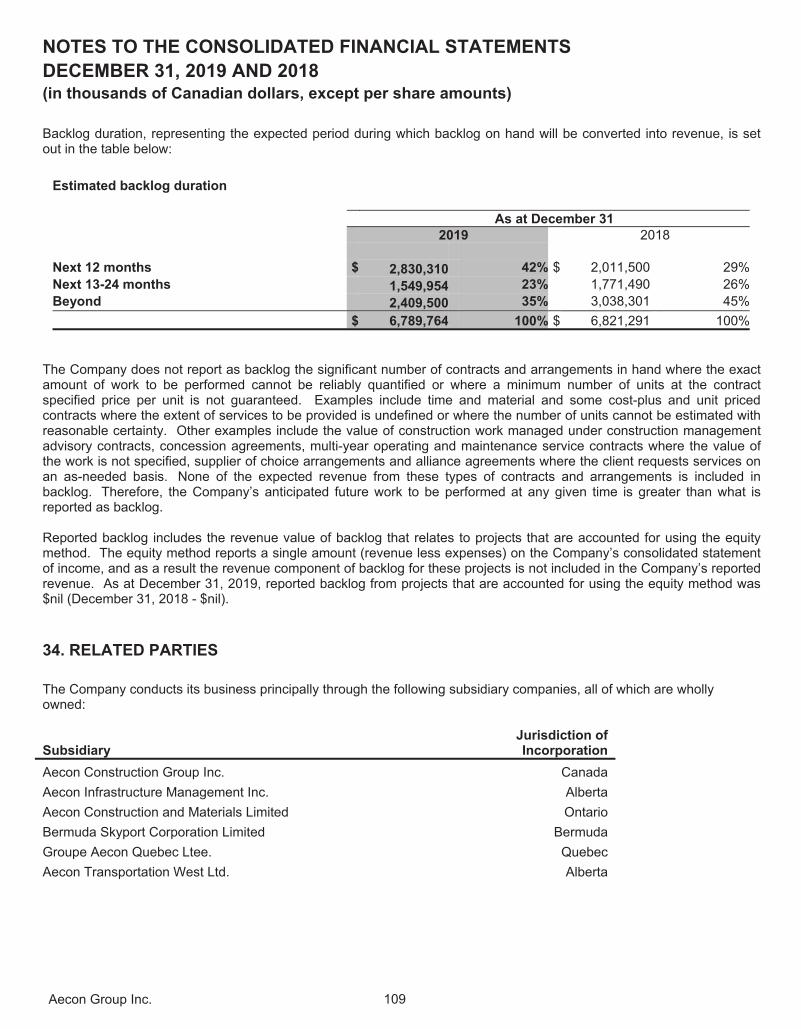
NOTES TO THE CONSOLIDATED FINANCIAL STATEMENTS DECEMBER 31, 2019 AND 2018 (in thousands of Canadian dollars, except per share amounts)
Backlog duration, representing the expected period during which backlog on hand will be converted into revenue, is set out in the table below: Estimated backlog duration As at December 31 2019 2018 Next 12 months $ 2,830,310 42% $ 2,011,500 29%
Next 13-24 months 1,549,954 23% 1,771,490 26%
Beyond 2,409,500 35% 3,038,301 45%
$ 6,789,764 100% $ 6,821,291 100% The Company does not report as backlog the significant number of contracts and arrangements in hand where the exact amount of work to be performed cannot be reliably quantified or where a minimum number of units at the contract specified price per unit is not guaranteed. Examples include time and material and some cost-plus and unit priced contracts where the extent of services to be provided is undefined or where the number of units cannot be estimated with reasonable certainty. Other examples include the value of construction work managed under construction management advisory contracts, concession agreements, multi-year operating and maintenance service contracts where the value of the work is not specified, supplier of choice arrangements and alliance agreements where the client requests services on an as-needed basis. None of the expected revenue from these types of contracts and arrangements is included in backlog. Therefore, the Company’s anticipated future work to be performed at any given time is greater than what is reported as backlog. Reported backlog includes the revenue value of backlog that relates to projects that are accounted for using the equity method. The equity method reports a single amount (revenue less expenses) on the Company’s consolidated statement of income, and as a result the revenue component of backlog for these projects is not included in the Company’s reported revenue. As at December 31, 2019, reported backlog from projects that are accounted for using the equity method was $nil (December 31, 2018 - $nil).
34. RELATED PARTIES The Company conducts its business principally through the following subsidiary companies, all of which are wholly owned:
Subsidiary Jurisdiction of Incorporation
Aecon Construction Group Inc. Canada
Aecon Infrastructure Management Inc. Alberta
Aecon Construction and Materials Limited Ontario
Bermuda Skyport Corporation Limited Bermuda
Groupe Aecon Quebec Ltee. Quebec
Aecon Transportation West Ltd. Alberta
Aecon Group Inc. 109

NOTES TO THE CONSOLIDATED FINANCIAL STATEMENTS DECEMBER 31, 2019 AND 2018 (in thousands of Canadian dollars, except per share amounts)
The Company also conducts its business through the following significant joint arrangements and associates:
Joint arrangements and associatesCountry of operations
Ownership interests
Nature of activities
OPG Darlington RFR Project Canada 50.0% Construction Eglinton Crosstown LRT Construction Project Canada 25.0% Construction Eglinton Crosstown LRT Concessionaire Canada 25.0% Concession Réseau express métropolitain Montreal LRT Canada 24.0% Construction Site C Generating Station and Spillways Civil Works Canada 30.0% Construction SA Energy Group Canada 50.0% Construction Frontier - Kemper Aecon Kemano Project Canada 40.0% Construction Annacis Wastewater Treatment Plant Canada 50.0% Construction Gordie Howe International Bridge Project Canada and USA 20.0% Construction Gordie Howe International Bridge Concessionaire Canada and USA 20.0% Concession Viva Project Canada 50.0% Construction OPG Darlington TGR Project Canada 60.0% Construction Finch West LRT Construction Project Canada 33.0% Construction Finch West LRT Concessionaire Canada 33.0% Concession Second Narrows Water Supply Tunnel Project Canada 40.0% Construction Bruce Power Unit 6 FCFR Canada 40.0% Construction OPG Darlington D20 Project Canada 60.0% Construction Peace River Project Canada 50.0% Construction Aecon Six Nations JV Canada 49.0% Construction Highway 401 Expansion Project Canada 50.0% Construction Yellowline Asphalt Products Ltd. Canada 50.0% Construction Waterloo LRT Concessionaire Canada 10.0% Concession The Company enters into transactions with certain equity accounted investees as part of the normal course of operations. The Company had the following transactions with equity accounted investees: As at December 31, 2019, trade receivables include amounts due from equity accounted investees of $34,117 (2018 - $36,502), and trade payables include amounts due to equity accounted investees of $1,363 (2018 - $839). For the year ended December 31, 2019, revenue includes sales to equity accounted investees of $418,403 (2018 - $383,310), and direct costs and expenses include purchases from equity accounted investees of $11,721 (2018 - $17,377). Key management includes the Company’s Board of Directors and Named Executive Officers. Compensation awarded to key management is as follows:
December 31 December 31 2019 2018 Short-term employee benefits $ 9,075 $ 11,285 Post-employment benefits 117 96 Executive transition payments 7,000 - Stock-based payments 4,968 4,585 $ 21,160 $ 15,966
2019 Annual Report110

NOTES TO THE CONSOLIDATED FINANCIAL STATEMENTS DECEMBER 31, 2019 AND 2018 (in thousands of Canadian dollars, except per share amounts)
35. SUBSEQUENT EVENT On February 3, 2020, the Company acquired Voltage Power (“Voltage”), an electrical transmission and substation contractor headquartered in Winnipeg, Manitoba. The base purchase price is $30,000 in cash, with additional earnout payments possible based on achieving minimum targets over the next three years. Previously a private, employee-owned company, Voltage brings key medium to high-voltage power transmission and distribution capabilities to Aecon. The preliminary purchase price allocations for the above acquisition have not been finalized pending final determination of the fair values of assets acquired and liabilities assumed.
Aecon Group Inc. 111

AECON.COMCover Design: Hambly & Woolley Inc.
Back Cover: Site C Generating Station and Spillways Civil Works Project Fort St. John, B.C.
This Page: Darlington Nuclear Refurbishment Project Clarington, ON
Board of DirectorsJohn M. BeckJohn W. BraceJoseph A. CarrabbaAnthony P. FranceschiniJ.D. HoleSusan Wolburgh Jenah ICD.DEric RosenfeldJean-Louis ServranckxMonica Sloan ICD.DDeborah S. Stein
Executive CommitteeJean-Louis ServranckxPresident and Chief Executive Officer
David SmalesExecutive Vice President andChief Financial Officer
Yonni FushmanExecutive Vice President,Chief Legal Officer and Secretary
Steve NackanExecutive Vice President andPresident, Concessions
Mark SchererExecutive Vice President,Industrial and Chief Safety Officer
Thomas ClochardSenior Vice President andExecutive Lead, Nuclear
Michael DerksenSenior Vice President andExecutive Lead, Civil West
Marty HarrisSenior Vice President andExecutive Lead, Civil East
Eric MacDonaldSenior Vice President,Utilities
Manuel RivayaSenior Vice President,Urban Transportation Systems
Gordana TerkalasSenior Vice President,Human Resources

VANCOUVER1055 Dunsmuir Street, Suite 2124Vancouver, BC V7X 1G4PHONE 604 235 1398
CALGARY110 9th Avenue SW, Suite 300Calgary, Alberta T2P 0T1PHONE 403 695 3085
TORONTO20 Carlson Court, Suite 105Toronto, Ontario M9W 7K6PHONE 416 297 2600
MONTREAL2015 rue Peel, Bureau 600Montreal, Quebec H3A 1T8PHONE 514 352 0100
GENERAL INQUIRIESTOLL FREE 1 877 232 2677EMAIL [email protected]
INVESTOR RELATIONS INQUIRIESEMAIL [email protected]
MEDIA RELATIONS INQUIRIESEMAIL [email protected]
REGISTRAR AND TRANSFER AGENTComputershare Investor Services Inc.PHONE 514 982 7555TOLL FREE 1 800 564 6253EMAIL [email protected]
AECON GROUP INC.