2018 - state corporation commission · medical/surgical, mental health, and substance use disorder...
TRANSCRIPT

2018 Report
Claims - Complaints - Appeals
Mental Health
& Substance Use Disorder Benefits
For the Period January 1, 2017 - December 31, 2017
State Corporation Commission
Bureau of Insurance

2
Executive Summary
As required by § 38.2-3412.1 of the Code of Virginia and in accordance with the federal
Mental Health Parity and Addiction Equity Act of 2008, P.L. 110-343, mental health and
substance use disorder benefits provided by group and individual health insurance coverage must
be in parity with medical and surgical benefits coverage. Further, Enactment Clause 3 of
Chapter 649 of the 2015 General Assembly requires:
That the State Corporation Commission's Bureau of Insurance, in consultation with health carriers providing coverage for mental health and substance use disorder benefits pursuant to § 38.2-3412.1 of the Code of Virginia, shall develop reporting requirements regarding denied claims, complaints, and appeals involving such coverage set forth in § 38.2-3412.1 of the Code of Virginia. Beginning in 2017 for the year preceding, the Bureau shall compile the information into an annual report that: (i) ensures the confidentiality of individuals whose information has been reported; (ii) is made available to the public by, among such other means as the Bureau finds appropriate, posting the reports on the Bureau's Internet website; and (iii) is written in nontechnical, readily understandable language. Managed Care Health Insurance Plans (“MCHIPs”) licensed in Virginia currently submit
annual reports on claims, complaints and appeals to the Virginia Department of Health and to the
State Corporation Commission Bureau of Insurance (the “Bureau”) pursuant to §§ 32.1-137.6 C
and 38.2-5804 of the Code of Virginia. However, specific information related to claims,
complaints and appeals for mental health and substance use services could not be gleaned from
the reports. Therefore, a separate survey was developed by the Bureau in conjunction with the
Virginia Association of Health Plans (“VAHP”), and with health carriers that provide the
majority of fully-insured health insurance in Virginia that are not members of VAHP, along with
major input from the Virginia Department of Behavioral Health and Developmental Services.

3
Through this survey, the Bureau receives information to help it analyze whether claims,
complaints and appeals related to mental health and substance use disorder benefits are being
treated in parity with claims, complaints and appeals related to medical/surgical benefits.
The results of the 2018 survey, which contains information related to calendar year 2017,
are provided in this report. Overall, the survey results suggest that health insurance carriers
generally treat claims, complaints and appeals related to mental health and substance use
disorder benefits in parity with claims, complaints and appeals related to medical/surgical
benefits.

4
Overview
The Bureau surveyed 17 health carriers identified as insuring greater than 5,000 lives in
Virginia in the individual, small group, and large group health insurance markets during the 2017
calendar year. In total, these carriers reported more than 2.2 million covered lives. Carriers were
requested to report information specific to three benefit categories: Medical/Surgical Benefits,
Mental Health Benefits, and Substance Use Disorder Benefits. Further, the carriers were
required to report data for the 2017 calendar year related to these specific three benefit categories
for:
• Claims paid, denied and the reason for the denial;
• Complaints received and processed;
• Internal appeals processed; and
• External reviews processed.
Generally, and from year to year, the report serves to provide an overview of the surveyed data.
As required by § 38.2-3412.1 of the Code of Virginia and in accordance with the federal
Mental Health Parity and Addiction Equity Act of 2008, P.L. 110-343, mental health and
substance use disorder benefits provided by group and individual health insurance coverage shall
be in parity with the medical and surgical benefits coverage. The report provides an observation
of claims, complaints and appeal denials for coverage of mental health benefits and substance
use disorder benefits, compared to medical/surgical benefit coverage, based on the surveyed
data.1
1 To protect the confidentiality of the individual member and health carrier the report only provides data in the aggregate. None of the data in the report pertains to any one individual or health carrier; rather, it is a compilation of the total data reported by the health carriers in response to each surveyed question.

5
Section I. Claims
Overview
Carriers surveyed reported a total of 44,408,780 claims received with 7,355,281 (16.6%)
of claims being denied. Each carrier reported whether each denied claim related to
medical/surgical, mental health, or substance use disorder benefits. The claims reported in each
of these three benefit categories were broken into five separate claims categories: Office Visit
Claims, All Other Outpatient Claims, Inpatient Claims, Emergency Care Claims, and Outpatient
Prescription Drug Transactions. Tables 1, 2, and 3 below provide the breakdown into the five
claim categories of the total claims handled in each benefit category.
Table 1. Claims Overview – Medical/Surgical Benefits
Table 2. Claims Overview – Mental Health Benefits
Claim Category: Medical/ Surgical Benefits
Total C laims R ec eived
C laims P aidC laims Denied
% Denied to Total C laims
O ffic e V is it C laims 10,029,492 9,469,000 560,492 5.6%
A ll O ther O utpatient C laims 13,154,086 11,277,088 1,876,998 14.3%
Inpatient C laims 1,044,899 923,908 120,991 11.6%
E mergenc y C are C laims 1,315,853 1,248,666 67,187 5.1%
O utpatient P res c ription Drug Trans ac tions 14,571,594 10,556,702 4,014,892 27.6%
Totals : 40,115,924 33,475,364 6,640,560 16.6%
Claim Category: Mental Health Benefits
Total C laims R ec eived
C laims P aidC laims Denied
% Denied to Total C laims
O ffic e V is it C laims 888,568 838,856 49,712 5.6%
A ll O ther O utpatient C laims 277,354 250,569 26,785 9.7%
Inpatient C laims 49,444 42,520 6,924 14.0%
E mergenc y C are C laims 92,044 87,693 4,351 4.7%
O utpatient P res c ription Drug Trans ac tions 2,200,755 1,667,369 533,386 24.2%
Totals : 3,508,165 2,887,007 621,158 17.7%

6
Table 3. Claims Overview – Substance Use Disorder Benefits
Denied Claim Ratios
The following charts compare the ratios of denied claims to total claims for
medical/surgical, mental health, and substance use disorder benefits. Figure 1 shows that the
denial rate for claims related to mental health benefits are 1.1% greater than that for medical
surgical benefits and 5.8% greater than that for substance use disorder benefits.
Figure 1. Denied Claims Ratio – All Claims
Claim denials were further broken down by the type of service and benefit category. Figure 2
shows the denial rate for Office Visit Claims (such as physician visits) is the same for both mental
Claim Category: Substance Use Disorder Benefits
Total C laims R ec eived
C laims P aidC laims Denied
% Denied to Total C laims
O ffic e V is it C laims 503,160 481,840 21,320 4.2%
A ll O ther O utpatient C laims 138,019 105,141 32,878 23.8%
Inpatient C laims 33,418 28,438 4,980 14.9%
E mergenc y C are C laims 21,914 20,133 1,781 8.1%
O utpatient P res c ription Drug Trans ac tions 88,180 55,576 32,604 37.0%
Totals : 784,691 691,128 93,563 11.9%

7
health benefits and medical/surgical benefits and substantially greater than that for substance use
disorder benefits.
Figure 2. Denied Claims Ratio – Office Visit Claims
Figures 3 and 5 show that the denial ratio for All Other Outpatient Claims (such as outpatient
surgery, facility charges for day treatment centers, laboratory charges, or other medical items),
and Emergency Care Claims related to substance use disorder benefits exceeds claims denied for
mental health benefits and medical/surgical benefits in those categories. Figure 4 shows the
denial rate for Inpatient Claims related to mental health benefits or substance use disorder
benefits exceeds claims denied for medical/surgical benefits.
Figure 3. Denied Claims Ratio – All Other Outpatient Claims

8
Figure 4. Denied Claims Ratio – Inpatient Claims
Figure 5. Denied Claims Ratio – Emergency Care Claims
Figure 6 shows that the denial rate for Outpatient Prescription Drug Transactions related to
substance use disorder benefits exceeds claims denied for medical/surgical benefits or mental
health benefits.

9
Figure 6. Denied Claims Ratio – Outpatient Prescription Drug Transactions
Attachment A of the report provides an explanation of the reasons for a denial, the top
three reasons for claim denials, and the number of denied claims under six general denial
categories.
Section II. Complaints
Overview
Carriers were requested to provide the number of complaints submitted to the carrier by
either covered persons or the Bureau during 2017as well as the number of complaints the carrier
closed during 2017. A total of 8,468 complaints were reported by the 17 carriers completing the
survey. This information was broken down into five complaint areas for each of the three benefit
categories: Access to Health Care Services, Utilization Management, Practitioners/Providers,
Administrative/Service, and Claims Processing. These five areas are further explained in
Attachment B, Complaint Areas.

10
Table 4 shows the number of complaints for the respective complaint area and whether
the complaint was related to a medical/surgical benefit, mental health benefit, or substance use
disorder benefit. Table 5 shows the ratio of the number of complaints in each complaint area,
broken down by benefit category to the total of all complaints in each complaint area and in total
by benefit category.
Table 4. Total Complaints
Table 5. Ratio of Complaints to Their Respective Total
Submitted During Year
Closed During Year
Submitted During Year
Closed During Year
Submitted During Year
Closed During Year
Submitted During Year
Closed During Year
Access to Health Care Services 692 690 23 22 0 0 715 712
Utilization Management 2,142 2,115 29 29 5 4 2,176 2,148
Practitioners/ Providers 49 45 3 3 0 0 52 48
Administrative/ Service 1,671 1,628 47 47 0 0 1,718 1,675
Claims Processing 3,779 3,741 25 24 3 3 3,807 3,768
Totals 8,333 8,219 127 125 8 7 8,468 8,351
All ComplaintsNumber of Complaints Related to:
Medical/ Surgical Benefits
Mental Health Benefits
Substance Use Disorder Benefits

11
Complaint Ratios
The following charts demonstrate how the different areas of complaints related to mental
health or substance use disorder benefits compare to those complaint areas for medical/surgical
services, which comprised 98.4% of all complaints. For example, of the total complaints carriers
received for medical/surgical benefits, 8.3% pertain to complaints regarding access to health care
services, whereas 18.1% of the total complaints carriers received for mental health benefits were
due to access to health care services. At the same time there were no complaints regarding
access to care for substance use disorder benefits; utilization management produced the greatest
percentage of complaints in this benefit category. The charts below are an illustration of the
respective ratios.
Attachment B of the report provides examples of the complaints that fall into the five
areas of complaints.
0.0%2.0%4.0%6.0%8.0%
10.0%12.0%14.0%16.0%18.0%20.0%
MentalHealth
MedicalSurgical
SubstanceUse
Disorder
Ratio of Submitted Complaints by Benefit Category
Complaints - Access to Health Care Services
0.0%
10.0%
20.0%
30.0%
40.0%
50.0%
60.0%
70.0%
MentalHealth
MedicalSurgical
SubstanceUse
Disorder
Ratio of Submitted Complaints by Benefit CategoryComplaints - Utilization Management
Figure 7. Access to Health Care Services Complaints
Figure 8. Utilization Management Complaints

12
0.0%
0.5%
1.0%
1.5%
2.0%
2.5%
MentalHealth
MedicalSurgical
SubstanceUse
Disorder
Ratio of Submitted Complaints by Benefit CategoryComplaints -Practitioners/Providers
0.0%
5.0%
10.0%
15.0%
20.0%
25.0%
30.0%
35.0%
40.0%
MentalHealth
MedicalSurgical
SubstanceUse
Disorder
Ratio of Submitted Complaints by Benefit CategoryComplaints -Administrative/Service
0.0%
5.0%
10.0%
15.0%
20.0%
25.0%
30.0%
35.0%
40.0%
45.0%
50.0%
MentalHealth
MedicalSurgical
SubstanceUse
Disorder
Ratio of Submitted Complaints by Benefit CategoryComplaints - Claims Processing
Figure 9. Complaints Regarding Practitioner/Providers
Figure 10. Administrative/Service Complaints
Figure 11. Claims Processing Complaints
13
Section III. Appeals
Internal Appeals
An internal appeal is filed by a healthcare provider or consumer to obtain approval for
services an MCHIP has denied as the result of utilization review or an administrative denial. The
appeal could concern a denied request for pre-authorization, which is a pre-service appeal, or the
appeal could concern services that have already been provided or that do not require pre-
authorization, which is a post-service appeal. The defining characteristic of the internal appeal
process is that the MCHIP makes the determination. Depending upon the particular MCHIP and
an individual’s health plan, the person may have one or two levels of internal appeal. Pre-service
appeals must be decided within 30 days, and post-service appeals must be decided within 60
days. For situations involving a serious medical condition where a quick response is required, a
person or the healthcare provider can request an urgent care appeal. In such a case, the MCHIP
has 72 hours to make a decision.
The health carriers responding to the survey reported that a total of 9,244 internal appeals
were processed and closed in 2017. Table 6 shows the number of appeals related to the denial of
benefits for medical/surgical, mental health, and substance use disorder services and the results of
those appeals. Figures 12-14 demonstrate the appeal outcome for the three benefit categories.

14
Table 6. Closed Internal Appeals
Closed Internal Appeals Number Related to Medical/ Surgical
Benefits
Number Related to Mental Health
Benefits
Number Related to Substance Use
Disorder Benefits Internal A ppeals – Denial Upheld
6024 84 57Internal A ppeals – Denial P artially Upheld
158 2 0Internal A ppeals – Denial O verturned
3062 16 17Total Closed Internal Appeals 9244 102 74
Figure 12. Closed Internal Appeals – Denial Upheld
Figure 13. Closed Internal Appeals – Denial Partially Upheld

15
External Review
When a consumer with a fully-insured Virginia policy receives a denial after completing the
health carrier’s internal appeals process (unless it is an emergency in which case completion is
not required), there is an external review process available that is administered by the Bureau.
There are two kinds of denials which may be subject to an external review:
• A denial that involves a finding that services are not medically necessary; or
• A denial that involves a determination that a treatment is experimental or
investigational.
The consumer or his authorized representative may file a written request for an external
review within 120 days of the date the consumer receives the health carrier’s final decision. The
notice sent by the health carrier should provide instructions for when and how the request must
be filed. One of the Bureau’s approved Independent Review Organization’s (“IRO”) external
reviewers is then assigned the external review on a random basis, taking into account any
potential conflict of interest. The IRO will issue a final decision within 45 days for a standard
external review and within either 72 hours or six days for an expedited review, depending on
Mental Health Medical/Surgical Substance UseDisorder
Denial Overturned 15.7% 33.1% 23.0%
0.0%5.0%
10.0%15.0%20.0%25.0%30.0%35.0%
Ratio of Internal Appeals Denied to Total Closed Appeals
Internal Appeals - Denial Overturned
Figure 14. Closed Internal Appeals – Denial Overturned
16
whether or not the review relates to a treatment denied on the basis that it is experimental or
investigational. The IRO will either uphold the health carrier’s denial or overturn it. The health
carrier is required by law to accept the external reviewer’s decision.
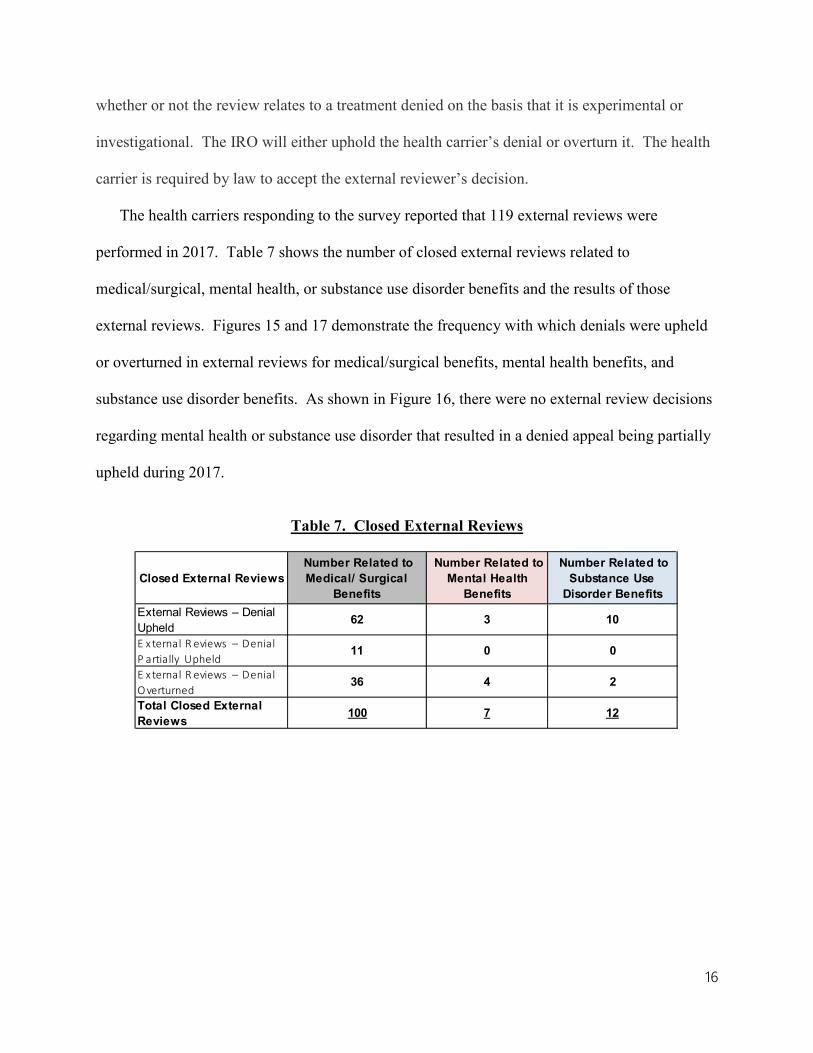
The health carriers responding to the survey reported that 119 external reviews were
performed in 2017. Table 7 shows the number of closed external reviews related to
medical/surgical, mental health, or substance use disorder benefits and the results of those
external reviews. Figures 15 and 17 demonstrate the frequency with which denials were upheld
or overturned in external reviews for medical/surgical benefits, mental health benefits, and
substance use disorder benefits. As shown in Figure 16, there were no external review decisions
regarding mental health or substance use disorder that resulted in a denied appeal being partially
upheld during 2017.
Table 7. Closed External Reviews
Closed External Reviews Number Related to Medical/ Surgical
Benefits
Number Related to Mental Health
Benefits
Number Related to Substance Use
Disorder Benefits External Reviews – Denial Upheld
62 3 10
E x ternal R eviews – Denial P artially Upheld
11 0 0
E x ternal R eviews – Denial O verturned
36 4 2
Total Closed External Reviews 100 7 12

17
Figure 15. Closed External Reviews - Denial Upheld
Figure 16. Closed External Reviews – Denial Partially Upheld
Figure 16. Closed External Reviews – Denial Overturned

18
Conclusion
This report provides an overview of how health carriers respond to submitted claims,
complaints received, and requests regarding health benefit plan enrollees’ appeals of a coverage
denial as an internal appeal or external review insofar as the claim, compliant or appeal was
related to a health care service for medical or surgical benefits, mental health benefits, or
substance use disorder benefits.
The carriers reported that of some 7.4 million denied claims, 10% were denied for health
care services relating to mental health benefits (9%) or substance use disorder benefits (1%).
This appears proportionate to the 44.4 million total claims received in which slightly more than
9.6% of all claims received related to mental health benefits (7.9%) and substance use disorder
benefits (1.7%). The report shows that depending on the type of claim (office visits, other
outpatient claims, inpatient claims, emergency care claims or outpatient prescription drug
transactions), claim denials for mental health were denied either less frequently or more
frequently than services for medical/surgical benefits, whereas claims for substance use disorders
services were generally denied more frequently than claims for medical/surgical benefits with the
exception being office visits for mental health benefits.
There was a total of 8,478 complaints reported as received in 2017 with 135 complaints
(1.6 %) representing a complaint on mental health or substance use disorder benefits. Of these,
the largest complaint category was administrative services (47), while the fewest complaints
were received in the category concerning practitioners or providers (3).
The carriers reported 179 closed internal appeals of claim denials for mental health or
substance use disorder benefits with 141 (78.8%) having the denials upheld. Of the remaining

19
closed internal appeals, the claim denial was overturned in 33 cases with 2 partially overturned.
There were 19 closed external reviews with 13 (68%) having the denial upheld and 6 (32%)
having the claim denial overturned.
The information requested and obtained was based on the carriers’ data recorded and
provided to the Bureau for the calendar year ending December 31, 2017, and would suggest that
carriers generally are complying with the statutory requirements relating to parity.

20
Attachment A
Claim Denial Reasons
Carriers were asked to report the total number of claims denied for which the denial
would leave the member responsible for payment and to identify the top three denial reasons in
each of the three benefit categories: Medical/ Surgical (“M/S”), Mental Health (“MH”) and
Substance Use Disorder (“SUD”).
Carriers reported that a total of 4,175,466 denials out of the 7,355,281 total claims denials
reported in “Section I. Claims” could be attributed to each carrier’s top three claim denial
reasons. This means that 3,179,815 reported claim denials were for reasons other than each
carrier’s top three reasons.
Table A-1. shows the top three claim denial reasons across all carriers surveyed by the
number of claim denials in each benefit category.
Table A-1. Top Three Denial Reasons by Ranking
Denial Reason by Benefit Category Number of Denials Rank
Exceeds benefit limits (contractual) 1,203,017 1Prescription refill too soon 668,603 2Not a covered benefit/service contractually excluded 457,758 3
Prescription refill too soon 160,132 1Individual ineligible/not insured when the services were provided 125,678 2Exceeds benefit limits (contractual) 105,919 3
Individual ineligible/not insured when the services were provided 13,227 1Services not preauthorized/Referral not obtained 12,301 2Not a covered benefit/service contractually excluded 6,960 3
Medical/Surgical
Mental Health
Substance Use Disorders

21
For purposes of the report, the Bureau consolidated the reasons reported by carriers as the
top three claim denial reasons into six general categories. Table A-2. shows those denial reasons
reported by carriers and organizes those reasons into general categories. Table A-3. shows the
number of all denied claims attributable to each general category, broken down by benefit
category.
Table A-2. Denial Reasons by General Category
Denials related to non-covered benefits or services:Exceeds benefit limits (contractual)Not a covered benefit/service contractually excludedIndividual ineligible/not insured when the services were providedOther (Explain): Workers Compensation
Denials related to prescription drug claims:Prescription refill too soonRejected - Drug Utilization ReviewFilled after coverage terminiatedDoes not meet step therapy protocol
Denials related to preauthorization or precertification:Services not preauthorized/Referral not obtainedClaim submitted does not match prior authorization
Denials related to provider or administrative billing:Provider billed incorrectlyExceeds deadline for timely filing - member responsibleIncomplete information filedAmount exceeds UCR/Allowable ChargeCOB - plan is secondaryPCP not selectedThe quantity of units billed exceeds the medically unlikely edit limit .Other (Explain): The # of units reported exceeds the typical frequency per day.Other (Explain): The submitted procedure is disallowed because it is incidental to a code billed on the same date of service.Other (Explain): ITS No Hold Harmless Allowable OverrideOther (Explain): This service is not allowed because it is part of a CMS NCCI Column 1/ Column 2 edit that includes a procedure or service on a prior claim.Other (Explain): The member's plan provides coverage for charges that are reasonable and appropriate as determined by [insurance company]. This procedure exceeds the maximum number of services allowed under [insurance company] guidelines for a single date of service.Other (Explain): The member's plan provides coverage for charges that are reasonable and appropriate. The charge for this service does not meet this requirement of the member's plan of benefits because this service is considered mutually exclusive to another procedure performed on the same date of service.Other (Explain):The procedure is disallowed because this service or a component of this service was previously billed by another health care professional.Other (Explain):The submitted procedure code is disallowed because the primary related service was not reported on the claim or was denied for other reason.

22
Table A-3. Number of Claims Denied by General Categories
Other (Explain): Claim Paid at 0 for 60 Day Grace PeriodOther (Explain): No charges are eligible for payment due to the Medicare provider's contractural obligation or Medicare has paid the charges in fullOther (Explain): Claim line denied by external bundling/fraud detection systemOther (Explain): Not covered overutilizes servicesOther (Explain): Duplicate chargesOther (Explain): Facility's daily rate includes charges.Other (Explain): Benefits for this service are included in the payment.
Denials related to non-paricipating provider, out-of-network, out of service area or other such denial reason:
Provider not participating with the individual’s planProvider/Facility not a covered provider/facility type for this serviceRendering Clinician has not been individually credentialedOther (Explain): Claim is not payable under our service area. Claim must be filed to the Payer/Plan in the service area where the services were received.
Denials related to not medicaly necessary or inappropriate service:Not Medically NecessaryInappropriate level of care/inappropriate place of service/inappropriate treatment for condition orcircumstanceProvider/Facility not a covered provider/facility type for this serviceExperimental/Investigational
All M/S MH SUD4,175,466 3,636,809 484,176 54,481
Non-c overed benefits or s ervic es 2,267,247 1,984,073 261,557 21,617 P res c ription drug s ervic es 901,273 728,980 170,891 1,402 P reauthoriz ation or prec ertific ation 432,334 388,468 31,565 12,301 P rovider or adminis trative billing 317,121 292,100 12,938 12,083 Non-partic ipating providers or out of network/s ervic e area 127,379 115,844 6,064 5,471 Medic al nec es s ity or inappropriate s ervic e 130,112 127,344 1,161 1,607
General Categories

23
Attachment B Complaint Areas
1 Geographic access limitations to providers and practitioners
2Availability of Primary Care Providers/Specialists/Behavioral and Mental HealthProviders
3 Primary Care Provider after-hour access4 Access to urgent care and emergency care5 Out of network access6 Availability and timeliness of provider appointments and provision of services
7Availability of outpatient services with the network (to include home health agencies, hospice, labs, physical therapy, and radiation therapy)
8 Enrollee provisions to allow transfers to another Primary Care Provider9 Patient abandonment by Primary Care Provider
10Pharmaceuticals (based upon patient's condition, the use of generic drugs versusbrand name drugs)
11Access to preventative care (immunizations, prenatal exams, sexually transmitteddiseases, alcohol, cancer screening, coronary, smoking)
1 Denial of medically appropriate services covered within the enrollee contract
2 Limitations on hospital length of stays for stays covered within the enrollee contract
3 Timeliness of preauthorization reviews based on urgency
4Inappropriate setting for care, i.e. procedure done in an outpatient setting that should be performed in an inpatient setting
5 Criteria for experimental care6 Unnecessary tests or lack of appropriate diagnostic tests7 Denial of specialist referrals allowed within the contract8 Denial of emergency room care allowed within the contract
9Failure to adequately document and make available to the members reasons fordenial
10 Unexplained death
11Denial of care for serious injuries or illnesses, the natural history of which, if untreated are likely to result in death or to progress to a more severe form
12 Organ transplant criteria questioned
1 Appropriateness of diagnosis and/or care2 Appropriateness of credentials to treat
3Failure to observe professional standards of care, state and/or federal regulationsgoverning health care quality
4 Unsanitary physical environment5 Failure to observe sterile techniques or universal precautions
6Medical records - failure to keep accurate and legible records, to keep them confidential and to allow patient access
7 Failure to coordinate care (example - appropriate discharge planning)
1 Inadequate, incomplete, or untimely response to concerns by health carrier staff
2Conflict of application of health carrier policies and procedures with evidence of coverage or policy
3 Breach of confidentiality
4 Lack of access/explanation of to health carrier complaint and grievance procedures
5 Incomplete or absent health carrier enrollee notification
6Plan documents (evidence of coverage, enrollment information, insurance card) notreceived
7 Enrollee did not understand available benefits
8Enrollee claimed plan staff members were not responsive to request for assistance,or phone calls or letters were not answered
9 Marketing or other plan material was not clear
10Complaints and appeals, formal or informal, were not responded to within requiredtime frames, or were not adequately answered
1 Claim not paid in full, unrelated to utilization review decision2 Claim not paid in a timely manner
3 Claim processed incorrectly, or an incorrect copayment or deductible was assessed
4 Claim was denied because of pre-existing condition
5 Enrollee held responsible contrary to “hold harmless” contractual agreement between the health plan and provider
6 Usual, Customary and Reasonable determination unreasonable
E. Claim Processing, unrelated to utilization review
D. Administrative/Health Carrier Service
p g
B. Utilization Management
A. Access to Health Care Services
C. Practitioners/Providers