2018 lake county analysis of impediments … · discriminatory practices in housing and an...
TRANSCRIPT

PREPARED BY: The Florida Housing Coalition, Inc.
2018 LAKE COUNTY ANALYSIS OF IMPEDIMENTS TO FAIR
HOUSING CHOICE

2
This Page Intentionally Left Blank
3
Contents
List of Figures ................................................................................................................................................ 6
Introduction and Executive Summary........................................................................................................... 8
Purpose of the Report .............................................................................................................................. 8
Fair Housing Laws .....................................................................................................................................9
Federal Fair Housing Laws.....................................................................................................................9
State of Florida Fair Housing Laws .......................................................................................................10
Federal Accessibility Standards ............................................................................................................10
Report Organization ................................................................................................................................11
I. Jurisdictional Background ................................................................................................................... 12
Population Growth ................................................................................................................................. 12
Sex ........................................................................................................................................................... 17
Age Profile .............................................................................................................................................. 17
Race/Ethnicity ......................................................................................................................................... 20
Familial Status ......................................................................................................................................... 21
Disability ................................................................................................................................................. 21
Foreign Born ........................................................................................................................................... 26
Place of Birth........................................................................................................................................... 22
Limited English Proficiency ..................................................................................................................... 29
Median Household Income .................................................................................................................... 31
Household Income Distribution .............................................................................................................. 33
Employment ........................................................................................................................................... 35
Housing Profile ....................................................................................................................................... 42
II. Additional Data and Analysis ..............................................................................................................61
Segregation Analysis ............................................................................................................................... 61
Access to Areas of Opportunity .............................................................................................................. 63
Job Proximity Index ............................................................................................................................. 63
Labor Market Index ............................................................................................................................. 68
Transit Trips Index ................................................................................................................................71
Low Transportation Cost Index ...........................................................................................................76
Center for Neighborhood Technology’s Housing + Transportation Index ..........................................81
School Proficiency Index .....................................................................................................................90
Low Poverty Index ...............................................................................................................................95
Racially or Ethnically Concentrated Areas of Poverty (R/ECAPs) ...........................................................98

4
Hate Crime Data ...................................................................................................................................100
III. Evaluation of Jurisdiction’s Current Fair Housing Legal Status .....................................................101
Fair Housing Complaints or Compliance Reviews ................................................................................101
Fair Housing Discrimination Suit filed by Department of Justice .........................................................104
Reasons for any trends or patterns ......................................................................................................105
Other Fair Housing Concerns or Problems ...........................................................................................105
IV. Identification of Impediments ......................................................................................................106
Zoning and Site Selection .....................................................................................................................106
PHA and Other Assisted/Insured Housing Provider Tenant Selection Procedures; Housing Choices for Certificate and Voucher Holders ..........................................................................................................110
Section 8 Housing Choice Voucher Program Application and Tenant SelectionPolicies .....................111
Sale of Subsidized Housing and Possible Displacement .......................................................................116
Property Tax Policies ............................................................................................................................117
Planning and Zoning Boards .................................................................................................................118
Building Codes (Accessibility) ...............................................................................................................121
Private Sector – Lending Policies and Practices ...................................................................................123
Public Sector .........................................................................................................................................126
Fair Housing Enforcement ................................................................................................................126
Complaint Process .............................................................................................................................127
Information Programs .......................................................................................................................128
Visitability in Housing ........................................................................................................................129
Assessment of Current Public and Private Fair Housing Programs and Activities in the Jurisdiction..130
Community Survey ...............................................................................................................................133
Respondent demographics ...............................................................................................................133
Housing Discrimination and Fair Housing Rights ..............................................................................135
Reporting awareness ........................................................................................................................136
Access to Opportunity .......................................................................................................................137
V. Conclusions and Impediments ..........................................................................................................139
Impediments and Action Plan ..............................................................................................................140
VI. Signature Page ..............................................................................................................................142
Appendix ...................................................................................................................................................143
Appendix 1. Community Survey Results ...............................................................................................143

5
6
List of Figures Figure 1. HUD AFFHT004, 2010 Demographics by Race/Ethnicity ............................................................. 14
Figure 2. HUD AFFHT004, 1990 Demographics by race/ethnicity .............................................................. 15
Figure 3. HUD AFFHT004, 2000 Demographics by race/ethnicity .............................................................. 16
Figure 4. Age Profile of Lake County ........................................................................................................... 19
Figure 5. HUD AFFHT004, Ambulatory, Self-Care, and Independent Living Disability ................................ 24
Figure 6. HUD AFFHT004, Hearing, Vision, and Cognitive Disability ........................................................... 25
Figure 7. HUD AFFHT004, National Origin .................................................................................................. 28
Figure 8. HUD AFFHT004, Limited English Proficiency ................................................................................ 30
Figure 9: Median Household Income .......................................................................................................... 32
Figure 10. Unemployment rate in Lake County and Orlando-Kissimmee-Sanford region ......................... 35
Figure 11: Percent of Population 16 and Over Below the Poverty Level .................................................... 39
Figure 12: Percent of All Housing Units Built Since 1980 ............................................................................ 43
Figure 13: Estimated Contract Rent ............................................................................................................ 48
Figure 14: Cost Burdened Renter Units ...................................................................................................... 53
Figure 15: Cost Burdened Owner Units with a Mortgage ........................................................................... 55
Figure 16: Cost Burdened Owner Units without a Mortgage ..................................................................... 57
Figure 17: Rental Units as a Percent of All Occupied Units ........................................................................ 59
Figure 18. HUD AFFHT004, Job Proximity Index and Family Status ............................................................ 65
Figure 19. HUD AFFHT004, Job Proximity Index and National Origin ......................................................... 66
Figure 20. HUD AFFHT004, Job Proximity Index and Race/Ethnicity .......................................................... 67
Figure 21. HUD AFFHT004, Labor Market Index and Familial Status .......................................................... 70
Figure 22. HUD AFFHT004, Labor Market Index and National Origin ......................................................... 71
Figure 23. HUD AFFHT004, Labor Market Index and Race/Ethnicity .......................................................... 72
Figure 24. HUD AFFHT004, Transit Trips Index and Familial Status ............................................................72Figure 25. HUD AFFHT004, Transit Trips Index and National Origin ...........................................................73Figure 26. HUD AFFHT004, Transit Trips Index and Race/Ethnicity ............................................................74Figure 27. HUD AFFHT004, Low Transportation Cost Index and Familial Status ........................................77Figure 28. HUD AFFHT004, Low Transportation Cost Index and National Origin .......................................78Figure 29. HUD AFFHT004, Low Transportation Cost index and Race/Ethnicity ........................................79Figure 30. CNT H+T Index and Race/Ethnicity ............................................................................................82Figure 31. CNT H+T Index for 80% AMI Households and Disabled Population in Lake County ..................84Figure 32. CNT H+T Index for 80% AMI Households and number of families in Lake County ....................86Figure 33. CNT H+T Index for 80% AMI Households and foreign born population in Lake County ............88Figure 34. HUD AFFHT004, School Proficiency Index and Race/Ethnicity ..................................................92Figure 35. HUD AFFHT004, School Proficiency Index and National Origin .................................................93Figure 36. HUD AFFHT004, School Proficiency Index and Familial Status ..................................................94Figure 37. HUD AFFHT004, Low Poverty Index and Race/Ethnicity ............................................................97Figure 38. Low- and Moderate-Income census tracts and percent minority in Lake County .....................99Figure 39. Housing Complaints Resolved by Basis ....................................................................................103Figure 40. Lake County Zoning ..................................................................................................................109Figure 41. Subsidized Housing and HCV unit concentration by census tract, Lake County......................115
8
Introduction and Executive Summary The U.S. Department of Housing and Urban Development (HUD) has a commitment to eliminate
discriminatory practices in housing and an obligation under Section 808 of the Fair Housing Act to
encourage the adoption and enforcement of fair housing laws in federally funded housing and community
development programs. Title VIII of the Civil Rights Act of 1964 (42 U.S.C. 2000d et seq.) and implementing
regulations in 24 CFR part 1, prohibit discrimination in any program or activity funded in whole or in part
with federal funds made available under this part. In addition to its responsibility for enforcing other
Federal statutes prohibiting discrimination in housing, HUD has a statutory obligation under Section 109
of the HCD Act of 1974, Title I, prohibiting discrimination on the basis of race, color, national origin,
disability, age, religion, and sex within Community Development Block Grant (CDBG) programs or
activities.
Lake County receives federal funding from HUD to conduct housing and community development
activities under 24 CFR Parts 91 and 570, the Consolidated Planning process. The Consolidated Planning
process combines major federal grants such as the Community Development Block Grant (CDBG), the
HOME Investment Partnership Program (HOME) and the Emergency Solutions Grant (ESG). As a recipient
of CDBG funds, Lake County is required to submit a certification to HUD that it will affirmatively further
fair housing. This certification requires the completion of an Analysis of Impediments (AI) to Fair Housing
Choice.
To satisfy the certification requirement, and in the pursuit of equal access to opportunity and affirmative
enforcement of the Fair Housing Act, Lake County contracted with the Florida Housing Coalition, Inc. to
develop this AI. Lake County will monitor progress of the plan and assess the fair housing challenges and
opportunities over the next five years.
Purpose of the Report Equal access to housing is fundamental to each person in meeting essential needs, including pursuit of
personal, educational or employment goals. Because housing is so critical to personal development, fair
housing is a goal that public officials and private citizens must embrace for the vision of equality of
opportunity to become a reality. In recognition of equal housing access as an essential right, the federal
government and the State of Florida have both established fair housing choice as a right protected by law.
Additionally, Lake County recognizes the fundamental importance of equal access to housing and works
to affirmatively further fair housing in both the letter and spirit of the law.
Fair Housing is defined as a condition in which individuals of similar income levels in the same housing
market have a range of housing choices available to them independent of their race, color, religion,
national origin, sex, sexual orientation, gender identity or expression, age, disability, familial status,
marital status or any other arbitrary factor.
Impediments to fair housing choice include any actions, omissions or decisions taken because of race,
color, religion, national origin, sex, sexual orientation, gender identity or expression, age, disability,
familial status or marital status, or any other arbitrary factor which restricts housing choices or the
availability of housing choices.

9
Pursuant to HUD regulations (24CFR91.225(a)) to receive CDBG funds, each entitlement jurisdiction must
certify that it will affirmatively further fair housing (AFFH) through Fair Housing Planning. Fair Housing
Planning entails:
Completion of an Analysis of Impediments to Fair Housing Choice (AI).
Implementation of action plans to eliminate any identified impediments.
Maintenance of AFFH records corresponding with implementation of the Consolidated Plan everythree to five years.
HUD interprets these three certifying elements to include:
Analyzing housing discrimination in jurisdictions and working toward its elimination.
Promoting fair housing choice for all people.
Providing racially and ethnically inclusive patterns or housing occupancy.
Promoting housing that is physically accessible to, and usable by all people particularly individualswith disabilities.
Fostering compliance with nondiscrimination provisions of the Fair Housing Act.
This AI will:
Evaluate population, household income and housing characteristics by protected classes in theCounty.
Evaluate public and private sector policies that may impose barriers to fair housing choice.
Identify existing impediments to fair housing choice, if they exist in Lake County.
Create an action plan for overcoming identified impediments to fair housing choice with actionsthat are both feasible and meaningful.
The AI presents a jurisdictional background of Lake County, assesses the extent of housing needs among
specific groups, and evaluates the availability of a variety of housing choices for its residents. This report
also analyzes the conditions in the private market and public sector that may limit the range of housing
choices or impede a person’s access to housing. While this report also assesses the nature and extent of
housing discriminations, the focus is on identifying impediments that may prevent equal housing access
and developing solutions to mitigate or remove such impediments.
Fair housing, while required by law and a moral issue in its commitment to equal access to housing for all
people, is also an economic issue. No community can reach its full potential for economic growth and
well-being if its residents are unable to participate fully in the housing market. Segregated housing causes
unequal education, unequal access to jobs, and unequal income. Studies have clearly shown the
relationship between housing, education, jobs and the ability to build equity through home ownership.
Home-seekers who do not have access to all of the available housing choices may not be able to take
advantage of living in neighborhoods that provide access to opportunity.
Fair Housing Laws
Federal Fair Housing Laws The Federal Fair Housing Act of 1968 and Fair Housing Amendments Act of 1988 prohibit discrimination
in all aspects of housing, including the sale, rental, lease or negotiation for real property. The Fair Housing
Act prohibits discrimination based on a person’s race, color, religion, sex, disability, familial status or

10
national origin. In addition, HUD issued a Final Rule on February 3, 2012, that prohibits communities and
organizations participating in its grant programs from discriminating on the basis of actual or perceived
sexual orientation, gender identity or marital status. Persons who are protected from discrimination by
fair housing laws are referred to as members of the protected classes.
State of Florida Fair Housing Laws The Florida Civil Rights Act of 1992 (state statute 760) prohibits housing discrimination on the basis of
race, color, religion, sex, national origin, age, handicap or marital status. In addition to the seven federally
protected classes, age is also a protected class in the State of Florida, giving Florida residents greater
protection under the State fair housing laws. The Civil Rights Act formally created the Florida Commission
of Human Relations (FCHR).
Federal Accessibility Standards Fair Housing Amendment Act: The Act requires owners of housing facilities make “reasonable
accommodation” (exceptions) in their rules, policies and operations to give people with disabilities equal
housing opportunities. The Fair Housing Act also requires landlords to allow tenants with disabilities to
make reasonable access-related modifications to their private living space, as well as to common use
spaces at the tenant’s own expense. Finally, the Act requires that new multi-family housing with four or
more units be designed and built to allow access for persons with disabilities. This includes accessible
common use areas, doors that are wide enough for wheelchairs, kitchens and bathrooms that allow a
person using a wheelchair to maneuver, and other adaptable features within the units.
Americans with Disabilities Act (ADA): ADA standards are required to ensure equal access to places of
public accommodation and commercial facilities by individuals with disabilities. Title II of the ADA applies
to state and local services, including state and local housing programs. Government entities are obliged
to assure that housing financed through state and local programs complies with ADA accessibility
guidelines.
Section 504: Section 504 of the Rehabilitation Act of 1973 states: “No otherwise qualified individual with
a disability in the United States . . . shall, solely by reason of her or his disability, be excluded from
participation in, be denied the benefits of, or be subjected to discrimination under any program, service
or activity receiving federal financial assistance or under any program or activity conducted by any
Executive agency or by the United States Postal Service (29 U.S.C. 794)”. This means that Section 504
prohibits discrimination on the basis of disability in any program or activity that receives financial
assistance from any federal agency, including HUD.
Architectural Barriers Act: The Architectural Barriers Act of 1968 (ABA) (42 U.S.C. 4151-4157) requires
that certain buildings financed with Federal funds must be designed, constructed or altered in accordance
with standards that ensure accessibility for persons with physical disabilities. The ABA requires that
covered buildings comply with the Uniform Federal Accessibility Standards (UFAS). The ABA does not
cover privately-owned housing, but covers buildings or facilities financed in whole or in part with Federal
funds. The ABA applies to public housing (24 CFR 40), and to buildings and facilities constructed with CDBG
funds (24 CFR 570.614). In practice, buildings built to meet the requirements of Section 504 and Title II of
the ADA will conform to the requirements of the ABA.
Uniform Federal Accessibility Standards (UFAS): UFAS sets standards for facility accessibility by physically
handicapped persons for federal and federally-funded facilities. These standards are to be applied during

11
the design, construction, and alteration of buildings and facilities to the extent required by the
Architectural Barriers Act of 1968, as amended.
Report Organization The AI is divided into six sections: I. Jurisdictional Background. The Jurisdictional Background presents demographic, housing, and income
characteristics in Lake County and, where possible, are examined through the lens of protected classes
under the Fair Housing Act.
II. Additional Data and Analysis. The Additional Data and Analysis section reviews data sets related to
access to opportunity, segregation, racially/ethnically concentrated areas of poverty, and hate crime data.
III. Evaluation of Current Fair Housing Legal Status. The Evaluation of Current Fair Housing Legal Status
section identifies outstanding legal liabilities or obligations related to Fair Housing in Lake County and its
agencies.
IV. Identification of Impediments. The Identification of Impediments section reviews various public
policies and actions that may impede fair housing within Lake County, and reviews a public survey
conducted on behalf of Lake County.
V. Conclusions and Impediments. The Conclusions and Impediments section reviews impediments to fair
housing choice identified in the report and identifies actions that are both meaningful and feasible for
Lake County to execute.
VI. Signature Page.

12
I. Jurisdictional Background Impediments to fair housing choice are often discovered through quantitative data analysis. To that end,
the jurisdictional background reviews the demographic profile of Lake County and uses the Orlando-
Kissimmee-Sanford metropolitan statistical area (MSA) as a point of comparison. The analysis covers
population growth trends, sex, age, race/ethnicity, familial status, disability, foreign born, place of birth,
and limited English proficiency populations. The analysis includes data provided by the American
Community Survey and from HUD.
The topics reviewed in this section are purposefully expansive and exhaustive. The data provided here is
used to identify general trends over time between the general population and protected classes,
disproportionate housing cost burdens for protected classes, and reviews economic data. It is suggested
that the reader use the jurisdictional background as a reference for the current state of economic,
housing, and demographic conditions in Lake County.
Population Growth
Table 1 shows trends in the total population by race/ethnicity in Lake County between 1990 and 2016.
The White population represents a significant majority of the total population in Lake County, although
the total share declined between 1990 and 2010 (from 88.56% of the population in 1990 to 76.20% in
2010). The 2012-2016 data shows both an increased number and share of Whites in the County, rising to
83.47% of the population.
The Black and Hispanic population share have each grown since 2010, with the Black population
accounting for 9.92% of the population (up from 9.18% in 2010), and the Hispanic population accounts
for 13.81% of the population (up from 11.45%). Some of the smaller minority groups such as Asian/Pacific
Table 1 Lake County FL, Population Growth Trends
1990 Trend 2000 Trend 2010 Trend 2012-2016
Race/Ethnicity # % # % # % # %
White 95,020 88.56% 122,563 85.49% 153,316 76.20% 265,082 83.47%
Black 8,624 8.04% 10,758 7.50% 18,462 9.18% 31,492 9.92%
Hispanic 2,925 2.73% 7,387 5.15% 23,046 11.45% 43,852 13.81%
Asian or Pacific
Islander
349 0.33% 1,442 1.01% 4,216 2.10% 5,790 1.82%
Native
American
244 0.23% 872 0.61% 1,498 0.74% 1,339 0.42%
Source 1990 Decennial Census, Table DP1; 2000 Decennial Census, Table DP1; 2010 Decennial
Census, Table DP1; American Community Survey, Table B02001, 2012-2016

13
Islander and Native Americans account for 1.82% and 0.42% of the population, respectively. Both groups
have experienced a decrease in the total share of the population, but the absolute number of persons
identifying as Native American or Asian or Pacific Islander have risen.
Table 2 below shows race/ethnicity trends at the regional level. Trends in the region mirror those
observed in Lake County. The percentage of the total population that is White, Black, or Hispanic has
grown to varying degrees, while the percentages for Asian or Pacific Islanders and Native Americans has
decreased in both. Hispanics represent the largest minority group in both Lake County and the region but
is a larger share in the region than. Hispanics account for over 28% of the region’s population, over twice
the share in Lake County (13.8% compared to 28.1%).
Table 2 Orlando-Kissimmee-Sanford MSA, Population Growth Trends
1990 Trend 2000 Trend 2010 Trend 2012-2016
Race/Ethnicity # % # % # % # %
White 956,485 78.08% 1,070,36
2
65.08% 1,136,86
3
53.26% 1,657,932 83.47%
Black 143,019 11.67% 232,143 14.11% 339,119 15.89% 380,326 16.33%
Hispanic 100,532 8.21% 271,531 16.51% 538,856 25.25% 654,377 28.10%
Asian or Pacific
Islander
19,816 1.62% 52,067 3.17% 97,305 4.56% 97,141 4.17%
Native American 3,099 0.25% 8,731 0.53% 10,760 0.50% 5,491 0.24%
Source 1990 Decennial Census, Table DP1; 2000 Decennial Census, Table DP1; 2010 Decennial Census, Table DP1; American
Community Survey, Table B02001, 2012-2016

14
In addition to data presented in tables, this analysis also includes geospatial information to describe the
location of various protected class populations in Lake County. In some cases, maps were collected from
the HUD AFFH Tool which is available online at https://egis.hud.gov. In other cases, maps were prepared
using ESRI ArcGIS and publicly available data sets.
Figure 1 shows the 2010 Demographics of race/ethnicity in Lake County. The 2010 Demographics map
gives a visual representation of the demographic profile of Lake County. Each dot represents 75 people
and the races/ethnicities depicted are White, Black, Native American, Asian/Pacific Islander, and Hispanic.
The map shows significant concentrations of White residents, with a relatively even dispersion across the
region. Additionally, Map 2 shows a concentration of Blacks/African Americans and Hispanics in the
Montclair neighborhood, to the Northwest of the City of Leesburg.
Figure 1. HUD AFFHT004, 2010 Demographics by Race/Ethnicity

15
Figure 2 shows the 1990 trend in Race/Ethnicity. Each dot represents 75 people and the races/ethnicities
depicted are White, Black, Native American, Asian/Pacific Islander, and Hispanic. The orange dots
represent the White population which made up 88.56% of the population of Lake County at that time.
The northeast sections of Lake County appear to be less diverse in the 1990 trend map than areas in the
southwest. Some of the more diverse areas of Lake County in the 1990 trend, according to Map 2, include
Tavares, Leesburg, and Fruitland Park.
Figure 2. HUD AFFHT004, 1990 Demographics by race/ethnicity

16
Figure 3 shows a larger White population but also larger Black and Hispanic populations. The largest
change from the 1990 map to the data presented in Map 3 is the increase in the Hispanic population,
which almost doubled as a percentage of the total population. This change is reflected in the geographic
region slightly north-west from Clermont. Map 3 shows that the Black population grew around Leesburg
from the 1990 trend map to this one. Another change includes more geographic distribution by
race/ethnicity for Hispanics, notably near Tavares and Eustis.
Figure 3. HUD AFFHT004, 2000 Demographics by race/ethnicity
17
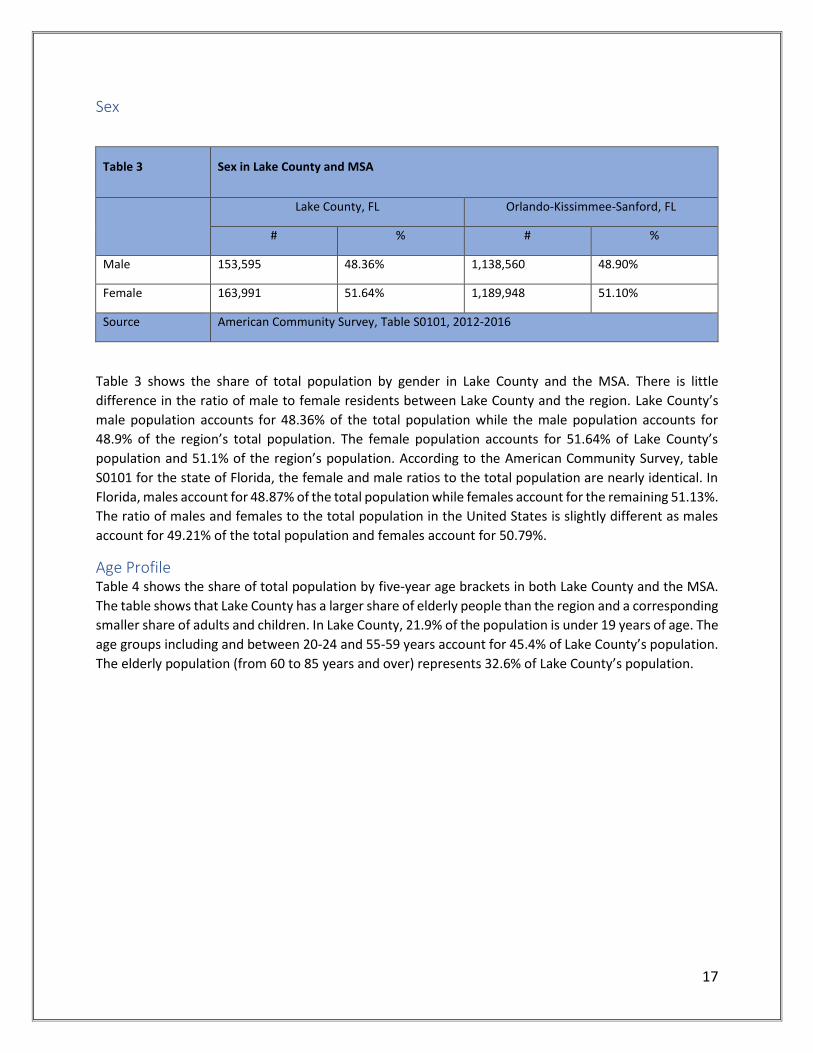
Sex
Table 3 Sex in Lake County and MSA
Lake County, FL Orlando-Kissimmee-Sanford, FL
# % # %
Male 153,595 48.36% 1,138,560 48.90%
Female 163,991 51.64% 1,189,948 51.10%
Source American Community Survey, Table S0101, 2012-2016
Table 3 shows the share of total population by gender in Lake County and the MSA. There is little
difference in the ratio of male to female residents between Lake County and the region. Lake County’s
male population accounts for 48.36% of the total population while the male population accounts for
48.9% of the region’s total population. The female population accounts for 51.64% of Lake County’s
population and 51.1% of the region’s population. According to the American Community Survey, table
S0101 for the state of Florida, the female and male ratios to the total population are nearly identical. In
Florida, males account for 48.87% of the total population while females account for the remaining 51.13%.
The ratio of males and females to the total population in the United States is slightly different as males
account for 49.21% of the total population and females account for 50.79%.
Age Profile Table 4 shows the share of total population by five-year age brackets in both Lake County and the MSA.
The table shows that Lake County has a larger share of elderly people than the region and a corresponding
smaller share of adults and children. In Lake County, 21.9% of the population is under 19 years of age. The
age groups including and between 20-24 and 55-59 years account for 45.4% of Lake County’s population.
The elderly population (from 60 to 85 years and over) represents 32.6% of Lake County’s population.

18
Table 4 Age Profile in Lake County and MSA
Lake County, FL Orlando-Kissimmee-Sanford, FL
% %
Under 5 years 5.10% 6.00%
5 to 9 years 5.40% 6.10%
10 to 14 years 5.90% 6.40%
15 to 19 years 5.50% 6.60%
20 to 24 years 4.90% 7.50%
25 to 29 years 5.00% 7.70%
30 to 34 years 5.10% 7.10%
35 to 39 years 5.30% 6.70%
40 to 44 years 5.70% 6.90%
45 to 49 years 6.20% 6.90%
50 to 54 years 6.70% 6.90%
55 to 59 years 6.50% 6.20%
60 to 64 years 6.70% 5.30%
65 to 69 years 7.90% 4.60%
70 to 74 years 6.30% 3.30%
75 to 79 years 5.30% 2.40%
80 to 84 years 3.50% 1.70%
85 years and over 2.90% 1.70%
Source American Community Survey, Table S0101, 2012-2016
19
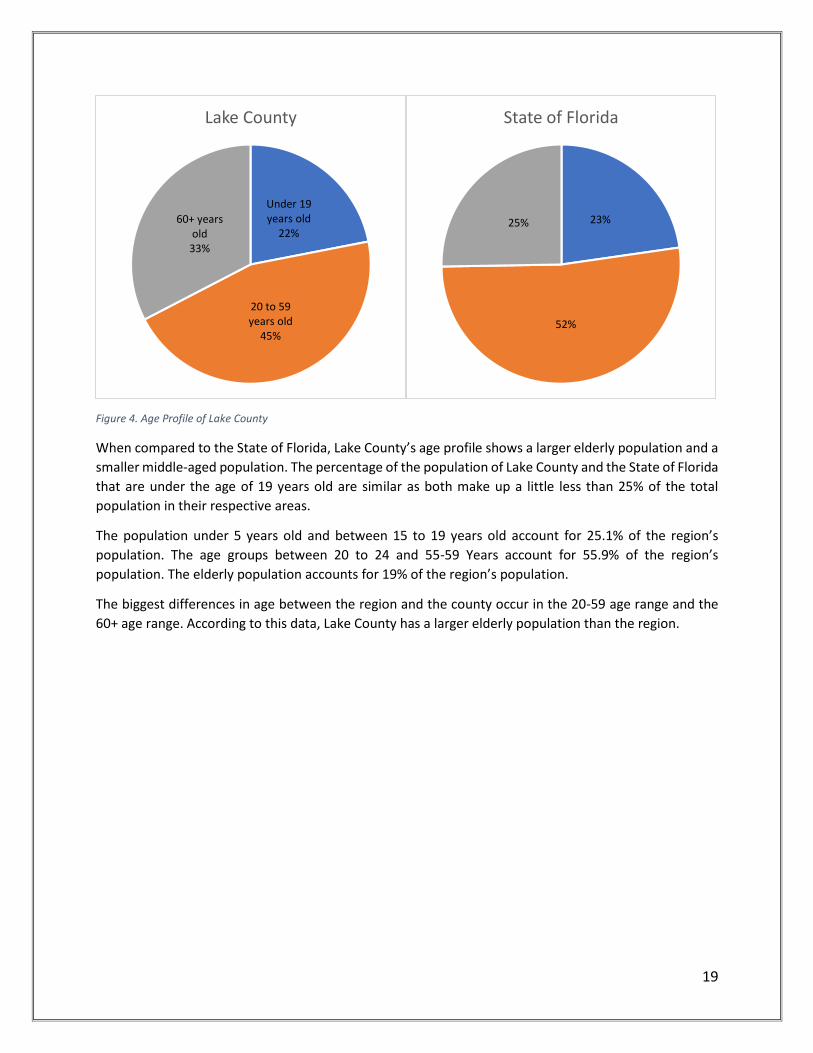
Figure 4. Age Profile of Lake County
When compared to the State of Florida, Lake County’s age profile shows a larger elderly population and a
smaller middle-aged population. The percentage of the population of Lake County and the State of Florida
that are under the age of 19 years old are similar as both make up a little less than 25% of the total
population in their respective areas.
The population under 5 years old and between 15 to 19 years old account for 25.1% of the region’s
population. The age groups between 20 to 24 and 55-59 Years account for 55.9% of the region’s
population. The elderly population accounts for 19% of the region’s population.
The biggest differences in age between the region and the county occur in the 20-59 age range and the
60+ age range. According to this data, Lake County has a larger elderly population than the region.
Under 19 years old
22%
20 to 59 years old
45%
60+ years old
33%
Lake County
23%
52%
25%
State of Florida

20
Race/Ethnicity Race and ethnicity plays a fundamental role in any fair housing analysis. This AI frequently reviews
race/ethnicity data, particularly the geographic distribution of population by race/ethnicity. To begin,
this section simply reviews the total count of persons in each group, followed by an analysis of the total
share of the population for each group in Lake County and the region.
Table 5 Race/Ethnicity in Lake County and MSA
Lake County, FL Orlando-Kissimmee-Sanford, FL
# % # %
White, Non-
Hispanic 265,082 83.47% 1,657,932 71.20%
Black, Non-Hispanic 31,492 9.92% 380,326 16.33%
Hispanic 43,852 13.81% 654,377 28.10%
Asian or Pacific
Islander, Non-
Hispanic
6,162 1.94% 98,770 4.24%
Native American,
Non-Hispanic 1,339 0.42% 5,491 0.24%
Two or More Races,
Non-Hispanic 7,133 2.25% 73,074 3.14%
Other, Non-
Hispanic 6,378 2.01% 112,915 4.85%
Source American Community Survey, Table B02001, 2012-2016
Table 5 shows the percentage and total of the population that fall into each Race/Ethnicity category in
Lake County and also the Orlando-Kissimmee-Sanford region. Lake County and the MSA have very
different populations, especially considering the share of Hispanics in each jurisdiction.
The residents of Lake County are predominantly White (83.47%), with Hispanics representing the next
largest group at 13.81% of the population. Blacks/African Americans represent 9.92% of the total
population in the County. Asian/Pacific Islanders account for 1.94% and Native Americans account for
21
0.42% of the population. Those who are Two or More Races account for 2.25% and those who are
categorized as Other account for 2.01% of Lake County’s population. These final two categories, consisting
of approximately 13,500 persons, represent a small but growing share of the population in Lake County.
The population of the Orlando-Kissimmee-Sanford region of Florida is more diverse than the population
living in Lake County. The largest differences between the county and the region are found in the
populations of the White, Black, and Hispanic residents. The White population in the region accounts for
71.2% of the population - 12.27% lower than in Lake County. The Black population accounts for 16.33% of
the region’s population, compared to 9.92% of the county’s population (a difference of just under 7%).
The Hispanic population accounts for 28.1% of the region’s population. This represents a 14.29%
difference between region in county in regard to Hispanic population. Hispanics make up the largest
minority in both the region and the county.
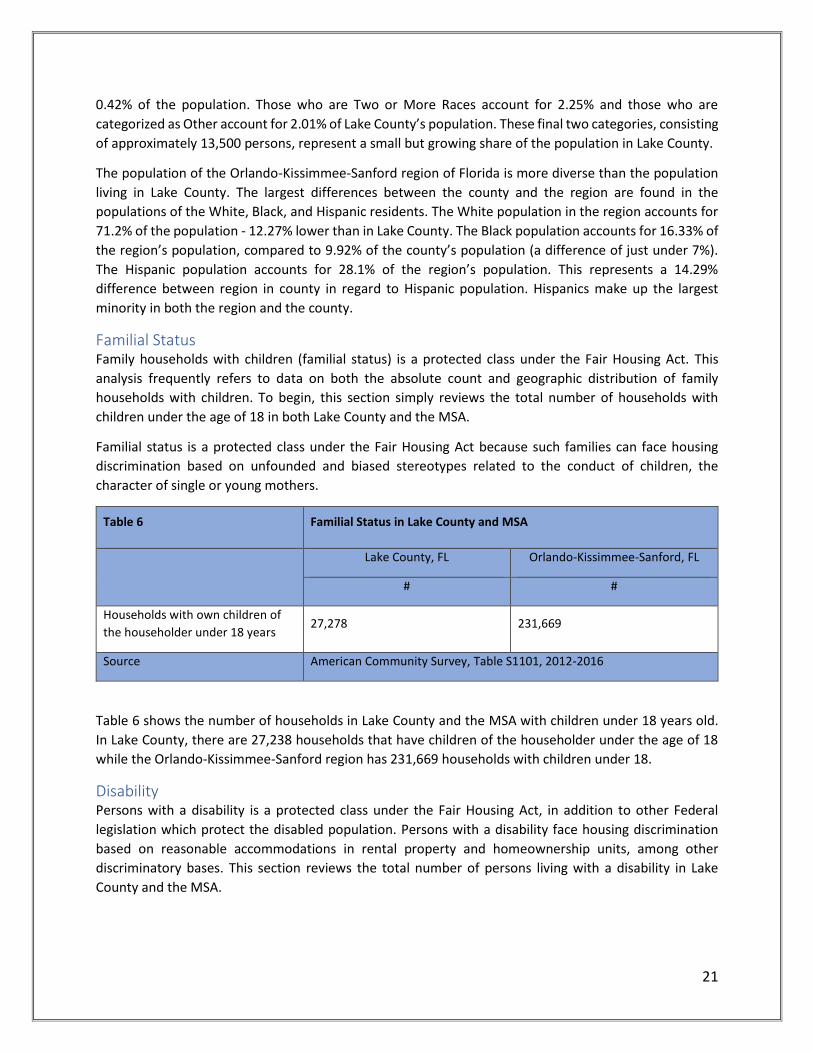
Familial Status Family households with children (familial status) is a protected class under the Fair Housing Act. This
analysis frequently refers to data on both the absolute count and geographic distribution of family
households with children. To begin, this section simply reviews the total number of households with
children under the age of 18 in both Lake County and the MSA.
Familial status is a protected class under the Fair Housing Act because such families can face housing
discrimination based on unfounded and biased stereotypes related to the conduct of children, the
character of single or young mothers.
Table 6 Familial Status in Lake County and MSA
Lake County, FL Orlando-Kissimmee-Sanford, FL
# #
Households with own children of
the householder under 18 years 27,278 231,669
Source American Community Survey, Table S1101, 2012-2016
Table 6 shows the number of households in Lake County and the MSA with children under 18 years old.
In Lake County, there are 27,238 households that have children of the householder under the age of 18
while the Orlando-Kissimmee-Sanford region has 231,669 households with children under 18.
Disability Persons with a disability is a protected class under the Fair Housing Act, in addition to other Federal
legislation which protect the disabled population. Persons with a disability face housing discrimination
based on reasonable accommodations in rental property and homeownership units, among other
discriminatory bases. This section reviews the total number of persons living with a disability in Lake
County and the MSA.

22
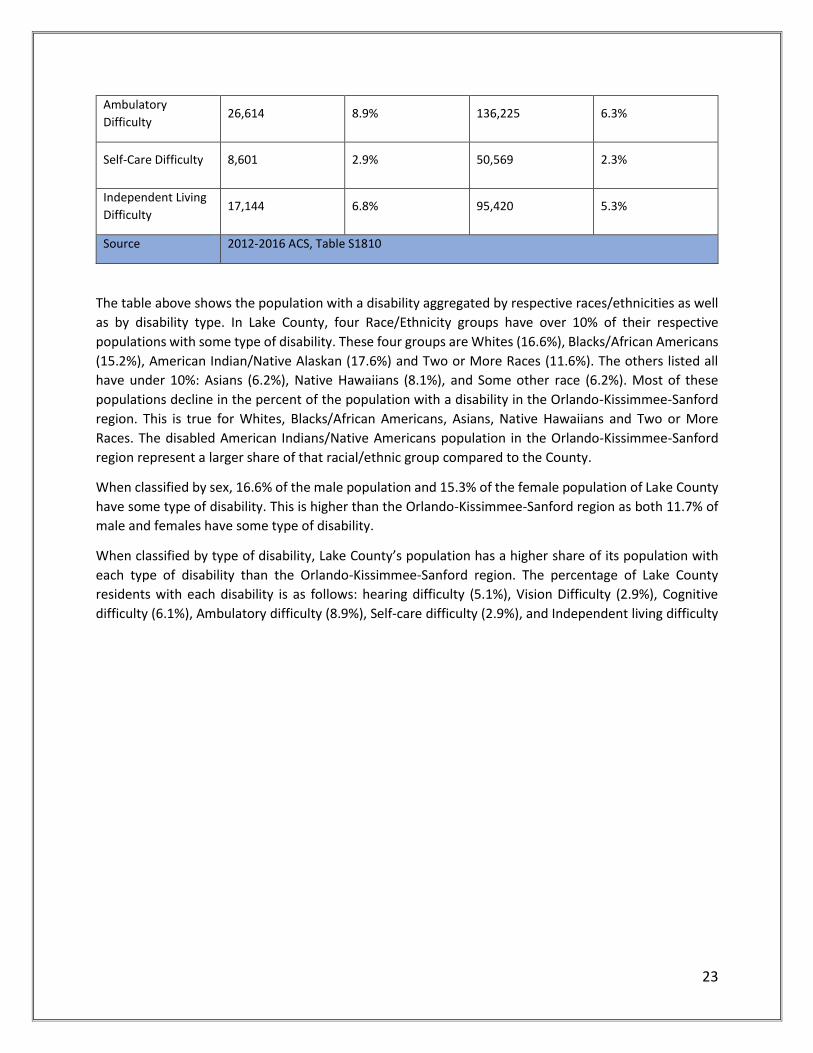
Table 7 Disability by race/ethnicity, sex, and type in Lake County and MSA
Lake County, FL Orlando-Kissimmee-Sanford, FL
# % # %
White Alone 43,720 16.6% 203,261 12.4%
Black/African
American Alone 4,610 15.2% 40,910 10.9%
American
Indian/Native
Alaskan Alone
232 17.6% 1,024 18.8%
Asian Alone 356 6.2% 5,891 6.1%
Native Hawaiian 30 8.1% 75 4.6%
Some other race
alone 391 6.2% 11,356 10.1%
Two or more races 825 11.6% 7,564 10.4%
Disability by Sex # % # %
Male 25,136 16.6% 132,128 11.7%
Female 25,028 15.3% 137,953 11.7%
Disability by Type # % # %
Hearing Difficulty 15,980 5.1% 66,869 2.9%
Vision Difficulty 9,251 2.9% 54,544 2.4%
Cognitive Difficulty 18,085 6.1% 107,637 5.0%
23
Ambulatory
Difficulty 26,614 8.9% 136,225 6.3%
Self-Care Difficulty 8,601 2.9% 50,569 2.3%
Independent Living
Difficulty 17,144 6.8% 95,420 5.3%
Source 2012-2016 ACS, Table S1810
The table above shows the population with a disability aggregated by respective races/ethnicities as well
as by disability type. In Lake County, four Race/Ethnicity groups have over 10% of their respective
populations with some type of disability. These four groups are Whites (16.6%), Blacks/African Americans
(15.2%), American Indian/Native Alaskan (17.6%) and Two or More Races (11.6%). The others listed all
have under 10%: Asians (6.2%), Native Hawaiians (8.1%), and Some other race (6.2%). Most of these
populations decline in the percent of the population with a disability in the Orlando-Kissimmee-Sanford
region. This is true for Whites, Blacks/African Americans, Asians, Native Hawaiians and Two or More
Races. The disabled American Indians/Native Americans population in the Orlando-Kissimmee-Sanford
region represent a larger share of that racial/ethnic group compared to the County.
When classified by sex, 16.6% of the male population and 15.3% of the female population of Lake County
have some type of disability. This is higher than the Orlando-Kissimmee-Sanford region as both 11.7% of
male and females have some type of disability.
When classified by type of disability, Lake County’s population has a higher share of its population with
each type of disability than the Orlando-Kissimmee-Sanford region. The percentage of Lake County
residents with each disability is as follows: hearing difficulty (5.1%), Vision Difficulty (2.9%), Cognitive
difficulty (6.1%), Ambulatory difficulty (8.9%), Self-care difficulty (2.9%), and Independent living difficulty

24
(6.8%). The biggest differences between Lake County and region occur in the disability types of Hearing
difficulty and Ambulatory difficulty where the difference between county and region is over 2% in each.
Figure 5 shows the geographic distribution of the Ambulatory, Self-Care, and Independent Living disability
population, with each dot representing 75 persons. The most prominent disability in Lake County is
Ambulatory disability, which is depicted by orange dots. While all three groups show mostly even
dispersion in Lake County, the map shows that ambulatory disabilities are more common in and around
Leesburg.
Figure 5. HUD AFFHT004, Ambulatory, Self-Care, and Independent Living Disability

25
Figure 6 shows the geographic distribution of persons with a hearing, vision, or cognitive disability in Lake
County. The map shows that high concentrations of cognitive disability (purple) and hearing disability
(orange) populations in Lake County. Hearing and cognitive disabilities both affect more than 5% of the
total population of Lake County. All three have similar dispersion across Lake County and none are shown
to affect an area of Lake County more than another.
Figure 6. HUD AFFHT004, Hearing, Vision, and Cognitive Disability

26
Foreign Born National origin is a protected class under the Fair Housing Act. This section reviews data on the absolute
number of native and foreign-born persons in Lake County and the MSA, as well as the share of the total
population that each represents. Foreign born persons experience housing discrimination through a
variety of means, including direct discrimination and inadvertent discrimination.
Table 8 Foreign Born population in Lake County and MSA
Lake County, FL Orlando-Kissimmee-Sanford, FL
Nativity # % # %
Native 292,059 91.96% 1,935,520 83.12%
Foreign Born 25,527 8.04% 393,188 16.89%
Source American Community Survey, Table B05012, 2012-2016
A large majority of Lake County residents were born in the United States (91.96%) while approximately
8% are foreign born. This represents a smaller share of the total population compared to the region, where
nearly 17% of the population is foreign-born.
Place of Birth Place of birth is not a specific protected class under the Fair Housing Act, but data on place of birth informs
possible concerns related to fair housing by revealing language and skin-color barriers that may result in
direct or indirect housing discrimination. This section reviews the total number of persons by place of
birth in both the County and the region, followed by a review of the geographic distribution of persons by
place of birth.
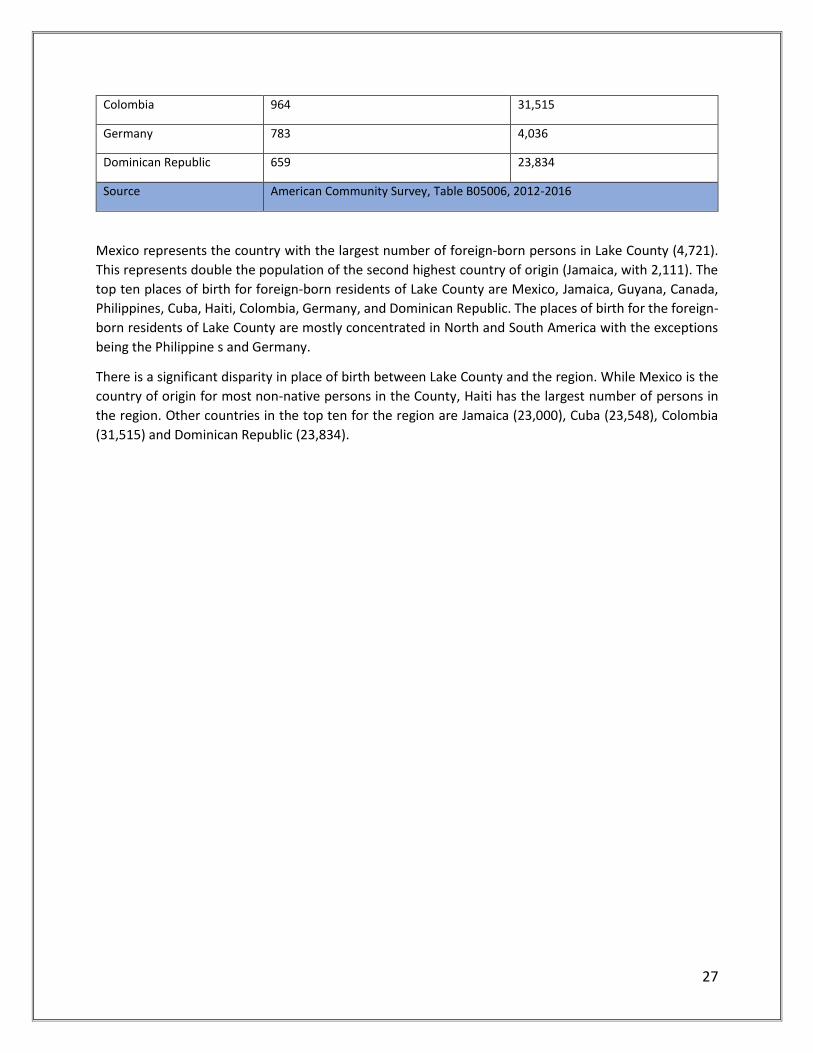
Table 9 Place of birth in Lake County and MSA
Lake County, FL Orlando-Kissimmee-Sanford, FL
# #
Mexico 4,721 28,024
Jamaica 2,111 23,000
Guyana 1,746 11,547
Canada 1,343 7,216
Philippines 1,310 12,646
Cuba 1,130 23,548
Haiti 1,041 33,832
27
Colombia 964 31,515
Germany 783 4,036
Dominican Republic 659 23,834
Source American Community Survey, Table B05006, 2012-2016
Mexico represents the country with the largest number of foreign-born persons in Lake County (4,721).
This represents double the population of the second highest country of origin (Jamaica, with 2,111). The
top ten places of birth for foreign-born residents of Lake County are Mexico, Jamaica, Guyana, Canada,
Philippines, Cuba, Haiti, Colombia, Germany, and Dominican Republic. The places of birth for the foreign-
born residents of Lake County are mostly concentrated in North and South America with the exceptions
being the Philippine s and Germany.
There is a significant disparity in place of birth between Lake County and the region. While Mexico is the
country of origin for most non-native persons in the County, Haiti has the largest number of persons in
the region. Other countries in the top ten for the region are Jamaica (23,000), Cuba (23,548), Colombia
(31,515) and Dominican Republic (23,834).

28
The National Origin maps show the top 5 most populous national origins for the region. Each dot
represents 10 people and the countries represented are Mexico, Guyana, Jamaica, Philippines, and
Germany. The most populous country on this map is Mexico which has seemingly even dispersion across
Lake County with notable populations around Mascotte, Groveland, and northeast of Tavares. The
Guyanese and Jamaican populations can both be found in the northwest of Lake County near Lady Lake
and also in the southeast of Lake County, west of Lake Apopka, in areas near Mineola and Clermont.
Furthermore, the Jamaican population can be found south of Lake Harris, near Okahumpka. This area is
also the home of a large part of the German population as well as the northeast part of Lake Griffin. The
Filipino population can be found near Lady Lake and Clermont with smaller groups scattered throughout
Lake County.
Figure 7. HUD AFFHT004, National Origin
29
Limited English Proficiency While Limited English Proficiency (LEP) is not a protected class under the Fair Housing Act, HUD has
recognized LEP as a critical barrier to fair housing choice on the basis of national origin. To further
protections under the Fair Housing Act, HUD issued guidance on September 15, 2016 on housing
discrimination under the guise of LEP. The HUD rule states: “Housing providers are … prohibited from
using limited English proficiency selectively or as an excuse for intentional housing discrimination. The law
also prohibits landlords from using limited English proficiency in a way that causes an unjustified
discriminatory effect.”
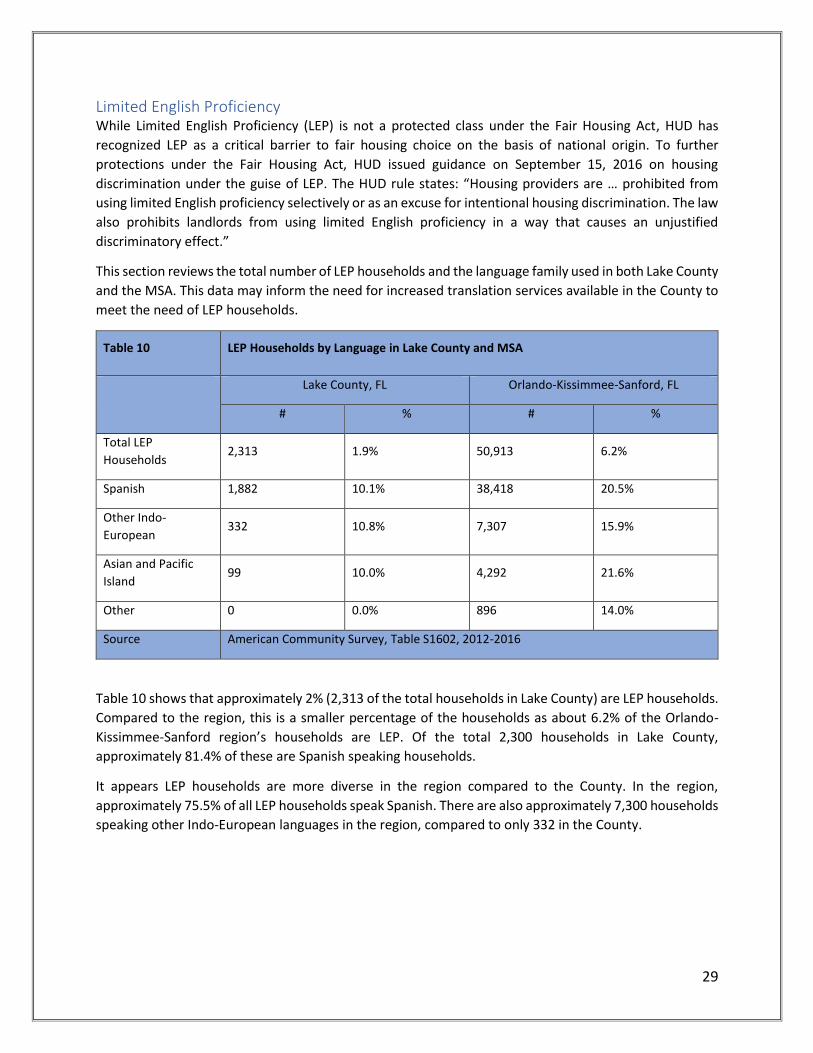
This section reviews the total number of LEP households and the language family used in both Lake County
and the MSA. This data may inform the need for increased translation services available in the County to
meet the need of LEP households.
Table 10 LEP Households by Language in Lake County and MSA
Lake County, FL Orlando-Kissimmee-Sanford, FL
# % # %
Total LEP
Households 2,313 1.9% 50,913 6.2%
Spanish 1,882 10.1% 38,418 20.5%
Other Indo-
European 332 10.8% 7,307 15.9%
Asian and Pacific
Island 99 10.0% 4,292 21.6%
Other 0 0.0% 896 14.0%
Source American Community Survey, Table S1602, 2012-2016
Table 10 shows that approximately 2% (2,313 of the total households in Lake County) are LEP households.
Compared to the region, this is a smaller percentage of the households as about 6.2% of the Orlando-
Kissimmee-Sanford region’s households are LEP. Of the total 2,300 households in Lake County,
approximately 81.4% of these are Spanish speaking households.
It appears LEP households are more diverse in the region compared to the County. In the region,
approximately 75.5% of all LEP households speak Spanish. There are also approximately 7,300 households
speaking other Indo-European languages in the region, compared to only 332 in the County.

30
Figure 8 shows the geographic distribution of LEP households in the County. Each dot represents 10
people, and the languages represented are Spanish, German, Portuguese, French, and Hmong. The map
shows large concentrations of Spanish-speaking households with dispersion across Lake County, with
pronounced concentrations in the southeast in and around Clermont, in the southwest in and around
Mascotte, the northwest near Leesburg and Lady Lake, and near the middle of Lake County near Tavares.
The map shows that German is most common near Okahumpka, while French is most common around
the Sorrento area.
Figure 8. HUD AFFHT004, Limited English Proficiency
31
Median Household Income
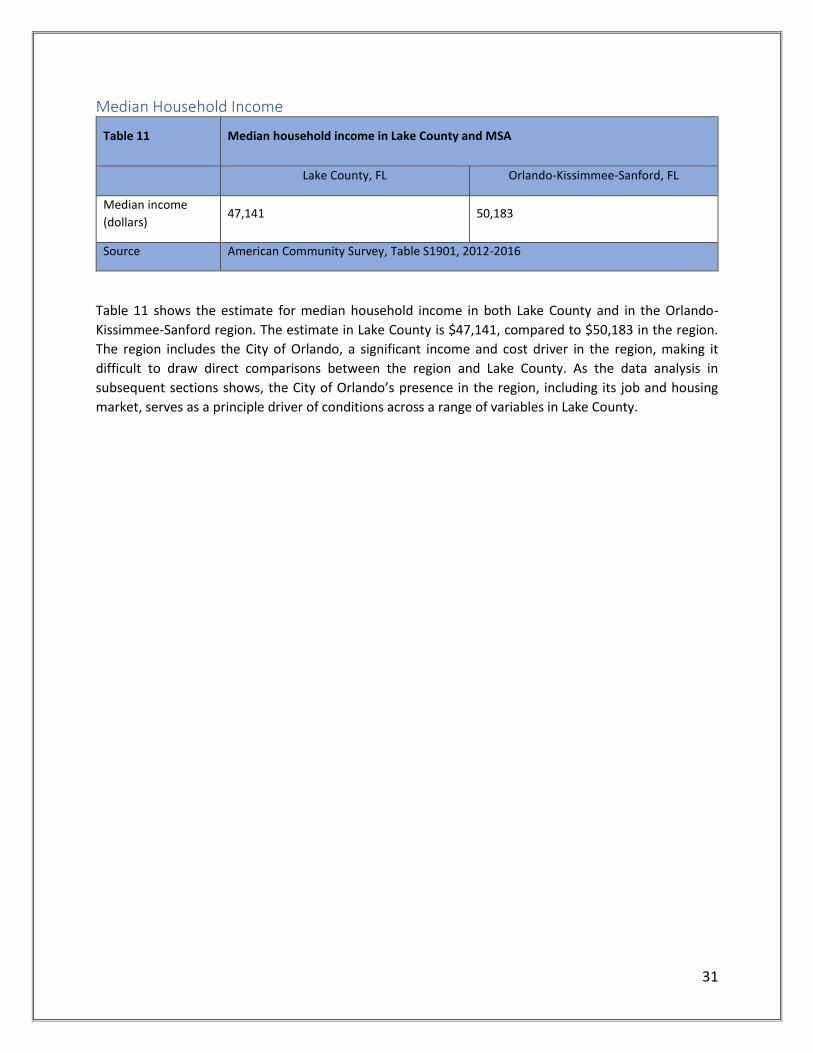
Table 11 Median household income in Lake County and MSA
Lake County, FL Orlando-Kissimmee-Sanford, FL
Median income
(dollars) 47,141 50,183
Source American Community Survey, Table S1901, 2012-2016
Table 11 shows the estimate for median household income in both Lake County and in the Orlando-
Kissimmee-Sanford region. The estimate in Lake County is $47,141, compared to $50,183 in the region.
The region includes the City of Orlando, a significant income and cost driver in the region, making it
difficult to draw direct comparisons between the region and Lake County. As the data analysis in
subsequent sections shows, the City of Orlando’s presence in the region, including its job and housing
market, serves as a principle driver of conditions across a range of variables in Lake County.

32
Figure 9 presents median household income data for Blacks/African Americans, Hispanics, and Asians in
Lake County. In the southeast corner of Lake County (near Clermont and Minneola), the median household
income is relatively higher than other locations in the County. Additionally, this area features
concentrations of the three minorities in Lake County. The largest minority populations in South Lake
Figure 9: Median Household Income
33
County are Hispanics (approximately 25,111 persons according to the 2012-2016 ACS) followed by
Black/African Americans (approximately 12,149 persons). The area near the center of the map, near
Tavares and Eustis, is on the lower end of the median household income distribution and is dominated by
Black/African Americans and Hispanics. The area to the east of Tavares (Mt. Dora) has the highest
incomes, with moderate populations of Black/African Americans, Hispanics, and Asians.
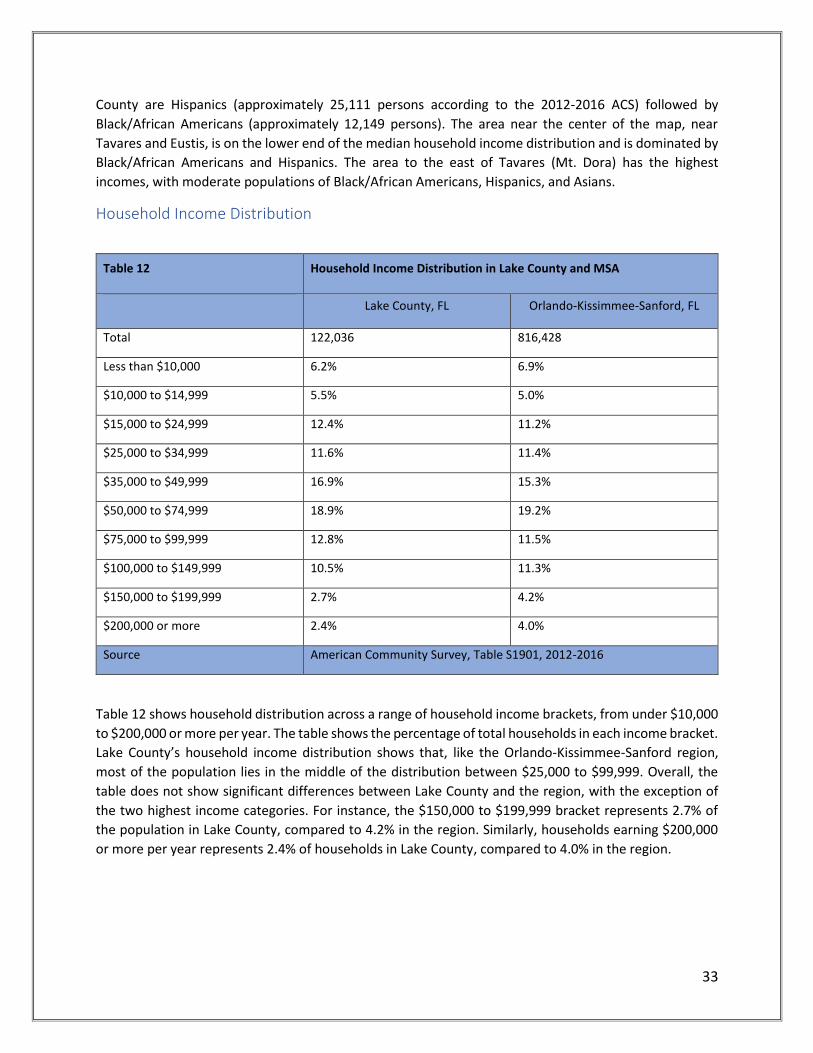
Household Income Distribution
Table 12 Household Income Distribution in Lake County and MSA
Lake County, FL Orlando-Kissimmee-Sanford, FL
Total 122,036 816,428
Less than $10,000 6.2% 6.9%
$10,000 to $14,999 5.5% 5.0%
$15,000 to $24,999 12.4% 11.2%
$25,000 to $34,999 11.6% 11.4%
$35,000 to $49,999 16.9% 15.3%
$50,000 to $74,999 18.9% 19.2%
$75,000 to $99,999 12.8% 11.5%
$100,000 to $149,999 10.5% 11.3%
$150,000 to $199,999 2.7% 4.2%
$200,000 or more 2.4% 4.0%
Source American Community Survey, Table S1901, 2012-2016
Table 12 shows household distribution across a range of household income brackets, from under $10,000
to $200,000 or more per year. The table shows the percentage of total households in each income bracket.
Lake County’s household income distribution shows that, like the Orlando-Kissimmee-Sanford region,
most of the population lies in the middle of the distribution between $25,000 to $99,999. Overall, the
table does not show significant differences between Lake County and the region, with the exception of
the two highest income categories. For instance, the $150,000 to $199,999 bracket represents 2.7% of
the population in Lake County, compared to 4.2% in the region. Similarly, households earning $200,000
or more per year represents 2.4% of households in Lake County, compared to 4.0% in the region.

34
Table 13 Median Household Income by race/ethnicity in Lake County and MSA
Lake County, FL Orlando-Kissimmee-Sanford Region
Total MHI ($) Total MHI ($)
Total Households 122,036 47,141 816,428 50,183
White 87.5% 48,200 75.3% 53,287
Black or African
American 7.9% 37,366 14.8% 37,383
American Indian
and Alaska Native 0.4% 39,583 0.2% 45,938
Asian 1.1% 87,122 3.5% 62,168
Native Hawaiian/
Pacific Islander 0.1% 28,714 0.0% 44,741
Some Other Race 1.6% 36,795 3.9% 40,382
Two or More Races 1.5% 48,125 2.3% 42,736
Source American Community Survey, Table S1903, 2012-2016
Table 13 for Median Household Income by Race/Ethnicity shows the total number of households and the
percentage of the total population that each Race/Ethnicity accounts for, as well as the median income
estimate for each. Notably, the Asian populations of both Lake County and the Orlando-Kissimmee-
Sanford region have the highest median income by a significant margin. The Asian population’s median
income in Lake County is $87,122 and $62,168 in the Orlando-Kissimmee-Sanford region.
The median income estimate for the 122,036 households in Lake County is $47,141, while it is $50,183 for
816,428 households in the Orlando-Kissimmee-Sanford region.
35
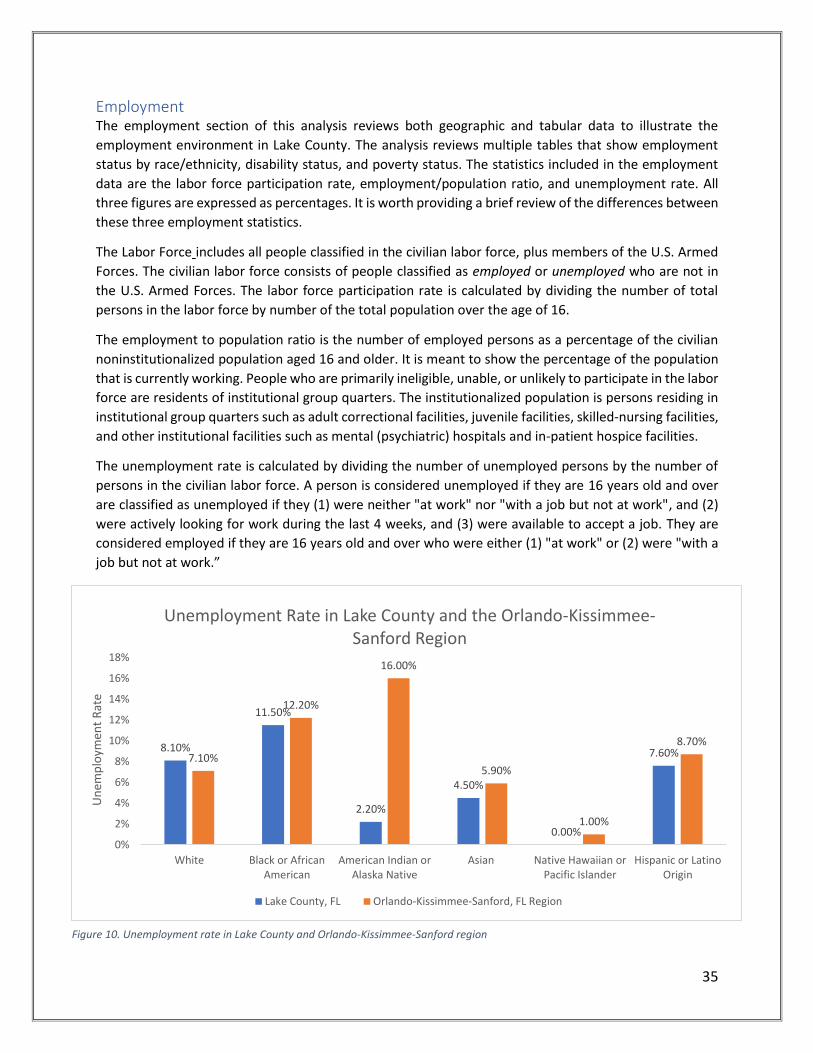
Employment The employment section of this analysis reviews both geographic and tabular data to illustrate the
employment environment in Lake County. The analysis reviews multiple tables that show employment
status by race/ethnicity, disability status, and poverty status. The statistics included in the employment
data are the labor force participation rate, employment/population ratio, and unemployment rate. All
three figures are expressed as percentages. It is worth providing a brief review of the differences between
these three employment statistics.
The Labor Force includes all people classified in the civilian labor force, plus members of the U.S. Armed
Forces. The civilian labor force consists of people classified as employed or unemployed who are not in
the U.S. Armed Forces. The labor force participation rate is calculated by dividing the number of total
persons in the labor force by number of the total population over the age of 16.
The employment to population ratio is the number of employed persons as a percentage of the civilian
noninstitutionalized population aged 16 and older. It is meant to show the percentage of the population
that is currently working. People who are primarily ineligible, unable, or unlikely to participate in the labor
force are residents of institutional group quarters. The institutionalized population is persons residing in
institutional group quarters such as adult correctional facilities, juvenile facilities, skilled-nursing facilities,
and other institutional facilities such as mental (psychiatric) hospitals and in-patient hospice facilities.
The unemployment rate is calculated by dividing the number of unemployed persons by the number of
persons in the civilian labor force. A person is considered unemployed if they are 16 years old and over
are classified as unemployed if they (1) were neither "at work" nor "with a job but not at work", and (2)
were actively looking for work during the last 4 weeks, and (3) were available to accept a job. They are
considered employed if they are 16 years old and over who were either (1) "at work" or (2) were "with a
job but not at work.”
8.10%
11.50%
2.20%
4.50%
0.00%
7.60%7.10%
12.20%
16.00%
5.90%
1.00%
8.70%
0%
2%
4%
6%
8%
10%
12%
14%
16%
18%
White Black or AfricanAmerican
American Indian orAlaska Native
Asian Native Hawaiian orPacific Islander
Hispanic or LatinoOrigin
Un
emp
loym
ent
Rat
e
Unemployment Rate in Lake County and the Orlando-Kissimmee-Sanford Region
Lake County, FL Orlando-Kissimmee-Sanford, FL Region
Figure 10. Unemployment rate in Lake County and Orlando-Kissimmee-Sanford region

36
Table 14 Employment Status by Race/Ethnicity and Hispanic/Latino Origin in Lake County and MSA
Lake County, FL
Total Labor Force
Participation Rate
Employment/Population
Ratio
Unemployment
Rate
White Alone 222,532 50.7% 46.5% 8.1%
Black or African
American Alone 23,811 61.8% 54.6% 11.5%
American Indian
and Alaska
Native
1,021 67.0% 65.5% 2.2%
Asian Alone 4,934 51.8% 49.5% 4.5%
Native
Hawaiian/Pacific 322 46.6% 46.6% 0.0%
Some other Race
Alone 4,693 68.1% 63.8% 6.3%
Two or more
Races 3,957 63.6% 60.4% 4.9%
Hispanic or
Latino Origin (of
any race)
31,233 64.8% 59.8% 7.6%
Source American Community Survey, Table S2301, 2012-2016
Table 15 Employment Status by Race/Ethnicity and Hispanic/Latino Origin in Lake County and MSA
Orlando-Kissimmee-Sanford, FL Metro Area
Total Labor Force
Participation Rate
Employment/Population
Ratio
Unemployment
Rate
White Alone 1,360,353 63.1% 58.6% 7.1%
Black or African
American Alone 287,493 66.5% 58.4% 12.2%
American Indian
and Alaska
Native
4,411 65.2% 54.8% 16.0%
Asian Alone 79,640 63.8% 60.1% 5.9%
Native
Hawaiian/Pacific 1,170 58.8% 58.2% 1.0%
37
Some other Race
Alone 86,283 71.8% 64.0% 10.9%
Two or more
Races 45,732 68.0% 61.7% 9.2%
Hispanic or
Latino Origin (of
any race)
493,347 65.9% 60.1% 8.7%
Source American Community Survey, Table S2301, 2012-2016
Tables 14 and 15 above show the Employment Status by Race/Ethnicity and Hispanic/Latino Origin for
Lake County and the Orlando-Kissimmee-Sanford Region, respectively. Notably, the unemployment rates
in Lake County are lower as a whole than the Orlando-Kissimmee-Sanford region figures. Also, the Labor
Force Participation Rates as a whole for races/ethnicities are lower in Lake County when compared to the
Orlando-Kissimmee-Sanford region. Low labor force participation rates may indicate chronically high
unemployment among residents who are no longer looking for work or above-average proportions of
children, armed service members, or retirees in the resident population. A potential reason for Lake
County’s lower labor force participation rate could be that Lake County has a larger elderly population as
a percentage of the total population than the Orlando-Kissimmee-Sanford region.
The Black/African American population of Lake County has a 11.5% unemployment rate, highest in the
county among all races/ethnicities. It should be noted that Blacks/African Americans also have the highest
unemployment rate in the Orlando-Kissimmee-Sanford region (12.2%) out of race/ethnicities with a
population over 10,000 people.
The race/ethnicity with the second highest unemployment rate in Lake County is the White population
with 8.1% unemployment. This is 3.4% lower than the Black/African American unemployment rate. In the
region, the White unemployment rate is 7.1%. The White population is the only race/ethnicity which has
a higher unemployment rate in Lake County than the region.
The second highest unemployment rate in the region of populations over 10,000 people are those
residents classified as Some Other Race Alone with a 10.9% unemployment rate. Out of the three highest
populations classified by race/ethnicity, the Hispanic population has the highest unemployment rate at
8.7%, only behind the Black/African American population.
Table 16 Poverty status in the past 12 months in Lake County
Lake County, FL
Total Labor Force
Participation Rate
Employment/Population
Ratio
Unemployment
Rate
Below Poverty
Status 21,803 51.94% 37.2% 28.3%
38
At or Above the
Poverty Level 141,685 78.4% 74.1% 5.3%
Source American Community Survey, Table S2301, 2012-2016
Table 17 Poverty status in the past 12 months in MSA
Orlando-Kissimmee-Sanford, FL Metro Area
Total Labor Force
Participation Rate
Employment/Population
Ratio
Unemployment
Rate
Below Poverty
Status 203,534 55.6% 41.0% 26.2%
At or Above the
Poverty Level 1,203,507 82.9% 78.3% 5.5%
Source American Community Survey, Table S2301, 2012-2016
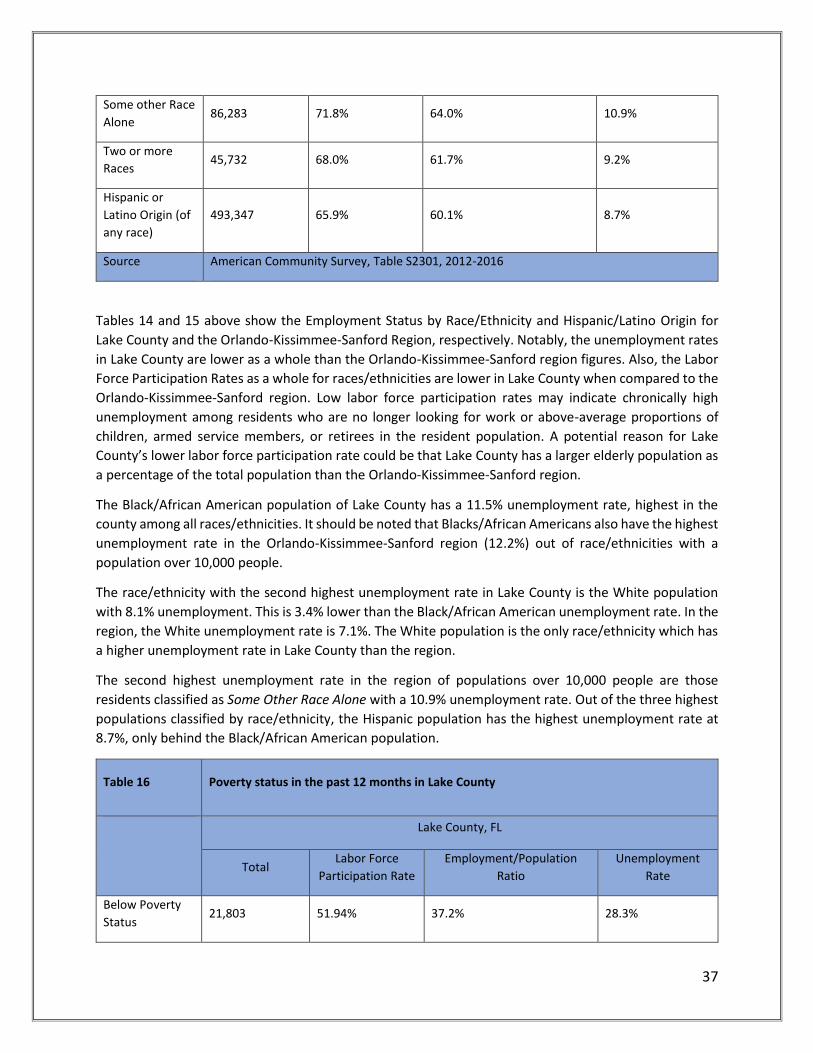
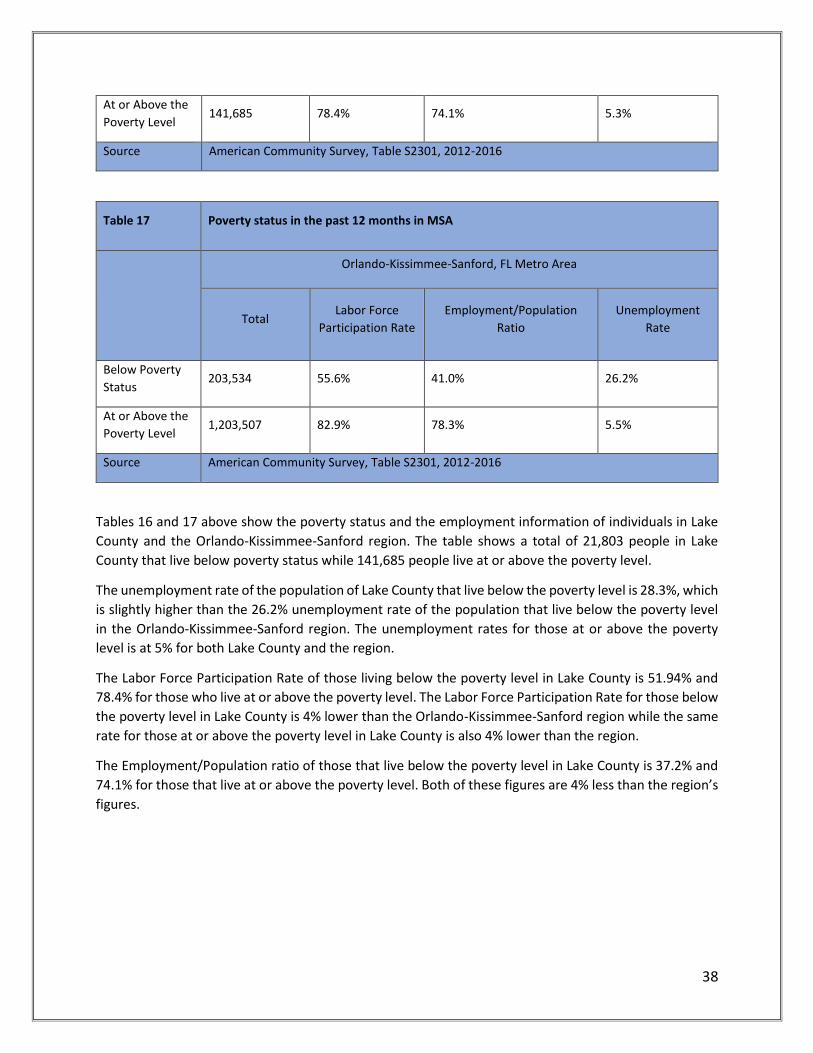
Tables 16 and 17 above show the poverty status and the employment information of individuals in Lake
County and the Orlando-Kissimmee-Sanford region. The table shows a total of 21,803 people in Lake
County that live below poverty status while 141,685 people live at or above the poverty level.
The unemployment rate of the population of Lake County that live below the poverty level is 28.3%, which
is slightly higher than the 26.2% unemployment rate of the population that live below the poverty level
in the Orlando-Kissimmee-Sanford region. The unemployment rates for those at or above the poverty
level is at 5% for both Lake County and the region.
The Labor Force Participation Rate of those living below the poverty level in Lake County is 51.94% and
78.4% for those who live at or above the poverty level. The Labor Force Participation Rate for those below
the poverty level in Lake County is 4% lower than the Orlando-Kissimmee-Sanford region while the same
rate for those at or above the poverty level in Lake County is also 4% lower than the region.
The Employment/Population ratio of those that live below the poverty level in Lake County is 37.2% and
74.1% for those that live at or above the poverty level. Both of these figures are 4% less than the region’s
figures.
39
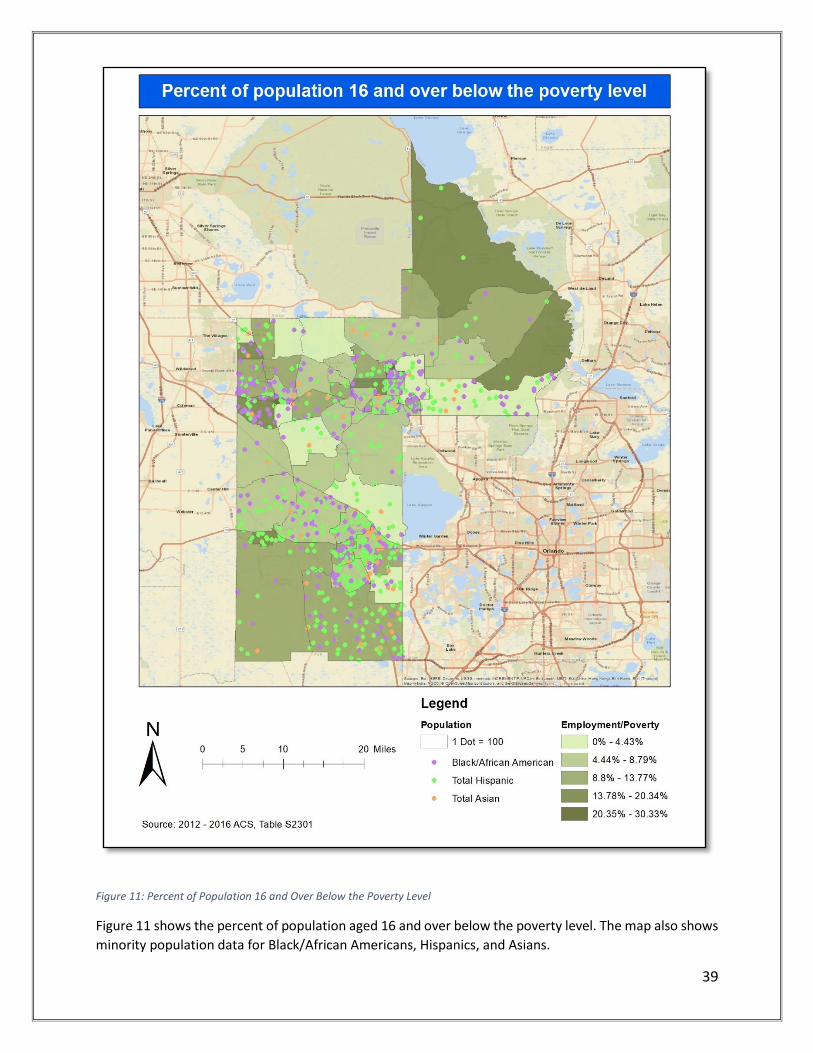
Figure 11: Percent of Population 16 and Over Below the Poverty Level
Figure 11 shows the percent of population aged 16 and over below the poverty level. The map also shows
minority population data for Black/African Americans, Hispanics, and Asians.

40
When reviewing the spatial distribution of racial/ethnic group minorities and concentration of poverty,
two principle trends emerge. First, census tracts with the highest rates of poverty are typically rural with
a low-density built environment. Second, minorities mirror the overall population in the County by
locating in cities and towns, and in suburban communities in south Lake County with relatively easy access
to the Orlando metropolitan region.
Table 18 summarizes the dominant minority groups in Lake County by geographic quadrant. The area with
the most poverty and the highest concentration of minorities is to the southeast of the county (Clermont
and Minneola). Another area of the county that has a dense population of these three minority groups is
the northwest area which includes Leesburg and Fruitland Park. The areas with the highest rates of
poverty for those 16 and over include the Leesburg area, Tavares area, and areas around and north of
Altoona and Paisley. Although the areas around and north of Altoona and Paisley show high poverty, it is
probably not densely populated due to being located in the Ocala National Forest. Another area on the
map with high poverty in northeast Lake County falls in the Seminole State Forest and does not seem to
be densely populated. The area in the west of Lake County around Groveland and Mascotte shows high
poverty and is densely populated with Hispanics.
Table 19 Employment Status by Disability Status in Lake County and MSA
Lake County, FL
Orlando-Kissimmee-Sanford, FL
Metro Area
Total: 169,781 1,473,288
In the labor force: 125,571 1,136,693
Employed: 115,670 1,046,684
With a disability 6,529 46,806
No disability 109,141 999,878
Table 18 Dominant Minority Groups in Lake County by Geographic Quadrant
Area Minority group(s) Note
Southeast Black/African American, Hispanic Clermont and Minneola area
Northwest Black/African American, Hispanic,
Asian
Leesburg, Fruitland Park area
Northeast None High poverty but not densely
populated
West Hispanic Mascotte and Groveland area

41
Unemployed: 9,901 89,709
With a disability 1,580 10,288
No disability 8,321 79,421
Not in labor force: 44,210 336,895
With a disability 12,966 81,522
No disability 31,244 255,373
Source American Community Survey, Table C18120, 2012-2016
Table 19 shows Employment Status by Disability Status in Lake County, FL and Orlando-Kissimmee-
Sanford, FL metro area. The unemployment rate for disabled residents of Lake County is 16%, while the
unemployment rate for disabled residents of the Orlando-Kissimmee-Sanford region is 11.5%.
Lake County and the region show similar shares of disabled residents in the labor force as disabled
residents make up 6.5% of Lake County’s labor force, while disabled residents make up 5% of the region’s
labor force. About 12,966 residents in Lake County are disabled and not in the labor force while 31,244
residents with no disability are not in the labor force.

42
Housing Profile
Table 20: Age of Housing Stock Age of housing stock in Lake County and MSA
Lake County, FL
Orlando-Kissimmee-Sanford, FL
Region
Total: 147,372 976,455
Built 2014 or Later 935 7,270
Built 2010 to 2013 3,396 23,984
Built 2000 to 2009 44,932 252,572
Built 1990 to 1999 31,930 210,718
Built 1980 to 1989 25,886 206,266
Built 1970 to 1979 19,352 132,552
Built 1960 to 1969 7,795 60,949
Built 1950 to 1959 7,168 53,844
Built 1940 to 1949 2,343 13,231
Built 1939 or Earlier 3,635 15,069
Source American Community Survey, Table B25034, 2012-2016
Table 20 shows the Age of Housing Stock in Lake County, Florida and Orlando-Kissimmee-Sanford, Florida
metro area. The time period with the greatest housing development was from 2000 to 2009, in both Lake
County and the region. Notably, the percentage of housing built before 1980 is around 27-29% for both
Lake County and the region. Also, 33% of the housing in Lake County was built in the year 2000 or later
compared to 29% of the region’s housing. In total, 73% of the housing in Lake County was built in 1980 or
after - slightly higher than the region’s total.
43
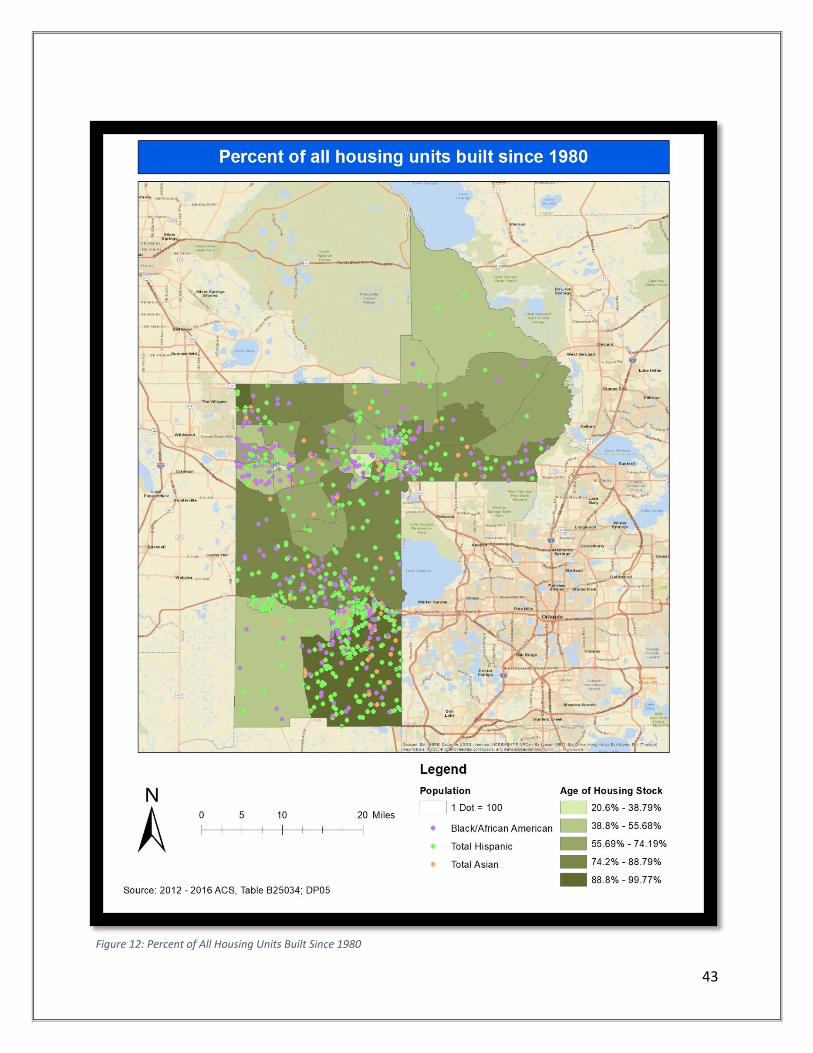
Figure 12: Percent of All Housing Units Built Since 1980
44
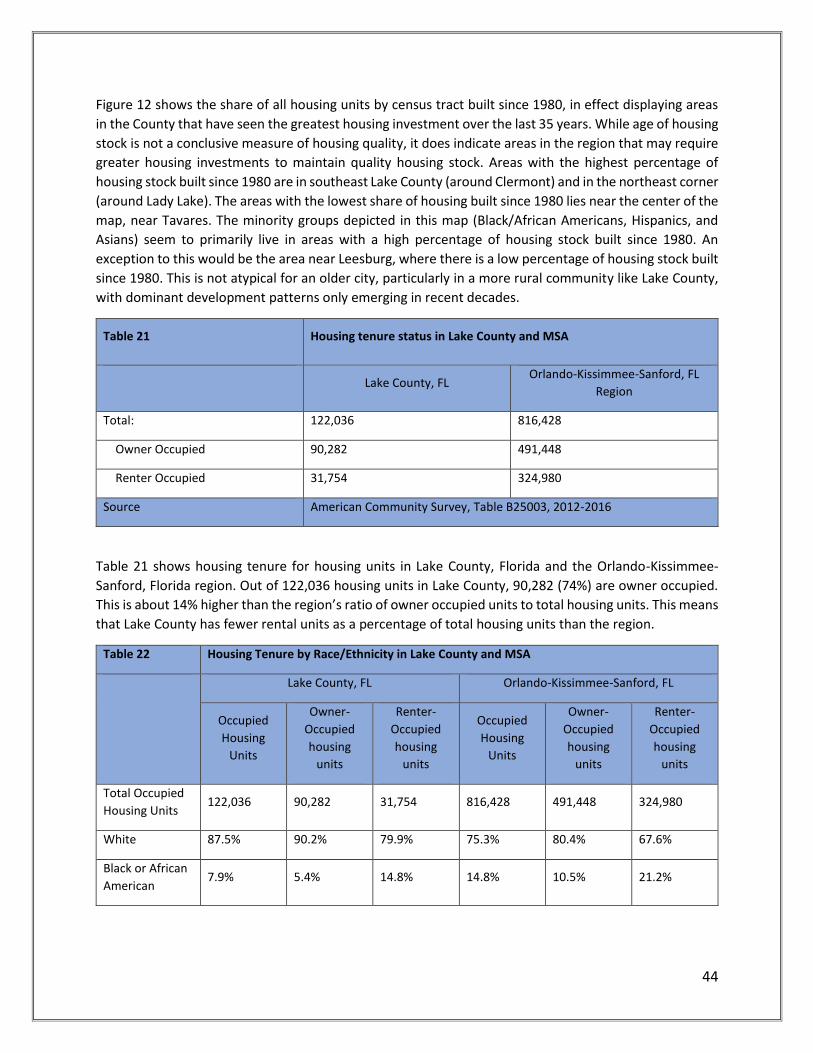
Figure 12 shows the share of all housing units by census tract built since 1980, in effect displaying areas
in the County that have seen the greatest housing investment over the last 35 years. While age of housing
stock is not a conclusive measure of housing quality, it does indicate areas in the region that may require
greater housing investments to maintain quality housing stock. Areas with the highest percentage of
housing stock built since 1980 are in southeast Lake County (around Clermont) and in the northeast corner
(around Lady Lake). The areas with the lowest share of housing built since 1980 lies near the center of the
map, near Tavares. The minority groups depicted in this map (Black/African Americans, Hispanics, and
Asians) seem to primarily live in areas with a high percentage of housing stock built since 1980. An
exception to this would be the area near Leesburg, where there is a low percentage of housing stock built
since 1980. This is not atypical for an older city, particularly in a more rural community like Lake County,
with dominant development patterns only emerging in recent decades.
Table 21 Housing tenure status in Lake County and MSA
Lake County, FL
Orlando-Kissimmee-Sanford, FL
Region
Total: 122,036 816,428
Owner Occupied 90,282 491,448
Renter Occupied 31,754 324,980
Source American Community Survey, Table B25003, 2012-2016
Table 21 shows housing tenure for housing units in Lake County, Florida and the Orlando-Kissimmee-
Sanford, Florida region. Out of 122,036 housing units in Lake County, 90,282 (74%) are owner occupied.
This is about 14% higher than the region’s ratio of owner occupied units to total housing units. This means
that Lake County has fewer rental units as a percentage of total housing units than the region.
Table 22 Housing Tenure by Race/Ethnicity in Lake County and MSA
Lake County, FL Orlando-Kissimmee-Sanford, FL
Occupied
Housing
Units
Owner-
Occupied
housing
units
Renter-
Occupied
housing
units
Occupied
Housing
Units
Owner-
Occupied
housing
units
Renter-
Occupied
housing
units
Total Occupied
Housing Units 122,036 90,282 31,754 816,428 491,448 324,980
White 87.5% 90.2% 79.9% 75.3% 80.4% 67.6%
Black or African
American 7.9% 5.4% 14.8% 14.8% 10.5% 21.2%

45
American Indian
and Alaska
Native
0.4% 0.3% 0.6% 0.2% 0.2% 0.3%
Asian 1.1% 1.2% 1.0% 3.5% 4.0% 2.7%
Native
Hawaiian/Pacific
Islander
0.1% 0.1% 0.1% 0.0% 0.0% 0.1%
Some Other
Race 1.6% 1.5% 1.8% 3.9% 2.7% 5.7%
Two or More
Races 1.5% 1.3% 1.9% 2.3% 2.1% 2.5%
Hispanic or
Latino Origin 9.7% 7.6% 15.5% 23.3% 17.9% 31.3%
Source American Community Survey, Table S2502, 2012-2016
Table 22 breaks down Housing Tenure by Race/Ethnicity in Lake County and the Orlando-Kissimmee-
Sanford region. The table classifies occupied housing units as owner-occupied, renter-occupied and also
shows the total. It then breaks down the percentage each race/ethnicity that makes up these three
categories of occupied housing units.
Lake County has a total of 122,036 occupied housing units. A total of 90,282 of them are owner-occupied
and 31,754 of the housing units are renter-occupied.
The White population constitutes 87.5% of all occupied housing units in Lake County. They also make up
90.2% of all occupied owner housing units, as well as 79.9% of all occupied renter housing units. These
figures are all at least 10% higher in Lake County than in the region for the White population.
The Black/African American population makes up 7.9% of all occupied housing units. They also make up
just 5.4% of all owner-occupied housing units and 14.8% of all renter occupied units. These are all lower
figures than what the Black/African American population makes up in the region. Black/African Americans
make up 14.8% of all occupied housing units, 10.5% of owner occupied housing units, and 21.2% of all
renter occupied housing units in the Orlando-Kissimmee-Sanford region.
The Hispanic population makes up 9.7% of all occupied housing units, 7.6% of all owner-occupied housing
units, and 15.5% of all renter-occupied housing units in Lake County. This is significantly lower than the
figures from the region. The Hispanic population in the region makes up 23.3% of all occupied housing
units, 17.9% of owner-occupied housing units, and 31.3% of renter-occupied housing units.
46
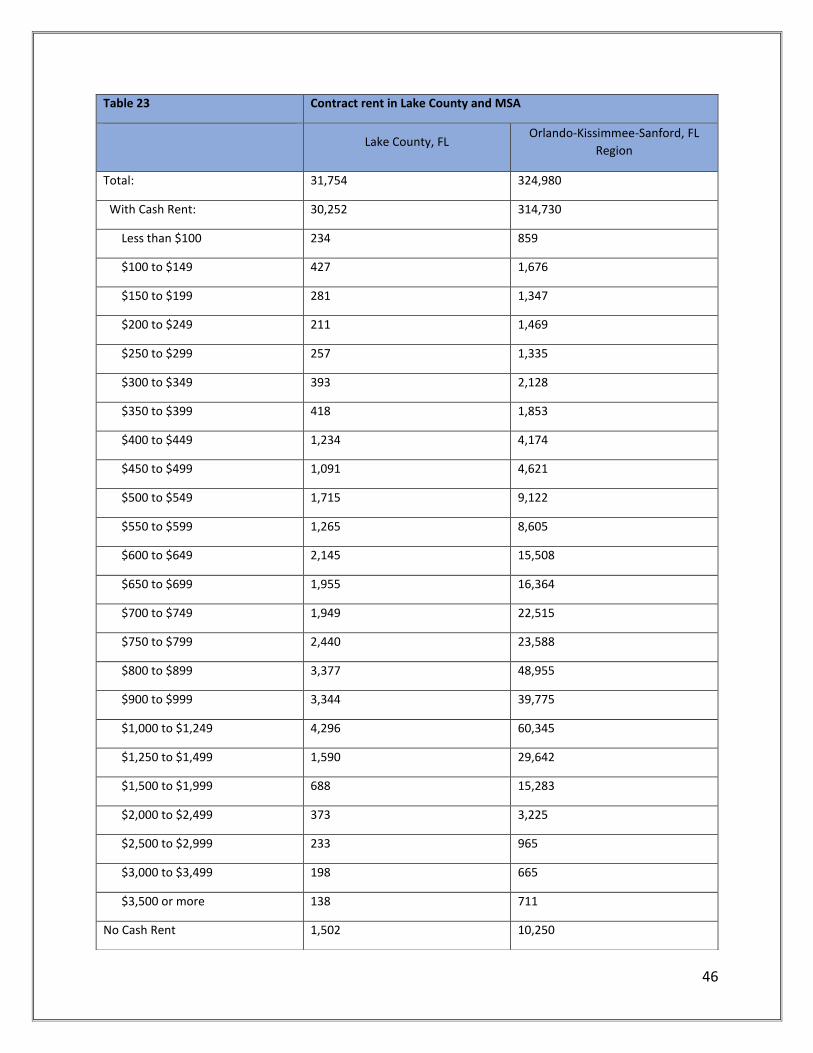
Table 23 Contract rent in Lake County and MSA
Lake County, FL
Orlando-Kissimmee-Sanford, FL
Region
Total: 31,754 324,980
With Cash Rent: 30,252 314,730
Less than $100 234 859
$100 to $149 427 1,676
$150 to $199 281 1,347
$200 to $249 211 1,469
$250 to $299 257 1,335
$300 to $349 393 2,128
$350 to $399 418 1,853
$400 to $449 1,234 4,174
$450 to $499 1,091 4,621
$500 to $549 1,715 9,122
$550 to $599 1,265 8,605
$600 to $649 2,145 15,508
$650 to $699 1,955 16,364
$700 to $749 1,949 22,515
$750 to $799 2,440 23,588
$800 to $899 3,377 48,955
$900 to $999 3,344 39,775
$1,000 to $1,249 4,296 60,345
$1,250 to $1,499 1,590 29,642
$1,500 to $1,999 688 15,283
$2,000 to $2,499 373 3,225
$2,500 to $2,999 233 965
$3,000 to $3,499 198 665
$3,500 or more 138 711
No Cash Rent 1,502 10,250
47
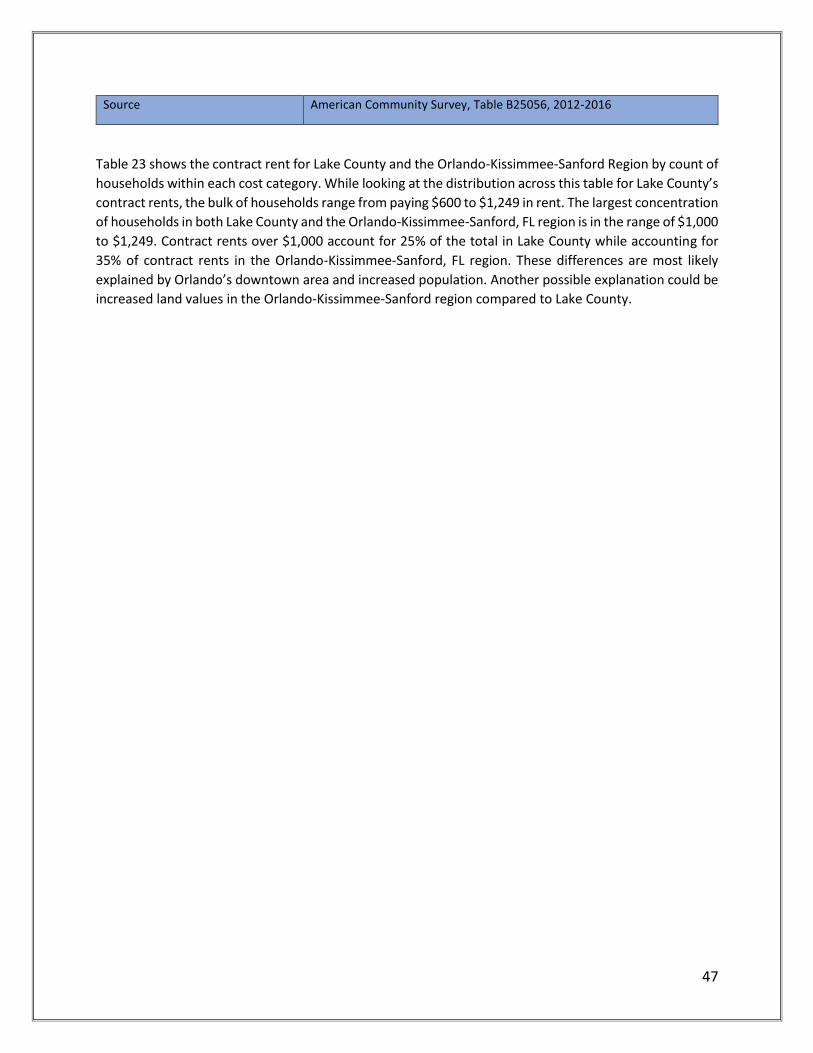
Table 23 shows the contract rent for Lake County and the Orlando-Kissimmee-Sanford Region by count of
households within each cost category. While looking at the distribution across this table for Lake County’s
contract rents, the bulk of households range from paying $600 to $1,249 in rent. The largest concentration
of households in both Lake County and the Orlando-Kissimmee-Sanford, FL region is in the range of $1,000
to $1,249. Contract rents over $1,000 account for 25% of the total in Lake County while accounting for
35% of contract rents in the Orlando-Kissimmee-Sanford, FL region. These differences are most likely
explained by Orlando’s downtown area and increased population. Another possible explanation could be
increased land values in the Orlando-Kissimmee-Sanford region compared to Lake County.
Source American Community Survey, Table B25056, 2012-2016

48
Figure 13: Estimated Contract Rent

49
Figure 13 shows Lake County with areas shaded by estimated contract rent. Also shown on the map are
dots that represent the minority groups of Black/African Americans, Hispanics, and Asians. The area with
the highest contract rent is in southeast Lake County (Clermont and areas south). As noted previously,
this is the same area with the largest share of housing stock built since 1980. The data indicates that
average contract rent in this area ranges from $1,876.01 to $3,063.00. No other area on the map has such
a concentration of expensive rental housing. The areas with the lowest estimated contract rents are
distributed across the region, including areas in the center of the map between Mascotte and Leesburg,
as well as areas in the northeast in and near the Ocala National Forest and Seminole State Forest.
Table 24 Monthly Owner Housing Costs as % of Household Income in Lake County and MSA
Lake County, FL Orlando-Kissimmee-Sanford, FL Region
Total: 122,036 - 816,428 -
Owner-occupied
housing units:
90,282 74% 491,448 60.2%
Less than $20,000: 11,817 13.1% 52,411 10.7%
Less than 20 percent 1,782 15.1% 5,202 9.9%
20 to 29 percent 1,864 15.8% 5,753 11%
30 percent or more 8,171 69.1% 41,456 79.1%
$20,000 to $34,999: 14,566 16.1% 66,977 13.6%
Less than 20 percent 5,462 37.5% 17,611 26.3%
20 to 29 percent 3,330 22.9% 12,604 18.8%
30 percent or more 5,774 39.6% 36,762 54.9%
$35,000 to $49,999: 15,078 16.7% 68,582 14.0%
Less than 20 percent 8,175 54.2% 24,321 35.5%
20 to 29 percent 3,021 20.0% 15,941 23.2%
30 percent or more 3,882 25.7% 28,320 41.3%
$50,000 to $74,999: 17,919 19.8% 96,699 19.7%
Less than 20 percent 11,112 62.0% 43,050 44.5%
20 to 29 percent 4,667 26.0% 30,260 31.3%
30 percent or more 2,140 11.9% 23,389 24.2%
$75,000 or more: 29,974 33.2% 200,710 40.8%
Less than 20 percent 23,130 77.2% 145,277 72.4%

50
20 to 29 percent 5,317 17.7% 43,201 21.5%
30 percent or more 1,527 5.1% 12,232 6.1%
Zero or Negative
Income
928 1.0% 6,069 1.2%
Source American Community Survey, Table B25206, 2012-2016
Table 24 shows monthly owner housing costs as a percentage of the household’s income. It is broken up
by income levels as follows: less than $20,000; $20,000 to $34,999; $35,000 to $49,999; $50,000 to
$74,999; $75,000 or more; and zero or negative income. It is then broken down under each income
category by the percentage of monthly household income used for housing. Notably, as household income
rises the percentage of household income used for housing costs decreases. Also, the percentage of
households spending 30 percent or more on housing costs is lower in Lake County than the Orlando-
Kissimmee-Sanford Region across all household income levels. Spending 30% or more of household
income is a well-established threshold for housing cost burden. When households spend more than 30%
of income on housing costs, it is more likely that households will face difficult tradeoffs between critical
expenses like food, clothing, and transportation.
In the “less than $20,000” for household income group in Lake County, just under 70% of households
devote 30 percent or more of their household income to housing costs. In the region, just under 80% of
households with income less than $20,000 spend 30 percent of more of that income on housing costs.
For the households in Lake County that have income between $20,000 and $34,999, about 40% of those
households spend more than 30 percent of their income on housing costs. This percentage is lower than
the region’s households in this income group as 54.8% of those households spend 30 percent or more of
their household income on housing costs.
In the remaining income groups, the share of households using 30 percent or more of their household
income on housing costs decreases while the percentage of households using less than 20 percent
increases. As a whole across all household income levels, Lake County residents spend less of a percentage
of their income on housing costs than in the Orlando-Kissimmee-Sanford Region.
Table 25 Monthly Renter Housing Costs as % of Household Income in Lake County and MSA
Lake County, FL Orlando-Kissimmee-Sanford, FL Region
Renter-occupied
housing units: 31,754 - 324,980 -
Less than $20,000: 7,756 24.4% 70,389 21.7%
Less than 20 percent 100 1.3% 337 0.1%
20 to 29 percent 535 6.9% 2,199 0.7%
30 percent or more 7,121 91.8% 67,853 96.4%

51
$20,000 to $34,999: 7,070 22.3% 71,560 22.0%
Less than 20 percent 183 2.6% 956 1.3%
20 to 29 percent 936 13.2% 6,052 8.5%
30 percent or more 5,951 84.2% 64,552 90.2%
$35,000 to $49,999: 5,281 16.6% 54,794 16.9%
Less than 20 percent 621 11.8% 2,959 5.4%
20 to 29 percent 2,555 48.4% 22,640 41.3%
30 percent or more 2,105 39.8% 29,195 53.3%
$50,000 to $74,999: 5,090 16% 58,360 18.0%
Less than 20 percent 1,750 34.4% 14,726 25.2%
20 to 29 percent 2,494 49% 32,224 55.2%
30 percent or more 846 16.6% 11,410 19.6%
$75,000 or more: 4,543 14.3% 51,363 15.8%
Less than 20 percent 3,214 70.7% 37,223 72.5%
20 to 29 percent 1,134 25% 13,180 25.7%
30 percent or more 195 4.3% 960 1.9%
Zero or Negative
Income 512 1.6% 8,264 2.5%
No Cash Rent 1,502 4.7% 10,250 3.2%
Source American Community Survey, Table B25106, 2012-2016
Table 25 shows monthly renter housing costs as a percentage of household income in Lake County and
the Orlando-Kissimmee-Sanford, FL region. Lake County and Orlando-Kissimmee-Sanford show similar
percentages for renters spending 30 percent or more their income on housing. The data shows that as
household income rises, households spend a smaller share of their income on housing.
Compared to homeowners, renters are more cost burdened across all income levels except for households
earning $75,000 or more. This is particularly the case for lower income households. For those households
earning less than $20,000, about 92% of renters are spending 30 percent of more of their household
income on housing costs. This same figure is 69.1% for homeowner households. In the income level of
$20,000 to $34,999, the percentage of renters that spend 30 percent or more of their household income
on housing costs is about 84.2%. This large percentage of renters is about double the percentage of
homeowners in the same household income bracket.

52
As household income rises, the percentage of renters spending 30 percent or more on housing costs
decreases but are still more than homeowners at all income levels except for $75,000 or more in
household income.
According to these tables, renters have more cost burden in Lake County. Although the differences
between homeowners and renter cost burden seem high in Lake County, the Orlando-Kissimmee-Sanford
region shows similar differences.

53
Figure 14: Cost Burdened Renter Units

54
Figure 14 shows Lake County with areas shaded by cost burdened renter units, with darker shades
indicating areas with higher housing cost burdens. Also shown on the map are dots representing the
minority groups of Black/African American, Hispanic, and Asian. The area with the highest percentage cost
burdened renter units is the area around Leesburg and south. Other areas with high cost burdened renter
units include Umatilla and areas in the northeast which are probably not densely populated. The north
east part of Lake County also has an area of high cost burdened renter units in the Lady Lake area.
Areas with a higher percentage of cost burdened renter units with a significant minority population
include Leesburg, a City with a dense minority population of mostly Hispanic and Black/African American
households. Another densely populated minority area with a higher percentage of cost burdened renter
units is Tavares, with high concentrations of Black/African American and Hispanic households. The final
areas with a dense minority population and high cost burden are the Clermont and Minneola
communities, each with dense Hispanic populations and significant Black/African American populations.

55
Figure 15: Cost Burdened Owner Units with a Mortgage
Figure 15 shows Lake County with areas shaded by cost burdened owner units with a mortgage. Also
shown on the map are dots that represent the minority groups of Black/African American, Hispanic, and
Asian. The areas with the highest cost burdened owner units with a mortgage include the northwest area

56
and the area in the center of Lake County around Tavares, which has a densely populated minority
population. The areas around Leesburg and south also show high cost burdened owner units with a
mortgage.
Areas that have a high percentage of cost burdened owner units with a mortgage with dense minority
populations include Leesburg and the surrounding area. This area has a dense population of Black/African
American and Hispanic residents. Another area, like this, would be the Tavares area. Both of these areas
also have a high percentage of cost burdened renter units.
The Clermont and Minneola areas show less of a percentage of cost burdened owner units with a
mortgage than cost burdened renter units, found in the previous map.

57
Figure 16: Cost Burdened Owner Units without a Mortgage

58
Figure 16 shows Lake County with areas shaded by cost burdened owner units without a mortgage. Also
shown on the map are dots that represent the minority groups of Black/African American, Hispanic, and
Asian. The areas with the highest cost burdened units are distributed unevenly as most appear to be
located in the south in the Groveland area and south.
In most areas, it seems that the percentage of housing costs relative to household income decreases from
Figure 15 to Figure 16. However, some areas with dense minority populations have high housing costs
without a mortgage. These areas include the area south of Clermont and also the Groveland area, which
have dense Hispanic populations.

59
Figure 17: Rental Units as a Percent of All Occupied Units

60
Figure 17 shows Lake County with areas shaded by rental units as a percent of all occupied units. Also
shown on the map are dots that represent the minority groups of Black/African American, Hispanic, and
Asian. The area with the highest percentage of rental units as a percent of all occupied units is the area in
the southeast of Lake County. In the southeast, there is a substantial Hispanic minority population.
Another area of Lake County that has the highest percentage of rental units as a percent of all occupied
units is the Leesburg area, which has a substantial Black/African American minority population.

61
II. Additional Data and Analysis
Segregation Analysis Segregation is defined in the Affirmatively Furthering Fair Housing (AFFH) rule as a condition where there
is a high concentration of persons of a particular race, color, religion, sex, familial status, national origin,
or having a disability or a type of disability in a particular geographic area when compared to a broader
geographic area. Integration, on the other hand, means that there is not a high concentration of protected
class persons in a particular geographic area when compared to a broader geographic area.
The level of residential segregation can be measured by a dissimilarity index. A dissimilarity index assesses
the degree to which two groups are evenly distributed across the jurisdiction or region. The dissimilarity
index value ranges from 0 to 100, where a higher number indicates a greater degree of segregation
between the two measured groups. The table below depicts the current and past race/ethnicity
dissimilarity index values for the non-white/White, Black/White, Hispanic/White, and Asian or Pacific
Islander/White populations in Lake County. Dissimilarity index values between 0 and 39 indicate low
segregation, values between 40 and 54 indicate moderate segregation, and values between 55 and 100
indicate high segregation.
Table 26 Racial/Ethnic Dissimilarity Index Trends in Lake County
(Lake County, FL CDBG) Jurisdiction
1990 2000 2010 Current
Non-White/White 41.25 28.44 30.34 35.75
Black/White 48.87 42.99 35.84 43.81
Hispanic/White 36.35 29.53 31.51 36.12
Asian or Pacific Islander/White 20.84 22.90 32.64 36.48
Source: 1990, 2000, 2010 Decennial census, HUD AFFHT004 Dissimilarity Index
Based on the data in Table 26, the Non-White/White, Hispanic/White, and Asian or Pacific Islander/White
dissimilarity index is low for Lake County at 35.75, 36.12, and 36.48 respectively. This indicates a low level
of segregation in Lake County amongst those particular race/ethnicities. There is a higher level of
segregation for the Black/White category at 43.81. Blacks/African Americans are the racial/ethnic group
experiencing the highest level of segregation as indicated by the Black/White dissimilarity index value.
This represents moderate segregation between African American and White individuals. Both Hispanic
and Asian or Pacific Islanders experience low degrees of segregation.
The non-White/White dissimilarity index in Lake County is currently low, however trends show that in
1990 segregation for this category was higher decreasing in 2000 and increasing again in 2010. The
Black/White dissimilarity index is the highest among the racial/ethnic groups however, from 1990 to 2010

62
the segregation level decreased only to increase again between 2010 and 2018. The trends for
Hispanic/White are similar, decreasing between 1990 and 2000 and then consistently increasing once
again since 2010. The Asian or Pacific Islander/White dissimilarity index has been steadily increasing since
1990 until its highest point currently at 36.48.

63
Access to Areas of Opportunity
The ability to live in housing close jobs offers many advantages to those people who can afford it. While
it is ideal to live close to one’s place of employment, it is not always possible for various reasons. A
principal reason is the cost of housing in areas close to large job centers is often prohibitive for lower-
income households. Commute times increase the further a person lives from his or her job, with a
corresponding increase in the cost of travel.
Overall, it is preferred that residential neighborhoods have accessibility to job locations. In many
communities, large numbers of jobs tend to be located in areas that are accessible to neighborhoods with
significant human capital, as measured by educational attainment, population sizes, and work experience,
but this relationship is, in many communities, determined by historic housing development patterns.
Job Proximity Index
Table 27 Jobs Proximity Index by race/ethnicity in Lake County and MSA
Lake County, FL Orlando-Kissimmee-Sanford region
Total Population
White, Non-Hispanic 42.73 45.57
Black, Non-Hispanic 56.47 42.36
Hispanic 43.92 41.22
Asian or Pacific Islander, Non-Hispanic
45.23 48.16
Native American, Non-Hispanic 43.56 44.03
Population below federal poverty line
White, Non-Hispanic 42.15 49.32
Black, Non-Hispanic 56.18 45.76
Hispanic 43.29 43.93
Asian or Pacific Islander, Non-Hispanic
54.68 50.85
Native American, Non-Hispanic 57.74 44.67
Source: Decennial Census; ACS; Great Schools; Common Core of Data; SABINS; LAI; LEHD; NATA

64
Table 27 shows the Job Proximity Index values for Lake County and the Orlando-Kissimmee-Sanford
region. The table reviews index values for race/ethnicity for the total population and also for the
population below the federal poverty line. The higher the index value, the better the access to
employment opportunities for residents in a neighborhood.
Index values for the population below the federal poverty line are greater than the values of the total
population for the Asian and Native American population and essentially equal for the White, Black, and
Hispanic populations.
The White population of Lake County has a 42.73 Job Proximity Index value. This value is slightly lower
than the region value of 45.57. The value of 42.73 for the total population of White residents of Lake
County is about the same as the value for the White population of Lake County below the federal poverty
line, which is 42.15. The index value for the White population below the federal poverty line in the region
is 49.32.
The Black and Hispanic populations of Lake County show little change in index value when comparing the
total population to the population below the federal poverty line. The total population index value for the
Black residents of Lake County is 56.47 while the total population index value for the Hispanic population
is 43.92. The index value for the population below the federal poverty line for the Black population of Lake
County is 56.18 and 43.29 for the Hispanic population. While the index values are similar for Lake County
and the region for Hispanic residents, the index values for the Black population in the region is lower than
in Lake County.
The total population index values for Asians and Native Americans in Lake County are 45.23 and 43.56,
respectively. Both the Asian and Native American index values for the population below the federal
poverty line increase to above 50. The index value for the Asian population below the federal poverty line
is 54.68 while the index value for the Native American population below the federal poverty line is 57.74.

65
The differences between the total population and the population below the federal poverty line for the
Asian and Native American populations in the region is smaller than in Lake County.
Figure 18 shows the job proximity index with the percentage of households that are families with children
in Lake County. The higher the index value, the better the access to employment opportunities for
residents in a neighborhood.
Areas with a share of households that are families with children above 60% include Clermont and
Minneola in southeast Lake County. These areas do not have demonstrably higher job proximity index
values compared to the rest of the County.
The areas of Tavares and Leesburg have percentages of households that are families with children below
60%. These two areas show job proximity index values higher than the other areas of Lake County, above
the 40.1-50 range which seems to be the average for Lake County.
Figure 18. HUD AFFHT004, Job Proximity Index and Family Status
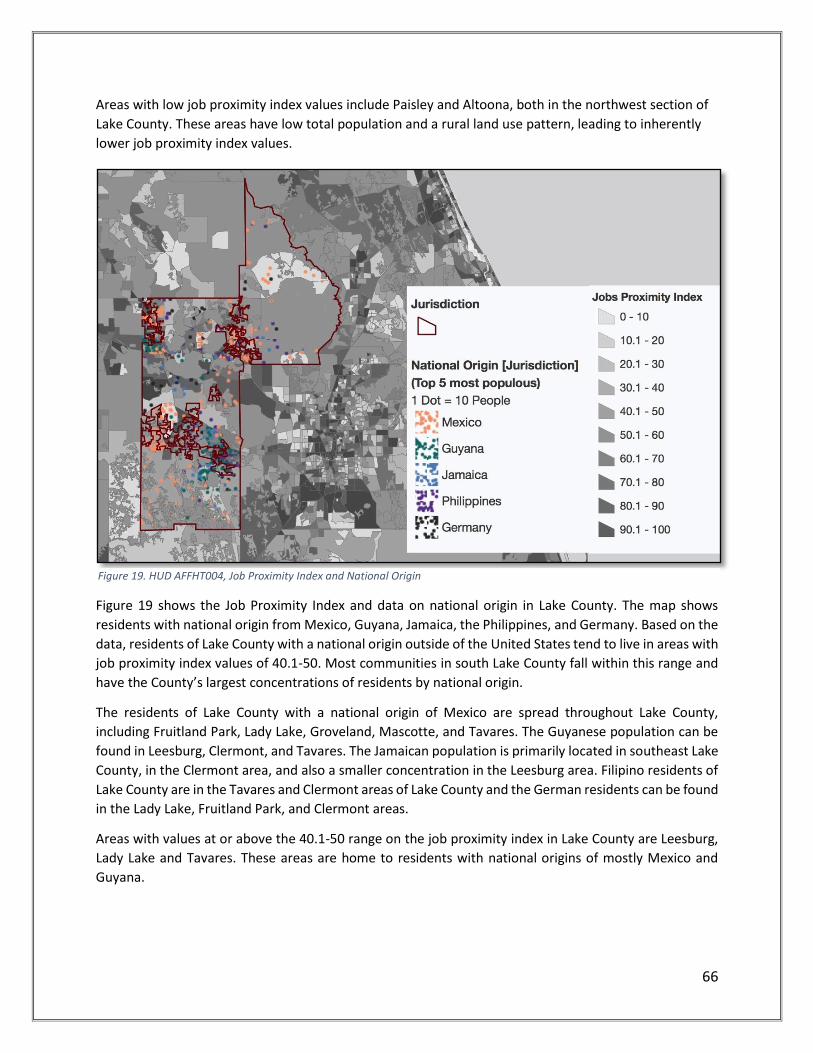
66
Areas with low job proximity index values include Paisley and Altoona, both in the northwest section of
Lake County. These areas have low total population and a rural land use pattern, leading to inherently
lower job proximity index values.
Figure 19 shows the Job Proximity Index and data on national origin in Lake County. The map shows
residents with national origin from Mexico, Guyana, Jamaica, the Philippines, and Germany. Based on the
data, residents of Lake County with a national origin outside of the United States tend to live in areas with
job proximity index values of 40.1-50. Most communities in south Lake County fall within this range and
have the County’s largest concentrations of residents by national origin.
The residents of Lake County with a national origin of Mexico are spread throughout Lake County,
including Fruitland Park, Lady Lake, Groveland, Mascotte, and Tavares. The Guyanese population can be
found in Leesburg, Clermont, and Tavares. The Jamaican population is primarily located in southeast Lake
County, in the Clermont area, and also a smaller concentration in the Leesburg area. Filipino residents of
Lake County are in the Tavares and Clermont areas of Lake County and the German residents can be found
in the Lady Lake, Fruitland Park, and Clermont areas.
Areas with values at or above the 40.1-50 range on the job proximity index in Lake County are Leesburg,
Lady Lake and Tavares. These areas are home to residents with national origins of mostly Mexico and
Guyana.
Figure 19. HUD AFFHT004, Job Proximity Index and National Origin

67
The areas of Lake County with values below the 40.1-50 range job proximity index values are Altoona
and Paisley. These areas have very few residents with national origins outside of the United States.
Figure 20 shows Job Proximity Index and race/ethnicity in Lake County. The map shows races/ethnicities
of White, Black, Native American Asian, Hispanic, Other, and Multi-racial. From the map, it seems that the
non-White residents of Lake County live in areas with average to above average values on the jobs
proximity index.
The White population of Lake County is evenly distributed across densely populated areas of Lake County. The Black/African American population of Lake County is mostly concentrated in the Leesburg, Tavares, and Clermont. The Hispanic population of Lake County is distributed in the prior mentioned three areas as well as Groveland and Mascotte. The Asian population is primarily located in Clermont and Tavares.
Areas with values between 40.1-50 on the job proximity index in Lake County are Leesburg, Lady Lake and Tavares. Areas with values below the 40.1-50 range on the job proximity index in Lake County are Altoona and Paisley. These areas are not densely populated and most of the population in these areas is White. From the map, it appears most races/ethnicities besides White persons live in areas with average to above average job proximity index vales for Lake County.
Figure 20. HUD AFFHT004, Job Proximity Index and Race/Ethnicity

68
Labor Market Index
Table 28 Labor Market Index by Race/Ethnicity in Lake County and MSA
Race/Ethnicity Lake County, FL Orlando-Kissimmee-Sanford region
Total Population
White, Non-Hispanic 37.24 53.63
Black, Non-Hispanic 32.07 37.67
Hispanic 40.45 45.53
Asian or Pacific Islander, Non-Hispanic
44.42 58.12
Native American, Non-Hispanic 35.21 45.53
Population below federal poverty line
White, Non-Hispanic 31.06 47.68
Black, Non-Hispanic 29.53 30.34
Hispanic 39.61 41.32
Asian or Pacific Islander, Non-Hispanic
42.09 52.58
Native American, Non-Hispanic 43.89 38.51
Source Decennial Census; ACS; Great Schools; Common Core of Data; SABINS; LAI; LEHD; NATA
Table 28 shows the labor market index by race/ethnicity for Lake County and the Orlando-Kissimmee-
Sanford region. The table reviews index values for race/ethnicity for the total population and for the
population below the federal poverty line. The higher the index value, the higher the labor force
participation and human capital in a neighborhood. When comparing the index values for the total
population of Lake County to the population below the federal poverty line in Lake County, it is apparent
that the population living in poverty have lower labor market index values compared to the rest of the
population.
The total White population of Lake County has a labor market index value of 37.24 and the White
population below the federal poverty line has an index value of 31.06. The index value for the total White

69
population in the region is 53.63 and 47.68 for the White population below the federal poverty line in the
region.
The overall Black population labor market index value for Lake County is 32.07, compared to 29.53 for the
Black population below the federal poverty line. At the regional level, the Black index values are 37.67 and
30.34, respectively. The index values of Lake County show less of a difference between the total
population and the population below the federal poverty line in Lake County than in the region.
The total Hispanic population labor market index value for Lake County is 40.45 and the Hispanic
population below the federal poverty line index value is 39.61. These values are both slightly less than the
region’s values.
The Asian population has the highest index values of all the races/ethnicities in Lake County and also in
the Orlando-Kissimmee-Sanford region. The index value for the total Asian population in Lake County is
44.42 and 42.09 for the Asian population below the federal poverty line. Both of these values are below
the region’s figures for the Asian population.
The Native American population’s labor market index value is greater for the population below the federal
poverty line than the total population. Because of the small population of Native Americans in Lake

70
County, the index values are probably susceptible to change from small changes in the data for Native
Americans in Lake County.
Figure 21 shows the labor market index and the percentage of households that are families with children.
The higher the index value, the higher the labor force participation and human capital in a neighborhood.
On the map, a larger percentage of households that are families with children in an area yields a larger
circle.
The areas with the highest labor market index values are Clermont and Minneola in the southeast which
also have a high percentage of households that are families with children. Areas with the percentage of
households that are families with children above 60% include the Clermont and Minneola areas which are
in the southeast of Lake County. These areas have labor market index values which are above average in
Lake County.
The areas of Tavares and Leesburg have percentages of households that are families with children below
60%. Tavares seems to have labor market index values which are about average for Lake County while
Leesburg seems to have labor market index values below the average for Lake County.
Figure 21. HUD AFFHT004, Labor Market Index and Familial Status

71
Areas with low labor market index values include Paisley and Altoona which are in the northwest section
of Lake County. These areas do not seem to have many families with children or many households in
general.
Figure 22 shows the labor market index and national origin of residents of Lake County. The map shows
residents with national origin from Mexico, Guyana, Jamaica, the Philippines, and Germany. Because of
the high number of residents in the southeast of Lake County that have national origins outside of the
United States, many residents with a national origin outside of the US live in areas of Lake County with a
high labor market index value.
The residents of Lake County with a national origin of Mexico are spread throughout Lake County. This
includes the areas of Fruitland Park, Lady Lake, Groveland, Mascotte, and Tavares. The Guyanese
population can be found in Leesburg, Clermont, and Tavares. The Jamaican population is primarily located
in southeast Lake County, in the Clermont area, and also a smaller concentration in the Leesburg area.
Filipino residents of Lake County are in the Tavares and Clermont areas of Lake County and the German
residents can be found in the Lady Lake, Fruitland Park, and Clermont areas.
Figure 22. HUD AFFHT004, Labor Market Index and National Origin

72
Figure 23 shows the labor market index and race/ethnicities in Lake County. The map shows
races/ethnicities of White, Black, Native American Asian, Hispanic, Other, and Multi-racial. The southeast
part of Lake County has the highest labor market index values of Lake County which is also a diverse part
of Lake County.
The White population of Lake County is evenly distributed across densely populated areas of Lake County.
The Black/African American population of Lake County is mostly concentrated in the Leesburg, Tavares,
and Clermont. The Hispanic population of Lake County is distributed in the prior mentioned three areas
as well as Groveland and Mascotte. The Asian population is mainly located in Clermont and Tavares.
Tavares seems to have labor market index values which are about average for Lake County while Leesburg
seems to have labor market index values below the average for Lake County. These areas are home to
White, Black, and Hispanic residents. Areas with low labor market index values include Paisley and Altoona
which are in the northwest section of Lake County. This area does not seem densely populated by any
race/ethnicity. The area with the highest labor index value is the southeast of Lake County which includes
Clermont and Minneola.
Figure 23. HUD AFFHT004, Labor Market Index and Race/Ethnicity

71
Transit Trips Index Access to transportation is an important factor in a community. Without it, the residents of a
neighborhood would have much more trouble travelling from home to places they need to go. The world
uses transportation to get to work, school, and other places that will enhance their lives. As the world has
become more car dependent, those without access to a car are often times at a disadvantage to get to
these places. Widespread access to transportation can make it easier to find work and to attend school.
Transportation access for all greatly benefits the residents of a neighborhood economically and socially.
The following maps use the Transit Trips Index to evaluate public transit access in Lake County, FL. The index uses data from a 3-person single-parent family with income at 50% of the median income for renters in the region. The demographic data used in the following maps includes family status, national origin, and race/ethnicity data of Lake County.
The values are percentile ranked nationally and range from 0 to 100. Higher values indicate a greater likelihood that residents utilize public transit. A low value indicates lower access to public transit compared to a high value.
According to the data, areas across Lake County score low values on the Transit Trips Index. This indicates
poor access to public transit regardless of geographic location in the County. The lowest values in the
Transit Trips Index for Lake County are mostly found in the north east and southern portions of Lake
County, including Clermont, Groveland, Mascotte, and Minneola. The reason for the low values could low
access to public transit in the north east and southern parts of Lake County.
The higher values in the Transit Trips Index for Lake County tend to be in the north west area of Lake
County where Lady Lake, Fruitland Park, and Leesburg are located. Another area with relatively high a
Transit Trips Index value is Tavares, which is located east of Leesburg. This could be because of greater
accessibility to public transportation due to the comparatively dense built environment and greater
frequency of bus service in the city.

72
Figure 24. HUD AFFHT004, Transit Trips Index and Familial Status
Figure 24 shows the Transit Trips Index with family status data. The areas with the higher values for the
Transit Trips Index in Lake County tend to have a lower percentage of households that are families with
children.
Areas with a higher percentage of households with children appear to be located in the southeast of Lake
County in Clermont and Minneola. The southern area of Lake County has low values in the Transit Trips
Index.
Areas with a percentage of households that are families with children between 0%-40% include Tavares,
Lady Lake and Leesburg. These areas have relatively high values in the Transit Trips Index when compared
to the rest of Lake County.

73
Figure 25. HUD AFFHT004, Transit Trips Index and National Origin
Figure 25 shows the Transit Trips Index and national origin for Lake County, FL. The map shows residents
with national origin from Mexico, Guyana, Jamaica, the Philippines, and Germany. From the map, it
appears that residents of Lake County with a national origin outside of the United States tend to live in
areas with a lower Transit Trips Index value compared to the rest of the population. This is due, in large
part, to a disproportionate share of the population by national origin living in southeast Lake County – an
area dominated by low transit trips index values.
The residents of Lake County with a national origin of Mexico are spread throughout Lake County. This
includes the areas of Fruitland Park, Lady Lake, Groveland, Mascotte, and Tavares. The Guyanese
population can be found in Leesburg, Clermont, and Tavares. The Jamaican population is primarily located
in southeast Lake County, in the Clermont area, and also a smaller concentration in the Leesburg area.
Filipino residents of Lake County are in the Tavares and Clermont areas of Lake County and the German
residents can be found in the Lady Lake, Fruitland Park, and Clermont areas.
Fruitland Park, Lady Lake, and Tavares have a higher value on the Transit Trips Index than the rest of Lake
County. The areas of Groveland, Clermont, and Mascotte show lower values on the index.

74
Figure 26. HUD AFFHT004, Transit Trips Index and Race/Ethnicity
According to Figure 26, there is a significant concentration of Hispanics in south Lake County where neighborhoods have a low value on the Transit Trips Index. Because of this, Hispanics overall have a lower value on the index than other racial/ethnic groups.
The White population of Lake County is evenly distributed across densely populated areas of Lake County. The Black/African American population of Lake County is mostly concentrated in the Leesburg, Tavares, and Clermont areas. The Hispanic population of Lake County is distributed in the prior mentioned three areas as well as Groveland and Mascotte. The Asian population is mainly located in Clermont and Tavares.

75
Table 29 Transit Index by Race/Ethnicity in Lake County and MSA
Lake County, FL Orlando-Kissimmee-Sanford, FL
region
Transit Index Value
Total Population
White, Non-Hispanic 34.73 45.09
Black, Non-Hispanic 37.12 50.54
Hispanic 30.82 48.20
Asian or Pacific Islander, Non-Hispanic
32.09 46.24
Native American, Non-Hispanic 33.57 45.85
Population below federal poverty line
White, Non-Hispanic 36.37 47.80
Black, Non-Hispanic 39.60 52.96
Hispanic 29.38 50.59
Asian or Pacific Islander, Non-Hispanic
35.14 50.25
Native American, Non-Hispanic 39.20 55.37
Source Decennial Census; ACS; Great Schools; Common Core of Data; SABINS; LAI; LEHD; NATA
According to Table 29, which shows the Transit Index values by Race/Ethnicity for Lake County and the
Orlando-Kissimmee-Sanford region of Florida, persons living under the federal poverty line have superior
access to transit compared to the population living above the poverty line. There is one exception to this:
Hispanics living under the poverty line (29.38) have slightly worse access to transit than Hispanics above
the poverty line (30.82). The fact that persons living below the poverty line enjoy greater access to transit
is explained primarily by the spatial concentration of these populations in denser urban environments
with regular and accessible bus service. Alternatively, populations living above the poverty line are more
likely to live in less dense areas of the County with poor access to public transportation

76
As a whole, Lake County’s Transit Index values are lower than the Orlando-Kissimmee-Sanford region. This
is probably due to greater access to public transit across the region.
The Hispanic population of Lake County has the lowest values on the Transit Index for both the total
population and the population below the federal poverty line. While the difference is minimal, it can
probably be explained by a large Hispanic population present in the southern part of Lake County, which
has low Transit Index values.
Low Transportation Cost Index
The following maps use the Low Transportation Cost Index to evaluate the cost of transportation. The index takes data from a 3-person single-parent family with income at the 50% of the median income for renters in the region.
The values are inverted and percentile ranked nationally with values ranging from 0 to 100. A high value (darker areas) indicates a lower transportation cost in a neighborhood. Transportation costs may be low in a particular neighborhood because of greater access to public transportation and the density of homes, services, and jobs in the neighborhood and surrounding community.
The low transportation cost index values for Lake County are on the lower end of the index, indicating a higher cost of transportation. The areas with the highest values on the index in Lake County are Lady Lake, Leesburg, and Tavares. The areas of Tavares, Lady Lake, and Leesburg have the highest values on both the transit trips index and the low transportation index of all of Lake County. The areas of Mascotte, Mineola, and Fruitland Park show an index value on the lower end of Lake County areas.
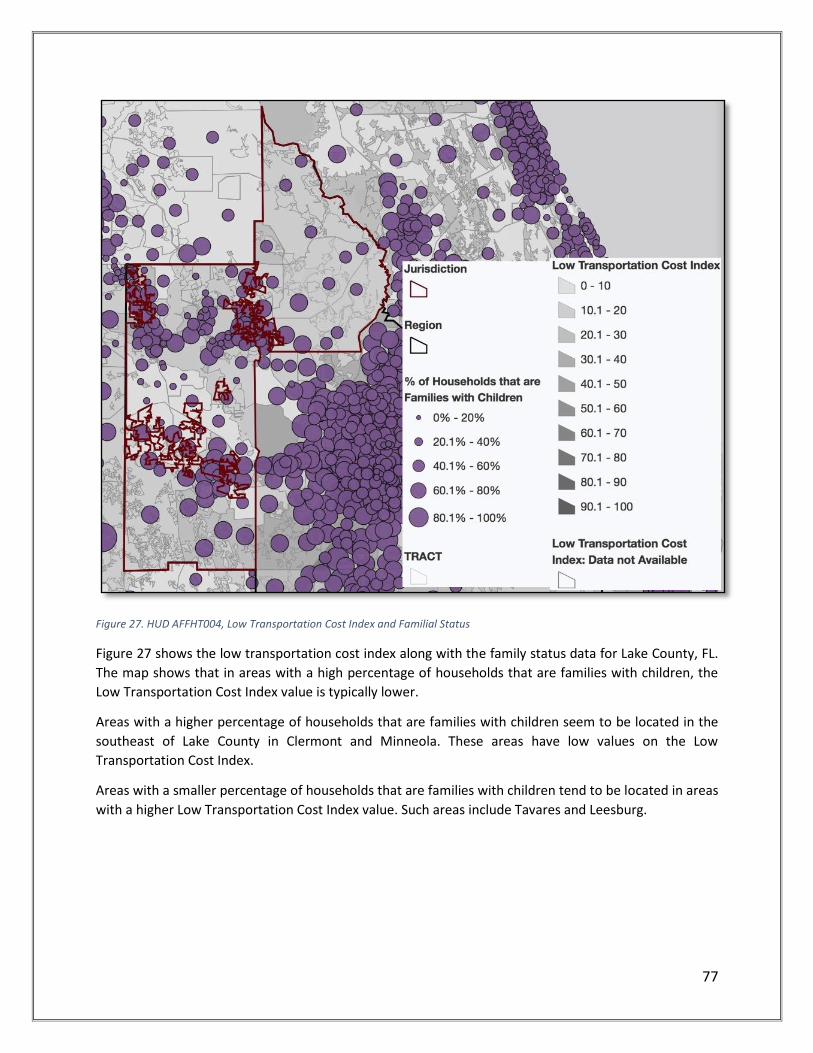
77
Figure 27. HUD AFFHT004, Low Transportation Cost Index and Familial Status
Figure 27 shows the low transportation cost index along with the family status data for Lake County, FL.
The map shows that in areas with a high percentage of households that are families with children, the
Low Transportation Cost Index value is typically lower.
Areas with a higher percentage of households that are families with children seem to be located in the
southeast of Lake County in Clermont and Minneola. These areas have low values on the Low
Transportation Cost Index.
Areas with a smaller percentage of households that are families with children tend to be located in areas
with a higher Low Transportation Cost Index value. Such areas include Tavares and Leesburg.
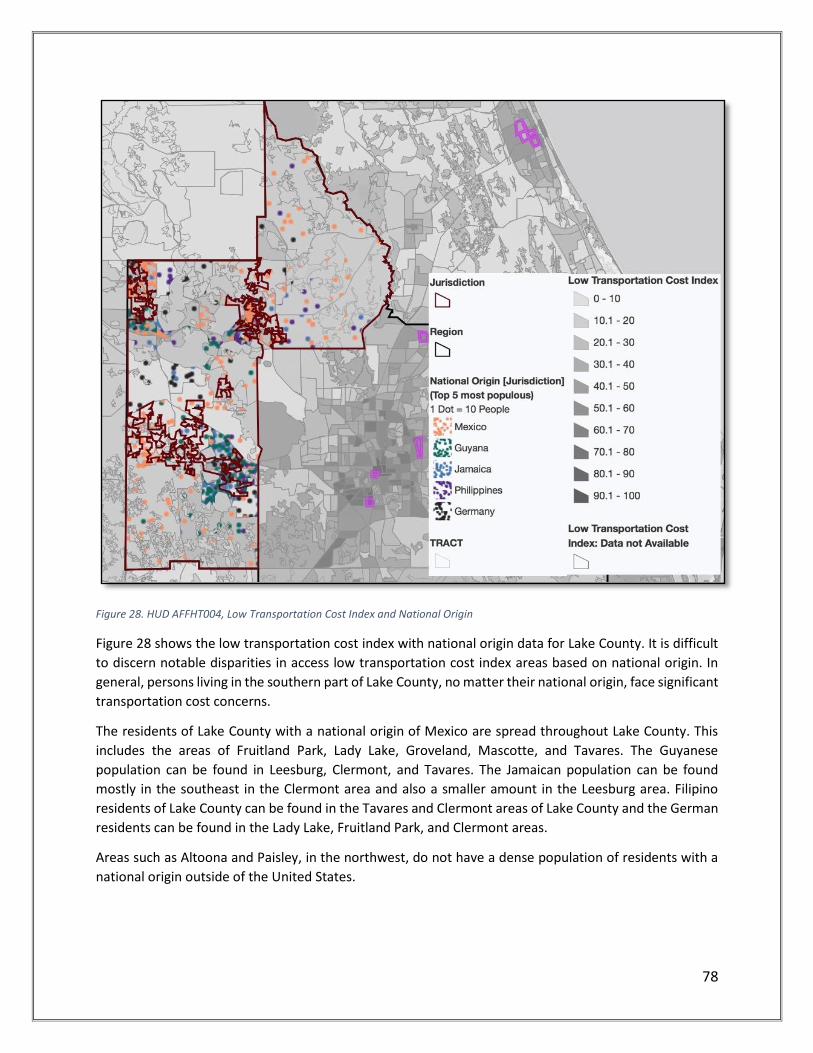
78
Figure 28. HUD AFFHT004, Low Transportation Cost Index and National Origin
Figure 28 shows the low transportation cost index with national origin data for Lake County. It is difficult
to discern notable disparities in access low transportation cost index areas based on national origin. In
general, persons living in the southern part of Lake County, no matter their national origin, face significant
transportation cost concerns.
The residents of Lake County with a national origin of Mexico are spread throughout Lake County. This
includes the areas of Fruitland Park, Lady Lake, Groveland, Mascotte, and Tavares. The Guyanese
population can be found in Leesburg, Clermont, and Tavares. The Jamaican population can be found
mostly in the southeast in the Clermont area and also a smaller amount in the Leesburg area. Filipino
residents of Lake County can be found in the Tavares and Clermont areas of Lake County and the German
residents can be found in the Lady Lake, Fruitland Park, and Clermont areas.
Areas such as Altoona and Paisley, in the northwest, do not have a dense population of residents with a
national origin outside of the United States.
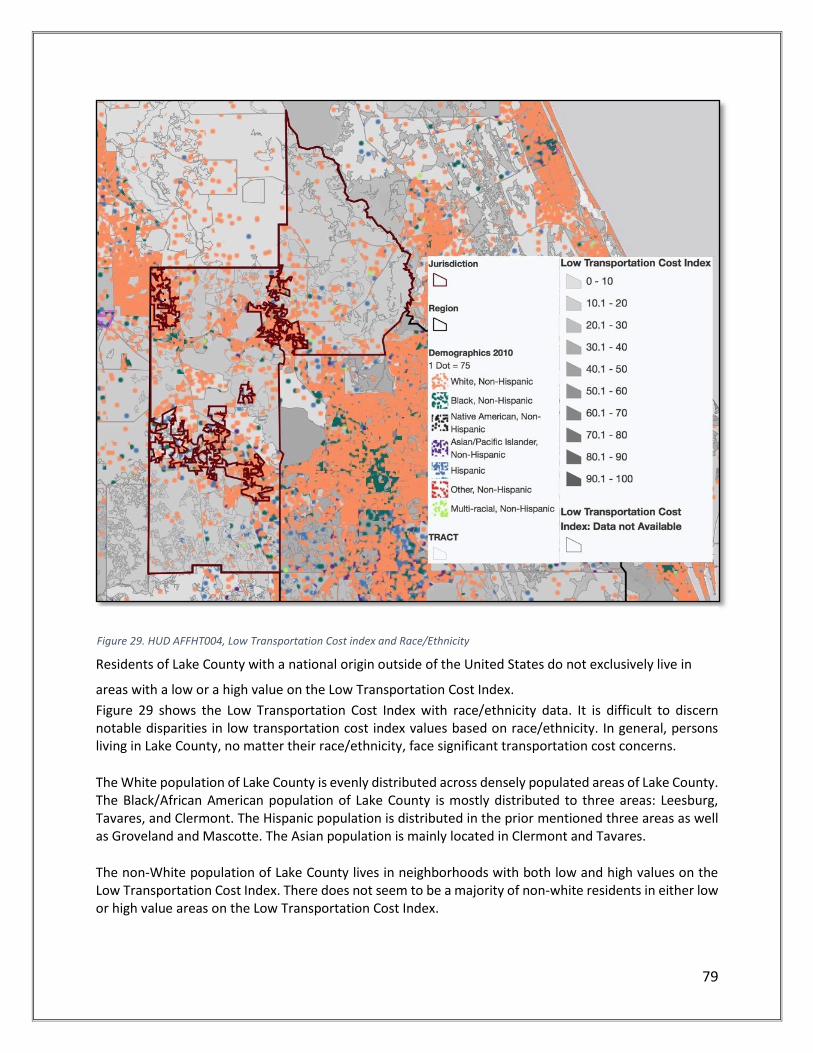
79
Figure 29. HUD AFFHT004, Low Transportation Cost index and Race/Ethnicity
Residents of Lake County with a national origin outside of the United States do not exclusively live in
areas with a low or a high value on the Low Transportation Cost Index.
Figure 29 shows the Low Transportation Cost Index with race/ethnicity data. It is difficult to discern notable disparities in low transportation cost index values based on race/ethnicity. In general, persons living in Lake County, no matter their race/ethnicity, face significant transportation cost concerns.
The White population of Lake County is evenly distributed across densely populated areas of Lake County. The Black/African American population of Lake County is mostly distributed to three areas: Leesburg, Tavares, and Clermont. The Hispanic population is distributed in the prior mentioned three areas as well as Groveland and Mascotte. The Asian population is mainly located in Clermont and Tavares.
The non-White population of Lake County lives in neighborhoods with both low and high values on the Low Transportation Cost Index. There does not seem to be a majority of non-white residents in either low or high value areas on the Low Transportation Cost Index.

80
Table 30 Low Transportation Cost Index by Race/Ethnicity in Lake County and MSA
Race/Ethnicity Lake County, FL Orlando-Kissimmee-Sanford, FL region
Total Population
White, Non-Hispanic 18.86 30.85
Black, Non-Hispanic 25.33 39.15
Hispanic 19.16 34.42
Asian or Pacific Islander, Non-Hispanic
18.93 32.88
Native American, Non-Hispanic 19.24 32.74
Population below federal poverty line
White, Non-Hispanic 19.59 35.11
Black, Non-Hispanic 27.40 43.29
Hispanic 22.69 38.04
Asian or Pacific Islander, Non-Hispanic
21.08 36.34
Native American, Non-Hispanic 17.15 45.22
Source Decennial Census; ACS; Great Schools; Common Core of Data; SABINS; LAI; LEHD; NATA
According to Table 30 for Low Transportation Cost Index values in Lake County and the Orlando-
Kissimmee-Sanford region, index values for the population across all races/ethnicities are low. Similar to
the Transit Index values, the population below the federal poverty line has superior transportation cost
index values compared to the population above the poverty line.
The values of Lake County are lower than the values for the Orlando-Kissimmee-Sanford region. This
indicates that transportation costs in the broader metropolitan region are lower than those in Lake
County. This could also indicate that the region has greater access to public transportation or a higher
density of homes, services, and jobs in the surrounding community.

81
The values for the Black, Non-Hispanic population of Lake County are highest in the county. This may be
due to the large Black population in areas such as Leesburg and Tavares, which have high Cost Index values
compared to the rest of Lake County.
The values for the White, Non-Hispanic population of Lake County and the region are lower than most of
the values of the other race/ethnicities.
Center for Neighborhood Technology’s Housing + Transportation Index Explanation of H+T index
The H+T index tells us the level of affordability for a neighborhood by factoring housing and transportation
costs in a single index. The index provides a percentage estimate of the average combined cost of housing
and transportation. The benchmark for affordability for housing and transportation costs is no more than
45% of household income. The index calculates total transportation costs by adding auto ownership, auto
usage and public transit usage.
Comparing H+T and HUD maps
A major difference between H+T and HUD maps 10 and 11 is not only does it factor in public transit usage
but also personal automobile ownership and usage costs. The H+T index factors in aspects from both of
the other indexes and combines that with housing costs to find an overall wider picture of a
neighborhood’s affordability. Additionally, the H+T Affordability Index does not have a value that is used
to compare to other places in the United States. Instead, it finds a neighborhood’s affordability by
comparing the total of the housing and transportation costs to the typical household income of a region.

82
Figure 30. CNT H+T Index and Race/Ethnicity

83
Figure 30 shows the percentage of household income that housing and transportation costs take up. As a
whole, Lake County shows a high cost index for the 80% AMI households. Areas with a lower percentage
of housing and transportation costs compared to the rest of Lake County are Leesburg and Tavares. Mt.
Dora, Minneola, and Clermont all are shown as having housing and transportation costs than other areas
in Lake County.
Areas of Lake County that have low values for both the Transit Trips Index and the Low Transportation
Cost Index are shown to have higher total housing and transportation costs in Lake County.
Assessment of H+T burden by protected class.
Using Figure 30 as a reference, minority populations in Lake County tend to live in areas with high H+T
burden. The H+T burden is felt by a substantial amount of the Lake County population as the map shows
most of Lake County above the 45% benchmark for affordability on the H+T Index. Areas such as Clermont
have a large minority population and also has high H+T costs as a percentage of household income.

84
Figure 31. CNT H+T Index for 80% AMI Households and Disabled Population in Lake County
85
Figure 31 shows the H+T Index for 80% AMI households and total population with a disability in Lake
County. The areas with the most total disabled residents, for the most part are located in areas with lower
H+T costs when compared to other parts of Lake County.
Areas such as Leesburg and Tavares with lower values on the H+T index compared to the rest of Lake
County, seem to have large disabled populations. Other areas such as Clermont and Mt. Dora have large
disabled populations and also have high H+T costs.
Disabled residents do not seem to be worse off in terms of H + T costs in Lake County.

86
Figure 32. CNT H+T Index for 80% AMI Households and number of families in Lake County

87
According to Figure 32, there are many families living in the southern part of Lake County. This area shows
high H+T communities, certainly compared to areas in the northwest part of Lake County. Areas such as
Tavares and Leesburg show low total families and lower H+T costs than an area in the south of Lake County
such as Clermont.
This shows that the areas with a large number of families in Lake County may face higher H+T costs
compared to areas with a smaller share of families.

88
Figure 33. CNT H+T Index for 80% AMI Households and foreign-born population in Lake County

89
According to Figure 33, areas with a larger number of foreign born residents tend to have higher H+T
costs. This assessment is based principally on the fact that the southern portion of Lake County has higher
H+T index values than the rest of the County. At the same time, there are high concentrations of foreign
born persons living in South Lake County.
The areas of Lake County with the lowest H+T costs for 80% AMI households show a low number of foreign
born residents. Areas such as Leesburg and Tavares showcase this.
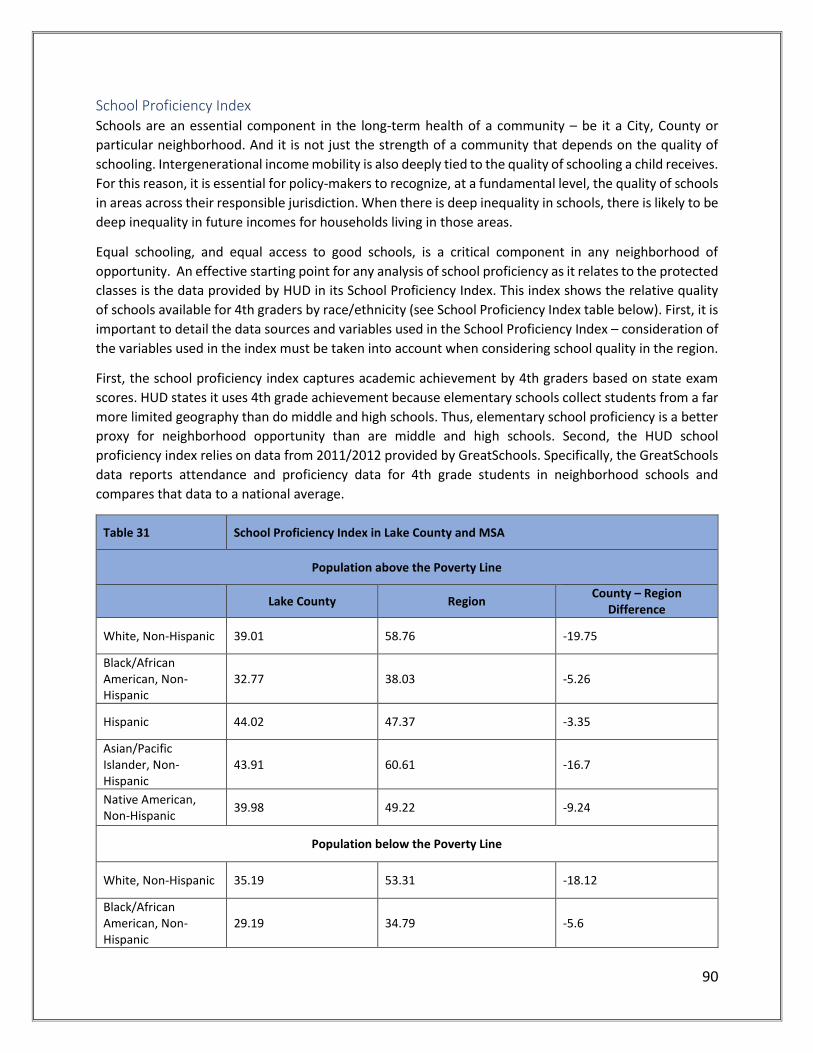
90
School Proficiency Index Schools are an essential component in the long-term health of a community – be it a City, County or
particular neighborhood. And it is not just the strength of a community that depends on the quality of
schooling. Intergenerational income mobility is also deeply tied to the quality of schooling a child receives.
For this reason, it is essential for policy-makers to recognize, at a fundamental level, the quality of schools
in areas across their responsible jurisdiction. When there is deep inequality in schools, there is likely to be
deep inequality in future incomes for households living in those areas.
Equal schooling, and equal access to good schools, is a critical component in any neighborhood of
opportunity. An effective starting point for any analysis of school proficiency as it relates to the protected
classes is the data provided by HUD in its School Proficiency Index. This index shows the relative quality
of schools available for 4th graders by race/ethnicity (see School Proficiency Index table below). First, it is
important to detail the data sources and variables used in the School Proficiency Index – consideration of
the variables used in the index must be taken into account when considering school quality in the region.
First, the school proficiency index captures academic achievement by 4th graders based on state exam
scores. HUD states it uses 4th grade achievement because elementary schools collect students from a far
more limited geography than do middle and high schools. Thus, elementary school proficiency is a better
proxy for neighborhood opportunity than are middle and high schools. Second, the HUD school
proficiency index relies on data from 2011/2012 provided by GreatSchools. Specifically, the GreatSchools
data reports attendance and proficiency data for 4th grade students in neighborhood schools and
compares that data to a national average.
Table 31 School Proficiency Index in Lake County and MSA
Population above the Poverty Line
Lake County Region County – Region
Difference
White, Non-Hispanic 39.01 58.76 -19.75
Black/African American, Non-Hispanic
32.77 38.03 -5.26
Hispanic 44.02 47.37 -3.35
Asian/Pacific Islander, Non-Hispanic
43.91 60.61 -16.7
Native American, Non-Hispanic
39.98 49.22 -9.24
Population below the Poverty Line
White, Non-Hispanic 35.19 53.31 -18.12
Black/African American, Non-Hispanic
29.19 34.79 -5.6
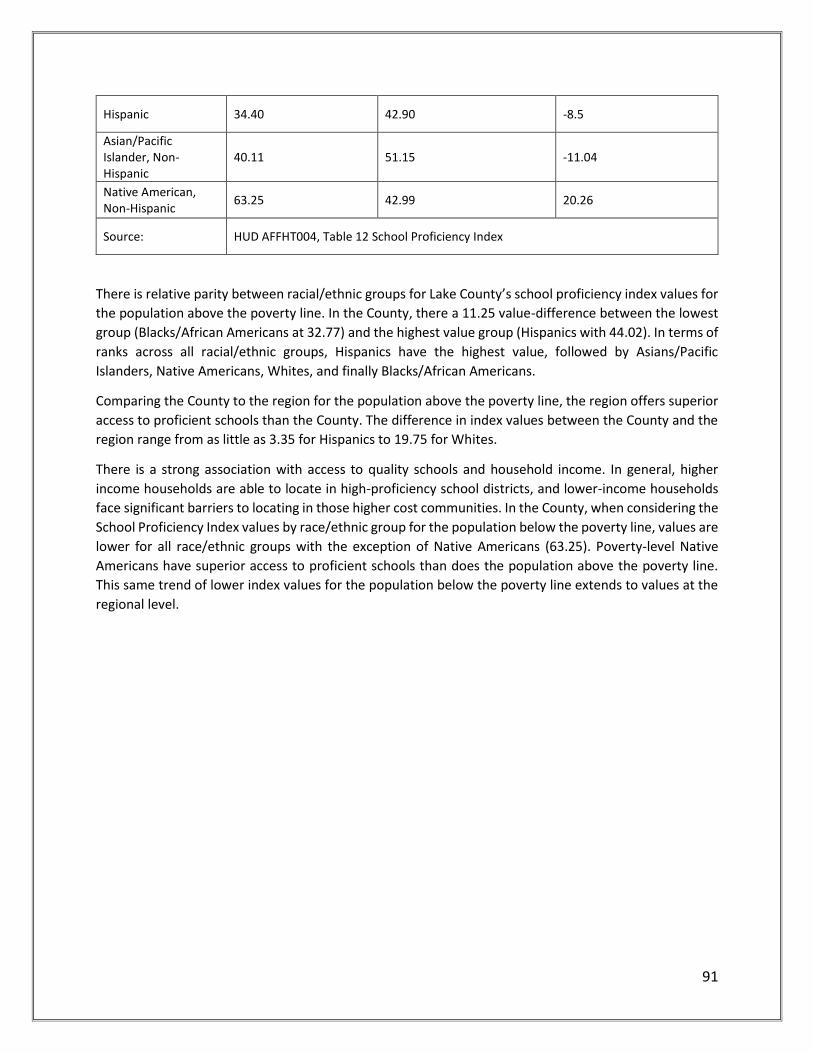
91
Hispanic 34.40 42.90 -8.5
Asian/Pacific Islander, Non-Hispanic
40.11 51.15 -11.04
Native American, Non-Hispanic
63.25 42.99 20.26
Source: HUD AFFHT004, Table 12 School Proficiency Index
There is relative parity between racial/ethnic groups for Lake County’s school proficiency index values for
the population above the poverty line. In the County, there a 11.25 value-difference between the lowest
group (Blacks/African Americans at 32.77) and the highest value group (Hispanics with 44.02). In terms of
ranks across all racial/ethnic groups, Hispanics have the highest value, followed by Asians/Pacific
Islanders, Native Americans, Whites, and finally Blacks/African Americans.
Comparing the County to the region for the population above the poverty line, the region offers superior
access to proficient schools than the County. The difference in index values between the County and the
region range from as little as 3.35 for Hispanics to 19.75 for Whites.
There is a strong association with access to quality schools and household income. In general, higher
income households are able to locate in high-proficiency school districts, and lower-income households
face significant barriers to locating in those higher cost communities. In the County, when considering the
School Proficiency Index values by race/ethnic group for the population below the poverty line, values are
lower for all race/ethnic groups with the exception of Native Americans (63.25). Poverty-level Native
Americans have superior access to proficient schools than does the population above the poverty line.
This same trend of lower index values for the population below the poverty line extends to values at the
regional level.

92
Figure 34. HUD AFFHT004, School Proficiency Index and Race/Ethnicity
Figure 34 below shows the School Proficiency Index by census tract with a race/ethnicity dot density layer.
Darker shaded areas indicate higher school quality, and lighter shaded areas show lower quality schools.
There is a clear pattern in the proficiency index scores in Lake County: neighborhoods with superior access
to quality schools are located in the Southeast, Northwest and Eastern areas of the City. It should be noted
that the high proficiency index value neighborhoods have a disproportionate share of Whites and a lack
of minority groups. This may indicate a fair housing concern, with families possibly unable to access
affordable housing, or other barriers to housing choice, in neighborhoods with better performing schools.

93 Figure 35. HUD AFFHT004, School Proficiency Index and National Origin
Figure 35 below shows the School Proficiency Index by census tract with a national origin dot density layer.
The data shows high concentrations of population by national origin in high-value census tracts,
particularly in the Clermont/Minneola area and neighborhoods on the County border. There are also high
concentrations of Mexicans in the County’s Northwest corner, also with high performing tracts.
Conversely, there appear to be significant concentrations of Jamaicans and Mexicans in low-performing
school areas, particularly in the Eustis and Leesburg areas.

94 Figure 36. HUD AFFHT004, School Proficiency Index and Familial Status
Figure 36 below shows the School Proficiency Index by census tract with a familial status proportional
symbol layer. The data shows that areas with the highest school proficiency index values are not those
with the highest concentration of families. Of particular concern is the number of households with
children in and around the Leesburg area, an area with low school proficiency index values. Similarly, there
is a significant concentration of households with children in and around the Cherry Lake area, an area with
low school proficiency index values.
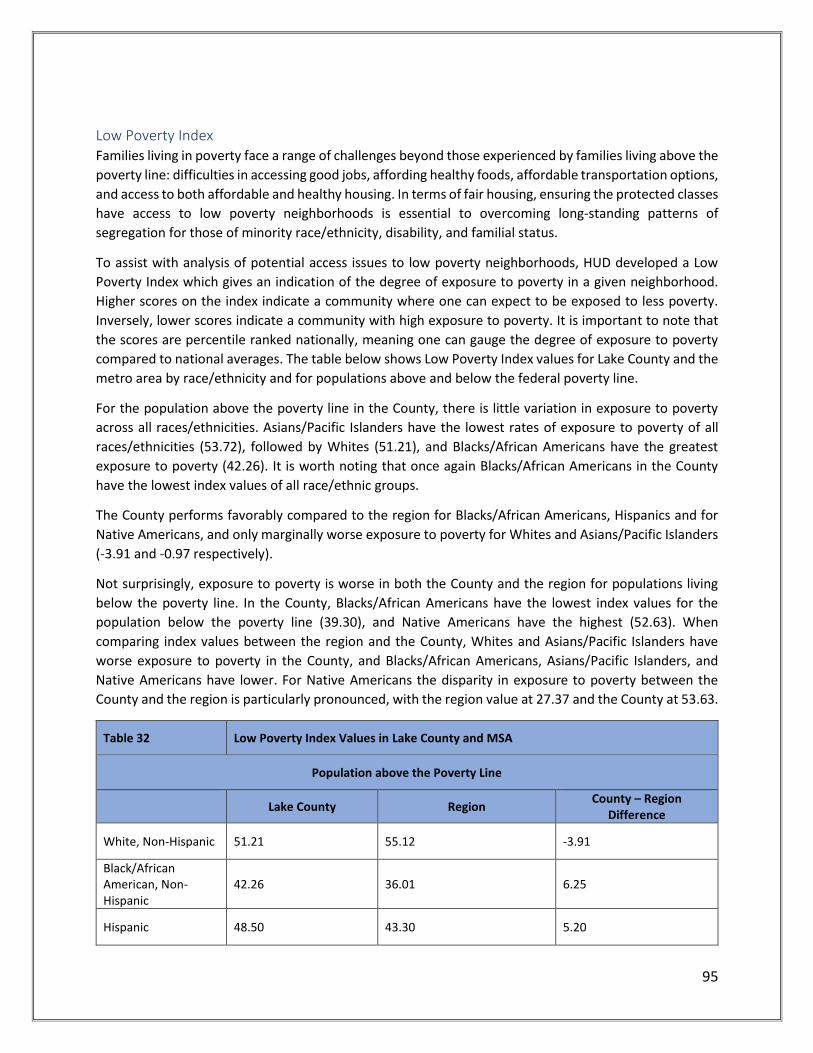
95
Low Poverty Index Families living in poverty face a range of challenges beyond those experienced by families living above the
poverty line: difficulties in accessing good jobs, affording healthy foods, affordable transportation options,
and access to both affordable and healthy housing. In terms of fair housing, ensuring the protected classes
have access to low poverty neighborhoods is essential to overcoming long-standing patterns of
segregation for those of minority race/ethnicity, disability, and familial status.
To assist with analysis of potential access issues to low poverty neighborhoods, HUD developed a Low
Poverty Index which gives an indication of the degree of exposure to poverty in a given neighborhood.
Higher scores on the index indicate a community where one can expect to be exposed to less poverty.
Inversely, lower scores indicate a community with high exposure to poverty. It is important to note that
the scores are percentile ranked nationally, meaning one can gauge the degree of exposure to poverty
compared to national averages. The table below shows Low Poverty Index values for Lake County and the
metro area by race/ethnicity and for populations above and below the federal poverty line.
For the population above the poverty line in the County, there is little variation in exposure to poverty
across all races/ethnicities. Asians/Pacific Islanders have the lowest rates of exposure to poverty of all
races/ethnicities (53.72), followed by Whites (51.21), and Blacks/African Americans have the greatest
exposure to poverty (42.26). It is worth noting that once again Blacks/African Americans in the County
have the lowest index values of all race/ethnic groups.
The County performs favorably compared to the region for Blacks/African Americans, Hispanics and for
Native Americans, and only marginally worse exposure to poverty for Whites and Asians/Pacific Islanders
(-3.91 and -0.97 respectively).
Not surprisingly, exposure to poverty is worse in both the County and the region for populations living
below the poverty line. In the County, Blacks/African Americans have the lowest index values for the
population below the poverty line (39.30), and Native Americans have the highest (52.63). When
comparing index values between the region and the County, Whites and Asians/Pacific Islanders have
worse exposure to poverty in the County, and Blacks/African Americans, Asians/Pacific Islanders, and
Native Americans have lower. For Native Americans the disparity in exposure to poverty between the
County and the region is particularly pronounced, with the region value at 27.37 and the County at 53.63.
Table 32 Low Poverty Index Values in Lake County and MSA
Population above the Poverty Line
Lake County Region County – Region
Difference
White, Non-Hispanic 51.21 55.12 -3.91
Black/African American, Non-Hispanic
42.26 36.01 6.25
Hispanic 48.50 43.30 5.20

96
Asian/Pacific Islander, Non-Hispanic
53.72 54.69 -0.97
Native American, Non-Hispanic
45.93 45.77 0.16
Population below the Poverty Line
White, Non-Hispanic 41.11 46.84 -5.73
Black/African American, Non-Hispanic
39.30 26.77 12.53
Hispanic 40.66 36.42 4.24
Asian/Pacific Islander, Non-Hispanic
49.38 51.47 -2.09
Native American, Non-Hispanic
52.63 27.37 25.26
Source: HUD AFFHT004, Table 12 Low Poverty Index

97
Figure 37. HUD AFFHT004, Low Poverty Index and Race/Ethnicity
Figure 37 below shows the Low Poverty Index mapped to census tracts in Lake County with a race/ethnic
dot density layer. Areas with the lowest index values (highest exposure to poverty) include areas in and
around Leesburg, Tavares, Mascotte, and Eustis. Areas with the highest index values (lowest exposure to
poverty) include areas in and around Montverde, Yalaha, Lady Lake, and north of SR-91 but South of Little
Lake Harris. The low index-value neighborhoods listed above have high concentrations of Blacks/African
Americans. The high-index value neighborhoods listed above have high concentrations of Whites and
Asians/Pacific Islanders.

98
Racially or Ethnically Concentrated Areas of Poverty (R/ECAPs) A racially or ethnically concentrated area of poverty (R/ECAP) is defined by HUD as census tracts where
more than half of the population is non-White and 40% or more of the population is in poverty or where
the poverty rate is greater than three times the average poverty rate in the area.
Neighborhoods within R/ECAP areas tend to have dilapidated housing, high crime rates, and disparities in
accessing a quality education for children, jobs, and services. Analyzing the intersection of race and
poverty assists in identifying the fair housing issues minorities residing in R/ECAPs face and in developing
strategies to transform these neighborhoods so that residents have better access to opportunities and
improved living conditions.
Based on the HUD definition, there are no R/ECAP areas in Lake County. However, as shown in Table 33
and Figure 38, there are several areas of minority concentration in low-income areas. An area of minority
concentration is an area where the total minority population exceeds 50% of the total population of the
area. Areas of low income concentration are areas where the percentage of families with incomes at or
below 80% AMI exceeds 50% of the total households in the area.
There are four census tracts with a minority concentration that are also areas of low income concentration
– census tracts 302.06, 305.03, 306.02, and 313.11. While these census tracts are not currently
concentrated areas of poverty, there may be neighborhoods in these areas with similar characteristics
and needs as a R/ECAP area. Two of these census tracts, 302.06 and 305.03, are located in CDBG target
areas identified in the County’s Consolidated Plan.
Table 33 High poverty and minority population census tracts in Lake County
Census Tract Jurisdiction Tract Minority % % Below Poverty
Line Low Mod %
302.06 Eustis 63.31 31.15 61.30
305.03 Leesburg 58.07 28.96 81.82
306.02 Leesburg 57.22 36.76 78.27
313.11 Unincorporated 53.87 14.36 51.27
Source: 2017 FFIEC Census Report; FY 2018 Low Mod Income Summary Data
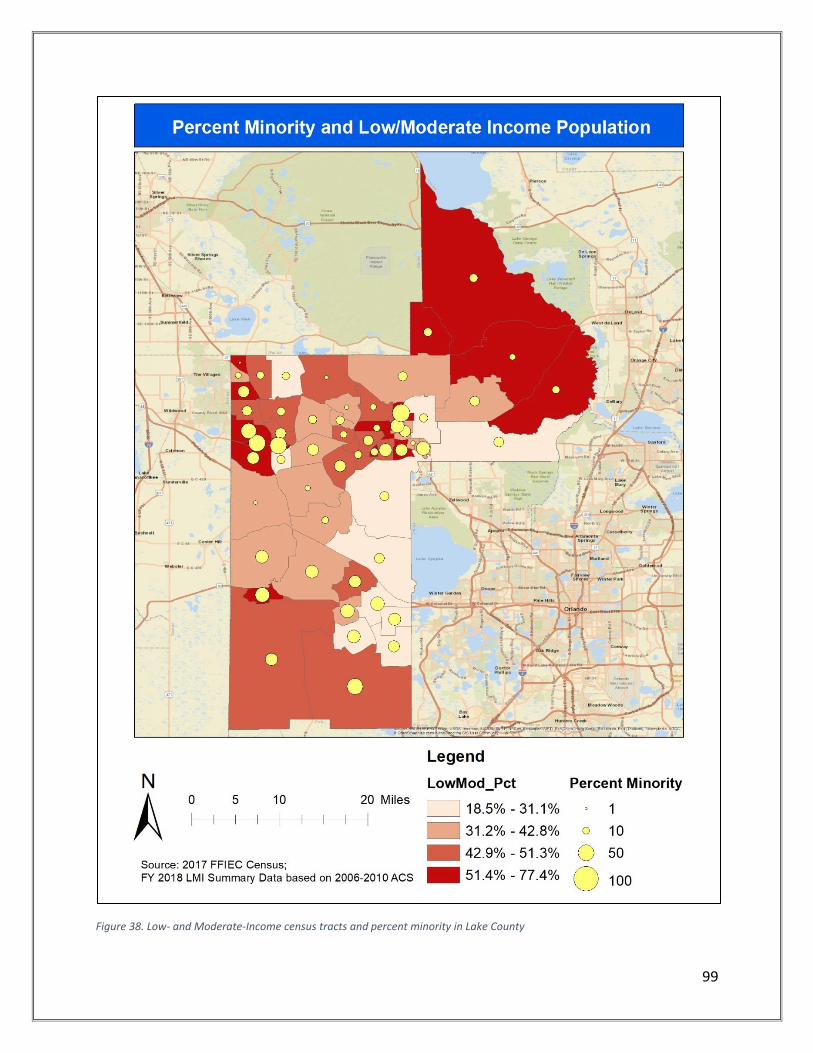
99
Figure 38. Low- and Moderate-Income census tracts and percent minority in Lake County

100
Hate Crime Data In addition to making housing discrimination unlawful, the federal Fair Housing Act also prohibits injuring,
intimidating, or interfering with any persons in the exercise of enjoyment of his or her fair housing rights
(42 U.S.C § 3631). This behavior is referred to as housing-related hate activity and includes hate crimes.
In 1990, Congress passed the Hate Crime Statistics Act, which required that the Attorney General collect
data “about crimes that manifest evidence of prejudice based on race, religion, sexual orientation, or
ethnicity.” The Attorney General delegated the responsibility to the Director of the FBI, who assigned the
task to the Uniform Crime Reporting (UCR) Program. There have been subsequent changes to hate crime
data collection over the years to capture statistics on bias against persons with disabilities, bias against a
particular gender and gender identity, and crimes committed by, and crimes directed against, juveniles. A
hate crime is defined as a criminal offense against a person or property motivated in part by an offender’s
bias against a race, religion, disability, sexual orientation, ethnicity, gender, or gender identity. It is
important to review hate crime data as a fair housing issue because the victims of hate crimes are often
members of protected classes under the Fair Housing Act.
As summarized in Table 34 below, there were nine bias-motivated incidents reported from 2010 to 2016
in Lake County including five incidents occurring in the cities of Clermont and Leesburg. Seven of the hate
crimes related to race/ethnicity or national origin while two incidents were based on sexual orientation.
Table 34 Number of incidents per bias motivation
Jurisdiction Race/Ethnicity/
Ancestry Religion
Sexual
Orientation Disability Gender
Gender
Identity
2016 Lake County 1 - - - - -
2015 Lake County 1 - - - - -
2014 Lake County - - - - - -
2013 Lake County 1 - - - - -
2012 Clermont 1 - - - - -
Leesburg 1 - - - - -
Lake County 2 - 1 - - -
2011 Leesburg - - 1 - - -
2010 Lake County - - - - - -
Total 7 0 2 0 0 0
Source: FBI UCR 2010-2016 Hate Crime Statistics

101
I. Evaluation of Jurisdiction’s Current Fair Housing Legal Status This section provides information on Lake County’s current fair housing legal status including information
about the number and type of fair housing complaints, the existence of fair housing discrimination suits
filed by the U.S. Department of Justice, as well as a discussion of other fair housing concerns or problems.
The federal Fair Housing Act is administered and enforced by HUD’s Department of Fair Housing and Equal
Opportunity (FHEO) and the Department of Justice’s Housing and Civil Enforcement Section. FHEO also
administers the Fair Housing Assistance Program (FHAP) and the Fair Housing Initiative Program (FHIP).
These programs provide funding to States, local public agencies, and non-profit organizations to assist
victims of housing discrimination and to promote awareness of fair housing laws.
In addition to the federal Fair Housing Act, the State of Florida has adopted a state fair housing law that
is enforced by the Florida Commission on Human Relations (FCHR). Title XLIV, Chapter 760 of the Florida
Statutes, Civil Rights, covers discrimination in the treatment of persons and minority representation. Part
II, the Florida Fair Housing Act, (ss. 760.20 – 760.37), prohibits discrimination in the sale, rental,
advertising, financing, or provision of brokerage services for housing. The Florida Fair Housing Act is
substantially equivalent to the federal Fair Housing Act and protects persons from housing discrimination
on the bases of race, color, religion, national origin, sex, pregnancy, disability, and familial status. In 2000,
the Florida Fair Housing Act (FFHA) was amended to include affordable housing as a protected class
(Section 760.26, Florida Statutes).
In Lake County, there are two main local fair housing enforcement agencies that enforce fair housing laws
and provide fair housing outreach and education services. They are the Florida Commission on Human
Relations (FCHR) and Community Legal Services of Mid-Florida (CLSMF). FCHR is a FHAP agency that
supports a variety of fair housing administrative and enforcement activities, including complaint
investigation, conciliation, administrative and/or judicial enforcement, training, and education and
outreach. CLSMF is a recipient of FHIP funding and carries out education, testing, and other enforcement
activities to eliminate unlawful practices in several Florida counties including Lake County. For additional
information about the enforcement of fair housing laws in Lake County see Section IV, Identification of
Impediments – Public and Private Sector.
Fair Housing Complaints or Compliance Reviews A review of fair housing complaint data is necessary to identify trends in housing discrimination in the
County in order to determine specific fair housing actions that may be needed to address the cause of any
trends. As summarized in Table 35, between 2012 and 2018, 29 fair housing cases (about 5 cases per year)
were filed in Lake County based on statistics provided by HUD and FCHR. In several of the cases,
complainants alleged discrimination based on multiple protected classes bringing the total number of
complaints filed to 42. The table shows a decline in the number of complaints from 2016 to 2018 however
this is partly due to limited information for those years - Data was received solely from HUD for 2016-
2018 and it was only available for part of 2018.

102
Housing discrimination complaints based on disability accounted for the majority of complaints
investigated. There were 19 cases of discrimination against persons with disabilities reported,
representing 45.2% of all reported cases. There were 12 cases of racial discrimination or approximately
28.6% of all reported cases in the County. Retaliation and national origin were the third and fourth most
frequent basis of discrimination at 9.5% (4 cases) and 7.1% (3 cases), respectively. There were two
complaints (4.8%) on the basis of sex followed by discrimination based on familial status and color with
one complaint (2.4%) each. There were no discrimination complaints based on religion.
Table 35 Basis for Housing Discrimination Cases Lake County (2012-2018)
2012 2013 2014 2015 2016 2017 2018 Total
Race 3 - 4 3 1 - 1 12
Disability 2 2 5 5 3 1 1 19
Familial
Status
- - 1 - - - - 1
Sex 1 - - 1 - - - 2
National
Origin
- - 2 - - - 1 3
Color - - 1 - - - - 1
Religion - - - - - - - -
Retaliation 1 - 1 2 - - - 4
Total 7 2 14 11 4 1 3 42
Source FCHR; HUD FHEO Region IV
Table 36 and Figure 39 compare Lake County’s housing complaint data to the nation and to Florida. The
basis for complaints in the County were similar to both the state and the country in that fair housing
complaints based on disability and race were the most reported type of housing discrimination. However,
disability complaints for the County were about 10% lower than the nation and the state and complaints
based on race were higher in the County than national and state percentages. There was some deviation
for the third most frequent complaint. In both the nation and Lake County, complaints classified as ‘other’
were the third most frequent basis of discrimination while in Florida, it was national origin. For national
data, ‘other’ complaints may include source of income, age, sexual orientation, and gender identity. For
Lake County data it includes retaliatory claims.
Table 36 Basis for Housing Discrimination Cases nationally, in Florida, and Lake County
Basis Nation (2016) Florida (2016) Lake County
(1-yr average)
Race 19.6% 18.9% 28.6%
Disability 55.0% 55.9% 45.2%
Familial Status 8.5% 5.9% 2.4%
Sex 7.7% 5.9% 4.8%
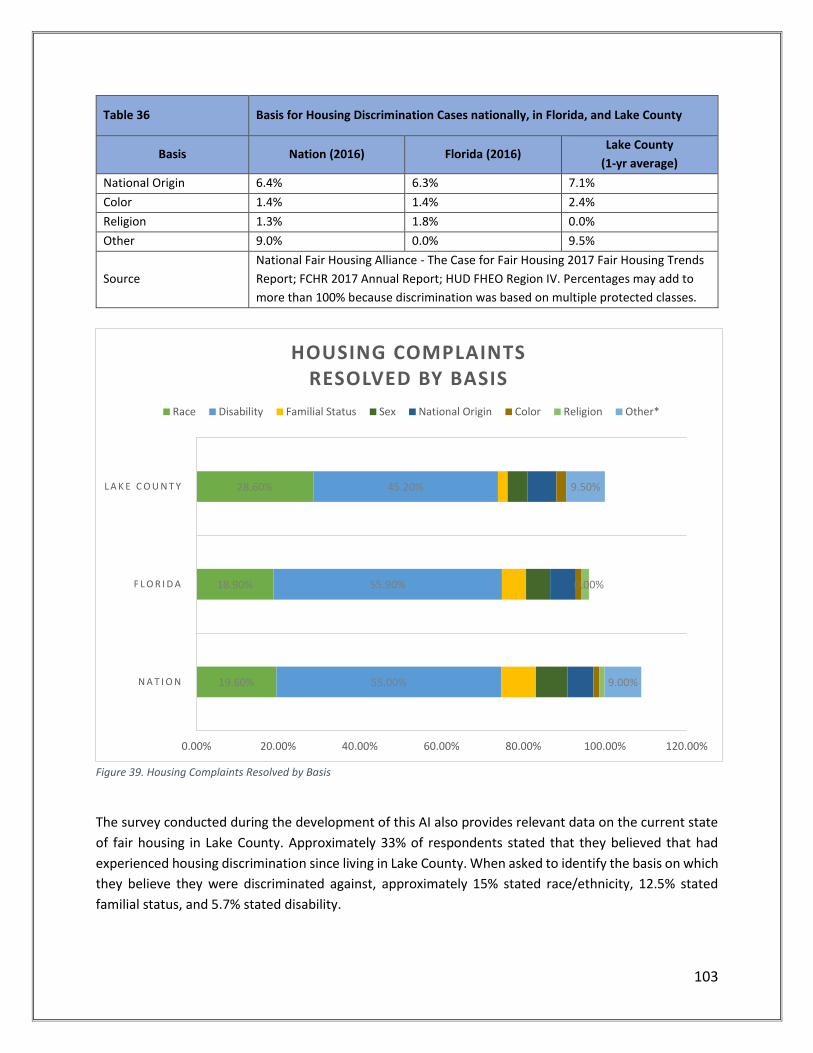
103
Table 36 Basis for Housing Discrimination Cases nationally, in Florida, and Lake County
Basis Nation (2016) Florida (2016) Lake County
(1-yr average)
National Origin 6.4% 6.3% 7.1%
Color 1.4% 1.4% 2.4%
Religion 1.3% 1.8% 0.0%
Other 9.0% 0.0% 9.5%
Source
National Fair Housing Alliance - The Case for Fair Housing 2017 Fair Housing Trends
Report; FCHR 2017 Annual Report; HUD FHEO Region IV. Percentages may add to
more than 100% because discrimination was based on multiple protected classes.
Figure 39. Housing Complaints Resolved by Basis
The survey conducted during the development of this AI also provides relevant data on the current state
of fair housing in Lake County. Approximately 33% of respondents stated that they believed that had
experienced housing discrimination since living in Lake County. When asked to identify the basis on which
they believe they were discriminated against, approximately 15% stated race/ethnicity, 12.5% stated
familial status, and 5.7% stated disability.
19.60%
18.90%
28.60%
55.00%
55.90%
45.20%
9.00%
0.00%
9.50%
0.00% 20.00% 40.00% 60.00% 80.00% 100.00% 120.00%
N A T I O N
F L O R I D A
L A K E C O U N T Y
HOUSING COMPLAINTS RESOLVED BY BASIS
Race Disability Familial Status Sex National Origin Color Religion Other*

104
The review of fair housing complaint data is not enough to identify the fair housing issues in the County
since complaints are based on allegations of unlawful discrimination. Fair housing issues may also be
identified through a review of the disposition of the cases. The 29 cases reviewed were resolved in the
following ways:
Complainant failed to cooperate – 3 cases or 10.3%;
No cause determination – 17 cases or 58.6%;
Conciliation or settlement successful – 3 cases or 10.3%;
Administrative closure – 3 cases or 10.3%; and
Open – 3 cases or 10.3%.
The high number of cases that were found to have no cause may indicate an individual’s lack of awareness
about their rights under the fair housing laws. This may also contribute to the under-reporting of
discrimination and supports the need for additional fair housing education. The need for fair housing
education is also supported by the AI survey where only about half of the respondents (56.8%) stated that
they felt they understood their fair housing rights. Additionally, the nature of the complaints that were
found to have cause may indicate the need for education and outreach on specific protections. The three
cases that were settled successfully were for complaints based on disability, suggesting the need to raise
awareness about specific protections for persons with disabilities.
Based on the review of the complaint data, there may be a need to revise the County’s fair housing actions
from those identified in the previous AI. In the County’s 2005 AI, one component of the Fair Housing
Action Plan included a partnership between the County and Alianza for Fair Housing to sponsor fair
housing workshops targeted to minority populations and housing providers due to the potential for
discrimination against Section 8 tenants when they attempted to select housing. Since 2012, the
complaint data shows that most of the housing discrimination complaints filed with the fair housing
enforcement agencies have been on based on discrimination against persons with disabilities. While there
is still a high percentage of racial discrimination complaints, the fair housing actions going forward should
also emphasize outreach, education, and information on the fair housing laws as it pertains to persons
with disabilities. This should include actions that address the refusal of housing providers to rent to
persons with disabilities, failure to grant reasonable accommodation or modifications to persons with
disabilities, and failure to provide accessible and usable public and common areas.
Fair Housing Discrimination Suit filed by Department of Justice There is no unresolved letter of findings issued by or lawsuits filed or joined by the Department of Justice
alleging a pattern or practice or systemic violation of a fair housing or civil rights law against the County.
There is also no claim under the False Claims Act related to fair housing, nondiscrimination, or civil rights
generally, including an alleged failure to affirmatively further fair housing.

105
Reasons for any trends or patterns The National Fair Housing Alliance stated in its 2017 Fair Housing Trends Report that the large number of
complaints based on disability can be partially attributed to the fact that disability cases are often more
overt and more easily detected than other types of housing discrimination.
Other Fair Housing Concerns or Problems As mentioned above, the FFHA has been certified by HUD as being substantially equivalent to the federal
Fair Housing Act. However, in 2008, HUD informed FCHR that the state court judicial interpretation of the
FFHA in the Belletete vs. Halford case, made the state law inconsistent with federal law. Specifically, the
FFHA requires the exhaustion of administrative remedies before pursuing a civil action which is
inconsistent with the federal law. Due to HUD’s finding, FCHR is at risk of losing FHAP funding. Efforts
made to amend the FFHA during the 2012, 2013, 2014, and 2016 legislative sessions were unsuccessful
however as of March 2016, HUD refrained from making a decision regarding suspension due to pending
judicial proceedings in the Third District Court of Appeal. The most recent attempt to amend the law was
made in 2018 (House Bill 853) and in March 2018, the bill was indefinitely postponed and withdrawn from
consideration in the Senate. Although this concern is specific to Florida, in general, both FHAP and FHIP
have been historically underfunded. This can result in a lack of local fair housing outreach and
enforcement and the continuation of discriminatory practices.

106
II. Identification of Impediments
Zoning and Site Selection Zoning ordinances directly impact housing choice by either supporting or limiting availability, location, or
types of housing in the community. Zoning determines where housing can be built, the type of housing
that is allowed, and the form it takes. Regulations can directly or indirectly affect the cost of developing
housing, making it harder or easier to accommodate affordable housing. It is important to review zoning
ordinances and regulations to identify any potential barriers to fair housing.
Studies have shown that “anti-density zoning,” which calls for large lot sizes for single-family houses or
restrictions on apartment development, can increase housing prices and reduce the local supply of single-
and multi-family units.
Density is the maximum average number of housing units per acre that may be built within a particular
designated area. Zoning Commissions regulate density through ordinances that establish limits on the
number of units per acre. The density allowed in a given zone has a direct influence on the cost of
development, and by extension on building affordable housing. The lower the number of allowed units
per acre, the more expensive that housing will be to be build. If maximum density is low, affordable
housing developers must acquire larger plots of land to build more units. The density allowed in a
particular zoning district is an important consideration for multifamily development. Permitted
multifamily densities vary from one jurisdiction to another, as the data below illustrates, however in some
areas the densities are kept so low that multifamily development may be impractical.
Zoning ordinances may also set a minimum size for parcels of land. Large minimum lot sizes translate into
increased land acquisition costs for developers in order to comply with the regulations.
Minimum floor areas establish that a building cannot be smaller than a certain size. This is one of the
principal methods used by zoning commissions to regulate the size of buildings. If the minimum floor area
is set at a high level, floor area regulations can restrict affordable housing development. High floor area
specifications encourage the construction of large housing units that are naturally more expensive,
making them too expensive for low- and moderate-income households.
Lake County’s zoning ordinance is intended to allow development and use of property only in compliance
with the goals, objectives and policies of Lake County as expressed in the Lake County Comprehensive
Plan. The county has 13 districts zoned for residential use, four of which allow for duplexes or multi-family
housing development. The districts permitting multi-family housing primarily allow for medium density
development. The Multi-Family Residential District allows for the highest density at 10 dwelling units per
acre. The standards set in Lake County’s zoning ordinance are comparable to other counties of similar
suburban/rural character. For instance, Polk County in Florida also sets a maximum 10 dwelling units per
acre in its highest density zone and has a similar escalating residential density model as shown here.
Table 37 Lake County Zoning
District Maximum
Density
Minimum
Structure Size (sq.
ft.)
Height (feet) Count of Areas in
County

107
Ranchette District RA 1 DU/5 AC 850 40 479
Agricultural Residential AR 1 DU/2 AC 1,000 40 949
Rural Residential R1 1 DU/AC 900 40 11,373
Estate Residential R2 2 DU/AC 1,500 40 1,524
Medium Residential R3 3 DU/AC 1,500 40 5,507
Medium Suburban
Residential R4 4 DU/AC 1,200 40 1,484
Urban Residential R6 6 DU/AC 1,200 40 13,856
Mixed Residential R7 8 DU/AC 850 40 3,895
Multi-Family Residential R10 10 DU/AC 850 40 -
Residential Professional RP 8 DU/AC 1,200 40 974
Mixed Home Residential RM 8 DU/AC 800 40 5,528
Mobile Home Rental Park RMRP 8 DU/AC - 40 1,738
Recreational Vehicle Park RV - - 40 1
Lake County has several districts specifically zoned for low or medium density single-family homes. The
Estate Residential District could be considered a barrier to fair housing as its purpose is to “encourage the
retention and development of suitable areas for select types of residential development at a low density,
such as detached high and medium value country estates for single-family use; and discourage the
creation or continuation of conditions which could detract from the function, operation and appearances
of rural areas by permitting uses of land and densities of population which more properly belong in urban
places”. This zoning ordinance may impede fair housing as it limits access to developable land where high
density affordable housing could be developed.
A review of the location of estate residential zoning identified a total of 1,524 areas across the County.
These areas are almost exclusively located adjacent to bodies of water, presumably due to attractive
views. A majority of the areas are North of SR-91 Florida Turnpike (896 zones). It is reasonable to conclude

108
that the Estate Residential zone is inflating the cost of land, but due to the low land area consumed by the
zone its impact on affordability in the County overall is negligible.
Lake County has numerous planned unit developments (PUD), spread across both North and South Lake
County. In total, there are 21,980 areas designated as a PUD across the county. PUDs are independent
zones with unique design characteristics, zoning codes, and in many cases delegated authority to local
planning, zoning, and town council membership. PUDs are, in many cases, a separate town. PUDs in Lake
County are spread across the region, with a heavy concentration in southeast and east Lake County. Given
the extent of PUDs in the County and given the characteristic restrictive zoning densities of many PUDs, it
is possible PUDs may serve as a barrier to fair housing in Lake County.

109
Figure 40. Lake County Zoning
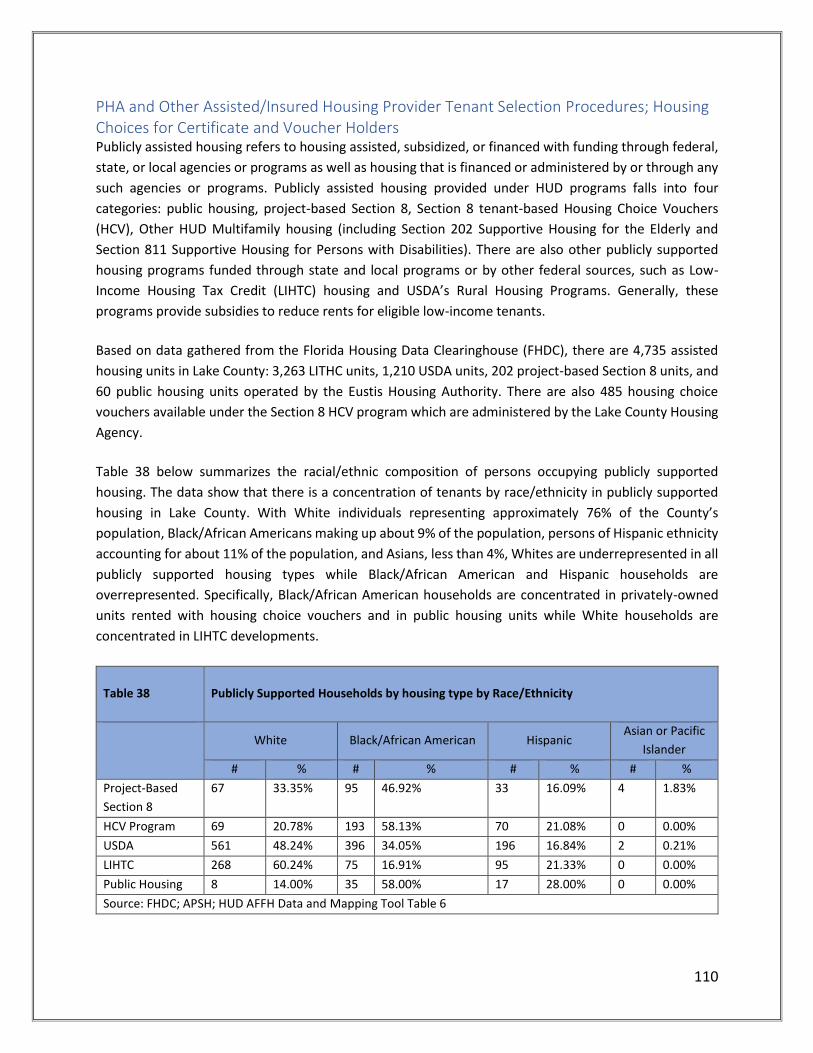
110
PHA and Other Assisted/Insured Housing Provider Tenant Selection Procedures; Housing Choices for Certificate and Voucher Holders Publicly assisted housing refers to housing assisted, subsidized, or financed with funding through federal,
state, or local agencies or programs as well as housing that is financed or administered by or through any
such agencies or programs. Publicly assisted housing provided under HUD programs falls into four
categories: public housing, project-based Section 8, Section 8 tenant-based Housing Choice Vouchers
(HCV), Other HUD Multifamily housing (including Section 202 Supportive Housing for the Elderly and
Section 811 Supportive Housing for Persons with Disabilities). There are also other publicly supported
housing programs funded through state and local programs or by other federal sources, such as Low-
Income Housing Tax Credit (LIHTC) housing and USDA’s Rural Housing Programs. Generally, these
programs provide subsidies to reduce rents for eligible low-income tenants.
Based on data gathered from the Florida Housing Data Clearinghouse (FHDC), there are 4,735 assisted
housing units in Lake County: 3,263 LITHC units, 1,210 USDA units, 202 project-based Section 8 units, and
60 public housing units operated by the Eustis Housing Authority. There are also 485 housing choice
vouchers available under the Section 8 HCV program which are administered by the Lake County Housing
Agency.
Table 38 below summarizes the racial/ethnic composition of persons occupying publicly supported
housing. The data show that there is a concentration of tenants by race/ethnicity in publicly supported
housing in Lake County. With White individuals representing approximately 76% of the County’s
population, Black/African Americans making up about 9% of the population, persons of Hispanic ethnicity
accounting for about 11% of the population, and Asians, less than 4%, Whites are underrepresented in all
publicly supported housing types while Black/African American and Hispanic households are
overrepresented. Specifically, Black/African American households are concentrated in privately-owned
units rented with housing choice vouchers and in public housing units while White households are
concentrated in LIHTC developments.
Table 38 Publicly Supported Households by housing type by Race/Ethnicity
White Black/African American Hispanic Asian or Pacific
Islander
# % # % # % # %
Project-Based
Section 8
67 33.35% 95 46.92% 33 16.09% 4 1.83%
HCV Program 69 20.78% 193 58.13% 70 21.08% 0 0.00%
USDA 561 48.24% 396 34.05% 196 16.84% 2 0.21%
LIHTC 268 60.24% 75 16.91% 95 21.33% 0 0.00%
Public Housing 8 14.00% 35 58.00% 17 28.00% 0 0.00%
Source: FHDC; APSH; HUD AFFH Data and Mapping Tool Table 6

111
Section 8 Housing Choice Voucher Program Application and Tenant Selection Policies The Section 8 Housing Choice Voucher Program is a federal program for assisting very low-income families,
the elderly, and the disabled to secure affordable, decent, safe, and sanitary housing in the private market.
Housing assistance is provided on behalf of the family or individual, and participants are able to find their
own housing, including single-family homes, townhouses and apartments. The participant is free to
choose any housing that meets the requirements of the program and is not limited to units located in
subsidized housing projects. Housing choice vouchers are administered locally by public housing agencies
(PHAs). A housing subsidy is paid to the landlord directly by the PHA on behalf of the participating family.
The family then pays the difference between the actual rent charged by the landlord and the amount
subsidized by the program. Eligibility for a housing voucher is determined by the PHA based on the total
annual gross income and family. In general, the family's income may not exceed 50% of the median
income for the county or metropolitan area in which the family chooses to live.
The Section 8 HCV Program in Lake County is operated by the Lake County Housing Agency, which is a part
of the Housing & Community Development Division of the Community Services Department. The Lake
County Housing Agency administers 485 vouchers providing assistance to 1,303 individuals. With the high
demand for rental assistance, the program has been operating off a waiting list that is currently closed.
Lake County plans to reopen the waiting list in the fall of 2019. As of June 2018, there are 544 applicants
on the waiting list including 344 families with children, 12 elderly applicants, and 6 disabled applicants. In
terms of racial composition, 74% of the applicants are Black/ African American, 23% are White, less than
1% are some other race, and 3% are of Hispanic ethnicity.
A review of the admission and occupancy policies of the Lake County Housing Agency was conducted to
determine if the policies contribute to the concentration of minorities in publicly supported housing. Lake
County Housing Agency is responsible for selecting families for admission to the HCV Program by
reviewing the application of interested families to determine whether applicants are eligible for the
program. The 2015-2019 PHA Administrative Plan for the Lake County Housing Agency covers the
following policies as well as several others:
Tenant selection policies and admission of applicants from the waiting list, including any
admission preferences;
Policies for issuing or denying vouchers, including extensions or suspensions of the voucher term;
Occupancy policies and standards for denying admission or terminating assistance based on
criminal activity or alcohol abuse; and
Desegregation policies to encourage participation by property owners of suitable units located
outside areas of low income or minority concentration;
Nondiscrimination Policy
Lake County Housing Agency must certify that it will carry out the HCV program in conformity with several
federal laws, including the Fair Housing Act. In addition to the protected classes covered by the Fair
Housing Act, the Lake County Housing Agency also prohibits discrimination on the basis of marital status
or sexual orientation. If an applicant or participant in the HCV program believes that they have been
112
subjected to unlawful discrimination, they may notify the Lake County Housing Agency and complete a
discrimination complaint form. The Lake County Housing Agency provides a copy of the form to the
complainant and provides them with information on how to submit the form to HUD’s Office of Fair
Housing and Equal Opportunity.
Policies for admitting persons with disabilities
The Lake County Housing Agency is required to make reasonable accommodation in its rules, policies, and
practices to afford a person with a disability equal opportunity to use and enjoy the program or dwelling
under the program. To accomplish this, Lake County Housing Agency asks all participants and applicants
if they require any type of accommodation and provides a specific contact for requests for
accommodations for persons with disabilities. The PHA encourages families to make any requests in
writing using a reasonable accommodation request from. However, the agency does consider any request
whether or not it is submitted in writing. The agency responds to any request for reasonable
accommodation with 10 business days. If a request for accommodation is denied because it is not
reasonable, the agency will discuss an alternative accommodation.
To meet the needs of persons with hearing impairments, TTD/TTY communication is available and to meet
the needs of persons with vision impairments, large-print and audio versions of key program documents
are available upon request. Additional alternative forms of communication are available including sign
language interpretation, having material explained orally by staff, or having a third-party representative
receive, interpret, or explain housing material and be present at all meetings.
Lake County Housing Agency is in compliance with all federal regulations pertaining to the physical
accessibility of units. When issuing a voucher to a family that includes an individual with a disability, the
agency includes a current list of available accessible units and assists the family with locating a suitable
unit. Property owners must permit the family to make reasonable modifications to a unit.
Policies related to criminal records
Applicants to the HCV program may be denied assistance for several reasons including exceeding the
income limits of the program – 100% of all families admitted to the program must be low-income and 75%
of all families must be extremely low-income, being a noncitizen without eligible immigration status or
an individual without a social security number, being evicted from federally-assisted housing in the last 3
years for a drug-related criminal activity, or currently using or has a pattern of using illegal drugs or
alcohol, which threatens the health or safety of other residents. The PHA may also deny assistance if a
household member was engaged in or has engaged drug-related criminal activity or violent criminal
activity, within five years before the family would receive assistance or criminal activity that threatens the
health, safety or right to peaceful enjoyment of the premises by residents or persons residing in the
immediate vicinity or threatens property owners, management staff, or PHA staff or contractors.
In April 2016, HUD issued legal guidance that states housing providers, both in the public and private
housing market, likely violate the Fair Housing Act when employing blanket policies in refusing to rent or
renew a lease based on an individual’s criminal history since such policies may have a disparate impact on

113
racial minorities. The Lake County Housing Agency performs criminal background checks for every adult
household member that applies for assistance however, when making the decision to deny assistance
based on criminal record, the agency considers the following factors and may on a case-by-case basis,
decide not to deny assistance:
the seriousness of the case, especially with respect to how it would affect other residents;
the effects of the denial of assistance may have on other members of the family who were not
involved in the action;
the extent of participation or culpability of individual family members;
the length of time since the violation occurred, the family’s recent history and the likelihood of
favorable conduct in the future; and
in the case of drug or alcohol abuse, the culpable household member is participating in or has
successfully completed a supervised drug or alcohol rehabilitation programs or has been
rehabilitated successfully.
Tenant Screening
The Lake County Housing Agency does not conduct screening to determine a family’s suitability for
tenancy. Tenant screening of applicants is the responsibility of the property owner. The agency informs
property owners of their responsibility to screen prospective tenants and provides the owner with
information on the family’s current and prior address and the name and address of the owner at the
current and prior addresses. The PHA does not provide the owner with information on tenant history,
criminal history, or other factors.
Application, Waiting List, and Tenant Selection Policies
Applicants to the Section 8 HCV program have a one-or two-step application process before they are
placed on the waiting list. The application process depends on the when the PHA expects the family to be
selected from the waiting list. If selection is within 60 days of the date of the application, the one-step
process is applied meaning that the applicant must provide all necessary information to determine
eligibility and the level of assistance. The two-step process is used if the family will not be selected within
60 days and requires that the family provide information for an initial assessment of eligibility and provide
all of the necessary information once the family is selected from the waiting list.
The City of Leesburg Section 8 HCV Program was transferred to Lake County and as such, the Lake County
Housing Agency uses two waiting lists for admission to the Section 8 HCV program – the Lake County list
and the City of Leesburg list. Applicants on the Lake County list are offered assistance when voucher slots
become available in the original Lake County program, and applicants on the City of Leesburg list are
offered assistance when the slots become available in the Leesburg program. The agency plans to use a
single waiting list for admission to the program when both waiting lists are exhausted.
Lake County Housing Agency has established local preferences for selecting applicants from the waiting
list. The preference categories are 1) Elderly-Disabled Preference, 2) Elderly Preference, 3) Disabled
Preference, and 4) No Preference.

114
Deconcentration Policy
Figure 41 shows the rate of Section 8 HCV utilization in Lake County. The darker shaded areas indicate a
greater percent of HCV units. Based on the map, vouchers are more concentrated in the City of Leesburg
and surrounding areas, as well as Tavares.
To ensure that voucher holders have access to housing outside areas of poverty or minority concentration,
the agency ensures that there are a sufficient number of property owners willing to participate in the HCV
program. To accomplish this, the Lake County Housing Agency conducts owner outreach to inform them
about the program and to recruit property owners. Outreach strategies include distributing printed
material about the program to property owners and managers, contacting property owners and managers
by phone or in-persons, holding owner recruitment or information meetings at least once a year,
participating in community-based organizations that include owners and managers of private rental
property, and developing working relations with owners and real estate broker associations.
It is also the agency’s policy to conduct targeted outreach to populations that it determines are being
underserved. The agency provides a listing of property owners that indicate their interest in participating
in the program to applicants as part of the informational briefing packet.
Based on the review of the PHA’s Administrative Plan, the policies and procedures of the Lake County
Housing Agency are consistent with the requirements of federal law and HUD regulations and guidance.
However, the community participation process during the development of the AI did identify several fair
housing issues that may impact housing choice voucher holders:
The overall lack of rental housing in the County;
Difficulty finding landlords that accept Section 8 vouchers although units are advertised for lease;
High application fees;
Refusal to rent to individuals due to rental history, prior eviction, criminal record, or credit issues;
and;
Concentration of affordable housing in predominantly minority areas.
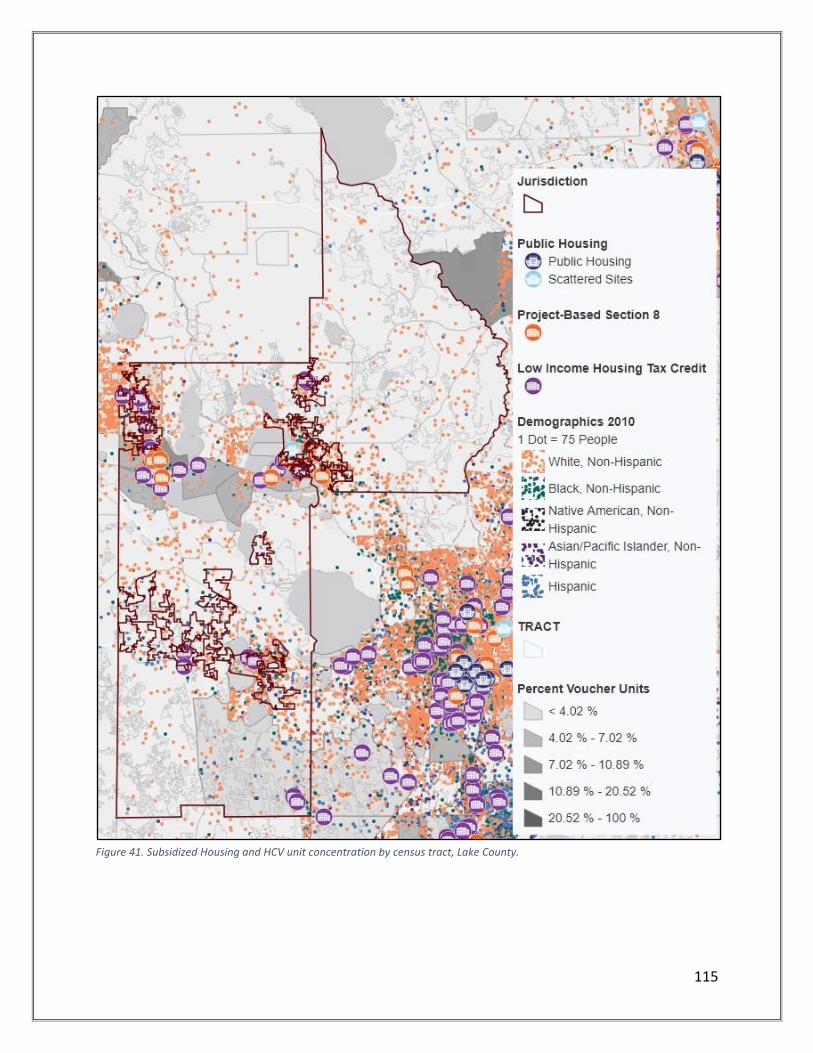
115
Figure 41. Subsidized Housing and HCV unit concentration by census tract, Lake County.

116
Sale of Subsidized Housing and Possible Displacement Lake County adheres to HUD regulations regarding the sale of subsidized homes when administering the
Community Development Block Grant program. Lake County has policies in place for federally assisted
homes that are sold or transferred in any way. Lake County administers a homeownership and housing
rehabilitation program. In the interest of protecting the affordability of homes that are rehabilitated or
purchased utilizing federal assistance, the County has implemented policies requiring a certain amount to
be paid back to the jurisdiction upon the sale of the home. The policies currently in place for the
homeownership and housing rehabilitation programs are as follows:
Homeownership Program
Assistance is in the form of a deferred second mortgage which is forgiven after 15 years.
No payments are due if the borrower lives in the home for the term of the mortgage; however, a
lien held by the County is placed on the home during the mortgage period.
If, before the 15 years have elapsed, the home is sold, ceases to be the principal residence of the
borrower, the borrower refinances with cash out or uses the home as collateral for a home equity
line of credit, the loan must be repaid in its entirety within 30 days of closing.
The loan does not need to be repaid if the refinancing was to obtain a lower fixed interest rate,
or to create additional living space due to an increase in family size.
Housing Rehabilitation Program
Interest-free deferred payment loan to qualified, eligible applicants.
All loans are deferred until point of sale, transfer of title, moving, refinancing with a cash payout,
refinancing with higher interest rate, refinance with more than 2% lender’s fees, or failure to
occupy the home.
Home repair/rehabilitation loans are forgiven after fifteen years provided the applicant continues
to live in the home; loans for home replacement have a term of fifteen years.
There are also two Housing authorities in Lake County: the Lake County Housing Agency and the Eustis
Housing Authority. The Lake County Housing Agency administers the Section 8 program only. Lake County
has 485 vouchers issued and 135 port-in vouchers that are served monthly.
The Eustis Housing Authority currently owns and operates 60 units of public housing. Public housing units
are reserved for low-income families. Residents who live in public housing units pay 30% of the monthly
adjusted income. Subsidy from HUD provides the additional funding required for managing the units. The
Eustis Housing Authority also owns and operates 56 units of rural housing for farm workers. Due to the
diminished farm worker population in the area, the Authority has received a waiver to house any family
that meets the low-income criteria. Priority will be given to farm worker families.
There is no expectation for the sale of subsidized housing through the Lake County Housing Agency or
Eustis Housing Authority. The Lake County Housing Agency does not own or operate any public housing
developments or units. Further, though the farm worker population in the area has decreased,
farmworker housing units will not be lost or sold, but rather utilized to house low-income families when
units are available.
117
Property Tax Policies Lake County has established certain property tax exemptions for populations meeting criteria for
seniors, year-round residents, the disabled, veterans/military, first responders, and widows. A list of
property tax exemptions in Lake County is listed below:
Homestead exemption. For property used as a permanent residence.
Widow/widower exemption. Reduces the assessed value of property by $500. Given the smalladjustment, the exemption provides only a minimal realized tax savings of approximately $10annually.
First responder fallen hero exemption. The un-remarried, surviving spouse of a law enforcementofficer, correctional officer, firefighter, emergency medical technician or paramedic may receive100% exemption on property taxes.
Disability exemption. Reduces the assess value of property by $500. Given the small adjustment,the exemption provides only a minimal realized tax savings of approximately $10 annually.Applicants must submit an application along with a statement, verifying that he/she is totally andpermanently disabled, as submitted by a licensed Florida physician.
Limited income senior exemption. As provided by Florida law, for senior citizens over 65 years ofage, provides up to $50,000 off the assessed value of a permanent residence. The adjusted grosshousehold income cannot exceed $29,454.
Additional limited income senior exemptions for 25-year residency. As authorized by the state ofFlorida, exempts the assessed value of a property in which one has resided in for no less than 25years, and the just value of the property is less than $250,000. Lake County adopted thisexemption.
Military/Veterans. There are multiple property tax exemptions for the military and veterans.There is a $5,000 service connected disability exemption, combat related disability exemption, aservice-connected total and permanent disability exemption, and a deployed service memberproperty tax exemption. These exemptions are authorized by the state of Florida and adopted byLake County.
Total and permanent disability exemption. There is a total property tax exemption for real estateused and owned as a Homestead property by a quadriplegic, paraplegic, hemiplegic, or othertotally and permanent disabled person who must use a wheelchair for mobility or who is legallyblind.
118
Planning and Zoning Boards The Lake County Planning and Zoning Board as well as other boards and committees established by the
Lake County Board of County Commissioners have the ability to make decisions regarding issues that
impact fair housing choice and access to opportunity. In an effort to affirmatively further fair housing,
County boards and committees should be representative of the residents of the community and include
diverse members from lower-income racial and ethnic groups, gender categories, persons with
disabilities, and families with children.
Section 760.80, Florida Statutes addresses minority representation on boards, commissions, councils, and
committees. The statute recognizes the importance of balance in the appointment of minority and
nonminority persons to decision-making and regulatory boards, commissions, councils, and committees.
The statute also promotes the inclusion of persons with physical disabilities on such panels. Membership
to boards, commissions, councils, and committees should also be selected from the best-qualified
candidates. In addition, the appointing authority should select, from qualified persons, persons that
reflect the proportion each group of minority persons in the population of the area represented by the
board, commission, council, or committee, as determined by the decennial census unless the law requires
otherwise, or persons of the underrepresented minority group cannot be recruited.
A description of fair housing related advisory boards, councils, committees and authorities in Lake County
is provided below along with the duties of the panel, membership, and where information is available,
the demographic characteristics of the members.
Lake County Planning and Zoning Board
The Lake County Planning and Zoning Board and the Lake County Local Planning Agency were established
by Ordinance No. 2004-13 on March 16, 2004. The Ordinance dissolved the Planning and Zoning
Commission and replaced it with the Planning and Zoning Board. The Planning and Zoning Board is
responsible for reviewing proposed changes to existing zoning on a development specific basis, evaluating
conformance with the Lake County Comprehensive Plan, and making recommendations to the Board of
County Commissioners for adoption. The Planning and Zoning Board has nine members from the following
categories:
One member from each of the five County Commission districts;
One citizen at-large;
One representative from the Lake County School Board;
One alternate member from the Lake County School Board; and
One ex-officio, non-voting representative of a military installation acting on behalf of all military
installations within Lake County.
The current membership of the Planning and Zoning Board includes eight (89%) White individuals and one
(11%) person of Hispanic ethnicity. There are five (56%) male members and four (44%) female members.
None of the members of the Planning and Zoning Board report having a disability.
119
Lake County Affordable Housing Advisory Committee
Lake County is a recipient of state funding under the State Housing Initiatives Partnership (SHIP) program.
SHIP was enacted by the Sadowski Act in 1992 as a dedicated revenue source for affordable housing. Each
local government that receives SHIP funding is statutorily required to assemble an Affordable Housing
Advisory Committee (AHAC). The purpose of the AHAC is to recommend housing strategies to incentivize
the production of affordable housing. Section 420.9076 (2), Florida Statutes outlines the requirements for
the composition of an AHAC. The AHAC must have at least eight members representing at least six
categories. However, local governments may elect to have up to eleven committee members.
Representatives are to be selected from the following categories:
Citizen who is actively engaged in the residential home building industry in connection with
affordable housing.
Citizen who is actively engaged in the banking or mortgage banking industry in connection with
affordable housing.
Citizen who is a representative of those areas of labor actively engaged in home building in
connection with affordable housing.
Citizen who is actively engaged as an advocate for low‐income persons in connection with
affordable housing.
Citizen who is actively engaged as a for‐profit provider of affordable housing.
Citizen who is actively engaged as a not‐for‐profit provider of affordable housing.
Citizen who is actively engaged as a real estate professional in connection with affordable housing.
Citizen who is actively serving on the local planning agency pursuant to Florida Statutes, Sec.
163.3174.
Citizen who is residing within the jurisdiction of the local governing body making the
appointments.
Citizen who represents employers within the jurisdiction.
Citizen who represents essential services personnel, as defined in the local housing assistance
plan.
As of January 2018, there were nine members on the Lake County AHAC and two vacancies. The current
membership includes six males (66%) and three (33%) females.
Board of Adjustment
The Board of Adjustment reviews applications that have been submitted for a variance to the Land
Development Regulations. The Board approves or denies the applications based upon staff reports and
evidence submitted during the hearing, taking into consideration the applicant’s and other testimony in
favor or against the request. The Board of Adjustment is comprised of seven members from the following
categories:
Five qualified electors of Lake County, one from each County Commission district
Two qualified electors of Lake County serving as at-large members

120
Currently there are five (71%) male members and two (29%) female members.
Elder Affairs Coordinating Council
The Elder Affairs Coordinating Council provides the Board of County Commissioners with information
regarding existing programs and facilities serving the needs of elders in Lake County. The Council
recommends policies and develops strategies that will address the needs of elders, improves community
awareness and increases access to services for elders, assists in the coordination of the elder service
delivery system and serves as an advocate for elder issues. This council is to be comprised of 13 members
as follows:
Two members from each of the five County Commission districts
Three at-large members
Currently there are 12 members of the Elder Affairs Coordinating Council: two (16%) males and ten (83%)
females.
Mount Plymouth-Sorrento Advisory Committee
The Mt. Plymouth-Sorrento Community Redevelopment Advisory Committee advises the Board of County
Commissioners on issues related to the creation, operation and functions of the Mt. Plymouth-Sorrento
Redevelopment Agency. The Community Development Area (CRA) was established in 2012 to address the
slum and blighted conditions within the Mt. Plymouth-Sorrento community. Mt. Plymouth-Sorrento is
located in east Lake County near the Lake/Seminole County line. The residential area is located in the
western and eastern areas of the CRA and many of the residential parcels consist of mobile homes and
conventional housing. Many of the mobile homes are in need of replacement and/or rehabilitation. Other
issues in the redevelopment area include deteriorating structures in some areas, older mobile home
housing stock, and lack of sidewalks, streetlights, and adequate storm water drainage.
This advisory committee is comprised of seven members as follows:
Four members who are property owners within the Planning Area
Three members who are residents or property owners within a 3-mile radius of the Planning Area
Currently there are four (57%) male members and three (43%) female members of the advisory
committee.
121
Building Codes (Accessibility) An important way that state and local governments impact fair housing choice for persons with disabilities
is through the building and construction codes adopted and enforced in their jurisdictions. While federal
housing discrimination laws impose design and building accessibility standards for certain housing and
public facilities, Congress and HUD place the direct responsibility of meeting those federal standards on
the architects/designers, builders, and operators of the covered accommodations, and do not require or
authorize local government authorities to interpret or enforce federal accessibility requirements. There is
no plan review or permitting process under the Fair Housing Act (FHA) or Americans with Disabilities Act
(ADA). Indeed, under these laws, a building permit or certificate of occupancy from a local government
does not shield a builder from enforcement action by HUD or the DOJ or from liability in a private civil
action. Rather, local building departments and inspectors only enforce state and local accessibility codes
or laws. However, by incorporating the federal standards into the state and local codes, state and local
governments can ensure another level of oversight and protection of the unique housing needs faced by
persons with disabilities.
All construction in Lake County shall be in accordance with the Florida Building Code, Florida Fire
Prevention Code, and the 2015 International Property Maintenance Code as amended. The Florida
Building Code includes the primary guidance containing scoping and technical requirements for
accessibility to sites, facilities, buildings, and elements by individuals with disabilities. The requirements
are to be applied during the design, construction, additions to, and alteration of sites, facilities, buildings,
and elements. The 1993 Florida Legislature enacted the “Florida Americans with Disability Accessibility
Implementation Act” which incorporated the architectural accessibility requirements of the Americans
with Disabilities Act of 1990 into Florida law and maintained existing provisions of Florida law thought to
be more stringent than the ADA accessibility guidelines. In 1997 the legislature amended the Act to
address U.S. Department of Justice (DOJ) concerns with Florida requirements, which might not have been
equivalent or more stringent than ADA architectural standards, to obtain federal certification of Florida’s
building code as substantially equivalent to the Federal ADA Standards for Accessible Design as adopted
by the Department of Justice (DOJ) in 28 CFR 36.
As a recipient of federal funds, Lake County is obligated to comply with the Fair Housing Act (FHA) and the
Fair Housing Amendments Act, which expanded the FHA and established terms to enforce harsher
penalties for those who sell or rent property and discriminate against persons with disabilities.
Multifamily housing units covered by the FHA’s accessibility requirements are those located in a building
of four or more units, built for first occupancy after March 13, 1991, and includes both privately owned
and publicly assisted housing rental units and for sale units. It includes not just apartments and
condominiums but also assisted living facilities, continuing care facilities, nursing homes, public housing
developments, HOPE VI projects, projects funded with HOME or other federal funds, transitional housing,
single room occupancy units (SROs), shelters designed as a residence for homeless persons, dormitories,
hospices, extended stay or residential hotels, and more. When an addition is built onto an existing
building, the addition of four or more units is regarded as a new building and must meet the design
requirements. If any new public and common use spaces are added, they are required to be accessible. In
buildings with four or more dwelling units and at least one elevator, all dwelling units and all public and
common use areas are subject to the Act’s design and construction requirements. In buildings with four
or more dwelling units and no elevator, all ground floor units and public and common use areas are subject
to the Act’s design and construction requirements.
122
Additional laws Lake County is obligated to comply with due to receipt of federal assistance is Section 504
of the Rehabilitation Act of 1973 (which applies to programs and activities receiving federal funds), Titles
II and III of the Americans with Disabilities Act (ADA) (which apply to programs, services, and activities
provided or made available by public entities and to public accommodations, respectively), and the
Architectural Barriers Act (which applies to federal facilities). Any housing (including single family
detached homes) constructed by federal, state, or local government entities or constructed using federal
funds may be subject to accessibility requirements under these laws.
Housing funded by HUD also must meet the Uniform Federal Accessibility Standards (UFAS) or a standard
that is equivalent or stricter. Under the UFAS, all federally assisted new construction housing
developments with five or more units must design and construct 5% of the dwelling units, or at least one
unit, whichever is greater, to be accessible for persons with mobility disabilities. An additional 2% of the
dwelling units, or at least one unit, whichever is greater, must be accessible for persons with hearing or
visual disabilities.
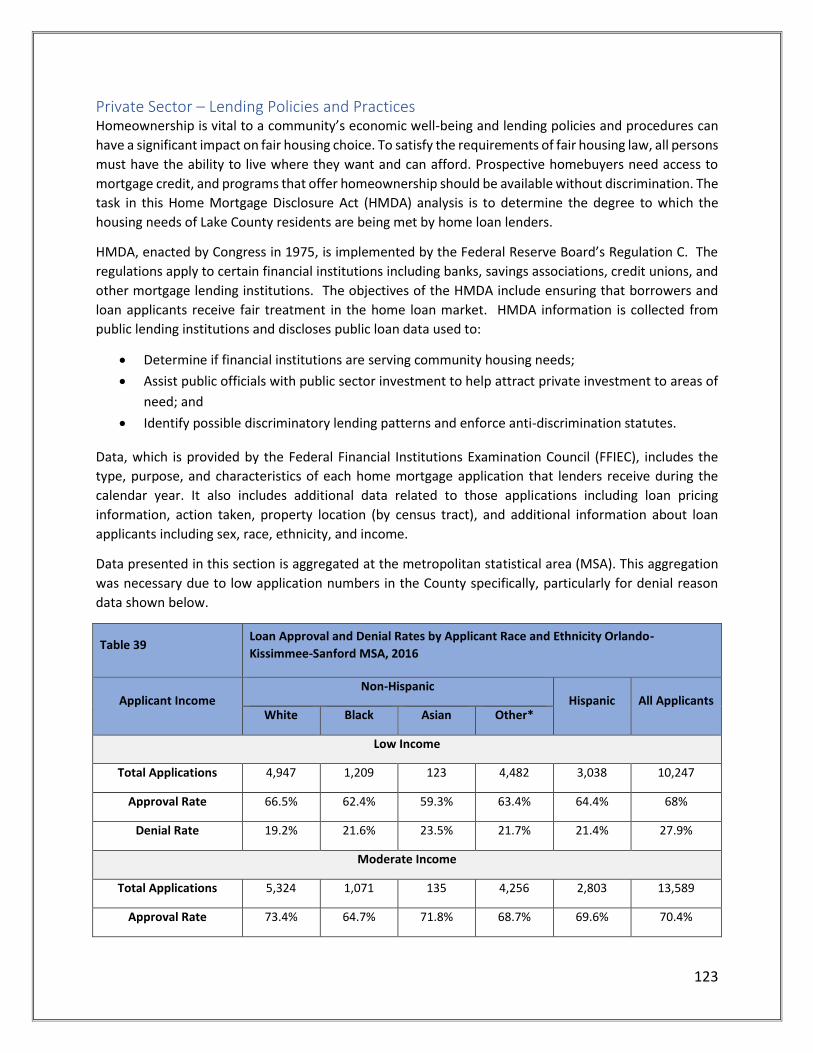
123
Private Sector – Lending Policies and Practices Homeownership is vital to a community’s economic well-being and lending policies and procedures can
have a significant impact on fair housing choice. To satisfy the requirements of fair housing law, all persons
must have the ability to live where they want and can afford. Prospective homebuyers need access to
mortgage credit, and programs that offer homeownership should be available without discrimination. The
task in this Home Mortgage Disclosure Act (HMDA) analysis is to determine the degree to which the
housing needs of Lake County residents are being met by home loan lenders.
HMDA, enacted by Congress in 1975, is implemented by the Federal Reserve Board’s Regulation C. The
regulations apply to certain financial institutions including banks, savings associations, credit unions, and
other mortgage lending institutions. The objectives of the HMDA include ensuring that borrowers and
loan applicants receive fair treatment in the home loan market. HMDA information is collected from
public lending institutions and discloses public loan data used to:
Determine if financial institutions are serving community housing needs;
Assist public officials with public sector investment to help attract private investment to areas of
need; and
Identify possible discriminatory lending patterns and enforce anti-discrimination statutes.
Data, which is provided by the Federal Financial Institutions Examination Council (FFIEC), includes the
type, purpose, and characteristics of each home mortgage application that lenders receive during the
calendar year. It also includes additional data related to those applications including loan pricing
information, action taken, property location (by census tract), and additional information about loan
applicants including sex, race, ethnicity, and income.
Data presented in this section is aggregated at the metropolitan statistical area (MSA). This aggregation
was necessary due to low application numbers in the County specifically, particularly for denial reason
data shown below.
Table 39 Loan Approval and Denial Rates by Applicant Race and Ethnicity Orlando-
Kissimmee-Sanford MSA, 2016
Applicant Income Non-Hispanic
Hispanic All Applicants White Black Asian Other*
Low Income
Total Applications 4,947 1,209 123 4,482 3,038 10,247
Approval Rate 66.5% 62.4% 59.3% 63.4% 64.4% 68%
Denial Rate 19.2% 21.6% 23.5% 21.7% 21.4% 27.9%
Moderate Income
Total Applications 5,324 1,071 135 4,256 2,803 13,589
Approval Rate 73.4% 64.7% 71.8% 68.7% 69.6% 70.4%

124
Denial Rate 13.1% 17.3% 14% 15.4% 14.9% 14.5%
High Income
Total Applications 5,509 893 151 3,540 1,911 12,004
Approval Rate 75.2% 71.3% 70.8% 71.5% 71.1% 73.1%
Denial Rate 11.4% 14.3% 15.2% 14.1% 14.6% 13%
Total
Total Applications 15,780 3,173 409 12,278 7,752 35,840
Approval Rate 71.8% 65.6% 67.7% 67.6% 67.9% 76.1%
Denial Rate 14.4% 18.1% 17.3% 17.3% 17.4% 17.8%
*Includes American Indians and Alaskan Natives, Native Hawaiians and Pacific Islanders, and persons of other or
multiple races. Note: Analysis is based on applicants only and does not include co-applicants.
Source FFIEC 2016 Home Mortgage Disclosure Act Data
For low-income applicants, loan approval rates ranged from 62.4% for Blacks to 66.5% for White
applicants. Denial rates were highest for Asian applicants (23.5%) and lowest for white (19.2%). In
comparison to Whites, Black and Hispanic applicants had lower approval rates (by 6.36–3.20 percentage
points) and higher denial rates (by 11.76-10.83 percentage points).
Moderate income applicants had higher approval rates and lower denial rates than the low-income group
for all races/ethnicities. In the moderate-income band, minority applicants had approval rates from 64.7%
to 71.8%, compared to 73.4% for Whites. Denial rates were highest for Black applicants (17.3%) and lowest
for white (13.1%).
At the high-income level, applicants had even higher approval rates and lower denial rates than the low-
income group for all races/ethnicities with the exception of Asian. In the high-income band, minority
applicants had approval rates from 70.8% to 71.5%, compared to 75.2% for Whites. Denial rates were
highest for Asian applicants (15.2%) and lowest for white (11.4%).
Table 40 identifies reasons for loan denials by race and ethnicity. For each minority group, the distribution
of loan denial reasons is compared to that of White applicants (as a reference group). Findings are
summarized below:
Reasons for denial vary by race and ethnicity. Collateral, debt-to-income ratio, and credit history were
top reasons for denials across all race/ethnicities.
For Asian loan applicants, denial reasons varied, but credit application being incomplete seems to be
an additional significant reason for denial.
For Hispanic applicants, denial reasons were more evenly spread amongst denial reason but credit
history and debt-to-income ratio were more likely denial reasons.

125
For Black/African American applicants, debt-to-income ratio and credit history are the highest reasons
for denial.
Table 40 Reasons for Loan Denial by Applicant Race and Ethnicity Orlando-
Kissimmee-Sanford MSA, 2016
Non-Hispanic Hispanic
White Black Asian Other
Total Number of Denials 2,279 576 71 2,131 1,349
Collateral 21.0% 10.5% 56.3% 13.1% 10.5%
Credit application incomplete 14.6% 6.4% 60.5% 9.1% 7.1%
Credit history 17.6% 13.5% 60.5% 14.5% 12.0%
Debt-to-income ratio 32.6% 20.8% 100.0% 27.2% 23.3%
Employment history 3.5% 2.9% 18.3% 2.6% 1.7%
Insufficient cash 10.3% 7.2% 35.2% 8.5% 7.7%
Mortgage insurance denied 0.4% 0.1% - 0.1% 0.2%
Unverifiable information 8.9% 3.9% 36.6% 6.7% 6.4%
Other 14.4% 9.3% 67.6% 12.0% 10.3%
Source FFIEC 2016 Home Mortgage Disclosure Act Data

126
Public Sector
Fair Housing Enforcement
The federal Fair Housing Act prohibits discrimination in housing on the basis of race, color, religion, sex,
national origin, familial status, and disability. The U.S. Department of Justice (DOJ) and HUD are jointly
responsible for enforcing the federal Fair Housing Act. Two HUD programs are dedicated to the
enforcement of the Fair Housing Act: Fair Housing Assistance Program (FHAP) and Fair Housing Initiatives
Program (FHIP). HUD’s Office of Fair Housing and Equal Opportunity (FHEO) is responsible for
administering FHIP, FHAP, and HUD’s investigation of fair housing and fair lending complaints. The Civil
Rights Division of the U.S. Department of Justice (DOJ) may also investigate complaints.
The State of Florida and Lake County have also adopted fair housing laws. HUD has determined that the
Florida Fair Housing Act (FFHA) is substantially equivalent to the federal Fair Housing Act meaning that
the state law covers the protected classes in the Fair Housing Act. The state or local law may also provide
additional protected classes as is the case in Florida where it is unlawful to discriminate in land use
decisions or in the permitting of developments based on protected characteristics, or, based on the source
of financing of a development or proposed development. The FFHA also protects persons who are
pregnant or in the process of becoming legal custodians of children 18 years of age or younger, or persons
who are themselves handicapped or associated with a handicapped person.
The Lake County Fair Housing Ordinance (Ordinance No. 2002-98) is also modeled after the federal Fair
Housing Act and assures an equal opportunity for all persons in Lake County to obtain adequate housing,
regardless of race, color, sex, religion, national origin, familial status, or handicap and to, eliminate
discrimination in housing.
State and local government agencies certified by HUD to enforce state or local fair housing laws that are
substantially equivalent to the Fair Housing Act receive FHAP funds. HUD provides funding to the Florida
Commission on Human Relations (FCHR), the agency charged with enforcing the state’s civil rights laws,
including the FFHA. Through annual work share agreements FCHR receives and investigates housing
discrimination complaints referred by HUD. HUD provides FHAP funding for processing dual-filed
complaints, training, provision of technical assistance, the creation and maintenance of data information
systems, and the development and enhancement of education and outreach projects, special
enforcement efforts, partnership initiatives, and other fair housing projects.
FHIP is a competitive grant program administered by FHEO that supports private nonprofit fair housing
organizations in their efforts to provide education and outreach to the public and housing providers, and
to enforce the Fair Housing Act by investigating discrimination complaints. Community Legal Services of
Mid-Florida is a FHIP-funded organization that serves Citrus, Flagler, Hernando, Lake, Marion, Putnam,
Sumter, and Orange counties. In FY 2017, CLSMF received FHIP funding of $125,000 for private
enforcement initiative (PEI) activities and $300,000 for education and outreach initiatives (EOI). PEI
assistance enables CLSMF to carry out testing and enforcement activities to prevent or eliminate

127
discriminatory housing practices and EOI assistance is used to inform the general public and housing
providers about what equal opportunity in housing means and what housing providers need to do to
comply with the Fair Housing Act.
Complaint Process Persons that suspect that they have been discriminated against can file a fair housing complaint at the
federal, state, or local level by contacting HUD, DOJ, FCHR, or CLSMF. Any complaints received by the Lake
County Department of Community Services alleging fair housing violations are referred to Community
Legal Services of Mid-Florida. The chart below provides information on how residents can file a housing
discrimination complaint with any of the fair housing enforcement organizations.
How to file a Housing Discrimination Complaint
To file a housing discrimination complaint with
HUD:
Place a toll-free call to 1-800-440-8091 or
TTY 1-800-927-9275;
Complete the “on-line” complaint form
available on the HUD website;
Submit a claim of housing discrimination
on the HUD Complaint Mobile App; or
Mail a completed complaint form or letter
to:
Atlanta Regional Office of FHEO
U.S. Department of Housing and Urban
Development
Five Points Plaza
40 Marietta Street, 16th Floor
Atlanta, Georgia 30303-2806
To report an incident of housing
discrimination to the DOJ, or to alert the DOJ
of matters involving a pattern or practice of
discrimination or matters involving denial of
rights to groups of persons:
Call the Fair Housing Tip Line at 1-800-
896-7743;
Email [email protected]; or
Mail a letter to:
U.S. Department of Justice
Civil Rights Division
Housing and Civil Enforcement Section –
G St.
950 Pennsylvania Avenue, N.W.
Washington, DC 20530
To file a complaint with FCHR, complainants must
contact the agency within one year of the date on
which the alleged act of discrimination occurred.
Telephone 850-488-7082; or
Mail or fax the Technical Assistance
Questionnaire for Housing Complaints to:
Florida Commission on Human Relations
Office of Customer Service
4075 Esplanade Way, Room 110
Tallahassee, FL 32399
Facsimile 850-487-1007
To file a complaint with CLSMF:
Email [email protected];
Telephone 407-841-7777; or
Visit Tavares Office at:
226 West Main Street
Tavares, FL 32778

128
If a complaint is filed with HUD under the federal Fair Housing Act and the complaint falls within the
jurisdiction of FCHR, HUD must refer the complaint to the local or state agency and may take no further
action, except under limited circumstances. Once the complaint is filed with FCHR, the process is as
follows:
A person alleging discrimination under the FFHA has one year after the discriminatory housing
practice to file a complaint with FCHR.
FCHR has 100 days after receiving the complaint to complete an investigation and issue a
determination.
FCHR can decide to resolve the complaint and eliminate or correct the alleged discriminatory
housing practice through conciliation.
If, within 180 days after a complaint is filed, FCHR has been unable to obtain voluntary compliance,
the complainant may initiate civil action or petition for an administrative determination.
If the commission finds reasonable cause, the claimant may request that the Attorney General
bring the civil action against the respondent.
A civil action must be commenced within two years after the alleged discriminatory act occurred.
The court may continue a civil case if conciliation efforts by FCHR or by a local housing agency are
likely to result in a satisfactory settlement.
If the court funds that a discriminatory housing practice has occurred, the court must issue an
order prohibiting the practice and providing administrative relief.
Possible remedies include injunctions, restraining orders, fines and actual and punitive damages,
court costs, and reasonable attorney’s fees.
The fair housing enforcement process in Lake County is efficient and effective in providing complainants
and respondents with a fair process for settling housing complaints as evidenced by the nature and
disposition of housing discrimination complaints filed in the County.
Information Programs
For fair housing planning to be comprehensive it must address the lack of knowledge of the general public
and among local government officials about unlawful discriminatory practices, fair housing laws, and fair
housing objectives. Below is a summary of the fair housing education and outreach activities that have
been conducted by the Lake County HCD Office and CLSMF in recent years.
In 2015, CLSMF participated in a Family Fun and Resource Fair where it handed out brochures
covering fair housing topics. CLSMF also provided materials to two builders in Lake County on
universal design and visitability.
The County partners with its urban county participating cities (Tavares, Leesburg, Montverde, and
Minneola) and CLSMF on an annual fair housing symposium that is held during the month of April
– Fair Housing Month – to address citizens, landlords, and non-profits on fair housing activities
and promote housing opportunities available through the Lake County Housing Division. On April
28, 2016, CLSMF hosted the 5th Annual Florida Fair Housing Summit. A total of 242 community
members, advocates, local government administrator, housing providers, property managers,

129
attorneys, real estate agents, and mortgage lenders participated in the conference. The summit
included intense workshops on topics ranging from affirmative furthering fair housing to creating
accessible homes and inclusive, sustainable diverse communities.
The County provides fair housing information to potential Section 8 HCV tenants and added a
module on fair housing for landlords that participate in the Section 8 program to reduce the
incidence of private discrimination from landlords that refuse to rent to individuals because of
their source of income.
In spite of the efforts to educate the residents and housing providers about their rights and
responsibilities, the housing discrimination complaint data analyzed in Section III, Evaluation of Current
Fair Housing Legal Status, and the AI survey results suggest that there is still a lack of knowledge by
residents about fair housing laws and actions that are discriminatory.
Visitability in Housing Visitability is a voluntary standard endorsed by HUD to allow mobility impaired persons to visit families
and friends where this would not otherwise be possible. Visitability means that 1) at least one entrance is
at grade (no step), approached by an accessible route, such as a sidewalk, 2) the entrance door and all
interior doors on the first floor are at least 34 inches wide, offering 32 inches of clear passage space, and
3) at least a half bathroom on the main floor of the house. The visitability concept applies to single family
and other housing types that are not covered by federal law to incorporate accessibility features. Unlike
accessibility, a visitable home does not require that all features of a dwelling unit be made accessible. The
benefits of visitability include:
An increase in the availability of housing options for individuals who may not require full
accessibility;
Providing property owners with assistance in making reasonable accommodations and reducing,
in some cases, the need for structural modifications or transfers when individuals become
disabled in place; and
Improvement in the marketability of units.
Lake County has not developed a written visitability policy however, the County has adopted the Florida
Building Code, which includes compliance with the 2012 Florida Accessibility Code for Building
Construction adopted pursuant to Section 553.503, Florida Statutes. The Florida Housing Finance
Corporation has also adopted Universal Design and Visitability Features in all state funded developments
that involve new construction and rehabilitation of housing units.
The Florida Accessibility Code expands the requirements of the Fair Housing Act and the ADA standards
by requiring that all new single-family houses, duplexes, triplexes, condominiums, and townhouses
provide at least one bathroom with a door that has a 29-inch clear opening on each habitable grade
level. This provision in the Florida Accessibility Codes promotes the concept of visitability and the
County does make accessibility improvements in accordance with the building code and rehabilitation
standards.
130
Assessment of Current Public and Private Fair Housing Programs and Activities in the Jurisdiction Lake County is committed to furthering fair housing and continues to fund housing and neighborhood
revitalization activities through its CDBG, SHIP, and Health and Human Services programs to assist in
providing housing choice. Coordination with various state and local agencies has resulted in significant
program and service diversity to assist in meeting housing needs throughout the County. The County will
continue to work in conjunction with private and public organizations to increase fair housing
opportunities and review and re-evaluate current programs and activities consistently to ensure
compliance in furthering fair housing efforts. Current programs and/or organizations supporting fair
housing efforts in Lake County include:
Community Development Block Grant (CDBG)
The Community Development Block Grant (CDBG) program is a versatile program providing communities
with resources to address a wide range of community development needs. Created under Title I of the
Housing and Community Development Act, CDBG is a primary funding source for Lake County in
addressing community revitalization, housing, and economic development needs. The CDBG program
contains a regulatory requirement to affirmatively further fair housing based upon HUD’s obligation under
Section 808 of the Fair Housing Act. Grantees under the CDBG program must comply with this
requirement and certify that it will further fair housing efforts. For the purpose of the CDBG program,
HUD defines “affirmatively furthering fair housing” as requiring a grantee to:
Conduct an analysis to identify impediments to fair housing choice within the jurisdiction;
Take appropriate actions to overcome the effects of any impediments identified through the
analysis; and
Maintain records reflecting the analysis and actions taken in this regard.
This document will serve as the County’ updated Analysis of Impediments in accordance with HUD
regulation at 24 CFR 570.904(c)(1) for HUD CDBG Entitlement grantees. The County is committed to
eliminating discriminatory practices in housing opportunities for all protected groups identified under fair
housing laws. This Analysis of Impediments will coincide with the County’s 2015-2019 Consolidated Plan,
which includes the County’s certification of compliance with fair housing requirements.
Lake County continues to further fair housing efforts through their CDBG programs by funding activities
including housing rehabilitation, neighborhood revitalization activities, and various public service
activities. Grantees are committed to providing benefits to the greatest number of people while targeting
low-and moderate-income residents. Lake County utilizes CDBG funds in a strategic approach to alleviate
poverty through various community development activities focused on neighborhood revitalization.
Neighborhood infrastructure development that incorporates social design into physical improvements
changes neighborhood landscapes and significantly improves the social connectedness of its residents.
Community initiative is vital to revitalizing the health of a neighborhood, to the provision of a suitable
living environment and economic sustainability for residents, and in promoting fair housing.
Section 8 Housing Choice Voucher Program

131
The Housing Choice Voucher Program provides vouchers to very low - and extremely low – income
households that are in need of housing, are potentially at risk of being homeless, or have special needs.
Rental assistance provides affordable housing opportunities which leads to families moving towards self-
sufficiency.
The Housing Choice Voucher Program (Section 8) is administered by the Lake County Housing Agency. In
total, the Lake County Housing Agency manages 485 housing choice vouchers throughout the County.
Lake County’s waiting list is currently closed due to high demand for vouchers and lack of available
vouchers. The Housing Choice Voucher program helps to support fair housing efforts by creating
affordable housing opportunities.
State Housing Initiatives Partnership Program
The State Housing Initiatives Partnership (SHIP) program, administered through the Florida Housing
Finance Corporation (FHFC), has the primary objective of encouraging and creating partnerships that will
assist in the production and preservation of affordable housing in the state of Florida. Funds must be
used to benefit low-income and moderate-income persons. The SHIP program has required set-asides for
funding that grantees must follow. A minimum of 65% of grant funds must be expended on eligible
homeownership activities, a minimum of 75% is to be expended on eligible construction activities, at least
30% must be reserved for very-low income households, a minimum of 30% must be reserved for low-
income households, and a minimum of 20% for households with special needs. The SHIP program funds
affordable housing initiatives that support fair housing.
Lake County offers assistance through SHIP to help extremely low, very low, low and moderate-income
households purchase homes. Funds can be used for down payments, closing costs for new homes, or for
existing homes that have been or will be repaired within twelve months of transfer of title. The maximum
purchase price for new and existing homes is $180,000. Up to $5,000 of the assistance can be used for
repairs to existing homes. The amount of SHIP assistance available varies by income category.
Lake County Health and Human Services
Annually, the county allocates funds to support the Human Services Grant Program. Funds are awarded
to increase the level of services to Lake County citizens through existing community-based organizations
and have been used in the past to expand services to vision-impaired citizens, assist victims of domestic
violence, provide employment opportunities to developmentally-challenged citizens, and help with
emergency rent and utility assistance for financially-disadvantaged residents. Prevention and/or
intervention programs that serve at-risk individuals, elders, and families include: rental or mortgage
assistance; utilities assistance; deposits (for utilities and housing); food; elder fraud and exploitation
prevention. Funding these affordable housing activities or services surrounding affordable housing assists
with fair housing efforts.
Community Legal Services of Mid-Florida (CLSMF)
Community Legal Services of Mid-Florida (CLSMF) is a nonprofit law firm striving to remove barriers to
justice by empowering vulnerable communities through legal advocacy. As the primary provider of free
legal aid for low to moderate income residents in Central Florida, CLSMF helps individuals obtain the basic
necessities of life: food, shelter, health care, safety, and education.

132
Community Legal Services of Mid-Florida provides legal representation and advice to homeowners and
renters on a wide range of legal issues including foreclosures, mortgage scams, landlord tenant disputes,
subsidized housing, fair lending and fair housing, and more. By providing legal advice and assistance on
these issues, CLSMF helps Central Florida’s families, veterans, seniors and other vulnerable members of
population stay in their homes and avoid homelessness.
Community Legal Services of Mid-Florida’s Fair Housing Project promotes equal opportunity in housing
for all persons through education, investigation and enforcement. “Fair Housing” refers to laws and
regulations that make it illegal to discriminate on the basis of a protected class in housing. This includes
activities related to the rental, sale, lending and advertising of a dwelling. Services are available free to
any person who experiences housing discrimination in Brevard, Citrus, Flagler, Hernando, Lake, Marion,
Orange, Osceola, Putnam, Seminole, Sumter or Volusia counties, regardless of income.

133
Community Survey Lake County published and advertised an online survey to collect community feedback on the degree to
which residents understand their fair housing rights, the demographics of respondents, and the degree to
which respondents think there is equal access to communities of opportunity in the County. A total of 88
residents completed the survey. Most questions in the survey required simple “yes,” “no,” or “don’t
know” responses, although several questions allowed respondents to offer written comments. While a
summary of findings and comments are presented in this section, complete results are available in the
Appendix to this report.
Respondent demographics A significant majority of respondents reported their race/ethnicity as White. Approximately 12% of
respondents were Black/African American, and 5.75% said they were Latino/Hispanic or Other/Multiple
Races.
Respondents were asked their gender, and 72.7% said they were Female, 27.27% said they were male,
and no respondent indicated “Other.” Additionally, respondents reported their age range. Approximately
32% of respondents were aged between 35 and 44 years, with the second highest group being 21.8% of
respondents indicating they were between the ages of 25 and 34. One respondent skipped the question.
75.86%
12.64%
0.00% 0.00%5.75% 5.75%
White AfricanAmerican/Black
NativeAmerican/Alaska
Native
Asian/PacificIslander
Latino/Hispanic Other/MultipleRaces
0.00%
10.00%
20.00%
30.00%
40.00%
50.00%
60.00%
70.00%
80.00%
What is your race/ethnicity?

134
Respondents were also asked their annual household income, and the distribution of responses was fairly
even. The income category with the most responses was $35,000 to $49,999 at 21.43% of responses. The
second income category with the most responses was $15,000 to $24,999 with 15.48% of responses.
Surprisingly, given the median household income in the County, seven respondents indicated annual
household income was $100,000 or more.
0.00%
3.45%
21.84%
32.18%
17.24%
11.49%10.34%
3.45%
Under 18 18-24 25-34 35-44 45-54 55-61 62-74 75+
0%
5%
10%
15%
20%
25%
30%
35%
What is your age group?
11.90%
5.95%
15.48%
11.90%
21.43%
14.29%
10.71%
8.33%
Less than $10,000
$10,000 to $14,999
$15,000 to $24,999
$25,000 to $34,999
$35,000 to $49,999
$50,000 to $74,999
$75,000 to $99,000
$100,000 or more
0% 5% 10% 15% 20% 25%
What is your annual household income?
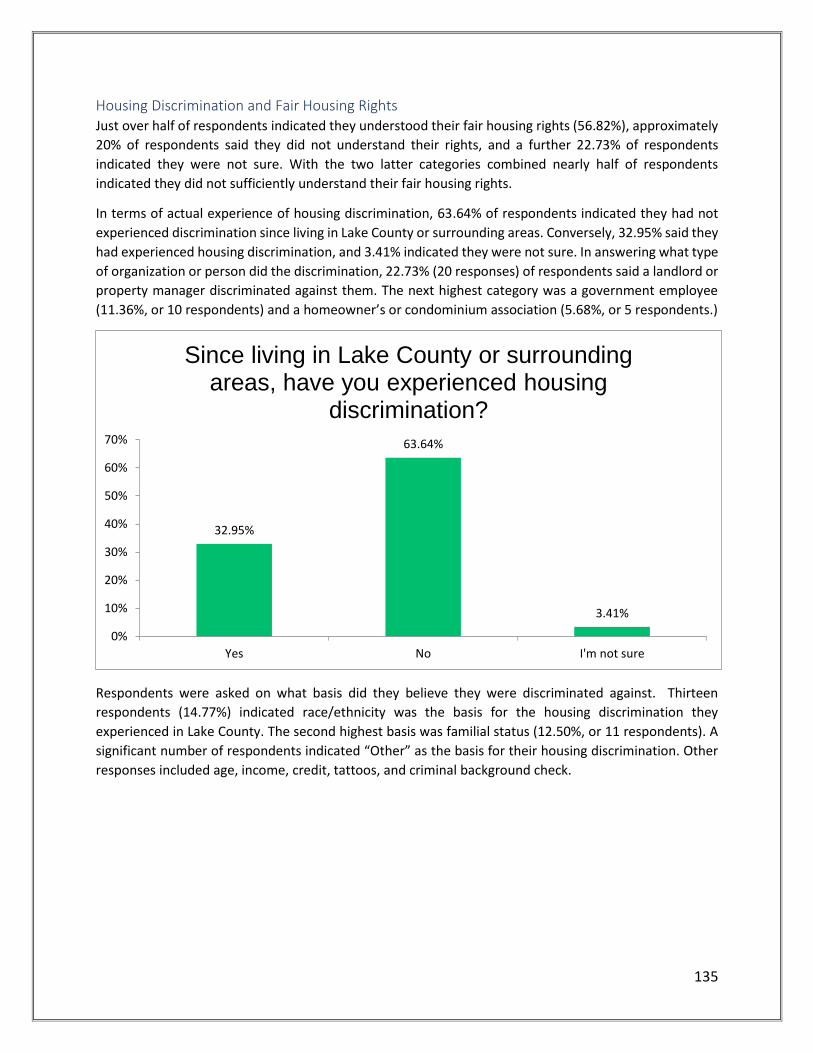
135
Housing Discrimination and Fair Housing Rights Just over half of respondents indicated they understood their fair housing rights (56.82%), approximately
20% of respondents said they did not understand their rights, and a further 22.73% of respondents
indicated they were not sure. With the two latter categories combined nearly half of respondents
indicated they did not sufficiently understand their fair housing rights.
In terms of actual experience of housing discrimination, 63.64% of respondents indicated they had not
experienced discrimination since living in Lake County or surrounding areas. Conversely, 32.95% said they
had experienced housing discrimination, and 3.41% indicated they were not sure. In answering what type
of organization or person did the discrimination, 22.73% (20 responses) of respondents said a landlord or
property manager discriminated against them. The next highest category was a government employee
(11.36%, or 10 respondents) and a homeowner’s or condominium association (5.68%, or 5 respondents.)
Respondents were asked on what basis did they believe they were discriminated against. Thirteen
respondents (14.77%) indicated race/ethnicity was the basis for the housing discrimination they
experienced in Lake County. The second highest basis was familial status (12.50%, or 11 respondents). A
significant number of respondents indicated “Other” as the basis for their housing discrimination. Other
responses included age, income, credit, tattoos, and criminal background check.
32.95%
63.64%
3.41%
Yes No I'm not sure
0%
10%
20%
30%
40%
50%
60%
70%
Since living in Lake County or surrounding areas, have you experienced housing
discrimination?

136
Reporting awareness To better assess the degree to which respondents understand the proper procedure or agencies to report
housing discrimination, Lake County included a series of questions to explore the topic. First, respondents
were asked whether they had filed a report of the incident previously described in the survey. In response,
43% of respondents indicated they did not file a report of the discrimination incident, and only 3.41% (3
responses) said they did file a report. The respondent was then asked if they did not file a report to
indicate the reason for not doing so. Approximately 17% of respondents indicated they did not think
reporting the discrimination would help, and 10.23% indicated they did not know where to file.
14.77%
3.41%
1.14%
0.00%
3.41%
12.50%
5.68%
0.00%
2.27%
65.91%
14.77%
Race/ethnicity
Color
National origin
Religion
Sex
Familial status
Disability
Gender identity or expression
Sexual orientation
Not applicable
Other (please specify)
0% 10% 20% 30% 40% 50% 60% 70%
On what basis do you believe you were discriminated against? (Check all that apply)
17.05%10.23%
5.68% 5.68%0.00% 2.27%
71.59%
I did not thinkit would help
I did not knowwhere to file
I did notrealize it was aviolation of the
law
I was afraid ofretaliation
The processwas not in my
nativelanguage
The reportingprocess was
not accessibleto me becauseof a disability
Not applicable
0%
10%
20%
30%
40%
50%
60%
70%
80%
If you did not file a report, why not? (check all that apply)

137
Respondents were asked what they would do it they were discriminated against in housing choice. Nearly
half of respondents indicated they would report the incident (47.73%). Approximately 33% of respondents
said they would not know what to do (32.95%, or 29 responses).
Access to Opportunity Respondents on the survey were asked to report the degree to which housing choice is limited to certain
geographic neighborhoods. Respondents were evenly split on the question, with 47.73% indicating in the
positive, 47.73% responding in the negative, and 4.55% offering a specific area that is accessible.
Respondents were then asked whether affordable housing options are located throughout the County.
Approximately 61% of respondents said affordable housing is limited to certain areas/neighborhoods, and
only 38.64% of respondents said affordable housing is spread throughout the region.
In response to a question asking whether certain neighborhoods in the County are undesirable places to
live, over 72% of respondents answered in the positive. Only 6.82% of respondents answered ‘no.’ This
indicates a strong sense in the community that certain neighborhoods in the County are undesirable
places to live. Written responses noted the four corners area, Carver Heights, Leesburg, Bates, Eustis,
and Tavares.
38.64%43.18%
18.18%
Spread throughout the region Concentrated in certainareas/neighborhoods
If concentrated, please identifythe area:
0%
10%
20%
30%
40%
50%
Do you think that affordable housing options are located throughout the Lake County
region, or are they concentrated in certain areas/neighborhoods

138
72.73%
6.82%
14.77%
5.68%
Yes No I don't know If Yes, please identify theareas:
0%
10%
20%
30%
40%
50%
60%
70%
80%
Do you think that certain geographic areas or neighborhoods in the County are undesirable
places to live?

139
III. Conclusions and Impediments In the Fair Housing Planning Guide, HUD defines an impediment to fair housing choice as an action,
omission or decision based on race, color, religion, sex, disability, familial status, or national origin that
restricts or has the effect of restricting housing choices or the availability of housing choices. Throughout
this analysis various community issues have surfaced, both positive and negative. Some of these issues
represent general community needs and, while valid, do not restrict or have the effect of restricting
housing choice and thus do not constitute impediments.
For this analysis, qualitative data in the form of input from interviews and community meetings was
combined with quantitative data from the U.S. Census and from other sources. In some cases, the
quantitative data collected from a single source was clear and compelling enough on its own to indicate
the existence of an impediment. In other cases, and particularly with the use of qualitative data, the
cumulative effect of a comment or criticism repeated many times over in many different settings was
sufficient to indicate a barrier. Sometimes a weak or inconclusive correlation of quantitative data from
one source could be supported by public comments and input or data from another source to constitute
an impediment.
In this section, impediments to fair housing choice are identified. Each impediment listed is associated
with an “action plan,” or set of specific actions to be conducted by Lake County staff over the next 5 years.
By implementing the recommendations, Lake County staff will begin to correct the identified impediments
to fair housing choice.
The recommendations and actions listed in this section meet two critical criteria: they must be both
meaningful and feasible. Actions must be meaningful in that they have a reasonable expectation of
reducing barriers to fair housing choice. As well, actions must be feasible in that they are within the scope
of Lake County’s authority and within the scope of funding considerations.

140
Impediments and Action Plan
# Impediment Actions Timeline Outcomes
1 Lack of awareness by residents of fair housing laws and where to file complaints
1. Provide fair housing trainings to the public and invited organizations twice per year.
2. Place flyers and fair housing information in public facilities. 3. Advertise April Fair Housing Month and make public announcements
regarding opportunities to learn about fair housing. 4. Include the HUD fair housing logo on all housing program related
documents. 5. Present information on fair housing rights at least once per year to
the local Continuum of Care.
2018 - 2022
1. Improved public understanding of fair housing laws as measured by fair housing survey.
2. Increased count of reports of housing discrimination to HUD, State of FL, or local agency.
2 Insufficient supply of affordable rental housing
1. Establish a Community Land Trust. 2. Develop an action plan for affordable housing rental development in
Lake County’s designated Opportunity Zones. 3. Establish a Community Land Trust organization, and build its capacity
with SHIP, CDBG, and quality County-owned surplus lands. 4. In Land Development Code, eliminate collection of impact fees for
Accessory Dwelling Units (LDC 10.01.00). 5. Improve relationships with private landlords and encourage
placement of HCV holders and protected class populations in naturally affordable rental housing in areas of opportunity.
6. Coordinate annual review of FHFC RFAs and identify deployable County and private resources to ensure applications are submitted to relevant RFA opportunities.
2018 - 2022
1. Increased count of affordable housing units developed in Lake County.
2. Count of permanently affordable single-family home parcels managed by CLT.
3. Placement of HCV households.
3 Poor condition of private market rental housing units and HCV units
1. Increase inspections of apartments accepting HCV holders, to include random and unannounced housing quality inspections.
2. Encourage and promote access to CDFI rehabilitation and renovation capital for energy efficiency and rehabilitation of privately owned homes/units.
2018-2022
1. Improved HQS scores for HCV units.
4 Lack of access to opportunity 1. Prioritize allocation of CDBG funds in high opportunity census tracts
as defined and measured by HUD School Proficiency Index and Labor Market Index.
2018 – 2022
1. Increased median household income in low-income, high-minority census tracts.

141
2. Through public-private partnerships, increase workforce development and access to workforce training in low opportunity census tracts, as defined and measured by HUD Labor Market Index.
5 Poor credit history and criminal background checks as barriers to fair housing access
1. Expand access to credit counseling services for low-income and protected classes.
2. Improve public and landlord awareness of HUD criminal background check ruling.
2018 – 2022
1. Reduced number of landlords with blanket & exclusionary criminal background check policies.
2. Reduced number of loan origination denials based on credit, as reported by FFIEC HMDA data.
142
IV. Signature Page
1. Submission date: 8/31/2018
2. Submitter name: Lake County
3. Type of submission: Single program participant
4. Type of program participant(s): Consolidated Plan Participant
5. Sole or lead submitter contact information:
a. Name:
b. Title:
c. Department:
d. Street address:
e. City:
f. State:
g. Zip code:
6. Period covered by this assessment: 2018 - 2022
7. To the best of its knowledge and belief, the statements and information contained herein are true, accurate, and complete and the program participant has developed this AI in compliance with the requirements of the Department of Housing and Urban Development;
Signature: Date:
8. Departmental acceptance or non-acceptance:
Signature: Date:

143
Appendix
Appendix 1. Community Survey Results
Q1. Lake County Analysis of Impediments to Fair Housing Choice
Do you feel you understand your Fair Housing Rights?
Answer Choices Responses
Yes 56.82% 50
No 20.45% 18
I'm not sure 22.73% 20
Answered 88
Skipped 0
Yes No I'm not sure
0.00%
10.00%
20.00%
30.00%
40.00%
50.00%
60.00%
Do you feel you understand your Fair Housing Rights?
Responses
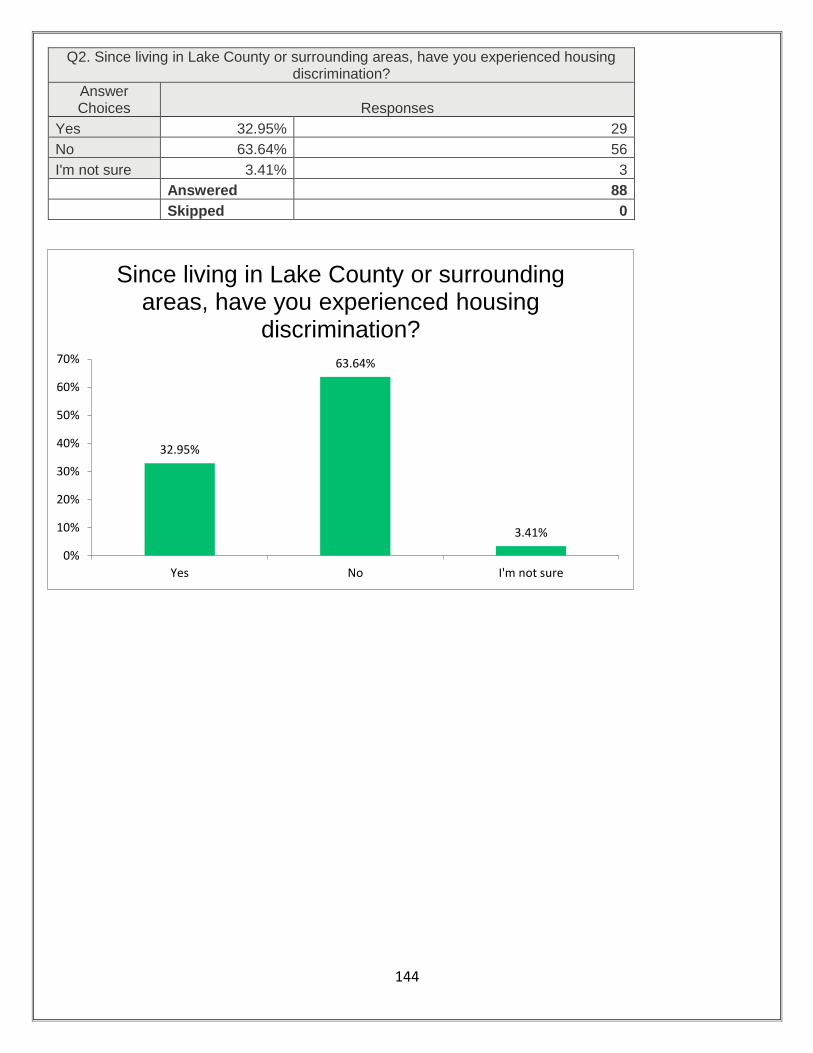
144
Q2. Since living in Lake County or surrounding areas, have you experienced housing discrimination?
Answer Choices Responses
Yes 32.95% 29
No 63.64% 56
I'm not sure 3.41% 3
Answered 88
Skipped 0
32.95%
63.64%
3.41%
Yes No I'm not sure
0%
10%
20%
30%
40%
50%
60%
70%
Since living in Lake County or surrounding areas, have you experienced housing
discrimination?
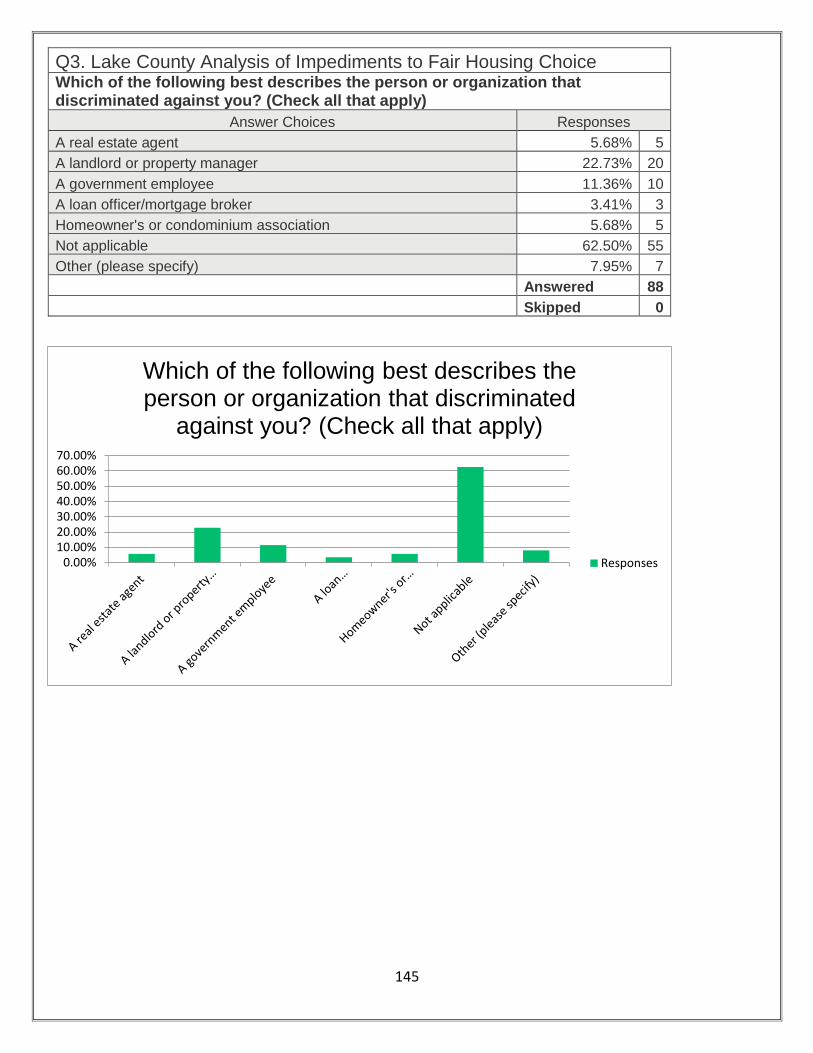
145
Q3. Lake County Analysis of Impediments to Fair Housing Choice Which of the following best describes the person or organization that discriminated against you? (Check all that apply)
Answer Choices Responses
A real estate agent 5.68% 5
A landlord or property manager 22.73% 20
A government employee 11.36% 10
A loan officer/mortgage broker 3.41% 3
Homeowner's or condominium association 5.68% 5
Not applicable 62.50% 55
Other (please specify) 7.95% 7
Answered 88
Skipped 0
0.00%10.00%20.00%30.00%40.00%50.00%60.00%70.00%
Which of the following best describes the person or organization that discriminated
against you? (Check all that apply)
Responses

146
Q4. Lake County Analysis of Impediments to Fair Housing Choice On what basis do you believe you were discriminated against? (Check all that apply)
Answer Choices Responses
Race/ethnicity 14.77% 13
Color 3.41% 3
National origin 1.14% 1
Religion 0.00% 0
Sex 3.41% 3
Familial status 12.50% 11
Disability 5.68% 5
Gender identity or expression 0.00% 0
Sexual orientation 2.27% 2
Not applicable 65.91% 58
Other (please specify) 14.77% 13
Answered 88
Skipped 0
0%
10%
20%
30%
40%
50%
60%
70%
On what basis do you believe you were discriminated against? (Check all that apply)

147
Q5. Lake County Analysis of Impediments to Fair Housing Choice
Did you file a report of the discrimination?
Answer Choices Responses
Yes 3.41% 3
No 43.18% 38
Not applicable 53.41% 47
Answered 88
Skipped 0
Yes No Not applicable
0.00%
10.00%
20.00%
30.00%
40.00%
50.00%
60.00%
Did you file a report of the discrimination?
Responses
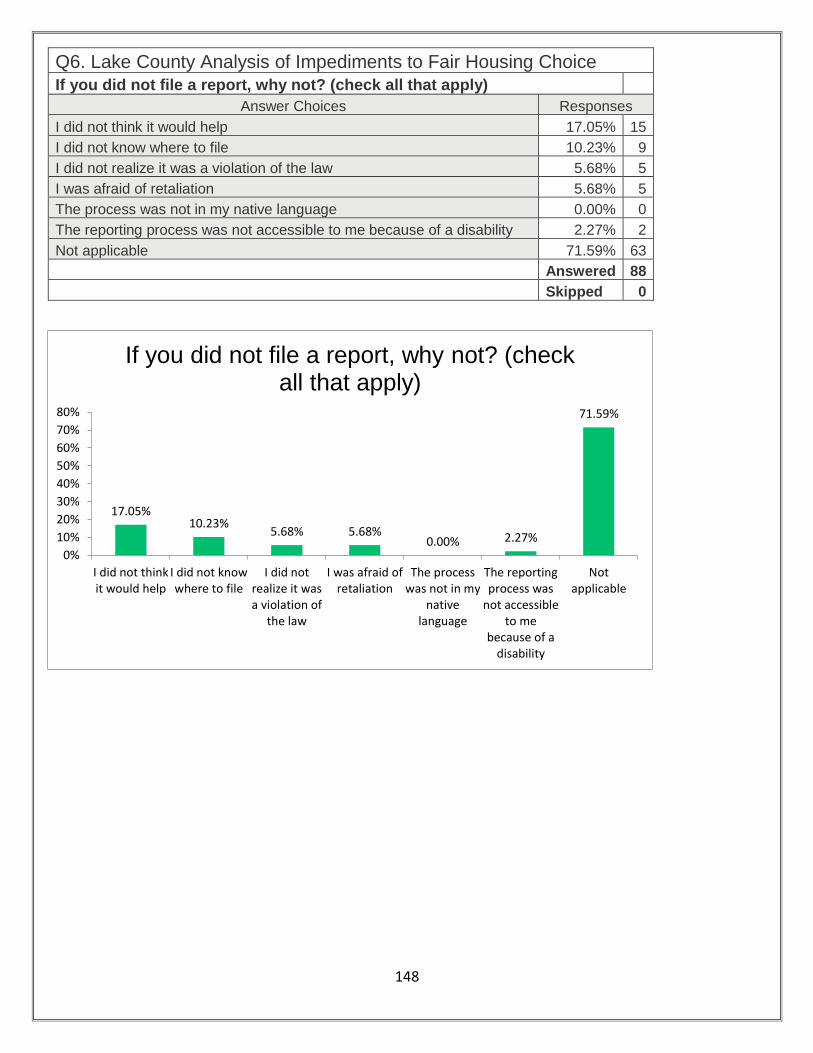
148
Q6. Lake County Analysis of Impediments to Fair Housing Choice
If you did not file a report, why not? (check all that apply) Answer Choices Responses
I did not think it would help 17.05% 15
I did not know where to file 10.23% 9
I did not realize it was a violation of the law 5.68% 5
I was afraid of retaliation 5.68% 5
The process was not in my native language 0.00% 0
The reporting process was not accessible to me because of a disability 2.27% 2
Not applicable 71.59% 63
Answered 88
Skipped 0
17.05%10.23%
5.68% 5.68%0.00% 2.27%
71.59%
I did not thinkit would help
I did not knowwhere to file
I did notrealize it wasa violation of
the law
I was afraid ofretaliation
The processwas not in my
nativelanguage
The reportingprocess was
not accessibleto me
because of adisability
Notapplicable
0%
10%
20%
30%
40%
50%
60%
70%
80%
If you did not file a report, why not? (check all that apply)

149
Q7. Lake County Analysis of Impediments to Fair Housing Choice
If you did file a report, where did you file it? (check all that apply) Answer Choices Responses
To a local City of County office 0.00% 0
To an agency administered by the State of Florida 1.14% 1
The U.S. Department of Housing and Urban Development (HUD) 3.41% 3
To a private fair housing advocacy or enforcement organization 1.14% 1
Not applicable 93.18% 82
Other (please specify) 3.41% 3
Answered 88
Skipped 0
To a local City ofCounty office
To an agencyadministered by
the State ofFlorida
The U.S.Department of
Housing andUrban
Development(HUD)
To a private fairhousing
advocacy orenforcementorganization
Not applicable Other (pleasespecify)
0.00%10.00%20.00%30.00%40.00%50.00%60.00%70.00%80.00%90.00%
100.00%
If you did file a report, where did you file it? (check all that apply)
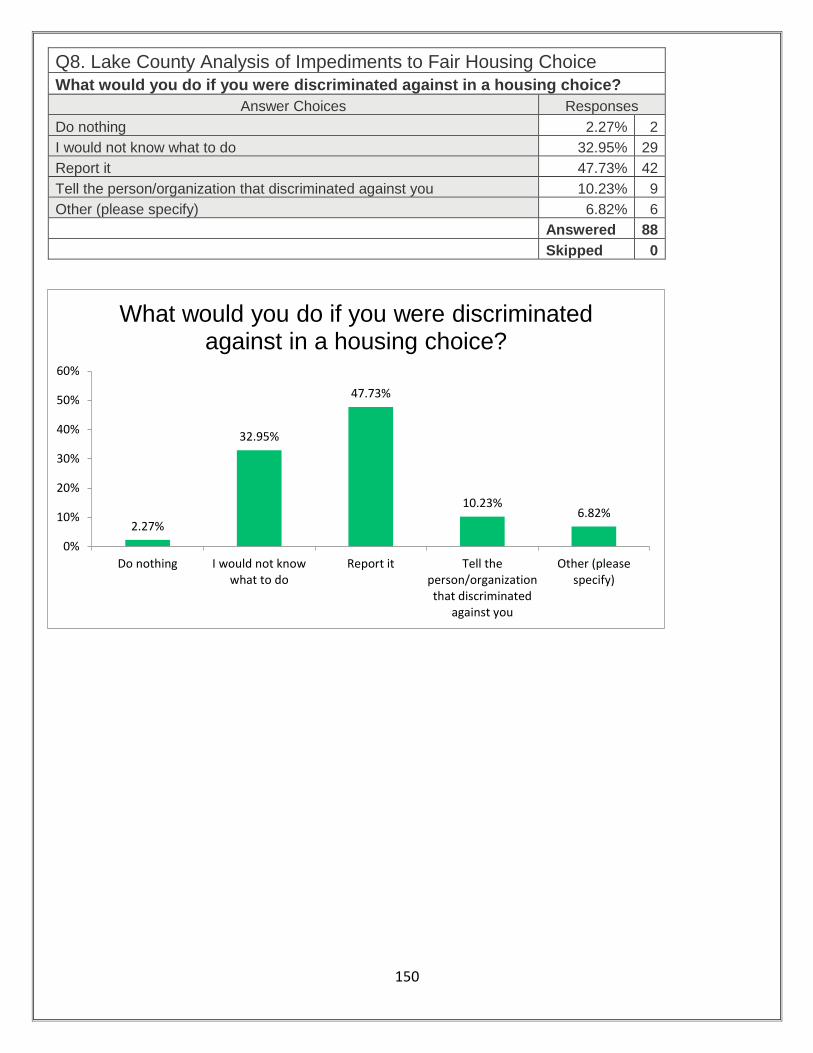
150
Q8. Lake County Analysis of Impediments to Fair Housing Choice
What would you do if you were discriminated against in a housing choice?
Answer Choices Responses
Do nothing 2.27% 2
I would not know what to do 32.95% 29
Report it 47.73% 42
Tell the person/organization that discriminated against you 10.23% 9
Other (please specify) 6.82% 6
Answered 88
Skipped 0
2.27%
32.95%
47.73%
10.23%6.82%
Do nothing I would not knowwhat to do
Report it Tell theperson/organizationthat discriminated
against you
Other (pleasespecify)
0%
10%
20%
30%
40%
50%
60%
What would you do if you were discriminated against in a housing choice?

151
Q9. Lake County Analysis of Impediments to Fair Housing Choice Do you feel your housing choices are limited to certain geographic areas or neighborhoods?
Answer Choices Responses
Yes 47.73% 42
No 47.73% 42
If "yes," what neighborhoods? 4.55% 4
Answered 88
Skipped 0
Yes No If "yes," what neighborhoods?
0.00%
10.00%
20.00%
30.00%
40.00%
50.00%
60.00%
Do you feel your housing choices are limited to certain geographic areas or
neighborhoods?
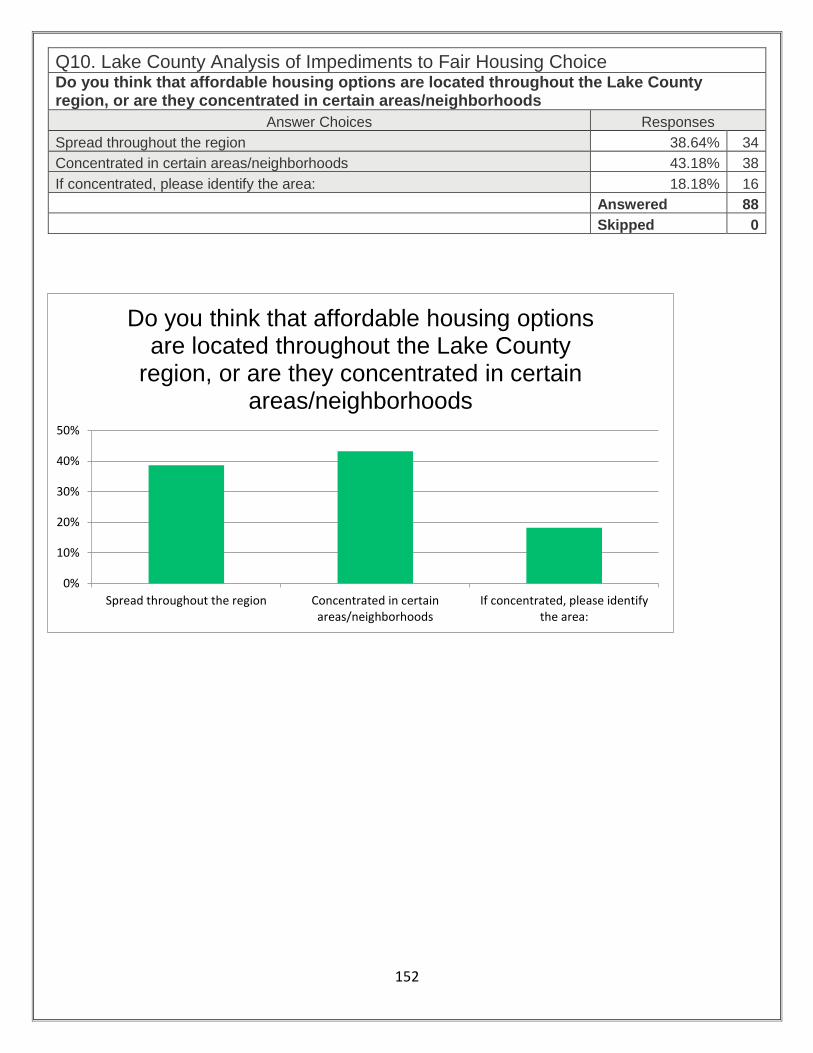
152
Q10. Lake County Analysis of Impediments to Fair Housing Choice Do you think that affordable housing options are located throughout the Lake County region, or are they concentrated in certain areas/neighborhoods
Answer Choices Responses
Spread throughout the region 38.64% 34
Concentrated in certain areas/neighborhoods 43.18% 38
If concentrated, please identify the area: 18.18% 16
Answered 88
Skipped 0
Spread throughout the region Concentrated in certainareas/neighborhoods
If concentrated, please identifythe area:
0%
10%
20%
30%
40%
50%
Do you think that affordable housing options are located throughout the Lake County
region, or are they concentrated in certain areas/neighborhoods

153
Q11. Lake County Analysis of Impediments to Fair Housing Choice Where have you seen or heard information regarding fair housing programs, laws, or enforcement in Lake County?
Answer Choices Responses
Fair housing flyers or pamphlets 4.55% 4
Fair housing public service announcement (radio or television) 3.41% 3
Fair housing event 0.00% 0
Lake County Housing Agency 10.23% 9
Lake County Board of County Commissioners 4.55% 4
Florida Commission on Human Relations website 0.00% 0
HUD Fair Housing and Equal Opportunity website 12.50% 11
None 57.95% 51
Other (please specify) 6.82% 6
Answered 88
Skipped 0
0.00%10.00%20.00%30.00%40.00%50.00%60.00%70.00%
Where have you seen or heard information regarding fair housing programs, laws, or
enforcement in Lake County?
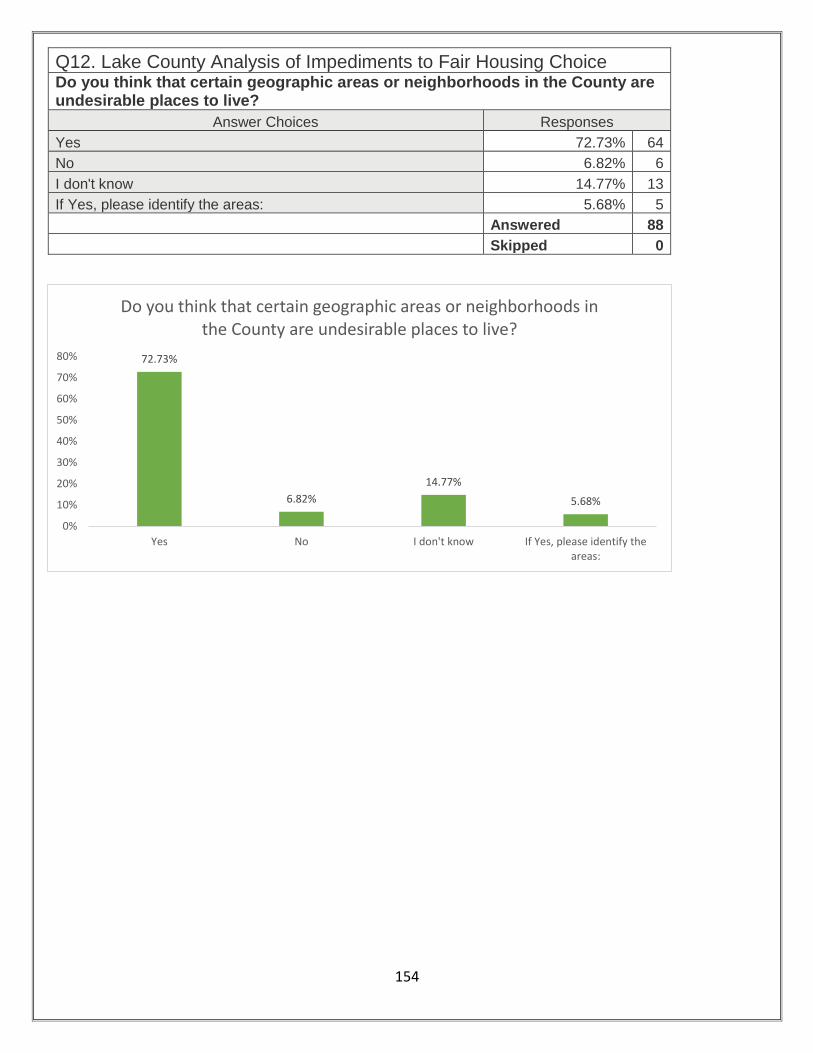
154
Q12. Lake County Analysis of Impediments to Fair Housing Choice Do you think that certain geographic areas or neighborhoods in the County are undesirable places to live?
Answer Choices Responses
Yes 72.73% 64
No 6.82% 6
I don't know 14.77% 13
If Yes, please identify the areas: 5.68% 5
Answered 88
Skipped 0
72.73%
6.82%
14.77%
5.68%
0%
10%
20%
30%
40%
50%
60%
70%
80%
Yes No I don't know If Yes, please identify theareas:
Do you think that certain geographic areas or neighborhoods in the County are undesirable places to live?
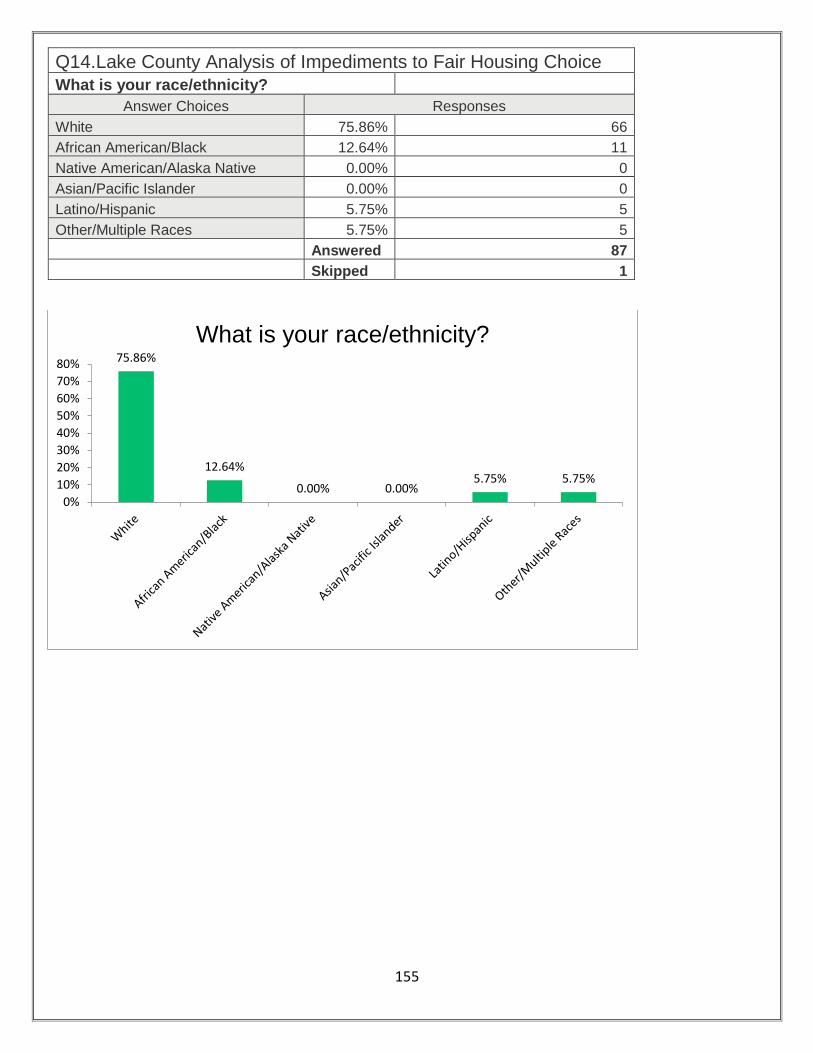
155
Q14.Lake County Analysis of Impediments to Fair Housing Choice
What is your race/ethnicity? Answer Choices Responses
White 75.86% 66
African American/Black 12.64% 11
Native American/Alaska Native 0.00% 0
Asian/Pacific Islander 0.00% 0
Latino/Hispanic 5.75% 5
Other/Multiple Races 5.75% 5
Answered 87
Skipped 1
75.86%
12.64%
0.00% 0.00%5.75% 5.75%
0%
10%
20%
30%
40%
50%
60%
70%
80%
What is your race/ethnicity?

156
Q15.Lake County Analysis of Impediments to Fair Housing Choice
What is your gender? Answer Choices Responses
Male 27.27% 24
Female 72.73% 64
Other (please specify) 0.00% 0
Answered 88
Skipped 0
Male Female Other (please specify)
0.00%
10.00%
20.00%
30.00%
40.00%
50.00%
60.00%
70.00%
80.00%
What is your gender?

157
Q16.Lake County Analysis of Impediments to Fair Housing Choice
What is your age group?
Answer Choices Responses
Under 18 0.00% 0
18-24 3.45% 3
25-34 21.84% 19
35-44 32.18% 28
45-54 17.24% 15
55-61 11.49% 10
62-74 10.34% 9
75+ 3.45% 3
Answered 87
Skipped 1
0.00%
3.45%
21.84%
32.18%
17.24%
11.49%10.34%
3.45%
Under 18 18-24 25-34 35-44 45-54 55-61 62-74 75+
0%
5%
10%
15%
20%
25%
30%
35%
What is your age group?

158
Q17.Lake County Analysis of Impediments to Fair Housing Choice
What is your marital status? Answer Choices Responses
Married 50.00% 44
Single, head of household 28.41% 25
Domestic partner 4.55% 4
Divorced 14.77% 13
Widowed 2.27% 2
Answered 88
Skipped 0
Married Single, head ofhousehold
Domesticpartner
Divorced Widowed
0.00%
10.00%
20.00%
30.00%
40.00%
50.00%
60.00%
What is your marital status?
Responses

159
Q18.Lake County Analysis of Impediments to Fair Housing Choice
Do you have children under the age of 18 years in your household?
Answer Choices Responses
Yes 50.00% 44
No 50.00% 44
Answered 88
Skipped 0
Yes No
0.00%
10.00%
20.00%
30.00%
40.00%
50.00%
60.00%
Do you have children under the age of 18 years in your household?
Responses
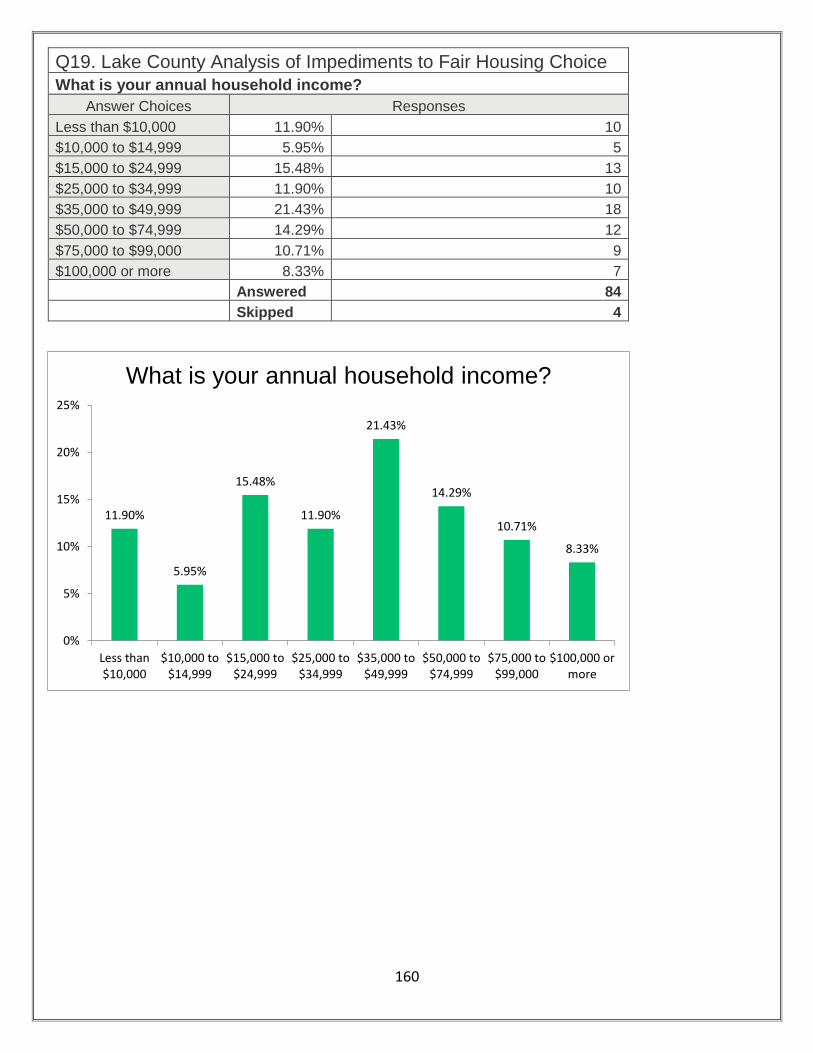
160
Q19. Lake County Analysis of Impediments to Fair Housing Choice
What is your annual household income?
Answer Choices Responses
Less than $10,000 11.90% 10
$10,000 to $14,999 5.95% 5
$15,000 to $24,999 15.48% 13
$25,000 to $34,999 11.90% 10
$35,000 to $49,999 21.43% 18
$50,000 to $74,999 14.29% 12
$75,000 to $99,000 10.71% 9
$100,000 or more 8.33% 7
Answered 84
Skipped 4
11.90%
5.95%
15.48%
11.90%
21.43%
14.29%
10.71%
8.33%
Less than$10,000
$10,000 to$14,999
$15,000 to$24,999
$25,000 to$34,999
$35,000 to$49,999
$50,000 to$74,999
$75,000 to$99,000
$100,000 ormore
0%
5%
10%
15%
20%
25%
What is your annual household income?
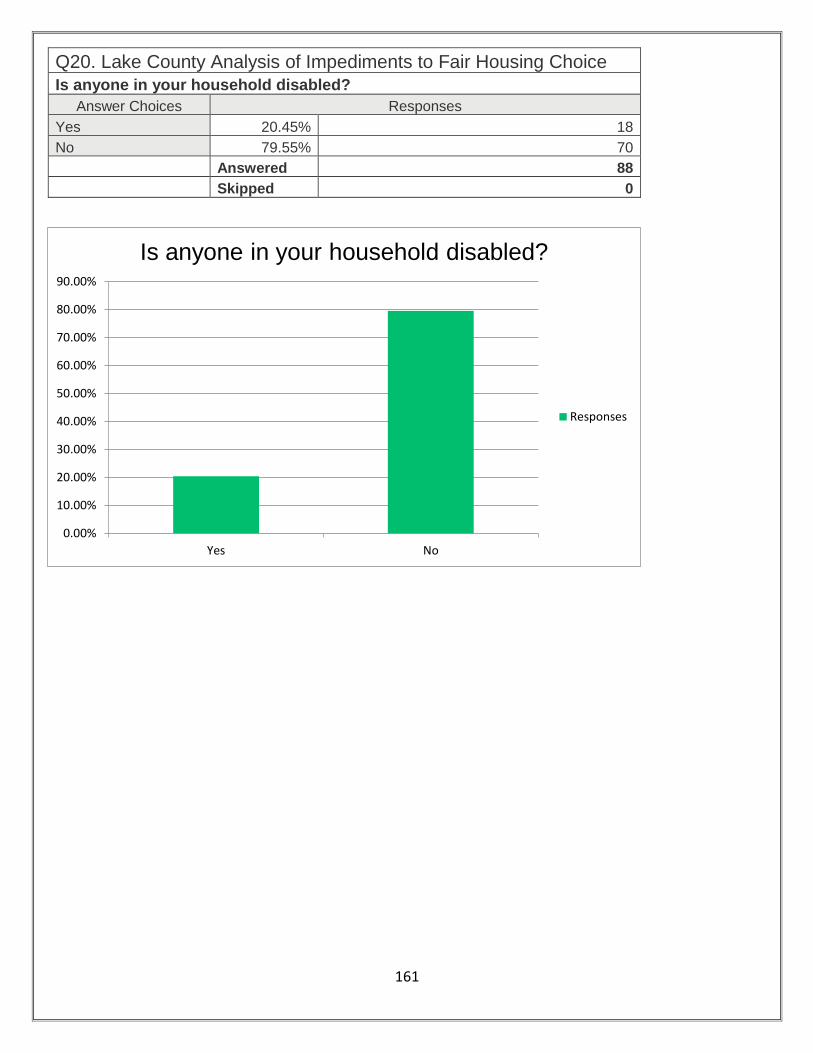
161
Q20. Lake County Analysis of Impediments to Fair Housing Choice
Is anyone in your household disabled?
Answer Choices Responses
Yes 20.45% 18
No 79.55% 70
Answered 88
Skipped 0
Yes No
0.00%
10.00%
20.00%
30.00%
40.00%
50.00%
60.00%
70.00%
80.00%
90.00%
Is anyone in your household disabled?
Responses

162
Q21. Lake County Analysis of Impediments to Fair Housing Choice
Are languages other than English spoken in your household?
Answer Choices Responses
Spanish 25.81% 8
Creole 3.23% 1
Vietnamese 0.00% 0
Chinese 0.00% 0
Other (please specify) 70.97% 22
Answered 31
Skipped 57
Spanish Creole Vietnamese Chinese Other (pleasespecify)
0.00%
10.00%
20.00%
30.00%
40.00%
50.00%
60.00%
70.00%
80.00%
Are languages other than English spoken in your household?
Responses