2018 fourth quarter project progress and financial update
TRANSCRIPT
Released: February 2019
San Francisco Bay Area Toll Bridge Seismic Retrofi t Program2018 Fourth Quarter Project Progress and Financial Update


Program Management Team
Andrew FremierBay Area Toll Authority
Chris TrainaCalifornia Transportation Commission
Dan McElhinneyCaltrans District 4 - Bay Area
Brian Maroney Caltrans, SFOBB Chief Engineer

CONTENTSIntroduction 1
Toll Bridge Seismic Retrofi t Program Cost Summary 2
Toll Bridge Seismic Retrofi t Program Schedule Summary 3
San Francisco-Oakland Bay Bridge Seismic Retrofi t 4
Active Contracts:
Yerba Buena Island Transition Structures #2 5
504’/288’ Structures Dismantling 5
Marine Foundations 6
Marine Foundation Pier Retention and Public Access Facilities 7
Self-Anchored Suspension Bridge Superstructure 8
TBSRP Risk Management Program Update 9
Program Funding Status 12
Quarterly Environmental Compliance Highlights 14
Appendices 15
Cover:(Top) Pier E2 Pier Concrete Deck Pour, Photo by Caltrans.
Cover (Bottom) Concrete Girder Installation between E22 and E23 Photo by Caltrans.
Contents: SFOBB East Spans, looking east. Photo by Caltrans.
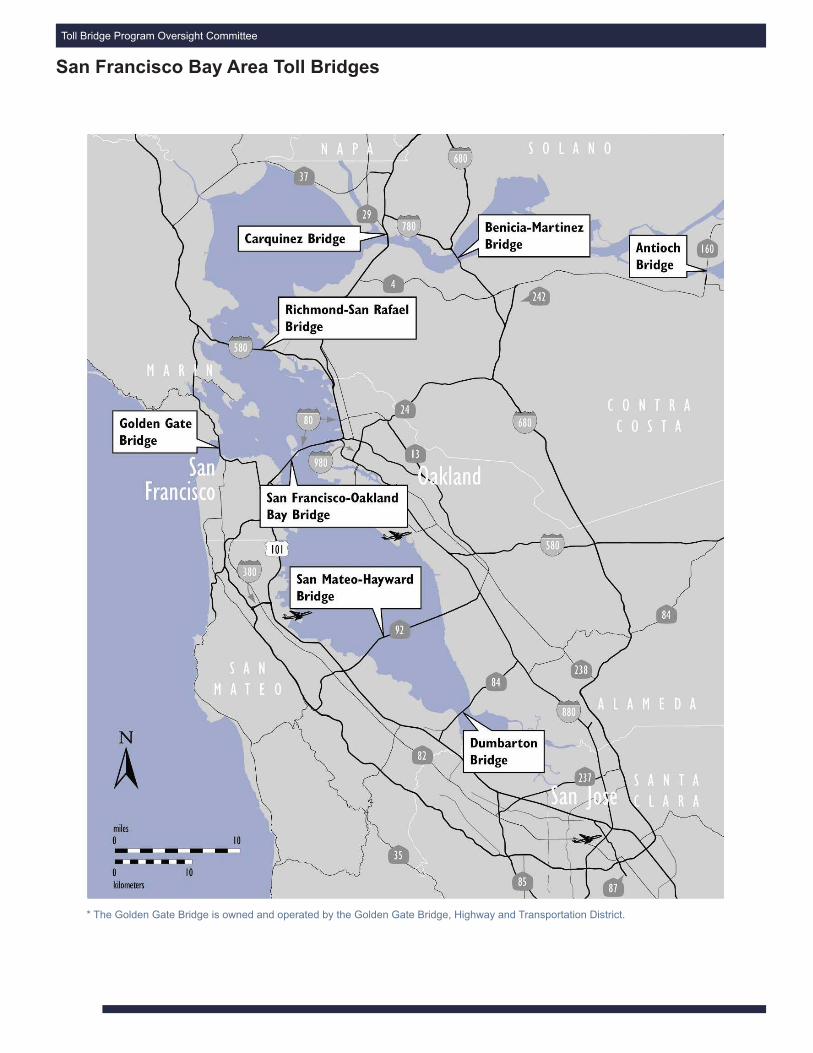
* The Golden Gate Bridge is owned and operated by the Golden Gate Bridge, Highway and Transportation District.
San Francisco Bay Area Toll Bridges
Toll Bridge Program Oversight Committee
San Francisco Bay Area Toll Bridges
In July 2005, Assembly Bill (AB) 144 (Hancock) created the Toll Bridge Program Oversight Committee (TBPOC) to implement a project oversight and project control process for the new Benicia-Martinez Bridge and State Toll Bridge Seismic Retrofi t Program (TBSRP) projects. The TBPOC consists of the Director of the California Department of Transportation (Caltrans), the Executive Director of the Bay Area Toll Authority (BATA) and the Executive Director of the California Transportation Commission (CTC). The TBPOC’s project oversight and control processes include, but are not limited to, reviewing bid specifi cations and documents, reviewing and approving signifi cant change orders and claims in excess of $1 million (as defi ned by the TBPOC), and keeping the Legislature and others apprised of current project progress and status. In January 2010, Assembly Bill (AB) 1175 (Torlakson) amended the TBSRP to include the Antioch and Dumbarton Bridges seismic retrofi t projects. The current TBSRP is as follows:
2018 Fourth Quarter Project Progress and Financial Update
1
Toll Bridge Seismic Retrofi t Projects Seismic Safety StatusDumbarton Bridge Seismic Retrofi t CompleteAntioch Bridge Seismic Retrofi t CompleteSan Francisco-Oakland Bay Bridge East Span Replacement CompleteSan Francisco-Oakland Bay Bridge West Approach Replacement CompleteSan Francisco-Oakland Bay Bridge West Span Seismic Retrofi t CompleteSan Mateo-Hayward Bridge Seismic Retrofi t CompleteRichmond-San Rafael Bridge Seismic Retrofi t Complete1958 Carquinez Bridge Seismic Retrofi t Complete1962 Benicia-Martinez Bridge Seismic Retrofi t CompleteSan Diego-Coronado Bridge Seismic Retrofi t CompleteVincent Thomas Bridge Seismic Retrofi t Complete
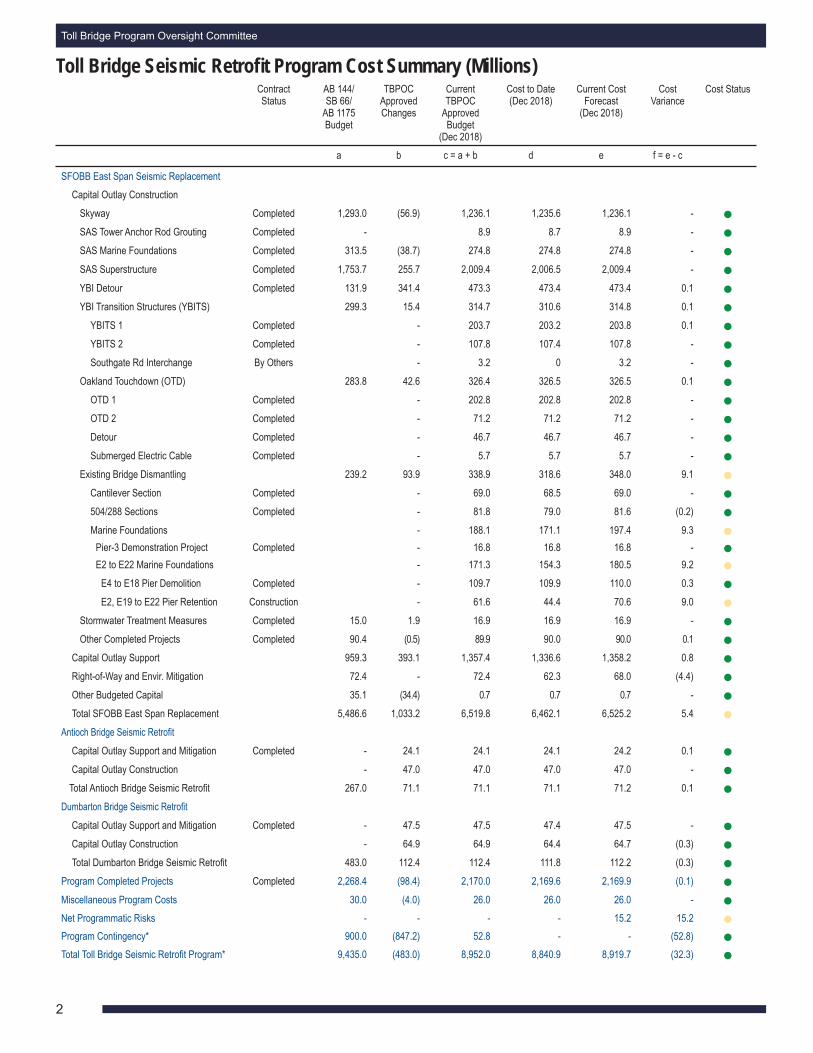
Toll Bridge Seismic Retrofi t Program Cost Summary (Millions)Toll Bridge Program Oversight Committee
2
Contract Status
AB 144/SB 66/
AB 1175 Budget
TBPOCApproved Changes
Current TBPOC
Approved Budget
(Dec 2018)
Cost to Date (Dec 2018)
Current Cost Forecast
(Dec 2018)
Cost Variance
Cost Status
a b c = a + b d e f = e - c
SFOBB East Span Seismic ReplacementCapital Outlay Construction
Skyway Completed 1,293.0 (56.9) 1,236.1 1,235.6 1,236.1 - ●SAS Tower Anchor Rod Grouting Completed - 8.9 8.7 8.9 - ●SAS Marine Foundations Completed 313.5 (38.7) 274.8 274.8 274.8 - ●SAS Superstructure Completed 1,753.7 255.7 2,009.4 2,006.5 2,009.4 - ●YBI Detour Completed 131.9 341.4 473.3 473.4 473.4 0.1 ●YBI Transition Structures (YBITS) 299.3 15.4 314.7 310.6 314.8 0.1 ●
YBITS 1 Completed - 203.7 203.2 203.8 0.1 ●YBITS 2 Completed - 107.8 107.4 107.8 - ●Southgate Rd Interchange By Others - 3.2 0 3.2 - ●
Oakland Touchdown (OTD) 283.8 42.6 326.4 326.5 326.5 0.1 ●OTD 1 Completed - 202.8 202.8 202.8 - ●OTD 2 Completed - 71.2 71.2 71.2 - ●Detour Completed - 46.7 46.7 46.7 - ●Submerged Electric Cable Completed - 5.7 5.7 5.7 - ●
Existing Bridge Dismantling 239.2 93.9 338.9 318.6 348.0 9.1 ●Cantilever Section Completed - 69.0 68.5 69.0 - ●504/288 Sections Completed - 81.8 79.0 81.6 (0.2) ●Marine Foundations - 188.1 171.1 197.4 9.3 ●
Pier-3 Demonstration Project Completed - 16.8 16.8 16.8 - ●E2 to E22 Marine Foundations - 171.3 154.3 180.5 9.2 ●
E4 to E18 Pier Demolition Completed - 109.7 109.9 110.0 0.3 ●E2, E19 to E22 Pier Retention Construction - 61.6 44.4 70.6 9.0 ●
Stormwater Treatment Measures Completed 15.0 1.9 16.9 16.9 16.9 - ●Other Completed Projects Completed 90.4 (0.5) 89.9 90.0 90.0 0.1 ●
Capital Outlay Support 959.3 393.1 1,357.4 1,336.6 1,358.2 0.8 ●Right-of-Way and Envir. Mitigation 72.4 - 72.4 62.3 68.0 (4.4) ●Other Budgeted Capital 35.1 (34.4) 0.7 0.7 0.7 - ●Total SFOBB East Span Replacement 5,486.6 1,033.2 6,519.8 6,462.1 6,525.2 5.4 ●
Antioch Bridge Seismic Retrofi t
Capital Outlay Support and Mitigation Completed - 24.1 24.1 24.1 24.2 0.1 ●Capital Outlay Construction - 47.0 47.0 47.0 47.0 - ●
Total Antioch Bridge Seismic Retrofi t 267.0 71.1 71.1 71.1 71.2 0.1 ●Dumbarton Bridge Seismic Retrofi t
Capital Outlay Support and Mitigation Completed - 47.5 47.5 47.4 47.5 - ●Capital Outlay Construction - 64.9 64.9 64.4 64.7 (0.3) ●Total Dumbarton Bridge Seismic Retrofi t 483.0 112.4 112.4 111.8 112.2 (0.3) ●
Program Completed Projects Completed 2,268.4 (98.4) 2,170.0 2,169.6 2,169.9 (0.1) ●Miscellaneous Program Costs 30.0 (4.0) 26.0 26.0 26.0 - ●Net Programmatic Risks - - - - 15.2 15.2 ●Program Contingency* 900.0 (847.2) 52.8 - - (52.8) ●Total Toll Bridge Seismic Retrofi t Program* 9,435.0 (483.0) 8,952.0 8,840.9 8,919.7 (32.3) ●

Toll Bridge Seismic Retrofi t Program Schedule Summary2018 Fourth Quarter Project Progress and Financial Update
3
AB 144/SB 66 Project Completion Schedule Baseline
(July 2005)
TBPOC Approved Changes (Months)
Current TBPOC Approved Completion
Schedule (Dec 2018)
Current Completion Forecast
(Dec 2018)
Schedule Variance (Months)
Schedule Status
g h i = g + h j k = j - i l
SFOBB East Span Seismic Replacement
Contract Completion
Skyway Apr 2007 8 Dec 2007 Dec 2007 - ●SAS Marine Foundations Jun 2008 (5) Jan 2008 Jan 2008 - ●SAS Superstructure Mar 2012 42 Sep 2015 Sep 2015 - ●YBI Detour Jul 2007 39 Oct 2010 Oct 2010 - ●YBI Transition Structures (YBITS) Nov 2013 36
YBITS 1 Feb 2014 Feb 2014 - ●YBITS 2 Nov 2017 Nov 2017 - ●
Oakland Touchdown Nov 2013 10
OTD 1 Jun 2010 Jun 2010 - ●OTD 2 Sep 2015 Sep 2015 - ●Submerged Electric Cable Jan 2008 Jan 2008 - ●
Existing Bridge Dismantling Sep 2014 48 Sep 2018 Sep 2018 - ●Cantilever Section (2) Jul 2015 Jul 2015 - ●504/288 Sections Jun 2017 Jun 2017 - ●Marine Foundations
E3 Foundation Removal Demo Project Jan 2016 Jan 2016 - ●E4 - E18 Foundation Removal Dec 2018 Dec 2018 - ●E19 - E20 Foundation Removal ep 2018 Sep 2018 - ●E2, E21 to E22 Pier Retention Aug 2019 Aug 2019 - ●
Stormwater Treatment Measures Mar 2008 Mar 2008 - ●SFOBB East Span Bridge Opening and Other Milestones
Westbound Seismic Safety Open Sep 2011 24 Sep 2013 Sep 2013 - ●Eastbound Seismic Safety Open Sep 2012 12 Sep 2013 Sep 2013 - ●Bike/Ped Path to YBI Landing Dec 2015 Oct 2016 - ●Eastbound On-Ramp Jun 2016 Jun 2016 - ●
Within approved schedule and budgetIdentifi ed potential project risks that could signifi cantly impact approved schedules and budgets if not mitigatedKnown project impacts with forthcoming changes to approved schedules and budgets
Footnotes for Page 2 Toll Bridge Seismic Retrofi t Program Cost Summary Table *AB144/SB66 established a funding level of $8.685 Billion in July 2005 for TBSRP, AB1175 added the retrofi tting of the Antioch and Dumbarton Bridges in January 2010, providing another $750 million in funding,
bringing Total Toll Seismic Retrofi t Program funding to $9.435 Billion. Since 2010, $483 million has been removed from the program, bringing the current TBPOC Approved Budget to $8.952 Billion. The $483 million removed consisted of:Antioch Savings (4/12/10) $137 million - Dumbarton Savings (9/02/10) $216 million - Program Contingency Redirection (11/05/13) $130 million, the current TBPOC approved Program Budget is $8,952 million.
**(Due to the rounding of numbers, the totals above are shown within $0.1).

San Francisco-Oakland Bay Bridge East Span Replacement ProjectSeismic Retrofi t
Rather than a seismic retrofi t, the two-mile long east span of the San Francisco-Oakland Bay Bridge has been completely rebuilt. The new east span consists of several different sections, yet appears as a single streamlined span. The eastbound and westbound lanes of the east span no longer include upper and lower decks. The lanes are side-by-side, providing motorists with expansive views of the bay. These views are also enjoyed by bicyclists and pedestrians, thanks to a new bicycle/pedestrian path on the south side of the bridge that will extend all the way to Yerba Buena Island. The new span features the world’s longest Self-Anchored Suspension (SAS) bridge that connects to an elegant roadway supported by piers (Skyway), which gradually slopes down toward the Oakland shoreline (Oakland Touchdown).
Toll Bridge Program Oversight Committee
4 West Approach West Span
SFOBB Self Anchor Suspension Span, looking west. Photo courtesy of Caltrans.

YBI Transition Structures, bicycle/pedestrian path landing, and YBI on/off-ramps, looking north. Photo courtesy of Caltrans.
San Francisco-Oakland Bay Bridge East Span Replacement Project
YBITS 2 - Eastbound On-Ramp and Cantilever DismantlingApproved Capital Outlay Budget: $107.8 MContractor: CEC & Silverado, JVStatus: 100% Complete
The YBITS 2 contract involves dismantling the detour viaduct, constructing a new eastbound on-ramp to the bridge, completing the bicycle/pedestrian path to Yerba Buena Island, and dismantling the cantilever.
The contract was awarded to California Engineering Contractors Inc./Silverado Contractors Inc., Joint Venture on November 28, 2012. Startup activities and submittals began in March 2013, with actual dismantling starting after the seismic safety opening during Labor Day weekend in 2013.
Status: Cantilever removal was completed in July 2015. The eastbound on-ramp was opened on June 2, 2016. The pedestrian/bicycle path opened in October 2016. Construction was complete on November 29, 2017.
504’/288’ Superstructure DismantlingApproved Capital Outlay Budget: $81.8 MContractor: CEC & Silverado JVStatus: 100% Complete
The contractor sequenced the bridge removal operations into seven phases of dismantling beginning with the upper deck and initial truss removal, followed by the removal of the 504’ and 288’ steel truss spans, and ending with the removal of the supporting steel columns.
Status: The fi rst of fi ve 504’ main truss spans was lowered in February 2016. The last 504’ section was lowered in August 2016. The first of fourteen 288’ sections was lowered in November 2016. The last section was lowered in March 2017. The project reached substantial completion in June 2017.
2018 Fourth Quarter Project Progress and Financial Update
5Yerba Buena Island Transition SAS Skyway Oakland Touchdown

Piers E19-20 being demolished> Photo courtesy of Caltrans .
San Francisco-Oakland Bay Bridge East Span Replacement Project
Marine Foundation DemolitionApproved Capital Outlay Budget: Pier E3 - $16.8 M Piers E4-E18 - $109.7 MContractor: Kiewit/MansonStatus: 100% Complete
The original east span of the San Francisco-Oakland Bay Bridge was supported by 21 in-water bridge piers, Piers E2 through E22, along with land based piers at Yerba Buena Island and Oakland. Part of this project is the demolition of Pier E3, which is located 1,535 feet east of Yerba Buena Island and on the east side of a 50-foot deep navigation channel.
The marine foundation removal is a CMGC (Construction Manager / General Contractor) contract and the selected CMGC contractor is a Kiewit/Manson team (KM).
Status: E3 through E18 marine foundations have been removed. This contract is now complete.
Toll Bridge Program Oversight Committee
6 West Approach West Span

Public access facility in Oakland for Piers E21-23 under constructionPhoto courtesy of Caltrans.
San Francisco-Oakland Bay Bridge East Span Replacement Project
Marine Foundation Demolition and Public Access PiersApproved Capital Outlay Budget: $61.6 MContractor: Kiewit/MansonStatus: 74% Complete as of December 2018
The Bay Bridge project environmental document and resource agency permits included removing all marine based piers of the old Bay Bridge east span. In lieu of removing the piers, the TBPOC was presented with a proposal to re-purpose the piers as part of observations decks along both the YBI shoreline and Oakland shoreline as environmental enhancements.
Caltrans awarded a contract to Kiewit/Manson on April 3, 2018 to demolish piers E19 and E20 and construct the observation decks and associated access improvements from Piers E21 to E23 and at Pier E2.
Status: E19 and E20 marine foundations were removed in September 2018. The team is now constructing observation piers at E2 and E21-E22. Pier girders have been installed on both the SF and Oakland sides. The Contractor is fi nishing the pier decks and working on railings, approaches and furnishings. Work is expected to be completed in August 2019.
In December 2018, the TBPOC approved by a vote of 3-0 (3 votes yes, 0 no) for the naming of the YBI Pier E2 Boardwalk after the late TBPOC member and Executive Director of CTC, Bimla Rhinehart.
2018 Fourth Quarter Project Progress and Financial Update
7Yerba Buena Island Transition SAS Skyway Oakland Touchdown

Toll Bridge Program Oversight Committee
8
San Francisco-Oakland Bay Bridge East Span Replacement Project
Self-Anchored Suspension Bridge SuperstructureApproved Capital Outlay Budget: $2.01 BContractor: American Bridge/Fluor Enterprises, JVStatus: 100% Complete
The self-anchored suspension span (SAS) of the bridge is not just another suspension bridge. Rising 525 feet above mean sea level and embedded in bedrock, the single-tower SAS span is designed to withstand a massive earthquake. Traditional main cable suspension bridges have twin cables with smaller suspender cables connected to them. While there appears to be two main cables on the SAS, it is actually a single continuous cable. This single cable is anchored within the eastern end of the roadway, carried over the tower and then wrapped around the two side-by-side decks at the western end.
The single-steel tower is made up of four separate legs connected by shear link beams, which function much like a fuse in an electrical circuit. These beams will absorb most of the impact from an earthquake, preventing damage to the tower legs.
SFOBB Self-Anchored SuspensionStructure, looking northeast. Photo courtesy of Caltrans.
Status: During the contract arbitration process for the SAS Contract dispute with the contractor, the parties met in mediation and reached a tentative agreement for the settlement of all claims for a payment of $25.5 million to the Contractor and a waiver of $8,536,370 in accounts receivable. The settlement was presented and approved by the TBPOC at their June 21, 2018 meeting and payment was made to the contractor soon thereafter. The contract is now complete.
2018 Fourth Quarter Project Progress and Financial Update
9
Risk Management Program Update P D O P R (P C )
Caltrans continues to implement comprehensive risk management on all TBSRP projects in accordance with AB 144. Risk response efforts continue to focus on mitigating the estimated cost and schedule impacts of identifi ed risks. The “bottom line” of cost risk analysis is whether the Program Contingency remains adequate to cover all identifi ed risks.
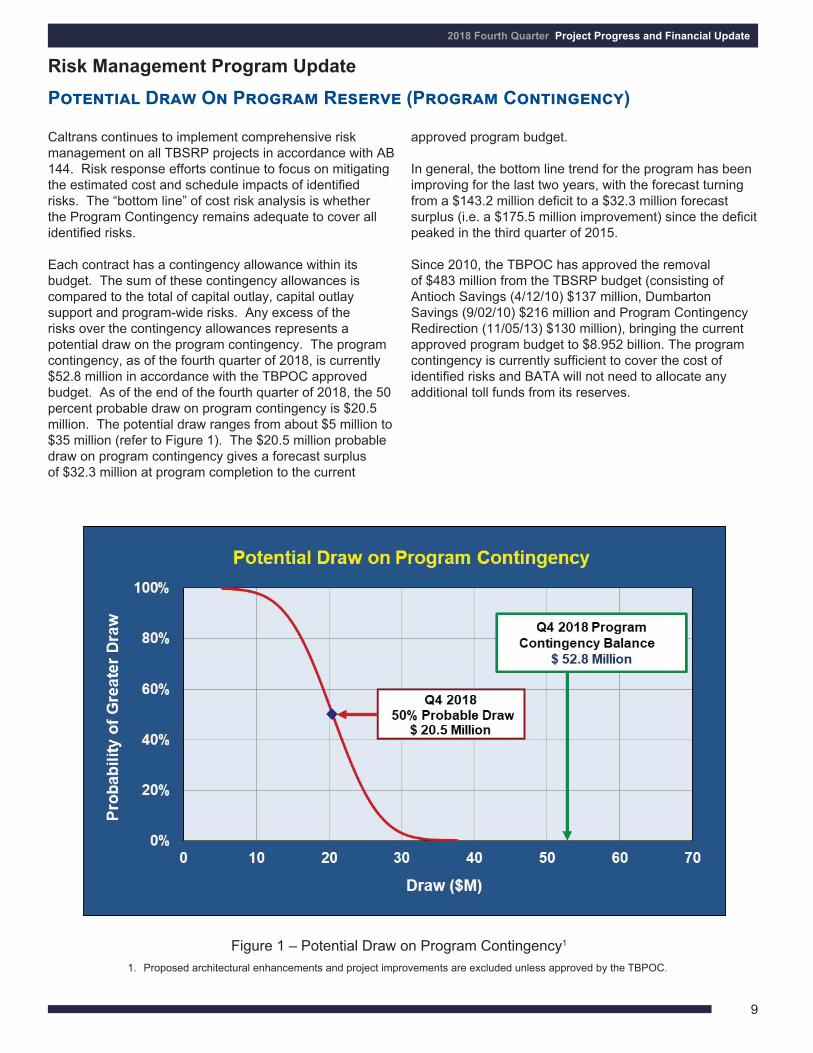
Each contract has a contingency allowance within its budget. The sum of these contingency allowances is compared to the total of capital outlay, capital outlay support and program-wide risks. Any excess of the risks over the contingency allowances represents a potential draw on the program contingency. The program contingency, as of the fourth quarter of 2018, is currently $52.8 million in accordance with the TBPOC approved budget. As of the end of the fourth quarter of 2018, the 50 percent probable draw on program contingency is $20.5 million. The potential draw ranges from about $5 million to $35 million (refer to Figure 1). The $20.5 million probable draw on program contingency gives a forecast surplus of $32.3 million at program completion to the current
approved program budget.
In general, the bottom line trend for the program has been improving for the last two years, with the forecast turning from a $143.2 million defi cit to a $32.3 million forecast surplus (i.e. a $175.5 million improvement) since the defi cit peaked in the third quarter of 2015.
Since 2010, the TBPOC has approved the removal of $483 million from the TBSRP budget (consisting of Antioch Savings (4/12/10) $137 million, Dumbarton Savings (9/02/10) $216 million and Program Contingency Redirection (11/05/13) $130 million), bringing the current approved program budget to $8.952 billion. The program contingency is currently suffi cient to cover the cost of identifi ed risks and BATA will not need to allocate any additional toll funds from its reserves.
Figure 1 – Potential Draw on Program Contingency1
1. Proposed architectural enhancements and project improvements are excluded unless approved by the TBPOC.

Toll Bridge Program Oversight Committee
10
RISK MANAGEMENT DEVELOPMENTS
Close-Out of Toll Bridge Seismic Retrofi t Program
On December 10, 2018, the TBPOC met and approved the fi nal Toll Bridge Program Budget to be reported in this 2018 Fourth Quarter Project Progress and Financial Update to the Legislature and the California Transportation Commission. Caltrans verifi ed that all seismic retrofi t projects in the program were complete, that the objectives of the Toll Bridge Seismic Retrofi t Program as described in AB144 have been fulfi lled, and there are no more activities which require oversight by the TBPOC. Additionally, the TBPOC approved the transfer of remaining budget to BATA and assigned the oversight of the remaining minor work activities to BATA/Caltrans as part of their on-going Toll Bridge Rehabilitation Program (Rehab).
The fi nal budget includes all recent TBPOC actions regarding pier retention and capital outlay support. This fi nal budget was also approved by BATA in early January 2019. The overall program budget remained $8,952 million and maintained a $52.8 program contingency.
The risk management team were asked to forecast the fi nal program forecast numbers using November 2018 budget, cost expenditures and risk information. The risk team forecast a probable draw (50% probable) of $18.0 million on the $52.8 million in program contingency at program completion and a forecast draw of $26.2 million, when using the 90% confi dence level (i.e. confi dence level used when removing funds from the program in the past). The TBPOC approved keeping this $26.2 million set aside in the BATA Rehab program to cover any residual seismic program costs. These costs could include risks to complete the pier retention work and any associated delays, close out of hazardous sites on YBI, environmental compliance, and disposition of right-of-way. The other $26.6 million (i.e. $52.8-$26.2) in program contingency will be transferred back to BATA. This $26.6 million, along with the $483 million previously transferred back to BATA, brings the total to $509.6 million in seismic toll funds being made available to fund other Bay Area transportation projects.
The project team led by the Bay Bridge Chief Engineer will continue to meet weekly in 2019 and plan to brief Caltrans
Public access facility in Oakland for Piers E21-23 under constructionPhoto courtesy of Caltrans.

2018 Fourth Quarter Project Progress and Financial Update
11
and BATA on progress regularly until all fi eld work and closeout activities (i.e. as-builts, archiving, media inquiries, annual FHWA report, fi nal audit and accounting) are complete.
SFOBB East Span COS Budget
Budget to Completion: The fourth quarter 2018 COS forecast to completion is $1,357.9 million, which results in a cost variance of $0.6 million to the current budget. This is a $46.9 million improvement over the fourth quarter 2015 forecast, when the COS forecast peaked at $1,404.8 million. The current approved budget of $1,357.36 million for SFOBB East Span COS is expected to fund the program COS through completion of close-out activities.
Expenditures vs. Budget for 2018/19 Fiscal Year: On October 22, 2018, the TBPOC approved a total COS budget of $14.6 million for the 2018/19 fi scal year. The actual expenditure for FY 2018/19 through December 31 2018 was $6.7 million, running below the expected cost of $7.3 million for the same period. This keeps the program on target to deliver the planned work at or under the approved COS budget.
Marine Foundation E2, E21 & E22 Pier Retention
Permitting Contract for E2, E21, E22 Pier Retention & E19, E20 Demolition: The project environmental team diligently pursued seven different permits and secured the permits by the end of July to allow the contract to be substantially complete with all marine work by December 31, 2018. Marine work is now complete and the contractor has demobilized his marine fl eet, thereby signifi cantly reducing the project’s exposure to delay costs. The permits came with additional requirements which the team worked to build into the contract during the fourth quarter.
On November 6 2018, the TBPOC approved $5.8 million in additional funding to fund this added scope. BCDC may require additional amenities be added to this project prior to allowing the piers to be accessed by the public. If required, the additional amenities would be funded from the $26.2 million in TBSRP funds transferred to the Rehab Program that the TBPOC approved as a reserve for any residual seismic program obligations.
Close Out of historic contaminated sites on YBI: There are several historic contaminated sites on YBI that were the result of the Navy’s past activities on the island. The Navy postponed clean-up of these sites pending completion of the SFOBB East Span replacement project. One of these sites (Site #11) lies under the area the TBSRP plans to build a parking lot to facilitate public access to pier E2. There is a risk that, to move the Pier Retention project forward, the project might be held responsible for a portion of the cleanup costs. Remediation would be funded from TBSRP funds transferred to the Rehab Program that the TBPOC approved as a reserve for any residual seismic
program obligations.
The project team has identifi ed several risks in the program risk registers that the project might be found to be the responsible party for these sites rehabilitation. These risks carry a high-end exposure of $10 million, with a probable cost of $6.1 million carried in the forecast numbers of the program risk register. The risks could be funded from TBSRP funds transferred to the Rehab Program that the TBPOC approved as a reserve for any residual seismic program obligations.
Caltrans is currently developing a work plan to defi ne the nature and extent of the contamination and developing a scoping document for remediation alternatives as it relates to interim work, and long-term remediation. Once approved, implementation of these remediation alternatives will take place and then monitoring and reporting may take 1-5 years to complete.
RISK MANAGEMENT LOOK AHEAD
Marine Foundation E2, E21 & E22 Pier Retention
Increased cost of required permit amenities: The project environmental team secured the required permits by the end of July to allow the contract to be substantially complete with all marine work by December 31, 2018. The permits came with additional requirements which the team worked to build into the contract during the fourth quarter 2018. These additional permit requirements came at an additional cost of about $5.8 million, which was allocated to the contract by the TBPOC during the Nov 6 2018 TBPOC meeting. BCDC may require additional amenities prior to closing out the project/program environmental permit.
Close Out Historic Contaminated Sites on YBI
Project Environmental and Legal team will reinitiate coordination with the US Navy in accordance with the Interim Site 11 Remedial Investigation Report (2010). Caltrans will work with the Navy to consult with resource agencies to develop workplans for fi nal closure of these contaminated sites.
Toll Bridge Program Oversight Committee
12
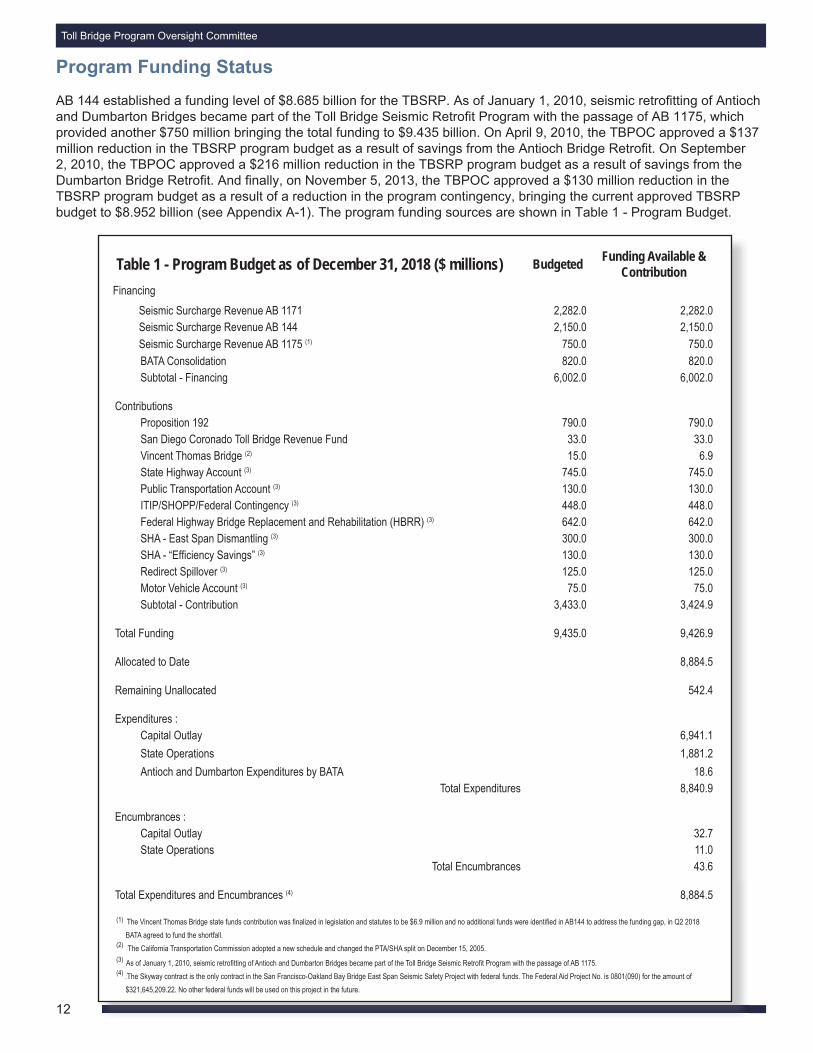
Program Funding StatusAB 144 established a funding level of $8.685 billion for the TBSRP. As of January 1, 2010, seismic retrofi tting of Antioch and Dumbarton Bridges became part of the Toll Bridge Seismic Retrofi t Program with the passage of AB 1175, which provided another $750 million bringing the total funding to $9.435 billion. On April 9, 2010, the TBPOC approved a $137 million reduction in the TBSRP program budget as a result of savings from the Antioch Bridge Retrofi t. On September 2, 2010, the TBPOC approved a $216 million reduction in the TBSRP program budget as a result of savings from the Dumbarton Bridge Retrofi t. And fi nally, on November 5, 2013, the TBPOC approved a $130 million reduction in the TBSRP program budget as a result of a reduction in the program contingency, bringing the current approved TBSRP budget to $8.952 billion (see Appendix A-1). The program funding sources are shown in Table 1 - Program Budget.
Table 1 - Program Budget as of December 31, 2018 ($ millions) Budgeted Funding Available & Contribution
FinancingSeismic Surcharge Revenue AB 1171 2,282.0 2,282.0 Seismic Surcharge Revenue AB 144 2,150.0 2,150.0 Seismic Surcharge Revenue AB 1175 (1) 750.0 750.0 BATA Consolidation 820.0 820.0 Subtotal - Financing 6,002.0 6,002.0
ContributionsProposition 192 790.0 790.0 San Diego Coronado Toll Bridge Revenue Fund 33.0 33.0 Vincent Thomas Bridge (2) 15.0 6.9 State Highway Account (3) 745.0 745.0 Public Transportation Account (3) 130.0 130.0 ITIP/SHOPP/Federal Contingency (3) 448.0 448.0 Federal Highway Bridge Replacement and Rehabilitation (HBRR) (3) 642.0 642.0 SHA - East Span Dismantling (3) 300.0 300.0 SHA - “Effi ciency Savings” (3) 130.0 130.0 Redirect Spillover (3) 125.0 125.0 Motor Vehicle Account (3) 75.0 75.0 Subtotal - Contribution 3,433.0 3,424.9
Total Funding 9,435.0 9,426.9
Allocated to Date 8,884.5
Remaining Unallocated 542.4
Expenditures :Capital Outlay 6,941.1State Operations 1,881.2Antioch and Dumbarton Expenditures by BATA 18.6
Total Expenditures 8,840.9
Encumbrances : Capital Outlay 32.7State Operations 11.0
Total Encumbrances 43.6
Total Expenditures and Encumbrances (4) 8,884.5
(1) The Vincent Thomas Bridge state funds contribution was fi nalized in legislation and statutes to be $6.9 million and no additional funds were identifi ed in AB144 to address the funding gap, in Q2 2018 BATA agreed to fund the shortfall.
(2) The California Transportation Commission adopted a new schedule and changed the PTA/SHA split on December 15, 2005. (3) As of January 1, 2010, seismic retrofi tting of Antioch and Dumbarton Bridges became part of the Toll Bridge Seismic Retrofi t Program with the passage of AB 1175.(4) .The Skyway contract is the only contract in the San Francisco-Oakland Bay Bridge East Span Seismic Safety Project with federal funds. The Federal Aid Project No. is 0801(090) for the amount of
$321,645,209.22. No other federal funds will be used on this project in the future.

2018 Fourth Quarter Project Progress and Financial Update
13
Summary of the Toll Bridge Oversight Committee ExpensesPursuant to Streets and Highways Code Section 30952.1 (d), expenses incurred by Caltrans, BATA, and the California Transportation Commission (CTC) for costs directly related to the duties associated with the TBPOC are to be reimbursed by toll revenues. Table 3 -Toll Bridge Program Oversight Committee Estimated Expenses: July 1, 2005, through December 31, 2018, for TBPOC functioning, support, and monthly and quarterly reporting.
Table 2—CTC Toll Bridge Seismic Retrofi t Program Contributions Adopted December 2005Schedule of Contributions to the Toll Bridge Seismic Retrofi t Program ($ Millions)
Source Description 2005-06(Actual)
2006-07(Actual)
2007-08(Actual)
2008-09(Actual)
2009-10(Actual)
2010-11(Actual)
2011-12(Actual)
2012-13(Actual)
2013-14(Actual) Total
AB1171
SHA 290 290PTA 80 40 120Highway BridgeReplacementandRehabilitation(HBRR)
100 100 100 42 342
Contingency 1 99 100 100 148 448
AB 144
SHA* 2 8 53 50 17 130Motor VehicleAccount (MVA)
75 75
Spillover 125 125SHA** 300 300Total 547 273 100 43 99 153 150 165 300 1,830
* Caltrans Effi ciency Savings** SFOBB East Span Dismantling Cost. Actual as of December 31, 2018
Table 3—Toll Bridge Program Oversight Committee Estimated Expenses: July 1, 2005 through December 31, 2018 ($ Millions)
Agency/Program Activity Expenses
BATA 3.0
Caltrans 4.3
CTC 3.7
Reporting 5.9
Total Program 16.6

Quarterly Environmental Compliance Highlights
Overall environmental compliance for the San Francisco-Oakland Bay Bridge (SFOBB) East Span Seismic Safety Project (SFOBB Project) has been a success during the 4th Quarter of 2018. The tasks for the current quarter were focused on biological monitoring in support of construction activities, pier retention and pier removal permit compliance, and project close-out.
ENVIRONMENTAL TEAM KEY SUCCESSES
The environmental team conducted construction monitoring throughout the 4th quarter of 2018 to ensure compliance with regulatory approvals for implosion of piers E19 and E20, construction of new public access piers on Yerba Buena Island (YBI) and the Oakland Touchdown (OTD), and dismantling of the construction access trestle at the OTD. Bird monitoring was conducted weekly in compliance with the project’s Bird Monitoring Plans. The goal of this monitoring was to document potential impacts to birds from construction activities. Water quality monitoring was conducted during all in-water work activities, including post-implosion clean-up and OTD trestle dismantling. With approval from the California Department of Fish and Wildlife, the Department proceeded with in-water removal of the temporary trestle piles at OTD during the month of December without a herring waiver. The Department committed to monitoring for herring spawns each day of in-water activity. Monitoring was conducted prior to the start of construction activities each day, including weekends when the contractor worked. No evidence of herring spawning was observed, and all work proceeded without delay due to herring.
The environmental team provided preliminary monitoring results from the Pier E19 and E20 implosion event to applicable regulatory agencies throughout the end of the 3rd quarter of 2018. The team assembled a fi nal report summarizing the monitoring results of the 2018 pier implosion event throughout the 4th quarter of 2018 that will be submitted to the regulatory agencies in February 2019. Monitoring during the implosion event indicated impacts were less than or equal to what was anticipated, indicating there was no unauthorized take of fi sh or marine mammals and water quality parameters reached background levels within a few hours.
The environmental team worked closely with the project team, Bay Area Toll Authority (BATA), East Bay Regional Parks District (EBRPD), and the Coastal Conservancy to secure an additional $1.1 million in grant funding for amenities on the OTD public access pier. The task involved extensive coordination between BATA, EBRPD, the Coastal Conservancy and SFOBB construction management to develop a list of additional amenities (e.g., benches, water line, vault toilet) to be funded through a
cooperative funding agreement.
The environmental team worked with EBRPD throughout the 4th quarter of 2018 to resolve the outstanding shorebird roosting habitat mitigation requirement pursuant to conditions of the San Francisco Bay Conservation Development Commission (BCDC) permit for the SFOBB Project. The team has developed a strategy in coordination with EBRPD to fulfi l this mitigation requirement at the Martin Luther King Jr. Regional Shoreline in San Leandro Bay. Meetings were held with BCDC on September 27, 2018 and December 7, 2018 to discuss this option, and the team will continue to work with stakeholders and BCDC to comply with this permit requirement in early 2019.
The environmental team submitted a BCDC permit amendment request for a proposed OTD parking lot and associated infrastructure. The amendment request includes plans for a 63-stall parking lot with sidewalks and shoulders that will satisfy the requirement for a temporary parking lot included in the project’s BCDC permit. The parking lot will also meet the needs of EBRPD and MTC for inclusion into the future Gateway Park.
SFOBB PROJECT CLOSE-OUT
The environmental team continued working on SFOBB Project close-out activities throughout the 4th quarter of 2018. Archiving of key environmental records for the project was conducted throughout the quarter. The team also reviewed the SFOBB Project environmental document and natural resource agency permits and authorizations for outstanding compliance and mitigation items.
To address potential impacts to environmental resources during bridge construction and dismantling, the Department and Federal Highway Administration (FHWA) prepared the SFOBB Project FEIS, dated May 2001, pursuant to the National Environmental Policy Act (NEPA). The Department also obtained approvals from regulatory agencies for all activities associated with both the construction of the new east span and the dismantling of the original east span. These approvals include the following:
• California Department of Fish and Game (CDFG) Incidental Take Permit No. 2081-2001-021-03 (2001) and all 7 associated Amendments
• National Oceanic and Atmospheric Administration National Marine Fisheries Service (NMFS) Biological Opinion and Incidental Take Statement No. 151422-SWR99-SR-190 (2001) and all 6 Supplemental Biological and Conference Opinions
Toll Bridge Program Oversight Committee
14

Quarterly Environmental Compliance Highlights (Continued)
• National Oceanic and Atmospheric Administration National Marine Fisheries Service (NMFS) Incidental Harassment Authorizations (13) and Letters of Authorization
• Regional Water Quality Control Board (RWQCB) Waste Discharge Requirements Order R2-2002-0011 (2002), and modifi cation (2018)
• Regional Water Quality Control Board (RWQCB) Water Quality Certifi cation Order 01-120 (2001)
• San Francisco Bay Conservation and Development Commission (BCDC) Permit No. 8-01 (2001), and all 44 associated Amendments
• United States Army Corps of Engineers (ACOE) Permit No. 23013S (2001) and all associated Letters of Modifi cation
• United States Coast Guard New Bridge Permit (2001) and all associated Amendments
• United States Fish and Wildlife Service (USFWS) Biological Opinion No. 1-1-02-F-0002 (2001)
The environmental team anticipates the close-out of these authorizations will take approximately six months after completion of SFOBB Project construction activities. Examples of outstanding compliance items that must be resolved prior to permit close-out include completion of shorebird roosting habitat compensatory mitigation, fi nalizing a public access guarantee for public access areas on YBI and OTD, and completion of infi ll monitoring at the locations of the former marine foundations. The Capital Outlay costs of these close out items are captured in the Right of Way and Environmental Mitigation approved budget and the Capital Outlay Support cost of implementing these items are captured in the approved SFOBB East Span Replacement COS budget.
KEY ACCOMPLISHMENTS FOR SFOBB PROJECT
The environmental team was a key member of the SFOBB Project team throughout permitting, bridge construction and dismantling. Key accomplishments made by the environmental team for the SFOBB Project are outlined below.
• Developed a $15.5 million comprehensive mitigation package to address project environmental impacts off-site, and oversee on-site restoration activities.
• Undertook a series of interagency meetings to keep federal and state regulatory agencies appraised of
the progress and changes of the project’s environmental elements and aid in the decision making process for developing continued avoidance and minimization measures and strategies.
• Minimized impacts from pile driving by developing and implementing effective marine pile driving attenuation systems that are now standard on projects across the country.
• Contributed to the improvement of San Francisco Bay water quality through the construction and operation of bio-retention basins that fi lter runoff from the SFOBB toll plaza.
• Completion of two cage fi sh studies to further understanding of hydroacoustic impacts on fi sh from pile driving and pier implosion activities.
• Obtained regulatory authorizations for the use of up to 2,540 steel shell piles to support bridge dismantling activities.
• Worked with the project team to develop alternative dismantling methodologies which greatly reduced the originally considered amount of pile driving and eliminated the need for dredging.
• Obtained unique permit from USFWS allowing for the removal of chicks and eggs from active nests to avoid construction delays during bridge dismantling.
• Mitigated effects to the existing cormorant colony during construction through effective avoidance and minimization measures.
• Avoided impacts to the fully protected peregrine falcon that were residents on the original east span during bridge construction and demolition construction activities.
• Obtained regulatory approvals for underwater controlled blasting, a fi rst in San Francisco Bay, which reduced the demolition phase of the project by approximately 3 years.
• Successfully relocated the resident cormorant population from the original east span to platforms constructed on the new east span.
2018 Fourth Quarter Project Progress and Financial Update
15

Quarterly Environmental Compliance Highlights (Continued)
• Innovated methods to implement and attenuate controlled blasting of major marine structures through use of advanced blasting technology and planning and a robust blast attenuation system, thereby reducing environmental effects from previously considered demolition methods.
• Contributed to and advanced the understanding of controlled implosion as a viable and less impactful method for removal of major marine structures.
• Implemented a successful monitoring program that provided effective protection to marine species during controlled blast events.
• Cleaned up the Bay by removing SFOBB original east span without take of listed species during bridge dismantling.
• Minimized impacts to water quality through effective BMPs and response measures throughout construction.
• Provided public access to YBI and the San Francisco Bay via the SFOBB bike path on the new east span.
• Provided public access to the Bay at the OTD and YBI via new over-water observation areas.
• Extended public access via the Bay Trail from the new east span through the Emeryville Crescent.
Toll Bridge Program Oversight Committee
16

APPENDICESA. TBSRP AB 144/SB 66/ AB 1175 Baseline Budget, Forecasts and
Expenditures through December 31, 2018 (A-1 and A-2) 16B. TBSRP (SFOBB East Span Only) AB 144/SB 66 Baseline Budget,
Forecasts and Expenditures through December 31, 2018 20Glossary of Terms 25
2018 Fourth Quarter Project Progress and Financial Update
17

Toll Bridge Program Oversight Committee
18
ContractAB 144/SB 66/AB 1175
Approved Changes
Current Approved
Budget (12/2018)
Cost to Date (12/2018)
Cost Forecast (12/2018)
At-Completion Variance
a c d e = c + d f g h = g - e
SFOBB East Span Replacement ProjectCapital Outlay Support 959.3 398.1 1,357.4 1,336.6 1,357.9 0.5Capital Outlay Construction 4,492.2 669.5 5,161.7 5,124.8 5,166.6 4.9Other Budgeted Capital 35.1 (34.4) 0.7 0.7 0.7 -
Total 5,486.6 1,033.2 6,519.8 6,462.1 6,525.2 5.4SFOBB West Approach Replacement
Capital Outlay Support 120.0 (0.5) 119.5 119.4 119.5 - Capital Outlay Construction 309.0 24.1 333.1 333.0 333.1 -
Total 429.0 23.6 452.6 452.4 452.6 -SFOBB West Span Retrofi t -
Capital Outlay Support 75.0 (0.2) 74.8 74.8 74.8 - Capital Outlay Construction 232.9 (2.4) 230.5 230.5 230.5 -
Total 307.9 (2.6) 305.3 305.3 305.3 - Richmond-San Rafael Bridge Retrofi t*
Capital Outlay Support 134.0 (7.2 126.8 126.7 126.8 -Capital Outlay Construction 780.0 (111.8) 668.2 668.1 668.1 (0.1)
Total 914.0 (119.0) 795.0 794.8 794.9 (0.1)Benicia-Martinez Bridge Retrofi t -
Capital Outlay Support 38.1 - 38.1 38.1 38.1 - Capital Outlay Construction 139.7 - 139.7 139.7 139.7 -
Total 177.8 - 177.8 177.8 177.8 - Carquinez Bridge Retrofi t
Capital Outlay Support 28.7 0.1 28.8 28.8 28.8 - Capital Outlay Construction 85.5 (0.1) 85.4 85.4 85.4 -
Total 114.2 - 114.2 114.2 114.2 - San Mateo-Hayward Bridge Retrofi t -
Capital Outlay Support 28.1 - 28.1 28.1 28.1 - Capital Outlay Construction 135.4 (0.1) 135.3 135.3 135.3 -
Total 163.5 (0.1) 163.4 163.4 163.4 - Vincent Thomas Bridge Retrofi t (Los Angeles)
Capital Outlay Support 16.4 - 16.4 16.4 16.4 - Capital Outlay Construction 42.1 - 42.1 42.0 42.1 -
Total 58.5 - 58.5 58.4 58.5 - San Diego-Coronado Bridge Retrofi t
Capital Outlay Support 33.5 (0.3) 33.2 33.2 33.2 -Capital Outlay Construction 70.0 - 70.0 70.0 70.0 -
Total 103.5 (0.3) 103.2 103.2 103.2 -
Appendix A-1: TBSRP AB 144/SB 66/AB 1175 Baseline Budget, Forecasts and ExpendituresThrough December 31, 2018, by bridge including program contingency ($ Millions)
2018 Fourth Quarter Project Progress and Financial Update
19
ContractAB 144/SB 66/AB 1175
Approved Changes
Current Approved
Budget (12/2018)
Cost to Date (12/2018)
Cost Forecast (12/2018)
At-Completion Variance
a c d e = c + d f g h = g - e
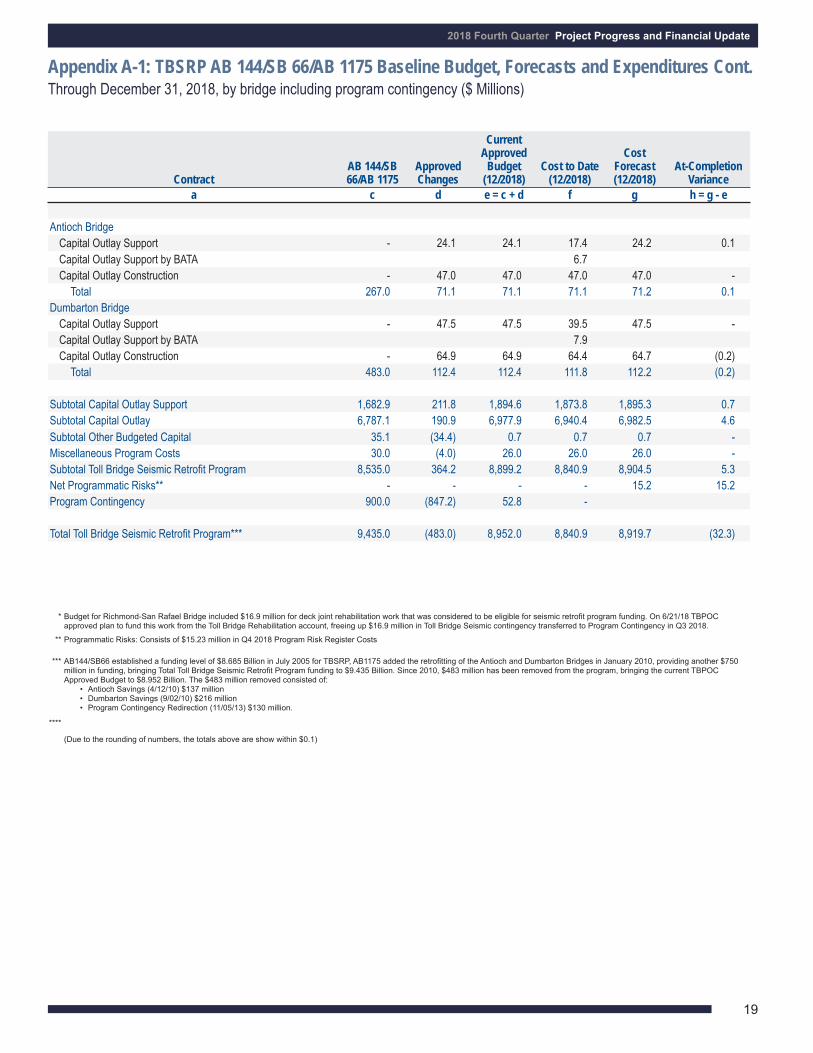
Antioch BridgeCapital Outlay Support - 24.1 24.1 17.4 24.2 0.1 Capital Outlay Support by BATA 6.7 Capital Outlay Construction - 47.0 47.0 47.0 47.0 -
Total 267.0 71.1 71.1 71.1 71.2 0.1 Dumbarton Bridge
Capital Outlay Support - 47.5 47.5 39.5 47.5 - Capital Outlay Support by BATA 7.9 Capital Outlay Construction - 64.9 64.9 64.4 64.7 (0.2)
Total 483.0 112.4 112.4 111.8 112.2 (0.2)
Subtotal Capital Outlay Support 1,682.9 211.8 1,894.6 1,873.8 1,895.3 0.7Subtotal Capital Outlay 6,787.1 190.9 6,977.9 6,940.4 6,982.5 4.6Subtotal Other Budgeted Capital 35.1 (34.4) 0.7 0.7 0.7 - Miscellaneous Program Costs 30.0 (4.0) 26.0 26.0 26.0 -Subtotal Toll Bridge Seismic Retrofi t Program 8,535.0 364.2 8,899.2 8,840.9 8,904.5 5.3Net Programmatic Risks** - - - - 15.2 15.2Program Contingency 900.0 (847.2) 52.8 -
Total Toll Bridge Seismic Retrofi t Program*** 9,435.0 (483.0) 8,952.0 8,840.9 8,919.7 (32.3)
Appendix A-1: TBSRP AB 144/SB 66/AB 1175 Baseline Budget, Forecasts and Expenditures Cont.Through December 31, 2018, by bridge including program contingency ($ Millions)
* Budget for Richmond-San Rafael Bridge included $16.9 million for deck joint rehabilitation work that was considered to be eligible for seismic retrofi t program funding. On 6/21/18 TBPOC approved plan to fund this work from the Toll Bridge Rehabilitation account, freeing up $16.9 million in Toll Bridge Seismic contingency transferred to Program Contingency in Q3 2018.
** Programmatic Risks: Consists of $15.23 million in Q4 2018 Program Risk Register Costs
*** AB144/SB66 established a funding level of $8.685 Billion in July 2005 for TBSRP, AB1175 added the retrofi tting of the Antioch and Dumbarton Bridges in January 2010, providing another $750 million in funding, bringing Total Toll Bridge Seismic Retrofi t Program funding to $9.435 Billion. Since 2010, $483 million has been removed from the program, bringing the current TBPOC Approved Budget to $8.952 Billion. The $483 million removed consisted of:
• Antioch Savings (4/12/10) $137 million• Dumbarton Savings (9/02/10) $216 million• Program Contingency Redirection (11/05/13) $130 million.
****
(Due to the rounding of numbers, the totals above are show within $0.1)
Toll Bridge Program Oversight Committee
20
BridgeAB 144 Baseline
BudgetTBPOC Current
Approved Budget
Expenditures to date and
encumbrancesas of (12/2018)
see Note (1)
Estimated costs not yet spent or encumbered as
of (12/2018)
Total Forecast as of (12/2018)
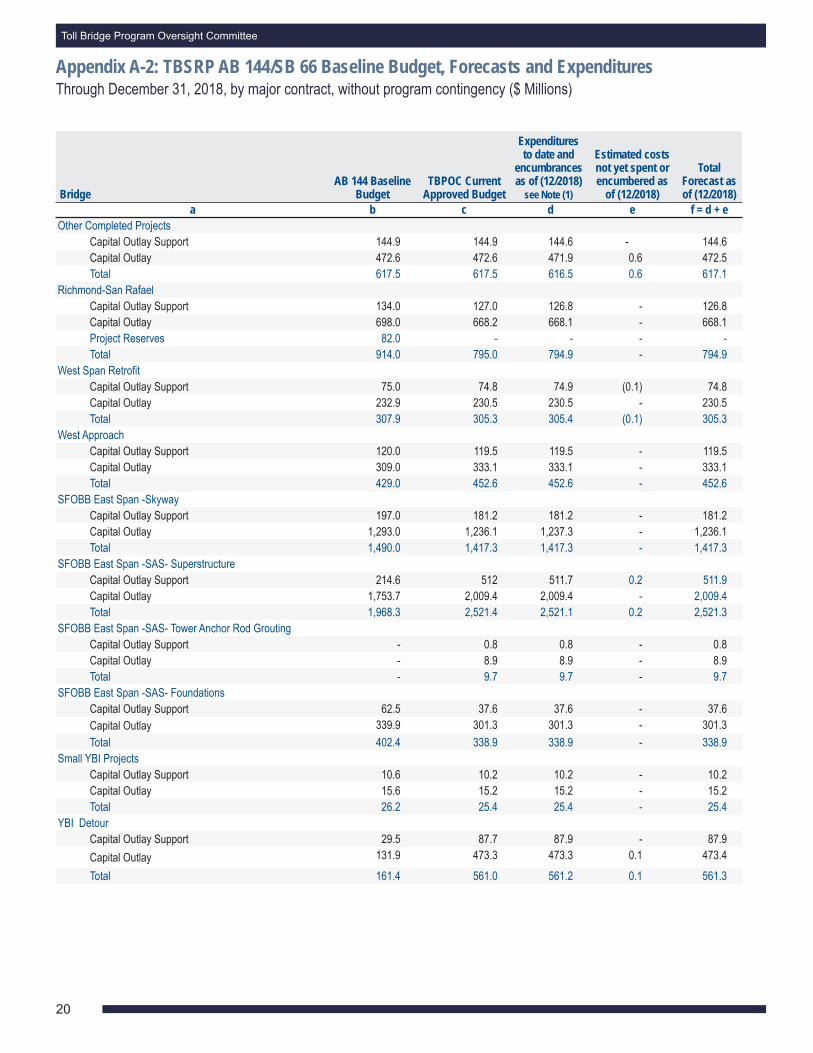
a b c d e f = d + eOther Completed Projects
Capital Outlay Support 144.9 144.9 144.6 - 144.6 Capital Outlay 472.6 472.6 471.9 0.6 472.5 Total 617.5 617.5 616.5 0.6 617.1
Richmond-San RafaelCapital Outlay Support 134.0 127.0 126.8 - 126.8 Capital Outlay 698.0 668.2 668.1 - 668.1Project Reserves 82.0 - - - - Total 914.0 795.0 794.9 - 794.9
West Span Retrofi tCapital Outlay Support 75.0 74.8 74.9 (0.1) 74.8 Capital Outlay 232.9 230.5 230.5 - 230.5 Total 307.9 305.3 305.4 (0.1) 305.3
West ApproachCapital Outlay Support 120.0 119.5 119.5 - 119.5 Capital Outlay 309.0 333.1 333.1 - 333.1 Total 429.0 452.6 452.6 - 452.6
SFOBB East Span -SkywayCapital Outlay Support 197.0 181.2 181.2 - 181.2 Capital Outlay 1,293.0 1,236.1 1,237.3 - 1,236.1 Total 1,490.0 1,417.3 1,417.3 - 1,417.3
SFOBB East Span -SAS- SuperstructureCapital Outlay Support 214.6 512 511.7 0.2 511.9Capital Outlay 1,753.7 2,009.4 2,009.4 - 2,009.4Total 1,968.3 2,521.4 2,521.1 0.2 2,521.3
SFOBB East Span -SAS- Tower Anchor Rod GroutingCapital Outlay Support - 0.8 0.8 - 0.8Capital Outlay - 8.9 8.9 - 8.9Total - 9.7 9.7 - 9.7
SFOBB East Span -SAS- FoundationsCapital Outlay Support 62.5 37.6 37.6 - 37.6 Capital Outlay 339.9 301.3 301.3 - 301.3 Total 402.4 338.9 338.9 - 338.9
Small YBI ProjectsCapital Outlay Support 10.6 10.2 10.2 - 10.2 Capital Outlay 15.6 15.2 15.2 - 15.2 Total 26.2 25.4 25.4 - 25.4
YBI DetourCapital Outlay Support 29.5 87.7 87.9 - 87.9 Capital Outlay 131.9 473.3 473.3 0.1 473.4 Total 161.4 561.0 561.2 0.1 561.3
Appendix A-2: TBSRP AB 144/SB 66 Baseline Budget, Forecasts and ExpendituresThrough December 31, 2018, by major contract, without program contingency ($ Millions)

2018 Fourth Quarter Project Progress and Financial Update
21
Contract
AB 144 Baseline Budget
TBPOC Current Approved Budget
Expenditures to date and
encumbrancesas of (12/2018)
see Note (1)
Estimated costs not yet spent or
encumbered as of (12/2018)
Total Forecast as of (12/2018)
a b c d e f = d + e
YBI - Transition StructuresCapital Outlay Support 78.7 152.4 147.1 6.4 153.5Capital Outlay 299.4 314.7 314.8 - 314.8Total 378.1 467.1 461.9 6.4 468.3
Oakland TouchdownCapital Outlay Support 74.4 118.7 118.3 - 118.3 Capital Outlay 283.8 326.4 326.5 - 326.5 Total 358.2 445.1 444.8 - 444.8
East Span Other Small ProjectsCapital Outlay Support 212.3 197.9 197.9 - 197.9 Capital Outlay 170.8 138.2 133.9 - 133.9Total 383.1 336.1 331.8 - 331.8
Existing Bridge DemolitionCapital Outlay Support 79.7 58.9 54.9 4.0 58.8Capital Outlay 239.2 338.9 339.1 8.9 348.0Total 318.9 397.8 394.0 12.9 406.9
Antioch BridgeCapital Outlay Support - 24.1 17.4 0.1 17.5 Capital Outlay Support by BATA 6.7 - 6.7 Capital Outlay - 47.0 47.0 - 47.0 Total 267.0 71.1 71.1 0.1 71.2
Dumbarton BridgeCapital Outlay Support - 47.5 39.6 - 39.6 Capital Outlay Support by BATA 7.9 - 7.9 Capital Outlay - 64.9 64.7 - 64.7 Total 483.0 112.4 112.2 - 112.2
Miscellaneous Program Costs 30.0 26.0 26.0 - 26.0 Total Capital Outlay Support (2) 1,712.9 1,920.6 1,910.8 10.6 1,921.4Total Capital Outlay 6,822.1 6,978.6 6,973.7 9.4 6,983.1Program Total 8,535.0 8,899.2 8,884.5 20.0 8,904.5
(1) Total Capital Outlay Support includes program indirect costs.(2) Construction administration of the OTD Detour is under the YBITS1 contract. Encumbrance is included in YBITS 1 contract.(3) Construction administration of the Cantilever segment is under the YBITS2 contract. Encumbrance is included in YBITS2 contract.(Due to the rounding of numbers, the totals above are shown within $0.1)
Appendix A-2: TBSRP AB 144/SB 66 Baseline Budget, Forecasts and Expenditures Cont.Through December 31, 2018, by major contract, without program contingency ($ Millions)

Toll Bridge Program Oversight Committee
22
Contract
AB 144 / SB66 Budget(07/2005)
ApprovedChanges
Current Approved
Budget(12/2018)
Cost to Date(12/2018)
Cost Forecast(12/2018)
At-Completion
Variancea c d e = c + d f g h = g - e
San Francisco-Oakland Bay Bridge East Span Replacement ProjectEast Span - SAS Superstructure
Capital Outlay Support 214.6 297.4 512.0 511.7 511.9 (0.1)Capital Outlay Construction 1,753.7 255.7 2,009.4 2,007.4 2,009.4 -
Total 1,968.3 553.1 2,521.4 2,519.1 2,521.3 (0.1)SAS Tower Anchor Rod Grouting
Capital Outlay Support - 0.8 0.8 0.7 0.8 - Capital Outlay Construction - 8.9 8.9 8.7 8.9 -
Total - 9.7 9.7 9.5 9.7 - SAS W2 Foundations
Capital Outlay Support 10.0 (0.8) 9.2 9.2 9.2 - Capital Outlay Construction 26.4 0.1 26.5 26.5 26.5 -
Total 36.4 (0.7) 35.7 35.7 35.7 - YBI South/South Detour
Capital Outlay Support 29.4 58.3 87.7 87.9 87.9 0.2 Capital Outlay Construction 131.9 341.4 473.3 473.4 473.4 0.1
Total 161.3 399.7 561.0 561.3 561.3 0.3 East Span - Skyway
Capital Outlay Support 197.0 (15.8) 181.2 181.2 181.2 - Capital Outlay Construction 1,293.0 (56.9) 1,236.1 1,235.6 1,236.1 -
Total 1,490.0 (72.7) 1,417.3 1,416.8 1,417.3 - East Span - SAS E2/T1 Foundations -
Capital Outlay Support 52.5 (24.1) 28.4 28.4 28.4 - Capital Outlay Construction 313.5 (38.7) 274.8 274.8 274.8 -
Total 366.0 (62.8) 303.2 303.2 303.2 - YBI Transition Structures (see notes below)
Capital Outlay Support 78.7 73.7 152.4 143.2 153.5 1.1Capital Outlay Construction 299.3 15.4 314.7 310.7 314.8 0.1
Total 378.0 89.1 467.1 454.1 468.3 1.2* YBI - Transition Structures
Sunk Cost 16.4 16.4 16.4 - * YBI - Southgate Road
Cost Outlay Support BATA (Southgate Road) 6.4 4.1 6.4 - Cost Outlay BATA (Southgate Road) 3.2 - 3.2 -
Total 9.6 4.1 9.6 - * YBI - Transition Structures Contract No. 1
Capital Outlay Support 72.1 71.2 71.2 (0.9)Capital Outlay Construction 203.7 203.2 203.8 0.1
Total 275.8 274.4 275.0 (0.8)* YBI - Transition Structures Contract No. 2
Capital Outlay Support 56.5 51.4 58.5 2.0Capital Outlay Construction 107.8 107.4 107.8 -
Total 164.3 158.9 166.3 2.0* YBI - Transition Structures Contract No. 3 Landscape
Capital Outlay Support 1.0 0.3 1.0 - Capital Outlay Construction - - - -
Total 1.0 - 1.0 -
Appendix B: TBSRP (SFOBB East Span Only) AB 144/SB 66 Baseline Budget, Forecasts and Expenditures Through December 31, 2018 ($ Millions)

2018 Fourth Quarter Project Progress and Financial Update
23
Contract
AB 144 / SB66 Budget(07/2005)
ApprovedChanges
Current Approved
Budget(12/2018)
Cost to Date (12/2018)
Cost Forecast(12/2018)
At-Completion
Variancea c d e = c + d f g h = g - e
Oakland Touchdown (see notes below)Capital Outlay Support 74.4 44.3 118.7 118.2 118.3 (0.4)Capital Outlay Construction 283.8 42.6 326.4 326.5 326.5 0.1
Total 358.2 86.9 445.1 444.7 444.8 (0.3) * OTD Prior-to-Split Costs
Capital Outlay Support 20.1 20.0 20.0 (0.1)Capital Outlay Construction - - - -
Total 20.1 20.0 20.0 (0.1) * OTD Submarine Cable(1)
Capital Outlay Support 0.9 0.9 0.9 - Capital Outlay Construction 5.7 5.7 5.7 -
Total 6.6 6.6 6.6 - * OTD No. 1 (Westbound)
Capital Outlay Support 51.2 51.2 51.2 - Capital Outlay Construction 202.8 202.8 202.8 -
Total 254.0 254.0 254.0 - * OTD No. 2 (Eastbound)
Capital Outlay Support 37.6 37.4 37.4 (0.2)Capital Outlay Construction 71.2 71.2 71.2 -
Total 108.8 108.6 108.6 (0.2) * OTD Touchdown 2 Detour(2)
Capital Outlay Support 8.1 8.0 8.0 (0.1)Capital Outlay Construction 46.7 46.7 46.7 -
Total 54.8 54.7 54.7 (0.1) * OTD Electrical Systems
Capital Outlay Support 0.8 0.8 0.8 - Capital Outlay Construction - - - -
Total 0.8 0.8 0.8 - Existing Bridge Dismantling
Capital Outlay Support 79.7 (20.8) 58.9 47.9 58.9 --Capital Outlay Construction 239.2 99.7 338.9 318.6 348.0 9.1
Total 318.9 78.9 397.8 366.5 406.9 9.1 * Bridge Dismantling Prior-to-Split Cost Capital Outlay Support 3.9 3.9 3.9 - Capital Outlay Construction - - - - Total 3.9 3.9 3.9 - * Cantilever Section
Capital Outlay Support 1.6 1.6 1.6 - Capital Outlay Construction 69.0 68.5 69.0 -
Total 70.6 70.1 70.6 - * 504/288 Sections
Capital Outlay Support 11.0 10.2 10.5 (0.5)Capital Outlay Construction 81.8 79.0 81.6 (0.2)
Total 92.8 89.2 92.1 (0.7)
Appendix B: TBSRP (SFOBB East Span Only) AB 144/SB 66 Baseline Budget, Forecasts and Expenditures Through December 31, 2018 ($ Millions) Cont.

Toll Bridge Program Oversight Committee
24
Contract
AB 144 / SB66 Budget(07/2005)
ApprovedChanges
Current Approved
Budget(12/2018)
Cost to Date(12/2018)
Cost Forecast(12/2018)
At-Completion
Variancea c d e = c + d f g h = g - e
*Marine Foundations Capital Outlay Support 42.4 32.2 42.9 0.5 Capital Outlay Construction 188.1 171.1 197.4 9.3
Total 230.5 203.4 240.3 9 Sunk Cost for Marine Foundation 5.8 5.8 5.8 - Pier-3 Demonstration Project Capital Outlay Support 4.0 4.0 4.0 - Capital Outlay Construction 16.8 16.8 16.8 -
Total 20.8 20.8 20.8 - Remaining Marine Foundations2
Capital Outlay Support 32.6 22.5 33.2 0.6 Capital Outlay Construction 171.3 154.3 180.5 9.2 Total 203.9 176.8 213.7 9.8
Pier-E4 to Pier-E18 Capital Outlay Support 12.0 11.7 12.0 - Capital Outlay Construction 109.7 109.9 110.0 0.3 Total 121.7 121.8 122.0 0.3 Pier-E2 and Pier-E19 to Pier-E22 Capital Outlay Support 20.6 10.6 21.2 0.6 Capital Outlay Construction 61.6 44.4 70.6 9.0 Total 82.2 55.0 91.8 9.6YBI/SAS Archeology
Capital Outlay Support 1.1 - 1.1 1.1 1.1 - Capital Outlay Construction 1.1 - 1.1 1.1 1.1 -
Total 2.2 - 2.2 2.2 2.2 - YBI - USCG Road Relocation
Capital Outlay Support 3.0 (0.3) 2.7 2.7 2.7 - Capital Outlay Construction 3.0 (0.2) 2.8 2.8 2.8 -
Total 6.0 (0.5) 5.5 5.5 5.5 - YBI - Substation and Viaduct
Capital Outlay Support 6.5 (0.1) 6.4 6.4 6.4 - Capital Outlay Construction 11.6 (0.3) 11.3 11.3 11.3 -
Total 18.1 (0.4) 17.7 17.7 17.7 - Oakland Geofi ll -
Capital Outlay Support 2.5 - 2.5 2.5 2.5 - Capital Outlay Construction 8.2 - 8.2 8.2 8.2 -
Total 10.7 - 10.7 10.7 10.7 - Pile Installation Demonstration Project
Capital Outlay Support 1.8 - 1.8 1.8 1.8 - Capital Outlay Construction 9.3 (0.1) 9.2 9.3 9.3 -
Total 11.1 (0.1) 11.0 11.1 11.1 -
Appendix B: TBSRP (SFOBB East Span Only) AB 144/SB 66 Baseline Budget, Forecasts and Expenditures Through December 31, 2018 ($ Millions) Cont.

2018 Fourth Quarter Project Progress and Financial Update
25
Contract
AB 144 / SB66 Budget(07/2005)
ApprovedChanges
Current Approved
Budget(12/2018)
Cost to Date(12/2018)
Cost Forecast(12/2018)
At-Completion
Variancea c d e = c + d f g h = g - e
Stormwater Treatment MeasuresCapital Outlay Support 6.0 2.2 8.2 8.2 8.2 - Capital Outlay Construction 15.0 1.9 16.9 16.9 16.9 -
Total 21.0 4.1 25.1 25.1 25.1 - Right-of-Way and Environmental Mitigation
Capital Outlay Support - - - - - - Capital Outlay & Right-of-Way 72.4 - 72.4 62.3 68.0 (4.4)Total 72.4 - 72.4 62.3 68.0 (4.4)
Sunk Cost - Existing East Span Retrofi tCapital Outlay Support 39.5 - 39.5 39.5 39.5 - Capital Outlay Construction 30.8 - 30.8 30.8 30.8 - Total 70.3 - 70.3 70.3 70.3 -
Other Capital Outlay SupportEnvironmental Phase 97.7 0.1 97.8 97.8 97.8 - Pre-Split Project Expenditures 44.9 - 44.9 44.9 44.9 - Non-Project Specifi c Costs 20.0 (16.8) 3.2 3.2 3.2 - Total 162.6 (16.7) 145.9 145.9 145.9 -
Subtotal Capital Outlay Support 959.3 398.1 1,357.4 1,336.6 1,357.9 0.5Subtotal Capital Outlay Construction 4,492.2 669.5 5,161.7 5,124.8 5,166.6 4.9Other Budgeted Capital 35.1 (34.4) 0.7 0.7 0.7 -
Total SFOBB East Span Replacement Project 5,486.6 1,033.2 6,519.8 6,462.1 6,525.2 5.4(1) Current contract allotment to install two submarine electrical cables is $5.7 million. Additional non-program funding to support this allocation beyond the $9.6 million of available programs funds has been made available by the Treasure Island Development Authority.(2) Construction administration of the OTD Detour is under the YBITS#1 contract. (3) Construction administration of the Cantilever segment is under the YBITS#2 contract.(Due to the rounding of numbers, the totals above are shown within $0.1).
Appendix B: TBSRP (SFOBB East Span Only) AB 144/SB 66 Baseline Budget, Forecasts and Expenditures Through December 31, 2018 ($ Millions) Cont.

Toll Bridge Program Oversight Committee
26

2018 Fourth Quarter Project Progress and Financial Update
27
Glossary of Terms
AB 144/SB 66 BUDGET: The planned allocation of resources for the Toll Bridge Seismic Retrofi t Program, or subordinate projects or contracts, as provided in Assembly Bill 144 and Senate Bill 66, signed into law by Governor Schwarzenegger on July 18, 2005, and September 29, 2005, respectively.
AB 144/SB 66/AB1175 PROJECT COMPLETE BASELINE: The planned completion date for the Toll Bridge Seismic Retrofi t Program or subordinate projects or contracts.
APPROVED CHANGES: For cost, changes to the AB 144/SB 66 Budget or BATA Budget as approved by the Bay Area Toll Authority Commission. For schedule, changes to the AB 144/SB 66 Project Complete Baseline approved by the Toll Bridge Program Oversight Committee, or changes to the BATA Project Complete Baseline approved by the Bay Area Toll Authority Commission.
AT COMPLETION VARIANCE or VARIANCE (cost): The mathematical difference between the Cost Forecast and the Current Approved Budget.
BATA PROJECT COMPLETE BASELINE: The planned completion date for the Regional Measure 1 Program or subordinate projects or contracts.
CAPITAL OUTLAY SUPPORT (COS): Cost of developing and administering a capital project.
COST FORECAST: The current forecast of all of the costs that are projected to be expended so as to complete the given scope of the program, project, or contract.
COST TO DATE: The actual expenditures incurred by the program, project or contract as of the month and year shown.
CURRENT APPROVED BUDGET: The sum of the AB 144/SB 66 Budget or BATA Budget and Approved Changes.
HINGE PIPE BEAMS: Pipes between roadway sections designed to move within their sleeves during expansion or contraction of the decks during minor events, such as changes in temperature. The beams are designed to absorb the energy of an earthquake by deforming in their middle or “fuse” section. Hinge pipe beams are also found at the western piers where the SAS connects to the YBITS (Hinge “K” pipe beams).
PROJECT COMPLETE CURRENT APPROVED SCHEDULE: The sum of the AB 144/SB 66 Project Complete Baseline or BATA Project Complete Baseline and Approved Changes.
PROJECT COMPLETE SCHEDULE FORECAST: The current projected date for the completion of the program, project, or contract.
SCHEDULE VARIANCE or VARIANCE (schedule): The mathematical difference expressed in months between the Project Complete Schedule Forecast and the Project Complete Current Approved Schedule.
% COMPLETE: % Complete is based on an evaluation of progress on the project, expenditures to date, and schedule.
