fourth quarter and full year 2017 results - presentation ... · fourth quarter and full year 2017...
TRANSCRIPT
Fourth Quarter and Full Year 2017 Results
Presentation to Investors and Analysts
February 14, 2018

February 14, 2018 2
Disclaimer
This material does not purport to contain all of the information that you may wish to consider. This material is not to be relied upon as such or used in substitution for the exercise of independent judgment.
Credit Suisse has not finalized its 2017 Annual Report and Credit Suisse’s independent registered public accounting firm has not completed its audit of the consolidated financial statements for the period. Accordingly, the financial information contained in this presentation is subject to completion of year-end procedures, which may result in changes to that information.
Cautionary statement regarding forward-looking statements
This presentation contains forward-looking statements that involve inherent risks and uncertainties, and we might not be able to achieve the predictions, forecasts, projections and other outcomes we describe or imply in forward-looking statements. A number of important factors could cause results to differ materially from the plans, objectives, expectations, estimates and intentions we express in these forward-looking statements, including those we identify in "Risk factors” in our Annual Report on Form 20-F for the fiscal year ended December 31, 2016 and in the “Cautionary statement regarding forward-looking information" in our 4Q17 Earnings Release, published on February 14, 2018 and filed with the US Securities and Exchange Commission, and in other public filings and press releases. We do not intend to update these forward-looking statements.
In particular, the terms “Estimate”, “Illustrative”, “Ambition”, “Objective”, “Outlook” and “Goal” are not intended to be viewed as targets or projections, nor are they considered to be Key Performance Indicators. All such estimates, illustrations, ambitions, objectives, outlooks and goals are subject to a large number of inherent risks, assumptions and uncertainties, many of which are completely outside of our control. These risks, assumptions and uncertainties include, but are not limited to, general market conditions, market volatility, interest rate volatility and levels, global and regional economic conditions, political uncertainty, changes in tax policies, regulatory changes, changes in levels of client activity as a result of any of the foregoing and other factors. Accordingly, this information should not be relied on for any purpose. We do not intend to update these estimates, illustrations, ambitions, objectives, outlooks or goals.
We may not achieve the benefits of our strategic initiatives
We may not achieve all of the expected benefits of our strategic initiatives. Factors beyond our control, including but not l imited to the market and economic conditions, changes in laws, rules or regulations and other challenges discussed in our public filings, could limit our ability to achieve some or all of the expected benefits of these initiatives.
Estimates and assumptions
In preparing this presentation, management has made estimates and assumptions that affect the numbers presented. Actual results may differ. Annualized numbers do not take account of variations in operating results, seasonality and other factors and may not be indicative of actual, full-year results. Figures throughout this presentation may also be subject to rounding adjustments. All opinions and views constitute judgments as of the date of writing without regard to the date on which the reader may receive or access the information. This information is subject to change at any time without notice and we do not intend to update this information.
Cautionary Statements Relating to Interim Financial Information
This presentation contains certain unaudited interim financial information for 2018. This information has been derived from management accounts, is preliminary in nature, does not reflect the complete results of the first quarter of 2018 and is subject to change, including as a result of any normal quarterly adjustments in relation to the financial statements for the first quarter of 2018. This information has not been subject to any review by our independent registered public accounting firm. There can be no assurance that the final results for these periods will not differ from these preliminary results, and any such differences could be material. Quarterly financial results for the first quarter of 2018 will be included in our 1Q18 Financial Report. These interim results of operations are not necessarily indicative of the results to be achieved for the remainder of 1Q18 or the full first quarter of 2018.
Statement regarding non-GAAP financial measures
This presentation also contains non-GAAP financial measures, including adjusted results. Information needed to reconcile such non-GAAP financial measures to the most directly comparable measures under US GAAP can be found in this presentation in the Appendix, which is available on our website at www.credit-suisse.com.
Statement regarding capital, liquidity and leverage
As of January 1, 2013, Basel III was implemented in Switzerland along with the Swiss “Too Big to Fail” legislation and regulations thereunder (in each case, subject to certain phase-in periods). As of January 1, 2015, the Bank for International Settlements (BIS) leverage ratio framework, as issued by the Basel Committee on Banking Supervision (BCBS), was implemented in Switzerland by FINMA. Our related disclosures are in accordance with our interpretation of such requirements, including relevant assumptions. Changes in the interpretation of these requirements in Switzerland or in any of our assumptions or estimates could result in different numbers from those shown in this presentation.
Unless otherwise noted, leverage exposure is based on the BIS leverage ratio framework and consists of period-end balance sheet assets and prescribed regulatory adjustments. The look-through tier 1 leverage ratio and CET1 leverage ratio are calculated as look-through BIS tier 1 capital and CET1 capital, respectively, divided by period-end leverage exposure. Swiss leverage ratios are measured on the same period-end basis as the leverage exposure for the BIS leverage ratio.
Sources
Certain material in this presentation has been prepared by Credit Suisse on the basis of publicly available information, internally developed data and other third-party sources believed to be reliable. Credit Suisse has not sought to independently verify information obtained from public and third-party sources and makes no representations or warranties as to accuracy, completeness or reliability of such information.
4Q17 and Full Year 2017 Earnings Review
Tidjane Thiam, Chief Executive Officer David Mathers, Chief Financial Officer

February 14, 2018 4
• Delivering profitable growth
– Significant progress towards our 2018 Group targets: Wealth Management-related businesses1 achieved 85% of combined 2018 adj. PTI target level within 2 years; IBCM already operated within 2018 target RoRC† range in 2017
– Wealth Management2 NNA highest since 2013 with CHF 37.2 bn in 2017, up 27% YoY; Record AuM of CHF 772 bn, up 13% YoY at increased net margins
– Global Markets3 with positive operating leverage in 2017: adjusted net revenues up 5%4, adjusted operating expenses down 5%, adjusted PTI increased 118% YoY
Executing with discipline
– Achieved 2017 cost savings target, delivered total net cost savings of CHF 3.2 bn since 2015 at constant FX rates*
(CHF 3.6 bn at actual FX rates5); Adjusted operating cost base of CHF 17.7 bn at actual FX rates5 (CHF 18.0 bn at constant FX rates*)
– Continued progress in SRU wind-down: reduced RWA excl. Op Risk by 43%6, leverage exposure by 41% and adjusted operating expenses in 2017 by 43% YoY
Increasing return on capital
– Maintaining strong capital position; Stable Tier-1 leverage ratio of 5.2%; CET1 ratio of 12.8% after deduction of ~45 bps for RMBS-related operational risk RWA increase7 in 2H17 and after investments ahead of 2018
– All operating divisions profitable in 2017 with increased adjusted return on regulatory capital†
Strong start to the year in 1Q18 across our Wealth Management and Market-dependent activities
Key messages Strong Group performance – 2017 first positive reported PTI since 2014 at CHF 1.8 bn, up CHF 4 bn YoY; Adj. net revenues up 5%; adj. operating expenses down 6%; adj. PTI of CHF 2.8 bn, up CHF 2.1 bn YoY
1
2
3
4
Note: Adjusted results are non-GAAP financial measures. A reconciliation to reported results is included in the Appendix *, † See Appendix 1 Relating to SUB, IWM and APAC WM&C and their respective targets 2 Relating to SUB PC, IWM PB and APAC PB within WM&C 3 Measured in USD terms 4 Excludes SMG net revenues of USD 172 mn and USD (16) mn in 2016 and 2017, respectively 5 Measured using Group adjusted operating cost base at actual FX rates, with FX impact of CHF 326 mn, see Appendix 6 Excludes operational risk RWA of CHF 20 bn in 2016 and 2017 7 Increases to operational risk RWA of CHF 5.2 bn and CHF 3.8 bn in 3Q17 and 4Q17, respectively, reflecting an updated loss history and a revised methodology for the measurement of our risk-weighted assets relating to operational risk, primarily in respect of our RMBS settlements

February 14, 2018 5
2.8
Adj. net revenues in CHF bn
2017
Note: Adjusted results are non-GAAP financial measures. A reconciliation to reported results is included in the Appendix 1 Reflects credit provisions of CHF 252 mn in 2016 and CHF 210 mn in 2017 2 Adjusted net revenues increase of CHF 956 mn based on adjusted net revenues of CHF 19,957 mn in 2016 vs. CHF 20,913 mn in 2017
0.6 Adj. pre-tax
income1
in CHF bn
Driving revenues up, costs down in 2017; Delivering positive
operating leverage
20.0
19.1
17.9
20.9
14.2 9.6
4.7
4.6
9.0
13.3
14.9
15.7
9.8
10.7
4.7
5.5
FY 1Q 1H 9M
Adj. operating
expenses in CHF bn
2016
2017
2016 2017
2017 vs.
2016
+1.02
-1.1
+5%
-6%
+349%

February 14, 2018 6
Our strategic approach to cost reduction has delivered a sustainably
lower break-even point
Group adjusted
operating cost base
at constant FX rates* in CHF bn
2015 2016 2017
2018
Target
21.2
19.4
18.0
<17.0
Note: Adjusted results are non-GAAP financial measures. A reconciliation to reported results is included in the Appendix * See Appendix 1 Reduction of CHF 1,859 mn in 2016 and CHF 3,228 mn in 2017 based on adjusted operating cost base at constant FX rates of CHF 21,242 mn in 2015, CHF 19,383 mn in 2016 and CHF 18,014 mn in 2017 2 Measured using Group adjusted operating cost base at actual FX rates, with FX impact of CHF 326 mn, see Appendix
17.7 actual FX2
1.91
3.21
>4.2
Break-even
point
2018
2015
3.6 actual FX2 Total net
cost savings
(cumulative)

February 14, 2018 7
SRU RWA excl. Op Risk1
in USD bn
54
25
14
2015 2016 2017
Continued progress in accelerated SRU wind-down
Note: Adjusted results are non-GAAP financial measures. A reconciliation to reported results is included in the Appendix 1 Excludes operational risk RWA of CHF 19 bn in 2015, CHF 20 bn in 2016 and CHF 20 bn in 2017
-73%
SRU leverage exposure in USD bn 170 103 61
SRU adjusted operating
expenses in USD mn 2,677 1,584 909
February 14, 2018 8
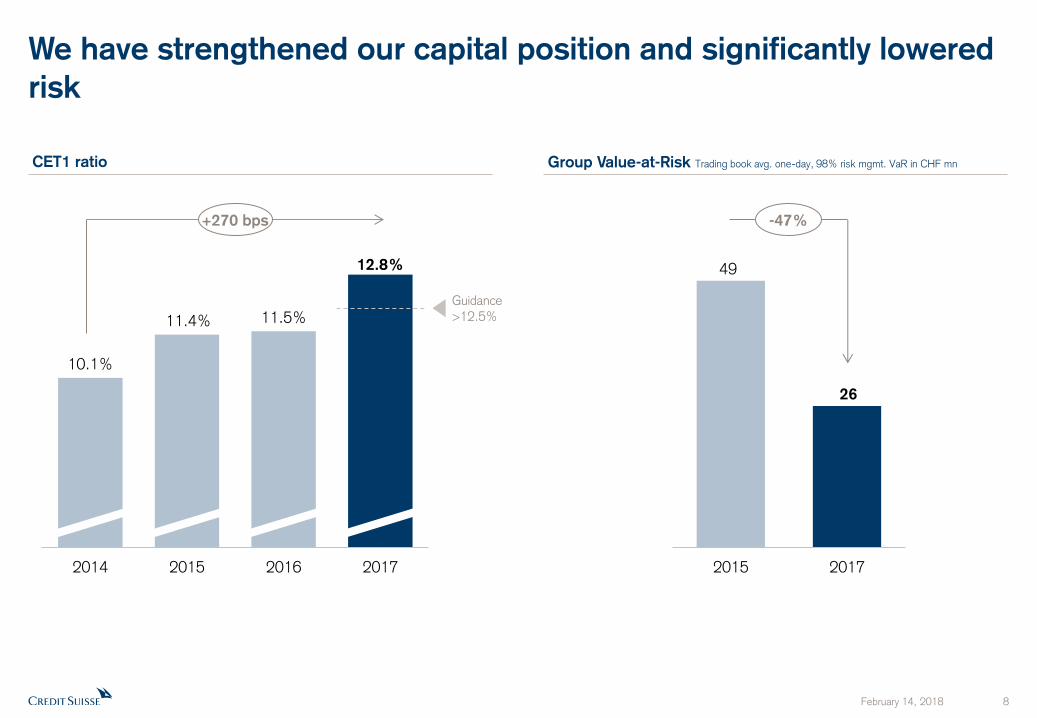
We have strengthened our capital position and significantly lowered
risk
49
26
2015 2017
Group Value-at-Risk Trading book avg. one-day, 98% risk mgmt. VaR in CHF mn CET1 ratio
-47%
10.1%
11.4% 11.5%
12.8%
2014 2015 2016 2017
+270 bps
Guidance
>12.5%
February 14, 2018 9
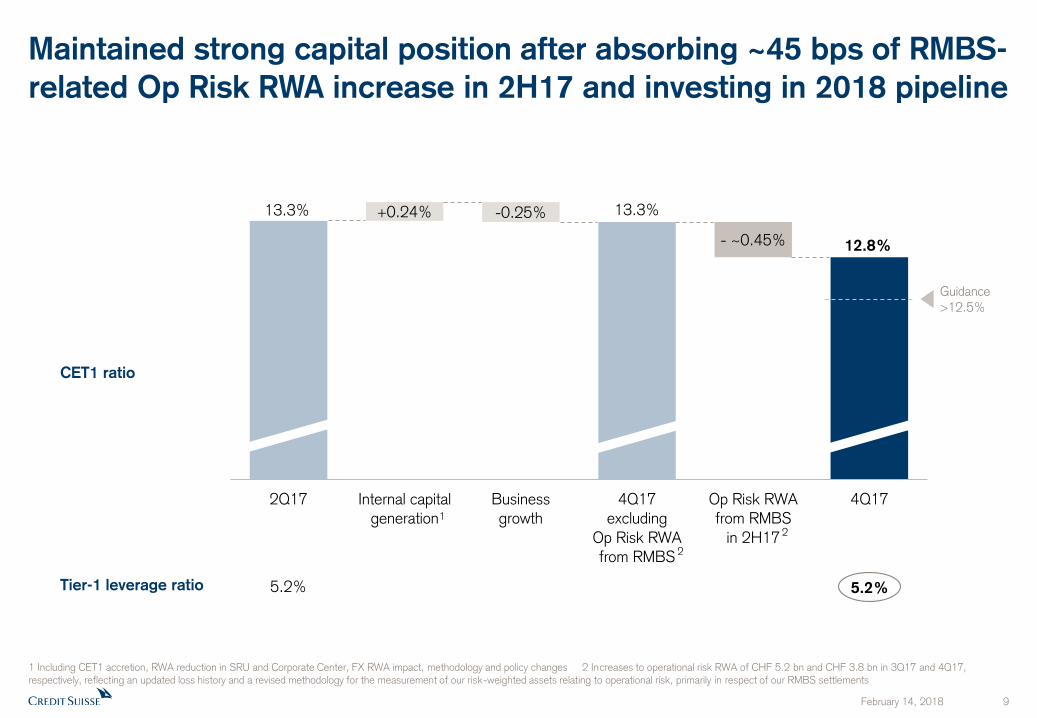
Maintained strong capital position after absorbing ~45 bps of RMBS-
related Op Risk RWA increase in 2H17 and investing in 2018 pipeline
1 Including CET1 accretion, RWA reduction in SRU and Corporate Center, FX RWA impact, methodology and policy changes 2 Increases to operational risk RWA of CHF 5.2 bn and CHF 3.8 bn in 3Q17 and 4Q17, respectively, reflecting an updated loss history and a revised methodology for the measurement of our risk-weighted assets relating to operational risk, primarily in respect of our RMBS settlements
CET1 ratio
Tier-1 leverage ratio
13.3% 13.3%
12.8%
+0.24% -0.25%
- ~0.45%
2Q17 Internal capitalgeneration
Businessgrowth
4Q17excluding
Op Risk RWA
from RMBS
Op Risk RWAfrom RMBS
in 2H17
4Q17
5.2%
1
2
2
5.2%
Guidance
>12.5%

February 14, 2018 10
Making significant progress towards our 2018 Group targets
Group net cost savings* since 2015 cumulative, in CHF bn
Note: Adjusted results are non-GAAP financial measures. A reconciliation to reported results is included in the Appendix * At constant FX rates, see Appendix † See Appendix 1 Relating to SUB, IWM and APAC WM&C
Wealth Management-related
businesses1 adj. pre-tax income in CHF bn Investment Banking 2017 adj. RoRC†
APAC
Markets (1)%
Global
Markets 4%
~
IBCM 15%
1.9
3.2
>4.2
2016 2017 2018
Target
1.7 1.9 2.3
1.1 1.5
1.8 0.5
0.8
0.85
2016 2017 2018Target
4.2
4.95
APAC
WM&C
IWM
SUB
3.4
2017
9%
2%
12%
2016
Achieved over 75% of cost savings target level within 2 years
Achieved 85% of combined 2018 adj. PTI target level within 2 years
IBCM already operated within 2018 adj. RoRC† target range

February 14, 2018 11
Our Wealth Management businesses have continued to perform
strongly
2015 2017
Assets under Management1 CHF 630 bn CHF 772 bn
Net New Assets1 CHF 18.1 bn CHF 37.2 bn
NNA1 growth rate 3% 5%
UHNW share of NNA1 ~50% >75%
Adjusted net margin1 28 bps 35 bps
CHF 2.9 bn Adjusted PTI2 CHF 4.2 bn
Wealth Management
key metrics
Note: Adjusted results are non-GAAP financial measures. A reconciliation to reported results is included in the Appendix 1 Relating to SUB PC, IWM PB and APAC PB within WM&C 2 Relating to SUB, IWM and APAC WM&C
February 14, 2018 12
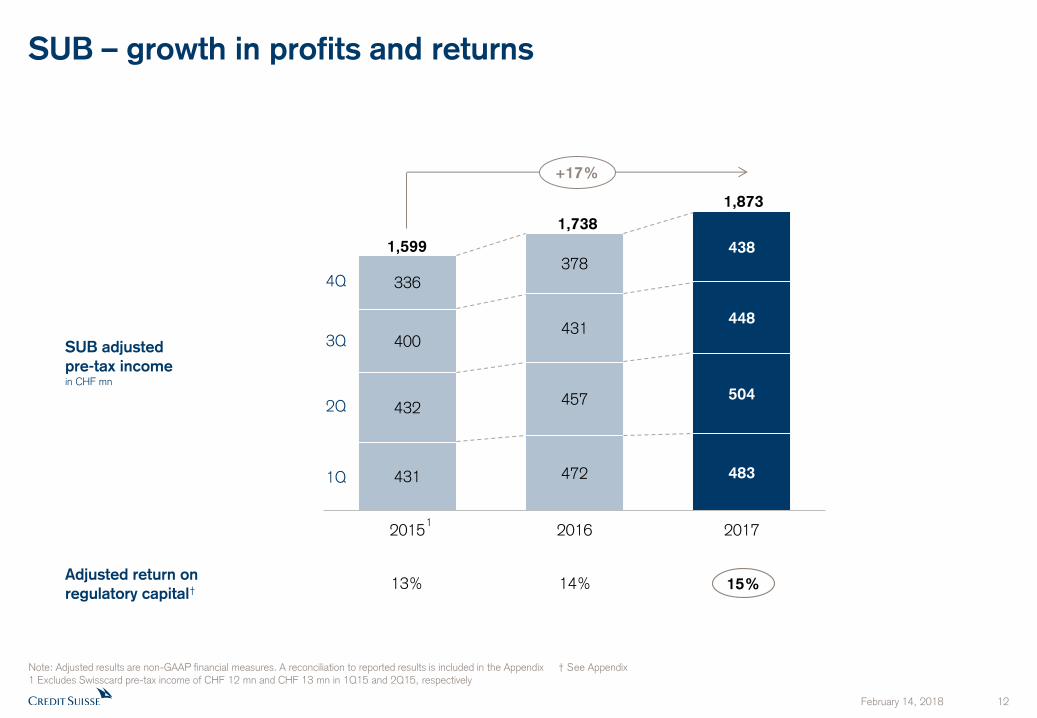
SUB – growth in profits and returns
431 472 483
432 457 504
400 431
448
336 378
438
2015 2016 2017
SUB adjusted
pre-tax income
in CHF mn
Note: Adjusted results are non-GAAP financial measures. A reconciliation to reported results is included in the Appendix † See Appendix 1 Excludes Swisscard pre-tax income of CHF 12 mn and CHF 13 mn in 1Q15 and 2Q15, respectively
1
+17%
1,873
1,738
1,599
1Q
2Q
3Q
4Q
Adjusted return on
regulatory capital† 13% 15% 14%

February 14, 2018 13
IWM – growth in profits and returns…
268 308 327
272 260 378
247 241
382 229 300
410
2015 2016 2017
IWM adjusted
pre-tax income
in CHF mn
Note: Adjusted results are non-GAAP financial measures. A reconciliation to reported results is included in the Appendix † See Appendix
+47%
1,497
1,109
1,016
1Q
2Q
3Q
4Q
Adjusted return on
regulatory capital† 22% 29% 23%

February 14, 2018 14
…supported by strong growth in Asset Management PTI…
186
287
381
2015 2016 2017
Asset Management
adjusted pre-tax income
in CHF mn
Note: Adjusted results are non-GAAP financial measures. A reconciliation to reported results is included in the Appendix
+105%

February 14, 2018 15
…driven by higher recurring management fees
Asset Management
management fees
in CHF mn
Fee-based gross margin in basis points
873 891
1,084
2015 2016 2017
32 34 32
+22%
February 14, 2018 16
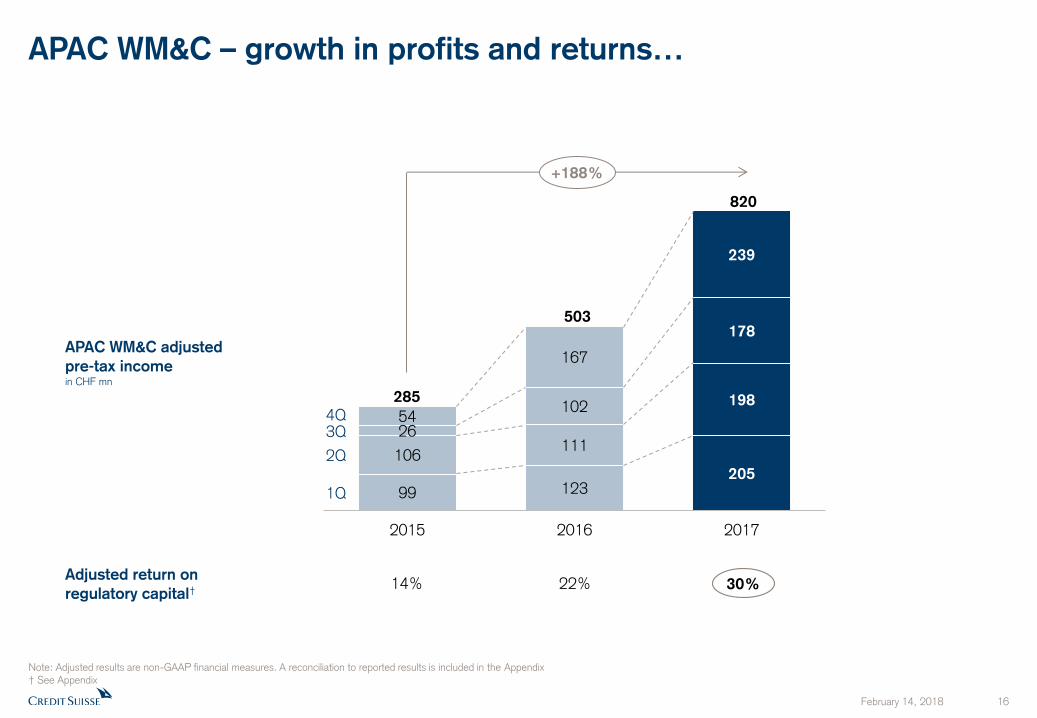
APAC WM&C – growth in profits and returns…
99 123 205
106 111
198
26
102
178
54
167
239
2015 2016 2017
APAC WM&C adjusted
pre-tax income
in CHF mn
Note: Adjusted results are non-GAAP financial measures. A reconciliation to reported results is included in the Appendix † See Appendix
+188%
820
503
285
1Q
2Q
3Q 4Q
Adjusted return on
regulatory capital† 14% 30% 22%

February 14, 2018 17
…our integrated approach in APAC is recognized as best-in-class
Best Private Bank –
Asia Pacific1
3rd consecutive year and 4th time in the past five years
Outperforming industry peers
in the competitive UHNW space ” Asian Private Banker
“ Best-in-class solutions
to Asia’s entrepreneurs Asian Private Banker
“ ”
Once again the standout player in the world’s most competitive private banking market, emphatically demonstrating just how powerful its
integrated APAC model is
“
” Asian Private Banker
Received ~120
industry awards
for 20175
selected accolades Asia Pacific Loan House of the Year6
Asia’s Best Bank for Financing2
Best Investment Bank in Indonesia, Singapore, South Korea, Vietnam2
Quant House of the Year for Asia ex-Japan8
1 Asian Private Banker as of January, 2018 2 Euromoney as of July, 2017 3 The Asset Triple A Regional Awards 2017 as of February, 2018 4 Institutional Investor as of June, 2017 5 Includes awards which reflect 2017 performance, including announced in 2018 YTD; excludes awards announced in 2017 which reflect 2016 performance. Excludes all survey and poll results 6 IFR Asia as of December, 2017 7 GlobalCapital Asia as of December, 2017 8 AsiaRisk as of September, 2017 9 Dealogic as of December 31, 2017 for APAC ex-Japan and ex-China onshore
Asia’s Best Bank for
Wealth Management2 #1 All-Asia Sales &
Trading Team Surveys4
Best Corporate and
Institutional Bank3
Top 2 IBCM Share of Wallet in APAC9
Best Investment Bank in Asia7
Best Private Bank – UHNW Services1
Best understanding
of client needs and (…)
high-quality relationships
with investors
”
Institutional Investor
“ Deploys capital in the
places it is good at, specifically serving Asia-
Pacific entrepreneurs Euromoney ”
“ One of the most active
participants in the Hong Kong tech IPO revival
The Asset ” “
February 14, 2018 18
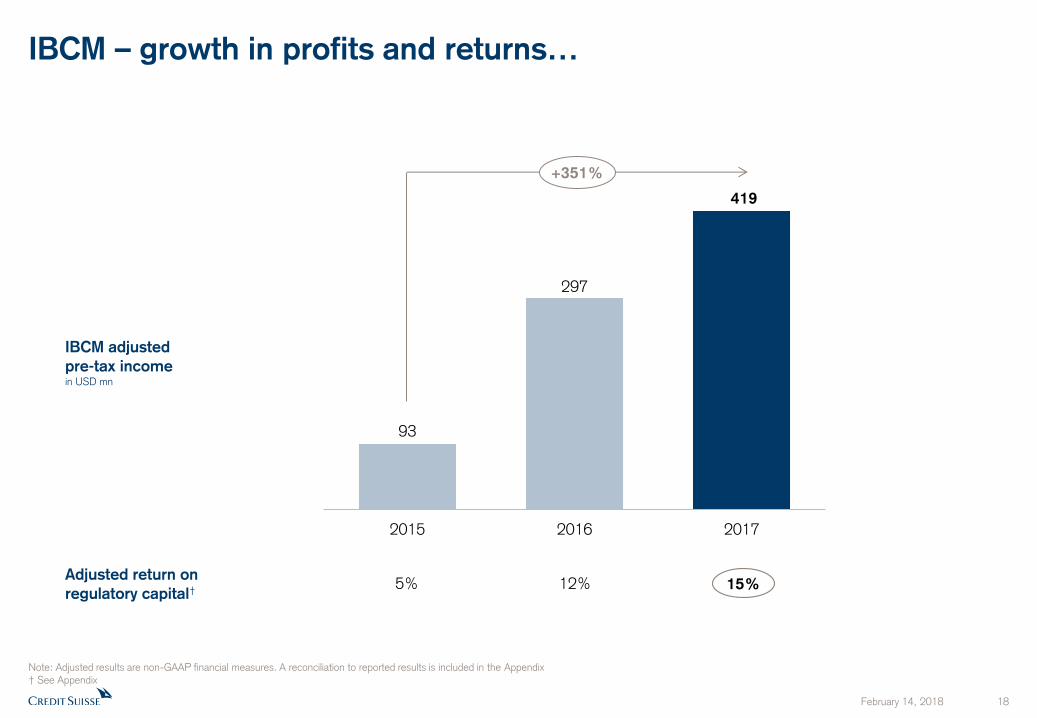
IBCM – growth in profits and returns…
93
297
419
2015 2016 2017
IBCM adjusted
pre-tax income
in USD mn
Note: Adjusted results are non-GAAP financial measures. A reconciliation to reported results is included in the Appendix † See Appendix
+351%
Adjusted return on
regulatory capital† 5% 15% 12%

February 14, 2018 19
…with share of wallet gains across all key products in 2017 and
continued strong performance in 4Q17…
IBCM share of wallet1
1 Source: Dealogic as of December 31, 2017. Relating to Americas and EMEA
2017 vs. 2016
2017
4.1%
5.7%
7.4%
M&A
ECM
Leveraged Finance
Share of wallet gains and market position in 4Q171
M&A SoW +78 bps YoY
Top 4 in ECM, up 1 rank YoY
Leveraged Finance SoW +27 bps YoY
Revenue growth outperformed industry-wide
Street fee pool

February 14, 2018 20
…and marquee M&A transactions announced in 4Q17, with
continued momentum in 1Q18
4Q17
1Q18
Selected announced global M&A transactions Deal value and Credit Suisse role
USD 7.0 bn Sale of selected Crop
Science businesses to BASF Joint Lead Financial Advisor to Bayer
USD 8.2 bn Acquisition of Unilever’s global Spreads business
Exclusive Financial Advisor to KKR
USD 5.0 bn Sale to Global
Infrastructure Partners Lead Financial Advisor to Equis Energy
USD 6.1 bn Acquisition of
Snyder’s-Lance Inc. Lead Financial Advisor to Campbell’s
USD 6.3 bn Recommended offer
by Informa PLC Financial Advisor and Corporate Broker to UBM plc
USD 2.8 bn Acquisition of Nestlé’s U.S.
Confectionary business Financial Advisor to Ferrero
USD 5.4 bn Acquisition of
DST Systems
Financial Advisor to SS&C and Lead Arranger on
committed financing
USD 23.0 bn Merger with
Keurig Green Mountain Financial Advisor to Dr Pepper Snapple Group, Inc.
USD 8.0 bn1
Acquisition of NRG Energy’s
controlling stake in NRG Yield and certain other renewable businesses
Financial Advisor to GIP and Joint Lead Arranger and
Joint Bookrunner on USD 1.5 bn of committed financing
1 Relating to enterprise value

February 14, 2018 21
Global Markets with resilient revenue performance in a challenging
trading environment…
Global Markets1 adjusted net revenues in 4Q17 decreased 5% YoY
Fixed Income2 revenues in 4Q17 increased 5% YoY, with strong contribution from Securitized Products,
particularly #1 ranked Asset Finance franchise3
Equities1,2 adjusted revenues in 4Q17 declined 15% YoY vs. a strong 4Q16 comparable; up 10% QoQ primarily
due to strong underwriting performance
Continued progress towards full-year 2018 adjusted operating expenses ambition of <USD 4.8 bn with 2017
adjusted operating expenses down 5% YoY
Strong start to 1Q18 with Global Markets estimated net revenues up more than 10% YoY4 in the first 6 weeks of
2018
Note: Measured in USD terms, adjusted results are non-GAAP financial measures. A reconciliation to reported results is included in the Appendix 1 Excludes SMG net revenues of USD 12 mn, USD 2 mn and USD (6) mn in 4Q16, 3Q17 and 4Q17 2 Includes sales and trading and underwriting 3 Thomson Reuters, as of December 31, 2017 4 Relating to February 8, 2018 versus February 8, 2017

February 14, 2018 22
…and positive operating leverage in 2017…
Global Markets adjusted operating expenses in USD bn
5.4
5.7
2016 2017
Global Markets adjusted net revenues1 in USD bn
+5%
5.3
5.0
2016 2017
-5%
Note: Adjusted results are non-GAAP financial measures. A reconciliation to reported results is included in the Appendix 1 Excludes SMG net revenues of USD 172 mn and USD (16) mn in 2016 and 2017, respectively
February 14, 2018 23
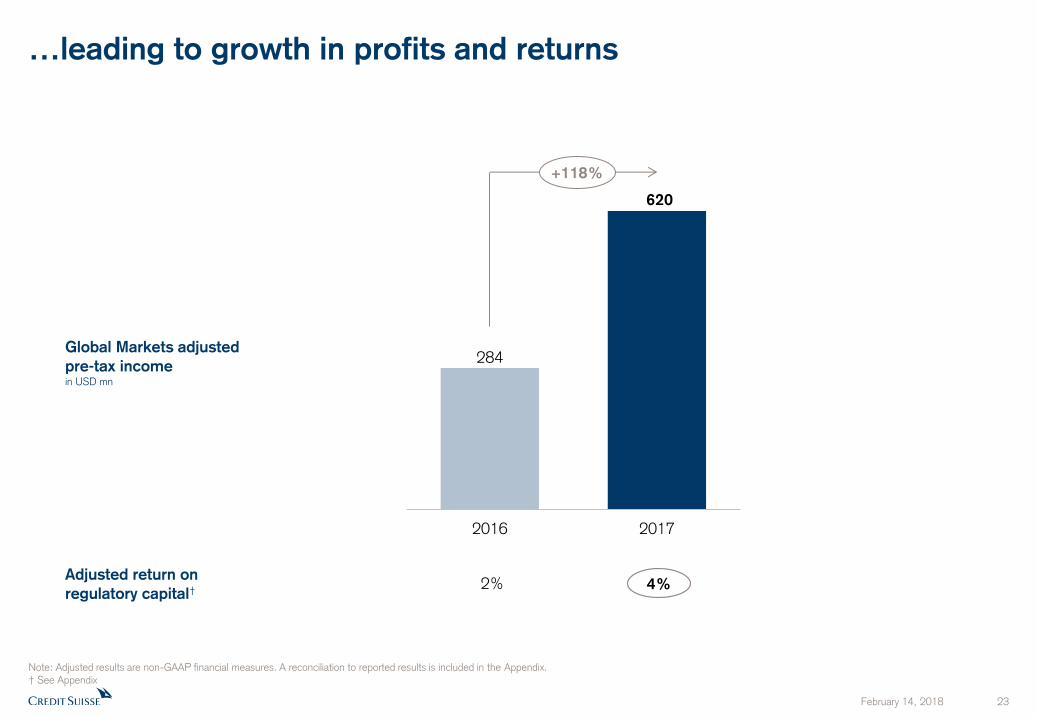
284
620
2016 2017
…leading to growth in profits and returns
Global Markets adjusted
pre-tax income
in USD mn
Note: Adjusted results are non-GAAP financial measures. A reconciliation to reported results is included in the Appendix. † See Appendix
+118%
Adjusted return on
regulatory capital† 4% 2%
February 14, 2018 24
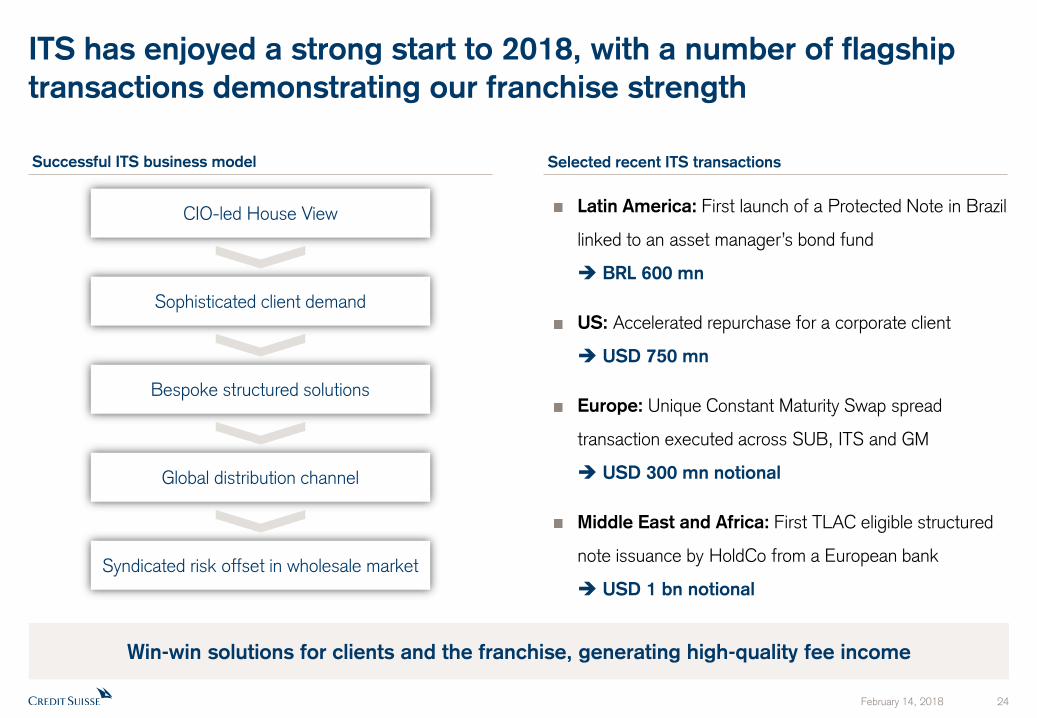
ITS has enjoyed a strong start to 2018, with a number of flagship
transactions demonstrating our franchise strength
Successful ITS business model Selected recent ITS transactions
Latin America: First launch of a Protected Note in Brazil
linked to an asset manager’s bond fund
BRL 600 mn
US: Accelerated repurchase for a corporate client
USD 750 mn
Europe: Unique Constant Maturity Swap spread
transaction executed across SUB, ITS and GM
USD 300 mn notional
Middle East and Africa: First TLAC eligible structured
note issuance by HoldCo from a European bank
USD 1 bn notional
CIO-led House View
Sophisticated client demand
Bespoke structured solutions
Global distribution channel
Syndicated risk offset in wholesale market
Win-win solutions for clients and the franchise, generating high-quality fee income
February 14, 2018 25
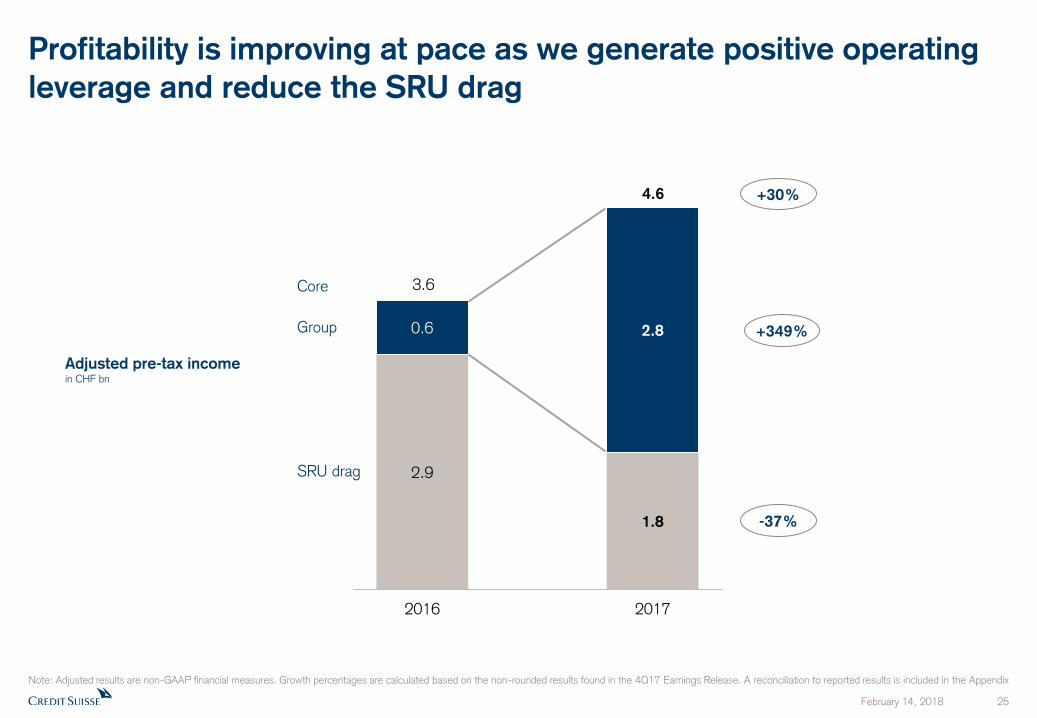
2.9
1.8
0.6 2.8
2016 2017
Profitability is improving at pace as we generate positive operating
leverage and reduce the SRU drag
Note: Adjusted results are non-GAAP financial measures. Growth percentages are calculated based on the non-rounded results found in the 4Q17 Earnings Release. A reconciliation to reported results is included in the Appendix
Adjusted pre-tax income in CHF bn
Core
SRU drag
Group
+30%
-37%
4.6
3.6
+349%

February 14, 2018 26
We are improving returns across our business lines and driving
Group returns higher
Note: Adjusted results are non-GAAP financial measures. A reconciliation to reported results is included in the Appendix † See Appendix 1 Thereof WM&C 29.9%, APAC Markets (0.9)%
6.0%
(2016: 1.3%) = +
2017 Adj. RoRC†
Group SRU
-33.5%
(2016: -35.1%)
SUB
IWM
APAC
IBCM
Global Markets
14.6% 14.2%
28.6% 23.1%
15.2% 11.9%
4.3% 2.0%
14.8% 15.0%1
10.9% 8.6% Core
Divisional adjusted RoRC†
2017 2016 Size of bar represents 2017 RWA allocation
2016 Adj. RoRC†

February 14, 2018 27
Current trading and outlook
Strong start to the year across Wealth Management and Market-dependent activities in the first 6 weeks of 2018
Positive net asset inflows across each of our Wealth Management businesses1
Significant rebound in client activity levels in Global Markets, with strength in Equity Derivatives and Securitized Products
Estimated net revenues in Global Markets up more than 10% YoY2 and in APAC Markets up more than 15% YoY2
In addition, operating expenses across the two divisions have been reduced since we started our restructuring back in
2016, benefiting directly our bottom-line, with a positive effect on profitability3
Recent pick-up in market volatility impacting primary calendar
Well positioned to capture profitable growth opportunities and benefit from improved market conditions
1 Relating to SUB PC, IWM PB and APAC PB within WM&C 2 Relating to February 8, 2018 versus February 8, 2017 3 Relating to February 8, 2018 versus February 8, 2016
February 14, 2018 28
Summary
Delivering profitable growth
Executing with discipline
Increasing return on capital
Detailed Financials

February 14, 2018 30
Credit Suisse Group results 4Q17 3Q17 4Q16 2017 2016
Net revenues 5,189 4,972 5,181 20,900 20,323
Provision for credit losses 43 32 75 210 252
Total operating expenses 5,005 4,540 7,309 18,897 22,337
Pre-tax income/(loss) 141 400 (2,203) 1,793 (2,266)
Real estate gains - - (78) - (424)
(Gains)/losses on business sales 28 - 2 13 58
Restructuring expenses (137) (112) (49) (455) (540)
Major litigation provisions (255) (108) (2,401) (493) (2,707)
Expenses related to business sales (8) - - (8) -
Net revenues 5,217 4,972 5,105 20,913 19,957
Provision for credit losses 43 32 75 210 252
Total operating expenses 4,605 4,320 4,859 17,941 19,090
Pre-tax income 569 620 171 2,762 615
Net income/(loss) attributable to shareholders (2,126) 244 (2,619) (983) (2,710)
Diluted earnings/(loss) per share in CHF (0.83) 0.09 (1.20) (0.41) (1.27)
Return on tangible equity1 (22.0)% 2.5% (26.9)% (2.6)% (6.9)%
Results overview A
dju
sted
Note: All values shown are in CHF mn unless otherwise specified. Adjusted results are non-GAAP financial measures. A reconciliation to reported results is included in the Appendix 1 Return on tangible equity is based on tangible shareholders’ equity attributable to shareholders, a non-GAAP financial measure, which is calculated by deducting goodwill and other intangible assets from total shareholders’ equity attributable to shareholders as presented in our balance sheet. Management believes that the return on tangible shareholders’ equity attributable to shareholders is meaningful as it allows consistent measurement of the performance of businesses without regard to whether the businesses were acquired. For end-4Q17, tangible equity excluded goodwill of CHF 4,742 million and other intangible assets of CHF 223 million from total shareholders’ equity attributable to shareholders of CHF 41,902 million as presented in our balance sheet.

February 14, 2018 31
(3) 265
1 2 4
2 272
3Q17 FX impact Corebusinesses
SRU Op Risk RWAfrom RMBS
Other 4Q17
917
(6) 909 7
7
3Q17 FX impact Core businesses SRU 4Q17
CET1 ratio at 12.8% and Tier-1 leverage ratio at 5.2%
1 Includes model and parameter updates 2 Includes methodology and policy changes
Basel III RWA in CHF bn Comments
Leverage exposure in CHF bn
12.8% CET1 ratio
3.8% 3.8% CET1 leverage ratio
5.2% 5.2% Tier-1 leverage ratio
CET1 ratio of 12.8% above 2018 target level of >12.5%
Further reduction of RWA in the SRU by CHF 3 bn, leaving RWA
excl. operational risk at USD 14 bn, well on track to achieve end-2018 target of USD 11 bn
CHF 3.8 bn reflecting an updated loss history and a revised methodology for the measurement of our RWA relating to operational risk, primarily in respect of our RMBS settlements,
recorded in Corporate Center in 4Q17; equates to a 19 bps adverse impact on CET1 ratio
Reduction in CET1 ratio during 2H17 including related
operational risk RWA recorded in 3Q17 equates to ~45 bps
Tier-1 leverage ratio of 5.2%, of which CET1 leverage ratio at
3.8%, unchanged from previous quarter
3Q17 4Q17 1
13.2%
2 1

February 14, 2018 32
Net savings of CHF 1.4 bn or 7% in the full year 2017; achieved
target with an operating cost base of CHF 18.0 bn for the year
Adjusted operating cost base at constant FX rates* in CHF bn Key messages
5.2 5.3
4.9
5.8
4.8 4.9 4.8 4.9
4.6 4.5 4.4 4.6
1Q 2Q 3Q 4Q
Continuous YoY cost reduction over the past 2 years
2015
2016
2017
Full year
2015
Full year
2016
Net cost savings
2017
Full year
2017
2018 Target
21.2
19.4 (1.4)
<17.0
18.0
(7)%
7% cost reduction in 2017 vs. prior year with incremental net savings of CHF 0.3 bn in 4Q17; majority of savings from the execution of the workforce strategy and the continued wind-down of the SRU
Committed to delivering on our end-2018 target with adjusted operating cost base of < CHF 17.0 bn
Note: Adjusted results are non-GAAP financial measures. A reconciliation to reported results is included in the Appendix * Adjusted operating cost base at constant FX rates; see Appendix
February 14, 2018 33
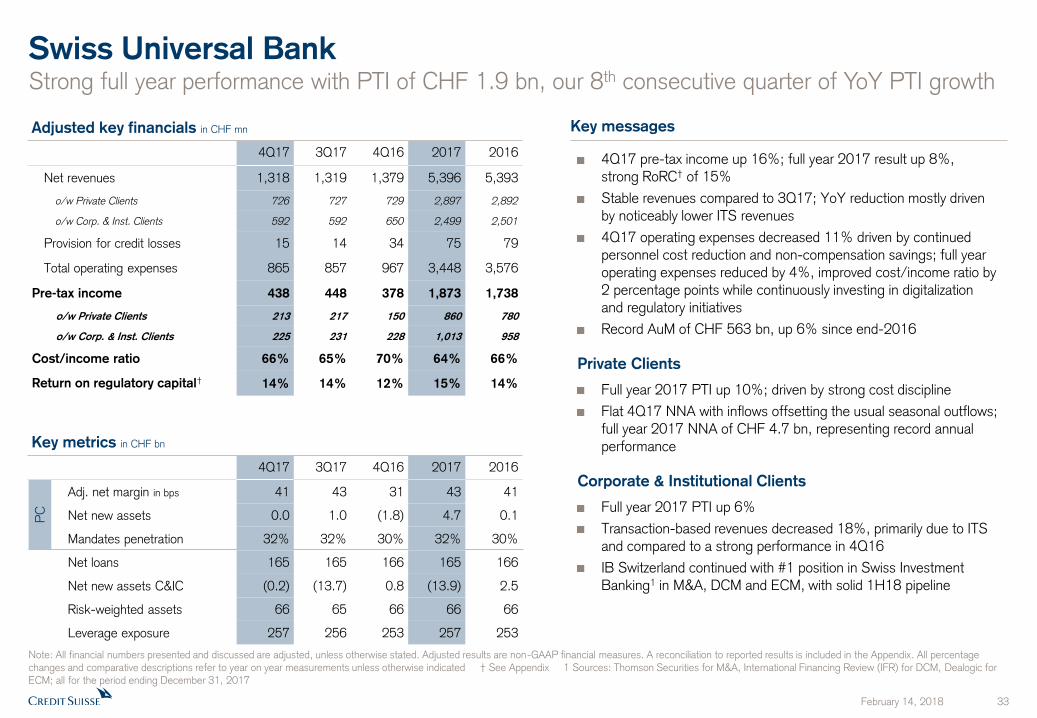
Swiss Universal Bank Strong full year performance with PTI of CHF 1.9 bn, our 8th consecutive quarter of YoY PTI growth
Note: All financial numbers presented and discussed are adjusted, unless otherwise stated. Adjusted results are non-GAAP financial measures. A reconciliation to reported results is included in the Appendix. All percentage changes and comparative descriptions refer to year on year measurements unless otherwise indicated † See Appendix 1 Sources: Thomson Securities for M&A, International Financing Review (IFR) for DCM, Dealogic for ECM; all for the period ending December 31, 2017
Key messages
PC
Key metrics in CHF bn
Adjusted key financials in CHF mn
4Q17 pre-tax income up 16%; full year 2017 result up 8%, strong RoRC† of 15%
Stable revenues compared to 3Q17; YoY reduction mostly driven by noticeably lower ITS revenues
4Q17 operating expenses decreased 11% driven by continued personnel cost reduction and non-compensation savings; full year operating expenses reduced by 4%, improved cost/income ratio by 2 percentage points while continuously investing in digitalization and regulatory initiatives
Record AuM of CHF 563 bn, up 6% since end-2016
Private Clients
Full year 2017 PTI up 10%; driven by strong cost discipline
Flat 4Q17 NNA with inflows offsetting the usual seasonal outflows; full year 2017 NNA of CHF 4.7 bn, representing record annual performance
Corporate & Institutional Clients
Full year 2017 PTI up 6%
Transaction-based revenues decreased 18%, primarily due to ITS and compared to a strong performance in 4Q16
IB Switzerland continued with #1 position in Swiss Investment Banking1 in M&A, DCM and ECM, with solid 1H18 pipeline
4Q17 3Q17 4Q16 2017 2016
Adj. net margin in bps 41 43 31 43 41
Net new assets 0.0 1.0 (1.8) 4.7 0.1
Mandates penetration 32% 32% 30% 32% 30%
Net loans 165 165 166 165 166
Net new assets C&IC (0.2) (13.7) 0.8 (13.9) 2.5
Risk-weighted assets 66 65 66 66 66
Leverage exposure 257 256 253 257 253
4Q17 3Q17 4Q16 2017 2016
Net revenues 1,318 1,319 1,379 5,396 5,393
o/w Private Clients 726 727 729 2,897 2,892
o/w Corp. & Inst. Clients 592 592 650 2,499 2,501
Provision for credit losses 15 14 34 75 79
Total operating expenses 865 857 967 3,448 3,576
Pre-tax income 438 448 378 1,873 1,738
o/w Private Clients 213 217 150 860 780
o/w Corp. & Inst. Clients 225 231 228 1,013 958
Cost/income ratio 66% 65% 70% 64% 66%
Return on regulatory capital† 14% 14% 12% 15% 14%

February 14, 2018 34
International Wealth Management Strong finish to a successful year – Full year PTI up 35% with a return on capital of 29%
PB
4Q17 3Q17 4Q16 2017 2016
Adj. net margin in bps 30 31 24 32 27
Net new assets 2.7 3.6 0.4 15.6 15.6
Number of RM 1,130 1,130 1,140 1,130 1,140
Net loans 50 48 45 50 45
Net new assets AM 1.4 1.1 (4.4) 20.3 5.6
Risk-weighted assets 38 37 35 38 35
Leverage exposure 99 93 94 99 94
Key metrics in CHF bn
Key messages Adjusted key financials in CHF mn
4Q17 3Q17 4Q16 2017 2016
Net revenues 1,392 1,262 1,245 5,139 4,644
o/w Private Banking 923 870 864 3,603 3,317
o/w Asset Management 469 392 381 1,536 1,327
Provision for credit losses 14 3 6 27 20
Total operating expenses 968 877 939 3,615 3,515
Pre-tax income 410 382 300 1,497 1,109
o/w Private Banking 275 272 192 1,116 822
o/w Asset Management 135 110 108 381 287
Cost/income ratio 70% 69% 75% 70% 76%
Return on regulatory capital† 31% 29% 24% 29% 23%
2017 PTI of CHF 1.5 bn vs. CHF 1.1 bn in 2016
Sustained strong PB NNA of CHF 15.6 bn, a growth rate of 5%; AM NNA increased to CHF 20.3 bn at a 6% growth rate
PB net margin improved to 32 bps in 2017
Private Banking
2017 PTI up 36% and 4Q17 PTI up 43% vs. 4Q16
Delivered operating leverage in 2017 on 9% higher revenues and stable expenses; cost increase vs. 3Q17 due to IT investments and higher regulatory and marketing costs
4Q17 and 2017 with increase across all major revenue lines, including significantly higher client activity
Successful house view performance reflected by CHF 15.3 bn net mandate sales in 2017; penetration up 3 percentage points to 31%
Asset Management
PTI up 33% vs. 2016 and up 25% vs. 4Q16
Continued double digit growth in management fees at resilient recurring margins
Strong investment performance during the year resulted in 105% higher performance fees vs. 4Q16 (up 66% vs. 2016); also resulted in higher performance-related compensation expenses
Note: All financial numbers presented and discussed are adjusted, unless otherwise stated. Adjusted results are non-GAAP financial measures. A reconciliation to reported results is included in the Appendix. All percentage changes and comparative descriptions refer to year on year measurements unless otherwise indicated † See Appendix

February 14, 2018 35
Asia Pacific Record performance in WM&C offset by lower results in Markets
PB
1
Key metrics in CHF bn
Key messages Adjusted key financials in CHF mn
Note: All financial numbers presented and discussed are adjusted, unless otherwise stated. Adjusted results are non-GAAP financial measures. A reconciliation to reported results is included in the Appendix. All percentage changes and comparative descriptions refer to year on year measurements unless otherwise indicated † See Appendix 1 APAC PB w ithin WM&C 2 Source: Dealogic, as of December 31, 2017; refers to APAC ex-Japan and ex-China Onshore 3 All numbers quoted under key messages for Markets are based on USD
Strongest fourth-quarter performance with PTI up 63% and full year RoRC† of 15%
Wealth Management & Connected (WM&C)
Record performance with 4Q17 PTI up 43% and RoRC† of 35%. 2017 PTI up 63%
Significantly higher PB net margin of 30 bps for 2017 vs. 2016 on record AuM of CHF 197 bn, including 2017 NNA of CHF 16.9 bn
Record WM&C revenues from higher financing activities, equity underwriting, transaction-based revenues and recurring commissions and fees. Financing revenues in 4Q17 included gains from a pre-IPO financing and net fair value impact from an impaired loan portfolio
Top 2 Rank2 in APAC in advisory and underwriting for 2017
Markets3
Equity sales and trading performance decreased from lower prime services and weaker trading performance in equity derivatives despite consistent client flows, partly offset by strong results in cash. Revenues in 4Q17 included a gain from the call of a structured note liability
Fixed income sales and trading revenues decreased reflecting lower levels of activity in FX and structured products, partly offset by improved performance in rates and credit products. QoQ revenues were lower across product groups, mainly reflecting weaker trading performance
2017 operating expense reduction of 14% from efficiency initiatives
RWA and leverage exposure lower by 23% and 6%, respectively
4Q17 3Q17 4Q16 2017 2016
Adj. net margin in bps 24 31 22 30 23
Net new assets 1.3 5.8 0.7 16.9 13.6
Number of RM 590 590 640 590 640
Assets under management 197 190 167 197 167
Net loans 43 43 40 43 40
Risk-weighted assets 31 31 35 31 35
Leverage exposure 106 106 109 106 109
4Q17 3Q17 4Q16 2017 2016
Net revenues 885 890 862 3,504 3,597
o/w WM&C 626 548 560 2,322 1,904
o/w Markets 259 342 302 1,182 1,693
Provision for credit losses 7 5 11 15 26
Total operating expenses 679 657 729 2,697 2,793
Pre-tax income 199 228 122 792 778
o/w WM&C 239 178 167 820 503
o/w Markets (40) 50 (45) (28) 275
Cost/income ratio 77% 74% 85% 77% 78%
Return on regulatory capital† 15% 18% 9% 15% 15%

February 14, 2018 36
Key messages
Investment Banking & Capital Markets Revenue growth driving over 40% YoY increase in PTI
Adjusted key financials in USD mn
Key metrics in USD bn
Global advisory and underwriting revenues1 in USD mn
Full Year 2017
Delivered strong financial performance for the full year
− Revenues up 9% vs. 2016
− PTI up 41%, driven by both revenue growth and cost discipline
− RoRC† of 15%, one year ahead of 2018 target
− Top 5 rankings in IPOs and Leveraged Finance with market share gains in both regions2
Global advisory and underwriting revenues are up 10% vs. 2016, outperforming industry-wide Street fees which were up 7%3
4Q17
Revenues of USD 573 mn with strong YoY growth across debt and equity underwriting, partly offset by lower advisory revenues reflecting fewer completed deals across the Street
Operating expenses up 6% reflecting targeted investments in business growth, compliance and IT
RoRC† of 17%, with Americas returns of 21% and improved contribution from EMEA
RWA up 16% driven by the impact of methodology changes, growth in the Corporate Bank loan portfolio and increased underwriting commitments
4Q17 3Q17 4Q16 2017 2016
Risk-weighted assets 21 20 18 21 18
Leverage exposure 45 44 45 45 45
4Q17 3Q17 4Q16 2017 2016
Net revenues 573 474 569 2,182 2,001
Provision for credit losses (1) 12 (1) 31 20
Total operating expenses 452 408 428 1,732 1,684
Pre-tax income 122 54 142 419 297
Cost/income ratio 79% 86% 75% 79% 84%
Return on regulatory capital† 17% 8% 22% 15% 12%
4Q17 3Q17 4Q16 2017 2016
Global advisory and underwriting
revenues1 1,034 950 1,042 4,133 3,771
Note: All financial numbers presented and discussed are adjusted, unless otherwise stated. Adjusted results are non-GAAP financial measures. A reconciliation to reported results is included in the Appendix. All share of wallet and rank data is based on IBCM addressable market; includes Americas and EMEA only; excludes self-advised deals and non-core DCM products (investment grade loans, asset-backed and mortgage-backed securities, and government debt). All percentage changes and comparative descriptions refer to year on year measurements unless otherwise indicated † See Appendix 1 Gross global revenues from advisory, debt and equity underwriting generated across all divisions before cross-divisional revenue sharing agreements 2 Source: Dealogic for the period ending December 31, 2017; includes Americas and EMEA only 3 Source: Dealogic for the period ending December 31, 2017 (Global)

February 14, 2018 37
Global Markets
2017 results reflect improved operating leverage and strength of client franchise
Note: All financial numbers presented and discussed are adjusted, unless otherwise stated. Adjusted results are non-GAAP financial measures. A reconciliation to reported results is included in the Appendix. All percentage changes and comparative descriptions refer to year on year measurements unless otherwise indicated † See Appendix 1 Includes sales and trading and underwriting 2 Excludes SMG 3 Completed the transition of the SMG business to IWM in 1Q17
Key messages
4Q17 3Q17 4Q16 2017 2016
Risk-weighted assets 60 58 51 60 51
Leverage exposure 290 291 278 290 278
Key metrics in USD bn
Adjusted key financials in USD mn
4Q17 3Q17 4Q16 2017 2016
Equities1,2 459 419 538 1,998 2,175
Fixed Income1 802 947 765 3,920 3,446
SMG3 (6) 2 12 (16) 172
Other (76) (60) (59) (240) (218)
Net revenues 1,179 1,308 1,256 5,662 5,575
Provision for credit losses 8 7 (3) 32 (4)
Total operating expenses 1,290 1,200 1,236 5,010 5,295
Pre-tax income (119) 101 23 620 284
Cost/income ratio 109% 92% 98% 88% 95%
Return on regulatory capital† n/m 3% 1% 4% 2%
Full Year 2017
Higher PTI of USD 620 mn on successful execution of restructuring strategy amid challenging market conditions
Fixed income revenues increased 14% driven by strength in securitized products and leveraged finance underwriting
Equities2,3 revenues declined 8% reflecting a low volume and volatility environment, particularly impacting equity derivatives
Strong cost discipline with expenses reduced by 5%, or USD 285 mn, vs. 2016 with continued progress towards < USD 4.8 bn in costs by 2018
4Q17
Revenues2,3 declined 5% as a significant increase in underwriting, up 33%, and stable fixed income trading results were offset by a 22% decline in equity trading2,3
Expenses increased 4% driven by higher professional services fees and compensation and benefits
RWA increased vs. 4Q16 due to methodology changes and higher underwriting commitments

February 14, 2018 38
Strategic Resolution Unit 2017 adjusted operating expenses lower by 43% YoY
RWA ex Op Risk and leverage exposure down 43% and 41%, respectively
Note: Adjusted results are non-GAAP financial measures. A reconciliation to reported results is included in the Appendix. All percentage changes and comparative descriptions refer to year on year measurements unless otherwise indicated. 1 Numbers represent RWA movements excluding operational risk RWA
Key messages
Adju
sted
Key financials in USD mn
4Q17 3Q17 4Q16 2017 2016
Net revenues (153) (265) (201) (944) (1,283)
Provision for credit losses 3 (9) 28 31 115
Total operating expenses 196 228 287 909 1,584
Pre-tax loss (352) (484) (516) (1,884) (2,982)
Real estate gains - - (4) - (4)
(Gain) / loss on business sales - - 1 (39) 6
Restructuring expenses 19 21 1 59 123
Major litigation expenses 91 94 2,322 275 2,646
Pre-tax loss reported (462) (599) (2,836) (2,179) (5,753)
4Q17 3Q17 4Q16 2017 2016
Risk-weighted assets in CHF bn 34 36 45 34 45
RWA excl. operational risk in USD bn 14 17 25 14 25
Leverage exposure in USD bn 61 68 103 61 103
Key metrics
Full Year 2017
Full year 2017 adjusted operating expenses lower by USD 675 mn, or 43%, reflecting progress of our cost and infrastructure rationalization program, and the exit from US onshore and Western European private banking businesses
4Q17
Adjusted pre-tax loss improved USD 132 mn vs. 3Q17, on the back of exit-related gains of USD 53 mn, and lower adjusted operating expenses
On a year-on-year basis, RWA1 and leverage exposure reduced by USD 11 bn (43%) and USD 42 bn (41%), respectively. Bilateral derivatives trade count of 92k, down 50k vs. 4Q16, or 35%
RWA1 and leverage exposure lower by USD 2 bn (15%) and USD 6 bn (9%), respectively, compared to 3Q17
− Broad range of transactions executed in the quarter, including the restructuring of life finance and emerging market exposures, real estate exits, and full exit of legacy leverage finance capital markets portfolio

February 14, 2018 39
Summary
Delivering profitable growth
Executing with discipline
Increasing return on capital
Appendix

February 14, 2018 41
Overview of Credit Suisse 4Q17 and 2017 results
Note: Adjusted results are non-GAAP financial measures. A reconciliation to reported results is included in this presentation
Pre-tax income in CHF mn unless otherwise specified
Reported Adjusted
4Q17 3Q17 4Q16 2017 2016 4Q17 3Q17 4Q16 2017 2016
SUB 433 426 382 1,765 2,025 438 448 378 1,873 1,738
IWM 340 355 331 1,351 1,121 410 382 300 1,497 1,109
APAC 176 218 103 729 725 199 228 122 792 778
o/w Wealth Mgmt. & Connected 229 173 162 799 489 239 178 167 820 503
o/w Markets in USD mn (53) 46 (58) (68) 245 (40) 52 (44) (26) 284
IBCM in USD mn 108 37 148 376 268 122 54 142 419 297
Global Markets in USD mn (200) 73 9 458 57 (119) 101 23 620 284
Total Core 596 978 692 3,928 3,493 916 1,089 692 4,609 3,558
SRU in USD mn (462) (599) (2,836) (2,179) (5,753) (352) (484) (516) (1,884) (2,982)
Group 141 400 (2,203) 1,793 (2,266) 569 620 171 2,762 615
RWA in CHF bn 272 265 268
CET1 ratio 12.8% 13.2% 11.5%
Leverage exposure in CHF bn 917 909 951
Tier 1 leverage ratio 5.2% 5.2% 4.4%

February 14, 2018 42
Wealth Management businesses NNA generation
1 APAC PB within WM&C
NNA growth (annualized)
IWM PB NNA in CHF bn
Regularization outflows included in NNA in CHF bn
SUB PC NNA in CHF bn
0.7
5.8
1.3
4Q16 2017
2% 10% 13% 3% 9%
3Q17 4Q17 2016
APAC PB1 NNA in CHF bn
(1.4) (0.7) - (0.1) (2.5)
1% 5% 4% 3% 5%
(2.2) (1.6) (0.4) (0.5) (5.7)
(4)% 2% 2% -% -
(0.2) (0.2) - (0.1) (0.6)
13.6
0.4
3.6 2.7
4Q16 2017 3Q17 4Q17 2016
15.6
(1.8)
1.0 -
4Q16 2017 3Q17 4Q17 2016
0.1
16.9
15.6 4.7

February 14, 2018 43
Wealth Management businesses Net and gross margins
Note: Adjusted results are non-GAAP financial measures. A reconciliation to reported results is included in this presentation. For details on calculations see at the end of this presentation under ‘Notes’ 1 APAC PB within WM&C
SUB PC Adj. net margin in bps
Adj. gross margin in bps
IWM PB Adj. net margin in bps
Adj. gross margin in bps
APAC PB1 Adj. net margin in bps
171 182 160
22 31
24 23 30
4Q16 2017 4Q17
Adj. gross margin in bps
87 87 80 86 88
Average AuM in CHF bn
95 548 365
Adj. pre-tax income in CHF mn
372 1,607 1,374
Adj. net revenues in CHF mn
3Q17 2016
184
141
400
196
116
391
24 31 30 27 32 31
43 41 41 43
316 344 300
109 101 101 110 105
192 1,116 822
864 3,603 3,317
346
272
870
365
275
923
192 202 190
152 142 140 152 143
150 860 780
729 2,897 2,892
204
217
727
208
213
726
4Q16 2017 4Q17 3Q17 2016 4Q16 2017 4Q17 3Q17 2016 4Q16 2017 4Q17 3Q17 2016
4Q16 2017 4Q17 3Q17 2016 4Q16 2017 4Q17 3Q17 2016

February 14, 2018 44
Swiss Universal Bank Private Clients and Corporate & Institutional Clients
Note: Adjusted results are non-GAAP financial measures. A reconciliation to reported results is included in this presentation
Private Clients Adjusted key financials in CHF mn Corporate & Institutional Clients Adjusted key financials in CHF mn
Key metrics in CHF bn Key metrics in CHF bn
4Q17 3Q17 4Q16 2017 2016
Net interest income 301 303 324 1,226 1,223
Recurring commissions & fees 159 149 162 634 626
Transaction-based 146 161 177 694 702
Other revenues (14) (21) (13) (55) (50)
Net revenues 592 592 650 2,499 2,501
Provision for credit losses 5 5 24 33 40
Total operating expenses 362 356 398 1,453 1,503
Pre-tax income 225 231 228 1,013 958
Cost/income ratio 61% 60% 61% 58% 60%
4Q17 3Q17 4Q16 2017 2016
Adj. net margin in bps 41 43 31 43 41
Net new assets 0.0 1.0 (1.8) 4.7 0.1
Mandates penetration 32% 32% 30% 32% 30%
Assets under management 208 206 192 208 192
Number of RM 1,300 1,300 1,430 1,300 1,430
4Q17 3Q17 4Q16 2017 2016
Net new assets (0.2) (13.7) 0.8 (13.9) 2.5
Assets under management 355 347 339 355 339
Number of RM 540 550 540 540 540
4Q17 3Q17 4Q16 2017 2016
Net interest income 428 421 421 1,670 1,661
Recurring commissions & fees 208 205 216 812 820
Transaction-based 89 101 93 413 410
Other revenues 1 0 (1) 2 1
Net revenues 726 727 729 2,897 2,892
Provision for credit losses 10 9 10 42 39
Total operating expenses 503 501 569 1,995 2,073
Pre-tax income 213 217 150 860 780
Cost/income ratio 69% 69% 78% 69% 72%

February 14, 2018 45
International Wealth Management Private Banking and Asset Management
Note: Adjusted results are non-GAAP financial measures. A reconciliation to reported results is included in this presentation
Private Banking Adjusted key financials in CHF mn Asset Management Adjusted key financials in CHF mn
Key metrics in CHF bn Key metrics in CHF bn
4Q17 3Q17 4Q16 2017 2016
Net interest income 380 367 353 1,449 1,308
Recurring commissions & fees 308 300 277 1,200 1,093
Transaction- and perf.-based 235 203 235 953 922
Other revenues 0 0 (1) 1 (6)
Net revenues 923 870 864 3,603 3,317
Provision for credit losses 14 3 6 27 20
Total operating expenses 634 595 666 2,460 2,475
Pre-tax income 275 272 192 1,116 822
Cost/income ratio 69% 68% 77% 68% 75%
4Q17 3Q17 4Q16 2017 2016
Adj. net margin in bps 30 31 24 32 27
Net new assets 2.7 3.6 0.4 15.6 15.6
Assets under management 367 355 323 367 323
Mandates penetration 31% 30% 28% 31% 28%
Net loans 50 48 45 50 45
Number of RM 1,130 1,130 1,140 1,130 1,140
4Q17 3Q17 4Q16 2017 2016
Management fees 283 278 228 1,084 891
Performance & placement rev. 173 63 108 310 208
Investment & partnership inc. 13 51 45 142 228
Net revenues 469 392 381 1,536 1,327
Total operating expenses 334 282 273 1,155 1,040
Pre-tax income 135 110 108 381 287
Cost/income ratio 71% 72% 72% 75% 78%
4Q17 3Q17 4Q16 2017 2016
Net new assets 1.4 1.1 (4.4) 20.3 5.6
Assets under management 386 376 322 386 322

February 14, 2018 46
Asia Pacific Wealth Management & Connected and Markets
Note: Adjusted results are non-GAAP financial measures. A reconciliation to reported results is included in this presentation † See under “Notes” at the end of this Appendix 1 APAC PB within WM&C
Wealth Management & Connected
Adjusted key financials in CHF mn
Markets
Adjusted key financials in USD mn
Private Banking1 revenue details in CHF mn
4Q17 3Q17 4Q16 2017 2016
Private Banking 391 400 372 1,607 1,374
Adv., Underwr. and Financing 235 148 188 715 530
Net revenues 626 548 560 2,322 1,904
Provision for credit losses 7 5 11 15 29
Total operating expenses 380 365 382 1,487 1,372
Pre-tax income 239 178 167 820 503
Cost/income ratio 61% 67% 68% 64% 72%
Return on regulatory capital† 35% 25% 27% 30% 22%
Risk-weighted assets in CHF bn 19 19 18 19 18
Leverage exposure in CHF bn 48 49 46 48 46
4Q17 3Q17 4Q16 2017 2016
Equity sales & trading 240 271 267 940 1,181
Eq. sales & trading ex SMG 240 271 258 940 1,115
Fixed income sales & trading 24 83 33 269 541
Net revenues 264 354 300 1,209 1,722
Provision for credit losses 0 0 0 0 (3)
Total operating expenses 304 302 344 1,235 1,441
Pre-tax income (40) 52 (44) (26) 284
Cost/income ratio 115% 85% 115% 102% 84%
Return on regulatory capital† (5)% 7% (5)% (1)% 9%
Risk-weighted assets in USD bn 12 13 16 12 16
Leverage exposure in USD bn 58 59 62 58 62
4Q17 3Q17 4Q16 2017 2016
Net interest income 147 144 166 620 602
Recurring commissions & fees 100 97 84 381 319
Transaction-based revenues 144 159 122 606 469
Other revenues 0 0 0 0 (16)
Net revenues 391 400 372 1,607 1,374
February 14, 2018 47
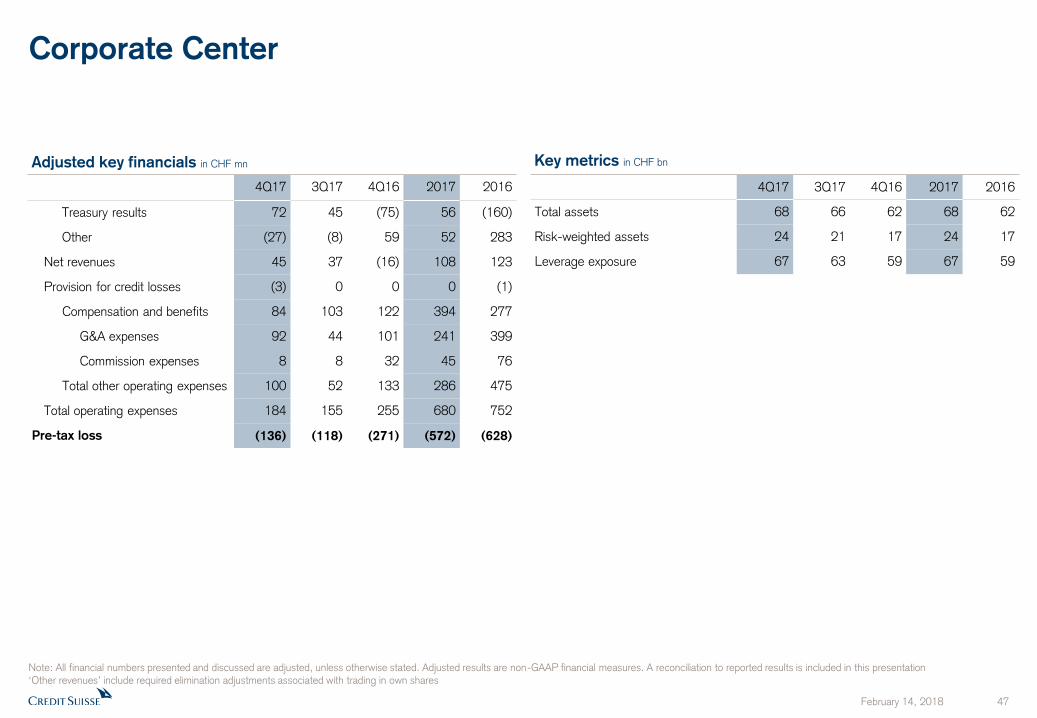
Corporate Center
Note: All financial numbers presented and discussed are adjusted, unless otherwise stated. Adjusted results are non-GAAP financial measures. A reconciliation to reported results is included in this presentation ‘Other revenues’ include required elimination adjustments associated with trading in own shares
4Q17 3Q17 4Q16 2017 2016
Total assets 68 66 62 68 62
Risk-weighted assets 24 21 17 24 17
Leverage exposure 67 63 59 67 59
Adjusted key financials in CHF mn
4Q17 3Q17 4Q16 2017 2016
Treasury results 72 45 (75) 56 (160)
Other (27) (8) 59 52 283
Net revenues 45 37 (16) 108 123
Provision for credit losses (3) 0 0 0 (1)
Compensation and benefits 84 103 122 394 277
G&A expenses 92 44 101 241 399
Commission expenses 8 8 32 45 76
Total other operating expenses 100 52 133 286 475
Total operating expenses 184 155 255 680 752
Pre-tax loss (136) (118) (271) (572) (628)
Key metrics in CHF bn

February 14, 2018 48
Currency mix & Group capital metrics
44%
29%
12%
15%
Currency mix capital metric4 ”look-through”
A 10% strengthening / weakening of the USD (vs. CHF)
would have a +2.1 bps / (2.4) bps impact on the
“look-through” BIS CET1 ratio
40%
46%
7% 7%
42%
45%
7% 5%
Bas
el I
II R
isk-w
eig
hte
d a
ssets
Sw
iss
leve
rage e
xposu
re
CHF
EUR
Other
USD
US
D
CE
T1
cap
ital
5
1 As reported 2 Total expenses include provisions for credit losses 3 Sensitivity analysis based on weighted average exchange rates of USD/CHF of 0.99 and EUR/CHF of 1.07 for the 2017 results 4 Data based on December 2017 month-end currency mix and on a ”look-through” basis 5 Reflects actual capital positions in consolidated Group legal entities (net assets) including net asset hedges less applicable Basel III regulatory adjustments (e.g. goodwill)
Contribution
Swiss Universal Bank
International Wealth Management
Asia Pacific
Global Markets
Investment Bank & Capital Markets
Credit Suisse Core results1
Core results
2017
in CHF mn CHF USD EUR GBP Other
Applying a +/- 10% movement on the average FX rates for 2017, the sensitivities are:
USD/CHF impact on 2017 pre-tax income by CHF +468 / (468) mn
EUR/CHF impact on 2017 pre-tax income by CHF +167 / (167) mn
Sensitivity analysis on Core results3
Net revenues 21,786 25% 49% 11% 2% 13%
Total expenses2 17,858 32% 34% 4% 11% 19%
Net revenues 5,396 76% 13% 8% 1% 2%
Total expenses2 3,631 82% 7% 2% 4% 5%
Net revenues 5,111 21% 50% 17% 3% 9%
Total expenses2 3,760 41% 26% 11% 9% 13%
Net revenues 3,504 4% 46% 2% 1% 47%
Total expenses2 2,775 10% 17% -% 3% 70%
Net revenues 5,551 -% 70% 18% 2% 10%
Total expenses2 5,101 4% 59% 3% 22% 12%
Net revenues 2,139 -1% 87% 7% 3% 4%
Total expenses2 1,770 3% 71% 5% 15% 6%

February 14, 2018 49
Reconciliation of adjustment items (1/8)
Adjusted results are non-GAAP financial measures that exclude goodwill impairment and certain other revenues and expenses included in our reported results. Management believes that adjusted results provide a useful presentation of our operating results for purposes of assessing our Group and divisional performance consistently over time, on a basis that excludes items that management does not consider representative of our underlying
performance. Provided below is a reconciliation of our adjusted results to the most directly comparable US GAAP measures.
Group in CHF mn
4Q17 3Q17 4Q16 1H17 1H16 9M17 9M16 2017 2016
Net revenues reported 5,189 4,972 5,181 10,739 9,746 15,711 15,142 20,900 20,323
Fair value on own debt - - - - - - - - -
Real estate gains - - (78) - - - (346) - (424)
(Gains)/losses on business sales 28 - 2 (15) 56 (15) 56 13 58
Net revenues adjusted 5,217 4,972 5,105 10,724 9,802 15,696 14,852 20,913 19,957
Provision for credit losses 43 32 75 135 122 167 177 210 252
Total operating expenses reported 5,005 4,540 7,309 9,352 9,909 13,892 15,028 18,897 22,337
Goodwill impairment - - - - - - - - -
Restructuring expenses (137) (112) (49) (206) (346) (318) (491) (455) (540)
Major litigation provisions (255) (108) (2,401) (130) - (238) (306) (493) (2,707)
Expenses related to business sales (8) - - - - - - (8) -
Total operating expenses adjusted 4,605 4,320 4,859 9,016 9,563 13,336 14,231 17,941 19,090
Pre-tax income/(loss) reported 141 400 (2,203) 1,252 (285) 1,652 (63) 1,793 (2,266)
Total adjustments 428 220 2,374 321 402 541 507 969 2,881
Pre-tax income/(loss) adjusted 569 620 171 1,573 117 2,193 444 2,762 615
CS Group in CHF mn
4Q17 3Q17 2Q17 1Q17 4Q16 3Q16 2Q16 1Q16 4Q15 3Q15 2Q15 1Q15 2017 2016 2015
Total operating expenses reported 5,005 4,540 4,541 4,811 7,309 5,119 4,937 4,972 10,518 5,023 5,248 5,106 18,897 22,337 25,895
Goodwill impairment - - - - - - - - (3,797) - - - - - (3,797)
Restructuring expenses (137) (112) (69) (137) (49) (145) (91) (255) (355) - - - (455) (540) (355)
Major litigation provisions (255) (108) (33) (97) (2,401) (306) - - (563) (204) (63) 10 (493) (2,707) (820)
Expenses related to business sales (8) - - - - - - - - - - - (8) - -
Debit valuation adjustments (DVA) (20) (20) (17) (26) - - - - - - - - (83) - -
Certain accounting changes (45) (48) (52) (25) - - - - - - - - (170) - -
Total operating cost base adjusted 4,540 4,252 4,370 4,526 4,859 4,668 4,846 4,717 5,803 4,819 5,185 5,116 17,688 19,090 20,923
FX adjustment 49 106 102 69 70 120 70 33 - 62 137 120 326 293 319
Total operating cost base adjusted
at constant FX 4,589 4,358 4,472 4,595 4,929 4,788 4,916 4,750 5,803 4,881 5,322 5,236 18,014 19,383 21,242
February 14, 2018 50
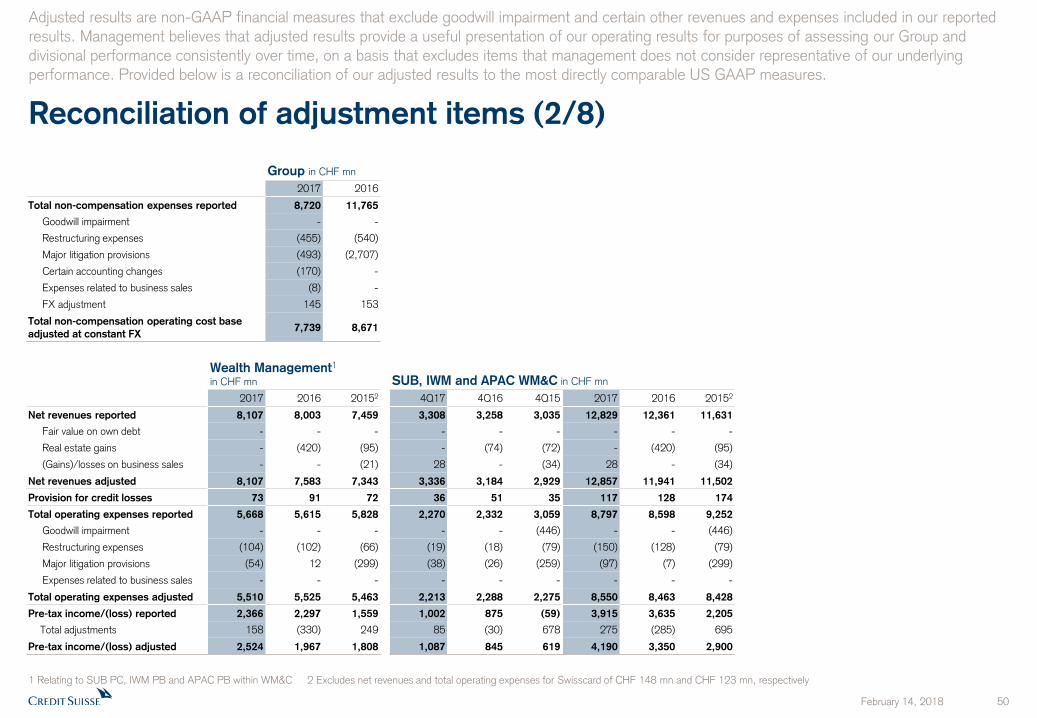
Reconciliation of adjustment items (2/8)
Adjusted results are non-GAAP financial measures that exclude goodwill impairment and certain other revenues and expenses included in our reported results. Management believes that adjusted results provide a useful presentation of our operating results for purposes of assessing our Group and divisional performance consistently over time, on a basis that excludes items that management does not consider representative of our underlying
performance. Provided below is a reconciliation of our adjusted results to the most directly comparable US GAAP measures.
1 Relating to SUB PC, IWM PB and APAC PB within WM&C 2 Excludes net revenues and total operating expenses for Swisscard of CHF 148 mn and CHF 123 mn, respectively
Wealth Management1
in CHF mn SUB, IWM and APAC WM&C in CHF mn
2017 2016 20152 4Q17 4Q16 4Q15 2017 2016 20152
Net revenues reported 8,107 8,003 7,459 3,308 3,258 3,035 12,829 12,361 11,631
Fair value on own debt - - - - - - - - -
Real estate gains - (420) (95) - (74) (72) - (420) (95)
(Gains)/losses on business sales - - (21) 28 - (34) 28 - (34)
Net revenues adjusted 8,107 7,583 7,343 3,336 3,184 2,929 12,857 11,941 11,502
Provision for credit losses 73 91 72 36 51 35 117 128 174
Total operating expenses reported 5,668 5,615 5,828 2,270 2,332 3,059 8,797 8,598 9,252
Goodwill impairment - - - - - (446) - - (446)
Restructuring expenses (104) (102) (66) (19) (18) (79) (150) (128) (79)
Major litigation provisions (54) 12 (299) (38) (26) (259) (97) (7) (299)
Expenses related to business sales - - - - - - - - -
Total operating expenses adjusted 5,510 5,525 5,463 2,213 2,288 2,275 8,550 8,463 8,428
Pre-tax income/(loss) reported 2,366 2,297 1,559 1,002 875 (59) 3,915 3,635 2,205
Total adjustments 158 (330) 249 85 (30) 678 275 (285) 695
Pre-tax income/(loss) adjusted 2,524 1,967 1,808 1,087 845 619 4,190 3,350 2,900
Group in CHF mn
2017 2016
Total non-compensation expenses reported 8,720 11,765
Goodwill impairment - -
Restructuring expenses (455) (540)
Major litigation provisions (493) (2,707)
Certain accounting changes (170) -
Expenses related to business sales (8) -
FX adjustment 145 153
Total non-compensation operating cost base
adjusted at constant FX 7,739 8,671
February 14, 2018 51
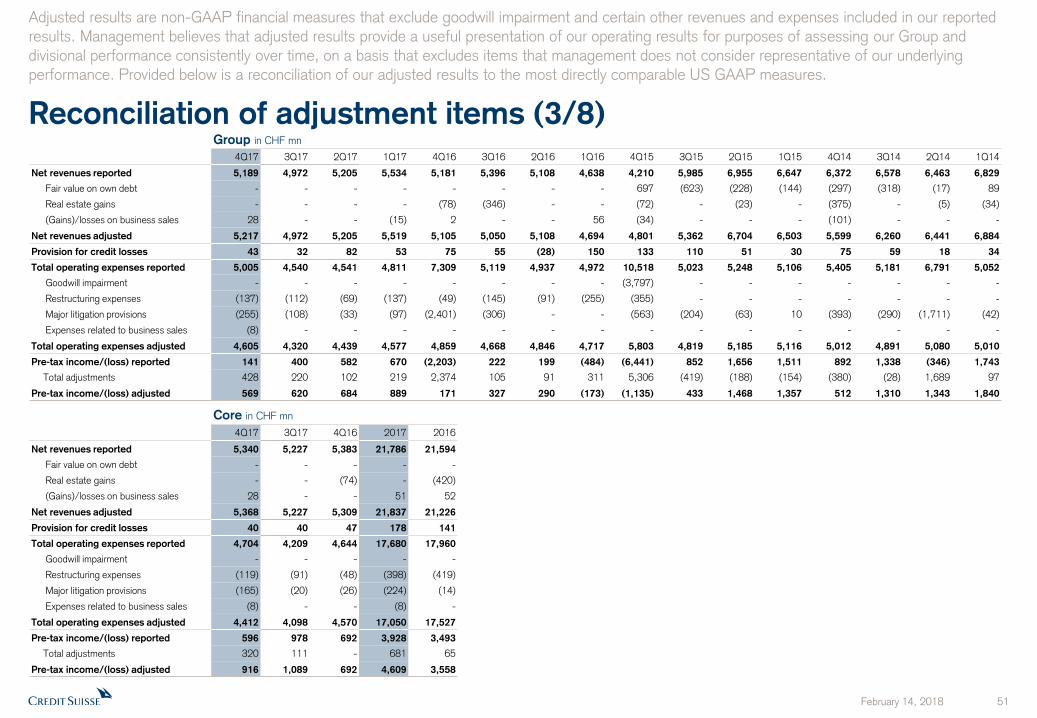
Reconciliation of adjustment items (3/8)
Adjusted results are non-GAAP financial measures that exclude goodwill impairment and certain other revenues and expenses included in our reported results. Management believes that adjusted results provide a useful presentation of our operating results for purposes of assessing our Group and divisional performance consistently over time, on a basis that excludes items that management does not consider representative of our underlying
performance. Provided below is a reconciliation of our adjusted results to the most directly comparable US GAAP measures.
Group in CHF mn
4Q17 3Q17 2Q17 1Q17 4Q16 3Q16 2Q16 1Q16 4Q15 3Q15 2Q15 1Q15 4Q14 3Q14 2Q14 1Q14
Net revenues reported 5,189 4,972 5,205 5,534 5,181 5,396 5,108 4,638 4,210 5,985 6,955 6,647 6,372 6,578 6,463 6,829
Fair value on own debt - - - - - - - - 697 (623) (228) (144) (297) (318) (17) 89
Real estate gains - - - - (78) (346) - - (72) - (23) - (375) - (5) (34)
(Gains)/losses on business sales 28 - - (15) 2 - - 56 (34) - - - (101) - - -
Net revenues adjusted 5,217 4,972 5,205 5,519 5,105 5,050 5,108 4,694 4,801 5,362 6,704 6,503 5,599 6,260 6,441 6,884
Provision for credit losses 43 32 82 53 75 55 (28) 150 133 110 51 30 75 59 18 34
Total operating expenses reported 5,005 4,540 4,541 4,811 7,309 5,119 4,937 4,972 10,518 5,023 5,248 5,106 5,405 5,181 6,791 5,052
Goodwill impairment - - - - - - - - (3,797) - - - - - - -
Restructuring expenses (137) (112) (69) (137) (49) (145) (91) (255) (355) - - - - - - -
Major litigation provisions (255) (108) (33) (97) (2,401) (306) - - (563) (204) (63) 10 (393) (290) (1,711) (42)
Expenses related to business sales (8) - - - - - - - - - - - - - - -
Total operating expenses adjusted 4,605 4,320 4,439 4,577 4,859 4,668 4,846 4,717 5,803 4,819 5,185 5,116 5,012 4,891 5,080 5,010
Pre-tax income/(loss) reported 141 400 582 670 (2,203) 222 199 (484) (6,441) 852 1,656 1,511 892 1,338 (346) 1,743
Total adjustments 428 220 102 219 2,374 105 91 311 5,306 (419) (188) (154) (380) (28) 1,689 97
Pre-tax income/(loss) adjusted 569 620 684 889 171 327 290 (173) (1,135) 433 1,468 1,357 512 1,310 1,343 1,840
Core in CHF mn
4Q17 3Q17 4Q16 2017 2016
Net revenues reported 5,340 5,227 5,383 21,786 21,594
Fair value on own debt - - - - -
Real estate gains - - (74) - (420)
(Gains)/losses on business sales 28 - - 51 52
Net revenues adjusted 5,368 5,227 5,309 21,837 21,226
Provision for credit losses 40 40 47 178 141
Total operating expenses reported 4,704 4,209 4,644 17,680 17,960
Goodwill impairment - - - - -
Restructuring expenses (119) (91) (48) (398) (419)
Major litigation provisions (165) (20) (26) (224) (14)
Expenses related to business sales (8) - - (8) -
Total operating expenses adjusted 4,412 4,098 4,570 17,050 17,527
Pre-tax income/(loss) reported 596 978 692 3,928 3,493
Total adjustments 320 111 - 681 65
Pre-tax income/(loss) adjusted 916 1,089 692 4,609 3,558

February 14, 2018 52
Reconciliation of adjustment items (4/8)
Adjusted results are non-GAAP financial measures that exclude goodwill impairment and certain other revenues and expenses included in our reported results. Management believes that adjusted results provide a useful presentation of our operating results for purposes of assessing our Group and divisional performance consistently over time, on a basis that excludes items that management does not consider representative of our underlying
performance. Provided below is a reconciliation of our adjusted results to the most directly comparable US GAAP measures.
SUB PC in CHF mn SUB C&IC in CHF mn
4Q17 3Q17 4Q16 2017 2016 20153 4Q17 3Q17 4Q16 2017 2016 2015
Net revenues reported 726 727 749 2,897 3,258 3,057 592 592 650 2,499 2,501 2,516
Real estate gains - - (20) - (366) (95) - - - - - -
(Gains)/losses on business sales - - - - - (10) - - - - - (13)
Net revenues adjusted 726 727 729 2,897 2,892 2,952 592 592 650 2,499 2,501 2,503
Provision for credit losses 10 9 10 42 39 49 5 5 24 33 40 89
Total operating expenses reported 504 512 566 2,054 2,124 2,325 366 367 417 1,502 1,531 1,460
Goodwill impairment - - - - - - - - - - - -
Restructuring expenses 1 (9) 3 (53) (51) (33) 1 (4) - (6) (9) (9)
Major litigation provisions (2) (2) - (6) - (25) (5) (7) (19) (43) (19) -
Total operating expenses adjusted 503 501 569 1,995 2,073 2,267 362 356 398 1,453 1,503 1,451
Pre-tax income/(loss) reported 212 206 173 801 1,095 683 221 220 209 964 930 967
Total adjustments 1 11 (23) 59 (315) (47) 4 11 19 49 28 (4)
Pre-tax income/(loss) adjusted 213 217 150 860 780 636 225 231 228 1,013 958 963
SUB in CHF mn
4Q17 3Q17 2Q17 1Q17 4Q16 3Q16 2Q16 1Q16 4Q15 3Q15 2Q151 1Q152 2017 2016 20153
Net revenues reported 1,318 1,319 1,405 1,354 1,399 1,667 1,337 1,356 1,495 1,364 1,387 1,327 5,396 5,759 5,573
Real estate gains - - - - (20) (346) - - (72) - (23) - - (366) (95)
(Gains)/losses on business sales - - - - - - - - (23) - - - - - (23)
Net revenues adjusted 1,318 1,319 1,405 1,354 1,379 1,321 1,337 1,356 1,400 1,364 1,364 1,327 5,396 5,393 5,455
Provision for credit losses 15 14 36 10 34 30 9 6 43 39 33 23 75 79 138
Total operating expenses reported 870 879 867 940 983 879 875 918 1,088 925 899 873 3,556 3,655 3,785
Goodwill impairment - - - - - - - - - - - - - - -
Restructuring expenses 2 (13) 4 (52) 3 (19) (4) (40) (42) - - - (59) (60) (42)
Major litigation provisions (7) (9) (6) (27) (19) - - - (25) - - - (49) (19) (25)
Total operating expenses adjusted 865 857 865 861 967 860 871 878 1,021 925 899 873 3,448 3,576 3,718
Pre-tax income/(loss) reported 433 426 502 404 382 758 453 432 364 400 455 431 1,765 2,025 1,650
Total adjustments 5 22 2 79 (4) (327) 4 40 (28) - (23) - 108 (287) (51)
Pre-tax income/(loss) adjusted 438 448 504 483 378 431 457 472 336 400 432 431 1,873 1,738 1,599
1 Excludes net revenues and total operating expenses for Swisscard of CHF 75 mn and CHF 62 mn, respectively 2 Excludes net revenues and total operating expenses for Swisscard of CHF 73 mn and CHF 61 mn, respectively 3 Excludes net revenues and total operating expenses for Swisscard of CHF 148 mn and CHF 123 mn, respectively

February 14, 2018 53
Reconciliation of adjustment items (5/8)
Adjusted results are non-GAAP financial measures that exclude goodwill impairment and certain other revenues and expenses included in our reported results. Management believes that adjusted results provide a useful presentation of our operating results for purposes of assessing our Group and divisional performance consistently over time, on a basis that excludes items that management does not consider representative of our underlying
performance. Provided below is a reconciliation of our adjusted results to the most directly comparable US GAAP measures.
IWM in CHF mn
4Q17 3Q17 2Q17 1Q17 4Q16 3Q16 2Q16 1Q16 4Q15 3Q15 2Q15 1Q15 2017 2016 2015
Net revenues reported 1,364 1,262 1,264 1,221 1,299 1,081 1,145 1,173 1,173 1,093 1,165 1,121 5,111 4,698 4,552
Real estate gains - - - - (54) - - - - - - - - (54) -
(Gains)/losses on business sales 28 - - - - - - - (11) - - - 28 - (11)
Net revenues adjusted 1,392 1,262 1,264 1,221 1,245 1,081 1,145 1,173 1,162 1,093 1,165 1,121 5,139 4,644 4,541
Provision for credit losses 14 3 8 2 6 0 16 (2) (7) 11 (1) 2 27 20 5
Total operating expenses reported 1,010 904 891 928 962 836 884 875 1,204 885 894 841 3,733 3,557 3,824
Goodwill impairment - - - - - - - - - - - - - - -
Restructuring expenses (11) (16) (7) (36) (16) (15) (15) (8) (36) - - - (70) (54) (36)
Major litigation provisions (31) (11) (6) - (7) 19 - - (228) (50) - 10 (48) 12 (268)
Total operating expenses adjusted 968 877 878 892 939 840 869 867 940 835 894 851 3,615 3,515 3,520
Pre-tax income/(loss) reported 340 355 365 291 331 245 245 300 (24) 197 272 278 1,351 1,121 723
Total adjustments 70 27 13 36 (31) (4) 15 8 253 50 - (10) 146 (12) 293
Pre-tax income/(loss) adjusted 410 382 378 327 300 241 260 308 229 247 272 268 1,497 1,109 1,016
IWM PB in CHF mn IWM AM in CHF mn
4Q17 3Q17 4Q16 2017 2016 2015 4Q17 3Q17 4Q16 2017 2016 2015
Net revenues reported 923 870 918 3,603 3,371 3,224 441 392 381 1,508 1,327 1,328
Real estate gains - - (54) - (54) - - - - - - -
(Gains)/losses on business sales - - - - - (11) 28 - - 28 - -
Net revenues adjusted 923 870 864 3,603 3,317 3,213 469 392 381 1,536 1,327 1,328
Provision for credit losses 14 3 6 27 20 5 - - - - - -
Total operating expenses reported 673 615 684 2,552 2,510 2,678 337 289 278 1,181 1,047 1,146
Goodwill impairment - - - - - - - - - - - -
Restructuring expenses (8) (9) (11) (44) (47) (32) (3) (7) (5) (26) (7) (4)
Major litigation provisions (31) (11) (7) (48) 12 (268) - - - - - -
Total operating expenses adjusted 634 595 666 2,460 2,475 2,378 334 282 273 1,155 1,040 1,142
Pre-tax income/(loss) reported 236 252 228 1,024 841 541 104 103 103 327 280 182
Total adjustments 39 20 (36) 92 (19) 289 31 7 5 54 7 4
Pre-tax income/(loss) adjusted 275 272 192 1,116 822 830 135 110 108 381 287 186

February 14, 2018 54
Reconciliation of adjustment items (6/8)
Adjusted results are non-GAAP financial measures that exclude goodwill impairment and certain other revenues and expenses included in our reported results. Management believes that adjusted results provide a useful presentation of our operating results for purposes of assessing our Group and divisional performance consistently over time, on a basis that excludes items that management does not consider representative of our underlying
performance. Provided below is a reconciliation of our adjusted results to the most directly comparable US GAAP measures.
APAC Mkts in CHF mn APAC in CHF mn
4Q17 3Q17 4Q16 2017 2016 2015 4Q17 3Q17 4Q16 2017 2016 2015
Net revenues reported 259 342 302 1,182 1,693 2,333 885 890 862 3,504 3,597 3,839
Fair value on own debt - - - - - - - - - - - -
Real estate gains - - - - - - - - - - - -
(Gains)/losses on business sales - - - - - - - - - - - -
Net revenues adjusted 259 342 302 1,182 1,693 2,333 885 890 862 3,504 3,597 3,839
Provision for credit losses - - - - (3) 4 7 5 11 15 26 35
Total operating expenses reported 312 297 361 1,252 1,460 1,784 702 667 748 2,760 2,846 3,427
Goodwill impairment - - - - - (310) - - - - - (756)
Restructuring expenses (13) (5) (14) (42) (39) (2) (23) (10) (19) (63) (53) (3)
Major litigation provisions - - - - - - - - - - - (6)
Total operating expenses adjusted 299 292 347 1,210 1,421 1,472 679 657 729 2,697 2,793 2,662
Pre-tax income/(loss) reported (53) 45 (59) (70) 236 545 176 218 103 729 725 377
Total adjustments 13 5 14 42 39 312 23 10 19 63 53 765
Pre-tax income/(loss) adjusted (40) 50 (45) (28) 275 857 199 228 122 792 778 1,142
APAC WM&C in CHF mn
4Q17 3Q17 2Q17 1Q17 4Q16 3Q16 2Q16 1Q16 4Q15 3Q15 2Q15 1Q15 2017 2016 2015
Net revenues reported 626 548 559 589 560 481 455 408 367 350 403 386 2,322 1,904 1,506
Fair value on own debt - - - - - - - - - - - - - - -
Real estate gains - - - - - - - - - - - - - - -
(Gains)/losses on business sales - - - - - - - - - - - - - - -
Net revenues adjusted 626 548 559 589 560 481 455 408 367 350 403 386 2,322 1,904 1,506
Provision for credit losses 7 5 (1) 4 11 34 3 (19) (1) 24 11 (3) 15 29 31
Total operating expenses reported 390 370 364 384 387 352 342 305 767 300 286 290 1,508 1,386 1,643
Goodwill impairment - - - - - - - - (446) - - - - - (446)
Restructuring expenses (10) (5) (2) (4) (5) (7) (1) (1) (1) - - - (21) (14) (1)
Major litigation provisions - - - - - - - - (6) - - - - - (6)
Total operating expenses adjusted 380 365 362 380 382 345 341 304 314 300 286 290 1,487 1,372 1,190
Pre-tax income/(loss) reported 229 173 196 201 162 95 110 122 (399) 26 106 99 799 489 (168)
Total adjustments 10 5 2 4 5 7 1 1 453 - - - 21 14 453
Pre-tax income/(loss) adjusted 239 178 198 205 167 102 111 123 54 26 106 99 820 503 285
February 14, 2018 55
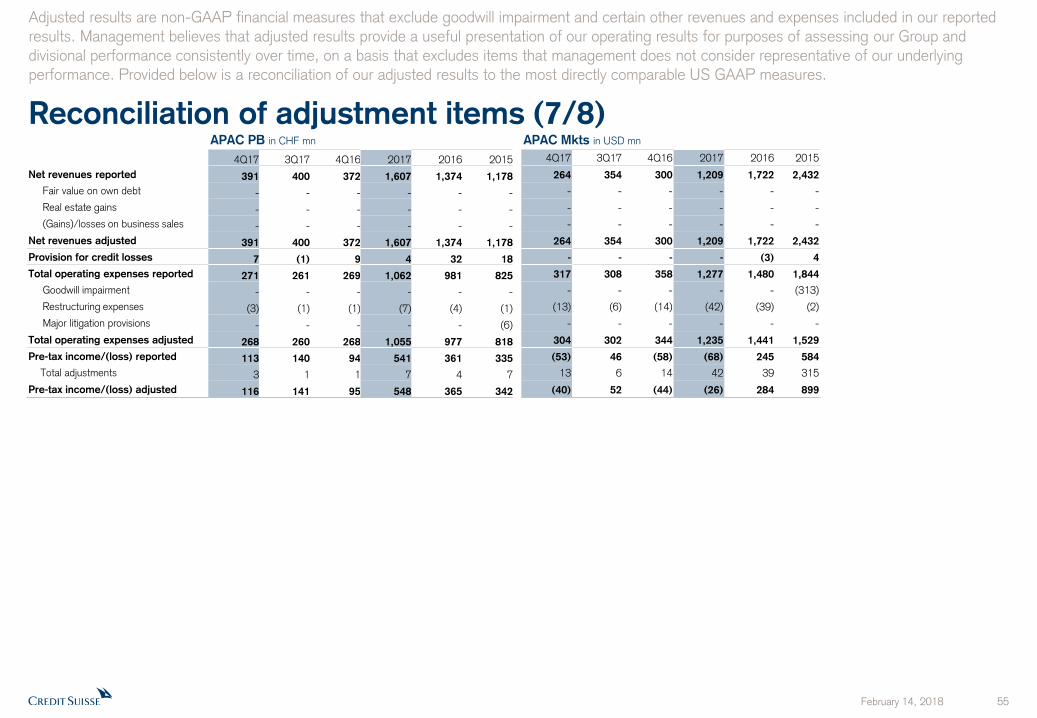
Reconciliation of adjustment items (7/8)
Adjusted results are non-GAAP financial measures that exclude goodwill impairment and certain other revenues and expenses included in our reported results. Management believes that adjusted results provide a useful presentation of our operating results for purposes of assessing our Group and divisional performance consistently over time, on a basis that excludes items that management does not consider representative of our underlying
performance. Provided below is a reconciliation of our adjusted results to the most directly comparable US GAAP measures.
APAC PB in CHF mn APAC Mkts in USD mn
4Q17 3Q17 4Q16 2017 2016 2015 4Q17 3Q17 4Q16 2017 2016 2015
Net revenues reported 391 400 372 1,607 1,374 1,178 264 354 300 1,209 1,722 2,432
Fair value on own debt - - - - - - - - - - - -
Real estate gains - - - - - - - - - - - -
(Gains)/losses on business sales - - - - - - - - - - - -
Net revenues adjusted 391 400 372 1,607 1,374 1,178 264 354 300 1,209 1,722 2,432
Provision for credit losses 7 (1) 9 4 32 18 - - - - (3) 4
Total operating expenses reported 271 261 269 1,062 981 825 317 308 358 1,277 1,480 1,844
Goodwill impairment - - - - - - - - - - - (313)
Restructuring expenses (3) (1) (1) (7) (4) (1) (13) (6) (14) (42) (39) (2)
Major litigation provisions - - - - - (6) - - - - - -
Total operating expenses adjusted 268 260 268 1,055 977 818 304 302 344 1,235 1,441 1,529
Pre-tax income/(loss) reported 113 140 94 541 361 335 (53) 46 (58) (68) 245 584
Total adjustments 3 1 1 7 4 7 13 6 14 42 39 315
Pre-tax income/(loss) adjusted 116 141 95 548 365 342 (40) 52 (44) (26) 284 899

February 14, 2018 56
Reconciliation of adjustment items (8/8)
Adjusted results are non-GAAP financial measures that exclude goodwill impairment and certain other revenues and expenses included in our reported results. Management believes that adjusted results provide a useful presentation of our operating results for purposes of assessing our Group and divisional performance consistently over time, on a basis that excludes items that management does not consider representative of our underlying
performance. Provided below is a reconciliation of our adjusted results to the most directly comparable US GAAP measures.
IBCM in USD mn GM in USD mn
4Q17 3Q17 4Q16 2017 2016 2015 4Q17 3Q17 4Q16 2017 2016 2015
Net revenues reported 573 474 569 2,182 2,001 1,857 1,179 1,308 1,256 5,662 5,575 7,124
Fair value on own debt - - - - - - - - - - - -
Real estate gains - - - - - - - - - - - -
(Gains)/losses on business sales - - - - - - - - - - - -
Net revenues adjusted 573 474 569 2,182 2,001 1,857 1,179 1,308 1,256 5,662 5,575 7,124
Provision for credit losses (1) 12 (1) 31 20 - 8 7 (3) 32 (4) 11
Total operating expenses reported 466 425 422 1,775 1,713 2,170 1,371 1,228 1,250 5,172 5,522 9,004
Goodwill impairment - - - - - (384) - - - - - (2,690)
Restructuring expenses (14) (17) 6 (43) (29) (22) (73) (28) (14) (154) (220) (97)
Major litigation provisions - - - - - - - - - - (7) (240)
Expenses related to business sales - - - - - - (8) - - (8) - -
Total operating expenses adjusted 452 408 428 1,732 1,684 1,764 1,290 1,200 1,236 5,010 5,295 5,977
Pre-tax income/(loss) reported 108 37 148 376 268 (313) (200) 73 9 458 57 (1,891)
Total adjustments 14 17 (6) 43 29 406 81 28 14 162 227 3,027
Pre-tax income/(loss) adjusted 122 54 142 419 297 93 (119) 101 23 620 284 1,136
Corp. Ctr. in CHF mn SRU in USD mn SRU in CHF mn
4Q17 3Q17 4Q16 2017 2016 2015 4Q17 3Q17 4Q16 2017 2016 2015 2017 2016
Net revenues reported 45 37 (16) 85 71 561 (153) (265) (198) (905) (1,285) 557 (886) (1,271)
Fair value on own debt - - - - - (298) - - - - - - - -
Real estate gains - - - - - - - - (4) - (4) - - (4)
(Gains)/losses on business sales - - - 23 52 - - - 1 (39) 6 - (38) 6
Net revenues adjusted 45 37 (16) 108 123 263 (153) (265) (201) (944) (1,283) 557 (924) (1,269)
Provision for credit losses (3) - - - (1) (1) 3 (9) 28 31 115 138 32 111
Total operating expenses reported 313 164 262 821 759 862 306 343 2,610 1,243 4,353 3,130 1,217 4,377
Goodwill impairment - - - - - - - - - - - - - -
Restructuring expenses (2) (9) (7) (14) (7) - (19) (21) (1) (59) (123) (158) (57) (121)
Major litigation provisions (127) - - (127) - - (91) (94) (2,322) (275) (2,646) (295) (269) (2,693)
Total operating expenses adjusted 184 155 255 680 752 862 196 228 287 909 1,584 2,677 891 1,563
Pre-tax income/(loss) reported (265) (127) (278) (736) (687) (300) (462) (599) (2,836) (2,179) (5,753) (2,711) (2,135) (5,759)
Total adjustments 129 9 7 164 59 (298) 110 115 2,320 295 2,771 453 288 2,816
Pre-tax income/(loss) adjusted (136) (118) (271) (572) (628) (598) (352) (484) (516) (1,884) (2,982) (2,258) (1,847) (2,943)

February 14, 2018 57
Notes
Throughout the presentation rounding differences may occur
Unless otherwise noted, all CET1 ratio, Tier-1 leverage ratio, risk-weighted assets and leverage exposure figures shown in this presentation are as of the end
of the respective period and on a “look-through” basis
Gross and net margins are shown in basis points Gross margin = adj. net revenues annualized / average AuM; net margin = adj. pre-tax income annualized / average AuM
Mandates penetration reflects advisory and discretionary mandates as percentage of total AuM
General notes
Adj. = Adjusted; Adv. = Advisory; AM = Asset Management; APAC = Asia Pacific; AuM = Assets under Management; avg. = average; BIS = Bank for International Settlements; bps = basis points; CET1 = Common Equity Tier 1; C&IC = Corporate & Institutional Clients; CIO = Chief Investment Officer;
Corp. Ctr. = Corporate Center; DCM = Debt Capital Markets; ECM = Equity Capital Markets; EMEA = Europe, Middle East & Africa; FINMA = Swiss Financial Market Supervisory Authority; FX = Foreign Exchange; GM = Global Markets; HoldCo = Holding Company; IBCM = Investment Banking & Capital Markets;
IPO = Initial Public Offering; ITS = International Trading Solutions; IWM = International Wealth Management; M&A = Mergers & Acquisitions;
mgmt. = management; Mkts = Markets; NNA = Net new assets; Op Risk = Operational Risk; PB = Private Banking; PC = Private Clients; perf. = performance; PTI = Pre-tax income; QoQ = Quarter-on-quarter; RM = Relationship Manager(s); RMBS = Residential Mortgage Backed Securities; RoRC = Return on Regulatory Capital; RWA = Risk-weighted assets; SMG = Systematic Market-Making Group; SoW = Share of wallet; SRU = Strategic
Resolution Unit; SUB = Swiss Universal Bank; TLAC = Total Loss-Absorbing Capacity; UHNW(I) = Ultra High Net Worth Individuals; VaR = Value-at-Risk; WM&C = Wealth Management & Connected; YoY = Year on year; YTD = Year to Date
Abbreviations
Specific notes * Our cost savings program is measured using an adjusted operating cost base at constant FX rates. “Adjusted operating cost base at constant FX rates” and “adjusted non-compensation operating cost base at constant FX rates” include adjustments as made in all our disclosures for restructuring expenses, major litigation provisions, expenses related to business sales and a goodwill impairment taken in 4Q15 as well as adjustments for certain accounting changes (which had not been in place at the
launch of the cost savings program), debit valuation adjustments (DVA) related volatility and for FX, applying the following main currency exchange rates for
1Q15: USD/CHF 0.9465, EUR/CHF 1.0482, GBP/CHF 1.4296, 2Q15: USD/CHF 0.9383, EUR/CHF 1.0418, GBP/CHF 1.4497,
3Q15: USD/CHF 0.9684, EUR/CHF 1.0787, GBP/CHF 1.4891, 4Q15: USD/CHF 1.0010, EUR/CHF 1.0851, GBP/CHF 1.5123, 1Q16: USD/CHF 0.9928, EUR/CHF 1.0941, GBP/CHF 1.4060, 2Q16: USD/CHF 0.9756, EUR/CHF 1.0956, GBP/CHF 1.3845, 3Q16: USD/CHF 0.9728, EUR/CHF 1.0882, GBP/CHF 1.2764, 4Q16: USD/CHF 1.0101, EUR/CHF 1.0798, GBP/CHF 1.2451,
1Q17: USD/CHF 0.9963, EUR/CHF 1.0670, GBP/CHF 1.2464, 2Q17: USD/CHF 0.9736, EUR/CHF 1.0881, GBP/CHF 1.2603, 3Q17: USD/CHF 0.9645, EUR/CHF 1.1413, GBP/CHF 1.2695, 4Q17: USD/CHF 0.9853, EUR/CHF 1.1667, GBP/CHF 1.3230.
These currency exchange rates are unweighted, i.e. a straight line average of monthly rates. We apply this calculation consistently for the periods under review. Adjusted non-compensation operating cost base is the adjusted operating cost base excluding compensation and benefits. To calculate the adjusted non-compensation cost base at constant FX rates, we subtract compensation and benefits (adjusted at constant FX rates in the manner described above) from the adjusted operating cost base at
constant FX rates.
† Regulatory capital is calculated as the worst of 10% of RWA and 3.5% of leverage exposure. Return on regulatory capital is calculated using (adjusted) income / (loss) after tax and assumes a tax rate of 30% and capital allocated based on the worst of 10% of average RWA and 3.5% of average leverage exposure. For the Markets business within the APAC division and for the Global Markets and Investment Banking & Capital Markets divisions, return on regulatory capital is based on US dollar denominated numbers. Adjusted return on regulatory capital is calculated using adjusted results, applying the same methodology to calculate return on regulatory capital.

February 14, 2018 58