2018 fleet barometer · the share of companies that have integrated telematics tools into their...
TRANSCRIPT

2018 FLEET BAROMETER Europe
2018 / Survey n°1700814

Table of content
2
I FLEET PROFILE
II FINANCING
III TELEMATICS
IV PERSPECTIVES IN TERMS OF CORPORATE MOBILITY
p.15
p.48
p.70
p.77

PERIMETER OF THE STUDY – FOCUS EUROPE
3

METHODOLOGY
DATA COLLECTION
METHOD FIELDWORK PERIOD TARGET QUOTAS SAMPLE
DURATION OF
INTERVIEW
CATI System
(Computer Assisted
Telephone Interviewing)
Fleet managers in
companies of all industries
using at least
1 corporate vehicle
Company size
& sector
3 313 interviews
through Europe
10 minutes
on average
JAN
15
FEB
6
4

Companies with 10 to 99 employees
677 interviews
Companies with 100 to 249 / 499 / 999 employees
883 interviews
Companies with 250 / 500 / 1 000 employees and more
660 interviews
1 to 99
employees
1 770 interviews
100 employees
and more
1 543 interviews
Perimeter of the survey: companies owning at least 1 vehicle
Companies with less than 10 employees
1 093 interviews
5
SAMPLE FOR EUROPE

6
NUMBER OF INTERVIEWS CONDUCTED IN EUROPE
Company size
& sector Total
Construction 211 (19%) 113 (17%) 90 (10%) 42 (6%) 456 (14%)
Industry 196 (18%) 218 (33%) 361 (41%) 244 (37%) 1 018 (31%)
Services 418 (38%) 194 (29%) 268 (31%) 269 (41%) 1 148 (35%)
Trade 274 (25%) 142 (21%) 157 (18%) 104 (16%) 677 (21%)
TOTAL 1 093 (100%) 677 (100%) 883 (100%) 660 (100%) 3 313 (100%)
Weight of each
company size
segment
33% 20% 27% 20% 100%
This sample structure was set up in order to be roughly representative of the number of cars registered by companies for
each company size segment and activity sector as well as to allow comparisons between countries on a similar bases.
In the following slides, no additional weighting of the data are applied to company sizes or activity sectors segments.

SAMPLE
Less than 10 employees
10 to 99 employees
100 to 249 employees
100 to 499 employees
100 to 999 employees
250 employees and more
500 employees and more
1000 employees and more
FR IT UK NL ES BE CZ DE PL PT CH
7

PICTOGRAMS
* Fleet size: the size of the fleet has been defined according to the total number of vehicles given in question A5.
10 – 99 employees
100 to 249 / 499 / 999 employees
250 / 500 / 1000 employees
and more
Less than 10 employees
10 – 49 vehicles
50 vehicles and more
1 – 9 vehicles
Company size Fleet size*
8

MAIN RESULTS

MAIN RESULTS
10
#1 Companies are embracing the shift to new powertrain technologies. The adoption of alternative energies will
accelerate among large and very large companies but also small and medium-sized companies which are now
considering this as well.
#2
#3
#4
The aforementioned evolution will impact the companies’ uses and attitudes in terms of mobility services. The
introduction of Car Sharing and Ride Sharing as a service has entered into the daily business life.
A redefinition of the mobility needs in which the fleet vehicle will remain a central tool. At a glance, the business
sees the future of fleet as bright and the companies confidence is strong an growth of their fleets size.
Operational leasing remains the preferred solution to support the development of fleets of large and very
large companies but is also increasingly considered by the SME segment.

MAIN RESULTS
11
#1 ALTERNATIVES ENERGIES
In the current transition period with the incoming of WLTP, key themes and points of interest of this year are
growth expectations for alternative vehicles and alternative mobility services in the broader sense.
If yesterday almost all fleet vehicles were running on diesel, this 2018 survey shows that the landscape is
changing: 30% of very large companies have already switched to electric vehicles and 27% to hybrids. Large
and very large companies also say that they want to accelerate the movement in the coming years ... small and
medium-sized companies will not be left out since they plan to follow the movement, as evidenced by the
following figures:
- respectively 68% and 48% of very large and large companies have already or plan to integrate in their live
fleets alternative energies (HEV, PHEV, BEV, CNG, LPG or Hydrogen)
- this value remains high even among small businesses since this concerns 32% of them.
The leading countries to implement such changes are Belgium, UK, the Netherlands and Switzerland.
More and more car policies are opened to alternative energies now that the TCO of those is closing in on
combustion engine based models. This is facilitated by local government’s fiscal policies, but also because
lessors are more confident than before about residual values of particularly the batteries powering full electric
vehicles, as well as their remaining capacity after a first full cycle of experience. The key remaining points of
attention of battery powered alternatives are the charging infrastructure and having enough comfort about their
true range in varying circumstances.

MAIN RESULTS
12
… Lessors are helping their clients to make the right strategic and tactical choices for future powertrain choices
during this challenging transitional period, during which OEMs need to adapt their models to ever more
challenging European norms around CO2 and NOx emissions. Corporates are also more and more conscious
of their direct impact on the environment in the broader sense and thus CSR objectives are progressively more
integrated into corporate fleet strategies.
The new WLTP test is already largely taken into account by large and very large companies in the definition of
their car policies (respectively 46% and 62% of them). Small and medium-sized companies intend also to take
into account these new values issued from this new protocol in their results over the next 3 years. It is obvious
that the CO2 emission rate is taken into account to define part of the rules of the company car policies, but the
corporates also tell us to be sensitive to NOx and fine particles even if they don’t have the possibility to fix the
numerical caps as it is the case for CO2.
Having enough benchmarking insights readily available on alternative strategies, but also on fuel spend and
more broadly on the TCO of existing and new vehicle models, is the expertise that corporate fleet managers
and decision makers welcome and appreciate nowadays to come from their lessors.

MAIN RESULTS
13
#2 MOBILITY SERVICES
The interest of fleet managers for mobility services to be implemented in their company is on the increase.
Car Sharing and Ride sharing as a service are one of the major topics of interest for fleet managers. As for the
implementation of alternative energy vehicles, 44% of the fleet managers are considering or have already
implemented one of these two services in their companies. Mobility budget management is also a service in a
few countries that fleet managers are considering more and more.
This concerns about half to one-third of very large and large businesses. The most advanced countries in this
field are Belgium, Switzerland, the Netherlands, France and United Kingdom.
The share of companies that have integrated telematics tools into their fleets is also a proof of the evolution of
the way of apprehending the needs in terms of mobility. A large proportion of large and very large companies
(almost a third) have already equipped all or part of their fleets with telematics tools. This rate reaches almost
half of the large and very large companies in countries like the Netherlands, Poland or UK. Today, these tools
are mainly used for real-time vehicle location, but also to optimize the fleet TCO or to improve drivers’
behaviour and resulting safety.

MAIN RESULTS
14
#3
#4
FLEET GROWTH
Every year, we measure and find that business confidence is increasing with respect to the growth of their fleet.
Our indicator increased by 1 point on the two previous years and by 2 points on the last measure. The largest
companies are the ones that express the highest level of confidence in the future.
Today we reach high levels of confidence:
- For the very large companies, 27% anticipate an increase of their fleets size versus only 9% who anticipate
a contraction
- For the smallest companies, the share of companies anticipating a rise is also greater: 13% versus only 4%
who anticipate a decline
More specifically, the countries where large and very large companies are the most confident
are Belgium, Spain, France and Italy. For small and medium-sized corporates, the most confidents
in the future are in the UK.
FINANCING SOLUTIONS
Operational leasing is the solution most often preferred by large and very large companies: 38%
of large companies and 51% of very large companies have declared that Full Service Leasing is
the main source of funding for their vehicle fleets. These values are stable over time. On the
other hand, in the case of smaller companies, we see a change: over the past 3 years; the part
of companies using Operational Leasing as a financing fleet vehicles mode has increased from
9% to 12% for small businesses and from 17% to 21% for medium-sized corporates.

I - FLEET PROFILE

A. FLEET CHARACTERISTICS
I - FLEET PROFILE

NUMBER OF VEHICLES IN FLEET
10 to 99 vehicles
100 to 499 vehicles
500 vehicles and more
Total
Can you please tell me the total number of vehicles of less than 3.5 tons in your fleet?
3% 14% 9%
11%
30% 31%
1%
30%
59%
45% 57%
99%
70%
30%
12%
1 to 9 vehicles
17

NUMBER OF VEHICLES IN FLEET
EU FR IT UK NL ES BE CZ DE PL PT CH
1 to 9 vehicles 88% 86% 95% 88% 85% 86% 84% 84% 88% 91% 88% 92%
10 to 99 vehicles 12% 14% 5% 11% 15% 14% 16% 16% 12% 9% 12% 8%
100 to 499 vehicles < 1% - - 1% - 1% - - - - - -
1 to 9 vehicles 22% 18% 34% 17% 22% 11% 6% 31% 16% 26% 28% 32%
10 to 99 vehicles 53% 43% 45% 49% 54% 51% 45% 59% 59% 64% 55% 57%
100 to 499 vehicles 19% 25% 17% 24% 19% 27% 39% 7% 20% 8% 13% 9%
500 vehicles and more 6% 13% 4% 10% 4% 10% 11% 2% 4% 3% 4% 1%
18
+
+

FLEET GROWTH POTENTIAL by company size
Balance 2017 Balance 2014
Balance = Fleet growth will increase – Fleet growth will decrease
Balance 2015 Balance 2018
+13 +11 +10 +9
+8 +8 +4 +6
+12 +9 +9 +6
+16 +14 +10 +10
+17 +15 +20 +15
19%
13%
17%
21%
27%
6%
4%
4%
6%
9%
Increase Decrease
Total
In the next three years, do you think that the total number of vehicles in your company fleet will?
19
% which think that the total number of vehicles of their company fleet will increase or decrease

10%
13%
8%
9%
6%
7%
2%
5%
2%
4%
4%
6%
FLEET GROWTH POTENTIAL by company size
Balance = Fleet growth will increase – Fleet growth will decrease
Balance 2018
+10
+27
+21
+10
+9
+9
14%
34%
25%
16%
14%
14%
4%
8%
4%
6%
5%
5%
Increase Decrease
Total
In the next three years, do you think that the total number of vehicles in your company fleet will?
20
% which think that the total number of vehicles of their company fleet will increase or decrease
EU
UK
PL
BE
FR
CH
Balance 2018 Increase Decrease
PT
IT
CZ
ES
DE
NL
+
+8
+8
+6
+5
+2
+2

FLEET GROWTH POTENTIAL by company size
Balance = Fleet growth will increase – Fleet growth will decrease
Total
In the next three years, do you think that the total number of vehicles in your company fleet will?
21
% which think that the total number of vehicles of their company fleet will increase or decrease
+
17%
21%
21%
24%
13%
15%
1%
7%
9%
12%
6%
11%
Balance 2018
+16
+36
+24
+20
+19
+16
24%
39%
30%
30%
25%
24%
7%
4%
6%
10%
5%
7%
Increase Decrease
EU
BE
ES
FR
IT
PL
Balance 2018 Increase Decrease
CZ
NL
PT
UK
DE
CH
+16
+14
+12
+12
+6
+4

FLEET GROWTH POTENTIAL by fleet size
Balance 2017 Balance 2014
Balance = Fleet growth will increase – Fleet growth will decrease
Balance 2015 Balance 2018
+13 +11 +10 +9
+8 +7 +5 +6
+12 +13 +15 +9
+27 +19 +20 +16
19%
13%
19%
35%
6%
5%
7%
9%
Increase Decrease
Total
In the next three years, do you think that the total number of vehicles in your company fleet will?
22
% which think that the total number of vehicles of their company fleet will increase or decrease

7%
11%
12%
7%
8%
4%
1%
5%
6%
3%
5%
4%
13%
32%
22%
13%
11%
13%
5%
9%
5%
4%
2%
6%
FLEET GROWTH POTENTIAL by fleet size
Balance = Fleet growth will increase – Fleet growth will decrease
In the next three years, do you think that the total number of vehicles in your company fleet will?
23
% which think that the total number of vehicles of their company fleet will increase or decrease
Total
Balance 2018
+8
+24
+17
+9
+8
+7
Increase Decrease
EU
UK
PL
IT
PT
BE
Balance 2018 Increase Decrease
CZ
CH
FR
ES
NL
DE
+6
+6
+6
+5
+3
0

FLEET GROWTH POTENTIAL by fleet size
Balance = Fleet growth will increase – Fleet growth will decrease
In the next three years, do you think that the total number of vehicles in your company fleet will?
24
% which think that the total number of vehicles of their company fleet will increase or decrease
17%
19%
19%
15%
17%
7%
4%
7%
8%
10%
14%
5%
19%
29%
28%
23%
22%
17%
7%
3%
7%
3%
7%
3%
Total
Balance 2018
+12
+26
+21
+20
+15
+14
Increase Decrease
EU
FR
BE
PL
IT
NL
Balance 2018 Increase Decrease
CZ
ES
UK
PT
CH
DE
+12
+12
+10
+5
+2
+1

FLEET GROWTH POTENTIAL by fleet size
Balance = Fleet growth will increase – Fleet growth will decrease
In the next three years, do you think that the total number of vehicles in your company fleet will?
25
% which think that the total number of vehicles of their company fleet will increase or decrease
36%
36%
35%
32%
25%
24%
10%
13%
15%
13%
7%
13%
35%
45%
44%
31%
36%
36%
9%
1%
7%
6%
10%
Total
Balance 2018
+27
+44
+37
+31
+30
+26
Increase Decrease
EU
BE
ES
CZ
IT
PT
Balance 2018 Increase Decrease
PL
FR
UK
CH
DE
NL
+26
+23
+20
+19
+18
+11

Total
Average in years
HOW LONG THE COMPANY KEEPS ITS VEHICLE by company size
26
5,7 6,2 6,3 5,4 5,0
On average, how long do you keep your vehicles before being sold (new precision added for the 2018 questionnaire) or giving back to the leasing company?

HOW LONG THE COMPANY KEEPS ITS VEHICLE by company size
EU CH IT PL PT NL CZ ES BE DE FR UK
5,7 7,5 6,6 6,5 6,5 5,7 5,7 5,3 5,2 5,1 4,9 3,9
6,3 7,6 7,7 6,7 6,8 6,1 5,7 6,2 5,6 5,9 6,1 4,0
5,2 7,4 5,3 6,4 6,1 5,3 5,7 4,4 4,7 4,1 3,7 3,9
27
+
+
Total
Average in years
On average, how long do you keep your vehicles before being sold (new precision added for the 2018 questionnaire) or giving back to the leasing company?

Total
Average in years
HOW LONG THE COMPANY KEEPS ITS VEHICLE by fleet size
28
5,7 6,2 5,4 4,8
On average, how long do you keep your vehicles before being sold (new precision added for the 2018 questionnaire) or giving back to the leasing company?

HOW LONG THE COMPANY KEEPS ITS VEHICLE by fleet size
EU CH IT PL PT NL CZ ES BE DE FR UK
5,7 7,5 6,6 6,5 6,5 5,7 5,7 5,3 5,2 5,1 4,9 3,9
6,2 7,8 7,5 6,8 6,6 5,9 5,6 6,3 5,5 5,9 5,8 3,9
5,4 6,9 5,6 6,4 7,0 4,8 6,3 4,8 5,0 4,3 4,1 3,6
4,8 7,4 4,3 5,5 5,0 6,4 4,7 3,9 4,8 3,8 3,8 4,2
29
Total
Average in years
On average, how long do you keep your vehicles before being sold (new precision added for the 2018 questionnaire) or giving back to the leasing company?

B. ENERGY MIX
I - FLEET PROFILE

DEVELOPMENT POTENTIAL OF NEW ENERGIES OR TECHNOLOGIES - by company size
At least one technology
Hybrid
Plug-in Hybrid
CNG (Compressed Natural Gas)
LPG (Liquefied Petroleum Gas)
Electric Vehicle
Fuel Cell Electric / Hydrogen
Already implemented
+ considered
Total
44%
29%
23%
8%
8%
26%
7%
31
Considered in the next 3 years
Already implemented
Amongst the following technologies, which one do you consider to use?
Proportion of companies having already or considering to implement in the next 3 years new energies or technologies in their fleet
(in at least one of their fleet vehicles)
32%
20%
16%
5%
8%
16%
6%
37%
23%
17%
6%
7%
18%
5%
46%
31%
24%
8%
8%
27%
7%
68%
47%
40%
15%
11%
52%
11%

DEVELOPMENT POTENTIAL OF NEW ENERGIES OR TECHNOLOGIES - by fleet size
Already implemented
+ considered
Total
32
Considered in the next 3 years
Already implemented
Amongst the following technologies, which one do you consider to use?
Proportion of companies having already or considering to implement in the next 3 years new energies or technologies in their fleet
At least one technology
Hybrid
Plug-in Hybrid
CNG (Compressed Natural Gas)
LPG (Liquefied Petroleum Gas)
Electric Vehicle
Fuel Cell Electric / Hydrogen
44%
29%
23%
8%
8%
26%
7%
33%
20%
16%
5%
8%
17%
5%
47%
30%
25%
8%
8%
26%
7%
73%
53%
45%
17%
11%
56%
13%

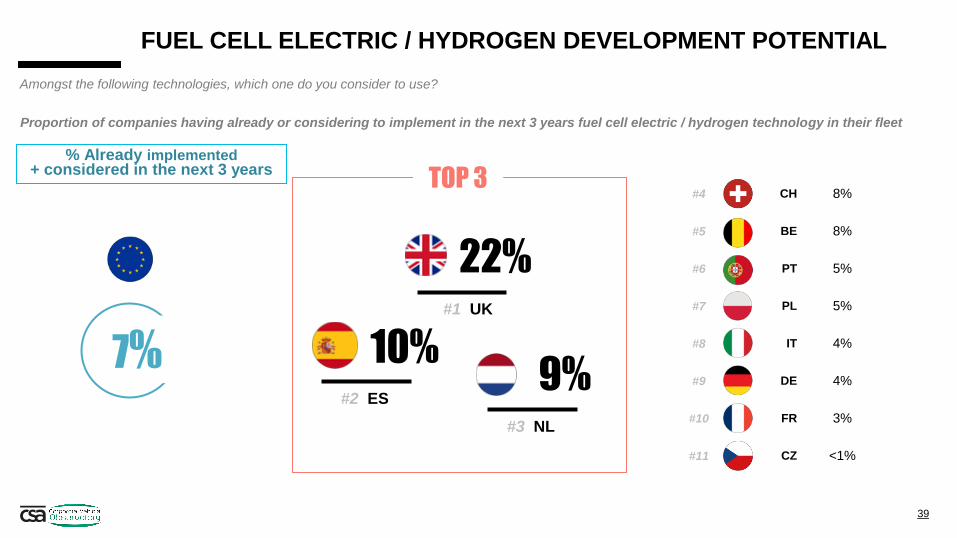
#4 CH 51%
#5 IT 45%
#6 FR 41%
#7 ES 39%
#8 DE 38%
#9 PL 36%
#10 PT 36%
#11 CZ 10%
DEVELOPMENT POTENTIAL OF NEW ENERGIES OR TECHNOLOGIES: At least one technology
% Already implemented + considered in the next 3 years
64%
61% 58%
#1 BE
#2 UK
#3 NL
44%
TOP 3
33
Amongst the following technologies, which one do you consider to use?
Proportion of companies having already or considering to implement in the next 3 years new energies or technologies in their fleet (hybrid,
plug-in hybrid, CNG, LPG, electric vehicle or fuel cell electric / hydrogen)

#4 CH 36%
#5 FR 30%
#6 ES 30%
#7 IT 22%
#8 PT 22%
#9 PL 19%
#10 DE 16%
#11 CZ 3%
HYBRYD DEVELOPMENT POTENTIAL
% Already implemented + considered in the next 3 years
53%
51% 37%
#1 UK
#2 BE
#3 NL
29%
TOP 3
34
Proportion of companies having already or considering to implement in the next 3 years hybrid technology in their fleet
Amongst the following technologies, which one do you consider to use?

#4 CH 34%
#5 DE 28%
#6 FR 26%
#7 ES 25%
#8 PT 23%
#9 IT 15%
#10 PL 11%
#11 CZ 3%
ELECTRIC VEHICLE DEVELOPMENT POTENTIAL
% Already implemented + considered in the next 3 years
45%
42% 37%
#1 NL
#2 UK
#3 BE
26%
TOP 3
35
Proportion of companies having already or considering to implement in the next 3 years electric vehicle technology in their fleet
Amongst the following technologies, which one do you consider to use?

#4 CH 25%
#5 FR 22%
#6 PT 20%
#7 ES 16%
#8 DE 15%
#9 IT 14%
#10 PL 14%
#11 CZ 1%
PLUG-IN HYBRID DEVELOPMENT POTENTIAL
% Already implemented + considered in the next 3 years
46%
43% 40%
#1 UK
#2 BE
#3 NL
23%
TOP 3
36
Proportion of companies having already or considering to implement in the next 3 years plug-in hybrid technology in their fleet
Amongst the following technologies, which one do you consider to use?

#4 ES 10%
#5 NL 8%
#6 CH 7%
#7 DE 7%
#8 CZ 3%
#9 PT 3%
#10 PL 3%
#11 FR 2%
CNG / COMPRESSED NATURAL GAS DEVELOPMENT POTENTIAL
% Already implemented + considered in the next 3 years
19%
18% 11%
#1 BE
#2 IT
#3 UK
8%
TOP 3
37
Proportion of companies having already or considering to implement in the next 3 years CNG (compressed natural gas) technology in their fleet
Amongst the following technologies, which one do you consider to use?

#4 ES 11%
#5 BE 8%
#6 DE 7%
#7 NL 6%
#8 CH 6%
#9 PT 4%
#10 CZ 3%
#11 FR 1%
LPG / LIQUEFIED PETROLEUM GAS DEVELOPMENT POTENTIAL
% Already implemented + considered in the next 3 years
17%
16% 14%
#1 PL
#2 IT
#3 UK
8%
TOP 3
38
Proportion of companies having already or considering to implement in the next 3 years LPG (liquefied petroleum gas) technology in their fleet
Amongst the following technologies, which one do you consider to use?
#4 CH 8%
#5 BE 8%
#6 PT 5%
#7 PL 5%
#8 IT 4%
#9 DE 4%
#10 FR 3%
#11 CZ <1%
FUEL CELL ELECTRIC / HYDROGEN DEVELOPMENT POTENTIAL
% Already implemented + considered in the next 3 years
22%
10% 9%
#1 UK
#2 ES
#3 NL
7%
TOP 3
39
Proportion of companies having already or considering to implement in the next 3 years fuel cell electric / hydrogen technology in their fleet
Amongst the following technologies, which one do you consider to use?

IMPACT OF THE WLTP TEST by company size
% Yes, already
Already or
expected
Total
Today, fuel consumption and CO2 emissions are determined with a new, more realistic test cycle: the WLTP-test. Has, or will the new higher and more
realistic fuel consumption levels and related CO2 emissions impact on your fleet policy?
40
18% 11% 11% 20% 31%
44% 36% 36% 46% 62%
Proportion of companies having already or expecting to be impacted in the next 3 years by the new WLTP test

IMPACT OF THE WLTP TEST by fleet size
% Yes, already
Already or
expected
Total
Today, fuel consumption and CO2 emissions are determined with a new, more realistic test cycle: the WLTP-test. Has, or will the new higher and more
realistic fuel consumption levels and related CO2 emissions impact on your fleet policy?
41
18% 11% 19% 35%
44% 35% 47% 67%
Proportion of companies having already or expecting to be impacted in the next 3 years by the new WLTP test

#4 PL 51%
#5 ES 47%
#6 FR 47%
#7 NL 46%
#8 CH 44%
#9 IT 37%
#10 CZ 16%
#11 DE 16%
IMPACT OF THE WLTP TEST
% Already implemented + expected to be impacted in the
next 3 years
69%
57% 53%
#1 BE
#2 PT
#3 UK
44%
TOP 3
42
Today, fuel consumption and CO2 emissions are determined with a new, more realistic test cycle: the WLTP-test. Has, or will the new higher and more
realistic fuel consumption levels and related CO2 emissions impact on your fleet policy?
Proportion of companies having already or expecting to be impacted in the next 3 years by the new WLTP test

IMPACT OF THE WLTP TEST
% Already implemented + considered in the next 3 years
36%
TOP 3
43
+
Today, fuel consumption and CO2 emissions are determined with a new, more realistic test cycle: the WLTP-test. Has, or will the new higher and more
realistic fuel consumption levels and related CO2 emissions impact on your fleet policy?
Proportion of companies having already or expecting to be impacted in the next 3 years by the new WLTP test
#4 PL 42%
#5 CH 39%
#6 ES 37%
#7 NL 37%
#8 FR 35%
#9 IT 29%
#10 CZ 13%
#11 DE 12%
60%
48% 45%
#1 BE
#2 PT
#3 UK

IMPACT OF THE WLTP TEST
% Already implemented + considered in the next 3 years
53%
TOP 3
44
Today, fuel consumption and CO2 emissions are determined with a new, more realistic test cycle: the WLTP-test. Has, or will the new higher and more
realistic fuel consumption levels and related CO2 emissions impact on your fleet policy?
Proportion of companies having already or expecting to be impacted in the next 3 years by the new WLTP test +
#4 FR 62%
#5 PL 61%
#6 ES 59%
#7 NL 57%
#8 CH 50%
#9 IT 45%
#10 DE 21%
#11 CZ 20%
80%
69% 63%
#1 BE
#2 PT
#3 UK

Total
EMISSIONS TAKEN INTO ACCOUNT IN THE CAR POLICY
45
NOx (nitrogen oxyde)
Fine particles
CO2 (Carbon dioxyde)
Other polluting emissions
None of these
Which of the following emissions do you take into account in your company car policy?
18%
26%
59%
6%
30%
Proportion of companies taking into account the following pollutant emission in their fleet policy
14%
25%
49%
6%
39%
16%
25%
49%
8%
38%
20%
29%
66%
6%
23%
26%
27%
75%
5%
16%

EMISSIONS TAKEN INTO ACCOUNT IN THE CAR POLICY
46
Total
Which of the following emissions do you take into account in your company car policy?
Proportion of companies taking into account the following pollutant emission in their fleet policy
NOx (nitrogen oxyde)
Fine particles
CO2 (Carbon dioxyde)
Other polluting emissions
None of these
18%
26%
59%
6%
30%
15%
25%
51%
7%
37%
20%
27%
60%
8%
27%
25%
28%
81%
4%
13%

#4 UK 67%
#5 FR 64%
#6 NL 61%
#7 PL 58%
#8 IT 48%
#9 CH 46%
#10 CZ 37%
#11 DE 28%
82%
80% 70%
#1 BE
#2 PT
#3 ES
59%
TOP 3
47
Which of the following emissions do you take into account in your company car policy?
PROPORTION OF COMPANIES TAKING CO2 EMISSIONS INTO ACCOUNT IN THEIR CAR POLICY

II - FINANCING

MAIN FINANCING METHOD by company size
39%
47%
43%
35%
29%
7%
13%
7%
3%
1%
26%
28%
30%
25%
19%
28%
12%
21%
38%
51%
Operating leasing Finance leasing Car credit Self purchase*
Total
What is the main financing method used to finance your company vehicles today?
49
Proportion of companies using the following solutions as their main financing method for their fleet vehicles
*Self-purchase = outright purchase + credit (other than car credit) Data have been consolidated: 3 years average

MAIN FINANCING METHOD by fleet size
39%
46%
36%
23%
7%
10%
3%
1%
26%
28%
26%
19%
28%
16%
35%
57%
Operating leasing Finance leasing Car credit Self purchase*
Total
What is the main financing method used to finance your company vehicles today?
50
Proportion of companies using the following solutions as their main financing method for their fleet vehicles
*Self-purchase = outright purchase + credit (other than car credit) Data have been consolidated: 3 years average

MAIN FINANCING METHOD: Self purchase
61%
53% 50%
#1 CH
#2 CZ
#3 NL
39%
TOP 3
51
What is the main financing method used to finance your company vehicles today?
Proportion of companies using self purchase as their main financing method for their fleet vehicles
*Self-purchase = outright purchase + credit (other than car credit) Data have been consolidated: 3 years average
#4 PL 46%
#5 UK 45%
#6 DE 35%
#7 PT 35%
#8 ES 33%
#9 BE 33%
#10 IT 28%
#11 FR 24%

EVOLUTION OF THE MAIN FINANCING METHOD by company size – focus on 1 to 9
52
What is the main financing method used to finance your company vehicles today?
Operating leasing Finance leasing Car credit Self purchase*
9% 9% 10% 11% 12%
30% 31% 30% 29% 28%
13% 13% 14% 14% 13%
48% 47% 46% 46% 47%
2014 2015 2016 2017 2018
Proportion of companies using the following solutions as their main financing method for their fleet vehicles
*Self-purchase = outright purchase + credit (other than car credit) Data have been consolidated: 3 years average Results provided for 2016 are calculated by the mean of an extrapolation between the results of the years 2015 and 2017.

EVOLUTION OF THE MAIN FINANCING METHOD by company size – focus on 10 to 99
53
What is the main financing method used to finance your company vehicles today?
17% 17% 18% 20% 21%
31% 31% 30% 29% 30%
8% 8% 8% 8% 7%
44% 44% 43% 43% 43%
2014 2015 2016 2017 2018
Operating leasing Finance leasing Car credit Self purchase*
Proportion of companies using the following solutions as their main financing method for their fleet vehicles
*Self-purchase = outright purchase + credit (other than car credit) Data have been consolidated: 3 years average Results provided for 2016 are calculated by the mean of an extrapolation between the results of the years 2015 and 2017.

EVOLUTION OF THE MAIN FINANCING METHOD by company size – focus on 100 to 249/499/999
54
What is the main financing method used to finance your company vehicles today?
36% 34%
36% 38% 38%
28% 28% 27% 25% 25%
3% 3% 3% 3% 3%
34% 34% 34% 34% 35%
2014 2015 2016 2017 2018
Operating leasing Finance leasing Car credit Self purchase*
Proportion of companies using the following solutions as their main financing method for their fleet vehicles
*Self-purchase = outright purchase + credit (other than car credit) Data have been consolidated: 3 years average Results provided for 2016 are calculated by the mean of an extrapolation between the results of the years 2015 and 2017.

EVOLUTION OF THE MAIN FINANCING METHOD by company size – focus on 250/500/1000 and more
55
What is the main financing method used to finance your company vehicles today?
49% 49% 50% 52% 51%
23% 24% 22% 19% 19%
2% 1% 1% 1% 1%
27% 25%
27% 28% 29%
2014 2015 2016 2017 2018
Operating leasing Finance leasing Car credit Self purchase*
Proportion of companies using the following solutions as their main financing method for their fleet vehicles
*Self-purchase = outright purchase + credit (other than car credit) Data have been consolidated: 3 years average Results provided for 2016 are calculated by the mean of an extrapolation between the results of the years 2015 and 2017.
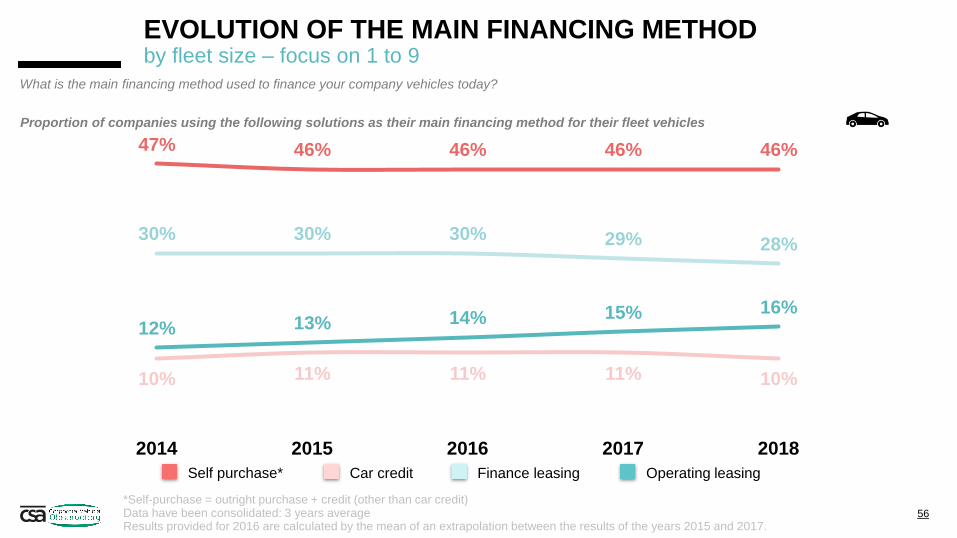
EVOLUTION OF THE MAIN FINANCING METHOD by fleet size – focus on 1 to 9
56
What is the main financing method used to finance your company vehicles today?
12% 13% 14% 15% 16%
30% 30% 30% 29% 28%
10% 11% 11% 11% 10%
47% 46% 46% 46% 46%
2014 2015 2016 2017 2018
Operating leasing Finance leasing Car credit Self purchase*
Proportion of companies using the following solutions as their main financing method for their fleet vehicles
*Self-purchase = outright purchase + credit (other than car credit) Data have been consolidated: 3 years average Results provided for 2016 are calculated by the mean of an extrapolation between the results of the years 2015 and 2017.

EVOLUTION OF THE MAIN FINANCING METHOD by fleet size – focus on 10 to 49
57
What is the main financing method used to finance your company vehicles today?
34% 34% 35% 36%
35%
30% 30% 28%
26% 26%
3% 4% 4% 4% 3%
33% 32% 33% 34%
36%
2014 2015 2016 2017 2018
Operating leasing Finance leasing Car credit Self purchase*
Proportion of companies using the following solutions as their main financing method for their fleet vehicles
*Self-purchase = outright purchase + credit (other than car credit) Data have been consolidated: 3 years average Results provided for 2016 are calculated by the mean of an extrapolation between the results of the years 2015 and 2017.

EVOLUTION OF THE MAIN FINANCING METHOD by fleet size – focus on 50 and more
58
What is the main financing method used to finance your company vehicles today?
53% 52% 55% 57% 57%
21% 23% 21% 19% 19%
1% 1% 1% 1% 1%
24% 23% 24% 24% 23%
2014 2015 2016 2017 2018
Operating leasing Finance leasing Car credit Self purchase*
Proportion of companies using the following solutions as their main financing method for their fleet vehicles
*Self-purchase = outright purchase + credit (other than car credit) Data have been consolidated: 3 years average Results provided for 2016 are calculated by the mean of an extrapolation between the results of the years 2015 and 2017.

MAIN FINANCING METHOD – Focus Operating leasing by company size – focus on 1 to 9
36%
16% 14%
#1 DE
#2 ES
#3 UK
12%
TOP 3
59 Data have been consolidated: 3 years average
What is the main financing method used to finance your company vehicles today?
Proportion of companies using operating leasing as their main financing method for their fleet vehicles
#4 BE 11%
#5 FR 11%
#6 NL 11%
#7 IT 9%
#8 PL 8%
#9 CH 7%
#10 PT 5%
#11 CZ 3%

MAIN FINANCING METHOD – Focus Operating leasing by company size – focus on 10 to 99
33%
31% 29%
#1 DE
#2 NL
#3 ES
21%
TOP 3
60 Data have been consolidated: 3 years average
What is the main financing method used to finance your company vehicles today?
#4 UK 27%
#5 BE 25%
#6 FR 22%
#7 IT 19%
#8 CZ 15%
#9 PT 12%
#10 PL 9%
#11 CH 5%
Proportion of companies using operating leasing as their main financing method for their fleet vehicles

MAIN FINANCING METHOD – Focus Operating leasing by company size – focus on 100 to 249/499/999
62%
60% 59%
#1 ES
#2 FR
#3 NL
38%
TOP 3
61 Data have been consolidated: 3 years average
What is the main financing method used to finance your company vehicles today?
#4 BE 54%
#5 DE 52%
#6 UK 44%
#7 IT 43%
#8 PT 20%
#9 CZ 19%
#10 CH 11%
#11 PL 10%
Proportion of companies using operating leasing as their main financing method for their fleet vehicles

MAIN FINANCING METHOD – Focus Operating leasing by company size – focus on 250/500/1000 and more
71%
71% 70%
#1 FR
#2 NL
#3 ES
51%
TOP 3
62 Data have been consolidated: 3 years average
What is the main financing method used to finance your company vehicles today?
#4 BE 67%
#5 DE 66%
#6 IT 66%
#7 UK 58%
#8 PT 51%
#9 CZ 33%
#10 PL 18%
#11 CH 11%
Proportion of companies using operating leasing as their main financing method for their fleet vehicles

MAIN FINANCING METHOD – Focus Operating leasing by company size – focus on 1 to 99
35%
21% 19%
#1 DE
#2 ES
#3 NL
15%
TOP 3
63 Data have been consolidated: 3 years average
What is the main financing method used to finance your company vehicles today?
+
#4 UK 19%
#5 BE 16%
#6 FR 15%
#7 IT 13%
#8 PL 8%
#9 PT 8%
#10 CZ 8%
#11 CH 6%
Proportion of companies using operating leasing as their main financing method for their fleet vehicles

MAIN FINANCING METHOD – Focus Operating leasing by company size – focus on 100 and more
66%
65% 64%
#1 ES
#2 FR
#3 NL
44%
TOP 3
64 Data have been consolidated: 3 years average
What is the main financing method used to finance your company vehicles today?
+
#4 BE 59%
#5 DE 58%
#6 IT 53%
#7 UK 50%
#8 PT 33%
#9 CZ 25%
#10 PL 14%
#11 CH 11%
Proportion of companies using operating leasing as their main financing method for their fleet vehicles

INTENTION TO DEVELOP OPERATING LEASING by company size
% Yes, certainly
Yes
Total
In the next three years, do you intend to develop Operating Leasing in order to finance your corporate fleet?
65
9% 5% 6% 11% 15%
23% 18% 19% 25% 31% (24%) (21%) (22%) (26%) (31%)
(9%) (6%) (7%) (10%) (17%)
Proportion of companies having the intention to develop operational leasing
(Reminder of 2017 results)

INTENTION TO DEVELOP OPERATING LEASING by fleet size
% Yes, certainly
Yes
In the next three years, do you intend to develop Operating Leasing in order to finance your corporate fleet?
66
Total
9% 5% 9% 20%
23% 18% 22% 36% (24%) (20%) (29%) (33%)
(9%) (5%) (12%) (18%)
Proportion of companies having the intention to develop operational leasing
(Reminder of 2017 results)

INTENTION TO DEVELOP OPERATING LEASING : Yes
35%
34% 33%
#1 FR
#2 PL
#3 BE
23%
TOP 3
67
In the next three years, do you intend to develop Operating Leasing in order to finance your corporate fleet?
Proportion of companies having the intention to develop operational leasing
#4 IT 28%
#5 UK 25%
#6 CH 21%
#7 NL 20%
#8 ES 17%
#9 PT 17%
#10 CZ 11%
#11 DE 8%

INTENTION TO DEVELOP OPERATING LEASING : Yes
34%
28% 24%
#1 PL
#2 IT
#3 BE
19%
TOP 3
68
+
In the next three years, do you intend to develop Operating Leasing in order to finance your corporate fleet?
Proportion of companies having the intention to develop operational leasing
#4 UK 22%
#5 CH 22%
#6 FR 22%
#7 ES 16%
#8 PT 14%
#9 NL 8%
#10 DE 8%
#11 CZ 7%

INTENTION TO DEVELOP OPERATING LEASING : Yes
50%
43% 34%
#1 FR
#2 BE
#3 PL
27%
TOP 3
69
+
In the next three years, do you intend to develop Operating Leasing in order to finance your corporate fleet?
Proportion of companies having the intention to develop operational leasing
#4 NL 34%
#5 UK 29%
#6 IT 29%
#7 PT 20%
#8 CH 19%
#9 ES 19%
#10 CZ 16%
#11 DE 9%

III - TELEMATICS

19% 8% 17% 26% 30%
USE OF TELEMATICS by company size
Total
71
Have you implemented Telematics within your fleet?
(20%) (9%) (19%) (25%) (33%)
Proportion of companies having implemented telematics in their fleet
(Reminder of 2017 results)

19% 10% 27% 37%
USE OF TELEMATICS by fleet size
Total
72
Have you implemented Telematics within your fleet?
(20%) (12%) (26%) (37%)
Proportion of companies having implemented telematics in their fleet
(Reminder of 2017 results)

USE OF TELEMATICS Yes
33%
28% 28%
#1 UK
#2 PL
#3 NL
19%
TOP 3
73
Have you implemented Telematics within your fleet?
Proportion of companies having implemented telematics in their fleet
#4 CZ 27%
#5 ES 21%
#6 PT 15%
#7 FR 14%
#8 IT 13%
#9 BE 13%
#10 CH 10%
#11 DE 8%

USE OF TELEMATICS Yes
22%
18% 14%
#1 UK
#2 CZ
#3 PL
11%
TOP 3
74
+
Have you implemented Telematics within your fleet?
Proportion of companies having implemented telematics in their fleet
#4 NL 14%
#5 BE 11%
#6 PT 11%
#7 IT 10%
#8 FR 9%
#9 ES 7%
#10 DE 6%
#11 CH 4%

USE OF TELEMATICS Yes
46%
45% 45%
#1 NL
#2 PL
#3 UK
28%
TOP 3
75
+
Have you implemented Telematics within your fleet?
Proportion of companies having implemented telematics in their fleet
#4 CZ 37%
#5 ES 36%
#6 PT 21%
#7 FR 19%
#8 IT 17%
#9 CH 17%
#10 BE 14%
#11 DE 11%

Total
PURPOSES FOR USING TELEMATICS
76
Improve drivers safety
Improve drivers behaviours
Locate vehicles
Optimize journeys
Reduce fleet costs
Other: 14%
60%
55%
74%
61%
59%
For which reasons do you use telematics within your company?

IV - PERSPECTIVE IN TERMS OF CORPORATE MOBILITY

DEVELOPMENT POTENTIAL OF MOBILITY ALTERNATIVES by company size
Already using
+ considered
Total
23%
28%
22%
78
Considered in the next 3 years
Already using
Car sharing or Ride sharing
Car sharing (the company makes available upon
reservation vehicles for its employees)
Ride sharing between employees (several employees in the
same car for a journey -car pooling, taxi
service, private hire vehicle-)
37% 21% 32% 42% 60%
In the next 3 years, would you consider using the following alternatives?
12%
15%
13%
16%
25%
20%
28%
31%
25%
44%
46%
35%
Proportion of companies already using or considering to use in the next 3 years the following mobility alternatives

DEVELOPMENT POTENTIAL OF MOBILITY ALTERNATIVES by fleet size
Already using
+ considered
Total
79
Considered in the next 3 years
Already using
In the next 3 years, would you consider using the following alternatives?
23%
28%
22%
Car sharing or Ride sharing
Car sharing (the company makes available upon
reservation vehicles for its employees)
Ride sharing between employees (several employees in the
same car for a journey -car pooling, taxi
service, private hire vehicle-)
37% 26% 46% 59%
14%
19%
16%
30%
34%
24%
43%
44%
37%
Proportion of companies already using or considering to use in the next 3 years the following mobility alternatives

#4 BE 42%
#5 PL 41%
#6 CH 40%
#7 NL 35%
#8 ES 32%
#9 PT 29%
#10 IT 23%
#11 DE 16%
DEVELOPMENT POTENTIAL OF MOBILITY ALTERNATIVES Car sharing or Ride sharing
% Already using + considered in the next 3 years
56%
47% 43%
#1 UK
#2 CZ
#3 FR
37%
TOP 3
80
In the next 3 years, would you consider using the following alternatives?
Proportion of companies already using or considering to use car sharing or ride sharing in the next 3 years

#4 PL 28%
#5 BE 27%
#6 CH 24%
#7 PT 22%
#8 ES 19%
#9 NL 18%
#10 IT 14%
#11 DE 7%
DEVELOPMENT POTENTIAL OF MOBILITY ALTERNATIVES Car sharing
% Already using + considered in the next 3 years
35%
34% 29%
#1 CZ
#2 UK
#3 FR
23%
TOP 3
81
In the next 3 years, would you consider using the following alternatives?
Proportion of companies already using or considering to use car sharing in the next 3 years

#4 CH 29%
#5 PL 28%
#6 FR 27%
#7 NL 26%
#8 ES 22%
#9 PT 19%
#10 IT 18%
#11 DE 13%
DEVELOPMENT POTENTIAL OF MOBILITY ALTERNATIVES Ride sharing
% Already using + considered in the next 3 years
48%
42% 31%
#1 UK
#2 CZ
#3 BE
28%
TOP 3
82
In the next 3 years, would you consider using the following alternatives?
Proportion of companies already using or considering to use ride sharing in the next 3 years

PROPORTION OF COMPANIES READY TO GIVE UP ALL OR PART OF THEIR COMPANY CARS FOR ALTERNATIVE MOBILITY SOLUTIONS - by company size
YES
Total
83
Yes probably
Yes certainly
And would you give up all or part of your company cars for such alternatives?
6%
6%
6%
Car sharing or Ride sharing
Car sharing
Ride sharing
9% 5% 6% 10% 18%
3%
3%
3%
3%
5%
4%
7%
7%
7%
13%
11%
10%

PROPORTION OF COMPANIES READY TO GIVE UP ALL OR PART OF THEIR COMPANY CARS FOR ALTERNATIVE MOBILITY SOLUTIONS - by fleet size
YES
Total
84
Yes probably
Yes certainly
And would you give up all or part of your company cars for such alternatives?
6%
6%
6%
Car sharing or Ride sharing
Car sharing
Ride sharing
9% 6% 8% 19%
4%
4%
4%
5%
6%
5%
14%
12%
12%

PROPORTION OF COMPANIES READY TO GIVE UP ALL OR PART OF THEIR COMPANY CARS FOR CAR SHARING OR RIDE SHARING
% YES
17%
14% 13%
#1 BE
#2 CH
#3 NL
9%
TOP 3
85
#4 FR 12%
#5 UK 11%
#6 IT 10%
#7 PL 8%
#8 PT 5%
#9 ES 4%
#10 DE 4%
#11 CZ 3%
And would you give up all or part of your company cars for such alternatives?

PROPORTION OF COMPANIES READY TO GIVE UP ALL OR PART OF THEIR COMPANY CARS FOR CAR SHARING
11%
9% 8%
#1 CH
#2 BE
#3 IT
6%
TOP 3
86
And would you give up all or part of your company cars for such alternatives?
#4 FR 8%
#5 UK 8%
#6 NL 7%
#7 PL 4%
#8 PT 3%
#9 ES 3%
#10 CZ 3%
#11 DE 2%
% YES

PROPORTION OF COMPANIES READY TO GIVE UP ALL OR PART OF THEIR COMPANY CARS FOR RIDE SHARING
12%
9% 9%
#1 BE
#2 NL
#3 UK
6%
TOP 3
87
And would you give up all or part of your company cars for such alternatives?
#4 CH 9%
#5 FR 7%
#6 PL 6%
#7 IT 5%
#8 PT 4%
#9 CZ 3%
#10 ES 3%
#11 DE 2%
% YES

88
T H A N K Y O U
88