2018 - asx.com.au2017 salesforce global innovation award for a major project undertaken with...
TRANSCRIPT

IVE Group Limited Annual Report 2018 1
ANNUAL REPORT 2018
VALUE
PERCEPTIONSIDEAS
WE MOVEWE MOVEWE MOVE
For
per
sona
l use
onl
y

IVE Group Limited Annual Report 2018 IVE Group Limited Annual Report 20182 11
IVE is a vertically integrated marketing services and print communications provider. IVE enables its customers to communicate more effectively with their customers by creating, managing, producing and distributing content across multiple channels.
The marketing services and print communications industry is dynamic and constantly evolving. IVE’s response to this evolution has been to maintain relevance with our customers through ongoing investment and continual expansion of our product and service offering.
IVE has a leading product and service offering in Australia and holds leading positions across multiple industry sectors.
IVE delivers its products and services through four operating divisions.
A customer experience agency that helps brands prosper through creative concept development, digital services, customer analytics & marketing automation
Integrated print, point of sale, personalised communications, promotional products, warehouse & logistics services
Fundraising strategy, data-driven solutions and telephone fundraising agency serving the not-for-profit sector
Managed solutions. Bundles the Group’s broad range of products and services into multi-channel solutions for customers
PERCEPTIONSWE MOVE WE MOVEWE MOVEWE MOVE
IVE Group Limited Annual Report 2018
Registered office IVE Group LimitedLevel 3, 35 Clarence StreetSydney NSW 2000Telephone: +61 2 8020 4400ACN 606 252 644
IVE Group Limited’s 2018 AGM will be held on Tuesday, 20 November 2018 commencing at 10:00am (Sydney time) in Establishment Room II at Establishment, 252 George Street, Sydney NSW 2000
IDEASWE MOVE WE MOVEWE MOVEWE MOVE VALUES
For
per
sona
l use
onl
y

IVE Group Limited Annual Report 2018 32
HIGHLIGHTSOF THE YEAR
FINANCIAL RESULTS
EARNINGS PER SHAREEarnings Per Share of $0.252(1) was down 2.6% on PCP impacted by August 2017 share issue, with full benefits of the capital raise residing in FY19 following completion of acquisition integrations and major capital expenditure programs
EBITDA $M
REVENUE $M
NPATA $M
35.9
695.4
73.2
27.3
496.9
55.2
FY2017
FY2017
FY2017
FY2018
FY2018
FY2018
FY2016
FY2016
FY2016
23.9
382.0
44.9
OPERATING CASH FLOW WAS STRONG REFLECTING EBITDA ACHIEVEMENT
EBITDA PERFORMANCE AND PRO FORMA FREE CASH CONVERSION OF 85.4% SUPPORTED A FINAL DIVIDEND OF 7.5 CENTS PER SHARE, FULLY FRANKED. PAYOUT RATIO OF 74% OF PRO FORMA NPAT
REVENUEStrong organic growth of 6.2%
Excellent success on revenue retention
Continued good momentum on ‘cross sell’
No material revenue losses
SUCCESSFULLY RAISED $55.6 MILLION IN AUGUST 2017 TO DRIVE FURTHER GROWTH BEYOND FY18
MILESTONES METRelocated and merged Victorian Blue Star DISPLAY with Franklin WEB retail display business
Completed the merger of Franklin WEB Victoria and AIW
$53 million investment in a new highly automated production site for Franklin WEB NSW
Completed acquisition of SEMA in September 2017
Revenue $695.4M↑ 39.9% PCP
$73.2M EBITDA↑32.4% PCP
$35.9M NPATA(1)
↑32.4% PCP
18.3% ROFE (2)
(1) NPAT excluding amortisation of customer contracts (2) EBIT/average funds employed where funds employed
equals net assets plus net debt
(1) Pro forma NPATA/weighted average shares on issue
IVE Group Limited Annual Report 2018
For
per
sona
l use
onl
y

IVE Group Limited Annual Report 2018 IVE Group Limited Annual Report 20184 5
Dear shareholders,
I am pleased to present my report as Executive Chairman of IVE Group, being proud of the progress we made over the year ending 30 June 2018. We are very satisfied that once again we have delivered on all strategic objectives and key operational milestones as we drive to position the company for continued growth.
Since listing on the ASX in December 2015 we have met market guidance(s) and delivered a strong uplift across revenue, EBITDA and NPATA. Our strategy, our narrative and operational imperatives have been effectively communicated and consistent throughout.
Continued Growth – Revenue and Earnings
FY18 revenue growth of 39.9% to $695.4 million including strong organic growth of 6.2% was underpinned by acquisitions, excellent revenue retention of key client accounts, no material revenue losses, and importantly, continued momentum on cross selling – a testament to IVE being Australia’s most diversified marketing and print communications provider.
EBITDA was up 32.4% to $73.2 million, with NPATA up 32.4% to $35.9 million. While our business experienced robust growth in FY18 we were still able to lift our dividend by 22% to 15.5 cents per share, underpinned by the highly cash generative nature of our business.
EPS was down 2.6% on PCP impacted by the delayed deployment of the funds raised in the August 2017 capital raise. We would expect the full benefits and resulting EPS uplift of this capital raise and subsequent investment program to flow through in FY19.
Our diversified customer base
Having led sector consolidation over the last 20 years, we have accumulated an enviable and very stable customer base from both new customers and through businesses we have acquired. Our company operates as a highly integrated collection of businesses, with 70%+ of our customers being serviced by more than one of our businesses. This reaffirms the success we have had in cross-selling additional services across the broader IVE Group.
We genuinely value the deep partnerships we have established over many years with our customers. In many cases we have been servicing customers for decades, a testament to our focus on client service as we have evolved our value proposition and maintained our relevance to meet their ever changing communications requirements.
Well positioned for FY19
Having now fully deployed the funds raised in August 2017, and following the successful execution of key operational initiatives over the last year, we expect in FY19 to fully realise operational efficiencies following our significant investment in Franklin WEB and the SEMA acquisition and integration.
We anticipate that the strong momentum across the Group will continue over FY19 and therefore expect to see a return to EPS growth.
Thank you
The success we have had at IVE has been a direct result of the hard work of our talented and committed team. Our senior management team have worked closely together for ten years and we have welcomed additional talent into IVE Group following the acquisitions of key businesses. We now employ around 1,700 people across the Group who have a wonderful customer service ethic. I would like to thank all staff for their tremendous effort during the year and our customers and supply partners for their continued support.
We are most fortunate to have a highly skilled and cohesive board. Thank you to my fellow directors for their commitment and valuable input over the last year.
Geoff Selig Executive Chairman
EXECUTIVE CHAIRMAN’S
REPORT
SINCE LISTING ON THE ASX IN DECEMBER 2015, OUR STRATEGY, OUR NARRATIVE, AND OUR OPERATIONAL IMPERATIVES HAVE BEEN EFFECTIVELY COMMUNICATED AND CONSISTENT
THE DIVERSE AND COMPELLING VALUE PROPOSITION CONTINUES TO LEAD THE MARKET, UNDERPINNING CONSISTENT REVENUE GROWTH AND RETENTION
For
per
sona
l use
onl
y

IVE Group Limited Annual Report 2018 IVE Group Limited Annual Report 20186 7
2018 was a year of further consolidation for our business, as we completed an equity raise in August 2017 to fund growth initiatives, including the further expansion of our personalised communications business Blue Star DIRECT through the acquisition and subsequent integration of SEMA, and the establishment of the highly automated world class Franklin WEB NSW operation.
In 2014 we launched a company wide employee benefits program, ‘IVE Plus’. This program is designed to support our staff realise their full potential through access to benefits across health and wellbeing, lifestyle, wealth and security, and personal family and community. In December 2017 this program was expanded further to include a diversity and inclusion component to ensure we continue to reinforce the extent to which we embrace and value our diverse workforce and inclusive culture. Our workplace health and safety platform ‘IVE 360’ was also successfully launched through the year.
Operational initiatives
Our first operational initiative was to relocate the Group’s existing Victorian Blue Star DISPLAY operation, which was merged with Franklin WEB’s retail display business into a dedicated facility in Victoria. This coincided with a significant investment program across both Victoria and NSW to provide more capacity to better service national retailers for their retail display requirements.
Kalido, our data analytics, marketing automation and digital services division continued its strong growth in both Australia and Asia, where we secured a number of new tier one customers. We were proud to have been awarded the 2017 Salesforce Global Innovation Award for a major project undertaken with Craveable Brands (Oporto, Red Rooster and Chicken Treat). Kalido partnered with Craveable Brands to transform their customer journey experience, leveraging leading marketing cloud platforms to enable a truly customer-centric, omni-channel automated solution.
Pareto is the leading data expert in understanding and forecasting trends across the not-for-profit sector. During the year we developed and implemented a new ‘big data platform’ that will enable all client fundraising data to be automatically uploaded and integrated to provide sophisticated reporting and an enhanced level of insights, both in relation to specific charities and across the wider market. We released a number of new analytics products which are enabling our customers to better target their fundraising efforts to benefit recipients.
We were certainly on the move over the last year to complete our plans in the Franklin WEB business. In Victoria, the merger of Franklin and AIW was completed in December 2017, when the AIW site ceased production and excess press capacity was retired. The AIW site remained open during the integration period to ensure there were no disruptions to our clients, and pleasingly we achieved that objective.
An important strategic objective was to ensure we had the appropriate balance of capacity between Franklin WEB NSW and Victoria to best service national retailers. The Group committed $53 million to establish a highly automated, low cost Franklin NSW operation in Huntingwood NSW. The facility was fully operational in November 2017 following the installation of the first new 80 page press and highly automated binding line, with stitching capacity expanded in March 2018. The second new 80 page press was commissioned on schedule in September 2018. We now look forward to driving growth and returns from both the Franklin Victoria and NSW businesses in FY19 as this investment is now complete.
Acquisitions integrated
Having completed the SEMA acquisition in September 2017 we integrated this business into Blue Star’s existing data driven, personalised communications division, Blue Star DIRECT. The integration was largely completed across three states in the second half of FY18, with the final phase completed in September 2018. Pleasingly, we had a smooth change in ownership, which is a testament to the strong emphasis we
We were certainly on the move over the last year to complete our plans in the Franklin WEB business.
MANAGING DIRECTOR’S
KALIDO WINS 2017 GLOBAL INNOVATION AWARD FOR OMNI-CHANNEL SOLUTION FOR ENHANCING THE CRAVEABLE BRANDS CUSTOMER EXPERIENCE
REPORTF
or p
erso
nal u
se o
nly

IVE Group Limited Annual Report 2018 8
place on acquiring businesses that have the right culture and management teams. Customers were very supportive of the ownership change, and we have subsequently experienced strong new business growth with all key staff retained.
Dominion Print Group was a bolt on acquisition which we acquired in November 2017 and was fully integrated into the Group by March 2018.
Continued strong outlook
IVE Group is set to continue with another strong year in FY19, with year on year revenue and earnings growth expected. We have a diverse and compelling value proposition which continues to underpin strong revenue retention and growth, both cross selling opportunities across our divisions and new customer acquisition. Having completed two significant acquisition and integration projects over the last two years, with associated major capital investment programs, we are well positioned to fully realise the resulting operational efficiencies in FY19 to unlock further growth in earnings per share.
As a result of strong revenue growth we undertook most of the ‘heavy lifting’ of our capital expenditure program in FY17/18, and accordingly our FY19 targeted investment and maintenance capital expenditure is significantly lower at $9 million. This excludes previously committed and communicated capital expenditure of $10.7 million for final phase of establishing Franklin Web NSW, and $5.5 million into additional high speed continuous inkjet in Blue Star DIRECT. We expect restructure costs for FY19 to be minimal.
Reflecting on the success we have had over FY18, I would like to thank all staff across the Group. I am privileged to work with a terrific team and the continued growth and strength of the Company is testament to their talent and dedication.
Warwick Hay Managing Director
MANAGING DIRECTOR’S REPORT
Geoff Selig Executive ChairmanGeoff has over 30 years’ experience in the marketing communications sector. Geoff was Managing Director of the IVE Group prior to moving into the role of Executive Chairman following the Company’s listing on the ASX in December 2015.
Geoff is a director of Caxton Group and Caxton Print Holdings, and also sits on the board of The Pinnacle Foundation and The Lysicrates Foundation. He was the State President of the NSW Liberal Party from 2005-8.
Geoff holds a Bachelor of Economics from Macquarie University and is a member of the Australian Institute of Company Directors.
Warwick Hay Managing DirectorAfter joining IVE Group in 2009 as CEO of Blue Star WEB, Warwick was appointed Managing Director in 2014.
Warwick has over 20 years of management experience across all business functions in complex B2B environments.
Between 2004 and 2009 Warwick was General Manager of Huhtamaki Flexibles Packaging Oceania. His prior work history includes 15 years within Carter Holt Harvey’s Packaging division across a broad range of senior roles. Warwick completed his tertiary education in New Zealand, a Graduate Diploma in Packaging Technology from Massey University and a Post Graduate Diploma in Business from Auckland University.
Paul Selig Executive DirectorPaul’s career commenced in banking and treasury management before moving into the print and marketing communications sector over 25 years ago. He has been an executive director of the Company since 2012.
Paul is an experienced director and investor having run the Caxton Group family office for over15 years.
Paul is also a director of Caxton Group, Caxton Print Holdings and Caxton Property Developments. He holds a Bachelor of Economics (Hons) from Macquarie University.
BOARD OF DIRECTORS
9IVE Group Limited Annual Report 2018
(L to R) Gavin Bell, Andrew Harrison, Sandra Hook, Geoff Selig, Paul Selig, Warwick Hay and James Todd.
For
per
sona
l use
onl
y

11
The future never stands still. And neither do we.At IVE, we move value, we move ideas and we move perceptions.
WE MOVEWE MOVE
Sandra Hook Independent Non-Executive DirectorSandra Hook has a track record in driving customer-centred business transformation and transitioning traditional organisations in rapidly evolving environments. She has extensive operational, digital, financial management and strategic experience built over 25 years as a CEO and in senior executive roles for some of Australia’s largest media companies including News Limited, Foxtel, Federal Publishing Company, Murdoch Magazines and Fairfax.
Since 2000 Sandra has also served as a non-executive director on listed, public and private companies and government bodies. Sandra is a director of digital/technology companies RXP Services, MedAdvisor and .au Domain Administration as well as the Sydney Fish Market. Sandra is a trustee of the Sydney Harbour Federation Trust and the Royal Botanic Gardens and Domain Trust.
Gavin Bell Independent Non-Executive DirectorGavin is an experienced director, executive and lawyer.
Gavin is a director of Smartgroup Corporation and icare NSW. He is also a member of the Advisory Council of the UNSW School of Business. Prior to becoming a director, Gavin was the CEO of global law firm Herbert Smith Freehills. He was a partner in the firm for 25 years.
Gavin holds a Bachelor of Laws from the University of Sydney and a Master of Business Administration from the AGSM, University of New South Wales.
Andrew Harrison Independent Non-Executive DirectorAndrew is an experienced company director and corporate adviser. Andrew has previously held senior executive positions and non-executive directorships with public, private and private equity owned companies, including as Chief Financial Officer of Seven Group Holdings, Group Finance Director of Landis and Gyr and Chief Financial Officer and a director of Alesco.
Andrew is a director of Burson Group, Estia Health, and WiseTech Global.
Andrew was previously a Senior Manager at Ernst & Young (Sydney and London) and Gresham Partners, and an Associate at Chase Manhattan Bank (New York). Andrew holds a Bachelor of Economics from the University of Sydney and a Master of Business Administration from Wharton School of the University of Pennsylvania, and is a chartered accountant.
James Todd Independent Non-Executive DirectorJames is an experienced company director, corporate adviser and investor. He commenced his career in investment banking and has taken active roles in a range of private and public companies. He was until recently Managing Director of Wolseley Private Equity, an independent private equity firm he co-founded in 1999.
James is a director of Coventry Group and HRL Holdings.
James holds a Bachelor of Commerce and a Bachelor of Laws from the University of New South Wales, and a Graduate Diploma of Applied Finance from the Financial Services Institute of Australasia (FINSIA), where he is a Fellow. He is also a member of the Australian Institute of Company Directors.
BOARD OF DIRECTORS
10IVE Group Limited Annual Report 2018 IVE Group Limited Annual Report 2018
For
per
sona
l use
onl
y

IVE Group Limited Annual Report 2018 1313
VALUEWE MOVE
12
WE MOVE
WE MOVE VALUE
OUR SHAREHOLDERSOur market-leading positions across the many sectors in which we operate, continue to deliver value for shareholders. The leadership team’s vision and investment strategy ensure we are strongly positioned to leverage Group capabilities, anticipate changing market conditions and meet our customers’ evolving needs.
OUR CUSTOMERSRecognising that our customers operate in a fast-changing world, our diverse and integrated capabilities support their evolving needs and strategic business opportunities. Our approach to customer communications that build brand value is measured by performance, creativity and innovation. Through continued diversification and internal development, our in-house capabilities – from data analytics and marketing automation to advanced print technology – drive demand for our customers’ products and services.
70%+ OF REVENUE GENERATED BY CUSTOMERS USING MULTIPLE IVE BUSINESSES
3,000+ CUSTOMERS ACROSS 26 INDUSTRY SECTORS
WE MOVE
IVE Group Limited Annual Report 2018
For
per
sona
l use
onl
y

IVE Group Limited Annual Report 201814 1515
VALUEWE MOVEWE MOVE WE MOVE
IVE Group Limited Annual Report 2018
OUR PEOPLEOur continued growth and evolution as an omnichannel marketing communications business is powered by our people. We value diversity and actively work to cultivate an open, dynamic and inclusive workplace. Supporting the individual and collective wellbeing of our people helps us attract and retain smart, energetic and determined talent who are focused to deliver.
OUR PARTNERSTo ensure we can reliably meet our customers’ marketing and communications campaign requirements, we work closely with select technology partners and third-party suppliers, both domestically and globally.
From digital workflow and managed solutions software to the world’s most advanced print operations, our partnerships connect customers with the most relevant and innovative solutions, driving efficiency and value.
IVE PLUS EMPLOYEE BENEFITS PROGRAM EXPANDED TO INCLUDE A DIVERSITY AND INCLUSION COMPONENT
OUR ETHICAL SUPPLY CHAIN INCLUDES 300 DOMESTIC AND GLOBAL SUPPLY PARTNERS
OUR STABLE MANAGEMENT TEAM HAS AN AVERAGE OF 20 YEARS’ SECTOR EXPERIENCE
We collaborate with leading global tech partners to deliver the world’s best practice cross-channel campaign management (maybe put this under ideas seeing as we don’t have anything else)
WE EMPLOY 1,700+ PEOPLE ACROSS AUSTRALIA, NEW ZEALAND, CHINA AND SINGAPORE
For
per
sona
l use
onl
y

IVE Group Limited Annual Report 2018 1717
IDEASWE MOVE
16IVE Group Limited Annual Report 2018
WE MOVEWE MOVE
WE MOVE IDEAS
RELATIONSHIPS In the constantly evolving world of marketing communications, relationships can be fleeting. We take pride in the fact that 75% of our revenue is generated from contracted or long-term customer relationships. Supporting deep customer engagement and the opportunity to introduce capabilities from across the IVE Group, these trusted business partnerships drive our organic growth. Our solutions-based approach brings ideas to life with innovative technology and contemporary creative solutions.
DIVERSIFICATION IVE’s product and service offering is unparalleled in Australia. In many of the sectors in which we operate, we are leaders in both innovation and market share. This breadth of services empowers our people to deliver inspired ideas that drive successful results. By creating, managing, producing and distributing highly personalised and engaging content across multiple marketing channels we give our customers a competitive edge.
THE DIVERSIFICATION OF OUR OFFER TODAY IS THE RESULT OF 20 YEARS+ OF CLEARLY DEFINED STRATEGY, MEASURED GROWTH AND EVOLUTION
THE VALUES THAT DEFINE OUR BUSINESS ARE AT THE CORE OF OUR LONG-TERM RELATIONSHIPS WITH ALL STAKEHOLDERS
For
per
sona
l use
onl
y

IVE Group Limited Annual Report 2018 IVE Group Limited Annual Report 201818 1919
IDEASWE MOVEWE MOVE WE MOVEEXPERTISE AND SKILLSWhen customers bring the opportunity, our people bring the smarts. Backed by leading-edge technology and unrivalled knowledge of the sectors in which we operate, our team’s expertise and experience is highly valued by our customers. Staying on top of global trends and new technologies, our people work together to provide powerful and relevant creative solutions.
TECHNOLOGYJust as technology is reshaping our lives, it continues to reshape our business. Our long history and expertise in traditional print is combined with dynamic capabilities in technology, data and digital communications. Valuable insights are driven by deep data analysis and inspire the ideas and innovations that our customers need to thrive. One-to-one or one-to-many, we are strongly positioned to lead the way in delivering highly personalised communications models and strategies.
INSIGHTSData helps unlock opportunities for innovation and creativity. From choosing the right communication channel to re-engineering delivery systems, we help deliver optimum value, efficiency and results throughout our customers’ businesses. By integrating data insight with CRM and marketing automation, we cohesively connect strategy, planning, delivery and optimisation services within the one solution.
THE UNIQUE BLEND OF CREATIVITY, SKILLS AND TECHNOLOGY DELIVER GREAT IDEAS AND OUTCOMES
WE HELP CUSTOMERS HARNESS DATA TO STRENGTHEN RELATIONSHIPS WITH INTERACTIVE TOOLS FOR MARKETING AUTOMATION, SHOPPER INSIGHTS, E-COMMUNICATIONS AND MORE
For
per
sona
l use
onl
y

IVE Group Limited Annual Report 2018 IVE Group Limited Annual Report 201820 2121
PERCEPTIONSWE MOVE
IVE Group Limited Annual Report 2018 20
OUR MANAGED SERVICES HELP BUSINESSES TO PLAN, EXECUTE AND OPTIMISE DATA-DRIVEN CUSTOMER JOURNEYS
DATAIVE has been creating personalised communications for more than 30 years. From our heritage as an innovator in personalised direct mail, today we are a market leader in data-driven communications that extend to every media channel and every area of the business. Whether managing customer relationships, fundraising for charity or building paths to purchase, our industry-leading data analytics, benchmarking, predictive modelling and insights help customers deliver the right message at the right time.
CONTENTWhether it’s a personalised online experience or printed brand collateral, IVE is strongly positioned to deliver compelling content that brings customers’ brand stories to life. Our integrated teams work to develop ‘media-neutral’ creative ideas that can be seamlessly rolled-out across any media channel. Complementing our deep expertise in print communications, our in-house design capabilities include branding, video content, animation and digital design. WE MOVE
PERCEPTIONS
WE MOVEWE MOVE
OUR ISO 27001 ACCREDITATION PROVIDES CUSTOMERS WITH THE ULTIMATE LEVEL OF COMFORT THAT IVE CAN MANAGE THEIR HIGHLY SENSITIVE DATA IN A SECURE ENVIRONMENT
HARNESSING THE POWER OF DATA TO DRIVE BETTER CUSTOMER RESULTS IS CORE TO OUR PERSONALISED COMMUNICATIONS OFFERING
For
per
sona
l use
onl
y

IVE Group Limited Annual Report 2018 IVE Group Limited Annual Report 201822 2323
PERCEPTIONSWE MOVEWE MOVE WE MOVEPRINT COMMUNICATIONSIVE is recognised as one of the most versatile and powerful print communications businesses in Australia, with capacity to handle projects of virtually any scope or size. We have continued to invest in technology that meets the ongoing needs of our customers. Investment and workflows are geared towards maximising flexibility, efficiency and competitiveness as well as greater speed to market for our customers.
PRODUCED 180 MILLION+ PERSONALISED DIRECT MARKETING MAIL PACKSAND 3.5 BILLION+ CATALOGUES
For
per
sona
l use
onl
y

IVE Group Limited Annual Report 2018 IVE Group Limited Annual Report 201824 2525
PERCEPTIONSWE MOVEWE MOVE WE MOVE
25
DIGITAL MARKETINGConnected by smartphones, mobile devices and computers, we’re living in a digital world. IVE provides solutions that let businesses interact with their customers in ways that are more personalised, more interactive and more informed by personal data than ever before. Every consumer has different preferences and behaviours so we help customers harness data to create highly personalised engagement journeys. We partner with leading technology platforms to deliver shopper insights, loyalty programs and marketing automation. We create chat-bots driven by Artificial Intelligence and enable marketing communications through SMS, email, social media and messaging platforms.
OUR FULLY INTEGRATED SOLUTIONS HELP BRANDS TO CONFIDENTLY NAVIGATE THE PATH FROM TRADITIONAL PRODUCT-LED MARKETING, TO THE REWARDS OF BEING CUSTOMER-CENTRIC CHAMPIONS
INTEGRATED MARKETING SOLUTIONSIVE combines our expertise in traditional print with leading capabilities in digital technology and data to provide integrated multi-channel solutions for many of Australia’s leading organisations. We help unlock opportunities for innovation and advantage, by drawing on our extensive consulting experience from marketing communications to digital technologies, supply chain logistics to retail display. Understanding each customer’s unique issues, we then collaborate to develop, implement and manage the optimum solution to drive better business results.
1 MILLION+ OUTBOUND PHONE CONVERSATIONS ON BEHALF OF CHARITIES
95 MILLION+ ELECTRONIC DIRECT MAILS AND 14 MILLION+ TEXT MESSAGES SENT
WE HAVE 110+ MARKETING EXECUTION EXPERTS EMBEDDED ON-SITE WITH CUSTOMERS OR NEAR SITE AT OUR CBD HUBS
For
per
sona
l use
onl
y

26IVE Group Limited Annual Report 2018
The future never stands still. And neither do we.
At IVE we’re on the move to create value for our people, shareholders, customers, and partners.
On the move to deliver inspired creative ideas that deliver the full potential of the continually evolving marketing and communications landscape.
And thinking beyond the ‘right now’ to help our customers confidently navigate the road ahead.
Our strategy of diversification and innovation continues to reinforce our position as a respected market leader in the many sectors in which we operate.
A stable and experienced leadership team guide our strategy and our culture, ensuring that we continue to attract customers, people and shareholders who share the IVE vision for our dynamic future.
WE MOVEWE MOVE
27IVE Group Limited Annual Report 2018
IVE GROUP LIMITEDANNUAL FINANCIAL REPORT
YEAR ENDED 30 JUNE 2018 ABN 62 606 252 644
For
per
sona
l use
onl
y
IVE Group Limited Annual Report 2018 IVE Group Limited Annual Report 201828 29
CONTENTSOperating and financial review 29
Directors’ report 35
Lead auditor’s independence declaration 55
Financial report contents 56
Consolidated financial statements 57
Notes to the consolidated financial statements 61
Directors’ declaration 92
Independent auditor’s report 93
ASX additional information 98
Corporate Governance Statement 100
OPERATING AND FINANCIAL REVIEW
1. INTRODUCTIONThe Directors are pleased to present the Operating and Financial Review (OFR) for IVE Group Limited (IVE) for the financial year ended 30th June 2018.
The OFR is provided to assist shareholder’s understanding of IVE’s business performance and factors underlying its results and financial position.
2. SUMMARYIVE achieved revenue growth for FY2018 of 39.9% compared to the prior corresponding period (PCP).The revenue increase reflects the impacts of the asset acquisition of Franklin Web Pty Ltd (Franklin) and share capital acquisitions of AIW Printing Pty Ltd (AIW) completed mid December 2016 and SEMA entities acquisition in September 2017. Growth also continued through a combination of new business wins and expanded spend from the existing customer base through IVE’s diversified service offering (share of wallet).
IVE achieved pro forma EBITDA growth of 32.4% over the PCP (before restructure and acquisition costs), due to a combination of organic growth and the acquisitions of Franklin WEB, AIW and SEMA, as well as continued productivity gains and cost base refinement through capital expenditure investment, focus on cost management, and the benefits arising from acquisition synergies. Statutory EBITDA is 77.2% higher than PCP, reflecting restructuring and acquisition costs in FY2017 mainly relating to Franklin and AIW acquisitions and costs.
During FY2018 IVE acquired 100% of the share capital of SEMA entities in September 2017, and John W Cage & Co Pty Ltd (trading as Dominion) in mid-November 2017.
FY2018 the Group successfully completed the integration of Franklin WEB and AIW, opened a new greenfield production site in Huntingwood Sydney (Franklin WEB NSW), which became fully operational in November 2017. The new site allowed for the final closure of production at the AIW site in mid-December 2017. The company also successfully undertook a capital raise in August 2017 to fund the SEMA acquisition (integrated H2 FY2018 and will complete Q1 FY2019), funding of a new printing press and ancillary equipment for recently secured revenue for our Franklin WEB operations (VIC and NSW), and provide capacity for future bolt on acquisitions and balance sheet flexibility.
For
per
sona
l use
onl
y

IVE Group Limited Annual Report 2018 IVE Group Limited Annual Report 201830 31
OPERATING AND FINANCIAL REVIEW (CONT.)
3. STRATEGY AND OPERATING OVERVIEWIVE’s journey of evolution and growth over the last 20 years has resulted in the most diversified marketing communications business in Australia. It is the extent of our diversification that has underpinned our capacity to retain customers over a very long period as we continue through our evolving value proposition to remain relevant to our customers’ changing communications requirements.
IVE’s four divisions (Kalido, Blue Star Group, Pareto Group, IVEO) bridge multiple sectors, and in each sector we continue to maintain our market leading positions.
IVE’s evolution and growth strategy has been focused on the following key initiatives:
• A cohesive, talented and stable leadership team
• A very stable, diverse and inclusive workforce
• New customer origination driven by a highly customer centric culture
• Effective cross selling to drive growth in share of wallet with existing customers
• Historically, the execution of a disciplined acquisition program
• Expansion of the value proposition through the addition of new products and services
• Continuing to strengthen and leverage our existing operational platforms through targeted productivity investment programs.
Further information on IVE’s strategy, operations and markets will be set out in our 30 June 2018 Annual Report.
4. OVERVIEW OF RESULTS FOR Y/E FY2018IVE’s Financial Report for FY2018 is presented on a Statutory basis in accordance with Australian Accounting Standards which comply with International Financial Reporting Standards (IFRS).
In this OFR, certain non-IFRS financial information has also been included to allow investors to understand the underlying performance of IVE. The non-IFRS financial information relates to FY2018 results presented before impacts of all restructuring and acquisition costs which primarily relate to the acquisitions of AIW, Franklin, SEMA and the August 2017 capital raise. Comparisons to FY2017 performance are on a Pro Forma basis also excluding all restructure and acquisition costs.
The Directors believe that the results before restructuring and acquisitions costs, and Pro Forma comparisons, better reflect the underlying operating performance and is consistent with the basis of full year guidance, this differs from the Statutory presentation.
The non-IFRS Pro Forma financial information has not been audited or reviewed.
Financial information in this OFR is expressed in millions and has been rounded to one decimal place. This differs from the interim Financial Report where numbers are expressed in thousands. As a result, some minor rounding discrepancies occur.
4.1 STATUTORY RESULTS PER THE FINANCIAL REPORTTable 1 outlines the Statutory results for FY2018 and FY2017 on a comparable basis.
Table 1: Statutory results
Statutory
Actual FY2018
$’M
Actual FY2017
$’M
Variance$’M
Variance%
Revenue 695.4 496.9 198.5 39.9%
Gross Profit 338.6 248.1 90.5 36.5%
% of Revenue 48.7% 49.9% 0 -2.5%
EBITDA 63.7 35.9 27.7 77.2%
% of Revenue 9.2% 7.2% 0 26.6%
EBIT 44.8 22.2 22.6 102.2%
% of Revenue 6.4% 4.5% 0 44.5%
Profit before tax 36.9 16.4 20.4 124.5%
NPAT 25.7 12.1 13.6 112.4%
NPATA 29.3 14.8 14.5 98.5%
The key variances on a Statutory basis between FY2018 and FY2017 are as follows:
• Revenue
Revenue increase of $198.5M or 39.9% over PCP, reflects the impact of Franklin/AIW and SEMA acquisitions, as well as increased revenue through new customer wins and the existing customer base through expanded service offering. The revenue increase has been achieved through realising the successful execution of IVE’s growth strategy initiatives. This has led to a number of new customers partnering with the Group throughout the year, the continued success of cross selling to existing and acquired customers, and the ability to achieve several key contract extensions.
• Gross profit
The gross profit increase of $90.5M over PCP largely driven by increased revenue. The Group achieved gross profit margin of 48.7% to revenue compared with 49.9% in PCP. Normalising for Franklin and AIW work mix and outsourcing due to capacity constraints during integration in H1 FY2018, gross profit has remained stable as a result of managing of inputs, continued leveraging of supply chain and reducing outsource spend wherever possible by producing internally. Paper cost increases in Q4 had minimal impact and were passed on wherever possible.F
or p
erso
nal u
se o
nly

IVE Group Limited Annual Report 2018 IVE Group Limited Annual Report 201832 33
OPERATING AND FINANCIAL REVIEW (CONT.)
4.1 STATUTORY RESULTS PER THE FINANCIAL REPORT (CONT.)• EBITDA (Earnings before interest, tax, depreciation and amortisation)
EBITDA of $63.7M represents an increase of $27.7M or 77.2% over PCP, achieved via a combination of acquisitions, organic revenue growth, and efficiency gains.
Production expenses (excluding depreciation) of $160.3M are 23.1% to revenue compared to $107.9M and 21.7% to revenue in PCP. The main driver of the increase in production expense is to service additional revenue; however % increase to revenue was partly driven by the integration of the SEMA acquisition in H2, as well as a result of keeping AIW operational throughout the integration period in H1 of FY2018. Production expenses also reflect increases in power expense.
Administration expenses (excluding depreciation and amortisation) of $106.0M are 15.2% to revenue compared to $88.7M and 17.8% to revenue in PCP.
Other expenses of $9.5M compared to PCP of $19.1M. FY2018 includes restructure costs associated with final AIW close down as well as SEMA integration costs, and acquisition costs also related to SEMA and August 2017 capital raise (see table 3). FY2017 is comprised of restructuring costs and acquisition costs predominantly relating to the Franklin and AIW acquisitions.
Other income of $0.8M mainly relates to contingent deferred goodwill (net) written back to the profit and loss.
EBITDA also impacted by bad debts associated with Kalido Asia.
4.2 YEAR ENDED FY2018 NON IFRS PRO FORMA FINANCIAL INFORMATIONThe FY2018 results below are presented before all restructuring and acquisition costs. Compared to FY2017 on a Pro Forma basis also excluding all restructure and acquisitions costs to allow investors to make a comparison on a like for like basis.
Table 2: FY2018 non IFRS Pro Forma financial information, FY2017 results on a Pro Forma basis, and FY2018 Statutory results
Statutory Pro Forma (ex restructure & acquisition)
Actual FY2018
$’M
Actual FY2018
$’M
ActualFY2017
$’M
Variance$’M
Variance%
Revenue 695.4 695.4 496.9 198.5 39.9%
Gross Profit 338.6 338.6 248.1 90.5 36.5%
% of Revenue 48.7% 48.7% 49.9% 0.0 –2.5%
EBITDA 63.7 73.2 55.3 17.9 32.4%
% of Revenue 9.2% 10.5% 11.1% 0.0 –5.4%
EBIT 44.8 54.3 41.5 12.8 30.9%
% of Revenue 6.4% 7.8% 8.4% 0.0 –6.5%
Profit before tax 36.9 46.4 35.8 10.6 29.7%
NPAT 25.7 32.4 24.5 7.9 32.1%
NPATA 29.3 35.9 27.1 8.8 32.4%
Table 3: FY2018 Statutory NPAT reconciliation to Pro Forma NPAT:
FY18 Actual
$’M
Statutory to pro forma NPAT reconciliation
Statutory NPAT 25.7
Restructure – IVE base (inc FW/AIW) 4.1
Restructure – SEMA/Dominion 4.4
Acquisition costs - SEMA/Dominion/ August 2017 capital raise 1.0
Tax effect of adjustments –2.9
Pro forma NPAT 32.4For
per
sona
l use
onl
y

IVE Group Limited Annual Report 2018 IVE Group Limited Annual Report 201834 35
OPERATING AND FINANCIAL REVIEW (CONT.)
4.3 BALANCE SHEETTable 4 sets out the indebtedness of IVE on a Statutory basis as at 30th June 2018 as a comparison to 30th June 2017.
Table 4: FY2018 Statutory indebtedness
Actual June FY2018
$’M
Actual June FY2017
$’M
Borrowings – short term 15.7 12.8
Borrowings – long term 137.5 137.2
Borrowings* – Sub Total 153.2 150.0
Cash –22.3 –23.9
Net Debt 130.9 126.2
* Borrowings are gross of loan establishment costs
Equipment finance borrowings increased due to the new printing presses in LFWO division, offset by reduction in senior facilities due to facility amortisation payment of $5.0M in December 2017 and a further $5.0M in June 2018. The second press and ancillary equipment has been funded from the proceeds of the August 2017 capital raise with the majority of the spend occuring in FY2018 and final payments due on commissioning in H1 of FY2019.
Net debt to FY18 pro forma EBITDA of $73.2M is 1.79X and operating cash flow conversion of 85.4% to EBITDA (on a pro forma basis).
Operating cash flow was strong reflecting EBITDA achievement, although partially offset by an increase in working capital from June 2017 impacted by the SEMA acquisition.
5. FY2018 FINANCIAL OUTLOOK• Continued good momentum across the Group positons us well for year on year revenue and earnings growth
• The diverse and compelling value proposition we take to market continues to underpin strong revenue retention and growth – both ‘cross sell’ and new business
• With the completion of the two significant acquisition/integration projects (Franklin/AIW & SEMA/Blue Star DIRECT) and associated major capital investment program, the Company is ideally positioned to fully realise the resulting operational efficiencies in FY19
• Following a period of significant capital expenditure, the Company’s FY19 new capital expenditure (excluding already committed FY19 capital expenditure as previously communicated) budget is significantly lower at $9 million
• Restructure costs for FY19 are expected to be minimal.
6. ADDITIONAL INFORMATIONFor further information contact:
Geoff Selig Darren Dunkley Executive Chairman Chief Financial Officer + 61 2 9089 8550 + 61 2 8020 4400
DIRECTORS’ REPORTFor the year ended 30 June 2018
The directors present their report together with the consolidated financial statements of the Group comprising of IVE Group Limited (the Company), and its subsidiaries (the Group) for the financial year ended 30 June 2018 and the auditor’s report thereon.
Principal activitiesThe principal activities of the Group during the course of the financial year were:
• Conceptual and creative design across print, mobile and interactive media;
• Printing of catalogues, magazines, marketing and corporate communications materials and stationery;
• Printing of point of sale display material and large format banners for retail applications;
• Personalised communications including marketing mail, publication mail, eCommunications and multi-channel solutions; and
• Outsourced communications solutions for large organisations including development of customised multi-channel management models covering creative and digital services, supply chain optimisation, inventory management, warehousing and logistics.
The Group services all major industry sectors in Australia including financial services, publishing, retail, communications, property, clubs and associations, not-for-profit, utilities, manufacturing, education and government.
There were no significant changes in the nature of the activities of the Group during the year.
Operating and financial reviewThe profit after tax of the Group for the year ended 30 June 2018 was $25,715 thousand (2017: $12,109 thousand). A review of operations and results of the Group for the year ended 30 June 2018 are set out in the Operating and Financial Review, which forms part of the Annual Financial Report.
DividendsThe directors have declared a final dividend of 7.5 Australian cents per share, fully franked, to be paid on 25 October 2018 to shareholders on the register at 19 September 2018.
Total dividends of $21,325 thousand were declared and paid by the Company to members during the 2018 financial year. Further details on dividends is included in note 19 of the Financial Report.
Significant changes in the state of affairsDuring the year, the Group acquired a number of businesses, the details of which are included in note 21 of the Financial Report.
In the opinion of the directors there were no other significant changes in the state of affairs of the Group that occurred during the financial year under review.
For
per
sona
l use
onl
y

IVE Group Limited Annual Report 2018 IVE Group Limited Annual Report 201836 37
DIRECTORS’ REPORT (CONT.)For the year ended 30 June 2018
Information on Directors The directors of the Company at any time during or since the end of the financial year are:
Director Experience, special responsibilities and other directorships
Geoff Bruce Selig
Executive Chairman
Appointed: 10 June 2015
Geoff has over 30 years’ experience in the marketing communications sector. Geoff was Managing Director of the IVE Group prior to moving into the role of Executive Chairman following the Company’s listing on the ASX in December 2015.
Geoff is a director of Caxton Group and Caxton Print Holdings, and also sits on the board of The Pinnacle Foundation and The Lysicrates Foundation. He was the State President of the NSW Liberal Party from 2005-8.
Geoff holds a Bachelor of Economics from Macquarie University and is a member of the Australian Institute of Company Directors.
Warwick Leslie Hay
Managing Director
Appointed: 25 November 2015
After joining IVE Group in 2009 as CEO of Blue Star WEB, Warwick was appointed Managing Director in 2014.
Warwick has over 20 years of management experience across all business functions in complex B2B environments.
Between 2004 and 2009 Warwick was General Manager of Huhtamaki Flexibles Packaging Oceania. His prior work history includes 15 years within Carter Holt Harvey’s Packaging division across a broad range of senior roles. Warwick completed his tertiary education in New Zealand, a Graduate Diploma in Packaging Technology from Massey University and a Post Graduate Diploma in Business from Auckland University.
Gavin Terence Bell
Independent Non-executive Director
Appointed: 25 November 2015
Gavin is an experienced director, executive and lawyer.
Gavin is a director of Smartgroup Corporation and icare NSW. He is also a member of the Advisory Council of the UNSW School of Business. Prior to becoming a director, Gavin was the CEO of global law firm Herbert Smith Freehills. He was a partner in the firm for 25 years.
Gavin holds a Bachelor of Laws from the University of Sydney and a Master of Business Administration from the AGSM, University of New South Wales.
Andrew Charles Harrison
Independent Non-executive Director
Appointed: 25 November 2015
Andrew is an experienced company director and corporate adviser. Andrew has previously held senior executive positions and non-executive directorships with public, private and private equity owned companies, including as Chief Financial Officer of Seven Group Holdings, Group Finance Director of Landis and Gyr and Chief Financial Officer and a director of Alesco.
Andrew is a director of Burson Group, Estia Health, and WiseTech Global.
Andrew was previously a Senior Manager at Ernst & Young (Sydney and London) and Gresham Partners, and an Associate at Chase Manhattan Bank (New York). Andrew holds a Bachelor of Economics from the University of Sydney and a Master of Business Administration from Wharton School of the University of Pennsylvania, and is a chartered accountant.
Paul Stephen Selig
Non-executive Director
Appointed: 10 June 2015
Paul’s career commenced in banking and treasury management before moving into the print and marketing communications sector over 25 years ago. He has been an executive director of the Company since 2012.
Paul is an experienced director and investor having run the Caxton Group family office for over15 years.
Paul is also a director of Caxton Group, Caxton Print Holdings and Caxton Property Developments. He holds a Bachelor of Economics (Hons) from Macquarie University.
Director Experience, special responsibilities and other directorships
James Scott Charles Todd
Independent Non-executive Director
Appointed: 10 June 2015
James is an experienced company director, corporate adviser and investor. He commenced his career in investment banking and has taken active roles in a range of private and public companies. He was until recently Managing Director of Wolseley Private Equity, an independent private equity firm he co-founded in 1999.
James is a director of Coventry Group and HRL Holdings.
James holds a Bachelor of Commerce and a Bachelor of Laws from the University of New South Wales, and a Graduate Diploma of Applied Finance from the Financial Services Institute of Australasia (FINSIA), where he is a Fellow. He is also a member of the Australian Institute of Company Directors.
Sandra Margaret Hook
Independent Non-executive Director
Appointed: 1 June 2016
Sandra Hook has a track record in driving customer-centred business transformation and transitioning traditional organisations in rapidly evolving environments. She has extensive operational, digital, financial management and strategic experience built over 25 years as a CEO and in senior executive roles for some of Australia’s largest media companies including News Limited, Foxtel, Federal Publishing Company, Murdoch Magazines and Fairfax.
Since 2000 Sandra has also served as a non-executive director on listed, public and private companies and government bodies. Sandra is a director of digital/technology companies RXP Services, MedAdvisor and .au Domain Administration as well as the Sydney Fish Market. Sandra is a trustee of the Sydney Harbour Federation Trust and the Royal Botanic Gardens and Domain Trust.
For
per
sona
l use
onl
y

IVE Group Limited Annual Report 2018 IVE Group Limited Annual Report 201838 39
DIRECTORS’ REPORT (CONT.)For the year ended 30 June 2018
Company SecretaryEmma LawlerEmma was appointed as Company Secretary on 11 December 2015. Emma has two decades of experience as a company secretary and governance professional. Emma holds a Bachelor of Business and a Graduate Diploma in Applied Corporate Governance and is a Fellow of the Governance Institute of Australia.
Darren DunkleyDarren has been the Chief Financial Officer (CFO) of the Group since 2012, and has been with IVE for over 15 years. He has over 25 years of experience with a range of blue chip companies including Sharp Corporation, ANZ Banking Group Ltd and Nashua Australia. Darren has a Bachelor of Commerce majoring in Accounting and is a CPA.
Meetings of DirectorsThe number of directors’ meetings (including meetings of committees of directors) and number of meetings attended by each of the directors of the Company during the financial year are:
BoardAudit, Risk & Compliance
Committee (ARCC)
Nominations & Remuneration
Committee (NRC)
Other Committees
Eligible Attended Eligible Attended Eligible Attended Eligible Attended
Geoff Selig 11 11 – – – – 2 2
Warwick Hay 11 11 – – – – 1 1
Gavin Bell 11 10 4 4 3 3 – –
Andrew Harrison 11 11 4 4 – – – –
Sandra Hook 11 11 – – 3 3 – –
Paul Selig 11 10 – – – – 1 1
James Todd 11 11 4 4 3 3 – –
Committee membership for ARCC and NRC changed during the year.
There were two meetings held of the Independent Directors during the year. All of the Independent Directors attended both of these meetings.
Directors’ interest and benefits The relevant interests of each director in the shares of the Company as at the date of this report are disclosed in the Remuneration Report (on page 40).
Environmental regulationThe Group’s operation is not subject to any significant environmental regulations under either Commonwealth or State legislation. However, the Board believes that the Group has adequate systems in place for the management of its environmental requirements and is not aware of any breach of those environmental requirements as they may apply to the Group during the period covered by this report.
Events subsequent to reporting dateThere has not arisen in the interval between the end of the financial year and the date of this report any item, transaction or event of a material and unusual nature likely, in the opinion of the directors of the Company, to affect significantly the operations of the Group, the results of those operations, or the state of affairs of the Group, in future financial years.
Likely developmentsInformation about likely developments in the operations of the Group and the expected results of those operations in future financial years has not been included in this report because disclosure of the information would be likely to result in unreasonable prejudice to the Group.
Indemnification and insurance of officersDuring the financial year, the Group paid a premium insuring the directors of the Group, the company secretaries, and executive officers to the extent permitted by the Corporations Act 2001.
The Group indemnified its directors and company secretaries to the extent permitted by law against a liability incurred.
Indemnification and insurance of auditorDuring or since the end of the financial year the Group has not indemnified or made a relevant agreement to indemnify the auditor of the Group against a liability incurred as the auditor. In addition, the Group has not paid, or agreed to pay, a premium in respect of a contract insuring against a liability incurred by the auditor.
Insurance premiumsDuring the financial year the Company has paid premiums in respect of directors’ and officers’ liability insurance contracts for the year ended 30 June 2018. In addition, since the financial year, the Company paid or agreed to pay premiums in respect of such insurance contracts for the year ending 30 June 2019. Such insurance contracts insure against certain liability (subject to specific exclusions) for persons who are or have been directors or executive officers of the Company.
The directors have not included details of the nature of the liabilities covered or the amount of the premiums paid in respect of the directors’ and officers’ liability insurance contracts, as such disclosure is prohibited under the terms of the contract.
For
per
sona
l use
onl
y

IVE Group Limited Annual Report 2018 IVE Group Limited Annual Report 201840 41
Letter from the Chair of the Nomination and Remuneration Committee
Dear Shareholder,
As Chair of the Nomination and Remuneration Committee (NRC), on behalf of the Board, I am pleased to present IVE Group’s Remuneration Report for the year ended 30 June 2018 (FY18).
The Report is designed to provide shareholders with an understanding of IVE’s remuneration philosophy and the link between this philosophy and IVE’s strategy and performance.
The Board is committed to having remuneration policies and practices which are designed to ensure remuneration is competitive and reasonable to attract and retain key talent who are critical to IVE’s business success. IVE will align remuneration to strategies and business objectives and provide a balance between fixed and variable rewards to ensure that rewards are given for performance. Remuneration structures are designed to be transparent to employees and other stakeholders and easily understood. In addition the remuneration framework is designed to be acceptable to shareholders by being consistent with market practice and creating value for shareholders.
The remuneration framework was reviewed in 2018 and a staged process was commenced to appropriately reward Key Management Personnel through base pay and short term incentive levels that are in line with IVE’s peers and reward performance and ensure an appropriate level of long term incentives aligned with shareholder objectives of long-term sustainable performance. There have been no significant changes to the overall framework.
The members of the NRC have the necessary expertise and independence to fulfil their responsibilities and are able to access independent experts in remuneration for advice should this be required. The governance processes in relation to remuneration are working effectively and the Board trusts that shareholders find this Report useful and informative.
Gavin Bell
Chair of the Nomination and Remuneration Committee
Remuneration Philosophy• Be competitive and
reasonable to attract and retain key talent
• Align to IVE’s strategies and business objectives
• Provide a balance between fixed and variable rewards
• Be transparent and easily understood
• Be acceptable to shareholders.
Remuneration Report (Audited)This Remuneration Report (Report), which has been audited, describes the Key Management Personnel (KMP) remuneration arrangements for the period ended 30 June 2018 for IVE Group, in accordance with the Corporations Act 2001 (Cth) and its regulations.
The remuneration report contains the following sections:
• Persons covered by this Report
• Overview of the remuneration framework for executive KMPs
• Linking reward and performance
• Grant of Performance Share Rights and the Long Term Incentive Plan
• Non-Executive Director remuneration framework
• Contractual arrangements with executive KMPs
• Details of remuneration for KMPs
• Rights Granted to executive KMP
• Directors and executive KMP shareholdings in IVE Group Limited
• Other statutory disclosures
Who this report coversThis report covers Non-Executive Directors and executive KMPs (collectively KMP) and includes:
Role
Non-Executive Directors
Gavin Bell Independent Non-Executive Director
Andrew Harrison Independent Non-Executive Director
Sandra Hook Independent Non-Executive Director
James Todd Independent Non-Executive Director
Executive Directors
Geoff Selig Executive Chairman
Warwick Hay Managing Director
Paul Selig Executive Director
Executive Key Management Personnel
Matt Aitken Chief Operating Officer
Darren Dunkley Chief Financial Officer & Company Secretary
KMP detailed above were in their roles for the full year, except for Paul Selig who became an Executive Director effective 1 October 2017, from his previous role as a Non-Executive Director.
Overview of IVE Group’s remuneration framework for executive KMPThe objective of IVE Group’s remuneration philosophy is to ensure KMPs are rewarded for business performance and retained to continue to grow the business. The objectives underpinning the remuneration philosophy are that remuneration will:
• Be competitive and reasonable to attract and retain key talent;
• Align to IVE’s strategies and business objectives;
• Provide a balance between fixed and variable rewards;
• Be transparent and easily understood; and
• Be acceptable to shareholders.
For
per
sona
l use
onl
y

IVE Group Limited Annual Report 2018 IVE Group Limited Annual Report 201842 43
A key factor in IVE Group’s business success will be being able to attract and retain key talent and the remuneration framework has been designed to enable this.
Governance
IVE Group has established a Nomination and Remuneration Committee (NRC) whose role is to assist the Board with its remuneration responsibilities, including reviewing and recommending to the Board for approval, arrangements for executives, Executive Directors and Non-Executive Directors. The NRC has three members, all of whom are independent, including an independent Chair. The members of the NRC have appropriate qualifications and experience to enable the NRC to fulfil its role.
In addition, the Board has appointed Gavin Bell as the Lead Independent Director to fulfil the role of Chair whenever the Executive Chairman is conflicted and to assist in reviewing the Executive Chairman’s performance as part of the Board performance evaluation process.
External remuneration consultants
The Terms of Reference for the NRC requires that any remuneration consultants engaged be appointed by the NRC. During 2018 IVE did not engage the services of any external remuneration consultants.
Any advice that may be received from remuneration consultants in future will be carefully considered by the NRC to ensure it is given free of undue influence by IVE Group executives.
Structure of Remuneration
The remuneration framework for executive KMP includes both fixed and performance-based pay.
Fixed remuneration
Fixed remuneration is set using a combination of historical levels and sector comparisons. Fixed remuneration includes base pay, statutory contributions for superannuation and non-monetary benefits.
The NRC reviews the fixed remuneration of executive KMP on an annual basis and has reviewed the fixed remuneration during FY18 which has been implemented from 1 July 2018.
Fixed remuneration for executive KMP was increased for FY18 based on a review of competitor remuneration, the substantial increase in the size and complexity of the business and also noting the length of time since the last fixed remuneration increase. Most of the executive KMP had not had a fixed remuneration increase since late 2014 or early 2015.
Paying executive KMP the right fixed remuneration is a key tool in attracting and retaining the best talent. The Board is committed to retaining key personnel given the significant acquisitions made over the past two years and the consolidation occurring in some of the Company’s key markets. This is reflected in some of the base pay increases effected in FY18. The context of these increases includes the significant increase in the size, complexity and profitability of the Company since it listed in December 2015. As shown in the table on page 46, both revenue and EBITDA have more than doubled since FY15.
Short term incentive (STI)
In FY18, executive KMP (excluding Paul Selig) were eligible to receive an STI payment of between 19 and 24% of fixed remuneration. The STI is a cash incentive payment and full payment is conditional on achievement of:
• The key financial performance target for the Group, specifically, pro-forma Earnings before Interest, Tax, Depreciation and Amortisation (EBITDA) for the year in review and
• Individual financial and non-financial performance targets relevant to the individual executive KMP.
This STI target was an increased percentage over FY17, which was a deliberate decision by the NRC to have a greater proportion of remuneration at-risk.
DIRECTORS’ REPORT (CONT.)For the year ended 30 June 2018
The NRC reviews the achievement of STI targets at the end of each year and sets STI targets for the following year. The STI is the main tool for rewarding the current year’s performance of the business.
In FY18, the NRC reviewed performance against actual EBITDA and achievement of other performance indicators to determine the proportion of target STI to award. The award for each Executive KMP against target is shown in the table on the following page.
Paul Selig was awarded a discretionary bonus payment of $250,000 (paid 30/10/2017), as announced to the ASX in September 2017 on his appointment, for his work on strategic acquisitions, financing, integration and property related matters. The NRC’s view is that Mr Selig’s industry, financial and property experience, knowledge of the Company, commitment and remuneration arrangements delivered considerably more value to the Company than if an external consultant/s or additional employee/s were retained to perform this role. Paul Selig is not part of the usual executive remuneration framework due to his specific role.
Long term incentive (LTI)
The Board has established a LTI Plan as outlined in prior years Remuneration Reports and outlined in the section in this Report entitled “Share based remuneration”. The LTI Plan has not been amended during FY18 and will be the subject of a resolution at this year’s AGM to refresh shareholders’ approval of the LTI Plan. The LTI Plan is largely used to reward long-term sustainable performance.
The LTI Plan facilitates the offer of Performance Share Rights (Rights) to key executives and the Rights vest and convert to ordinary shares on a one-for-one basis, subject to meeting specific performance conditions, specifically achievement of:
• Relative total shareholder return (TSR); and
• Compound annual earnings per share growth (EPS) over a three-year performance period.
The LTI Plan, including the combination of TSR and EPS hurdles, has been designed commensurate with IVE Group’s long-term strategic objectives so that executive KMP will be rewarded when there is a demonstrable increase in shareholder value.
The grant of Rights to the Managing Director was approved by shareholders at the 2017 Annual General Meeting (AGM) and the Rights to be granted to the Executive Chairman and Managing Director for 2018 will be submitted for approval by shareholders at the 2018 AGM.
The Board has the discretion to amend the future vesting terms and performance hurdles at the grant of each award of Rights to ensure that they are aligned to market practice and ensure the best outcome for IVE Group. The Board also has the discretion to change the LTI Plan and to determine whether LTI grants will be made in future years. There is no re-testing of performance hurdles.
The Board makes changes to the level of LTI to grant each year based on reviews of total remuneration packages for executives. In FY18 the Board, following review by the NRC, did not grant an equity-based LTI to Geoff Selig, Executive Chairman, due to Geoff Selig being a substantial shareholder in IVE Group by being a beneficiary of the Selig Family Trust No.5 (trustee Caxton Print Holdings Pty Ltd). The NRC has again reviewed this position and will grant an equity-based LTI to Geoff Selig as Executive Chairman in FY19 after a review of comparable peers and to align his total remuneration package with other executives. Due to Paul Selig’s executive role being specific in nature, he does not participate in the LTI Plan.
The NRC agreed to increase the level of long term incentives in both FY18 and FY19 to further align management’s remuneration with shareholders’ longer term interests. This has been a staged program over FY18 and FY19 and all rewards are subject to achieving the performance conditions outlined above.F
or p
erso
nal u
se o
nly

IVE Group Limited Annual Report 2018 IVE Group Limited Annual Report 201844 45
Assessment of performance
Performance of executive KMPs is assessed against the agreed non-financial and financial targets on a regular basis. Based on this assessment, the Executive Chairman will make a recommendation to the NRC for Board approval of the amount of STI and LTI to award (as applicable) to each KMP, other than the Executive Chairman. Recommendations in relation to the Executive Chairman will be made by the Chair of the NRC for Board approval.
The NRC assesses the actual performance of IVE Group and the Executive Chairman against the agreed targets and recommends the amount of the STI and LTI (as applicable) to be paid for approval by the Board.
Executive KMP remuneration – paid, vested and targets
The table below presents the STI and LTI paid and vested to executive KMP during FY17 and FY18. Further detail on remuneration is included in the tables at the end of this Report.
All in $ STI LTI – Number of Rights
Maximum Actual Granted Vested
Geoff Selig FY18 200,000 181,250 0 Not applicable (3 year vesting)
FY17 70,000 50,000 32,817 Not applicable (3 year vesting)
Warwick Hay FY18 100,000 84,250 67,567 Not applicable (3 year vesting) FY17 70,000 50,000 32,817 Not applicable (3 year vesting)
Matt Aitken FY18 90,000 76,960 60,810 Not applicable (3 year vesting) FY17 70,000 50,000 32,817 Not applicable (3 year vesting)
Darren Dunkley FY18 75,000 64,700 50,675 Not applicable (3 year vesting) FY17 35,000 25,000 19,690 Not applicable (3 year vesting)
Paul Selig* FY18 0 0 0 0 FY17 0 0 0 0
*As disclosed earlier, Paul Selig was paid a discretionary bonus payment of $250,000, which is not part of the STI framework.
Further detail on the value of the Rights granted is included in the tables at the end of this Report.
DIRECTORS’ REPORT (CONT.)For the year ended 30 June 2018
Following the assessment of performance, the annual review of fixed remuneration and STI and LTI targets and benchmarking against peers, the changes to executive KMP for FY19 is outlined below. As detailed above, the increases for FY18 and FY19 have been an agreed staged program to adequately reward executive KMP and align remuneration with shareholders’ longer term interests.
All in $ Fixed Remuneration* STI LTI
FY17 FY18 FY19 FY17 FY18 FY19 FY17 FY18 FY19 Actual Actual Agreed Actual Actual Maximum Grant** Grant** Grant**
Geoff Selig 700,000 850,000 952,000 50,000 181,250 200,000 50,000 0 200,000***
Warwick Hay 440,000 500,000 525,000 50,000 84,250 100,000 50,000 100,000 200,000***
Matt Aitken 400,000 480,000 504,000 50,000 79,960 100,000 50,000 90,000 200,000
Darren Dunkley 305,000 400,000 420,000 25,000 64,700 80,000 30,000 75,000 150,000
Paul Selig N/A**** 303,501 330,000 N/A**** 250,000 0 N/A**** N/A**** N/A****
*Fixed remuneration includes superannuation
**LTI grant is the $ value of the grant approved by the Board.
***FY19 LTI grant is subject to shareholder approval.
**** Paul Selig was a non-executive Director during FY17 and appointed as an Executive effective 1 October 2017. FY18 is Fixed Remuneration for the part of the year Paul Selig was appointed as an Executive. Due to the specific nature of his role, Paul Selig does not participate in the LTI Plan.
Proportions of fixed and variable remuneration
The Board and NRC consider annually the fixed remuneration and proportion of variable remuneration that is dependent on performance (“at risk”) for each executive KMP. The relative proportions of fixed versus variable pay (as a percentage of total remuneration) received by executive KMP during the past two financial periods and proposed for the next financial period are shown below. This chart shows the staged process the NRC has undertaken to increase the proportion of at risk remuneration.
0
20
40
60
80
100
201920182017201920182017201920182017201920182017
Fixed At Risk
Geoff Selig Warwick Hay Matt Aitken Darren DunkleyFor
per
sona
l use
onl
y

IVE Group Limited Annual Report 2018 IVE Group Limited Annual Report 201846 47
For FY19, below shows the remuneration mix for each Executive KMP (noting Paul Selig is not subject to the general executive remuneration framework):
Fixed Remuneration At risk – STI (maximum) At risk LTI
2019 2018 2017 2019 2018 2017 2019 2018 2017
Geoff Selig 70.4% 80.9% 85.4% 14.8% 19.1% 8.5% 14.8% 0% 6.1%
Warwick Hay 63.6% 71.4% 78.6% 12.1% 14.3% 12.5% 24.3% 14.3% 8.9%
Matt Aitken 62.7% 72.7% 76.9% 12.4% 13.7% 13.5% 24.9% 13.6% 9.6%
Darren Dunkley 64.6% 72.7% 82.4% 12.3% 13.7% 9.5% 23.1% 13.6% 8.1%
Paul Selig* 100% 56.9% N/A N/A 43.1% N/A N/A N/A N/A
*Paul Selig was a Non-Executive Director during FY17 and appointed as an executive effective 1 October 2017. FY18 is Fixed Remuneration for the part of the year Paul Selig was appointed as an Executive.
How reward is linked to performancePerformance indicators and link to performanceIVE Group’s financial performance has been strong since listing on the ASX in December 2015. Performance of the business is reflected in the outcome of the variable components to the remuneration framework:
• Full STI payments are only made if executive KMP meet agreed financial and non-financial targets for the year in review; and
• LTI grants only vest if IVE Group achieves the targets set for TSR and EPS over a three year period.
There has been no LTI vesting for executive KMP since listing on the ASX. The first possible vesting date for executive KMP is after the FY19 financial results are released to the market and targets will be tested at that time.
In FY18, each executive KMP was awarded the proportion of the target STI indicated above, based on achievement of the Group EBITDA component to forecast as well as individual performance targets.
Key financial metrics over the last four years that can be measured are shown below:
FY14 FY15 FY16 FY17 FY18
Revenue ($m) 303.5 337.4 382.0 496.6 695.4
EBITDA ($m) 22.9 30.9 42.8 55.2 73.2
Net profit after tax ($m) 6.4 9.7 20.9 24.6 32.4
Dividend payment (cents per share)* N/A N/A N/A 12.7 15.5
Dividend payout ratio* N/A N/A N/A 69% 71%
Share price change ($)** N/A N/A N/A (0.043) +0.162
The above results are prepared on a pro forma basis***.
*Only applicable post-listing on ASX.
**Calculated as close price on 30 June for the applicable year.
*** Pro forma results exclude all restructure and acquisition costs. This better reflects the underlying operating performance and is consistent with guidance.
DIRECTORS’ REPORT (CONT.)For the year ended 30 June 2018
Grant of Performance Share RightsDuring the year, the Company made offers of Rights under the LTI Plan with clear performance measures. The offers included:
• On 17 November 2017, offers were made granting 253,374 performance rights under the Senior Leadership Team Plan. These Rights vest following the release of the FY20 financial results if certain performance conditions are met during the Performance period which is 1 July 2017 to 30 June 2020. During the year 27,026 of these Rights lapsed due to employee resignations.
In total there were 357,615 unvested Rights at 30 June 2018 form the FY17 and FY18 offers.
There were no offers of options during the year and there are no unvested options.
The terms of the Equity Incentive Plan which provide the framework under which the LTI grants were made in FY17 and FY18 are as follows:
Feature Terms of the IVE Group Equity Incentive Plan
Type of security Performance Share Rights which are an entitlement to receive fully paid ordinary IVE Group Limited shares (as traded on the ASX) on a one-for-one basis.
Valuation The number of Performance Share Rights for each KMP is calculated by dividing the allocated value of the LTI award for that KMP by the fair value of a Performance Share Right. The fair value is calculated using a Monte Carlo simulation approach for the Awards subject to the Relative TSR condition and a risk neutral assumption is used the value the Awards subject to the EPS condition.
For the Executive Chairman Managing Director, the LTI grant, as recommended by the Board, will be submitted for approval by shareholders at the relevant Annual General Meeting, as required by the ASX Listing Rules.
Performance Period The Performance Period is the three year period 1 July to 30 June inclusive.
Performance Conditions The number of Performance Share Rights that may vest will be determined by reference to:
• Earnings Per Share (EPS) compound annual growth over the Performance Period. EPS growth will be calculated as IVE Group’s Net Profit After Tax (NPAT) divided by the undiluted weighted average shares on issue throughout the Performance Period, using the following formula:
(Benchmark 1); and
• Relative Total Shareholder Return (TSR) performance of the Company in comparison to similar companies in a peer group determined by the Board. The peer group for the FY18 offer is shown on the following page. The TSR of each company will be measured from the start of the Performance Period to the end of the Performance Period (Benchmark 2),
(collectively the Performance Conditions).
Together Benchmark 1 and Benchmark 2 comprise the total Performance Conditions but act independently relative to their specific target component of 60% and 40% of Performance Share Rights, respectively.
Re-testing There is no re-testing. Any unvested LTI after the test at the end of the Performance Period will lapse immediately.
For
per
sona
l use
onl
y

IVE Group Limited Annual Report 2018 IVE Group Limited Annual Report 201848 49
Feature Terms of the IVE Group Equity Incentive Plan
Forfeiture All Rights will lapse if the participant elects to cease employment with IVE Group prior to the Conversion Date (being the date that Performance Share Rights convert to shares).
Rights will immediately lapse if the participant is dismissed or removed from office as an employee for any reason which entitles IVE Group to dismiss the participant without notice or if the participant acts fraudulently, dishonestly or in breach of their obligations to the Company.
The only exception to the lapse of rights if for a Good Leaver reason detailed below:
• Any unvested Rights will not lapse if the participant’s employment with IVE Group ceases due to death, ill-health, total permanent disability or sale of the business in which they are employed.
• Rights for employees who cease employment due to death will vest in full upon cessation.
• Rights for other good leavers will remain on foot and will be tested against the Performance Conditions as at the Vesting Date, vesting on a pro-rata basis.
The Board has discretion to allow vesting for other reasons, such as retirement or redundancy.
Clawback The Board has broad “clawback” powers if, amongst other things, the participant has acted fraudulently or dishonestly, engaged in gross misconduct or has acted in a manner that has brought the Company into disrepute, or there is a material financial mis-statement, or the Company is required or entitled under law or company policy to reclaim remuneration from the participant, or the participant’s entitlements vest as a result of the fraud, dishonesty or breach of obligations of any other person and the Board is of the opinion that the incentives would not have otherwise vested.
TSR Peer Group for FY18 Offer
1 OPG Opus Group Limited
2 PMP PMP Limited
3 WLL Wellcom Group Limited
4 CWY Cleanaway Waste Management Limited
5 MIL Millennium Services Group Limited
6 SLM Salmat Limited
7 SPO Spotless Group Holdings Limited
8 SGN STW Communications Group Limited
9 SWM Seven West Media Limited
10 ORA Orora Limited
11 PPG Pro-Pac Packaging Limited
12 GWA GWA Group Limited
13 DCG Decmil Group Limited
14 APN APN Outdoor Group Limited
15 SIQ Smartgroup Corporation Ltd
DIRECTORS’ REPORT (CONT.)For the year ended 30 June 2018
16 MMS McMillan Shakespeare Limited
17 QMS QMS Media Limited
18 KSC K & S Corporation Limited
19 LAU Lindsay Australia Limited
20 CKF Collins Foods Limited
21 OML Ooh!Media Limited
22 PRT Prime Media Group Limited
23 SXL Southern Cross Media Group Limited
24 TRS The Reject Shop Limited
25 RCG RCG Corporation Limited
26 TGA Thorn Group Limited
27 KMD Kathmandu Holdings Limited
28 AMA AMA Group Limited
29 FWD Fleetwood Corporation Limited
30 GUD GUD Holdings Limited
31 PGH Pact Group Holding Limited
The peer group was chosen by the Board. When compiling the peer group, the Board sought to include similar companies and, in addition to their size, considered characteristics such as being a direct competitor, operating in a similar industry or sector, generating revenue in Australia only, being exposed to domestic economic conditions including consumer spending and marketing spend.
Non-Executive Director Remuneration Non-Executive Directors enter into service agreements through a letter of appointment which are not subject to a fixed term. Non-Executive Directors receive a fee for their contribution as Directors. Fees are determined with reference to the demands of the role and the responsibilities carried out by Directors. The fee setting process also takes into account market levels, the need to attract high quality Directors and the size and complexity of the Company.
Directors receive fees for their role as members of the Board and, where applicable, for additional responsibilities. Non-Executive Directors do not receive additional fees for being a Chair or member of a Board Committee. Non-Executive Directors do not receive any variable or performance-based remuneration. Where Directors are required to provide additional services, these are paid on a fixed fee basis or determined on an hourly basis depending on the nature of the service. There were no additional services provided in FY18 by Non-Executive Directors.
During FY18, the Board agreed to increase the fee paid to Non-Executive Directors from $90,000 per annum to $105,000 per annum, commencing from 1 July 2018. This is the first increase in director fees since IPO and the fees were set approximately three years ago. Since that time the size and complexity of IVE has increased considerably. In determining the increase, the Board considered the level of Non-Executive Director fees paid to comparable peers and this level was deemed to be appropriate.F
or p
erso
nal u
se o
nly

IVE Group Limited Annual Report 2018 IVE Group Limited Annual Report 201850 51
The current annual fees provided to Non-Executive Directors are shown below (inclusive of superannuation):
Chair fee Non-Executive Director fee (from 1 July 2018)
N/A as Executive Chairman $105,000
The total Non-Executive Director fee pool has a maximum value of $1 million per annum. The total amount paid to Non-Executive directors in FY18 was $360K , being 36% of the approved fee pool. There is no intent to seek approval to increase the Non-executive Director fee pool at the 2018 AGM.
Non-Executive Directors do not receive fees that are contingent on performance, shares in return for their services, retirements benefits (other than statutory superannuation) or termination benefits.
Executive Directors are not remunerated separately for acting as Directors.
Directors are not required under the Constitution or any other Board policy to hold any shares in IVE Group.
The remuneration paid to Non-Executive Directors is detailed in the tables later in this Report.
Contractual arrangements with executive KMPsRemuneration and other conditions of employment are set out in the executive KMPs employment contracts. The key elements of these employment contracts are summarised below:
Name: Geoff Selig
Title: Executive Chairman
Terms of Agreement: No fixed term – subject to termination provisions detailed below
Details: Annual remuneration includes cash salary, superannuation and non-cash benefits
Incentives – eligible to participate in short term incentive and equity remuneration plans
Termination: Termination – 12 months’ written notice (except in certain circumstances, such as where committed any breach or material neglect of the material terms of his contract of employment, or any act of serious or wilful misconduct) by Company or employee.
All payments on termination will be subject to the termination benefits cap under the Corporations Act 2001 in the absence of shareholder approval.
Post-employment – 12 months’ restraint provisions.
Name: Warwick Hay
Title: Managing Director
Terms of Agreement: No fixed term – subject to termination provisions detailed below
Details: Annual remuneration includes cash salary, superannuation and non-cash benefits
Incentives – eligible to participate in short term incentive and equity remuneration plans
Termination: Termination – 6 months’ written notice (except in certain circumstances, such as where committed any breach or material neglect of the material terms of his contract of employment, or any act of serious or wilful misconduct) by Company or employee.
All payments on termination will be subject to the termination benefits cap under the Corporations Act 2001 in the absence of shareholder approval.
Post-employment – 3 months’ restraint provisions.
DIRECTORS’ REPORT (CONT.)For the year ended 30 June 2018
Name: Darren Dunkley
Title: Chief Financial Officer
Terms of Agreement: No fixed term – subject to termination provisions detailed below
Details: Annual remuneration includes cash salary, superannuation and non-cash benefits
Incentives – eligible to participate in short term incentive and equity remuneration plans
Termination: Termination – 6 months’ written notice (except in certain circumstances, such as where committed any breach or material neglect of the material terms of his contract of employment, or any act of serious or wilful misconduct) by Company or employee.
All payments on termination will be subject to the termination benefits cap under the Corporations Act 2001 in the absence of shareholder approval.
Post-employment – 3 months’ restraint provisions.
Redundancy: 6 months’ pay in circumstance where employment is terminated due to redundancy.
Name: Matt Aitken
Title: Chief Operating Officer
Terms of Agreement: No fixed term – subject to termination provisions detailed below
Details: Annual remuneration includes cash salary, superannuation and non-cash benefits
Incentives – eligible to participate in short term incentive and equity remuneration plans
Termination: Termination – 6 months’ written notice (except in certain circumstances, such as where committed any breach or material neglect of the material terms of his contract of employment, or any act of serious or wilful misconduct) by Company or employee.
All payments on termination will be subject to the termination benefits cap under the Corporations Act 2001 in the absence of shareholder approval.
Post-employment – 3 months’ restraint provisions.
Redundancy: 6 months’ pay in circumstance where employment is terminated due to redundancy.
For
per
sona
l use
onl
y

IVE Group Limited Annual Report 2018 IVE Group Limited Annual Report 201852 53
Details of RemunerationThe table below provides remuneration prepared for on a statutory basis for directors and executive KMPs year ended 30 June 2018 (except as noted below).
Fixed Remuneration Variable Remuneration
Name
Cash salary and
feesSuper-
annuation
Non-monetary
benefitsAnnual
leave
Long service
leave
Short term
incentive
Fair value of LTI
award TotalExecutive Directors
Geoff Selig 2018 798,030 20,049 31,921 0 181,250 1,031,250
2017 622,813 19,616 57,571 0 50,000 5,284 755,284
Paul Selig1,2 2018 280,030 19,895 3,576 0 250,000 553,501
2017 51,142 4,859 56,001
Warwick Hay 2018 437,494 20,049 42,457 0 84,250 10,450 594,700
2017 389,664 19,616 30,720 0 50,000 5,284 495,284
Non-executive Directors
Gavin Bell 2018 82,192 7,808 90,000
2017 82,192 7,808 90,000
Andrew Harrison 2018 82,192 7,808 90,000
2017 82,192 7,808 90,000
Sandra Hook 2018 82,192 7,808 90,000
2017 82,192 7,808 90,000
James Todd 2018 82,192 7,808 90,000
2017 82,192 7,808 90,000
Other Executive KMP
Darren Dunkley 2018 348,340 20,049 39,493 0 64,700 7,838 480,420
2017 262,334 19,616 27,084 0 25,000 3,171 337,205
Matt Aitken 2018 422,801 20,049 43,651 0 76,960 9,405 572,866
2017 375,995 19,616 5,157 0 50,000 5,284 456,052
1 Paul Selig provided additional services to IVE Group in 2017 well beyond those usually provided by a Non-Executive Director including advice on financing and property arrangements and assisting with strategic opportunities and acquisitions. Payment relating to these additional services in 2017 was $134,004. In 2017, payments were made out of the director fee pool to Paul Selig via Caxton Property Investments Pty Ltd from 1 July 2016 to 31 March 2017 ($168,003) and from 1 April 2017 to 30 June 2017 payments were made directly to Paul Selig ($56,001). Paul Selig became an Executive Director on 1 October 2017.
2 Paul Selig is not part of the STI framework but was awarded a discretionary bonus of $250,000 in FY18.
Rights granted to executive KMPFY18
KMP Number of rights granted in FY18
Vesting conditions Grant Date Fair value at grant date
Expiry date
Warwick Hay 27,027
40,540
67,567
Relative TSR
Compound annual EPS growth over 3 years
Total
17 Nov 2017
17 Nov 2017
31,270
68,730
100,000
After vesting following release of FY20 results. Any unvested Rights expire.
Matt Aitken 24,324
36,486
60,810
Relative TSR
Compound annual EPS growth over 3 years
Total
17 Nov 2017
17 Nov 2017
28,143
61,857
90,000
After vesting following release of FY20 results. Any unvested Rights expire.
Warwick Hay 20,270
30,405
50,675
Relative TSR
Compound annual EPS growth over 3 years
Total
17 Nov 2017
17 Nov 2017
23,452
51,547
75,000
After vesting following release of FY20 results. Any unvested Rights expire.
DIRECTORS’ REPORT (CONT.)For the year ended 30 June 2018
FY17
KMP Number of rights granted in FY18
Vesting conditions Grant Date Fair value at grant date
Expiry date
Geoff Selig 13,127
19,690
32,817
Relative TSR
Compound annual EPS growth over 3 years
Total
16 Sep 2016
16 Sep 2016
15,853
34,147
50,000
After vesting following release of FY19 results. Any unvested Rights expire.
Warwick Hay 13,127
19,690
32,817
Relative TSR
Compound annual EPS growth over 3 years
Total
16 Sep 2016
16 Sep 2016
15,853
34,147
50,000
After vesting following release of FY19 results. Any unvested Rights expire.
Matt Aitken 13,127
19,690
32,817
Relative TSR
Compound annual EPS growth over 3 years
Total
16 Sep 2016
16 Sep 2016
15,853
34,147
50,000
After vesting following release of FY19 results. Any unvested Rights expire.
Warwick Hay 7,876
11,814
19,690
Relative TSR
Compound annual EPS growth over 3 years
Total
16 Sep 2016
16 Sep 2016
9,512
20,488
30,000
After vesting following release of FY19 results. Any unvested Rights expire.
Note there were no Rights or options granted in FY16.
Director and Executive KMP ShareholdingThe table below provides the number of shares in IVE Group Limited held by each Director and executive KMP during the period, including their related parties:
Shares received during the period Balance on exercise of Balance at at Performance Shares Shares 30 June 1 July 2017 Share Rights acquired disposed 2018
Executive Directors
Geoff Selig, Executive Chairman1 10,066,329 – 1,143,902 – 11,210,231
Paul Selig1 10,066,329 – 1,193,902 – 11,260,231
Warwick Hay, Managing Director 520,681 – 15,000 – 535,681
Non-executive Directors
Gavin Bell 93,429 – 29,268 – 122,697
Andrew Harrison 53,371 – 37,585 – 90,956
Sandra Hook 10,526 – 2,393 – 12,919
James Todd 86,236 – 19,600 105,836
Executive KMP
Darren Dunkley, CFO and Company Secretary 200,273 – – 152,222 48,051
Matt Aitken, Chief Operating Officer 500,681 – – 500,681 0
1 Geoff Selig and Paul Selig are each beneficiaries of the Selig Family Trust No. 5, the trustee of which holds 11,210,231 shares.
For
per
sona
l use
onl
y

IVE Group Limited Annual Report 2018 IVE Group Limited Annual Report 201854 55
DIRECTORS’ REPORT (CONT.)For the year ended 30 June 2018
Loans to directors and executivesNo loans were made to directors and executives of IVE Group including their close family and entities related to them during the year.
Shares under optionThere were no unissued ordinary shares of IVE Group under option outstanding at the date of this report.
Shares under performance rightsThere were no unissued ordinary shares of IVE Group under Rights outstanding at the date of this report.
In total there were 357,615 unvested Rights at 30 June 2018.
Shares issued on the exercise of optionsThere were no ordinary shares of IVE Group Limited issued on the exercise of options during the year ended 30 June 2018 and up to the date of this report.
This concludes the remuneration report, which has been audited.
Non-audit servicesDuring the year, KPMG, the Group’s auditor has performed certain other services in addition to its statutory duties. The Board has considered the non-audit services provided during the year by the auditor, and, in accordance with the advice received from the Audit Committee, is satisfied that the provision of those non-audit services during the year by the auditor is compatible with, and did not compromise, the auditor independence requirement of the Corporations Act 2001 (Cth) for the following reasons:
• All non-audit services are subject to corporate governance procedures adopted by the Group and have been reviewed by those charged with governance throughout the year to ensure they do not impact the integrity and objectivity of the auditor; and
• The non-audit services provided do not undermine the general principles relating to audit independence as set out in the APES 110 Code of Ethics for Professional Accountants, as they did not involve reviewing or auditing the auditor’s own work, acting in a management or decision making capacity for the Group, acting as an advocate to the Group or jointly sharing the risks and rewards.
Details of the amounts paid to the auditor of the Group, KPMG, for audit and non-audit services provided during the year are set out in note 30 of the Financial Report.
Lead auditor’s independence declarationThe Lead auditor’s independence declaration is set out on page 55 and forms part of the directors’ report for the financial year ended 30 June 2018.
Rounding offThe Group is of a kind referred to in ASIC Corporations Instrument 2016/191 dated 24 March 2016 and in accordance with that Instrument, amounts in the consolidated financial statements and directors’ report have been rounded off to the nearest thousand dollars, unless otherwise stated.
This report is made in accordance with a resolution of the directors.
Geoff Selig Director
Dated at Sydney this 27th day of August 2018
For
per
sona
l use
onl
y

IVE Group Limited Annual Report 2018 IVE Group Limited Annual Report 201856 57
FINANCIAL REPORTCONTENTS
Consolidated Financial StatementsConsolidated statement of profit or loss and other comprehensive income 57
Consolidated statement of financial position 58
Consolidated statement of changes in equity 59
Consolidated statement of cash flows 60
Notes to the Consolidated Financial Statements 1. Reporting entity 61
2. Basis of preparation 61
3. Significant accounting polices 62
4. Other income 71
5. Personnel expenses 71
6. Expenses 71
7. Financial income and finance costs 71
8. Taxes 72
9. Cash and cash equivalents 73
10. Trade and other receivables 74
11. Inventories 75
12. Property, plant and equipment 75
13. Intangible assets and goodwill 76
14. Trade and other payables 77
15. Loans and borrowings 77
16. Employee benefits 78
17. Provisions 78
18. Share-based payments 79
19. Capital 80
20. Earnings per share 81
21. Acquisitions 82
22. Operating segments 83
23. Financial risk management and financial instruments 83
24. Operating leases 88
25. Capital commitments 89
26. Related parties 89
27. Group entities 89
28. Parent entity disclosures 90
29. Subsequent events 91
30. Auditor’s remuneration 91
31. Deed of cross guarantee 91
Directors’ declaration 92
Independent auditor’s report to the shareholders of IVE Group Limited 93
In thousands of AUD Note 2018 2017
Revenue 695,361 496,873Cost of sales (356,742) (248,769)
Gross profit 338,619 248,104
Other income 4 807 3,496Production expenses (172,653) (116,380)Administrative expenses (112,521) (93,906)Other expenses (9,487) (19,124)
Results from operating activities 5, 6 44,765 22,190
Finance income 248 237Finance costs (8,152) (6,009)
Net finance costs 7 (7,904) (5,772)
Profit before tax 36,861 16,418
Income tax expense 8 (11,146) (4,309)
Profit for the year 25,715 12,109
Other comprehensive income
Items that are or may be reclassified to profit or loss
Cash flow hedges – effective portion of changes in fair value (net of tax) (1,007) 100Cash flow hedges – reclassified to profit or loss (net of tax) 759 –
Total comprehensive income for the year 25,467 12,209
Profit attributable to:Owners of the Company 25,715 12,109
Profit for the year 25,715 12,109
Total comprehensive income attributable to:Owners of the Company 25,467 12,209
Total comprehensive income for the year 25,467 12,209
Earnings per shareBasic earnings per share (dollars) 20 0.18 0.11Diluted earnings per share (dollars) 20 0.18 0.11
The notes on pages 61 to 91 are an integral part of these consolidated financial statements.
CONSOLIDATED STATEMENT OF PROFIT OR LOSS AND OTHER COMPREHENSIVE INCOMEFor the year ended 30 June 2018
For
per
sona
l use
onl
y

IVE Group Limited Annual Report 2018 IVE Group Limited Annual Report 201858 59
In thousands of AUD Note 2018 2017
AssetsCash and cash equivalents 9 22,325 23,851Trade and other receivables 10 118,282 94,785Inventories 11 47,115 46,563Prepayments 2,559 1,978Current tax receivable – 3,049Other current assets 5,226 4,490
Total current assets 195,507 174,716
Deferred tax assets 8 16,006 19,192Property, plant and equipment 12 123,681 80,540Intangible assets and goodwill 13 170,271 153,857
Total non-current assets 309,958 253,589
Total assets 505,465 428,305
LiabilitiesTrade and other payables 14 111,522 98,373Loans and borrowings 15 16,442 12,815Employee benefits 16 18,493 15,158Current tax payable 1,285 –Provisions 17 1,815 5,861
Total current liabilities 149,557 132,207
Trade and other payables 14 681 12Loans and borrowings 15 134,890 135,513Employee benefits 16 6,079 5,706Provisions 17 14,917 17,251
Total non-current liabilities 156,567 158,482
Total liabilities 306,124 290,689
Net assets 199,341 137,616
EquityShare capital 20 156,318 98,820Reserves 25 188Retained earnings 42,998 38,608
Total equity 199,341 137,616
The notes on pages 61 to 91 are an integral part of these consolidated financial statements.
CONSOLIDATED STATEMENT OF FINANCIAL POSITIONAs at 30 June 2018
Share- based Share payment Hedging Retained Total In thousands of AUD Note capital reserve reserve earnings equity
Balance at 1 July 2016 39,843 – – 41,684 81,527
Total comprehensive income for the year
Profit for the year – – – 12,109 12,109Other comprehensive income – – 100 – 100
Total comprehensive income for the year – – 100 12,109 12,209
Transactions with owners of the Company
Performance share rights 18 – 88 – – 88Issue of share capital 19 58,977 – – – 58,977Dividends to owners of the Company 19 – – – (15,185) (15,185)
Total transactions with owners of the Company 58,977 88 – (15,185) 43,880
Balance at 30 June 2017 98,820 88 100 38,608 137,616
Balance at 1 July 2017 98,820 88 100 38,608 137,616
Total comprehensive income for the year
Profit for the year – – – 25,715 25,715Other comprehensive income – – (248) – (248)
Total comprehensive income for the year – – (248) 25,715 25,467
Transactions with owners of the Company
Performance share rights 18 – 85 – – 85Issue of share capital 19 57,498 – – – 57,498Dividends to owners of the Company 19 – – – (21,325) (21,325)
Total transactions with owners of the Company 57,498 85 – (21,325) 36,258
Balance at 30 June 2018 156,318 173 (148) 42,998 199,341
The notes on pages 61 to 91 are an integral part of these consolidated financial statements.
CONSOLIDATED STATEMENT OF CHANGES IN EQUITYFor the year ended 30 June 2018
For
per
sona
l use
onl
y
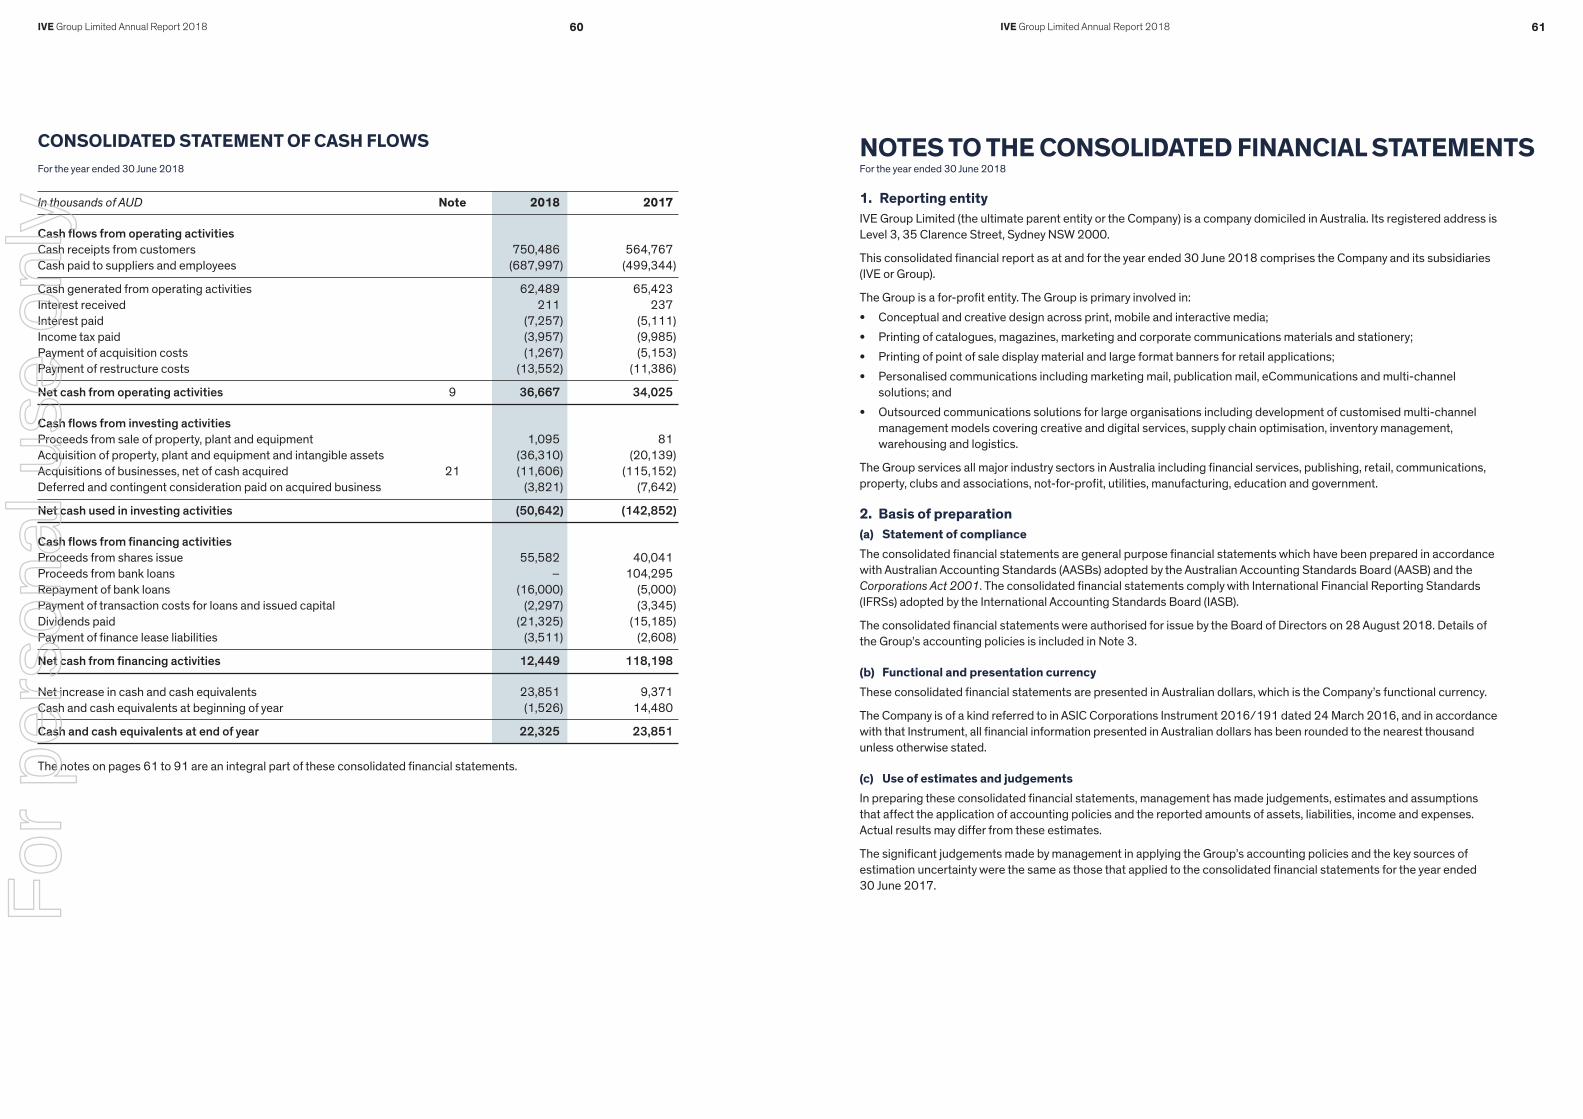
IVE Group Limited Annual Report 2018 IVE Group Limited Annual Report 201860 61
In thousands of AUD Note 2018 2017
Cash flows from operating activitiesCash receipts from customers 750,486 564,767Cash paid to suppliers and employees (687,997) (499,344)
Cash generated from operating activities 62,489 65,423Interest received 211 237Interest paid (7,257) (5,111)Income tax paid (3,957) (9,985)Payment of acquisition costs (1,267) (5,153)Payment of restructure costs (13,552) (11,386)
Net cash from operating activities 9 36,667 34,025
Cash flows from investing activitiesProceeds from sale of property, plant and equipment 1,095 81Acquisition of property, plant and equipment and intangible assets (36,310) (20,139)Acquisitions of businesses, net of cash acquired 21 (11,606) (115,152)Deferred and contingent consideration paid on acquired business (3,821) (7,642)
Net cash used in investing activities (50,642) (142,852)
Cash flows from financing activitiesProceeds from shares issue 55,582 40,041Proceeds from bank loans – 104,295Repayment of bank loans (16,000) (5,000)Payment of transaction costs for loans and issued capital (2,297) (3,345)Dividends paid (21,325) (15,185)Payment of finance lease liabilities (3,511) (2,608)
Net cash from financing activities 12,449 118,198
Net increase in cash and cash equivalents 23,851 9,371Cash and cash equivalents at beginning of year (1,526) 14,480
Cash and cash equivalents at end of year 22,325 23,851
The notes on pages 61 to 91 are an integral part of these consolidated financial statements.
CONSOLIDATED STATEMENT OF CASH FLOWSFor the year ended 30 June 2018
1. Reporting entityIVE Group Limited (the ultimate parent entity or the Company) is a company domiciled in Australia. Its registered address is Level 3, 35 Clarence Street, Sydney NSW 2000.
This consolidated financial report as at and for the year ended 30 June 2018 comprises the Company and its subsidiaries (IVE or Group).
The Group is a for-profit entity. The Group is primary involved in:
• Conceptual and creative design across print, mobile and interactive media;
• Printing of catalogues, magazines, marketing and corporate communications materials and stationery;
• Printing of point of sale display material and large format banners for retail applications;
• Personalised communications including marketing mail, publication mail, eCommunications and multi-channel solutions; and
• Outsourced communications solutions for large organisations including development of customised multi-channel management models covering creative and digital services, supply chain optimisation, inventory management, warehousing and logistics.
The Group services all major industry sectors in Australia including financial services, publishing, retail, communications, property, clubs and associations, not-for-profit, utilities, manufacturing, education and government.
2. Basis of preparation(a) Statement of complianceThe consolidated financial statements are general purpose financial statements which have been prepared in accordance with Australian Accounting Standards (AASBs) adopted by the Australian Accounting Standards Board (AASB) and the Corporations Act 2001. The consolidated financial statements comply with International Financial Reporting Standards (IFRSs) adopted by the International Accounting Standards Board (IASB).
The consolidated financial statements were authorised for issue by the Board of Directors on 28 August 2018. Details of the Group’s accounting policies is included in Note 3.
(b) Functional and presentation currencyThese consolidated financial statements are presented in Australian dollars, which is the Company’s functional currency.
The Company is of a kind referred to in ASIC Corporations Instrument 2016/191 dated 24 March 2016, and in accordance with that Instrument, all financial information presented in Australian dollars has been rounded to the nearest thousand unless otherwise stated.
(c) Use of estimates and judgementsIn preparing these consolidated financial statements, management has made judgements, estimates and assumptions that affect the application of accounting policies and the reported amounts of assets, liabilities, income and expenses. Actual results may differ from these estimates.
The significant judgements made by management in applying the Group’s accounting policies and the key sources of estimation uncertainty were the same as those that applied to the consolidated financial statements for the year ended 30 June 2017.
NOTES TO THE CONSOLIDATED FINANCIAL STATEMENTSFor the year ended 30 June 2018
For
per
sona
l use
onl
y

IVE Group Limited Annual Report 2018 IVE Group Limited Annual Report 201862 63
2. Basis of preparation (cont.)(d) Use of estimates and judgements (cont.)Estimates and underlying assumptions are reviewed on an ongoing basis. Revisions to accounting estimates are recognised prospectively.
(i) Judgements
Information about judgements made in applying the Group’s accounting policies that have the most significant effects on the amounts recognised in the consolidated financial statements is included in the following notes:
• Note 3(d) & (e) – estimation of useful lives of assets;
• Note 3(j) – provisions; and
• Note 23 – Level 3 fair value of contingent consideration, interest rate swaps and forward exchange contracts.
(ii) Assumptions and estimation uncertainties
Information about assumptions and estimation uncertainties that have a significant risk of resulting in a material adjustment in the year ending 30 June 2018 is included in the following notes:
• Note 3(h)(ii) & 13 – impairment testing for cash generating units containing goodwill; and
• Note 21 – acquisitions: fair value measured on a provisional basis.
Measurement of fair values
When measuring the fair value of an asset or a liability, the group uses market observable data if possible. Fair values are categorised into different levels in a fair value hierarchy based on the inputs used in the valuation techniques as follows:
• Level 1: quoted prices (unadjusted) in active markets for identical assets or liabilities.
• Level 2: inputs other than quoted prices included within Level 1 that are observable for the asset or liability, either directly (i.e., as prices) or indirectly (i.e., derived from prices).
• Level 3: inputs for the asset or liability that are not based on observable market data (unobservable inputs).
3. Significant accounting policiesThe accounting policies set out below have been applied consistently during the period presented in these consolidated financial statements, and have been applied consistently by all entities in the Group.
(a) Basis of consolidation(i) Business combinations
The consideration transferred in the acquisition is generally measured at fair value, as are the identifiable net assets acquired. Any goodwill that arises is tested annually for impairment. Any gain on a bargain purchase is recognised in profit or loss immediately. Transaction costs are expensed as incurred, except those related to the issue of debt or equity securities.
The consideration transferred does not include amounts related to the settlement of pre-exiting relationships. Such amounts are generally recognised in profit or loss.
Any contingent consideration is measured at fair value at the date of acquisition, with subsequent changes in the fair value of the contingent consideration recognised in profit or loss.
(ii) Subsidiaries
Subsidiaries are entities controlled by the Group. The Group controls an entity when it is exposed to, or has rights to, variable returns from its involvement with the entity and has the ability to affect those returns through its power over the entity. The financial statements of subsidiaries are included in the consolidated financial statements from the date on which control commences until the date on which control ceases.
NOTES TO THE CONSOLIDATED FINANCIAL STATEMENTS (CONT.)For the year ended 30 June 2018
3. Significant accounting policies (cont.)(a) Basis of consolidation (cont.)(ii) Subsidiaries (cont.)
Transactions eliminated on consolidation
Intra-group balances and transactions, and any unrealised income and expenses arising from intra-group transactions, are eliminated in preparing the consolidated financial statements.
(b) Foreign currencyForeign currency transactions
Transactions in foreign currencies are translated to the functional currency of the Group (Australian dollars) at exchange rates at the dates of the transactions. Monetary assets and liabilities denominated in foreign currencies are translated to the functional currency at the exchange rate at the reporting date.
Foreign currency differences arising on retranslation are recognised in profit or loss.
(c) Financial instruments(i) Non-derivative financial assets
The Group initially recognises receivables on the date that they are originated. All other financial assets are recognised initially on the date at which the Group becomes a party to the contractual provisions of the instrument.
The Group derecognises a financial asset when the contractual rights to the cash flows from the asset expire, or it transfers the rights to receive the contractual cash flows on the financial asset in a transaction in which substantially all the risks and rewards of ownership of the financial asset are transferred. Any interest in transferred financial assets that is created or retained by the Group is recognised as a separate asset or liability.
The Group has the following categories of non-derivative financial assets: cash and cash equivalents, and trade and other receivables.
Cash and cash equivalents
Cash and cash equivalents comprise cash balances and call deposits with original maturities of three months or less from the acquisition date that are subject to an insignificant risk of changes in their fair value, and are used by the Group in the management of its short-term commitments.
Trade and other receivables
Trade and other receivables are financial assets with fixed or determinable payments that are not quoted in an active market. Such assets are recognised initially at fair value plus any directly attributable transaction costs. Subsequent to initial recognition trade and other receivables are measured at amortised cost using the effective interest method, less any impairment losses.
(ii) Non-derivative financial liabilities
Financial liabilities are recognised initially on the date at which the Group becomes a party to the contractual provisions of the instrument.
The Group derecognises a financial liability when its contractual obligations are discharged, cancelled or expire.
The Group classifies non-derivative financial liabilities into the other financial liabilities category. Such financial liabilities are recognised initially at fair value plus any directly attributable transaction costs. Subsequent to initial recognition, these financial liabilities are measured at amortised cost using the effective interest method.
Other financial liabilities comprise finance lease liabilities, bank loan, and trade and other payables.
For
per
sona
l use
onl
y

IVE Group Limited Annual Report 2018 IVE Group Limited Annual Report 201864 65
3. Significant accounting policies (cont.)(c) Financial instruments (cont.)(iii) Share capital
Ordinary shares
Ordinary shares are classified as equity. Incremental costs directly attributable to the issue of ordinary shares are recognised as a deduction from equity, net of any tax effects.
(iv) Derivative financial instruments and hedge accounting
The Group holds derivative financial instruments to hedge its foreign currency and interest rate risk exposures. Embedded derivatives are separated from the host contract and accounted for separately if certain criteria are met.
Derivatives are recognised initially at fair value; any directly attributable transaction costs are recognised in profit or loss as they are incurred. Subsequent to initial recognition, derivatives are measured at fair value, and changes therein are generally recognised in profit or loss.
Cash flow hedges
When a derivative is designated as a cash flow hedging instrument, the effective portion of changes in the fair value of the derivative is recognised in other comprehensive income (“OCI”) and accumulated in the hedging reserve. Any ineffective portion of changes in the fair value of the derivative is recognised immediately in profit or loss.
The amount accumulated in equity is retained in OCI and reclassified to profit or loss in the same period or periods during which the hedged item affects profit or loss.
If the hedging instrument no longer meets the criteria for hedge accounting, expires or is sold, terminated or exercised, or the designation is revoked, then hedge accounting is discontinued prospectively. If the forecast transaction is no longer expected to occur, then the amount accumulated in equity is reclassified to profit or loss.
(d) Property, plant and equipment(i) Recognition and measurement
Items of property, plant and equipment are measured at cost less accumulated depreciation and accumulated impairment losses.
Cost includes expenditure that is directly attributable to the acquisition of the asset. Purchased software that is integral to the functionality of the related equipment is capitalised as part of that equipment.
When parts of an item of property, plant and equipment have different useful lives, they are accounted for as separate items of property, plant and equipment.
Any gains and losses on disposal of an item of property, plant and equipment (calculated as the difference between the net proceeds from disposal and the carrying amount of the item) are recognised in profit or loss.
(ii) Subsequent costs
Subsequent expenditure is capitalised only when it is probable that the future economic benefits associated with the expenditure will flow to the Group. Ongoing repairs and maintenance are expensed as incurred.
(iii) Depreciation
Items of property, plant and equipment are depreciated from the date that they are installed and are ready for use, or in respect of internally constructed assets, from the date that the asset is completed and ready for use.
Depreciation is calculated to write off the cost of property, plant and equipment less their estimated residual values using the straight-line basis over their estimated useful lives. Depreciation is generally recognised in profit or loss, unless the amount is included in the carrying amount of another asset. Leased assets are depreciated over the shorter of the lease term and their useful lives unless it is reasonably certain that the Group will obtain ownership by the end of the lease term.
NOTES TO THE CONSOLIDATED FINANCIAL STATEMENTS (CONT.)For the year ended 30 June 2018
3. Significant accounting policies (cont.)(d) Property, plant and equipment (cont.)(iii) Depreciation (cont.)
The estimated useful lives for the current year of significant items of property, plant and equipment are as follows:
• Leasehold improvements shorter of lease term and life of asset
• plant and equipment 3–20 years
• fixtures and fittings 5–10 years
Depreciation methods, useful lives and residual values are reviewed at each reporting date and adjusted if appropriate.
(e) Intangible assets and goodwill(i) Goodwill
Goodwill arising on the acquisition of subsidiaries is measured at cost less accumulated impairment losses.
(ii) Other intangible assets
Intangible assets that are acquired by the Group and have finite useful lives are measured at cost less accumulated amortisation and accumulated impairment losses.
(iii) Subsequent expenditure
Subsequent expenditure is capitalised only when it increases the future economic benefits embodied in the specific asset to which it relates. All other expenditure, including expenditure on internally generated goodwill and brands, is recognised in profit or loss as incurred.
(iv) Amortisation
Amortisation is calculated to write off the cost of intangible assets less their estimated residual values using the straight-line method over their estimated useful lives, and is generally recognised in profit or loss. Goodwill is not amortised.
The estimated useful lives are as follows:
• computer software 3 years
• customer relationships 5–9 years
Amortisation methods, useful lives and residual values are reviewed at each reporting date and adjusted if appropriate.
(f) Leased assetsLeases in terms of which the Group assumes substantially all the risks and rewards of ownership are classified as finance leases. Upon initial recognition of finance leases the leased asset is measured at an amount equal to the lower of its fair value and the present value of the minimum lease payments. Subsequent to initial recognition, the asset is accounted for in accordance with the accounting policy applicable to that asset.
Other leases are classified as operating leases and are not recognised in the Group’s consolidated statement of financial position.
(g) InventoriesInventories are measured at the lower of cost and net realisable value. The cost of inventories is based on the first-in, first-out principle. In the case of manufactured inventories and work in progress, cost includes an appropriate share of production overheads based on normal operating capacity.
For
per
sona
l use
onl
y

IVE Group Limited Annual Report 2018 IVE Group Limited Annual Report 201866 67
3. Significant accounting policies (cont.)(h) Impairment(i) Non-derivative financial assets
Financial assets not classified as at fair value through profit or loss are assessed at each reporting date to determine whether there is objective evidence of impairment.
Objective evidence that financial assets are impaired can include default or delinquency by a debtor, restructuring of an amount due to the Group on terms that the Group would not consider otherwise, indications that a debtor or issuer will enter bankruptcy, adverse changes in the payment status of borrowers or issuers in the Group or economic conditions that correlate with defaults.
Financial assets measured at amortised cost
The Group considers evidence of impairment for financial assets measured at amortised cost at both a specific asset and collective level. All individually significant assets are assessed for specific impairment. Those found not to be specifically impaired are then collectively assessed for any impairment that has been incurred but not yet identified. Assets that are not individually significant are collectively assessed for impairment by grouping together assets with similar risk characteristics.
In assessing collective impairment the Group uses historical trends of the probability of default, timing of recoveries and the amount of loss incurred, adjusted for management’s judgement as to whether current economic and credit conditions are such that the actual losses are likely to be greater or less than suggested by historical trends.
An impairment loss in respect of a financial asset measured at amortised cost is calculated as the difference between its carrying amount and the present value of the estimated future cash flows discounted at the asset’s original effective interest rate. Losses are recognised in profit or loss and reflected in an allowance account against receivables. Interest on the impaired asset continues to be recognised through the unwinding of the discount.
When an event occurring after the impairment was recognised causes the amount of impairment loss to decrease, the decrease in impairment loss is reversed through profit or loss.
(ii) Non-financial assets
The carrying amounts of the Group’s non-financial assets, other than inventories and deferred tax assets, are reviewed at each reporting date to determine whether there is any indication of impairment. If any such indication exists, then the asset’s recoverable amount is estimated. Goodwill is tested annually for impairment
For impairment testing, assets are grouped together into the smallest group of assets that generates cash inflows from continuing use that are largely independent of the cash inflows of other assets or cash-generating unit (CGU). Goodwill arising from a business combination is allocated to CGUs or groups of CGUs that are expected to benefit from the synergies of the combination.
The recoverable amount of an asset or CGU is the greater of its value in use and its fair value less costs to sell. In assessing value in use, the estimated future cash flows are discounted to their present value using a post-tax discount rate that reflects current market assessments of the time value of money and the risks specific to the asset.
An impairment loss is recognised if the carrying amount of an asset or CGU exceeds its estimated recoverable amount.
Impairment losses are recognised in profit or loss. Impairment losses recognised in respect of CGUs are allocated first to reduce the carrying amount of any goodwill allocated to the CGU (group of CGUs), and then to reduce the carrying amounts of the other assets in the CGU (group of CGUs) on a pro rata basis.
An impairment loss in respect of goodwill is not reversed. For other assets, an impairment loss is reversed only to the extent that the asset’s carrying amount does not exceed the carrying amount that would have been determined, net of depreciation or amortisation, if no impairment loss had been recognised.
NOTES TO THE CONSOLIDATED FINANCIAL STATEMENTS (CONT.)For the year ended 30 June 2018
3. Significant accounting policies (cont.)(i) Employee benefits(i) Defined contribution plans
A defined contribution plan is a post-employment benefit plan under which an entity pays fixed contributions into a separate entity and will have no legal or constructive obligation to pay further amounts. Obligations for contributions to defined contribution pension plans are recognised as an employee benefit expense in profit or loss in the periods during which services are rendered by employees.
(ii) Other long-term employee benefits
The Group’s net obligation in respect of long-term employee benefits is the amount of future benefit that employees have earned in return for their service in the current and prior periods. That benefit is discounted to determine its present value. Remeasurements are recognised in profit or loss in the period in which they arise.
(iii) Short-term employee benefits
Short-term employee benefits are expensed as the related service is provided. A liability is recognised for the amount expected to be paid if the Group has a present legal or constructive obligation to pay this amount as a result of past service provided by the employee and the obligation can be estimated reliably.
(iv) Share-based payment transactions
The grant-date fair value of equity-settled share-based payment awards granted to employees is generally recognised as an expense, with a corresponding increase in equity, over the vesting period of the awards. The amount recognised as an expense is adjusted to reflect the number of awards for which the related service and non-market performance conditions are expected to be met, such that the amount ultimately recognised is based on the number of awards that meet the related service and non-market performance conditions at the vesting date. For share-based payment awards with non-vesting conditions, the grant-date fair value of the share-based payment is measured to reflect such conditions and there is no true-up for differences between expected and actual outcomes.
(j) ProvisionsA provision is recognised if, as a result of a past event, the Group has a present legal or constructive obligation that can be estimated reliably, and it is probable that an outflow of economic benefits will be required to settle the obligation. Provisions are determined by discounting the expected future cash flows at a pre-tax rate that reflects current market assessments of the time value of money and the risks specific to the liability. The unwinding of the discount is recognised as finance cost.
(i) Restructuring
A provision for restructuring is recognised when the Group has approved a detailed and formal restructuring plan, and the restructuring either has commenced or has been announced publicly. Future operating losses are not provided for.
(ii) Make good provision
A make good provision is recognised when the Group enters into a lease contract that requires the property to be returned to the lessor in its original condition. The provision is based on the expected future cost of the refurbishment discounted to reflect current market assessments.F
or p
erso
nal u
se o
nly

IVE Group Limited Annual Report 2018 IVE Group Limited Annual Report 201868 69
NOTES TO THE CONSOLIDATED FINANCIAL STATEMENTS (CONT.)For the year ended 30 June 2018
3. Significant accounting policies (cont.)(k) Revenue(i) Sales
Revenue from the sale of goods is measured at the fair value of the consideration received or receivable, net of returns, trade discounts and volume rebates. Revenue is recognised when the significant risks and rewards of ownership have been transferred to the customer, recovery of the consideration is probable, the associated costs and possible return of goods can be estimated reliably, there is no continuing management involvement with the goods, and the amount of revenue can be measured reliably.
(ii) Rendering of services
The Group is involved in a range of services relating to print, communications, creative and digital services, supply chain optimisation, inventory management, warehousing and logistics. If the services under a single arrangement are rendered in different reporting periods, then the consideration is allocated on a relative fair value basis between the different services.
The Group recognises revenue from rendering of services in proportion to the stage of completion of the transaction at the reporting date. The stage of completion is assessed based on surveys of work performed.
(l) Lease paymentsPayments made under operating leases are recognised in profit or loss on a straight-line basis over the term of the lease. Lease incentives received are recognised as an integral part of the total lease expense, over the term of the lease.
Minimum lease payments made under finance leases are apportioned between the finance expense and the reduction of the outstanding liability. The finance expense is allocated to each period during the lease term so as to produce a constant periodic rate of interest on the remaining balance of the liability.
Contingent lease payments are accounted for by revising the minimum lease payments over the remaining term of the lease when the lease adjustment is confirmed.
(m) Finance income and finance costsFinance income comprises interest income on funds invested and foreign exchange gains. Interest income is recognised as it accrues in profit or loss, using the effective interest method.
Finance costs comprise interest expense on borrowings. Borrowing costs that are not directly attributable to the acquisition, construction or production of a qualifying asset are recognised in profit or loss using the effective interest method.
Foreign currency gains and losses are reported on a net basis as either finance income or finance cost depending on whether foreign currency movements are in a net gain or net loss position.
(n) Income taxIncome Tax expense comprises current and deferred tax. Current and deferred tax are recognised in profit or loss except to the extent that it relates to items recognised directly in equity or in other comprehensive income.
(i) Current tax
Current tax is the expected tax payable or receivable on the taxable income or loss for the year, using tax rates enacted or substantively enacted at the reporting date, and any adjustment to tax payable in respect of previous years.
(ii) Deferred tax
Deferred tax is recognised in respect of temporary differences between the carrying amounts of assets and liabilities for financial reporting purposes and the amounts used for taxation purposes. Deferred tax is not recognised for:• Temporary differences on the initial recognition of assets or liabilities in a transaction that is not a business combination
and that affects neither accounting nor taxable profit or loss; or• Temporary differences related to investments in associates to the extent that the Company is able to control the timing
of the reversal of the temporary differences and it is probable that they will not reverse in the foreseeable future, and• Taxable temporary differences arising on the initial recognition of goodwill.
The measurement of deferred tax reflects the tax consequences that would follow the manner in which the Group expects, at the end of the reporting period, to recover or settle the carrying amount of its assets and liabilities.
3. Significant accounting policies (cont.)(n) Income tax (cont.)(ii) Deferred tax (cont.)
Deferred tax is measured at the tax rates that are expected to be applied to temporary differences when they reverse, using tax rates enacted or substantively enacted at the reporting date.
Deferred tax assets and liabilities are offset if there is a legally enforceable right to offset current tax liabilities and assets, and they relate to taxes levied by the same tax authority on the same taxable entity, or on different tax entities, but they intend to settle current tax liabilities and assets on a net basis or their tax assets and liabilities will be realised simultaneously.
A deferred tax asset is recognised for unused tax losses, tax credits and deductible temporary differences, to the extent that it is probable that future taxable profits will be available against which they can be utilised. Deferred tax assets are reviewed at each reporting date and are reduced to the extent that it is no longer probable that the related tax benefit will be realised.
(iii) Tax exposures
In determining the amount of current and deferred tax the Group takes into account the impact of uncertain tax positions and whether additional taxes and interest may be due. This assessment relies on estimates and assumptions and may involve a series of judgements about future events. New information may become available that causes the Group to change its judgement regarding the adequacy of existing tax liabilities; such changes to tax liabilities will impact tax expense in the period that such a determination is made.
(iv) Tax consolidation
IVE Group Limited and its wholly owned Australian controlled entities formed a tax consolidated group on 16 December 2015. As a consequence, these entities are taxed as a single entity and the deferred tax asset and liabilities of these entities are offset in the consolidated financial statements.
(o) Goods and services tax (GST)Revenue, expenses and assets are recognised net of the amount of GST, except where the amount of GST incurred is not recoverable from the taxation authority. In these circumstances, the GST is recognised as part of the cost of acquisition of the asset or as part of an item of expense. Receivables and payables are shown inclusive of GST.
The net amount of GST recoverable from, or payable to, the taxation authority is included as part of receivables or payables in the statement of financial position.
Cash flows are presented on a gross basis. The GST components of cash flows arising from investing or financing activities, which is recoverable from, or payable to, the taxation authority is classified as operating cash flows.
(p) Earnings per shareThe Group presents basic and diluted earnings per share data for its ordinary shares. Basic earnings per share is calculated by dividing the profit or loss attributable to ordinary shareholders of the Company by the weighted average number of ordinary shares outstanding during the year, adjusted for own shares held. Diluted earnings per share is determined by adjusting the profit or loss attributable to ordinary shareholders and the weighted average number of ordinary shares outstanding, adjusted for own shares held, for the effects of all dilutive potential ordinary shares, which comprise convertible notes and share options granted to employees.
(q) Segment reportingOperating segments are reported in a manner consistent with the internal reporting provided to the chief operating decision maker. It has been determined the Board of Directors is the chief operating decision maker, as they are ultimately responsible for allocating resources and assessing performance.
For
per
sona
l use
onl
y

IVE Group Limited Annual Report 2018 IVE Group Limited Annual Report 201870 71
3. Significant accounting policies (cont.)(r) New standards and interpretations not yet adoptedA number of new standards, amendments to standards and interpretations are effective for annual periods beginning after 1 July 2018, and have not been applied in preparing these financial statements. Those which may be relevant to the Group and its financial impact are set out below.
AASB 9 Financial Instruments (2014)
AASB 9, approved in December 2014, replaces the existing guidance in AASB 139 Financial Instruments: Recognition and Measurement. AASB 9 includes revised guidance on the classification and measurement of financial instruments, including a new expected credit loss model for calculating impairment on financial assets, and the new general hedge accounting requirements. It also carries forward the guidance on recognition and derecognition of financial instruments from AASB 139. AASB 9 is effective for annual reporting periods beginning on or after 1 January 2018.
The Group has assessed the requirements of the new standard. The only financial impact affecting the Group will be the implementation of the new expected credit loss (ECL) model for calculating the allowance for impairment in respect of receivables. In calculating the ECL the Group has reviewed its historical bad debts experience. Based on this the Group will increase as at 1 July 2018 its allowance for impairment in respect of receivables and adjust retained earnings. The Group expects the adjustment amount to be immaterial.
AASB 15 Revenue from Contracts with Customers
AASB 15 establishes a comprehensive framework for determining whether, how much and when revenue is recognised. It replaces existing revenue recognition guidance, including AASB 118 Revenue, AASB 111 Construction Contracts and IFRIC 13 Customer Loyalty Programmes. AASB 15 is effective for annual reporting periods beginning on or after 1 January 2018.
The Group has applied the requirements of the standard to customer contracts with similar characteristics. The following are key characteristics within its customer contracts that the Group believes affects AASB 15: identification of goods and services to be delivered, price, variable consideration (e.g. discounts, rebates, sign-on fees, incentives, etc.), any materials supplied by the customer, payment terms, extended warranty, and right of payment for work completed to date. The Group has applied the following steps in assessing the requirements of the new standard:
• Identification of the customer contract
• Identification of the performance obligation(s)
• Determining the transaction price
• Allocating the transaction price to the performance obligation(s)
• Recognising the revenue as (or when) the performance obligation is completed.
The Group has determined that there is no financial impact. The current recognition of revenue already takes into consideration variable consideration such as discounts, rebates, incentives, etc. Under new standard, the Group’s revenue from goods sold does not satisfy the criteria for recognition of revenue over time; hence, the Group will continue to recognise revenue at a point in time when the goods are delivered to the customer.
Separately, the Group’s lesser revenue from services provided also continues to meet the criteria for recognition over time.
AASB 16 Leases
Under this Standard, there will no longer be a distinction between operating and finance leases. Instead, there will be one treatment and a requirement to recognise an asset and a lease liability for all leases. The effective date is for annual reporting periods beginning on or after 1 January 2019.
The Group is currently assessing the financial impact of AASB 16.
NOTES TO THE CONSOLIDATED FINANCIAL STATEMENTS (CONT.)For the year ended 30 June 2018
3. Significant accounting policies (cont.)(r) New standards and interpretations not yet adopted (cont.)Other standards
The following amended standards and interpretations are not expected to have a significant impact on the Group’s consolidated financial statements:
• Disclosure Initiative (Amendments to IAS 7)
• Recognition of Deferred Tax Assets for Unrealised Losses (Amendments to IAS 12)
• Annual Improvements to IFRSs 2014–2016 Cycle – various standards (Amendments to IFRS 12).
4. Other income
In thousands of AUD 2018 2017
Other income* 807 3,496
807 3,496
* Includes reversal of contingent consideration (net) – refer to Note 23.
5. Personnel expenses
In thousands of AUD 2018 20176
Wages and salaries 183,391 138,432Contributions to defined contribution plans 12,560 10,353Share-based payment expense 212 88
196,163 148,873
6. ExpensesIncluded in the consolidated statement of profit or loss and other comprehensive income:
In thousands of AUD 2018 2017
Depreciation and amortisation 18,874 13,777Acquisition costs 1,039 5,911Restructuring costs 8,475 13,350
7. Finance income and finance costs
In thousands of AUD 2018 2017
Interest income 211 237 Net foreign exchange gain 37 –
Finance income 248 237
Interest expense (8,152) (5,978)Net foreign exchange losses – (31)
Finance costs (8,152) (6,009)
Net finance costs (7,904) (5,772)
For
per
sona
l use
onl
y

IVE Group Limited Annual Report 2018 IVE Group Limited Annual Report 201872 73
8. Taxes
In thousands of AUD 2018 2017
Current tax expenseCurrent year 7,796 3,023Changes in estimates related to prior years (43) 434
7,753 3,457
Deferred tax expenseOrigination and reversal of temporary differences 3,393 852
Total tax expense 11,146 4,309
Numerical reconciliation between tax expense and pre-tax accounting profit
In thousands of AUD 2018 2017
Profit before tax 36,861 16,418Tax using the Company’s domestic tax rate of 30% 11,058 4,925(Non-assessable income)/non-deductible expenses – net 73 (545)Previously unrecognised deductible temporary differences 43 (495)Changes in estimates related to prior years (43) 434Other items (net) 15 (10)
11,146 4,309
Recognised deferred tax assets and liabilitiesDeferred tax assets and liabilities are attributable to the following:
Assets Liabilities Net
In thousands of AUD 2018 2017 2018 2017 2018 2017
Property, plant and equipment 4,011 6,630 – – 4,011 6,630Inventories – – (532) (19) (532) (19)Intangible assets – – (6,037) (6,275) (6,037) (6,275)Employee benefits 9,108 6,906 – – 9,108 6,906Provisions 5,289 7,775 – – 5,289 7,775Other items 4,167 4,204 – (29) 4,167 4,175
Tax assets/(liabilities) 22,575 25,515 (6,569) (6,323) 16,006 19,192Set off of tax (6,569) (6,323) – 6,323 – –
Net deferred tax assets 16,006 19,192 – – – 19,192
NOTES TO THE CONSOLIDATED FINANCIAL STATEMENTS (CONT.)For the year ended 30 June 2018
8. Taxes (cont.)Movement in temporary differences during the year
Acquisition Balance through Recognised Balance 2018 1 July business Recognised in profit 30 June In thousands of AUD 2017 Combination in equity or loss 2018
Property, plant and equipment 6,630 (989) – (1,630) 4,011
Inventories (19) – – (513) (532)
Intangible assets (6,275) (840) – 1,078 (6,037)
Employee benefits 6,906 1,007 – 1,195 9,108
Provisions 7,775 236 – (2,722) 5,289
Other items 4,175 – 793 (801) 4,167
19,192 (586) 793 (3,393) 16,006
Acquisition Balance through Recognised Balance 2017 1 July business Recognised in profit 30 June In thousands of AUD 2016 Combination* in equity or loss 2017
Property, plant and equipment 9,404 (1,071) – (1,703) 6,630
Inventories (506) 792 – (305) (19)
Intangible assets (2,739) (4,332) – 796 (6,275)
Employee benefits 5,519 1,715 – (328) 6,906
Provisions 2,516 5,063 – 196 7,775
Other items 3,015 126 542 492 4,175
17,209 2,293 542 (852) 19,192
* The movement includes recognition of deferred tax on acquisitions made in the previous reporting period. These adjustments have been made within twelve months since the acquisition date.
9. Cash and cash equivalents
In thousands of AUD 2018 2017
Bank balances 22,314 23,843Petty cash 11 8
Cash and cash equivalents in the statement of cash flows 22,325 23,851
For
per
sona
l use
onl
y

IVE Group Limited Annual Report 2018 IVE Group Limited Annual Report 201874 75
9. Cash and cash equivalents (cont.)Reconciliation of cash flows from operating activities
In thousands of AUD 2018 2017
Profit for the year 25,715 12,109
Non-cash items Depreciation, amortisation and impairment 18,874 13,777 Share based payment expense 212 88 Contingent consideration reduced (704) (2,949) Other income – (501) Interest expense 895 867 Acquisition costs (228) 758 Restructuring costs – 3,992 Income tax expense 11,146 4,309
Cash items Net gain on disposal of property, plant and equipment (6) –
55,904 32,450Change in trade and other receivables (14,514) 18,161Change in inventories 47 (10,801)Change in current assets 486 584Change in prepayment (111) 690Change in trade and other payables 5,575 7,980Change in provisions and employee benefits (6,763) (5,054)
Cash generated from operating activities 40,624 44,010
Income tax paid (3,957) (9,985)
Net cash from operating activities 36,667 34,025
10. Trade and other receivables
In thousands of AUD 2018 2017
CurrentTrade receivables 115,367 92,712Allowance for impairment (677) (704)
114,690 92,008
Forward exchange contracts used for hedging 655 397Other receivables 2,937 2,380
118,282 94,785
NOTES TO THE CONSOLIDATED FINANCIAL STATEMENTS (CONT.)For the year ended 30 June 2018
11. Inventories
In thousands of AUD 2018 2017
Finished goods 3,135 2,421Work in progress 8,598 7,502Raw materials 36,989 39,677
48,722 49,600
Allowance for inventory obsolescence (1,607) (3,037)
47,115 46,563
During the year, raw materials, consumables and changes in finished goods and work in progress recognised as cost of sales amounted to $356,742 thousand (2017: $248,769 thousand).
The reduction in allowance for inventory obsolescence of $1,188 thousand in stock write offs, sale of stock at loss, and costs associated in moving excess/older stock relates to the Franklin WEB and AIW acquisitions.
12. Property, plant and equipment
Leasehold Plant and Fixtures In thousands of AUD improvements equipment and fittings Total
CostBalance at 1 July 2016 6,292 61,863 1,044 69,199Acquisitions through business combinations 372 26,812 – 27,184Additions 1,910 19,087 547 21,544Disposals (1,084) (1,875) (236) (3,195)
Balance at 30 June 2017 7,490 105,887 1,355 114,732
Balance at 1 July 2017 7,490 105,887 1,335 114,732Acquisitions through business combinations – 3,502 – 3,502Additions 7,106 47,206 277 54,589Disposals – (1,381) (24) (1,405)
Balance at 30 June 2018 14,596 155,214 1,608 171,418
Depreciation and impairment lossesBalance at 1 July 2016 2,474 24,508 510 27,492Depreciation for the year 858 8,804 150 9,812Disposals (1,084) (1,801) (227) (3,112)
Balance at 30 June 2017 2,248 31,511 433 34,192
Balance at 1 July 2017 2,248 31,511 433 34,192Depreciation for the year 1,235 12,443 194 13,872Disposals – (305) (22) (327)
Balance at 30 June 2018 3,483 43,649 605 47,737
Carrying amountsAt 1 July 2017 5,242 74,376 922 80,540
At 30 June 2018 11,113 111,565 1,003 123,681
For
per
sona
l use
onl
y

IVE Group Limited Annual Report 2018 IVE Group Limited Annual Report 201876 77
12. Property, plant and equipment (cont.)Leased plant and machineryThe Group leases production equipment under a number of finance lease agreements. Some leases provide the Group with the option to purchase the equipment at a beneficial price. At 30 June 2018 the net carrying amount of leased assets was $17,621 thousand (2017: $18,338 thousand).
SecurityAt 30 June 2018 the carrying amount of total assets less the written down value of finance leased assets were held as security for bank facilities.
13. Intangible assets and goodwill
Computer Customer In thousands of AUD Note Goodwill software relationships Total
CostBalance at 1 July 2016 58,777 5,764 11,376 75,917Acquisition through business combinations 72,893 – 14,440 87,333Other additions – 2,210 – 2,210Acquisition accounting measurement period adjustment* (2,000) – – (2,000)
Balance at 30 June 2017 129,670 7,974 25,816 163,460
Balance at 1 July 2017 129,670 7,974 25,816 163,460Acquisition through business combinations 21 15,477 – 2,800 18,277Other additions – 3,139 – 3,139
Balance at 30 June 2018 145,147 11,113 28,616 184,876
Amortisation and impairment lossesBalance at 1 July 2016 – 3,477 2,161 5,638Amortisation for the year – 1,309 2,656 3,965
Balance at 30 June 2017 – 4,786 4,817 9,603
Balance at 1 July 2017 – 4,786 4,817 9,603Amortisation for the year – 1,409 3,593 5,002
Balance at 30 June 2018 – 6,195 8,410 14,605
Carrying amountsAt 1 July 2017 129,670 3,188 20,999 153,857
At 30 June 2018 145,147 4,918 20,206 170,271
*The adjustment relates to finalisation of preliminary accounting entries for the acquisition of JBA.
No impairment losses in relation to goodwill have been recognised in the year ended 30 June 2018 (2017 nil).
NOTES TO THE CONSOLIDATED FINANCIAL STATEMENTS (CONT.)For the year ended 30 June 2018
13. Intangible assets and goodwill (cont.)Impairment testing for cash-generating units containing goodwillThe following CGUs or groups of CGUs have carrying amounts of goodwill:
In thousands of AUD 2018 2017
Franklin (and AIW combined) 65,033 69,233Print communication and marketing services (group of CGUs) 52,618 32,941Creative services (group of CGUs) 11,614 11,614Pareto 15,882 15,882
145,147 129,670
Goodwill impairment test is performed applying by value in use calculations. The calculations use cash flow projections based on budgeted EBITDA approved by the Board. A post-tax WACC rate of 9.32% or 9.82% (depending on the size of the CGU) has been used with 2% growth allowance (in line with consumer price index) in the 5 year cash flow projections and terminal growth. In management’s assessment, there are no reasonable possible changes in assumptions that would give rise to impairment.
During the year, a part of Franklin’s business was transferred into the Print communications CGU. Hence, a reallocation of goodwill has been made between these CGUs.
14. Trade and other payables
In thousands of AUD 2018 2017
CurrentTrade payables 70,730 63,301Accrued expenses 34,015 28,804Deferred consideration 1,850 1,200Contingent consideration 4,850 4,825Interest rate swaps used for hedging 77 243
111,552 98,373
Non-currentContingent consideration 650 –Interest rate swaps used for hedging 31 12
681 12
15. Loans and borrowings
In thousands of AUD 2018 2017
CurrentBank loan 10,000 10,000Finance lease liabilities 3,668 2,815Equipment finance 2,774 –
16,442 12,815
Non-currentBank loan 108,961 124,325Finance lease liabilities 9,481 11,188Equipment finance 16,448 –
134,890 135,513
For
per
sona
l use
onl
y

IVE Group Limited Annual Report 2018 IVE Group Limited Annual Report 201878 79
15. Loans and borrowings (cont.)Bank loanAs at 30 June 2018, the Syndicated Facilities Agreement has a carrying amount of $118,961 thousand and face value of $120,000 thousand (2017: carrying amount of $134,325 and face value of $136,000 thousand). These facilities have an interest rate of BBSY plus a margin. Facility B is repayable partly during the term with the remaining balance maturing on 30 November 2019. The Company was in compliance with all loan covenants as at 30 June 2018.
Finance lease liabilitiesFinance lease liabilities of the Group are payable as follows:
Present value of Future minimum minimum lease lease payment Interest payments
In thousands of AUD 2018 2017 2018 2017 2018 2017
Less than one year 4,264 3,462 596 647 3,668 2,815Between one and five years 9,225 10,027 694 1,260 8,531 8,767More than five years 1,389 2,530 439 109 950 2,421
14,878 16,019 1,729 2,016 13,149 14,003
At 30 June 2018, the finance lease liabilities include $930 thousand lease liability for leased properties (2017: $1,196 thousand) and $12,219 thousand lease liability for leased plant and equipment (2017: $12,807 thousand).
16. Employee benefits
In thousands of AUD 2018 2017
CurrentLiability for long service leave 7,833 6,116Liability for annual leave 10,660 9,042
18,493 15,158
Non-currentLiability for long service leave 6,079 5,706
6,079 5,706
17. Provisions
In thousands of AUD Restructuring Make Acquired good lease liability Total
Balance at 1 July 2017 6,054 2,642 14,416 23,112Provisions made during the year 157 702 – 859Provisions reversed during the year (5,234) (354) (1,651) (7,239)
Balance at 30 June 2018 977 2,990 12,765 16,732
Current 344 – 1,471 1,815Non-current 633 2,990 11,294 14,917
977 2,990 12,765 16,732
NOTES TO THE CONSOLIDATED FINANCIAL STATEMENTS (CONT.)For the year ended 30 June 2018
18 . Share-based paymentsDuring the year ended 30 June 2018, the company granted Performance Share Rights (Rights) under the Equity Incentive Plan (EIP). The Rights are an entitlement to receive fully paid ordinary IVE Group Limited Shares on a one-for-one basis. Further details on the Rights are described below.
Type of arrangement General Management Award Senior Leadership Team Award
Date of grant 17 November 2017 17 November 2017*
Number granted 92,921 253,374
Contractual life 2 years 3 years and 2 months
Vesting conditions The Rights are subject to Performance Conditions: depending on the individual, including Earnings Before Interest Tax, Depreciation and Amortisation (EBITDA) or Revenue targets. The performance period is 1 July 2017 to 30 June 2018 inclusive. The vesting date is expected to be on or soon after the approval of IVE’s 2018 Annual Financial Report. Vested shares will be subject to an escrow period until 30 June 2019.
The Rights are subject to the following Performance Conditions: sixty percent of the Rights are referenced against achieving Earnings Per Share Target (EPS), and forty percent are referenced against achieving Relative Shareholder Return (TSR) target. The performance period is 1 July 2017 to 30 June 2020 inclusive. The vesting date is expected to be on or soon after the approval of IVE’s 2020 Annual Financial Report.
Weighted average fair value
$1.98 $1.48
Valuation methodology The fair value has been calculated using a risk-free neutral assumption. This is the difference between the spot price of the underlying asset minus the expected present value of the future dividend over the expected life if the holders of the underlying assets are not entitled to receive future dividends before the vesting date.
The EPS target was calculated using a risk-neutral assumption, whereas the TSR target has been valued using a Monte Carlo simulation approach.
Expected dividend Holders of performance share rights are not entitled to receive dividends prior to vesting.
Other key valuation assumptions
Share price at valuation date
$2.17 $2.17
Expected volatility 21.4% 21.4%
Risk free interest rate 1.64% 1.96%
Dividend yield 8.04% 8.04%
*Share rights issued to Directors required shareholder approval. This occurred at the Group’s 2017 Annual General Meeting.
Total expense relating to Share-based payments has been disclosed in note 5 of this consolidated financial statements.
On 27 September 2017, the Group issued shares under the 2017 General Management award (refer note 19 – Capital). The exercise price per share at the time of issue was $2.07. The fair value per share at grant date was $2.02. The total value of shares issued was $127 thousand.
For
per
sona
l use
onl
y

IVE Group Limited Annual Report 2018 IVE Group Limited Annual Report 201880 81
19. CapitalIssued and paid up capital
2018 2017
148,103,655 (June 2017: 119,280,624) ordinary shares fully paid 156,318 99,820
Movement in ordinary share capital
Number Issue Total Date Details of shares Price $’000
1-Jul16 Opening balance 89,180,901 39,843
13-Dec-16 Issue of new shares under the Institutional Entitlement Offer and Placement 17,659,564 $2.00 35,319
13-Dec-16 Issue of shares as consideration for acquisitions 9,814,729 19,771
19-Dec-16 Additional issue of shares as consideration for acquisition 264,253 529
30-Dec-16 Issue of new shares under the Retail Entitlement Offer 2,361,177 $2.00 4,722
Transaction costs arising from issue of shares (net of tax) (1,364)
30-Jun-17 Closing balance 119,280,624 98,820
1-Jul-17 Opening balance 119,280,624 98,820
5-Sep-17 Issue of new shares under the Institutional Entitlement Offer (refer below) 18,860,264 $2.05 38,664
5-Sep-17 Issue of shares as consideration for acquisition (refer below) 1,650,165 3,399
20-Sep-17 Issue of new shares under the Retail Entitlement Offer (refer below) 8,249,730 $2.05 16,912
Transaction costs arising from issue of shares (net of tax) (1,604)
27-Sep-17 Issue of shares under the Equity Incentive Plan 62,872 $2.02 127
30-Jun-18 Closing balance 148,103,655 156,318
DividendsOn 27th August 2018, the directors have declared a fully franked dividend of 7.5 cents per share to be paid on 25th October 2018 to shareholders on the register at 19 September 2018. The final dividend payout is $11.1m (2017: $9.5m). A liability has not been recognised as the dividend was declared after the reporting date.
NOTES TO THE CONSOLIDATED FINANCIAL STATEMENTS (CONT.)For the year ended 30 June 2018
19. Capital (cont.)Dividends (cont.)The following dividends were declared and paid during the year ended 30 June 2018:
Cents Total Date of In thousands of AUD per share amount payment
2018Final 2017 ordinary 6.4 9,477 25 October 2017Interim 2018 ordinary 8.0 11,848 19 April 2018
Total amount 21,325
On 25 October 2017 a dividend of 6.4 cents per share (100% franked) was declared and paid by the directors. The dividend was paid out of opening retained profits and profits earned up to that date.
On 19 April 2018 a further dividend of 8.0 cents per share (100% franked) was declared and paid by the directors. The dividend was paid out of profits earned up to that date.
The following dividends were declared and paid during the year ended 30 June 2017:
Cents Total Date of In thousands of AUD per share amount payment
2017Final 2016 ordinary 8.6 7,671 20 October 2016Interim 2017 ordinary 6.3 7,514 20 April 2017
Total amount 15,185
Dividend franking account
In thousands of AUD 2018 2017
Amount of franking credits available to shareholders of IVE Group Limited for subsequent financial years 5,857 12,080
The ability to utilise the franking credits is dependent upon the ability to declare dividends.
20. Earnings per share
In dollars 2018 2017
Basic earnings per share 0.18 0.11Diluted earnings per share 0.18 0.11
In thousands 2018 2017
EarningsProfit after income tax attributable to owners of the company used in calculating basic and diluted earnings per share 25,715 12,109
Weighted average number of ordinary sharesWeighted average number of ordinary shares used in calculating basic earnings per share 142,549 105,560
Weighted average number of ordinary shares used in calculating diluted earnings per share 142,796 105,656
For
per
sona
l use
onl
y

IVE Group Limited Annual Report 2018 IVE Group Limited Annual Report 201882 83
21. AcquisitionsDuring the year, the Group acquired the following businesses, the details of which are as follows:
• On 6 September 2017, IVE Group acquired the shares of SEMA Holdings Pty Limited (“SEMA”) and its operating entities. SEMA is a leading provider in personalised communication services and will be integrated into IVE’s Direct business.
• On 16 November 2017, IVE Group acquired the shares of John W Gage & Co Pty Limited (trading as “Dominion”). Dominion is a provider of creative services, digital print, offset print and warehousing and logistics services. It will be integrated into IVE’s Print business.
The following summarises the major classes of consideration transferred, and the recognised amounts of assets acquired and liabilities assumed at the acquisition date:
In thousands of AUD SEMA Dominion Total
Consideration transferredCash 7,750 4,572 12,322Completion cash adjustment* (356) 1,018 662Deferred consideration – 1,850 1,850Contingent consideration 3,350 650 4,000Issue of shares 3,399 – 3,399
14,143 8,090 22,233
Identifiable assets acquired and liabilities assumedCash and cash equivalents 657 721 1,378Trade and other receivables 7,275 1,450 8,725Inventories 277 322 599Prepayments 448 22 470Property, plant and equipment 2,874 628 3,502Customer relationship (intangible asset) 800 2,000 2,800Other current assets 1,221 – 1,221Deferred tax assets/(liabilities) 45 (631) (586)Trade and other payables (6,416) (877) (7,293)Current tax payable (350) (188) (538)Employee benefits (2,723) (799) (3,522)
4,108 2,648 6,756
Goodwill on acquisition 10,035 5,442 15,477
* The completion cash adjustment includes working capital and balance sheet date adjustments. These adjustments are made in the ordinary course of a transaction to reflect the difference between normalised expectations around balance sheet items at the time of signing and actual balances on transaction completion.
As part of the consideration transferred, contingent consideration is expected to be payable. The Group has made a best estimate of the amount of consideration payable for the acquisitions where there is a variable purchase price based on future revenue performance. Based on past and expected performance the Group assumes that the acquirees will meet the future revenue target. Any variation at time of settlement will be recognised as an expense or income.
Management have measured the assets and liabilities acquired at fair value with the remainder of the purchase consideration being allocated to goodwill. The acquisition accounting is still on a provisional basis pending the completion of a final valuation. If new information obtained within one year from the acquisition date about facts and circumstances that existed at the acquisition date identifies adjustments to the above amounts, or any additional provisions that existed at the acquisition date, then the accounting for the acquisition will be revised.
The goodwill is attributable to the future profitability of the acquisitions and the synergies expected to arise within the Group. None of the goodwill recognised is expected to be deductible for tax purposes.
NOTES TO THE CONSOLIDATED FINANCIAL STATEMENTS (CONT.)For the year ended 30 June 2018
21. Acquisitions (cont.)The businesses of SEMA and Dominion are being integrated into IVE. The profit before tax contribution of these acquisitions are indistinguishable from existing business unit results. On this basis a disclosure of profit before tax is impracticable. However, the revenues of these businesses have been tracked due to contingent consideration. The total revenue since acquisition is $39,447 thousand. Individually these businesses are considered immaterial.
If these acquisitions had occurred from beginning of the reporting period the combined Group revenue would have been estimated at $51,125 thousand. The Group has not estimated the profit before tax for the reasons provided above.
Acquisition-related costs totalling $1,039 thousand for all acquisitions has been included in Other expenses in the Group’s consolidated statement of profit or loss and other comprehensive income.
22. Operating segmentsThe Group has identified one operating segment (whole of business) based on the internal reports that are reviewed and used by the Board (Chief Operating Decision Maker or “CODM”) in assessing performance and in determining the allocation of resources. The Board reviews the internal report on a monthly basis.
The key measure of performance used by the CODM to assess performance is earnings before interest, tax, depreciation and amortisation (EBITDA).
A reconciliation of the reportable segment’s EBITDA to profit before income tax expense is shown below. Profit and loss, total assets and liabilities for the reportable segment is consistent with the primary statements included in this consolidated interim financial report.
In thousands of AUD 2018 2017
EBITDA 63,639 35,967Depreciation, amortisation and impairment (18,874) (13,777)Net finance costs (7,904) (5,772)
Profit before income tax 36,861 16,418
23. Financial risk management and financial instruments OverviewThe Group has exposure to the following risks from its use of financial instruments:
a. credit risk
b. liquidity risk
c. market risk
This note presents information about the Group’s exposure to each of the above risks, the Group’s objectives, policies and processes for measuring and managing risk, and the Group’s management of capital. Further quantitative disclosures are included throughout these consolidated financial statements.
Risk management frameworkThe Company’s board of directors has overall responsibility for the establishment and oversight of the Group’s risk management framework. The CFO is responsible for developing and monitoring the Group’s risk management policies. He reports regularly to the Board of Directors on its activities.
The Group’s risk management policies are established to identify and analyse the risks faced by the Group, to set appropriate risk limits and controls, and to monitor risks and adherence to limits. Risk management policies and systems are reviewed regularly to reflect changes in market conditions and the Group activities. The Group, through its training and management standards and procedures, aims to maintain a disciplined and constructive control environment in which all employees understand their roles and obligations.
The Group Audit Committee oversees how management monitors compliance with the Group’s risk management policies and procedures, and reviews the adequacy of the risk management framework in relation to the risks faced by the Group.
For
per
sona
l use
onl
y

IVE Group Limited Annual Report 2018 IVE Group Limited Annual Report 201884 85
23. Financial risk management and financial instruments (cont.)Credit riskCredit risk is the risk of financial loss to the Group if a customer or counterparty to a financial instrument fails to meet its contractual obligations, and arises principally from the Group’s receivables from customers and investments in debt securities.
The Group has no significant concentrations of credit risk. The Group has policies in place to ensure that sales of services are made to customers with an appropriate credit history based on enquires through the Group’s Finance department. Ongoing customer credit performance is monitored on a regular basis.
Exposure to credit risk
The carrying amount of financial assets represents the maximum credit exposure. The maximum exposure to credit risk at the reporting date was:
Carrying amounts
In thousands of AUD Note 2018 2017
Cash and cash equivalents 9 22,325 23,851Trade and other receivables 10 118,282 94,785
140,607 118,636
ImpairmentThe aging of the trade and other receivables at the end of the reporting period that were not impaired was as follows:
Carrying amounts
In thousands of AUD 2018 2017
Neither past due nor impaired 68,282 58,578Past due 1-30 days 33,197 21,327Past due 31-90 days 10,017 9,172Past due 91 days and over 6,808 6,015
118,304 95,092
The movement in the allowance for impairment in respect of receivables during the year was as follows:
In thousands of AUD 2018 2017
Balance at beginning of the year 704 1,315Assumed in a business combination in current year 562 424Impairment loss recognised 263 217Amounts written off (852) (1,252)
Balance at end of year 677 704
Liquidity riskLiquidity risk is the risk that the Group will encounter difficulty in meeting the obligations associated with its financial liabilities that are settled by delivering cash or another financial asset. The Group’s approach to managing liquidity is to ensure, as far as possible, that it will always have sufficient liquidity to meet its liabilities when due, under both normal and stressed conditions, without incurring unacceptable losses or risking damage to the Group’s reputation.
NOTES TO THE CONSOLIDATED FINANCIAL STATEMENTS (CONT.)For the year ended 30 June 2018
23. Financial risk management and financial instruments Overview (cont.)Liquidity risk (cont.)The following are the remaining contractual maturities of financial liabilities at the reporting date. The amounts are gross and undiscounted, and include estimated interest payments:
Contractual cash flows
Carrying 12 months 1-5 More than In thousands of AUD amount Total or less years 5 years
30 June 2018Non-derivative financial liabilitiesTrade and other payable 104,745 104,745 104,745 – –Deferred consideration 1,850 1,850 1,850 – –Contingent consideration 5,500 5,500 5,500 – –Finance lease liabilities 13,149 14,878 4,264 9,225 1,389Equipment finance 19,222 19,610 3,093 12,096 4,421Bank loans 118,961 125,866 13,738 112,128 –
263,427 272,449 133,190 133,449 5,801
Derivative financial liabilitiesInterest rate swaps used for hedging 108 108 77 31 –
108 108 77 31 –
Contractual cash flows
Carrying 12 months 1-5 More than In thousands of AUD amount Total or less years 5 years
30 June 2017Non-derivative financial liabilitiesTrade and other payable 92,105 92,105 92,105 – –Deferred consideration 1,200 1,200 1,200 – –Contingent consideration 4,825 4,825 4,825 – –Finance lease liabilities 14,003 16,019 3,462 10,027 2,530Bank loans 134,325 145,700 13,934 131,766 –
246,458 259,849 115,526 141,793 2,530
Market riskMarket risk is the risk that changes in market prices, such as foreign exchange rates and interest rates will affect the Group’s income or the value of its holdings of financial instruments. The objective of market risk management is to manage and control market risk exposures within acceptable parameters, while optimising the return.
Currency riskThe Group is exposed to currency risk to the extent that there is a mismatch between the currencies in which purchases are denominated and the respective functional currencies of Group entities. The functional currency of the Group is the Australian dollar (AUD). The currencies in which these transactions are primarily denominated are Euro, US dollars and AUD.
For
per
sona
l use
onl
y

IVE Group Limited Annual Report 2018 IVE Group Limited Annual Report 201886 87
NOTES TO THE CONSOLIDATED FINANCIAL STATEMENTS (CONT.)For the year ended 30 June 2018
23. Financial risk management and financial instruments (cont.)Currency risk (cont.)During the year, 5% of total group purchases were made in foreign currencies. The Group has used forward exchange contracts to hedge its currency risk, most with a maturity of less than one year from the reporting date. These forward exchange contracts has been designated as a cash flow hedge, and have a fair value of $655 thousand at the reporting date (2017: $397 thousand). The Group has performed effectiveness testing and recognised the full fair value amount net of deferred tax of $459 thousand in other comprehensive income (2017: $278 thousand). Based on the results of the test no in-effectiveness has been recognised in the profit or loss.
Exposure to currency risk
The summary quantitative data about the Group’s exposure to currency risk as reported to the management of the Group is as follows:
As at 30 June 2018 As at 30 June 2017
In thousands of AUD Euro USD GBP Euro USD NZD
Equipment finance loan 12,739 – – – – –Next three months forecast purchases 5,860 350 1,430 5,258 567 26Forward exchange contracts (18,599) (350) (1,430) (5,258) (567) (26)
Net exposure – – – – – –
Sensitivity analysis
The impact of exchange rate movements on profit is subject to other variables including movement in market prices. The impact of exchange rate movements on profit and loss is not material.
Interest rate riskThe Group has entered into interest rate swap contracts to minimise its variable interest exposure on bank loans. As at 30 June 2018, after taking into account the effect of the interest rate swaps, 50% of the carrying amount of Facility A and B of the bank loan is exposed to variable rates (2017: 50% of the carrying value of Facility A and B). The interest rate swap has been designated as a cash flow hedge. Its fair value at reporting date is $108 thousand (2017: $255 thousand). The Group has performed effectiveness testing and recognised the full fair value amount net of deferred tax of $76 thousand (2017: $178 thousand) in other comprehensive income. Based on the results of the test no in-effectiveness has been recognised in the profit or loss. These interest rate swaps closely match the terms of the bank loan and will mature during December 2019.
Exposure to interest risk
At the reporting date the interest rate profile of the Group’s interest-bearing financial instruments was:
Carrying amount
In thousands of AUD 2018 2017
Fixed rate instrumentsFinancial liabilities – finance lease liabilities and equipment finance (32,371) (14,003)Effect of interest rate swaps – notional amount (55,000) (60,000)
(87,371) (74,003)
Variable rate instrumentsFinancial assets – bank balances 22,314 23,843Financial liabilities – bank loans (120,000) (136,000)Effect of interest rate swaps – notional amount 55,000 60,000
(42,686) (52,157)
23. Financial risk management and financial instruments (cont.)Interest rate risk (cont.)Fair value sensitivity analysis for fixed rate instruments
The Group does not account for any fixed rate financial assets and liabilities at fair value through profit or loss, and the Group does not designate derivatives (interest rate swaps) as hedging instruments under a fair value hedge accounting model. Therefore, a change in interest rates at the reporting date would not affect profit or loss.
Cash flow sensitivity analysis for variable rate instruments
A change of 10 basis points in interest rates at the reporting date would have increased (decreased) equity and profit or loss by $43 thousand (2017: $52 thousand). This analysis assumes that all other variables, in particular foreign currency rates, remain constant. The analysis is performed on the same basis as 2017.
Measurement of fair valuesThe table below gives information on the valuation technique and unobservable inputs of financial assets or liabilities categorised as a Level 2 or Level 3 in the fair value hierarchy.
Type Valuation technique Significant unobservable inputs
Relationship between the fair value and unobservable inputs
Contingent consideration
The fair value is calculated based on the acquired business achieving future revenue or earning’s target.
Forecast revenue and earnings growth
The Group continuously reassess the contingent consideration payable based on revised expectations of achieving revenue and earnings growth targets over the defined measurement period (over the 2018 and 2019 financial years). As a result, contingent consideration continues to be recognised. If the applicable performance targets for all acquisitions are lower than expected by 10%, then the contingent consideration value will be decreased by approximately $650 thousand.
Interest rate swaps
The fair value is calculated using the present value of the estimated future cash flow based on observable yield curves.
Not applicable Not applicable
Forward exchange contracts
The fair value is determined using quoted forward exchange rates and present value of estimated future cash flow based on observable yield curves.
Not applicable Not applicable
For
per
sona
l use
onl
y

IVE Group Limited Annual Report 2018 IVE Group Limited Annual Report 201888 89
NOTES TO THE CONSOLIDATED FINANCIAL STATEMENTS (CONT.)For the year ended 30 June 2018
23. Financial risk management and financial instruments (cont.)Measurement of fair values (cont.)Reconciliation of Level 3 Contingent consideration fair value
The following table shows reconciliation of Contingent consideration from the opening balance to the closing balance:
In thousands of AUD 2018 2017
Balance at 1 July 4,825 10,374Assumed in a business combination in current year 4,000 1,700Contingent consideration settled during the year (2,622) (2,300)Contingent consideration reduced (703) (2,949)Acquisition accounting measurement period adjustment – (2,000)
Balance at 30 June 5,500 4,825
Fair values versus carrying amountsAs at the reporting date, the carrying value of other financial assets and liabilities as at the end of the financial year are considered to approximate their fair value.
Capital managementThe primary objective of the Group’s capital management is to maintain a strong capital base through cash flow management in order to sustain future development of the business and maximise shareholder value. There were no changes in the Group’s approach to capital management during the year. The Group is subject to externally imposed capital requirements (being financial loan covenants – refer to note 15).
24. Operating leasesLeases as lesseeNon-cancellable operating lease rentals are payable as follows:
In thousands of AUD 2018 2017
Less than one year 25,334 22,067Between one and five years 78,144 81,304More than five years 40,325 56,274
143,803 159,645
The Group leases office space and plant and equipment under operating leases. The leases typically run for a period of 2 to 10 years, with an option to renew the lease after that date.
During the year an amount of $26,265 thousand (2017: $19,680 thousand) was recognised as an expense in profit or loss in respect of operating leases.
25. Capital commitmentsAs at 30 June 2018, the Group has committed to purchase plant and equipment of $16,200 thousand (2017: $23,188 thousand).
26. Related partiesKey management personnel compensationKey management personnel compensation comprised the following:
In AUD 2018 2017
Short-term employee benefits 3,433,721 2,494,251Post-employee benefits 131,323 114,555Share-based payments 27,693 19,023
3,592,737 2,627,829
Related party transactions and outstanding balances
Transaction Transaction value year value year ended ended In AUD 30 June 2018 30 June 2017
Caxton Property Investments Pty Ltd – purchases – 224,004
Caxton Property Investments Pty Limited
Geoff Selig and Paul Selig (directors of the Company), hold positions in Caxton Property Investments Pty Limited that result in them having control or significant influence over the financial or operating policies of this entity.
The “purchases” referred to were payments of directors fees paid to that entity in lieu of director fees to the individual directors.
The terms and conditions of the transactions above were no more favourable than those available, or which might reasonably be expected to be available, on similar transactions to other third parties on an arm’s length basis.
27. Group entities
Ownership interest
2018 2017 % %
Ultimate parent entityIVE Group Limited
Controlled entities
Caxton Print Group Holdings Pty Limited 100 100Caxton Print Group Pty Limited 100 100IVE Group Australia Pty Limited 100 100IVE Group Victoria Pty Limited 100 100Task 2 Pty Limited 100 100Pareto Fundraising Pty Limited 100 100Pareto Phone Pty Limited 100 100James Bennett & Associates Pty Limited 100 100
For
per
sona
l use
onl
y

IVE Group Limited Annual Report 2018 IVE Group Limited Annual Report 201890 91
NOTES TO THE CONSOLIDATED FINANCIAL STATEMENTS (CONT.)For the year ended 30 June 2018
27. Group entities (cont.)
Ownership interest
2018 2017 % %
IVE Employment (Australia) Pty Limited 100 100IVE Employment (Victoria) Pty Limited 100 100Taverners No. 13 Pty Limited 100 100AIW Printing (Aust) Pty Limited 100 100AIW Printing Unit Trust 100 100IVE Group Asia Limited 100 100Guangzhou IVE Trading Company Limited 100 100IVE Singapore Pte Limited 100 100SEMA Holdings Pty Ltd 100 –SEMA Infrastructure Pty Ltd 100 –SEMA Operations Pty Ltd 100 –John W Gage & Co Pty Ltd 100 –
28. Parent entity disclosuresAs at, and throughout, the financial year ending 30 June 2018 the parent entity of the Group was IVE Group Limited.
In thousands of AUD 2018 2017
Result of parent entityProfit/(loss) for the year – 1,004Other comprehensive income – –
Total comprehensive income for the year – 1,004
Financial position of parent entity at year/period endCurrent assets 18 80Total assets 100,593 64,491
Current liabilities 80 18Total liabilities 80 18
Total equity of the parent entity comprising of:Share capital 287,631 230,267Other equity reserve (146,662) (146,662)Accumulated losses (40,455) (19,132)
Total equity 100,514 64,473
IVE Group Limited was incorporated on 10 June 2015, but did not undertake any trading activities until its listing (IPO) on the Australian Stock Exchange (ASX) on 16 December 2015 where it also contemporaneously acquired Caxton Print Group Holdings Pty Ltd (CPGH).
An internal restructure took place resulting in IVE Group Limited becoming the holding company of CPGH. The Directors elected to account for the restructure as a capital re-organisation rather than a business combination. In the Directors’ judgement, the continuation of the existing accounting values is consistent with the accounting that would have occurred if the assets and liabilities had already been in a structure suitable to IPO and most appropriately reflects the substance of the internal restructure. As such, the consolidated financial statements of the new IVE Group have been presented as a continuation of the pre existing accounting values of assets and liabilities in CPGH’s financial statements.
Accordingly, the other equity reserve represents the difference between the fair value of the share capital at the date of the IPO and historical book values of the assets and liabilities of the Group.
29. Subsequent eventsThere have been no other events subsequent to balance date which would have a material effect on the Group’s consolidated financial statements at 30 June 2018.
30. Auditors’ remuneration
In AUD 2018 2017
Audit servicesAuditors of the Company – KPMG Audit and review of financial reports 384,088 413,470 Audit of other assurance 10,125 5,000
394,213 418,470
Other servicesAuditors of the Company – KPMG Taxation services 189,625 86,818 Transaction services 399,750 653,000
589,375 739,818
31. Deed of cross guaranteePursuant to ASIC Corporations (Wholly owned Companies) Instrument 2016/785 the wholly-owned subsidiaries listed below are relieved from the Corporations Act 2001 requirements for preparation, audit and lodgement of financial reports, and directors’ reports.
It is a condition of the Instrument that the Company and each of the subsidiaries enter into a Deed of Cross Guarantee. The effect of the Deed is that the Company guarantees to each creditor payment in full of any debt in the event of winding up of any of the subsidiaries under certain provisions of the Corporations Act 2001. If a winding up occurs under other provisions of the Act, the Company will only be liable in the event that after six months any creditor has not been paid in full. The subsidiaries have also given similar guarantees in the event that the Company is wound up.
The Company and its subsidiaries amended its Deed of Cross Guarantee on 23 February 2018. The subsidiaries subject to the Deed are:
a. Caxton Print Group Holdings Pty Limited i. IVE Employment (Australia) Pty Limited
b. IVE Group Australia Pty Limited j. IVE Employment (Victoria) Pty Limited
c. IVE Group Victoria Pty Limited k. Taverners No. 13 Pty Limited
d. Caxton Print Group Pty Limited l. AIW Printing (Aust) Pty Limited
e. Task 2 Pty Limited m. SEMA Holdings Pty Limited
f. Pareto Fundraising Pty Limited n. SEMA Infrastructure Pty Limited
g. Pareto Phone Pty Limited o. SEMA Operations Pty Limited
h. James Bennett & Associates Pty Limited p. John W. Gage & Co Pty Limited
A consolidated statement of profit or loss and other comprehensive income and consolidated statement of financial position, comprising the Company and controlled entities which are a party to the Deed, after eliminating all transactions between parties to the Deed of Cross Guarantee, for the year ended 30 June 2018 is set out on pages 57 and 58 of this financial report.
For
per
sona
l use
onl
y

IVE Group Limited Annual Report 2018 IVE Group Limited Annual Report 201892 93
DIRECTORS’ DECLARATION1. In the opinion of the directors of IVE Group Limited (the Company):
(a) the consolidated financial statements and notes, set out on pages 57 to 91, are in accordance with the Corporations Act 2001, including:
(i) giving a true and fair view of the Group’s financial position as at 30 June 2018 and of its performance for the financial year ended on that date; and
(ii) complying with Australian Accounting Standards and the Corporations Regulations 2001; and
(b) there are reasonable grounds to believe that the Company will be able to pay its debts as and when they become due and payable.
2. There are reasonable grounds to believe that the Company and the group entities identified in Note 27 will be able to meet any obligations or liabilities to which they are or may become subject to by virtue of the Deed of Cross Guarantee between the Company and those group entities pursuant to ASIC Corporations (Wholly owned Companies) Instrument 2016/785.
3. The directors draw attention to Note 2 to the consolidated financial statements, which includes a statement of compliance with International Financial Reporting Standards.
Signed in accordance with a resolution of directors.
Geoff SeligDirector
Dated at Sydney this 27th day of August 2018
Liability limited by a scheme approved under Professional Standards Legislation.
KPMG, an Australian partnership and a member firm of the KPMG network of independent member firms affiliated with KPMG International Cooperative (“KPMG International”), a Swiss entity.
Independent Auditor’s Report
To the shareholders of IVE Group Limited
Report on the audit of the Financial Report
Opinion
We have audited the Financial Report of IVE Group Limited (the Company).
In our opinion, the accompanying Financial Report of the Company is in accordance with the Corporations Act 2001, including:
• giving a true and fair view of the Group's financial position as at 30 June 2018 and of its financial performance for the year ended on that date; and
• complying with Australian Accounting Standards and the Corporations Regulations 2001.
The Financial Report comprises:
• Consolidated statement of financial position as at 30 June 2018
• Consolidated statement of profit or loss and other comprehensive income, Consolidated statement of changes in equity, and Consolidated statement of cash flows for the year then ended
• Notes including a summary of significant accounting policies
• Directors' Declaration.
The Group consists of the Company and the entities it controlled at the year-end or from time to time during the financial year.
Basis for opinion
We conducted our audit in accordance with Australian Auditing Standards. We believe that the audit evidence we have obtained is sufficient and appropriate to provide a basis for our opinion.
Our responsibilities under those standards are further described in the Auditor’s responsibilities for the audit of the Financial Report section of our report.
We are independent of the Group in accordance with the Corporations Act 2001 and the ethical requirements of the Accounting Professional and Ethical Standards Board’s APES 110 Code of Ethics for Professional Accountants (the Code) that are relevant to our audit of the Financial Report in Australia. We have fulfilled our other ethical responsibilities in accordance with the Code.
For
per
sona
l use
onl
y

IVE Group Limited Annual Report 2018 IVE Group Limited Annual Report 201894 95
Key Audit Matters
Key Audit Matters are those matters that, in our professional judgement, were of most significance in our audit of the Financial Report of the current period.
This matter was addressed in the context of our audit of the Financial Report as a whole, and in forming our opinion thereon, and we do not provide a separate opinion on this matter.
Assessment of carrying value of goodwill
Refer to Note 13 ‘Intangible assets and goodwill’ to the Financial Report (Goodwill: $145.1 m)
The key audit matter How the matter was addressed in our audit
The Group’s annual testing of goodwill for impairment is a key audit matter due to the:
• size of the goodwill balance (being 28.7% of the total assets);
• significant forward looking judgments the Group applied in their value in use models.
• The judgments we focused on included:
• assessment of the Cash Generating Units (CGUs). The Group has several operating businesses and product lines and has made acquisitions during the year, necessitating our consideration of the Group’s determination of CGUs, based on the smallest group of assets to generate largely independent cash inflows;
• assessment of allocation of goodwill to CGUs. The Group made significant acquisitions during the year, necessitating our consideration of the Group’s allocation of goodwill to the CGUs to which they belong based on the management and monitoring of the business;
• forecasting operating cash flows, capital expenditure and forecast growth rates, including terminal growth rate. These judgments are impacted by the highly competitive market conditions and the pace of technological change and digital disruption in the printing industry, and increase the complexity of the audit;
• assessment of the discount rates. These are complicated in nature and vary according to the
Our procedures included:
• we considered the Group’s determination of their CGUs based on our understanding of the Group’s business, the impact of the SEMA Holdings Pty Limited (“SEMA”) and John W Gage & Co Pty Limited (“Dominion”) acquisitions, and, how independent cash inflows were generated, against the requirements of the accounting standards;
• we analysed the impact of the SEMA and Dominion acquisitions and the Group’s internal reporting to assess their monitoring and management of activities, and the consistency of the allocation of goodwill to CGUs;
• we considered the appropriateness and application of the value in use method applied by the Group to perform the annual test of goodwill for impairment against the requirements of the accounting standards;
• we assessed the integrity of the value in use models used, including the accuracy of the underlying calculations and formulas;
• we evaluated the Group’s cash flow forecasts, including capital expenditure, by comparing the forecasted data to the Board approved budget.
• we assessed the accuracy of previous Group forecasts to inform our evaluation of
conditions and environment the specific CGU is subject to from time to time;
• level of disclosure of the key assumptions used in the Group’s valuation models.
Given the nature of these judgments, we involved our valuation specialists and senior staff with experience in the industry and the Group’s business.
forecasted data incorporated in the models.
• we challenged the Group’s significant forecast cash flow and forecast growth rates in light of the expected continuation of highly competitive market conditions and digital disruption in the printing industry. We compared key events to the Board approved plan and strategy. We compared forecast growth rates and terminal growth rates to published information on industry trends and expectations, and considered differences for the Group’s operations. We used our knowledge of the Group, their past performance, business and customers, and our industry experience;
• we considered the sensitivity of the models by varying key assumptions, such as forecast growth rates, terminal growth rates and discount rates, within a reasonably possible range, to identify those CGUs with a higher risk of impairment and to focus our further procedures;
• working with our valuation specialists, we analysed the discount rates and terminal growth rates, based on our knowledge of the Group, its industry, current market forces, and publicly available market data for comparable entities;
• we assessed the impact of technological change and digital disruption in the printing industry on the Group’s key judgements, for indicators of bias and inconsistent application, using our industry knowledge;
• we assessed the related disclosures against the requirements of the accounting standards.
Other Information
Other Information is financial and non-financial information in IVE Group Limited’s annual reporting which is provided in addition to the Financial Report and the Auditor’s Report. The Directors are responsible for the Other Information.
The Other Information we obtained prior to the date of this Auditor’s Report was the Appendix 4E, Operating and Financial Review, Director’s Report, Remuneration Report and the IVE Group Ltd FY18 Results Presentation. The Chairman’s Report and Managing Director’s Report are expected to be made available to us after the date of the Auditor’s Report.
For
per
sona
l use
onl
y

IVE Group Limited Annual Report 2018 IVE Group Limited Annual Report 201896 97
Our opinion on the Financial Report does not cover the Other Information and, accordingly, we do not express an audit opinion or any form of assurance conclusion thereon, with the exception of the Remuneration Report and our related assurance opinion.
In connection with our audit of the Financial Report, our responsibility is to read the Other Information. In doing so, we consider whether the Other Information is materially inconsistent with the Financial Report or our knowledge obtained in the audit, or otherwise appears to be materially misstated.
We are required to report if we conclude that there is a material misstatement of this Other Information, and based on the work we have performed on the Other Information that we obtained prior to the date of this Auditor’s Report we have nothing to report.
Responsibilities of the Directors for the Financial Report
The Directors are responsible for:
• preparing the Financial Report that gives a true and fair view in accordance with Australian Accounting Standards and the Corporations Act 2001
• implementing necessary internal control to enable the preparation of a Financial Report that gives a true and fair view and is free from material misstatement, whether due to fraud or error
• assessing the Group and Company’s ability to continue as a going concern and whether the use of the going concern basis of accounting is appropriate. This includes disclosing, as applicable, matters related to going concern and using the going concern basis of accounting unless they either intend to liquidate the Group or to cease operations, or have no realistic alternative but to do so.
Auditor’s responsibilities for the audit of the Financial Report
Our objective is:
• to obtain reasonable assurance about whether the Financial Report as a whole is free from material misstatement, whether due to fraud or error; and
• to issue an Auditor’s Report that includes our opinion.
Reasonable assurance is a high level of assurance, but is not a guarantee that an audit conducted in accordance with Australian Auditing Standards will always detect a material misstatement when it exists.
Misstatements can arise from fraud or error. They are considered material if, individually or in the aggregate, they could reasonably be expected to influence the economic decisions of users taken on the basis of this Financial Report.
A further description of our responsibilities for the audit of the Financial Report is located at the Auditing and Assurance Standards Board website at: http://www.auasb.gov.au/auditors_responsibilities/ar1.pdf. This description forms part of our Auditor’s Report.
Report on the Remuneration Report
Opinion
In our opinion, the Remuneration Report of IVE Group Limited for the year ended 30 June 2018, complies with Section 300A of the Corporations Act 2001.
Directors’ responsibilities
The Directors of the Company are responsible for the preparation and presentation of the Remuneration Report in accordance with Section 300A of the Corporations Act 2001.
Our responsibilities
We have audited the Remuneration Report included in pages 40 to 54 of the Directors’ report for the year ended 30 June 2018.
Our responsibility is to express an opinion on the Remuneration Report, based on our audit conducted in accordance with Australian Auditing Standards.
KPMG John Wigglesworth Partner
Sydney
27 August 2018
conditions and environment the specific CGU is subject to from time to time;
• level of disclosure of the key assumptions used in the Group’s valuation models.
Given the nature of these judgments, we involved our valuation specialists and senior staff with experience in the industry and the Group’s business.
forecasted data incorporated in the models.
• we challenged the Group’s significant forecast cash flow and forecast growth rates in light of the expected continuation of highly competitive market conditions and digital disruption in the printing industry. We compared key events to the Board approved plan and strategy. We compared forecast growth rates and terminal growth rates to published information on industry trends and expectations, and considered differences for the Group’s operations. We used our knowledge of the Group, their past performance, business and customers, and our industry experience;
• we considered the sensitivity of the models by varying key assumptions, such as forecast growth rates, terminal growth rates and discount rates, within a reasonably possible range, to identify those CGUs with a higher risk of impairment and to focus our further procedures;
• working with our valuation specialists, we analysed the discount rates and terminal growth rates, based on our knowledge of the Group, its industry, current market forces, and publicly available market data for comparable entities;
• we assessed the impact of technological change and digital disruption in the printing industry on the Group’s key judgements, for indicators of bias and inconsistent application, using our industry knowledge;
• we assessed the related disclosures against the requirements of the accounting standards.
Other Information
Other Information is financial and non-financial information in IVE Group Limited’s annual reporting which is provided in addition to the Financial Report and the Auditor’s Report. The Directors are responsible for the Other Information.
The Other Information we obtained prior to the date of this Auditor’s Report was the Appendix 4E, Operating and Financial Review, Director’s Report, Remuneration Report and the IVE Group Ltd FY18 Results Presentation. The Chairman’s Report and Managing Director’s Report are expected to be made available to us after the date of the Auditor’s Report.
For
per
sona
l use
onl
y

IVE Group Limited Annual Report 2018 IVE Group Limited Annual Report 201898 99
ASX ADDITIONAL INFORMATIONAdditional information required by the Australian Securities Exchange (ASX) and not disclosed elsewhere in the Annual Report is set out below. The shareholder information below is as at 30 July 2018.
IVE Group Limited shares are traded on the ASX under the code ‘IGL’.
Share registry Registered office Principal Place of Business
Link Market Services Level 3, 35 Clarence Street Building B, 350 Parramatta RoadLevel 12, 680 George Street Sydney NSW 2000 Homebush NSW 2140Sydney NSW 2000 Phone: +61 2 8020 4400 Phone: +61 2 8020 4400Phone: +61 1300 554 474
Substantial shareholders of ordinary shares (as reported to the ASX)
Number of Name shares held %
Caxton Print Holdings Pty Ltd as trustee for the Selig Family Trust 11,210,231 8.02%Hume Partners Pty Ltd 8,421,747 7.20%Regal Funds Management Pty Ltd 10,259,475 6.93%COPIA Investment Partners 6,565,000 5.50%FIL Limited and associated entities 7,607,453 5.14%
Distribution of shareholders and shareholdings – ordinary sharesThere are 148,103,655 ordinary shares on issue held by 1,779 shareholders.
Ordinary Number Range Shares % of holders %
1 to 1,000 87,166 0.06 172 9.671,001 to 5,000 1,480,489 1.00 487 27.375,001 to 10,000 2,732,277 1.84 333 18.7210,001 to 100,000 20,506,781 13.85 705 39.63100,001 and Over 123,296,942 83.25 82 4.61
Total 148,103,655 100.00 1,779 100.00
Distribution of shareholders and shareholdings – performance share rights (unlisted)There are 447,506 unlisted performance share rights on issue that have been issued under an employee share plan. These are held by 25 employees.
Performance Number Range Share Rights % of holders %
1 to 1,000 – –1,001 to 5,000 26,765 5.98 9 34.615,001 to 10,000 50,500 11.28 10 38.4610,001 to 100,000 269,857 60.30 6 23.08100,001 and Over 100,384 22.44 1 3.85
Total 447,506 100.00 26 100.00
Unmarketable parcelsThe number of shareholders holding less than a marketable parcel of ordinary shares is 40 for 998 shares.
Twenty largest shareholders
Number of Rank Name Shares %
1 Citicorp Nominees Pty Limited 20,324,314 13.722 HSBC Custody Nominees (Australia) Limited 18,402,345 12.433 Caxton Print Holdings Pty Ltd 11,210,231 7.574 J P Morgan Nominees Australia Limited 10,828,047 7.315 National Nominees Limited 10,453,586 7.066 Taverners N Pty Ltd 7,740,136 5.237 BNP Paribas Nominees Pty Ltd <Agency Lending Drp A/C> 4,594,542 3.108 CS Fourth Nominees Pty Limited <HSBC Cust Nom AU Ltd 11 A/C> 3,911,248 2.649 BNP Paribas Noms Pty Ltd <DRP> 3,213,815 2.1710 Brispot Nominees Pty Ltd <House Head NomineE A/C> 2,574,368 1.7411 Strategic Value Pty Ltd <TAL Super A/C> 2,515,948 1.7012 Strategic Value Pty Limited 2,024,414 1.3713 CS Third Nominees Pty Limited <HSBC Cust Nom AU Ltd 13 A/C> 2,007,247 1.3614 Mr Stephen Craig Jermyn <Jermyn Family S/Fund A/C> 2,000,000 1.3514 SCJ Pty Ltd <Jermyn Family Account> 2,000,000 1.3515 UBS Nominees Pty Ltd 1,881,991 1.2716 Pershing Australia Nominees Pty Ltd <YNominee A/C> 1,220,000 0.8217 BNP Paribas Noms (NZ) Ltd <DRP> 1,191,252 0.8018 Shansley Pty Ltd <Ransley Shannon A/C> 988,462 0.6719 BNP Paribas Nominees Pty Ltd HUB24 Custodial Serv Ltd DRP 940,133 0.6320 Neweconomy Com Au Nominees Pty Limited 885,888 0.60
Total 110,907,967 74.89
Balance of register 37,195,688 25.11
Grand total 148,103,655 100.00
On-Market Buy BackThere is no current on-market buy back.
Voting RightsThe voting rights attached to ordinary shares are set out below:
On a show of hands every member present at a meeting in person or by proxy shall have one vote, and upon a poll, one vote for each fully paid share held.
There are no other classes of equity securities.
Voluntary escrowThere were no ordinary shares held in a voluntary escrow arrangement as at 31 July 2018.
Stock Exchange ListingIVE Group securities are only listed on the ASX.
For
per
sona
l use
onl
y

IVE Group Limited Annual Report 2018 IVE Group Limited Annual Report 2018100 101
CORPORATE GOVERNANCE STATEMENTThe Board is responsible for the overall corporate governance of IVE Group Limited, including adopting appropriate policies and procedures designed to ensure that the IVE Group is properly managed to protect and enhance Shareholder interests.
The Board monitors the operational and financial position and performance of IVE and oversees its business strategy, including approving the strategic goals of IVE. The Board is committed to maximising performance, generating appropriate levels of Shareholder value and financial return, and sustaining the growth and success of IVE.
In conducting business with these objectives, the Board is committed to ensuring that IVE is properly managed to protect and enhance Shareholder interests, and that IVE, its Directors, officers and employees operate in an appropriate environment of corporate governance. Accordingly, the Board has created a framework for managing IVE, including adopting relevant internal controls, risk management processes and corporate governance policies and practices, which it believes are appropriate for IVE’s business and that are designed to promote the responsible management and conduct of IVE.
Details of IVE’s key governance policies and the charters for the Board and each of its committees are available on IVE’s website at http://investors.ivegroup.com.au/home/.
The Corporate Governance Statement reports against the 3rd edition of the ASX Corporate Governance Council’s Principles and Recommendations (ASX Principles) and the practices detailed in the Corporate Governance Statement are current as at 31 July 2018. It has been approved by the Board and is available on the IVE website under Investors at http://investors.ivegroup.com.au/home/.
PERCEPTIONSWE MOVE WE MOVEWE MOVE WE MOVE
For
per
sona
l use
onl
y

IVE Group Limited Annual Report 2018 102
WE MOVE
ivegroup.com.au
WE MOVE
For
per
sona
l use
onl
y