2018 annual report - bdc.ca · i am pleased to present bdc’s annual report for fiscal 2018. bdc...
TRANSCRIPT

2018 Annual Report

Table of Contents
Message from the Chairperson of the Board of Directors 2
Message from the President and CEO 4
Management’s Discussion and Analysis 7
Consolidated Financial Statements 45
Corporate Governance 115
Additional Information 124
The only bank devoted exclusively to entrepreneurs

56,000 clients, a 14% increase compared to previous year
123business centres across Canada
+ 100 clients at our Growth Driver Program, for ambitious mid-sized companies that want to grow
$1B in flexible specialized financing and minority equity investments to high-growth mid-market companies
5.6 million visits to BDC’s website
$31B in capital committed to small and medium-sized businesses
$700M to help build globally competitive
cleantech firms
94% client satisfaction
$818.3M in net income reinvested to support entrepreneurs
Fiscal 2018 by the numbers
2018 BDC AR > 1

I am pleased to present BDC’s Annual Report for fiscal 2018.
BDC had a record year in terms of impact on Canadian entrepreneurs, providing more business owners with the financing, capital and advice they needed to grow their businesses. BDC now supports 56,000 entrepreneurs throughout Canada, a 14% increase compared to last year.
The Bank also had a successful year in terms of financial results.
BDC’s performance last year is testament to the leadership, vision and dedication of President and CEO Michael Denham, his management team and all 2,200 BDC employees from coast to coast.
I am honoured to have been appointed Chairperson of BDC’s Board of Directors in March 2018. BDC is an inspiring place. You can see it in the pride, dedication and expertise of its people. This comes from BDC’s unique mission of helping Canadian entrepreneurs succeed.
After more than three decades of experience in the banking industry around the world, I hope to put my experience to work helping BDC perform its mission even better and support Canadian small and medium-sized businesses compete globally.
I would like to thank my predecessor, Sam Duboc, for his stewardship and vision. Sam embraced the mandate of BDC and displayed great leadership, dynamism and tenacity, especially in increasing BDC’s reach and visibility and efforts to be closer to entrepreneurs. Thank you, Sam, for your ideas, drive and dedication.
Thanks also to Robert Pitfield, who served as interim Chairperson from January to March, 2018. Rob provided leadership, stability and continuity allowing BDC to operate seamlessly during the transition. Your contributions are highly appreciated.
BDC is a different kind of bankAs I get to know the organization, I am impressed to see that BDC stands out in many ways.
> The trust entrepreneurs have in BDC speaks to the quality of its interactions and services. For example, BDC knows the path to success isn’t always a straight line and it stands by its clients—through good times and bad. For example, its Business Restructuring Unit helps entrepreneurs who have hit a rough patch and need advice and support to turn their businesses around.
> BDC also provides a wealth of insight and thought leadership on the many challenges—and opportunities—facing entrepreneurs in our quickly evolving world. I was impressed with the quality of entrepreneurship-focused research and content BDC produces.
Message from the Chairperson of the Board of Directors
BDC is a different kind of bank. Its exclusive mandate to support entrepreneurs inspires great pride and dedication among its employees. They are constantly innovating to transform BDC and have greater impact on more business owners.
2018 BDC AR > 2

> Another key differentiating point that appealed to me as a banker was BDC’s non-financial services. It is the only financial institution providing advisory services through a team of seasoned advisors working to help entrepreneurs solve business challenges.
I would like to thank my board colleagues for their dedication, expertise and strategic direction over the past fiscal year.
Here are some of the key activities the board oversaw in fiscal 2018. > Focused on risk governance and strategy,
including monitoring the Bank’s follow-up to a review by the Office of the Superintendent of Financial Institutions.
> Oversaw the deployment of eFirst, a major technological transformation to make it even easier for entrepreneurs to do business with BDC. This will lead to the implementation of a new segmentation model to allow BDC to offer entrepreneurs the right products and services based on their growth ambitions.
> Monitored the implementation of a strategy to broaden reach across Canada. BDC’s four-year Increased Reach and Visibility program saw the opening of eight new business centres and 18 new shared offices. Of this number, four business centres and one shared office were opened last year.
> Supported the continued transformation of BDC Advisory Services, with a focus on increasing the relevance of the services offered to business owners.
Delivering on key shareholder initiatives The board also oversaw BDC’s efforts to support the implementation of the federal government’s key initiatives. This included an important role in supporting the Innovation and Skills Plan with the goal of making Canada a world-leading centre for innovation.
> A key focus was on continuing to advance women entrepreneurship. Last year, the board oversaw a comprehensive review of BDC’s services and offerings to make sure they are accessible for women entrepreneurs. The results didn’t show any evidence of systemic bias.
In fact, we saw that approval rates are higher for women business owners. The real challenge is getting more of them to know that BDC exists and how we can help. As a result, BDC increased its lending target for women entrepreneurs to $1.4 billion from $700 million three years ago. This builds on numerous BDC initiatives to support women entrepreneurs.
> The board continued to support the successful launch of the Venture Capital Catalyst Initiative (VCCI), which will make $400 million available over three years through BDC to increase late-stage venture capital to Canadian entrepreneurs. With private sector incentives, VCCI should deliver over $1.5 billion to the ecosystem.
> This follows the Venture Capital Action Plan, which—under BDC’s management—succeeded in attracting over $1.3 billion from the private sector to the venture capital asset class.
> The federal government’s Budget 2017 enabled BDC to do even more for cleantech companies. BDC’s new Cleantech Practice will deploy $700 million in debt and equity transactions to help build globally competitive Canadian cleantech firms and a commercially sustainable cleantech industry.
> BDC continued to work with other federal government partners, including Export Development Canada, Sustainable Development Technology Canada and Global Affairs Canada to support entrepreneurs and foster innovation and growth.
Looking forwardI am excited to continue working with my board colleagues and BDC’s management team to build on the great momentum the Bank has right now. I would like to thank everybody at BDC for the outstanding work they are doing to help advance entrepreneurship in Canada.
Sincerely,
Mike Pedersen Chairperson of the Board
2018 BDC AR > 3

The world is quickly changing and so are we at BDC. Canadian businesses face a complex business reality—the technology revolution, global competition and labour shortages are just a few of the top challenges they are facing.
As Canada’s only bank devoted exclusively to entrepreneurs, our job is to support business owners to turn these challenges into opportunities, and ultimately to help them become the most competitive in the world. With loans, advice and capital for all stages of growth, we are there to work with Canadian business owners who want to innovate, scale and grow internationally.
Record number of clientsAs I reflect on the difference we are making with entrepreneurs, I could not be more proud of the work of our 2,200 BDC employees across Canada.
We now support 56,000 clients, a record for BDC. We not only boosted our client numbers, but also broadened the diversity of those we accompany. We continued implementing our comprehensive approach to supporting more women entrepreneurs.
We also made important strides to make it even easier for entrepreneurs to do business with us and offer a more exceptional client experience, by investing in our online financing and by equipping our sales team with
a range of applications and mobility tools to facilitate client interactions. In fact, 94% of the entrepreneurs with whom we work are satisfied with our services.
In March 2018, we were also pleased to welcome Mike Pedersen as the new Chairperson of BDC’s Board of Directors. I look forward to working closely with Mike in our efforts to help entrepreneurs build a stronger Canadian economy. I would like to thank our outgoing chair Sam Duboc for pushing us to think big. His vision and leadership helped drive BDC further.
We accomplished a great deal this yearWe continually seek to offer faster, better and easier banking to our customers.
> Our clients accepted $6.8 billion in loans over the last fiscal year.
> We now offer more products and services online and via mobile devices.
> Our clients can apply for loans of up to $100,000 online at bdc.ca.
> For eligible existing clients, our account managers can write loans on tablets, 100% digitally, at a client’s place of business. Authorizing one of these loans takes under three minutes and reflects how we intend to work in the future.
Message from the President and CEO
BDC continues to work hard to support entrepreneurs’ efforts to grow their businesses and succeed. In fiscal 2018, we had greater success than ever. We now work with 56,000 clients in every part of Canada, a record for BDC.
2018 BDC AR > 4

BDC reached more entrepreneurs > Last year, we opened four new business centres
and one new shared office, bringing the total number of business centres to 123.
> Our website, bdc.ca, had 5.6 million visits, an increase of 25% over the previous year. BDC publications reached 220,000 readers last year.
> We were recertified as a Beneficial Corporation (B Corp) for the third time. This certification is part of a growing international movement to use the power of business for broader societal good. To continue raising awareness, BDC held B Corp workshops and presentations from coast to coast, reaching close to 9,000 entrepreneurs and business leaders.
We also continued delivering on our promise to do more to support women entrepreneurs.
> Three years ago, we took a comprehensive approach to advancing women entrepreneurship. We committed to increasing our lending to women entrepreneurs to at least $700M by the end of fiscal year 2018. We achieved this target eight months ahead of schedule. Over this period, we added 2,200 majority-owned women businesses to our portfolio and increased the dollar value of our loans to women entrepreneurs by 28%.
> Looking ahead, we will take it further. Following the federal government’s 2018 budget, we set a new lending target of $1.4 billion for women entrepreneurs by the end of fiscal year 2021, double the amount committed back in 2015.
> We also increased the size of our Women in Tech Fund from $70 million to $200 million, making it the largest such fund in the world.
Entrepreneurs’ capacity to innovate and scale up is the cornerstone of Canada’s prosperity. With over $3 billion under management, BDC Capital, the investment arm of BDC, serves as a strategic partner for Canada’s most innovative businesses.
> BDC Capital’s Growth & Transition Capital’s provides flexible specialized financing and minority equity investments to high-growth mid-market companies. Its portfolio reached a major milestone this year, surpassing $1 billion.
> On the venture capital front, we had a very successful year. In fact, our venture capital operations achieved exceptional profitability, with $159.3 million in net income, reflecting the success of the companies in which we invest. We are the largest and most active VC investor in the country and are proud to count 700 innovative tech-focused businesses, employing over 30,000 Canadians, in our portfolio.
We continued to expand our efforts to support leading clean technology businesses in their journey to become international champions. Building on our long history of investing in the cleantech industry, and further to the 2017 federal budget, we launched a national team of cleantech investment and financing professionals. This team will deploy BDC’s $700-million, five-year commitment to support high-potential cleantech innovators at the early stages of commercialization and with an ambition to grow.
In May 2017, BDC committed to authorizing $280 million to support companies in Atlantic Canada pursuing growth opportunities in the information and communication technology (ICT), agri-food, ocean technology and tourism industries. During fiscal 2018, entrepreneurs in the region received over $140 million in financing to grow their business.
2018 BDC AR > 5

As Canada’s development bank, we know that entrepreneurs need more than capital to succeed. This is why we continued to focus on non-financial support for Canadian business owners through our advisory services line of business.
> Last year, we delivered 1,500 advisory mandates helping entrepreneurs make their businesses more innovative, productive and competitive.
> We also passed the 100-client mark last year in our Growth Driver Program—a unique program, specifically designed for ambitious mid-sized companies that want to grow. We give these firms access to a Canada-wide network of seasoned business leaders with experience in more than 30 sectors.
Solid financial resultsAs a self-financing Crown corporation and in order to do even more for entrepreneurs, BDC needs to remain profitable. I am pleased to report that BDC earned consolidated net income of $818.3 million in fiscal 2018. We saw an improvement in our efficiency ratio as a result of good control of expenses. We also experienced portfolio growth, reflecting the quality and good performance of the SMEs in which we invest.
The year’s results will allow a dividend payment of $69.7 million to the Government of Canada, our sole shareholder. The remainder will be reinvested in our balance sheet to continue to enable us to provide more relevant support for Canadian business owners.
A great place to workWe know that engaged, motivated and dedicated employees do a better job for clients. I am proud that BDC was awarded Canada’s Top 100 Employer distinction for the 12th year in a row. BDC was also certified as a Great Place to Work and got high marks for credibility, respect, fairness and pride in the workplace.
It is my honour to work with such a talented pan-Canadian team. They are the reason for our outstanding client satisfaction rate. I would like to sincerely thank our 2,200 employees for making BDC a great partner for entrepreneurs and for a very successful year.
A reliable partner for Canadian entrepreneursI would like to close by thanking the tens of thousands of Canadian entrepreneurs who partner with us. We are proud to be by your side and help you achieve your goals. We will continue to work on new ways to support you every step of the way—because when you succeed, we all succeed.
Sincerely,
Michael Denham President and CEO
2018 BDC AR > 6

Management’s Discussion and Analysis 1 . Economic Environment 82. Performance Measures Results 93. Analysis of Financial Results 144. Risk Management 325. Accounting and Control Matters 42
2018 BDC AR > 7

The Canadian economy experienced strong growth in calendar 2017 supported by external demand and higher commodity prices.
Major economies around the world enjoyed stronger growth in 2017, reflecting firmer domestic demand in advanced economies and China as well as improved performance in other large emerging market economies, including India, Brazil and Russia.
Global trade growth increased to 3.6%—a big jump from 1.3% in 2016—contributing significantly to world economic growth. Trade and investment depend on solid business and consumer confidence, which have also improved recently.
Higher domestic demand in China is supporting the economy’s shift from export-led to consumer-led growth. Gross domestic product (GDP) growth hit 6.8% in 2017, up from 6.7% in 2016. India had the strongest growth among major economies in 2017 at 7.6%. With a population of 1.3 billion people, India’s contribution to global growth will only strengthen as its economy develops.
The European economy had one of its best years of late, with the euro area growing by 2.5%. Due to the uncertainty generated by Brexit, Britain grew only 1.7% in 2017. Japan’s economic growth doubled, increasing to 1.8% in 2017 from 0.9% in 2016.
In the United States, growth improved to 2.3% in 2017, up from 1.6% in 2016. Employment grew impressively, moving the unemployment rate down to 4.1% in October, where it remained for the rest of the year. The tightening labour market is beginning to translate into increased average hourly wages. With more money in their pockets, households spent more and this higher consumption contributed strongly to the higher economic growth. Business investment also contributed to growth, while residential investment was essentially flat.
Growth accelerated in Canada to 3.0% in 2017 from 1.5% in 2016, making the country the best performer among G7 nations. The recovery in oil prices fueled a broad-based expansion across the country.
Production in the oil and gas sector strengthened in 2017. Similarly, investments in the oil sector improved, though not to the levels seen in 2014 before the oil price collapse. Importantly, business investment picked up considerably in the last few months of the year, growing over 8% for the year, as firms purchased more machinery and equipment.
The goods producing sector bounced back last year, increasing by 4.6%, after declining in both 2015 and 2016, while service industries continued their steady growth of 2.8%.
Solid economic growth and a tighter labour market prompted the Bank of Canada to raise its overnight lending rate twice in 2017 and again in January 2018, reaching 1.25%. Canada’s strong economic growth and the rate increases propelled the Canadian dollar higher earlier in the year against the U.S. dollar. However, as protectionist sentiment south of the border and uncertainty surrounding the renegotiation of NAFTA worsened, the Canadian dollar traded lower.
Although the Canadian dollar remained at an export-friendly level, export growth was lacklustre, growing only 1% on a real basis. However, exports remain at a high level with energy deliveries being by far the most important contributor.
The Canadian labour market improved considerably in 2017. Employment growth was robust with more than 420,000 jobs—mostly full-time—created during the year. The unemployment rate fell to a near-historic low of 5.8% at the end of the year. The solid employment situation bodes well for households to manage steadily rising mortgage and credit-card payments as interest rates gradually rise. Nevertheless, indebted Canadians will have less disposable income to spend on goods and services.
In summary, synchronized global growth and recovering oil prices fueled broad-based economic growth in Canada in 2017. The energy sector’s output helped to drive manufacturing activity, especially in machinery manufacturing. The services industry continued to enjoy steady growth. While export growth was weak, Canada is exporting at very high levels with the energy sector seeing the strongest performance, growing 10% in volume terms. Consumer spending and residential investment benefitted from the good performance of the labour market and relatively low interest rates.
➀ Economic Environment
Management’s Discussion and Analysis
2018 BDC AR > 8

BDC’s performance measures support its aspiration to make Canadian entrepreneurs the most competitive in the world. They are aligned with shareholder priorities and BDC’s client impact strategic objectives below.
BDC’s performance measures and targets are based on the business environment in which Canadian small and medium-sized enterprises (SMEs) operate, as well as BDC’s previous and expected performance.
➁ Performance Measures Results
Management’s Discussion and Analysis
Increasing access to capital and advice for entrepreneurs
As a development bank, BDC’s role is to meet the needs of underserved entrepreneurs with its combination of guidance, investment and financial support that complement the private sector. BDC pays particular attention to certain demographics, such as women entrepreneurs and certain business types, such as small businesses and those with limited available collateral. To reach as many underserved SMEs as possible, BDC partners with public and private sector organizations. BDC also focuses on offering ease, speed and convenience to efficiently increase its reach and better meet evolving client expectations.
Accelerating growth, innovation and productivity for targeted entrepreneurs
Canadian SMEs continue to face challenges hindering their competitiveness: difficulty scaling up, lagging productivity, low spending on R&D, and over–reliance on U.S. demand. With a special focus on firms that have the potential to impact the Canadian economy the most, such as high-growth and high-impact firms, BDC provides capital and advice that enable these types of SMEs to succeed, especially by accelerating their growth, innovation, productivity and globalization.
Improving the Canadian entrepreneurial ecosystem
With over 70 years of experience supporting Canadian SMEs, BDC has gained a deep understanding of the challenges entrepreneurs face. It shares its expertise through a variety of easily accessible channels, such as online educative content and research to ensure a better understanding of success factors to make the Canadian entrepreneurial ecosystem healthier and even more vibrant. BDC is in a unique position to establish relationships and collaborate with partners and influencers, so that together, we enable the success of Canadian SMEs. BDC is especially active in strengthening the innovation ecosystem to make Canadian venture capital a financially attractive asset class for private sector investors. In addition to its direct VC funds, whose positive returns demonstrate the viability of the asset class, BDC invests in private sector funds to help create the next generation of Canadian fund managers. It also leverages its extensive knowledge of the market and its many relationships with industry stakeholders to provide a suite of non-investment ecosystem-building initiatives.
2018 BDC AR > 9

Management’s Discussion and Analysis | Performance Measures Results
Short term (1 year) Objective Performance measure
Target Fiscal 2018
Result Fiscal 2018
Percentage achieved
Rationale
Provide financing to small businesses
# of acceptances(1) 11,700 14,228 121% BDC strives to help small businesses meet their financing needs.
Provide asset-light financing
$ of acceptances, Growth & Transition Capital and BDC Financing unsecured loans ($ in millions) 1,240 1,385 112% BDC supports businesses that require financing
even if they have little or no collateral.
Support women entrepreneurs
$700 million financing for majority women-owned businesses, cumulative fiscal 2016 to fiscal 2018 700 1,000 143%
BDC has committed to providing a cumulative $700 million over three years (to fiscal 2018) in financing to majority women-owned businesses.
Support Indigenous entrepreneurs
# of clients identified as Indigenous 550 633 115%BDC aims to address the unique challenges faced by Indigenous businesses through our Indigenous Banking Unit.
Make it easy for clients to do business with BDC
% of very satisfied clients(2) 65 67 103%BDC is continuing its efforts to understand entrepreneurs and their needs, and create a positive client experience.
Work in partnership to extend reach and provide support to entrepreneurs
# of transactions done through partnerships(3) 2,300 2,469 107% BDC works with partners to maximize entrepreneurs’ success.
# of indirect clients(4) 8,000 11,100 139% BDC supports alternative lenders to improve access to financing for underserved markets.
Provide advisory services to accelerate growth, innovation and productivity
# of mandates for BDC Advisory Services(5) 1,875 1,502 80%BDC Advisory Services provides entrepreneurs with much-needed advice, knowledge and skill-building opportunities, delivered by a network of external consultants.
Support Canada’s most promising firms and enable them to contribute fully to the economy
% of $ of acceptances for high-growth firms, G&TC 35 41 111%To help firms overcome growth challenges, BDC has a tailored offering geared toward firms with ambition to grow.
Increasing access to capital and advice for entrepreneurs
Accelerating growth, innovation and productivity for targeted entrepreneurs
Improving the Canadian entrepreneurial ecosystem
2018 BDC AR > 10

Unless otherwise noted, all data is sourced from BDC’s portfolio.
(1) BDC Financing and Growth & Transition Capital loans with a commitment size of ≤ $750,000.
(2) “Very satisfied” clients gave a score of 9 or 10 out of 10 for their overall satisfaction with BDC services.
(3) Includes transactions done in collaboration with chartered banks, other lenders, government agencies and Crown corporations, and community futures and other economic development agencies, and under specific agreements.
(4) Excluding clients served by ATB Financial.
(5) Includes mandates for high-impact firms, international expansion and advisory services.
Management’s Discussion and Analysis | Performance Measures Results
Short term (1 year) Objective Performance measure
Target Fiscal 2018
Result Fiscal 2018
Percentage achieved
Rationale
Provide financing to small businesses
# of acceptances(1) 11,700 14,228 121% BDC strives to help small businesses meet their financing needs.
Provide asset-light financing
$ of acceptances, Growth & Transition Capital and BDC Financing unsecured loans ($ in millions) 1,240 1,385 112% BDC supports businesses that require financing
even if they have little or no collateral.
Support women entrepreneurs
$700 million financing for majority women-owned businesses, cumulative fiscal 2016 to fiscal 2018 700 1,000 143%
BDC has committed to providing a cumulative $700 million over three years (to fiscal 2018) in financing to majority women-owned businesses.
Support Indigenous entrepreneurs
# of clients identified as Indigenous 550 633 115%BDC aims to address the unique challenges faced by Indigenous businesses through our Indigenous Banking Unit.
Make it easy for clients to do business with BDC
% of very satisfied clients(2) 65 67 103%BDC is continuing its efforts to understand entrepreneurs and their needs, and create a positive client experience.
Work in partnership to extend reach and provide support to entrepreneurs
# of transactions done through partnerships(3) 2,300 2,469 107% BDC works with partners to maximize entrepreneurs’ success.
# of indirect clients(4) 8,000 11,100 139% BDC supports alternative lenders to improve access to financing for underserved markets.
Provide advisory services to accelerate growth, innovation and productivity
# of mandates for BDC Advisory Services(5) 1,875 1,502 80%BDC Advisory Services provides entrepreneurs with much-needed advice, knowledge and skill-building opportunities, delivered by a network of external consultants.
Support Canada’s most promising firms and enable them to contribute fully to the economy
% of $ of acceptances for high-growth firms, G&TC 35 41 111%To help firms overcome growth challenges, BDC has a tailored offering geared toward firms with ambition to grow.
2018 BDC AR > 11
Management’s Discussion and Analysis | Performance Measures Results
Objective Performance measureTarget
Fiscal 2020Result
Fiscal 2018 Rationale
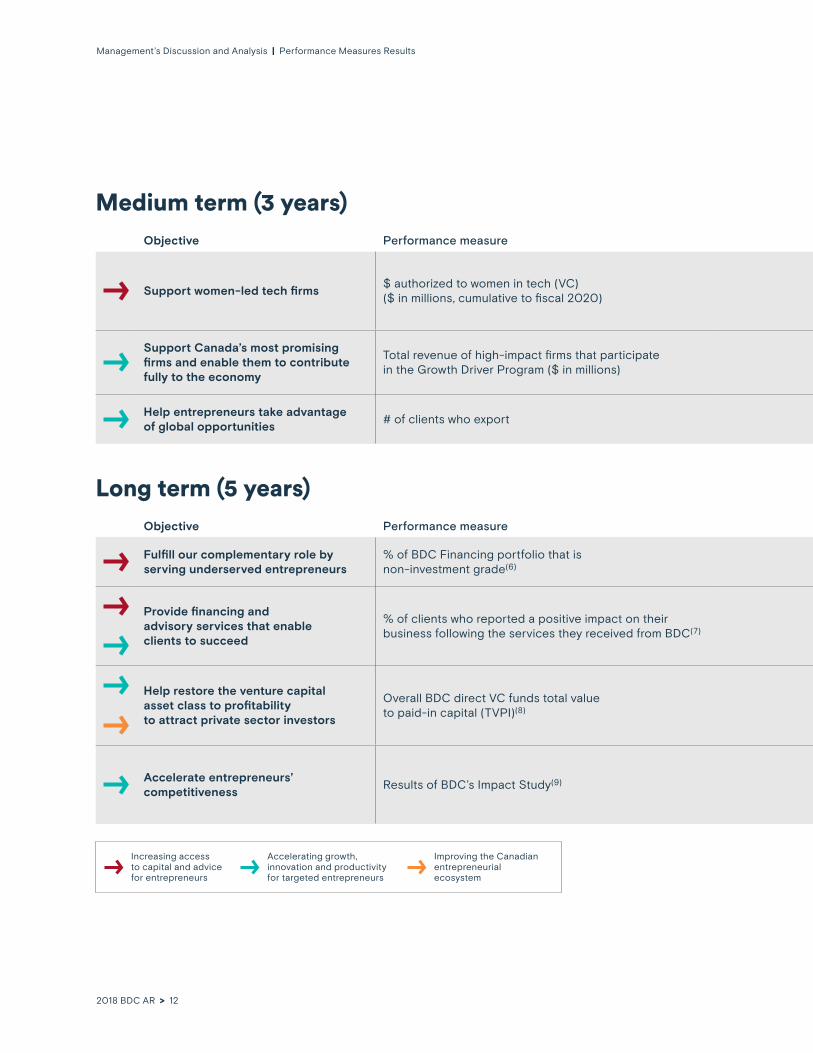
Support women-led tech firms$ authorized to women in tech (VC) ($ in millions, cumulative to fiscal 2020) 50 8.2
BDC has committed to providing a cumulative $50 million over a three-year period (up to fiscal 2020) to support women in tech. The Women In Tech fund size has since been increased to $200M as a result of the 2018 federal budget.(10)
Support Canada’s most promising firms and enable them to contribute fully to the economy
Total revenue of high-impact firms that participate in the Growth Driver Program ($ in millions) 8,800 3,635
With our Growth Driver Program, BDC Advisory Services is already helping slightly more than 100 high-impact firms achieve sustainable growth by providing expert advice to their CEO and management teams.
Help entrepreneurs take advantage of global opportunities
# of clients who export 6,350 6,568 BDC continues to support entrepreneurs’ international expansion efforts.
Objective Performance measureTarget
Fiscal 2022Result
Fiscal 2018 Rationale
Fulfill our complementary role by serving underserved entrepreneurs
% of BDC Financing portfolio that is non-investment grade(6)
Maintain minimum of 93 93% BDC activities are complementary to those of other financial institutions.
Provide financing and advisory services that enable clients to succeed
% of clients who reported a positive impact on their business following the services they received from BDC(7)
Maintain minimum of 89 90% BDC continues to ensure clients receive tailored support
that meets their needs.
Help restore the venture capital asset class to profitability to attract private sector investors
Overall BDC direct VC funds total value to paid-in capital (TVPI)(8) 1.25 or higher 1.30 BDC aims to reach profitability in our venture capital operations
to attract investors to this asset class.
Accelerate entrepreneurs’ competitiveness
Results of BDC’s Impact Study(9)
BDC has a positive impact
on revenue growth
N/A BDC strives to have a positive influence on the sales growth of businesses.
Increasing access to capital and advice for entrepreneurs
Accelerating growth, innovation and productivity for targeted entrepreneurs
Improving the Canadian entrepreneurial ecosystem
Medium term (3 years)
Long term (5 years)
2018 BDC AR > 12

Management’s Discussion and Analysis | Performance Measures Results
Unless otherwise noted, all data are sourced from BDC’s portfolio
(6) Non-investment grade is rated BB+ or less.
(7) Source: BDC Client Voice survey
(8) TVPI, a VC industry standard metric, is a ratio of the current value of investments to the original amount invested. BDC’s direct VC funds are Information Technology (IT), Healthcare, and Industrial, Clean and Energy Technology (ICE).
(9) Source: Statistics Canada, BDC: Measuring BDC’s impact on its clients. Study performed every five years.
(10) Includes investments since beginning of program (fiscal 2017).
Objective Performance measureTarget
Fiscal 2020Result
Fiscal 2018 Rationale
Support women-led tech firms$ authorized to women in tech (VC) ($ in millions, cumulative to fiscal 2020) 50 8.2
BDC has committed to providing a cumulative $50 million over a three-year period (up to fiscal 2020) to support women in tech. The Women In Tech fund size has since been increased to $200M as a result of the 2018 federal budget.(10)
Support Canada’s most promising firms and enable them to contribute fully to the economy
Total revenue of high-impact firms that participate in the Growth Driver Program ($ in millions) 8,800 3,635
With our Growth Driver Program, BDC Advisory Services is already helping slightly more than 100 high-impact firms achieve sustainable growth by providing expert advice to their CEO and management teams.
Help entrepreneurs take advantage of global opportunities
# of clients who export 6,350 6,568 BDC continues to support entrepreneurs’ international expansion efforts.
Objective Performance measureTarget
Fiscal 2022Result
Fiscal 2018 Rationale
Fulfill our complementary role by serving underserved entrepreneurs
% of BDC Financing portfolio that is non-investment grade(6)
Maintain minimum of 93 93% BDC activities are complementary to those of other financial institutions.
Provide financing and advisory services that enable clients to succeed
% of clients who reported a positive impact on their business following the services they received from BDC(7)
Maintain minimum of 89 90% BDC continues to ensure clients receive tailored support
that meets their needs.
Help restore the venture capital asset class to profitability to attract private sector investors
Overall BDC direct VC funds total value to paid-in capital (TVPI)(8) 1.25 or higher 1.30 BDC aims to reach profitability in our venture capital operations
to attract investors to this asset class.
Accelerate entrepreneurs’ competitiveness
Results of BDC’s Impact Study(9)
BDC has a positive impact
on revenue growth
N/A BDC strives to have a positive influence on the sales growth of businesses.
2018 BDC AR > 13

Management’s Discussion and Analysis
Lines of businessBDC reports on six business lines: Financing, Growth & Transition Capital, Venture Capital (VC), Advisory Services, Venture Capital Action Plan (VCAP) and a newly created business line, Cleantech Practice, in response to the 2017 federal budget. In past years, Financing and Securitization were presented as separate segments. Starting in fiscal 2018, BDC no longer reports on Securitization separately and presents asset-backed securities (ABS) as a product of Financing.
ActivitiesThe Business Development Bank of Canada (BDC) is the only bank devoted exclusively to Canadian entrepreneurs, accompanying them at every step of their business journey. BDC provides a complementary combination of guidance, investment and financial support to help entrepreneurs take the necessary steps to succeed.
Financing helps improve the competitiveness of small and medium-sized enterprises (SMEs) by providing term lending and collaborating with other financial institutions to increase credit availability in the market through co-lending, syndicated loans and indirect financing. During the year, clients of Financing accepted a total of $6.8 billion in loans, in line with an exceptional level of activities in fiscal 2017 when $6.6 billion was accepted.
BDC Advisory Services encompasses BDC’s non-financial offerings and provides tools and services for firms looking to expand abroad and increase their productivity, growth and managerial capabilities. Net sales from Advisory Services reached $25.1 million, compared to $24.3 million recorded last year.
Growth & Transition Capital offers patient funding to growing firms with limited tangible assets to offer as collateral, while limiting dilution of share capital ownership. Growth & Transition Capital continued to support the growth plans of Canadian entrepreneurs through its diverse product offerings, with clients accepting a total of $426.9 million in financing this year, compared to $320.5 million last year. During fiscal 2018, Growth & Transition Capital’s portfolio reached $1 billion, an important milestone.
During fiscal 2018, BDC Capital announced it had earmarked $900 million for change of ownership transactions as part of the $1.8 billion it committed to investing in high-potential firms over five years.
With BDC Capital’s help, business owners have the opportunity to withdraw capital while maintaining ownership of the company, which is often the first step in a phased succession plan. In addition, BDC Capital completed over $57 million in minority equity investments in high-growth mid-sized Canadian businesses. These investments are part of the bank’s commitment, announced in June 2017, to invest $250 million in growth equity over the next five years to help mid-sized firms scale up.
BDC continued to strengthen the innovation ecosystem with its venture capital activities. These helped Canadian innovators launch and grow technology-focused businesses and commercialize innovations, while also serving to build the skills of VC fund managers. In fiscal 2018, Venture Capital authorized investments totalling $178 million, compared to $161 million last year.
In fiscal 2018, BDC increased its support for women-led technology firms by committing an additional $20 million to its Women in Technology Fund. This brings the total fund size to $70 million. As part of the 2017 federal budget, this commitment increased to $200 million.
On behalf of the Government of Canada, BDC continued to manage the Venture Capital Action Plan (VCAP). Through VCAP, the government committed $340 million to four private sector funds of funds and $50 million to four high-performing VC funds. This capital was used to leverage over $900 million in private sector capital and $113 million from provincial governments, bringing the total venture capital raised under VCAP to $1.4 billion.
In fiscal 2018, BDC also launched two major initiatives to help position Canada as a nation of innovators: the Cleantech Practice and the Venture Capital Catalyst Initiative (VCCI).
During fiscal 2018, BDC launched the Cleantech Practice to deliver $600 million in additional capital entrusted to BDC by the federal government to help build globally competitive Canadian cleantech firms and a long-term, commercially sustainable cleantech industry that can attract significant private capital investment. To deliver on this mandate, BDC developed Cleantech Practice and established a new business line with dedicated expertise and resources to accomplish the mandate’s policy objectives while respecting its risk tolerance. At the end of fiscal 2018, acceptances for Cleantech Practice totalled $40 million with close to $10 million disbursed.
➂ Analysis of Financial Results
2018 BDC AR > 14

Management’s Discussion and Analysis | Analysis of Financial Results
Based on the early success of VCAP, the government asked BDC to manage VCCI, through which it allocates additional capital to further increase the availability of late-stage venture capital for Canadian entrepreneurs. The 2017 federal budget made available an additional $400 million for VCCI, which will be used to leverage private capital up to a total pool of $1.5 billion.
Financial results overviewFor the analysis of financial results, please also refer to Note 26—Segmented Information to the Consolidated Financial Statements.
Consolidated net incomeBDC reported consolidated net income of $818.3 million this year. Net income attributable to BDC’s shareholder amounted to $775.0 million, while net income of $43.3 million was attributable to non-controlling interests. Non-controlling interests relate to Growth & Transition Capital and Venture Capital operations.
Net income from Financing was $613.7 million, an increase of $163.0 million from last year. The increase in profitability was mainly due to higher net interest and fee income as a result of strong portfolio growth and by lower provisions for credit losses due to higher recoveries.
Advisory Services reported a net loss of $51.0 million, higher than the net loss of $45.8 million recorded last year, as BDC continued to invest to develop its non-financial services, including new offerings for Canada’s high-impact firms (Growth Driver Program), the Accelerated Growth Service (AGS) program and an enhanced offering to help businesses expand internationally. Most of what Advisory Services
does is considered an investment in fostering the competitiveness of Canadian businesses.
Net income from Growth & Transition Capital was $71.2 million, $26.6 million higher than last year. These strong results were mainly due to the partial sale of one investee. Fiscal 2017 net income was affected by higher fair value depreciation in the oil & gas sector.
Venture Capital recorded solid results: net income of $159.3 million for fiscal 2018, compared to $5.2 million recorded last year. Fiscal 2018 net income was favourably impacted by a significant fair value appreciation following the partial sale of one investee, good performance of our fund investments and two successful initial public offerings (IPOs), the first venture capital-backed IPOs in the life sciences sector in Canada in the last 10 years.
VCAP recorded net income of $25.7 million, compared to net income of $10.1 million last year, mainly due to a higher net change in unrealized appreciation of investments.
Net loss from Cleantech Practice was $0.6 million, as BDC started allocating resources to this new business line during fiscal 2018.
Net income attributable to non-controlling interests was $43.3 million in fiscal 2018 ($12.4 million in net income from Growth & Transition Capital and $30.9 million from Venture Capital), compared to net loss of $1.2 million in fiscal 2017 ($0.2 million in net income from Growth & Transition Capital and $1.4 million in net loss from Venture Capital). The increase in net income attributable to non-controlling interest was mainly due to the partial sale of one investee.
Consolidated net income—by business segmentfor the years ended March 31 ($ in millions)
2018 2017 2016 2015 2014
Financing 613.7 450.7 444.9 457.4 439.6
Advisory Services (51.0) (45.8) (31.6) (24.2) (16.9)
Growth & Transition Capital 71.2 44.6 53.7 38.5 23.3
Venture Capital 159.3 5.2 67.4 23.3 (12.0)
Venture Capital Action Plan 25.7 10.1 3.3 (4.3) (1.4)
Cleantech Practice (0.6) – – – –
Net income 818.3 464.8 537.7 490.7 432.6
Net income attributable to:
BDC's shareholder 775.0 466.0 535.4 490.5 426.0
Non-controlling interests 43.3 (1.2) 2.3 0.2 6.6
Net income 818.3 464.8 537.7 490.7 432.6
2018 BDC AR > 15

Management’s Discussion and Analysis | Analysis of Financial Results
Return on common equityBDC’s return on common equity (ROE) was 12.1% in fiscal 2018, higher than the 10-year moving average of 9.8%, as a result of BDC’s solid performance in fiscal 2018.
Consolidated comprehensive incomeConsolidated comprehensive income for fiscal 2018 was $754.3 million, compared to $536.5 million last year. Fiscal 2018 consolidated comprehensive income comprised of $794.8 million in consolidated net income and $40.5 million in other comprehensive loss. The other comprehensive loss for the year was mostly due to the remeasurement loss on the net defined benefit asset or liability of $36.8 million, compared to a gain of $72.8 million in fiscal 2017. For the most part, this loss was caused by lower discount rates used to value the net defined benefit liability, partially offset by higher returns on pension plan assets. For further details, refer to Note 20—Net Defined Benefit Asset or Liability to the Consolidated Financial Statements.
Return on common equity (ROE)as at March 31
14%
12%
10%
8%
6%
4%
2%
0%0
2
4
6
8
10
12
14
0
2
4
6
8
10
12
14
2014 2015 2016 2017 2018
n ROE(1)
10.2% 10.6% 10.3% 8.2% 12.1%
ROE – 10-year moving average
8.9% 9.2% 9.3% 9.2% 9.8%
(1) ROE is calculated based on equity attributable to BDC’s shareholder (See the Glossary on page 126 for a detailed definition).
Consolidated comprehensive incomefor the years ended March 31 ($ in millions)
2018 2017 2016 2015 2014
Net income 818.3 464.8 537.7 490.7 432.6
Other comprehensive income (loss) Items that may be reclassified subsequently to net income Net change in unrealized gains (losses) on available-for-sale assets (3.6) (1.7) (3.0) 1.7 0.3 Net change in unrealized gains (losses) on cash flow hedges (0.1) 0.6 (1.1) 0.7 (3.4) Total items that may be reclassified subsequently to net income (3.7) (1.1) (4.1) 2.4 (3.1)
Items that will not be reclassified to net income Remeasurements of net defined benefit asset or liability (36.8) 72.8 (39.5) (32.7) 52.7 Other comprehensive income (loss) (40.5) 71.7 (43.6) (30.3) 49.6
Total comprehensive income 777.8 536.5 494.1 460.4 482.2
Total comprehensive income attributable to:
BDC's shareholder 734.5 537.7 491.8 460.2 475.6 Non-controlling interests 43.3 (1.2) 2.3 0.2 6.6 Total comprehensive income 777.8 536.5 494.1 460.4 482.2
2018 BDC AR > 16

Management’s Discussion and Analysis | Analysis of Financial Results
Performance against objectivesThe consolidated net income of $818.3 million was significantly better than the corporate plan objective of $485 million. All business lines achieved better results than planned. Fiscal 2018 corporate plan objectives did not include Cleantech Practice.
Financing’s net income was $96.7 million higher than planned, primarily due to a lower provision for credit losses and higher net interest, fee and other income than anticipated.
Advisory Services’ net loss of $51.0 million was $3.3 million lower than expected, mainly as a result of lower-than-anticipated operating and administrative expenses.
Growth & Transition Capital’s net income of $71.2 million also contributed to the positive variance and was $18.0 million higher than the corporate plan objective, mainly due to a higher-than-anticipated net revenue on investments.
Both Venture Capital’s and Venture Capital Action Plan’s net income were significantly higher than expected, mainly due to a higher-than-anticipated net change in unrealized appreciation of investments. However, the increase in Venture Capital’s net income was partially offset by higher net unrealized foreign exchange losses on the U.S. denominated venture capital investments.
FinancingFinancing helps improve the competitiveness of SMEs by meeting the financing needs of underserved entrepreneurs. It provides term lending to SMEs at the start-up stage and throughout their business journey. BDC also collaborates with other financial institutions to increase credit availability in the market through co-lending and syndicated loans and indirect financing.
BDC continued to increase the ease, speed and convenience for entrepreneurs to access its services and has invested resources in past years to enhance its delivery model, online platform, and automation of processes.
In fiscal 2016, BDC earmarked $700 million in term lending over three years for majority women-owned businesses. BDC has since authorized $1.0 billion in loans, surpassing its objective, a testimony of BDC’s support to women entrepreneurs. BDC is also encouraging investment activity and initiatives to support women in senior management positions through coaching, mentoring and education.
Financing portfolioThe financing portfolio comprises mainly loans and asset-backed securities (ABS), and a marginal subordinate financing investment. Financing’s loan portfolio, before allowance for credit losses, increased by 8.8% from $22.4 billion a year ago to $24.4 billion as at March 31, 2018, mainly due to a strong level of activities in the loan portfolio. The closing loan portfolio comprised $23.6 billion in performing loans and $0.8 billion in impaired loans. As at March 31, 2018, 73.9% of the loan portfolio was composed of floating-rate loans, slightly lower than the fiscal 2017 level of 74.4%.
Financing portfolio(1)
as at March 31 ($ in millions)
25,000
20,000
15,000
10,000
5,000
00
5000
10000
15000
20000
25000
2014 2015 2016 2017 2018
n Fixed-rate loan portfolio 3,795 3,886 4,474 5,739 6,371
n Floating-rate loan portfolio 13,954 15,058 15,849 16,710 18,062
nn Total loans portfolio 17,749 18,944 20,323 22,449 24,433
n Asset-backed securities portfolio 336 408 510 518 473
nnnTotal Financing portfolio 18,085 19,352 20,833 22,967 24,906
(1) Excluding subordinate financing investments of $9.8 million.
2018 BDC AR > 17
Management’s Discussion and Analysis | Analysis of Financial Results
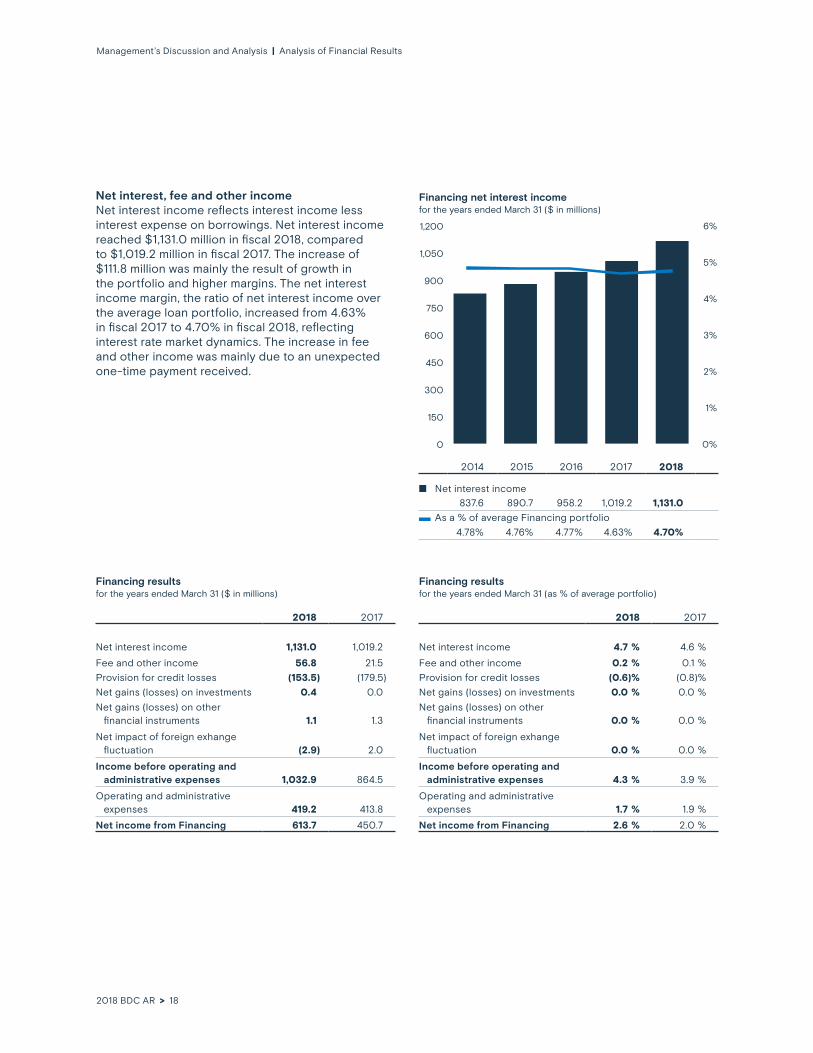
Net interest, fee and other incomeNet interest income reflects interest income less interest expense on borrowings. Net interest income reached $1,131.0 million in fiscal 2018, compared to $1,019.2 million in fiscal 2017. The increase of $111.8 million was mainly the result of growth in the portfolio and higher margins. The net interest income margin, the ratio of net interest income over the average loan portfolio, increased from 4.63% in fiscal 2017 to 4.70% in fiscal 2018, reflecting interest rate market dynamics. The increase in fee and other income was mainly due to an unexpected one-time payment received.
Financing net interest incomefor the years ended March 31 ($ in millions)
1,200
1,050
900
750
600
450
300
150
0
6%
5%
4%
3%
2%
1%
0%0
150
300
450
600
750
900
1050
1200
0
1
2
3
4
5
6
2014 2015 2016 2017 2018
n Net interest income 837.6 890.7 958.2 1,019.2 1,131.0
As a % of average Financing portfolio
4.78% 4.76% 4.77% 4.63% 4.70%
Financing resultsfor the years ended March 31 ($ in millions)
2018 2017
Net interest income 1,131.0 1,019.2
Fee and other income 56.8 21.5
Provision for credit losses (153.5) (179.5)
Net gains (losses) on investments 0.4 0.0
Net gains (losses) on other financial instruments 1.1 1.3
Net impact of foreign exhange fluctuation (2.9) 2.0
Income before operating and administrative expenses 1,032.9 864.5
Operating and administrative expenses 419.2 413.8
Net income from Financing 613.7 450.7
Financing resultsfor the years ended March 31 (as % of average portfolio)
2018 2017
Net interest income 4.7 % 4.6 %
Fee and other income 0.2 % 0.1 %
Provision for credit losses (0.6) % (0.8) %
Net gains (losses) on investments 0.0 % 0.0 %
Net gains (losses) on other financial instruments 0.0 % 0.0 %
Net impact of foreign exhange fluctuation 0.0 % 0.0 %
Income before operating and administrative expenses 4.3 % 3.9 %
Operating and administrative expenses 1.7 % 1.9 %
Net income from Financing 2.6 % 2.0 %
2018 BDC AR > 18
Management’s Discussion and Analysis | Analysis of Financial Results
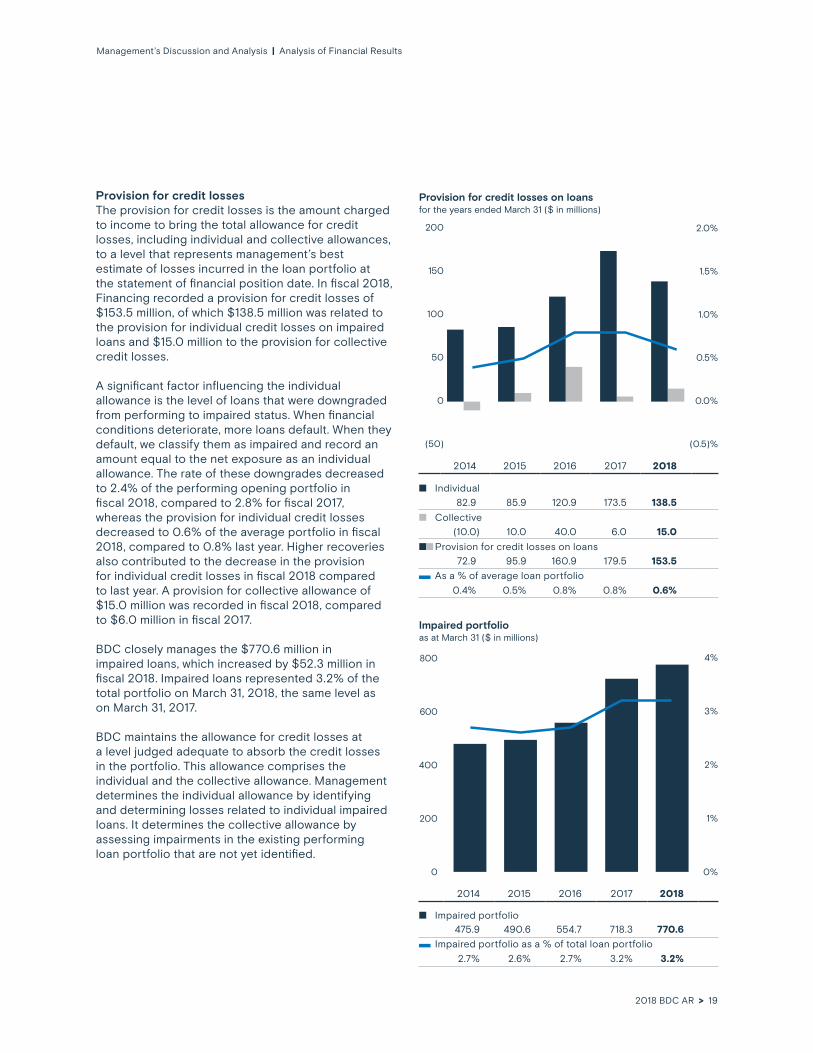
Provision for credit lossesThe provision for credit losses is the amount charged to income to bring the total allowance for credit losses, including individual and collective allowances, to a level that represents management’s best estimate of losses incurred in the loan portfolio at the statement of financial position date. In fiscal 2018, Financing recorded a provision for credit losses of $153.5 million, of which $138.5 million was related to the provision for individual credit losses on impaired loans and $15.0 million to the provision for collective credit losses.
A significant factor influencing the individual allowance is the level of loans that were downgraded from performing to impaired status. When financial conditions deteriorate, more loans default. When they default, we classify them as impaired and record an amount equal to the net exposure as an individual allowance. The rate of these downgrades decreased to 2.4% of the performing opening portfolio in fiscal 2018, compared to 2.8% for fiscal 2017, whereas the provision for individual credit losses decreased to 0.6% of the average portfolio in fiscal 2018, compared to 0.8% last year. Higher recoveries also contributed to the decrease in the provision for individual credit losses in fiscal 2018 compared to last year. A provision for collective allowance of $15.0 million was recorded in fiscal 2018, compared to $6.0 million in fiscal 2017.
BDC closely manages the $770.6 million in impaired loans, which increased by $52.3 million in fiscal 2018. Impaired loans represented 3.2% of the total portfolio on March 31, 2018, the same level as on March 31, 2017.
BDC maintains the allowance for credit losses at a level judged adequate to absorb the credit losses in the portfolio. This allowance comprises the individual and the collective allowance. Management determines the individual allowance by identifying and determining losses related to individual impaired loans. It determines the collective allowance by assessing impairments in the existing performing loan portfolio that are not yet identified.
Provision for credit losses on loansfor the years ended March 31 ($ in millions)
200
150
100
50
0
(50)
2.0%
1.5%
1.0%
0.5%
0.0%
(0.5)%-50
0
50
100
150
200
-0.5
0.0
0.5
1.0
1.5
2.0
2014 2015 2016 2017 2018
n Individual82.9 85.9 120.9 173.5 138.5
n Collective(10.0) 10.0 40.0 6.0 15.0
nnProvision for credit losses on loans72.9 95.9 160.9 179.5 153.5
As a % of average loan portfolio
0.4% 0.5% 0.8% 0.8% 0.6%
Impaired portfolio as at March 31 ($ in millions)
800
600
400
200
0
4%
3%
2%
1%
0%0
200
400
600
800
2014 2015 2016 2017 2018
n Impaired portfolio 475.9 490.6 554.7 718.3 770.6
Impaired portfolio as a % of total loan portfolio
2.7% 2.6% 2.7% 3.2% 3.2%
2018 BDC AR > 19

Management’s Discussion and Analysis | Analysis of Financial Results
The total allowance for credit losses increased to $704.6 million on March 31, 2018, compared to $696.9 million in fiscal 2017. The total allowance represented 2.9% of the total loans outstanding, slightly lower than the 3.1% recorded last year as a result of a decrease of the individual allowance.
To read more about credit risk management, please refer to Note 24—Risk Management to the Consolidated Financial Statements.
Allowance for credit losses as at March 31 ($ in millions)
4.0%
3.5%
3.0%
2.5%
2.0%
800
600
400
200
00
200
400
600
800
2.0
2.5
3.0
3.5
4.0
2014 2015 2016 2017 2018
n Individual allowance 168.3 179.9 215.7 300.9 293.6
n Collective allowance 340.0 350.0 390.0 396.0 411.0
nnTotal allowance 508.3 529.9 605.7 696.9 704.6
Total allowance as a % of loan portfolio
2.9% 2.8% 3.0% 3.1% 2.9%
Net gains or losses on other financial instrumentsNet gains or losses on other financial instruments are mainly the result of fair value changes to long-term notes and derivatives due to fluctuations in market conditions. The realized gains or losses are incurred when financial instruments are repurchased prior to maturity.
During fiscal 2018, Financing recorded net gains on other financial instruments of $1.1 million, which included net realized gains of $0.9 million and net unrealized gains of $0.2 million. This compared with net gains on other financial instruments of $1.3 million in fiscal 2017, comprising net realized gains of $2.4 million and net unrealized losses of $1.1 million.
Operating and administrative expensesOperating and administrative expenses were $419.2 million in fiscal 2018, slightly above the $413.8 million recorded last year.
As a percentage of the average portfolio, operating and administrative expenses were 1.7%, lower than the 1.9% recorded in fiscal 2017, reflecting efficiency gains from investments in processes and technology. BDC also continued to leverage its online presence through the virtual business centre and is investing in enhanced mobile capabilities to make it simpler and faster for clients to secure financing.
For fiscal 2018, BDC has adopted a refined methodology to recharge shared corporate services to business lines, as indicated in its fiscal 2018-22 corporate plan. This refinement had a positive impact on the operating and administrative expenses of Financing.
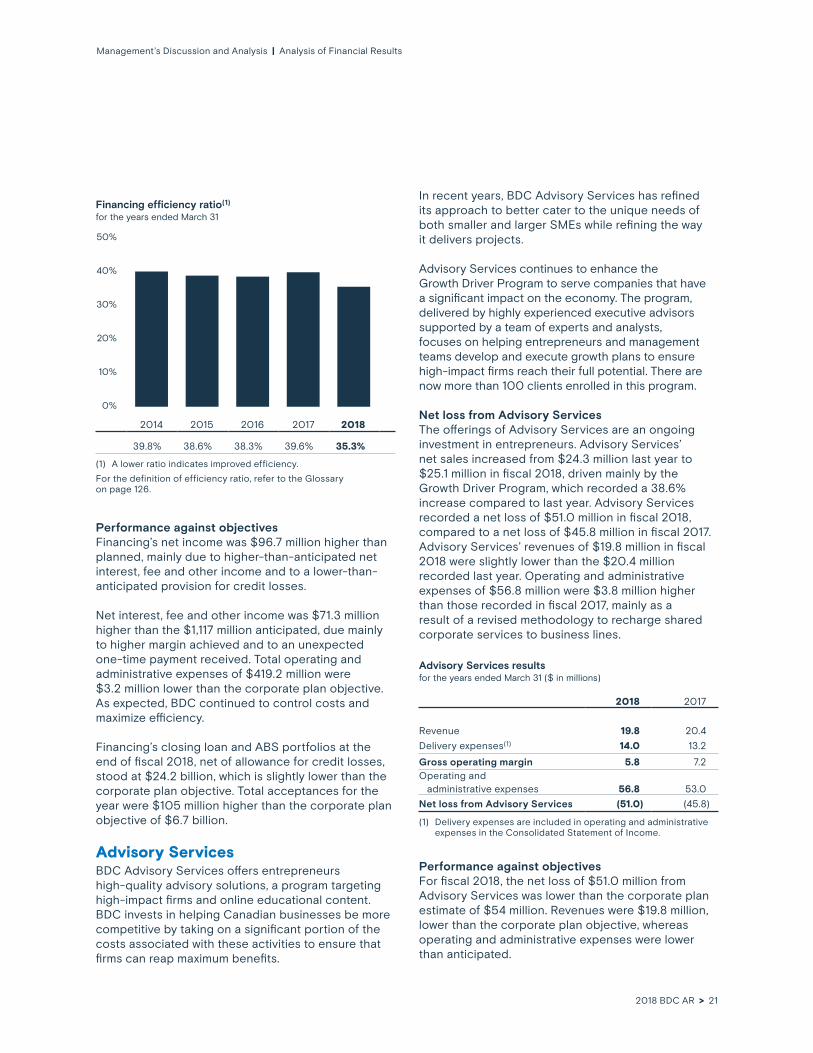
Operational efficiencyOver the years, BDC has made a concerted effort to achieve efficiencies while fulfilling its role as a development bank and implementing government priorities. BDC carefully manages operating expenses, by identifying and gaining efficiencies, and by improving its efficiency ratio—that is, the expenses incurred to earn each dollar of revenue. (The lower the ratio, the better.) As a result, the Financing efficiency ratio improved from 39.8% in fiscal 2014 to 35.3% in fiscal 2018. Investments in processes and technology have also contributed to efficiency gains and improved the Financing efficiency ratio compared to fiscal 2017. The increase in fee and other income as a result of an unexpected one-time payment received also positively impacted the efficiency ratio.
2018 BDC AR > 20
Management’s Discussion and Analysis | Analysis of Financial Results
Financing efficiency ratio(1)
for the years ended March 31
0
10
20
30
40
5050%
40%
30%
20%
10%
0%
2014 2015 2016 2017 2018
39.8% 38.6% 38.3% 39.6% 35.3%
(1) A lower ratio indicates improved efficiency.
For the definition of efficiency ratio, refer to the Glossary on page 126.
Performance against objectivesFinancing’s net income was $96.7 million higher than planned, mainly due to higher-than-anticipated net interest, fee and other income and to a lower-than-anticipated provision for credit losses.
Net interest, fee and other income was $71.3 million higher than the $1,117 million anticipated, due mainly to higher margin achieved and to an unexpected one-time payment received. Total operating and administrative expenses of $419.2 million were $3.2 million lower than the corporate plan objective. As expected, BDC continued to control costs and maximize efficiency.
Financing’s closing loan and ABS portfolios at the end of fiscal 2018, net of allowance for credit losses, stood at $24.2 billion, which is slightly lower than the corporate plan objective. Total acceptances for the year were $105 million higher than the corporate plan objective of $6.7 billion.
Advisory ServicesBDC Advisory Services offers entrepreneurs high-quality advisory solutions, a program targeting high-impact firms and online educational content. BDC invests in helping Canadian businesses be more competitive by taking on a significant portion of the costs associated with these activities to ensure that firms can reap maximum benefits.
In recent years, BDC Advisory Services has refined its approach to better cater to the unique needs of both smaller and larger SMEs while refining the way it delivers projects.
Advisory Services continues to enhance the Growth Driver Program to serve companies that have a significant impact on the economy. The program, delivered by highly experienced executive advisors supported by a team of experts and analysts, focuses on helping entrepreneurs and management teams develop and execute growth plans to ensure high-impact firms reach their full potential. There are now more than 100 clients enrolled in this program.
Net loss from Advisory ServicesThe offerings of Advisory Services are an ongoing investment in entrepreneurs. Advisory Services’ net sales increased from $24.3 million last year to $25.1 million in fiscal 2018, driven mainly by the Growth Driver Program, which recorded a 38.6% increase compared to last year. Advisory Services recorded a net loss of $51.0 million in fiscal 2018, compared to a net loss of $45.8 million in fiscal 2017. Advisory Services’ revenues of $19.8 million in fiscal 2018 were slightly lower than the $20.4 million recorded last year. Operating and administrative expenses of $56.8 million were $3.8 million higher than those recorded in fiscal 2017, mainly as a result of a revised methodology to recharge shared corporate services to business lines.
Advisory Services resultsfor the years ended March 31 ($ in millions)
2018 2017
Revenue 19.8 20.4
Delivery expenses(1) 14.0 13.2
Gross operating margin 5.8 7.2Operating and administrative expenses 56.8 53.0
Net loss from Advisory Services (51.0) (45.8)
(1) Delivery expenses are included in operating and administrative expenses in the Consolidated Statement of Income.
Performance against objectivesFor fiscal 2018, the net loss of $51.0 million from Advisory Services was lower than the corporate plan estimate of $54 million. Revenues were $19.8 million, lower than the corporate plan objective, whereas operating and administrative expenses were lower than anticipated.
2018 BDC AR > 21

Management’s Discussion and Analysis | Analysis of Financial Results
Growth & Transition CapitalGrowth & Transition Capital caters to growing businesses, especially high-growth firms, with strong management but, often, with limited tangible assets to offer as collateral. BDC offers higher risk solutions (cash flow, mezzanine, quasi-equity) to allow entrepreneurs to execute their growth and succession plans while limiting their ownership dilution. BDC also offers minority growth equity in cases where entrepreneurs require capital to rapidly accelerate the growth of their business.
Subordinate financing investment portfolioBDC’s subordinate financing investment portfolio reached the significant milestone of $1.0 billion in fiscal 2018 from $860.4 million in fiscal 2017, as demand remained strong in this underserved market segment. The average loan size increased to $2.2 million in fiscal 2018 compared to $1.8 million in fiscal 2017.
The fair value of the portfolio as a percentage of cost stood at 96.9%, slightly higher than last year.
Subordinate financing investment portfolioas at March 31 ($ in millions)
1,200
1,000
800
600
400
200
0
120%
100%
80%
60%
40%
20%
0%0
200
400
600
800
1000
1200
0
20
40
60
80
100
120
2014 2015 2016 2017 2018
n Fair value576.7 642.8 751.4 860.4 1,032.7
n Cost601.4 658.0 766.0 892.9 1,066.1
Fair value as % of cost95.9% 97.7% 98.1% 96.4% 96.9%
Net income from Growth & Transition CapitalGrowth & Transition Capital recorded net income of $71.2 million for the year, $26.6 million higher than in fiscal 2017. Net income included $12.4 million attributable to non-controlling interests in fiscal 2018, compared to $0.2 million last year. These strong results were mainly driven by the partial sale of one investee, also favourably affecting unrealized appreciation of investments recognized in non-controlling interests.
Growth & Transition Capital results for the years ended March 31 ($ in millions)
2018 2017
Net revenue on investments 111.1 98.7
Net change in unrealized appreciation (depreciation) of investments (0.9) (17.8)
Net foreign exchange gains (losses) (0.1) 0.0
Income before operating and administrative expenses 110.1 80.9
Operating and administrative expenses 38.9 36.3
Net income from Growth & Transition Capital 71.2 44.6
Net income attributable to:
BDC's shareholder 58.8 44.4
Non-controlling interests 12.4 0.2
Net income from Growth & Transition Capital 71.2 44.6
Growth & Transition Capital results for the years ended March 31 (as % of average portfolio)
2018 2017
Net revenue on investments 11.4 % 12.1 %
Net change in unrealized appreciation (depreciation) of investments (0.1) % (2.2) %
Net foreign exchange gains (losses) (0.0) % 0.0 %
Income before operating and administrative expenses 11.3 % 9.9 %Operating and administrative expenses 4.0 % 4.5 %Net income from Growth & Transition Capital 7.3 % 5.4 %
Net income attributable to:
BDC's shareholder 6.0 % 5.4 %Non-controlling interests 1.3 % 0.0 %Net income from Growth & Transition Capital 7.3 % 5.4 %
2018 BDC AR > 22

Management’s Discussion and Analysis | Analysis of Financial Results
Net revenue on investments, comprised of net interest income, net realized gains on investments, as well as fee and other income, reached $111.1 million, $12.4 million higher than in fiscal 2017. The increase was mainly due to higher net interest income as a result of portfolio growth in fiscal 2018. Refer to Note 26—Segmented Information for more details.
In fiscal 2018, Growth & Transition Capital recorded a net change in unrealized depreciation of investments of $0.9 million compared to $17.8 million last year. The lower unrealized depreciation of investments this year is mainly due to the favorable impact of the partial sale of one investee. In fiscal 2017, the oil-and-gas sector contributed to the higher unrealized depreciation of investments. The net change in unrealized appreciation (depreciation) of investments is detailed below.
Net change in unrealized appreciation (depreciation) of investmentsfor the years ended March 31 ($ in millions)
2018 2017
Net fair value appreciation (depreciation) (9.3) (13.7)
Reversal of net fair value depreciation (appreciation) due to realized income and write-offs 8.4 (4.1)
Net change in unrealized appreciation (depreciation) of investments (0.9) (17.8)
Operating and administrative expenses increased by $2.6 million from last year. The increase was mainly due to a revised methodology to recharge shared corporate services to business lines. However, as a percentage of the average portfolio, operating and administrative expenses decreased to 4.0% compared to 4.5% in fiscal 2017.
Performance against objectivesNet income from Growth & Transition Capital of $71.2 million in fiscal 2018 was higher than the corporate plan objective of $53.2 million. This difference was mainly due to higher-than-anticipated net revenue on investments.
BDC’s initiative to increase its reach and visibility resulted in a higher-than-anticipated level of activity. Acceptances reached $420 million for the year, higher than the corporate plan objective of $340 million.
Venture CapitalVenture Capital actively supports the development of a healthy and vibrant venture capital (VC) ecosystem to foster innovation in Canada. BDC plays an important role by helping Canadian innovators launch and grow technology-focused businesses and commercialize their innovations, and by building the skills of VC fund managers. It backs approximately 700 companies through direct investments in businesses and indirect investments in VC funds. VC’s efforts to make Canadian venture capital a financially viable and attractive asset class for private sector investors have helped propel the market forward.
Direct investmentSince 2012, BDC has been managing three direct investment funds in the areas of information technology (IT); healthcare; and industrial, clean and energy technology (ICE). These funds operate on the same principles as private sector funds, and have supported the development of 110 innovative companies while generating positive returns. In response to market demand, BDC allocated an additional $150 million to create a second IT fund in fiscal 2016 and $135 million for its second ICE fund in fiscal 2017.
Another component of BDC’s direct investing strategy is its co-investment initiative, whereby BDC is able to leverage the large number of indirect relationships it has via its fund investments. BDC co-invests in a select number of larger and rapidly growing technology companies alongside its private sector-led indirect fund partners. This allows BDC to specifically address the needs of the best technology companies for late-stage capital; increase available funding in emerging sectors; and balance early-stage capital with greater late-stage domestic VC funding.
BDC is also a leader in reinforcing the early-stage innovation ecosystem and filling the gap in seed funding with strategic investments in other ecosystem-building activities. One such initiative is BDC’s work with a select group of accelerators to identify and invest in top venture start-ups.
2018 BDC AR > 23

Management’s Discussion and Analysis | Analysis of Financial Results
Indirect investmentThe goal of BDC’s indirect investing strategy is to help create a thriving ecosystem of high-performing fund managers, while generating positive results. To achieve this mandate, BDC supports a mix of emerging and established managers, and focuses on helping top-performing funds evolve into globally competitive mature funds over time. BDC indirectly supports 616 tech firms through investments in 70 funds. The performance of BDC’s own portfolio of fund investments—a good proxy for Canadian industry performance—has improved significantly in recent years, closing the gap with the more mature U.S. VC industry.
Venture Capital portfolioThe fair value of the portfolio increased from $1,015.7 million in fiscal 2017 to $1,263.1 million this year. The portfolio is composed of $726.2 million in direct investments and $ 536.9 million in investments in 70 funds.
The fair value of the total portfolio as a percentage of cost was 136.9% as at March 31, 2018, higher than the 114.8% last year. The increase was mainly due to the partial sale of one investee and to two successful initial public offerings (IPOs), the first VC-backed IPOs in the life sciences sector in Canada in the last 10 years. Fiscal 2018 fair value as a percentage of cost was 133.4% for the direct investments portfolio and 141.8% for the funds.
The total Venture Capital commitment to investees, which represents the portfolio outstanding at cost plus undisbursed commitments, amounted to $1,274.2 million as at March 31, 2018. This represents $575.7 million committed to direct investments and $698.5 million to private sector investment funds, for an increase of 3.6% compared to last year.
As planned, our commitments to private sector investment funds are greater than those to direct investments. We expect to invest the undisbursed portion of our commitments over the next few years.
Venture Capital portfolio—total investmentsas at March 31 ($ in millions)
1,400
1,200
1,000
800
600
400
200
0
140%
120%
100%
80%
60%
40%
20%
0%0
200
400
600
800
1000
1200
1400
0
20
40
60
80
100
120
140
2014 2015 2016 2017 2018
n Fair value 495.1 709.6 928.0 1,015.7 1,263.1
n Portfolio (cost) 534.6 689.9 818.3 884.9 922.9
Fair value as % of cost
92.6% 102.9% 113.4% 114.8% 136.9%
Total commitment to Venture Capital investees as at March 31 ($ in millions)
1,400
1,200
1,000
800
600
400
200
00
200
400
600
800
1000
1200
1400
2014 2015 2016 2017 2018
n Portfolio (cost)534.6 689.9 818.3 884.9 922.9
n Undisbursed commitment327.3 337.1 360.0 345.1 351.3
nnTotal commitment to Venture Capital investees 861.9 1,027.0 1,178.3 1,230.0 1,274.2
2018 BDC AR > 24

Management’s Discussion and Analysis | Analysis of Financial Results
Net income from Venture CapitalVenture Capital recorded record high net income of $159.3 million, compared to $5.2 million net income last year, marking a fifth consecutive year with positive results. Fiscal 2018 net income was favourably affected by a significant fair value appreciation following the partial sale of one of our investees and two successful IPOs.
Venture Capital results for the years ended March 31 ($ in millions)
2018 2017
Net revenue (loss) on investments (23.4) 9.4
Net change in unrealized appreciation (depreciation) of investments 223.9 10.2
Net unrealized foreign exchange gains (losses) on investments (13.9) 10.7
Income before operating and administrative expenses 186.6 30.3
Operating and administrative expenses 27.3 25.1
Net income from Venture Capital 159.3 5.2
Net income attributable to:
BDC's shareholder 128.4 6.6
Non-controlling interests 30.9 (1.4)
Net income from Venture Capital 159.3 5.2
The net loss on investments, which comprised net realized gain or loss on investments, write-offs and other income, was $23.4 million, compared to $9.4 million net revenue recorded in fiscal 2017. Venture Capital recorded higher write-offs partially offset by higher realized gains in fiscal 2018. Proceeds received from divestiture of investments were again strong this year at $124.1 million, compared to $127.7 million in fiscal 2017.
BDC recorded a net change in unrealized appreciation of investments of $223.9 million, compared to a net change in unrealized appreciation of investments of $10.2 million last year.
Net change in unrealized appreciation (depreciation) of investmentsfor the years ended March 31 ($ in millions)
2018 2017
Net fair value appreciation (depreciation) 167.2 (3.3)
Reversal of fair value depreciation (appreciation) on divested investments and write-offs 56.7 13.5
Net change in unrealized appreciation (depreciation) of investments 223.9 10.2
Direct investments recorded fair value appreciation of $95.7 million and indirect investments recorded fair value appreciation of $71.5 million in fiscal 2018 for a total net fair value appreciation of $167.2 million.
Net unrealized foreign exchange losses of $13.9 million on investments were due to foreign exchange fluctuations on the U.S. dollar. BDC uses foreign exchange contracts to hedge U.S. dollar proceeds, following the occurrence of a liquidity event under which a venture capital investment is monetized as cash.
Operating and administrative expenses were $27.3 million, higher than the $25.1 million recorded last year, to better support Venture Capital’s ecosystem and portfolio growth. Venture Capital was also negatively impacted by the revised methodology to recharge shared corporate services to business lines.
Venture Capital’s net income attributable to non-controlling interests was $30.9 million for the year, $32.3 million higher than last year. The increase in non-controlling interests was due to higher fair value appreciation and realized gains recognized in Go Capital L.P. following the partial sale of one of our investees.
Performance against objectivesVenture Capital’s net income of $159.3 million was higher than the $10.0 million net loss anticipated in the corporate plan. This was largely due to higher-than-anticipated net fair value appreciation on investments, partially offset by higher write-offs and higher unrealized foreign exchange losses on investments. Net Income attributable to non-controlling interests of $30.9 million was $30.5 million higher than anticipated.
Venture Capital is a risky asset class that is subject to volatility and is difficult to predict. Actual results could significantly differ from plan.
2018 BDC AR > 25

Management’s Discussion and Analysis | Analysis of Financial Results
Venture Capital Action PlanBDC plays a leadership role in strengthening the Canadian venture capital ecosystem. Recognizing the importance of venture capital to Canada’s economic prosperity, the government asked BDC to manage the Venture Capital Action Plan (VCAP) to help increase available capital for promising innovative Canadian start-ups and create a vibrant and sustainable venture capital ecosystem in Canada led by the private sector.
BDC’s role was to provide advice and analysis to support the government’s design of VCAP; negotiate and make investments as the government’s agent; administer the flow of capital; and monitor the initiative for the government.
Through VCAP, the government committed $340 million to four private sector funds of funds and $50 million to four high-performing VC funds. This capital was used to leverage over $900 million in private sector capital and $113 million from provincial governments, bringing the total venture capital raised under VCAP to $1.4 billion.
Venture Capital Action Plan portfolioAs at March 31, 2018, the total portfolio stood at $400.5 million, compared to $301.5 million last year. The increase was mainly due to disbursements of $74.6 million and to fair value appreciation of investments during fiscal 2018.
Net income from Venture Capital Action PlanVCAP recorded net income of $25.7 million, mostly as a result of a net change in unrealized appreciation of investments of $27.0 million related to the increase in fair value of the underlying funds. This is the third year in a row that VCAP has shown positive results. Operating and administrative expenses were $1.3 million, higher than last year, mainly because of portfolio growth.
Venture Capital Action Plan results for the years ended March 31 ($ in millions)
2018 2017
Net revenue on investments 0.1 0.1
Net change in unrealized appreciation (depreciation) of investments 27.0 10.5
Net foreign exchange gains (losses) (0.1) 0.1
Income before operating and administrative expenses 27.0 10.7
Operating and administrative expenses 1.3 0.6
Net income from Venture Capital Action Plan 25.7 10.1
Performance against objectivesNet income of $25.7 million was $46.7 million better than anticipated, mostly due to a higher-than-anticipated net change in unrealized appreciation of investments.
Cleantech PracticeRecognizing the importance of giving high-potential innovative cleantech firms access to financing, the federal government requested BDC to further support the growth and expansion of future Canadian global cleantech champions. Budget 2017 allocated $600 million in new capital to BDC for debt and equity transactions that exceed BDC’s normal risk appetite. BDC’s Cleantech Practice aims to build globally competitive Canadian cleantech firms and a long-term commercially sustainable cleantech industry that will, over time, be able to attract the necessary private sector capital investments to grow.
Cleantech Practice’s portfolio at the end of fiscal 2018 was $9.9 million in subordinate financing investments. The net loss was $0.6 million, as BDC started allocating resources to this new business line. BDC’s new business line will be managed with the same financial rigour applied in the rest of the organization to control costs and maximize efficiency.
Cleantech Practice results for the year ended March 31 ($ in millions)
2018
Net interest and fee income 0.2
Operating and administrative expenses 0.8
Net income from Cleantech Practice (0.6)
2018 BDC AR > 26

Management’s Discussion and Analysis | Analysis of Financial Results
Consolidated Statement of Financial Position and Consolidated Statement of Cash FlowsTotal assets of $27.8 billion increased by $2.5 billion from a year ago, largely due to a $2.0 billion increase in the loans portfolio, combined with a $192 million increase in the subordinate financing investment portfolio, and a $346.4 million increase in the VC and VCAP investment portfolios.
Total assets—BDC as at March 31 ($ in millions)
0
5000
10000
15000
20000
25000
3000030,000
25,000
20,000
15,000
10,000
5,000
0
2014 2015 2016 2017 2018
19,570 21,129 22,906 25,317 27,809
At $23.7 billion ($24.4 billion in gross portfolio net of a $0.7 billion allowance for credit losses), the loan portfolio represented BDC’s largest asset. The gross loan portfolio has grown by 8.8% since March 31, 2017. BDC remained committed to actively supporting SMEs’ needs and helping them improve competitiveness, while continuing to identify and address market gaps in financing across Canada.
BDC’s investment portfolios, which include the subordinate financing, venture capital and VCAP portfolios, stood at $2.7 billion, compared to $2.2 billion as at March 31, 2017, with subordinate financing investments reaching $1.1 billion as at March 31, 2018. The asset-backed securities portfolio stood at $472.7 million, compared to $518.1 million as at March 31, 2017.
Derivative assets of $15.4 million and derivative liabilities of $3.4 million reflect the fair value of derivative financial instruments as at March 31, 2018.
Net derivative fair value decreased by $7.6 million compared to the value as at March 31, 2017, primarily due to maturities and redemptions, and a decrease in fair value. BDC acquires derivative financial instruments to manage exposures to interest, currency and other market risks. BDC does not hold derivatives for speculative or trading purposes.
As at March 31, 2018, BDC recorded a net defined benefit asset of $95.3 million related to the registered pension plan, and a net defined benefit liability of $255.2 million for the other plans, for a total net defined benefit liability of $159.9 million. This represents an increase of $49.5 million compared to the net defined benefit liability as at March 31, 2017, mostly as a result of remeasurement losses recorded during the year. For further information, refer to Note 20—Net Defined Benefit Asset or Liability to the Consolidated Financial Statements.
BDC holds cash and cash equivalents in accordance with its treasury risk policy. The Bank’s liquidities, which ensure funds are available to meet BDC’s cash outflows, totalled $672.9 million as at March 31, 2018, compared to $649.2 million as at March 31, 2017.
Borrowingsas at March 31 ($ in millions)
30,000
25,000
20,000
15,000
10,000
5,000
00
5000
10000
15000
20000
25000
30000
0
5000
10000
15000
20000
25000
30000
2014 2015 2016 2017 2018
n Liquid assets 677 667 680 649 673
n Portfolios(1)
18,654 20,222 22,045 24,448 26,917
Borrowings
14,832 15,984 17,198 18,977 20,619
(1) Includes net portfolios, investments and asset-backed securities
2018 BDC AR > 27

Management’s Discussion and Analysis | Analysis of Financial Results
For the year ended March 31, 2018, cash flow used by investing activities amounted to $318.2 million. Financing activities provided $1,686.0 million in cash flow, as long-term notes were repaid for $21.2 million and short-term notes increased by a net amount of $1,665.0 million. BDC also issued common shares totalling $64.5 million for the VCAP initiative. Operating activities used $1,344.0 million in cash flows, mainly to support the growth of the loans portfolio. For further information, refer to the Consolidated Statement of Cash Flows on page 53.
As at March 31, 2018, BDC funded its portfolios and liquidities with borrowings of $20.6 billion and total equity of $6.8 billion. Borrowings comprised $20.5 billion in short-term notes and $137.7 million in long-term notes.
Net defined benefit asset or liabilityBDC’s pension plan, supplemental plans and other employee future benefits are based on actuarial valuations and assumptions detailed in Note 20—Net Defined Benefit Asset or Liability to the Consolidated Financial Statements. Several factors, particularly the discount rate used to value future liabilities, influence the calculation of those obligations. For accounting measurement purposes, the discount rate used at each measurement date is based on market interest rates for long-term, high-quality debt instruments.
BDC’s employer contributions to the registered pension plan totalled $34.3 million in fiscal 2018, compared to $28.4 million in fiscal 2017. BDC’s best estimate of the contributions to be paid for fiscal 2019 is $25.9 million. For more information regarding BDC’s defined benefit pension plan, refer to Note 1—Act of Incorporation, Objectives and Operations of the Corporation to the Consolidated Financial Statements.
Further to the directive received in December 2014 from the Governor in Council, BDC must ensure a 50:50 current service cost-sharing ratio between employee and employer. As of December 31, 2017, this ratio was 48:52 between employee and BDC.
BDC funds its registered pension plan in accordance with applicable federal pension legislation and actuarial standards of practice in Canada to ensure proper funding of employee benefit. As of December 31, 2017, the funded status of the registered pension plan was a going-concern ratio of 141.3% (with a surplus in excess of $458M) and a wind-up/solvency
ratio of 105.1%. Mandatory employer current service contribution holiday occurs whenever the going-concern ratio is above 125% and the wind-up/solvency ratio is above 105%. Consequently, BDC will be taking a partial mandatory current service contribution holiday in the coming year, in accordance with the Income Tax Act, and will continue to contribute to the pension fund in future years, as prescribed by the applicable federal pension legislation.
Capital managementStatutory limitationsThe BDC Act specifies that the aggregate of borrowings and contingent liabilities in the form of guarantees provided by BDC may not exceed 12 times its equity. This ratio excludes accumulated other comprehensive income. BDC’s debt-to-equity ratio as at March 31, 2018, was 3.1:1, compared to 3.2:1 as at March 31, 2017.
In addition, the paid-in capital, the contributed surplus and any proceeds that have been prescribed, as equity (such as hybrid capital instruments) must not at any time exceed $3.0 billion. As at March 31, 2018, these amounts totalled $2.5 billion, compared to $2.4 billion as at March 31, 2017. In December 2017, BDC’s paid-in capital limit was raised from $3.0 billion to $4.5 billion.
During the year, a $64.5 million capital injection was received from the shareholder for the deployment of VCAP, compared to $125 million in fiscal 2017.
Debt-to-equity ratioas at March 31
12
4
2
0 0
2
4
6
8
10
12
0
2
4
6
8
10
12
0
2
4
6
8
10
12
0
2
4
6
8
10
12
2014 2015 2016 2017 2018
n Actual3.4 3.4 3.2 3.2 3.1
Statutory limit
12.0 12.0 12.0 12.0 12.0
2018 BDC AR > 28

Management’s Discussion and Analysis | Analysis of Financial Results
Capital adequacyBDC’s capital management framework is based on its Internal Capital Adequacy Assessment Process (ICAAP), which is aligned with the Office of the Superintendent of Financial Institutions’ guidelines and the new Capital and Dividend Policy Framework for Financial Crown Corporations. BDC’s ICAAP excludes VCAP and VCCI, as BDC manages these programs under a specific capital allocation from the shareholder.
The concept that capital has a cost is also embedded in the framework and related policies. It is ensured through strategic and efficient capital allocation to business segments, pricing models based on return on risk adjusted capital (RORAC) and assessment of financial performance against expected historical ranges and limits, as set out in BDC’s risk appetite statement.
To assess its capital adequacy, BDC monitors its capital status regularly by comparing its available capital to its capital demand. A key measure for assessing capital status adequacy is BDC’s internal capital ratio.
Because Cleantech Practice was designed so that excess capital derived from its activities would not be available for other BDC activities, the Cleantech Practice’s capital status is reported and monitored separately. It is considered protected capital and Cleantech Practice is excluded from BDC’s internal capital ratio. Cleantech Practice’s capital status is defined as the difference between the initiative’s available capital and the economic capital required to support the risk profile of the Cleantech Practice portfolio.
Available capitalAvailable capital is composed of equity attributable to BDC’s shareholder (retained earnings and capital injections) and adjustments aligned with industry practices.
Capital demandBDC’s capital demand represents the capital required to support BDC’s risk profile and includes the following three elements:
> economic capital required, which quantifies the capital required to survive multiple concurrent risk events associated with BDC’s operations
> stress testing reserve, which serves to absorb the volatility of an economic downturn while maintaining BDC’s financial strength
> Venture Capital protection reserve, which is held to cover any needed follow-up investments
Operating rangeBDC’s target capital level also factors in an operating range to mitigate the impact of unplanned capital volatility. It accounts for differences between planned and actual levels of activities, as well as other assumptions that are difficult to predict. The operating range allows any capital in excess of target capital to be paid as dividends to the shareholder in the following fiscal year.
Internal capital ratioBDC’s key measure for determining and assessing the adequacy of its capital status is its internal capital ratio, which is expressed as the level of available capital over the economic capital required. BDC’s capital management framework establishes different management zones to closely monitor the internal capital ratio through a complete economic cycle, against a minimum limit (100%), a tolerance threshold in normal economic conditions (122%) and BDC’s targeted internal capital ratio (134%). In normal economic conditions, BDC should maintain an internal capital ratio near the target capital ratio and within the operating range.
Internal capital ratio(1) as at March 31
134%
122%
100%
90
100
110
120
130
140
130% 130%
135%
2016 2017 2018
n Actual Target capital
Tolerance threshold (normal economic conditions)
Limit (stressed period)
(1) Available capital as a percentage of economic capital required.
BDC’s internal capital ratio, as at March 31, 2018, was 134.7%, slightly above the target capital ratio of 134% and increased compared to the 130% as at March 31, 2017.
2018 BDC AR > 29

Management’s Discussion and Analysis | Analysis of Financial Results
DividendsBDC revised its dividend policy in fiscal 2017 to align with the dividend methodology included in the new Capital and Dividend Policy Framework for Financial Crown Corporations. Excess capital, calculated as the difference between available capital and capital demand less operating range, is declared as dividends and distributed to the shareholder in the following fiscal year, subject to the discretion of the Board of Directors. The calculation excludes Cleantech Practice. As at March 31, 2018, BDC’s internal capital ratio reached the 134% target, and excess capital amounted to 69.7 million. Consequently, a dividend will be declared for fiscal 2019, based on fiscal 2018 results.
Dividendsfor the years ended March 31 ($ in millions)
70
60
50
40
30
20
10
0
0
10
20
30
40
50
60
70
2014 2015 2016 2017 2018 2019
n Common dividends declared(1)
59.6 54.6 62.9 68.6 0.0 69.7
(1) Based on previous year’s performance
Outlook for fiscal 2019The growth of the Canadian economy is expected to slow to about 2.2% in calendar 2018. From a provincial perspective, Alberta, British Columbia, Saskatchewan and Ontario will be the economy’s engines, with forecasted growth above 2%. Meanwhile, provinces in Atlantic Canada will experience slower rates, at about 1% or less. Higher interest rates in the U.S. will mean that borrowing will become more expensive globally, including for Canadian businesses. Anticipated rate hikes by the Bank of Canada will also contribute to higher borrowing costs. Another concern is the North American Free Trade Agreement (NAFTA) renegotiation. With about two-thirds of Canada’s goods and services exports destined for the U.S., Canadian exporters have a lot at stake in the talks. Given current market dynamics, and in line with its aspiration to be a leader in making Canadian entrepreneurs more competitive, BDC will continue to play its important complementary role.
BDC’s consolidated net income is forecast to total $560 million in fiscal 2019. Following strong results in fiscal 2018, especially from Growth & Transition Capital and Venture Capital, net income should return to levels that are more normal. BDC will continue to make concerted efforts to control operating and administrative expenses, while investing in technology and improving processes.
FinancingFinancing will continue to assist small businesses, including those that have difficulty accessing financing due to their location, sector or demographic profile. To that end, BDC will continue to enhance the ease, speed and convenience with which entrepreneurs can access its services.
BDC expects net financing acceptances to remain strong at $7.2 billion in fiscal 2019, $0.4 billion higher than fiscal 2018. The gross portfolio is expected to grow by 10.8% to $27.6 billion in fiscal 2019.
Financing’s net income is projected to reach $583 million in fiscal 2019. Provisions for credit losses on loans are expected to amount to $233 million, representing 0.9% of the average outstanding financing portfolio, up from the 0.6% recorded in fiscal 2018. The increase in the level of provision for credit losses is partly explained by the implementation of IFRS 9. It should be noted that IFRS 9 is expected to bring greater volatility in the level of provision for
2018 BDC AR > 30

Management’s Discussion and Analysis | Analysis of Financial Results
credit losses. Financing’s operating expenses as a percentage of the average portfolio outstanding are expected to remain at the same level of 1.7%.
Advisory ServicesAdvisory Services expects revenues to increase from $19.8 million in fiscal 2018 to $23 million in fiscal 2019. A net loss of $54 million is forecasted for fiscal 2019. Revenues generated by Advisory Services are not always sufficient to cover associated costs, but management considers these activities as an investment in the competitiveness of Canadian entrepreneurs and SMEs.
Growth & Transition CapitalGrowth & Transition Capital is playing an increasingly important role in supporting the growth plans of SMEs through flexible financing solutions and a diverse product offering.
Following a high level of activity in fiscal 2018, Growth & Transition Capital anticipates the volume of acceptances to taper to $383 million in fiscal 2019, compared to $420 million in fiscal 2018. The fair value of the portfolio is expected to be $1,124 million in fiscal 2019, slightly higher than the $1,052 million recorded in fiscal 2018. Operating expenses as a percentage of the average outstanding portfolio at cost are projected to remain at the same level as fiscal 2018 at 4.0%.
Following exceptionally solid results in fiscal 2018, Growth & Transition Capital’s net income is forecasted to reach $58 million in fiscal 2019 compared to $71.2 million in fiscal 2018.
Venture CapitalTo support innovative Canadian companies and create the conditions for success in the VC ecosystem, Venture Capital estimates that, in fiscal 2019, it will authorize $255 million in investments, including $102 million in direct investments and $153 million in indirect investments. The fair value of the venture capital portfolio is forecasted to be $1,323 million by March 31, 2019, representing 123% of its cost.
For fiscal 2019, Venture Capital forecasts net income of $5 million. Operating and administrative expenses are projected to be $30 million, higher than fiscal 2018. Proceeds from investments are forecasted at $160 million for fiscal 2019. VC is a risky asset class that is subject to the volatility of market conditions. This may result in significant variation from plan.
Venture Capital Action Plan (VCAP)BDC will continue to manage VCAP, a federal initiative to invest $400 million to increase private sector venture capital financing for high-potential, innovative Canadian businesses.
For fiscal 2019, BDC anticipates that $6 million will be disbursed, for a total of $387 million since the inception of the program, and forecasts that it will incur losses of $11 million.
Cleantech PracticeCleantech Practice places a greater emphasis on higher-risk transactions while balancing the need to demonstrate commercial viability and portfolio sustainability. BDC’s Cleantech Practice will deliver $600 million in loan and equity transactions that exceed BDC’s normal risk appetite as well as in investments in VC funds between fiscal 2018 and fiscal 2022. This is in addition to the $100 million of financing linked to BDC’s planned activities under other business lines.
Given the risky nature of cleantech transactions, a net loss of $18 million is forecast in fiscal 2019. Cleantech Practice portfolio at fair value is expected to reach $114 million in fiscal 2019. Due to the high-risk profile of Cleantech Practice, financial results are expected to be subject to significant volatility.
Venture Capital Catalyst Initiative (VCCI)Through the Venture Capital Catalyst Initiative (VCCI), the government made $400 million available through BDC over three years to provide late-stage venture capital to support the growth of innovative start-ups. It is estimated that VCCI’s success could inject $1.5 billion into Canada’s innovation capital market.
To implement the program, BDC expects an initial capital injection of $50 million in fiscal 2019. VCCI’s net loss is expected to be $3 million in fiscal 2019, mainly due to fair value depreciation. Authorizations are expected to reach $100 million with disbursements of $5 million in fiscal 2019.
2018 BDC AR > 31

Management’s Discussion and Analysis
BDC’s mandate is to promote, and assist in the establishment and development of, businesses in Canada, with a focus on small and medium-sized enterprises.
Consistent with our mandate, BDC generally assumes more risks than a typical financial institution to better support SMEs. However, BDC’s strong risk management practices and culture enable us to take the risks necessary to fulfill our mandate while ensuring the organization is financially sustainable.
BDC’s risk management framework (RMF) outlines the methodology used to manage the risks inherent in BDC’s activities, while ensuring the outcomes of such risk-taking activities are aligned with BDC’s strategy and mandate. It also reinforces a risk management culture across the organization that ensures a high level of risk awareness and makes risk management an integral part of strategic and operational decision-making.
BDC’s risk management principles
Key risk management principles that support the organization in our risk governance activities are the following:
> Risk accountability: Risk management is everyone’s responsibility, from members of the Board of Directors to employees carrying out oversight, business and corporate functions.
> Strategic balance: BDC manages risk by balancing it with our strategic objectives, our mandate to support Canadian entrepreneurs, and our ability to return capital to the shareholder in the form of dividends.
> Risk integration: BDC integrates risk management into key business processes, activities and IT solutions, including strategic, operational, business and budget planning, as well as lending, investing and consulting activities.
> Risk challenge: BDC fosters an open and transparent culture that promotes and encourages the challenging of decisions as part of risk management. The timely escalation of risk issues to the appropriate management level is fundamental to an effective dialogue about risk.
> Risk governance: Policies codify a comprehensive process for identifying, analyzing, monitoring and mitigating risk within approved limits. Oversight functions, executive-level reporting and accountability to an independent Board of Directors and the shareholder ensure continuous and objective assessment of risk.
➃ Risk Management
2018 BDC AR > 32

Risk governance framework
Management’s Discussion and Analysis | Risk Management
Board of Directors
BDC Management
Human Resources Committee
Governance Nominating Committee
Clean Technology Special
Committee
Board Investment Committee
Board Risk
Committee
President and Chief Executive
Officer
Risk Management Committees
Risk owners
> Identify, assess, manage and mitigate risks in all day-to-day functions
> Design, implement and communicate risk governance, risk and control strategies, and risk management policies, directives and procedures.
> Support first line in the development, management and update of activities to address governance, risk and control.
> Objectively provide oversight for first line activities.
Risk oversight functions
Disclosure Committee
Internal audit
Audit Committee
Senior Management Committee
2018 BDC AR > 33

The Board of Directors
The board and its committees oversee risk governance and risk management.
In addition to approving the risk appetite statement, the board also approves risk policies and strategies; ensures BDC’s risk management is effective; reviews portfolio and treasury risks; reviews capital adequacy and stress-testing analyses; sets clear levels of delegation of authority for transactions; and ensures an appropriate link between risk and reward.
Although all committees consider risk in their deliberations, as appropriate, three committees—the Board Risk Committee, the Board Investment Committee and the Audit Committee—have specific responsibilities for managing risk. For full details on the board and its committees, please see the Corporate Governance section, starting on page 115.
The Board Risk Committee advises the board on how BDC is effectively identifying and managing significant risks. It also reviews reports on BDC’s risk profile, including risk appetite statement measures, targets and limits. It regularly reviews risk management policies and reports. The committee also approves transactions above a certain threshold.
The Board Investment Committee advises the board on how effectively BDC is managing our venture capital and private-equity investment activities. The committee also approves transactions above a certain threshold.
The Audit Committee assists the board in overseeing financial risks and objectively assesses the financial performance of the Bank and our financial statements, internal controls, financial reporting, accounting standards, legal and regulatory compliance and the independence and quality of our Internal and external auditors.
BDC management: Risk committees and functions
BDC has implemented a management governance framework to foster a collaborative risk management culture that ensures effective coordination among business units. Each committee helps meet BDC’s strategic imperatives while making sure that operations are managed effectively.
The following committees are key elements of this management governance framework and help ensure an effective risk management culture and framework at BDC.
The Senior Management Committee includes the president and CEO, the chief financial officer, the chief risk officer, additional operating officers and designated senior vice presidents. It ensures that BDC establishes and respects sound risk management strategies and practices. It makes sure that BDC has an integrated vision for addressing key strategic, financial (credit, market and liquidity), and operational risks. It also, through the Disclosure Committee, oversees BDC’s disclosure obligations and practices.
The chief risk officer is accountable for the executive leadership and direction of BDC’s risk operations, processes and systems. The chief risk officer chairs the Risk Management Committee and is a member of the Senior Management Committee. The chief risk officer has unfettered access to the Board Risk Committee, and has the accountability and authority to identify and address or escalate risk issues, as required.
The Risk Management Committee includes senior key leaders from multiple business units. It focuses on oversight. As such, the committee ensures that BDC has an adequate and effective risk management framework to identify and evaluate trends in critical issues; evaluate or quantify their probable impact; and ensure BDC is mitigating them within our risk appetite.
Management’s Discussion and Analysis | Risk Management
2018 BDC AR > 34

More specifically, the committee reviews the quality and the migration of risk in the loan portfolio and securitization portfolio, and in venture capital and subordinate financing investments. It also reviews financial performance, capital adequacy and BDC’s risk appetite statement; ensures that treasury activities and related asset liability management comply with BDC policy; and receives regular updates on the management of investments related to BDC’s pension funds.
The committee focuses on significant risks. It reports to the Senior Management Committee and the board on these risks and related remediation activity.
The Valuation Committees oversee the assessment and determination of the fair value of a portfolio of investments. The committees include key senior leaders and an external chartered business valuator.
The Compliance and Security Committee reviews and recommends actions related to security, information management, BDC’s policies and corporate directives framework, and compliance with applicable laws.
BDC’s risk management functions are as follows: credit and investment risk management as well as anti-fraud and anti-money laundering monitoring; operational risk management and integrated risk management, which includes portfolio risk management; treasury risk management; and enterprise risk management. Risk management accountabilities include the following elements:
> ensure that BDC applies appropriate risk management principles, policies and corporate directives to manage significant and emerging risks, according to risk thresholds
> develop tools to measure, monitor and report on risks
> provide timely and complete reports on these risks to the organization’s risk management committees
BDC’s information security and information technology teams implement infrastructure, governance, processes and activities to protect BDC’s electronic information assets and supporting IT infrastructures against unauthorized access, use, disclosure, modification, damage or loss, while ensuring compliance with regulatory and enterprise requirements.
The Internal Audit Department promotes sound risk management practices and exists to protect the organization by providing reasonable assurance the internal controls put in place by management and the Board of Directors are both adequate and effective.
Key risksIdentification of top risks and/or emerging risks in consideration of objectives and targets is embedded in BDC’s corporate planning and ongoing monitoring of activities. The risk identification process identifies significant risks that may impact the organization’s capacity to achieve our objectives. Risks are taken into consideration by executive management and the Board of Directors and monitored and/or remediated in alignment with BDC’s day-to-day risk management activities.
Category Risk description
Market uncertainty
The need to maintain financial sustainability in the face of market fluctuations and adverse changes in the macroeconomic environment (such as the Canadian housing market, renegotiation of NAFTA, interest rate increases, etc.).
Cyber security
The risk of technology being used to maliciously access, use or distribute limited or restricted data, disrupt operations or intentionally compromise BDC’s brand. As evidenced in recent events impacting large organizations, phishing, hacking and infrastructure penetration by third parties is a broad concern.
Human resources
Potential labour and skills shortages arising from the competition for key resources, increasing operational demands for specialized skills and knowledge, and a highly demanding workplace environment with large, varied and concurrent changes underway.
Change management
The volume and scope of internal initiatives to address organization priorities and strategies requires the development and implementation of large strategic initiatives. This increases the risk of ineffective or untimely execution resulting from the volume and velocity of change as well as the reliance on limited specialized resources.
Technology innovation
Pace of technology innovation (fintech, AI, robotics, etc.) impacting the financial industry through changing consumer expectations and habits.
Management’s Discussion and Analysis | Risk Management
2018 BDC AR > 35

Management’s Discussion and Analysis | Risk Management
OSFI reviewAs part of its ongoing efforts to monitor evolving financial risks to which the government may be exposed and to ascertain whether those risks are adequately managed, the Office of the Superintendent of Financial Institutions (OSFI) reviewed BDC’s risk management and governance practices in 2015.
In general, OSFI’s report acknowledged that BDC’s practices are continuously evolving and that we have enhanced our enterprise-wide risk management framework numerous times over the years. It also provided advice on areas for improvement. In response, BDC agreed with the recommendations as a means to continue enhancing our risk management practices and immediately defined a three-year action plan for our risk management vision.
BDC will continue to improve our enterprise-wide risk management framework to ensure we remain aligned with evolving risk management practices, while continuing to deliver on our core mandate.
Risk appetite framework and risk appetite statementThe risk appetite framework (RAF) defines BDC’s approach to establishing and governing our risk appetite. The RAF is integrated into BDC’s strategy development and implementation. It determines core risk principles, which dictate that BDC will only take risks that:
> we understand, can manage and are aligned with our strategy
> fulfill our mandate to support Canadian SMEs
> are not expected to negatively impact our brand or the shareholder’s reputation
The risk appetite statement (RAS) is based on qualitative and quantitative measures that articulate, and allow for reporting on, the board and management’s vision for managing the risks BDC is willing to accept in executing our mandate. Risk limits provide the outer boundary for an acceptable level of risk.
Enterprise-wide risk management processThe risk management framework (RMF) provides a consistent and structured approach to managing the risks inherent to BDC’s activities while ensuring the outcome of such risk-taking activities are aligned with BDC strategy and mandate, and are in conformity with the RAS. The RMF outlines the methodology implemented by BDC to manage risk and reinforce a risk culture that is pervasive across the organization.
BDC’s Enterprise Risk Management Policy codifies the integrated, enterprise-wide process we use to identify, analyze, accept, monitor, mitigate and report risks. The policy is designed to ensure BDC considers risk in all business activities and makes risk management an integral part of day-to-day decision-making and the annual corporate planning process. The policy defines the roles and responsibilities of board members, management, functional units and employees in implementing the policy. The Board of Directors reviews and approves the policy at least every two years.
The foundation of an effective RMF is common language and a consistent approach to identifying, assessing, measuring and reporting risks at BDC. BDC defines risk as the potential for loss or an undesirable outcome adversely affecting the achievement of the Bank’s mandate and strategic objectives. BDC has established a risk inventory that defines the following risk categories:
> strategic
> credit and investment
> market and liquidity
> operational and technology
> regulatory and legal compliance
> reputational
2018 BDC AR > 36

BDC’s approach to managing risk is based on four pillars of risk management.
Risk identification and assessmentThe implementation of integrated risk identification and assessment programs and processes ensures that BDC continuously recognizes, understands and assesses our existing and emerging risks, which evolve as a result of changes in both the internal and external environments. Top and emerging risks are presented to the organization’s risk management committees for assessment and discussion. Risks related to all significant projects, new products or services, and policy changes, are also assessed and discussed.
Risk measurement and analytics Risks across the organization are quantified and qualitatively assessed with up-to-date tools and models taking into consideration best practices in the financial services industry. This ensures they reflect BDC’s policies, corporate directives, standards and tolerance limits. Board members and senior managers use this information to understand BDC’s risk profile and portfolio performance.
Risk monitoring and reporting The continuous monitoring of the potential impact of existing and emerging risks occurs in the normal course of management activities. Business lines, corporate functions, and risk management and oversight functions have established requirements associated with the day-to-day monitoring of their
respective activities. Integrated Risk Management (IRM) reports provide a comprehensive quantitative and qualitative assessment of performance against the risk appetite, the risk profile as measured against BDC’s major risk categories, and indepth portfolio monitoring. IRM reports are communicated to senior management and the board.
Risk control Business lines are responsible for ensuring effective and appropriate controls are detailed in their respective business rules, and that procedures are complied with. BDC uses the following elements to mitigate risks:
> adequate and clear roles, responsibilities, processes, policies, corporate directives and procedures
> corporate risk management functions and committees that provide oversight and monitoring
> risk mitigation activities, such as hedging, insurance risk management, business continuity planning, information technology recovery planning, and anti-fraud and anti-money laundering programs
> quality reviews and audits to ensure that BDC is using appropriate and sound risk management practices
> enterprise-wide stress tests on significant risks and portfolios to determine the appropriate level of capital necessary to withstand a sustained economic downturn and continue to fulfill the mandate
Major risk categoriesStrategic riskThe risk that BDC may fail to fulfill our mandate and thus put at risk our sustainability and/or existence due to the choice of sub-optimal or ineffective strategy, ineffective deployment of our chosen strategy, inaccurate knowledge of the market or lack of responsiveness to changes in the external environment
Managing strategic riskThe Senior Management Committee, which includes the CEO and leaders from the business and corporate functions, establishes BDC’s strategic direction, sets corporate objectives, defines success measures, and monitors operations and performance.
Management’s Discussion and Analysis | Risk Management
Risk management
Risk identification
and assessment
Risk monitoring
and reporting
Risk control
Risk measurement
and analytics
2018 BDC AR > 37
Management’s Discussion and Analysis | Risk Management
BDC has a rigorous process whereby we annually update our corporate strategy, which is then approved by senior management, the board and the Government of Canada. Regular strategic reviews and risk management programs ensure alignment with the Bank’s risk appetite.
BDC ensures we operate with an appropriate level of capital in accordance with the nature and level of risk taken. The internal capital adequacy assessment process (ICAAP) evaluates capital adequacy on both a regulatory and an economic capital basis, and is used to establish capital thresholds in line with the risk appetite statement. BDC allocates capital among business units based on needs and assessed risks in order to support new and existing corporate activities.
BDC also conducts stress tests on BDC’s capital to assess the impact of different adverse scenarios to ensure BDC has sufficient capital to withstand unfavorable economic conditions. BDC’s stress-testing framework seeks to ensure we are adequately capitalized, given the risks we take, and supports the determination of limits we use to manage risk levels and capital requirements, in line with BDC’s risk appetite.
Please refer to Note 23—Capital Management to the Consolidated Financial Statements for additional information on BDC’s capital management and adequacy.
Financial risksBDC has identified three major categories of financial risks, including credit risk, market risk and liquidity risk. Note 24—Risk Management to the consolidated financial statements details BDC’s financial risk management policies and measurements.
Credit riskThe risk of loss if a counterparty in a transaction fails to meet contractual commitments or obligations.
Managing credit riskAll credit and investment decisions must comply with established policies, corporate directives, guidelines, business rules and risk assessment tools used to help make these decisions. Managing credit risk is the responsibility of all employees—from those who deal directly with clients to authorizing officers. In the latter case, specific authorities are delegated to positions commensurate with their function and the level of
credit knowledge and judgment employees holding that position are required to possess.
Our adjudication process includes assigning a borrower rating that reflects our estimate of the probability of default (PD) over the life of a loan. PD estimates are calibrated using a through-the-cycle approach. BDC uses internal risk classification and scoring systems that consider quantitative and qualitative criteria. These criteria include an assessment of the borrower’s financial strength, management quality, financial flexibility and competitive strength. The quantitative model output can be modified in some cases by expert judgement, as prescribed within our credit policies. Our internal risk classification is also used for portfolio risk management, risk limit setting, product pricing and the determination of economic capital.
The table on page 39, based on the annual PD, matches our internal ratings to the ratings used by external ratings agencies.
While BDC follows leading risk management practices, we generally assume more risk than a typical financial institution, due to our mandate and corresponding risk appetite. As a result, a large portion of BDC’s portfolio is non-investment grade. Please refer to Note 11—Loans to the Consolidated Financial Statements for further information on loans outstanding, by grade equivalent.
The most common method used to mitigate credit risk at the transaction level is to obtain quality collateral from borrowers. While collateral cannot replace a rigorous assessment of a borrower’s ability to meet our obligations, it is an important complement. Collateral is not required in all cases; it depends on the type of loan granted. Please refer to Note 11—Loans for further information about principal collateral pledged as security and our level of security coverage.
In addition to managing credit risk on an individual, transactional basis, BDC manages it on a portfolio basis. Through monitoring, analysis and risk reports, portfolio risk management ensures that the overall risk in the portfolio is well-diversified and consistent with BDC fulfilling our mandate while achieving our financial objectives, in line with our risk appetite.
2018 BDC AR > 38

Management’s Discussion and Analysis | Risk Management
BDC loans performing portfolio, classified by credit risk exposureas at March 31, 2018 (as a percentage of gross performing financing portfolio)
0
15
30
45
6060%
40%
20%
0%
AAA to A- BBB+ to BBB- BB+ BB to BB- B+ to B- CCC+ to CC
Investment grade Non-investment grade Watchlist
0.1% 6.5% 28.6% 51.0% 10.2% 3.6%
BDC rating Annual PD Grade equivalent S&P equivalent Moody’s equivalent
0.5 - 1.0 0.1% - 0.3% Investment grade BBB+ to BBB- Baa1 to Baa3
1.5 - 2.0 0.3% - 10.0% Non-investment grade BB+ Ba1
2.5 - 4.0 BB to BB- Ba2 to Ba3
4.5 - 5.0 B+ to B- B1 to B3
5.5 10.0% - 99.9% Watchlist CCC+ to CC Caa1 to Ca
6.0 or higher 100% Default D C
BDC loans portfolio credit risk exposure
Market riskThis is the risk of financial loss that may arise from developments in the marketplace or from our inability to forecast poor economic conditions quickly enough to mitigate losses in our portfolio. It represents the market value fluctuations of BDC’s assets and liabilities arising from volatility in interest rates, equity and foreign currency levels. For BDC, market risk also arises from volatile and unpredictable market events affecting the value of venture capital and venture capital action plan investments.
Market non-trading risk is the risk of loss in financial instruments, the consolidated statements of financial position or in net income, or the risk in non-trading activities, such as asset liability management or
hedging due to market factors, including fluctuations in interest rates, foreign exchange rates, or the price of equities or commodities.
Managing market riskBDC applies a sound asset/liability framework in our funding strategy and uses derivatives to manage and mitigate exposure to fluctuations in equity markets, foreign currencies and interest rates.
Liquidity riskThis is the risk of being unable to obtain or convert BDC’s assets into cash for the purpose of servicing and refinancing debt for the timely disbursement of committed loans and/or for the payment of operating expenses and dividends.
2018 BDC AR > 39

Management’s Discussion and Analysis | Risk Management
Managing liquidity riskTo avoid any business disruptions, BDC ensures that the minimum required level of cash is invested in highly liquid, high-quality securities that can be sold to a wide range of counterparties in active secondary markets without incurring a substantial loss.
Operational riskOperational risk is the risk of loss from inadequate or failed internal processes, people and systems, or from events beyond BDC’s control, such as natural disasters. It is pervasive in all business activities, including our practices for managing other risks such as credit, market and liquidity risk.
Managing Operational RiskOperational risk is inherent in all our activities and daily operations at BDC. As such, BDC strives to identify, analyze, mitigate and monitor these risks in alignment with BDC’s enterprise risk management framework and relevant corporate directives. These policies and corporate directives govern the way BDC manages our people, processes and internal/external environment.
BDC has implemented mitigation practices for managing key operational risk as follows:
> Business continuity management and incident management: BDC has developed tools to manage incidents and minimize interruptions to business operations as set out in our Master Business Continuity Plan as well as individual Business Continuity Plans for each region/business centre area and business unit.
> Insurance: BDC protects our financial interests through the purchase of insurance against unfavorable insurable events.
> Human resources management: BDC’s long-term success stems largely from our capacity to attract, retain and develop the right talent, and to create a healthy, professional and collaborative environment that encourages engaged employees to fully contribute to BDC’s mission of helping Canadian entrepreneurs succeed. This is achieved through:
– BDC’s Code of Conduct, Ethics and Core Values
– Human capital strategies and plans, including effective hiring practices, organizational design and compensation
– Learning and development tools to foster engagement and prepare employees to achieve their full potential
> Procurement and contracting processes: BDC follows sound principles and practices in the procurement and contracting of goods and services and the management of external suppliers.
> Project management: The Enterprise Project Management Office (EPMO) provides project management leadership, expertise and experience for the benefit of the entire organization. The EPMO also provides executive management with an overall strategic view of all BDC projects for prioritization and effective decision-making to ensure projects proceed on the basis of their alignment with corporate objectives and the organizational capacity to deliver these projects.
> Fraud management: BDC has an anti-fraud program that is consistent with current legislation and industry practices.
> Model risk management: BDC manages and mitigates model risk throughout the lifecycle by reviewing, validating and approving new and existing models.
2018 BDC AR > 40

Technology riskThis is the risk of loss arising from disruption of business or system failures.
Technology risks are present in all daily operations at BDC. As such, the identification, analysis, monitoring and mitigation of these risks are embedded in all of BDC’s policies and corporate directives. These policies and corporate directives govern the way BDC manages systems and infrastructure, cyber security, information security and data integrity.
Managing technology riskBDC ensures the appropriate protection of our client and employee data.
A strong control environment includes the establishment of system and network controls, the fostering of broad employee awareness through training, anti-phishing campaigns and ongoing independent testing of infrastructure and key systems/applications stability. In addition, BDC has established a training program to enhance incident response management by BDC’s IT cybersecurity/operations specialists.
BDC has developed tools to manage technology incidents and minimize interruptions to business operations through our IT Disaster Recovery Plan and IT incident management processes.
Legal and regulatory risk This is the risk associated with a failure to meet BDC’s obligations as required by the laws, rules, regulations and prescribed practices in any jurisdiction within which we operate.
Managing legal and regulatory riskBDC’s Legal Affairs and Corporate Secretariat ensures employees and management comply with legal and regulatory requirements through the regulatory compliance framework. In addition, Legal Affairs is accountable for managing all litigation involving BDC. It provides the Audit Committee with the information it needs to ensure compliance with laws and regulations and oversees BDC’s management of our legal and regulatory risks.
Reputational riskThis is the risk that stakeholder perceptions regarding BDC’s mandate, practices, actions or inactions will or may cause damage to our reputation and have an impact on our ability to fulfill our mandate and conduct our business.
BDC must meet Canadians’ expectations in various ways, including the following:
> meet the shareholder’s expectation that BDC will support entrepreneurship
> carry out our mandate effectively
> meet legal and broadly held ethical standards
> refuse to support clients who fail to meet societal expectations of responsible behaviour
> do business in an environmentally responsible manner
Managing reputational riskComplying with BDC’s risk management framework principles is the cornerstone of managing reputational risk. Reputational risk management is part of our corporate risk policies and corporate directives and embedded in all elements of business activities.
BDC uses our corporate social responsibility framework with strategic purpose and rigour to manage reputational risk.
At the corporate level, BDC tracks the interests of key opinion leaders and stakeholders through dialogue and media monitoring, including social media monitoring.
BDC considers reputational risk when considering potential loans or investments. We screen potential clients and do due diligence on potential transactions. BDC has well-established procedures to determine whether a client is involved in money laundering or terrorist activities. We also ensure he or she meets requirements related to transparency and disclosure, environmental performance, ethics and credit eligibility.
Management’s Discussion and Analysis | Risk Management
2018 BDC AR > 41

Management’s Discussion and Analysis
Significant accounting policies BDC’s significant accounting policies are described in Note 3—Significant accounting policies to the Consolidated Financial Statements. Certain of these policies, as well as estimates and assumptions made in applying such policies, are considered critical, as they require significant judgements by management. BDC has established control procedures, including formal representations and certification by senior officers, to ensure that accounting policies, estimates and assumptions are reviewed and applied consistently from period to period.
Future changes in accounting policies IFRS 9, Financial InstrumentsOn July 24, 2014, the International Accounting Standards Board (IASB) issued the final version of IFRS 9, Financial Instruments, bringing together the classification and measurement, impairment, and hedge accounting phases of the IASB’s project to replace IAS 39, Financial Instruments: Recognition and Measurement and all previous versions of IFRS 9.
IFRS 9 is effective for annual periods beginning on or after January 1, 2018, and shall be applied retrospectively, subject to certain exemptions For BDC, IFRS 9 is effective for the fiscal year ended March 31, 2019.
The transition date is April 1, 2018, and the first publicly available financial statements prepared using IFRS 9 will be the Quarterly Financial Report for the first quarter of fiscal 2019 (quarter ending June 30, 2018). BDC will be applying the exemption, and therefore, will not be restating comparative information. The differences between the carrying amounts of financial assets and liabilities from the adoption of IFRS 9 will be recorded through retained earnings on April 1, 2018.
BDC has performed a preliminary assessment of the financial impact of adopting IFRS 9, which is summarized below.
Classification and measurementIFRS 9 introduces a principles-based approach to the classification and measurement of financial assets. Debt instruments, including hybrid contracts, are measured at amortized cost, fair value through profit or loss (FVTPL) or fair value through other comprehensive income (FVOCI), based on an entity’s business model and the nature of the cash flows of the assets. These categories replace the existing IAS 39: classifications of loans and receivables, FVTPL (held-for-trading and designated as at FVTPL) and available-for-sale. Equity instruments are measured as at FVTPL, unless they are not held for trading purposes, in which case an election can be made on initial recognition to measure them at FVOCI with no subsequent reclassification to profit or loss.
The requirements of IAS 39 for financial liabilities are carried forward to IFRS 9 essentially unchanged. Financial liabilities are classified at amortized cost unless they are designated at FVTPL or classified as liabilities at FVTPL such as derivative liabilities.
BDC concluded that these changes would have no impact on the measurement of its financial assets and liabilities at adoption of IFRS 9.
ImpairmentIFRS 9 introduces an expected credit loss (ECL) impairment model that differs significantly from the incurred loss model currently required under IAS 39 and is expected to result in earlier recognition of credit losses.
The ECL impairment model found in IFRS 9 is applicable to all financial assets classified at amortized cost or FVOCI, as well as to off-balance-sheet loan commitments and financial guarantees, which were previously provided for under IAS 37, Provisions, Contingent Liabilities and Contingent Assets.
Under IFRS 9, credit loss allowances will be measured on each reporting date according to a three-stage ECL impairment model:
> stage 1—Recognition of 12-month ECLs for performing instruments
> stage 2—Recognition of lifetime ECLs for performing instruments that have experienced a significant increase in credit risk
> stage 3—Recognition of lifetime ECLs for non-performing financial instruments
➄ Accounting and control matters
2018 BDC AR > 42

Stage 1 and stage 2 credit loss allowances effectively replace the collective allowance for incurred but not yet identified losses recorded under IAS 39, while stage 3 credit loss allowances effectively replace the individual allowance for impaired loans.
ECLs will be measured as the probability-weighted present value of expected credit losses over the remaining expected life of the financial instrument and will consider reasonable and supportable information about past events, current conditions, and forecasts of future events and economic conditions. Probability-weighted scenarios will be considered when determining stage allocation and measuring ECLs.
BDC estimates that the financial impact of applying the new impairment model at transition date will result in a reversal of approximately $133 million of the allowance for credit losses and a corresponding increase in the opening retained earnings.
BDC continues to monitor and refine certain elements of its impairment process in advance of the first quarter of fiscal 2019 reporting.
Hedge accountingThe new hedge accounting model under IFRS 9 aims to simplify hedge accounting, align the accounting for hedge relationships more closely with an entity’s risk management activities, and permit hedge accounting to be applied more broadly to a greater variety of hedging instruments and risks eligible for hedge accounting.
BDC elected to de-designate the hedging instruments effective on the last day of the fiscal year. The amounts recognized in other comprehensive income at March 31, 2018 will be recycled to the Consolidated Statement of Income in the periods where the hedged items affect net income. Derivatives held for risk management will be measured at fair value in the Consolidated Statement of Income starting April 1, 2018.
TransitionTo manage its transition to IFRS 9, BDC has implemented a project team, led jointly by Finance and Risk Management, that focuses on the key areas of impact, including financial reporting, modelling, data, systems and processes, as well as communication to and training for stakeholders.
During fiscal 2018, BDC completed its assessment of IFRS 9 and concluded that it will meet all requirements at the date of transition on April 1, 2018. The first publicly available financial statements prepared using IFRS 9 will be the Quarterly Financial Report for the first quarter of fiscal 2019 (quarter ended June 30, 2018). BDC will be applying the exemption, and therefore, will not be restating comparative information. The differences between the carrying amounts of financial assets and liabilities from the adoption of IFRS 9 will be recorded through retained earnings on April 1, 2018.
IFRS 15, Revenue from Contracts with CustomersOn May 28, 2014, the IASB issued a new standard, IFRS 15, Revenue from Contracts with Customers, replacing IAS 18, Revenue. The new standard is effective for annual periods beginning on or after January 1, 2018. The core principle of the standard is that an entity will recognize revenue when it transfers promised goods or services to customers, in an amount that reflects the consideration to which the entity is expected to be entitled in exchange for those goods or services.
In April 2016, the IASB issued amendments to IFRS 15, which clarify the underlying principles of IFRS 15 and provide additional transitional relief on initial application.
BDC has completed its analysis of IFRS 15 and has concluded that its adoption will not have a material impact on the Consolidated Financial Statements.
IFRS 16, LeasesOn January 13, 2016, the IASB issued a new standard, IFRS 16, Leases, which supersedes IAS 17, Leases and related interpretations. The new standard is effective for annual periods beginning on or after January 1, 2019. IFRS 16 sets out the principles for the recognition, measurement, presentation and disclosure of leases for both the lessee and the lessor. The standard provides a single lessee accounting model requiring lessees to recognize lease assets and lease liabilities on the statement of financial position for most leases. Lessors will continue classifying leases as operating or finance, since IFRS 16’s approach to lessor accounting is substantially unchanged from IAS 17.
Management’s Discussion and Analysis | Accounting and Control Matters
2018 BDC AR > 43

BDC has completed an initial assessment of IFRS 16 and has elected to apply the following transition reliefs:
> use the practical expedient where BDC is not required to reassess whether a contract is, or contains, a lease at the date of initial application.
> follow the modified retrospective approach under which a lessee does not restate comparative Information.
BDC is continuing to assess the impact of the adoption of IFRS 16 but does not expect this new standard to have a significant impact on its Consolidated Financial Statements.
Judgements, estimates and assumptions BDC’s significant accounting judgements, estimates and assumptions are described in Note 6—Significant accounting judgements, estimates and assumptions to the Consolidated Financial Statements. Critical accounting estimates that have the most significant effect on the amounts recognized in the Consolidated Financial Statements include those related to the allowance for credit losses, fair value of financial instruments, qualifying hedge relationships, impairment of available-for-sale assets, consolidation, defined benefit pension plans and other post-employment benefits.
Controls and proceduresManagement is responsible for establishing and maintaining adequate internal control over financial reporting, as well as appropriate disclosure controls and procedures.
Internal control over financial reporting is designed to provide reasonable assurance regarding the reliability of financial reporting and the preparation of financial statements in accordance with IFRS. However, because of its inherent limitations, internal control over financial reporting can only provide reasonable assurance and may not prevent or detect misstatements.
Disclosure controls and procedures are designed to provide reasonable assurance that all relevant information is gathered and reported to senior management on a timely basis so that BDC can make appropriate decisions about public disclosure.
BDC has a certification regime to evaluate the design and effectiveness of our internal control over financial reporting and our disclosure controls and procedures. This certification regime is based on the Internal Control—Integrated Framework issued by the Committee of Sponsoring Organizations of the Treadway Commission (COSO).
BDC has reached the following conclusion regarding the design and effectiveness of internal control over financial reporting:As of March 31, 2018, certifying officers evaluated the design and effectiveness of internal control over financial reporting. Based on the results of the evaluation, they concluded that internal control over financial reporting is adequately designed and operates effectively to provide reasonable assurance about the reliability of financial reporting and of financial statements prepared in accordance with IFRS.
BDC has reached the following conclusion regarding the design and effectiveness of disclosure controls and procedures:As of March 31, 2018, certifying officers evaluated the design and effectiveness of disclosure controls and procedures. Based on the results of the evaluation, they concluded that disclosure controls and procedures are adequately designed and operate effectively to provide reasonable assurance that material information disclosed is recorded, processed, summarized and presented within the requested timeframe, and that it is communicated to management on a timely basis for decision-making purposes.
Management’s Discussion and Analysis | Accounting and Control Matters
2018 BDC AR > 44

w
2018 BDC AR > 45
Consolidated Financial StatementsManagement’s Responsibility for Financial Information
46
Independent Auditors’ Report 47Consolidated Statement of Financial Position
48
Consolidated Statement of Income
49
Consolidated Statement of Comprehensive Income
50
Consolidated Statement of Changes in Equity
51
Consolidated Statement of Cash Flows
53
Notes to the Consolidated Financial Statements
54

Consolidated Financial Statements
The Consolidated Financial Statements of the Business Development Bank of Canada (BDC) were prepared and presented by management in accordance with International Financial Reporting Standards. The information contained therein normally includes amounts requiring estimations that have been made based upon informed judgement as to the expected results of current transactions and events. The financial information presented elsewhere in this annual report is consistent with the Consolidated Financial Statements.
In discharging its responsibility for the integrity, fairness and quality of the Consolidated Financial Statements and for the accounting systems from which they are derived, management maintains a system of internal control designed to provide reasonable assurance that transactions are authorized, assets are safeguarded and proper records are maintained. BDC has a certification regime to evaluate the design and effectiveness of its internal control over financial reporting and its disclosure controls and procedures. This certification regime is based on the Internal Control—Integrated Framework issued by the Committee of Sponsoring Organizations of the Treadway Commission (COSO). Refer to the Management’s Discussion and Analysis section of the annual report for additional information (p. 44).
The system of internal controls is supported by internal audit staff members who conduct periodic reviews of different aspects of BDC’s operations. In addition, the Chief Audit Executive, Internal Audit and the External Auditors have full and free access to the Audit Committee of the Board of Directors, which is responsible for overseeing and reviewing management’s internal control and reporting responsibilities. The Board of Directors, through the Audit Committee, which is entirely composed of independent directors, is responsible for reviewing and approving the audited annual Consolidated Financial Statements.
BDC’s independent auditors, Deloitte LLP, Chartered Professional Accountants, and the Auditor General of Canada have audited BDC’s Consolidated Financial Statements and their report indicates the scope of their audit and their opinion on the Consolidated Financial Statements.
Michael Denham President and Chief Executive Officer
Montreal, Canada June 13, 2018
Stefano Lucarelli, cpa, ca Executive Vice President and Chief Financial Officer
Management’s Responsibility for Financial Information
2018 BDC AR > 46

Consolidated Financial Statements
INDEPENDENT AUDITORS’ REPORT
To the Minister of Innovation, Science and Economic Development
Report on the Consolidated Financial Statements
We have audited the accompanying consolidated financial statements of the Business Development Bank of Canada, which comprise the consolidated statement of financial position as at 31 March 2018, and the consolidated statement of income, consolidated statement of comprehensive income, consolidated statement of changes in equity and consolidated statement of cash flows for the year then ended, and a summary of significant accounting policies and other explanatory information.
Management’s Responsibility for the Consolidated Financial Statements
Management is responsible for the preparation and fair presentation of these consolidated financial statements in accordance with International Financial Reporting Standards, and for such internal control as management determines is necessary to enable the preparation of consolidated financial statements that are free from material misstatement, whether due to fraud or error.
Auditor’s Responsibility
Our responsibility is to express an opinion on these consolidated financial statements based on our audit. We conducted our audit in accordance with Canadian generally accepted auditing standards. Those standards require that we comply with ethical requirements and plan and perform the audit to obtain reasonable assurance about whether the consolidated financial statements are free from material misstatement.
An audit involves performing procedures to obtain audit evidence about the amounts and disclosures in the consolidated financial statements. The procedures selected depend on the auditor’s judgment, including the assessment of the risks of material misstatement of the consolidated financial statements, whether due to fraud or error. In making those risk assessments, the auditor considers internal control relevant to the entity’s preparation and fair presentation of the consolidated financial statements in order to design audit procedures that are appropriate in the circumstances, but not for the purpose of expressing an opinion on the effectiveness of the entity’s internal control. An audit also includes evaluating the appropriateness of accounting policies used and the reasonableness of accounting estimates made by management, as well as evaluating the overall presentation of the consolidated financial statements.
We believe that the audit evidence we have obtained is sufficient and appropriate to provide a basis for our audit opinion.
Opinion
In our opinion, the consolidated financial statements present fairly, in all material respects, the financial position of the Business Development Bank of Canada as at 31 March 2018, and its financial performance and its cash flows for the year then ended in accordance with International Financial Reporting Standards.
Report on Other Legal and Regulatory Requirements
As required by the Financial Administration Act, we report that, in our opinion, the accounting principles in International Financial Reporting Standards have been applied on a basis consistent with that of the preceding year.
Further, in our opinion, the transactions of the Business Development Bank of Canada and its wholly-owned subsidiary that have come to our notice during our audit of the consolidated financial statements have, in all significant respects, been in accordance with Part X of the Financial Administration Act and regulations, the Business Development Bank of Canada Act, the charter and by-laws of the Business Development Bank of Canada and its wholly-owned subsidiary, and the directives issued pursuant to section 89 of the Financial Administration Act.
Tina Swiderski, CPA auditor, CA
Principal for the Auditor General of Canada
13 June 2018 Montréal, Canada
1 CPA auditor, CA, public accountancy permit No. A116129
2018 BDC AR > 47

Note March 31, 2018
March 31, 2017
ASSETS
Cash and cash equivalents 8 672,870 649,168
Derivative assets 9 15,357 21,332
Loans and investments
Asset-backed securities 10 472,695 518,088
Loans 11 23,728,191 21,752,511
Subordinate financing investments 12 1,052,352 860,448
Venture capital investments 13 1 ,263,111 1,015,713
Venture capital action plan investments 14 400,516 301,541
Total loans and investments 26,916,865 24,448,301
Property and equipment 15 51,297 29,103
Intangible assets 16 38,206 33,148
Net defined benefit asset 20 95,303 121,098
Other assets 17 19,268 14,615
Total assets 27,809,166 25,316,765
LIABILITIES AND EQUITY
Liabilities
Accounts payable and accrued liabilities 18 127,453 119,035
Derivative liabilities 9 3,387 1,789
Borrowings 19
Short-term notes 20,481,148 18,809,436
Long-term notes 137,684 167,391
Total borrowings 20,618,832 18,976,827
Net defined benefit liability 20 255,225 231,498
Other liabilities 21 45,066 48,321
Total liabilities 21,049,963 19,377,470
Equity
Share capital 22 2,477,900 2,413,400
Contributed surplus 27,778 27,778
Retained earnings 4,211,785 3,473,612
Accumulated other comprehensive income (991) 2,710
Equity attributable to BDC’s shareholder 6,716,472 5,917,500
Non-controlling interests 42,731 21,795
Total equity 6,759,203 5,939,295
Total liabilities and equity 27,809,166 25,316,765
Guarantees and contingent liabilities (Note 27)
Commitments (Note 28)
The accompanying notes are an integral part of these Consolidated Financial Statements.
Michael Calyniuk Michael DenhamDirector Director Chairperson, Audit Committee President and Chief Executive Officer
Consolidated Financial Statements
Consolidated Statement of Financial Position(in thousands of Canadian dollars)
2018 BDC AR > 48

2018 2017
Interest income 1,355,071 1,169,576
Interest expense 143,766 79,435
Net interest income 1,211,305 1,090,141
Net realized gains (losses) on investments (19,637) 6,744
Revenue from Advisory Services 19,603 20,332
Fee and other income 84,612 52,096
Net revenue 1,295,883 1,169,313
Provision for credit losses (153,539) (179,545)
Net change in unrealized appreciation (depreciation) of investments 250,181 2,897
Net foreign exchange gains (losses) (17,010) 12,836
Net gains (losses) on other financial instruments 1,180 1,293
Income before operating and administrative expenses 1,376,695 1,006,794
Salaries and benefits 392,157 371,417
Premises and equipment 40,309 40,366
Other expenses 125,966 130,195
Operating and administrative expenses 558,432 541,978
Net income 818,263 464,816
Net income attributable to:
BDC's shareholder 775,004 465,974
Non-controlling interests 43,259 (1,158)
Net income 818,263 464,816
The accompanying notes are an integral part of these Consolidated Financial Statements. Note 25 provides additional information on the Consolidated Statement of Income and Note 26 provides segmented information.
Consolidated Financial Statements
Consolidated Statement of IncomeFor the year ended March 31 (in thousands of Canadian dollars)
2018 BDC AR > 49

2018 2017
Net income 818,263 464,816
Other comprehensive income (loss)
Items that may be reclassified subsequently to net income
Net change in unrealized gains (losses) on available-for-sale assets (3,565) (1,668)
Net unrealized gains (losses) on cash flow hedges 813 970
Reclassification to net income of losses (gains) on cash flow hedges (949) (404)
Net change in unrealized gains (losses) on cash flow hedges (136) 566
Total items that may be reclassified subsequently to net income (3,701) (1,102)
Items that will not be reclassified to net income
Remeasurements of net defined benefit asset or liability (36,831) 72,804
Other comprehensive income (loss) (40,532) 71,702
Total comprehensive income 777,731 536,518
Total comprehensive income attributable to:
BDC’s shareholder 734,472 537,676
Non-controlling interests 43,259 (1,158)
Total comprehensive income 777,731 536,518
The accompanying notes are an integral part of these Consolidated Financial Statements.
Consolidated Financial Statements
Consolidated Statement of Comprehensive IncomeFor the year ended March 31 (in thousands of Canadian dollars)
2018 BDC AR > 50
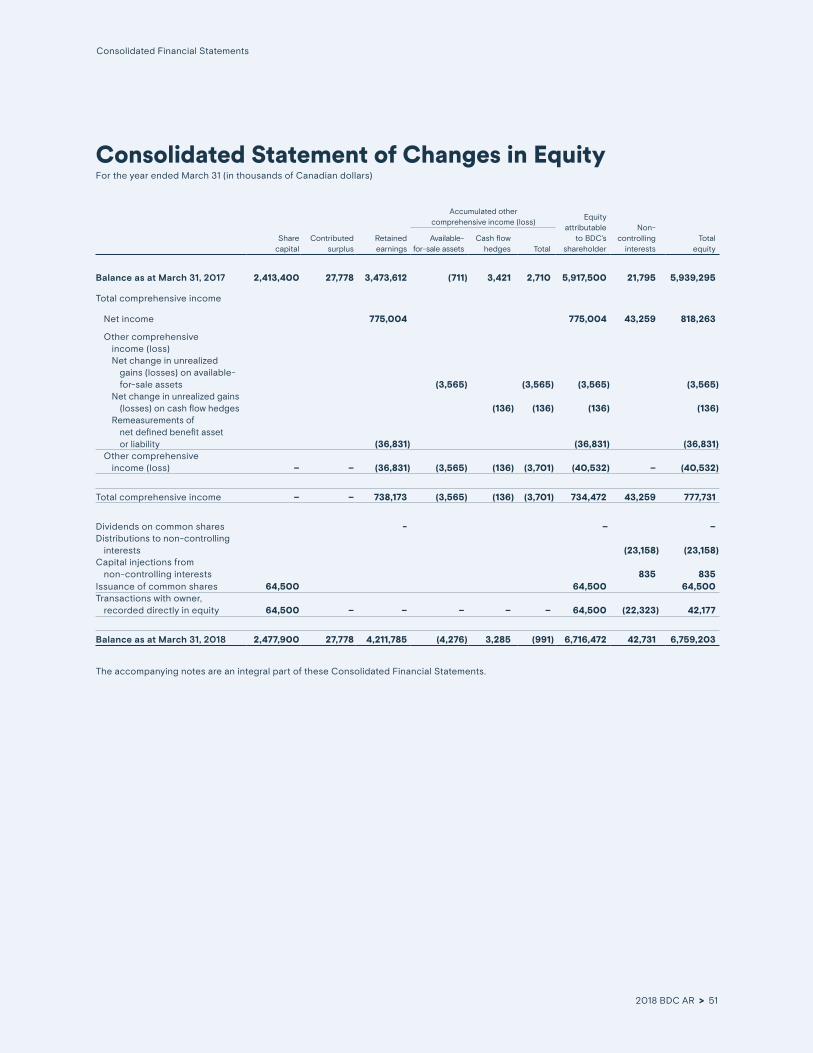
Consolidated Statement of Changes in EquityFor the year ended March 31 (in thousands of Canadian dollars)
Consolidated Financial Statements
Accumulated other comprehensive income (loss)
Equity attributable to BDC’s shareholder
Non- controlling interests
Total equity
Share capital
Contributedsurplus
Retained earnings
Available- for-sale assets
Cash flowhedges Total
Balance as at March 31, 2017 2,413,400 27,778 3,473,612 (711) 3,421 2,710 5,917,500 21,795 5,939,295
Total comprehensive income
Net income 775,004 775,004 43,259 818,263
Other comprehensive income (loss) Net change in unrealized gains (losses) on available- for-sale assets (3,565) (3,565) (3,565) (3,565) Net change in unrealized gains (losses) on cash flow hedges (136) (136) (136) (136) Remeasurements of net defined benefit asset or liability (36,831) (36,831) (36,831) Other comprehensive income (loss) – – (36,831) (3,565) (136) (3,701) (40,532) – (40,532)
Total comprehensive income – – 738,173 (3,565) (136) (3,701) 734,472 43,259 777,731
Dividends on common shares - – – Distributions to non-controlling interests (23,158) (23,158)Capital injections from non-controlling interests 835 835 Issuance of common shares 64,500 64,500 64,500 Transactions with owner, recorded directly in equity 64,500 – – – – – 64,500 (22,323) 42,177
Balance as at March 31, 2018 2,477,900 27,778 4,211,785 (4,276) 3,285 (991) 6,716,472 42,731 6,759,203
The accompanying notes are an integral part of these Consolidated Financial Statements.
2018 BDC AR > 51

Consolidated Statement of Changes in Equity (continued)
For the year ended March 31 (in thousands of Canadian dollars)
Consolidated Financial Statements
Accumulated other comprehensive income (loss)
Equity attributable to BDC’s shareholder
Non- controlling interests
Total equity
Share capital
Contributedsurplus
Retained earnings
Available- for-sale assets
Cash flowhedges Total
Balance as at March 31, 2016 2,288,400 27,778 3,003,483 957 2,855 3,812 5,323,473 26,046 5,349,519
Total comprehensive income
Net income 465,974 465,974 (1,158) 464,816
Other comprehensive income (loss) Net change in unrealized gains (losses) on available- for-sale assets (1,668) (1,668) (1,668) (1,668) Net change in unrealized gains (losses) on cash flow hedges 566 566 566 566 Remeasurements of net defined benefit asset or liability 72,804 72,804 72,804 Other comprehensive income (loss) – – 72,804 (1,668) 566 (1,102) 71,702 – 71,702
Total comprehensive income – – 538,778 (1,668) 566 (1,102) 537,676 (1,158) 536,518
Dividends on common shares (68,649) (68,649) (68,649)Distributions to non-controlling interests (4,971) (4,971)Capital injections from non-controlling interests 1,878 1,878
Issuance of common shares 125,000 125,000 125,000 Transactions with owner, recorded directly in equity 125,000 – (68,649) – – – 56,351 (3,093) 53,258
Balance as at March 31, 2017 2,413,400 27,778 3,473,612 (711) 3,421 2,710 5,917,500 21,795 5,939,295
The accompanying notes are an integral part of these Consolidated Financial Statements.
2018 BDC AR > 52

Consolidated Financial Statements
Consolidated Statement of Cash FlowsFor the year ended March 31 (in thousands of Canadian dollars)
Note 2018 2017
Operating activities
Net income 818,263 464,816
Adjustments to determine net cash flows
Interest income (1,355,071) (1,169,576)
Interest expense 143,766 79,435
Net realized losses (gains) on investments 19,637 (6,744)
Provision for credit losses 153,539 179,545
Net change in unrealized depreciation (appreciation) of investments (250,181) (2,897)
Net unrealized foreign exchange losses (gains) 28,858 (9,237)
Net unrealized losses (gains) on other financial instruments (231) 1,110
Defined benefits funding below (in excess) of amounts expensed 12,691 19,203
Depreciation of property and equipment, and amortization of intangible assets 16,072 15,708
Loss on derecognition of property and equipment 751 46
Other (13,777) (21,664)
Interest expense paid (137,713) (79,993)
Interest income received 1,302,618 1,136,337
Changes in operating assets and liabilities
Net change in loans (2,083,806) (2,157,463)
Net change in accounts payable and accrued liabilities 8,418 22,069
Net change in other assets and other liabilities (7,908) 8,967
Net cash flows provided (used) by operating activities (1,344,074) (1,520,338)
Investing activities
Disbursements for asset-backed securities (272,802) (227,631)
Repayments and proceeds on sale of asset-backed securities 314,703 217,721
Disbursements for subordinate financing investments (401,299) (286,486)
Repayments of subordinate financing investments 218,482 162,691
Disbursements for venture capital investments (185,207) (184,719)
Proceeds on sale of venture capital investments 124,061 127,686
Disbursements for venture capital action plan investments (74,585) (157,794)
Proceeds on sale of venture capital action plan investments 2,496 4,519
Acquisition of property and equipment (29,767) (12,136)
Acquisition of intangible assets (14,308) (4,574)
Net cash flows provided (used) by investing activities (318,226) (360,723)
Financing activities
Net change in short-term notes 19 1,665,000 1,961,227
Repayment of long-term notes 19 (21,175) (164,349)
Distributions to non-controlling interests (23,158) (4,971)
Capital injections from non-controlling interests 835 1,878
Issuance of common shares 64,500 125,000
Dividends paid on common shares – (68,649)
Net cash flows provided (used) by financing activities 1,686,002 1,850,136
Net increase (decrease) in cash and cash equivalents 23,702 (30,925)
Cash and cash equivalents at beginning of year 649,168 680,093
Cash and cash equivalents at end of year 672,870 649,168
The accompanying notes are an integral part of these Consolidated Financial Statements.
2018 BDC AR > 53

1.Act of incorporation, objectives and operations of the Corporation
The Business Development Bank of Canada is a Crown corporation that was established by an Act of Parliament on December 20, 1974, as the Federal Business Development Bank and continued under its current name by an Act of Parliament that was enacted on July 13, 1995. The Business Development Bank of Canada is incorporated in Canada and wholly owned by the Government of Canada. The Corporation’s head office is located at 5 Place Ville Marie, Suite 100, Montreal, Quebec, Canada.
The objectives of the Business Development Bank of Canada and its subsidiaries (together, BDC) are to promote and assist in the establishment and development of business enterprises in Canada, with a focus on small and medium-sized enterprises, by providing a range of complementary lending, investment and consulting services. BDC offers Canadian companies services tailored to meet their current needs while earning an appropriate return on equity, which is used to further BDC’s activities.
BDC does not receive appropriations from the Government of Canada. To finance its objectives, BDC borrows funds from Her Majesty the Queen in Right of Canada acting through the Minister of Finance. Prior to April 21, 2008, BDC issued debt instruments, which were secured by the Government of Canada. The Business Development Bank of Canada Act (BDC Act) also allows the use of hybrid capital instruments to provide the capital required for its operations. Her Majesty the Queen in Right of Canada would not be liable for payment of amounts owing under such capital instruments, none of which were outstanding as at March 31, 2018, and March 31, 2017.
BDC is for all purposes an agent of Her Majesty the Queen in Right of Canada. BDC is also named in Part I of Schedule III to the Financial Administration Act (FAA) and is accountable for its affairs to Parliament through the Minister of Innovation, Science and Economic Development. Pursuant to section 89 of the FAA, BDC, together with a number of other Crown corporations, has to comply with a directive issued in 2008 to ensure that Crown corporations give due consideration to the personal integrity of those they lend to or provide benefits to, in accordance with the government’s policy to improve the accountability and integrity of federal institutions. In fiscal 2009, BDC completed the implementation of the requirements of section 89 and confirms that the directive has been met since then.
Pursuant to section 89 of the FAA, BDC received a directive in December 2014 from the Governor General in Council (P.C. 2014-1378) requesting that BDC review its current pension plan and ensure that it remains affordable, financially sustainable and consistent with the terms of the Public Service Pension Plan. These changes are intended to ensure that pension plans of Crown corporations provide a 50:50 current service cost-sharing ratio between employee and employer for pension contributions by December 31, 2017, as well as to raise the normal age of retirement to 65 years for employees hired on or after January 1, 2015. Consequently, to comply with the directive, BDC implemented modifications to its existing defined benefit pension plan effective January 1, 2015. Eligible employees hired before January 1, 2015, had a choice of three options: two options included some features of the old plan design and a third option offered a completely new benefit structure. Employees hired after December 31, 2014, are automatically enrolled in the third option. In addition, BDC gradually increased the employee’s contribution level allowing to achieve a 50:50 current service cost sharing by December 31, 2017 and approved a funding policy with mechanisms to ensure BDC’s cash contributions, for current service cost only, would not exceed members’ required contributions, on a cumulative basis while complying with regulations. BDC completed the implementation of both elements of its strategy by December 31, 2017. As at December 31, 2017, BDC reached a 48:52 current service cost-sharing ratio between employee and employer. The slight deviation from the 50:50 objective is mostly explained by aging of its workforce greater than anticipated, other demographics changes as well as economical assumptions changes, such as a going-concern discount rate lower than forecasted in 2013. BDC will closely monitor the situation to ensure that it will reach the 50:50 objective in the upcoming years.
Notes to the Consolidated Financial StatementsFor the year ended March 31, 2018 (in thousands of Canadian dollars)
2018 BDC AR > 54

1. Act of incorporation, objectives and operations of the Corporation (continued)
Pursuant to section 89 of the FAA, BDC received a directive in July 2015 from the Governor General in Council (P.C. 2015-1109) requiring that BDC align its travel, hospitality, conference and event expenditure policies, guidelines and practices with Treasury Board policies, directives and related instruments on travel, hospitality, conference and event expenditures in a manner that is consistent with its legal obligations. The directive also instructed BDC to report on its implementation of this directive in its next corporate plan. Consequently, to comply with this directive, BDC implemented modifications to its Business Expense Policy and Corporate Directive. The Business Expense Policy can be found on BDC’s website. Also, to comply with the updated Treasury Board Directive on Travel, Hospitality, Conference and Event Expenditures which took effect April 1, 2017, BDC now discloses on its website extensive information on travel and hospitality expenses for all senior level employees and Board members. BDC has also reported on the implementation of the directive in its Corporate Plans.
2.Basis of preparation
Statement of compliance
BDC has prepared its Consolidated Financial Statements in accordance with International Financial Reporting Standards (IFRS). These Consolidated Financial Statements were approved for issue by the Board of Directors on June 13, 2018.
Basis of presentation and measurement
The Consolidated Financial Statements have been prepared on a historical cost basis, except for the following:
> available-for-sale financial assets, financial assets and financial liabilities at fair value through profit or loss, and derivative financial instruments have been measured at fair value; and
> the net defined benefit asset or liability in respect of post-employment benefits has been recognized as the present value of the defined benefit obligation less the fair value of the plans’ assets.
These Consolidated Financial Statements are presented in Canadian dollars, which is BDC’s functional currency as well as the functional currency of its subsidiaries. Unless otherwise specified, the figures presented in the Consolidated Financial Statements are stated in thousands of Canadian dollars.
Basis of consolidation
BDC conducts business through a variety of entities, including a wholly owned subsidiary, and several investment funds and other entities that are considered to be subsidiaries for financial reporting purposes.
The Consolidated Financial Statements of BDC comprise the financial statements of the parent entity and the consolidated financial statements of the subsidiaries referred to above as of March 31, 2018, and March 31, 2017. The financial statements of the subsidiaries are prepared using uniform accounting policies and valuation methods for similar transactions.
Notes to the Consolidated Financial StatementsFor the year ended March 31, 2018(in thousands of Canadian dollars)
2018 BDC AR > 55

2. Basis of preparation (continued)
Subsidiaries
For financial reporting purposes, subsidiaries are defined as entities controlled by BDC. BDC controls an entity when it has power over the investee; it is exposed to, or has rights to, variable returns from its involvement with the entity; and it has the ability to affect those returns through its power over the entity. Control is presumed when BDC directly or indirectly holds the majority of the voting rights. The existence and effect of potential voting rights are considered when assessing whether BDC controls another entity.
In instances where BDC does not hold a majority of the voting rights, further analysis is performed to determine whether or not BDC has control of the entity. BDC is deemed to have control when, according to the terms of the shareholder’s and/or limited partnership agreements, it makes most of the decisions affecting relevant activities.
Subsidiaries are fully consolidated from the date that control begins until the date that control ceases. No subsidiary has been acquired or disposed of during the reporting periods. Intercompany transactions and balances are eliminated upon consolidation.
The following entities have been consolidated in BDC’s Consolidated Financial Statements.
Entity Principal activity
Country of incorporation and residence
Proportion of ownership and voting power held Basis of control
BDC Capital Inc. Holding company structure
for investment activitiesCanada 100% Voting power
AlterInvest II Fund L.P. Investments in subordinate financing
Canada 50% Voting power and contractual agreements
Go Capital L.P. Investments in venture capital
Canada 20% Voting power and contractual agreements
Go Capital L.P.
Although BDC owns less than half of Go Capital L.P. and holds less than half of the voting power, management has determined, based on the terms of the agreement under which Go Capital L.P. was established, that BDC controls this entity. As the general partner, BDC has the current ability to direct the relevant activities of Go Capital L.P. and has the power to affect the variable returns, to which BDC is exposed.
Go Capital L.P.’s year-end date is December 31, as agreed upon by the partners at the time this entity was established. Consequently, additional financial information regarding this entity is prepared for the interim period for the purposes of consolidation.
AlterInvest II Fund L.P.
BDC owns 50% of AlterInvest II Fund L.P and acts as the general partner for this entity, thus having the ability to direct all relevant activities and power to affect the variable returns to which BDC is exposed. During fiscal 2014, having reached the end of their intended lives, AlterInvest Fund L.P. and AlterInvest Investment Fund Inc. began liquidating their investments. BDC owned 50% of AlterInvest Fund L.P. and AlterInvest Investment Fund Inc. Those investments that were not reimbursed by their respective clients were transferred into AlterInvest II Fund L.P. As each partner has equal interest in all of the funds, their partnership interest in AlterInvest II Fund L.P. did not change as a result of these transactions. At the end of fiscal 2018, these entities were dissolved.
Notes to the Consolidated Financial StatementsFor the year ended March 31, 2018(in thousands of Canadian dollars)
2018 BDC AR > 56

2. Basis of preparation (continued)
Non-controlling interests
Interests in the equity of subsidiaries not attributable to the parent entity are reported in consolidated equity as non-controlling interests. Net income and each component of other comprehensive income are attributed to BDC’s shareholder and to non-controlling interests in accordance with their respective shareholdings, even if this results in the non-controlling interests having a deficit balance.
Associates
Associates are those entities in which BDC has significant influence, but not control, over the financial and operating policies. Subordinate financing and venture capital investments in associates that are held as part of BDC’s investment portfolio by BDC Capital Inc. are carried in the Consolidated Statement of Financial Position at fair value. This treatment is permitted by International Accounting Standard (IAS) 28, Investments in Associates, which permits investments in an associate held by an entity that is a venture capital organization or other similar entity to elect to measure these investments at fair value through profit or loss in accordance with IAS 39, Financial Instruments: Recognition and Measurement.
3.Significant accounting policies
The principal accounting policies applied in the preparation of these Consolidated Financial Statements are set out below. These policies have been consistently applied to all periods presented in these Consolidated Financial Statements and have been applied consistently by all entities consolidated by BDC.
Financial instruments
Recognition and measurement of financial instrumentsFinancial assets and financial liabilities are recognized when BDC becomes party to the contractual provisions of the financial instrument.
Financial assets are derecognized when the contractual rights to the cash flows from the financial asset expire, or when the financial asset and all substantial risks and rewards are transferred. A financial liability is derecognized when the related contractual obligation is extinguished, discharged or cancelled, or when it expires.
Financial instruments are recognized and derecognized using settlement date accounting.
On initial recognition, financial instruments are measured at fair value. Fair value on initial recognition includes transaction costs directly attributable to the acquisition or issue of financial instruments, except for financial instruments carried at fair value through profit or loss, for which transaction costs are recognized in net income in the period when they are incurred.
Financial instruments are measured in subsequent periods either at fair value or at amortized cost using the effective interest rate method, depending on the financial instrument classification.
The effective interest rate is the rate that exactly discounts the estimated future cash payments and receipts through the expected life of the financial asset or liability to its carrying amount. When calculating the effective interest rate, BDC estimates future cash flows, considering all contractual terms of the financial instrument.
Notes to the Consolidated Financial StatementsFor the year ended March 31, 2018(in thousands of Canadian dollars)
2018 BDC AR > 57
3. Significant accounting policies (continued)
Financial instruments (continued)
Classification of financial instrumentsFair value through profit or lossFinancial instruments carried at fair value through profit or loss include financial instruments that are either (i) classified as held-for-trading or (ii) designated as at fair value through profit or loss upon initial recognition if they meet certain conditions.
Financial instruments classified as held-for-tradingA financial instrument is classified as held-for-trading if:
> it is acquired or incurred principally for the purpose of selling or repurchasing instruments in the near term; or
> at initial recognition, it is part of a portfolio of identified financial instruments that are managed together and for which there is evidence of a recent actual pattern of short-term profit-taking.
Derivative financial instruments are also classified as held-for-trading unless they are designated as hedging instruments.
Financial instruments designated as at fair value through profit or lossA financial instrument can be designated as at fair value through profit or loss in the following circumstances:
> the asset or liability is managed, evaluated and reported internally on a fair value basis;
> the designation eliminates or significantly reduces an accounting mismatch that would otherwise arise; or
> the asset or liability contains an embedded derivative that is separable and significantly modifies the cash flows that would otherwise be required under the contract.
A description of the basis for each designation is set out in the major types of financial instruments section of this note.
Subsequent to initial recognition, asset-backed securities, subordinate financing, venture capital and venture capital action plan investments classified or designated as at fair value through profit or loss are measured at fair value, with the variation of unrealized gains or losses being recognized in the Consolidated Statement of Income as net change in unrealized appreciation or depreciation of investments, and gains and losses upon the sale, disposal or write-off of these investments being recognized in the Consolidated Statement of Income as net realized gains or losses on investments.
Unrealized and realized gains or losses related to derivatives and borrowings are reported in the Consolidated Statement of Income as net gains or losses on other financial instruments.
Available-for-sale financial assetsAvailable-for-sale assets are non-derivative financial assets that are:
> intended to be held for an indefinite period of time and that may be sold in response to needs for liquidity, or changes in interest rates, exchange rates or equity prices; and
> not classified as loans and receivables, held-to-maturity investments or financial assets at fair value through profit or loss.
Subsequent to initial recognition, available-for-sale assets are measured at fair value, with unrealized gains and losses recorded in other comprehensive income (OCI) until the asset is derecognized, with the exception of impairment losses, which are recorded in the Consolidated Statement of Income during the period in which the asset is determined to have become impaired.
Upon disposal of available-for-sale assets, the accumulated fair value adjustments recognized in OCI are reclassified to the Consolidated Statement of Income and are reported as net realized gains or losses on investments.
Notes to the Consolidated Financial StatementsFor the year ended March 31, 2018(in thousands of Canadian dollars)
2018 BDC AR > 58

3. Significant accounting policies (continued)
Financial instruments (continued)
Classification of financial instruments (continued)
Cash flow hedgesBDC designates certain derivatives held for risk management as cash flow hedges. BDC documents all hedging relationships and its risk management objectives, along with its strategy for carrying out the hedge transactions. BDC assesses whether the derivatives used in hedging transactions are highly effective in offsetting changes in cash flow of hedged items, both at inception and over the life of the hedge.
Subsequent to initial recognition, derivatives designated as cash flow hedges are measured at fair value. The effective portion of changes in fair value of these derivatives is recognized in OCI and accumulated other comprehensive income (AOCI), while changes related to the ineffective portion are recorded in the Consolidated Statement of Income as net gains or losses on other financial instruments. Amounts in AOCI are recycled to the Consolidated Statement of Income in the periods where the hedged items affect net income. They are recorded in the financial statement lines associated with the related hedged items.
If these hedging instruments expire, are sold or no longer meet the criteria for hedge accounting, the amounts previously recognized in OCI are reclassified to the Consolidated Statement of Income as net gains or losses on other financial instruments during the periods when the variability in the cash flows of the hedged item affects net income. However, if a forecasted transaction is no longer expected to occur, the cumulative gain or loss that was reported in equity is immediately transferred to the Consolidated Statement of Income under net gains or losses on other financial instruments.
BDC elected to de-designate the hedging instruments effective on the last day of the fiscal year. The amounts recognized in Other Comprehensive Income at March 31, 2018 will be recycled to the Consolidated Statement of Income in the periods where the hedged items affect net income. Derivatives held for risk management will be measured at fair value in the Consolidated Statement of Income starting April 1, 2018.
Loans and receivablesLoans and receivables are non-derivative financial assets with fixed or determinable payments that are not quoted in an active market. Subsequent to initial recognition, loans and receivables are measured at amortized cost using the effective interest rate method.
Financial liabilities measured at amortized costFinancial liabilities that are not carried at fair value through profit or loss fall into the financial liabilities category and are measured subsequently at amortized cost using the effective interest rate method.
Major types of financial instrumentsCash equivalentsCash equivalents include short-term bank notes that, at the original acquisition date, have maturities of less than three months and are used to manage liquidity risk.
Cash equivalents have been classified as loans and receivables.
Asset-backed securitiesThe asset-backed securities (ABS) portfolio consists of investment-grade senior and subordinated notes issued by way of private placement.
Investment-grade senior ABS are classified as available-for-sale assets and subordinated ABS notes are designated as at fair value through profit or loss on the basis that they are reported to and evaluated by senior management on a fair value basis. ABS presented on the Consolidated Statement of Financial Position include accrued interest receivable.
The fair value of ABS is calculated using forecasted cash flows and an estimated yield curve that is derived from the Canadian government yield curve and ABS spread for comparable transactions. The result is adjusted to reflect the risk of the underlying assets and deal structure.
Notes to the Consolidated Financial StatementsFor the year ended March 31, 2018(in thousands of Canadian dollars)
2018 BDC AR > 59

3. Significant accounting policies (continued)
Financial instruments (continued)
Major types of financial instruments (continued)
Impairment of asset-backed securitiesAt each reporting date, BDC reviews ABS classified as available-for-sale for possible impairments or reversals of previously recognized impairments. BDC determines that ABS are impaired when there is objective evidence of impairment as a result of one or more events that occurred after the initial recognition of the asset and when that loss event (or events) has an impact on the estimated future cash flows of the financial asset or group of financial assets that can be reliably estimated. Refer to Note 6—Significant Accounting Judgements, Estimates and Assumptions for more information regarding the criteria used to determine whether an impairment has occurred.
Impairment losses and reversals of impairment losses are recognized in the Consolidated Statement of Income during the period in which objective evidence of impairment or reversal of impairment is identified.
LoansLoans are classified as loans and receivables. They are measured at amortized cost using the effective interest rate method, less allowance for credit losses. Loans presented on the Consolidated Statement of Financial Position include accrued interest receivable.
Allowance for credit lossesThe allowance for credit losses is maintained at a level considered adequate to absorb the credit losses existing in the portfolio at the financial reporting date. Allowances for credit losses are established at both the individual and collective levels.
BDC reviews its loan portfolio on an individual asset basis to assess credit risk and determines whether there is any objective evidence of impairment for which a loss should be recognized in the Consolidated Statement of Income. For BDC, there is objective evidence of impairment when the interest or principal of the loan is in arrears for three consecutive months or more, or if there is reason to believe that a portion of the principal or interest cannot be collected.
When a loan is deemed impaired, interest accrual recognition ceases and the carrying amount of the loan is reduced to the present value of its estimated future cash flows discounted using (i) the initial effective interest rate of the loan for fixed rate loans or (ii) the rate at time of impairment for floating rate loans. If cash flows cannot be reasonably determined, the estimated fair value of any underlying collateral is used, whether or not foreclosure is probable.
The carrying amounts of impaired loans are first reduced through the use of an allowance account, and then written off if and when all collection efforts have been exhausted and no further prospect of recovery is likely. The amounts of the initial impairment losses, as well as any subsequent increases or reversals of these impairment losses, are recognized in the provision for credit losses in the Consolidated Statement of Income.
Loans for which an individual allowance has not been established are then included in groups of assets having similar credit risk characteristics and collectively assessed for any impairment that has been incurred but not yet identified.
Refer to Note 6—Significant Accounting Judgements, Estimates and Assumptions for more information regarding the criteria used to determine the amount of the allowance.
Notes to the Consolidated Financial StatementsFor the year ended March 31, 2018(in thousands of Canadian dollars)
2018 BDC AR > 60

3. Significant accounting policies (continued)
Financial instruments (continued)
Major types of financial instruments (continued)
Subordinate financing, venture capital and venture capital action plan investmentsUpon initial recognition, subordinate financing, venture capital and venture capital action plan investments are designated as at fair value through profit or loss on the basis that they are part of a portfolio that is reported to and evaluated by senior management on a fair value basis, in accordance with a documented investment and risk management strategy.
BDC’s valuation process for fair value measurement of subordinate financing, venture capital and VCAP investments has been derived from the International Private Equity and Venture Capital Valuation Guidelines. Based on the type of investments being valued, BDC uses (i) market-based methodologies, such as the quoted share price or the price of recent similar investments; (ii) discounted earnings or cash flow approaches; or (iii) liquidation or asset-based methods. These fair values are updated at least twice a year by internal valuators and are then reviewed by a valuation committee, which includes an external member who is a chartered business valuator. VCAP includes fund-of-fund transactions that provide for certain other limited partners to receive a preferred return on the initial cost of their investment, later timing of cash calls and preference in the distributions. The impact of these terms and conditions is taken into account in the fair value calculation by applying an adjustment to the attributed net asset value of each fund.
BorrowingsShort-term notes are measured at amortized cost.
BDC has two types of long-term notes: unstructured and structured. Unstructured long-term notes are recorded at amortized cost. Structured notes are notes for which interest or principal, or both, are linked to fluctuations in currency rates, swap rates and other market references. These structured notes have been designated as at fair value through profit or loss, as they contain embedded derivatives that would otherwise need to be separated, given that they significantly modify the cash flows required under the host debt contract.
The fair value of structured notes is determined by using observable market data, together with recognized valuation techniques. Observable market data are sourced from leading inter-dealer brokers and include interest rates, foreign exchange rates and other market references.
Interest accrued on borrowings is included in the carrying amount of both short- and long-term notes.
DerivativesDerivative financial instruments are financial contracts that derive their value from underlying changes in interest rates, foreign exchange rates, stock market indices or other financial instrument measures. BDC acquires derivative financial instruments to manage exposures to interest, currency and other market risks. BDC does not hold derivatives for speculative or trading purposes. Derivatives are either designated as cash flow hedges or classified as held-for-trading.
All BDC derivatives are over-the-counter and are mainly composed of swaps and foreign exchange forwards. The fair value of swaps is determined using pricing models that take into account current market and contractual prices of the underlying instrument, as well as time value, the yield curve, or volatility factors underlying the position and embedded options. The fair value of foreign exchange forwards is calculated by discounting the notional amount using the yield curves of the respective currencies. Inputs to both these calculations are market-observable data sourced from leading inter-dealer brokers, together with industry-standard valuation models for estimating fair value.
Embedded derivatives that are not closely related to the host contract must be separated and classified as held-for-trading financial instruments, unless the hybrid instrument is designated as at fair value through profit or loss. As at March 31, 2018, and March 31, 2017, BDC had no embedded derivatives that needed to be separated from a host contract.
Notes to the Consolidated Financial StatementsFor the year ended March 31, 2018(in thousands of Canadian dollars)
2018 BDC AR > 61

3. Significant accounting policies (continued)
Interest income, interest expense and fee income
Interest income and expense for interest-bearing financial instruments are recognized in interest income and interest expense in the Consolidated Statement of Income using the effective interest rate method, with the exception of subordinate financing investments, for which interest income is recognized using the contractual rate of the instrument. Interest on impaired loans continues to be recognized based on the reduced carrying amount using the interest rate used to discount the future cash flows for the purposes of measuring the impairment loss.
Subordinate financing investments also bear non-interest returns, such as royalties and interest bonuses, which are recognized in fee and other income in the Consolidated Statement of Income when it is probable that they will be received and the amounts can be measured reliably.
Fees that are integral to originating or renegotiating a loan are deferred and recognized as interest income over the expected term of the loan using the effective interest rate method. All other fees are recognized in net income as the related services are performed.
Premiums and discounts on borrowings are amortized in interest expense over the life of the obligation using the effective interest rate.
Revenue from Advisory Services
Advisory Services provides consulting services to entrepreneurs. Revenues from Advisory Services are recognized as revenue when the services are rendered.
Property and equipment and intangible assets
Property and equipment and intangible assets are carried at cost less accumulated depreciation, accumulated amortization and accumulated impairment losses, if any.
The cost of an item of property and equipment includes its purchase price and any costs directly attributable to bringing the asset to the location and condition necessary for it to operate in the manner intended by management.
Property and equipment are depreciated using the straight-line method over the estimated useful life of the asset, as follows:
Estimated useful lifeRecorded in Consolidated Statement of Income as
Computer and telecommunications equipment 5 years Other expenses
Furniture, fixtures and equipment 10 years Premises and equipment
Leasehold improvements Lease term Premises and equipment
Intangible assets primarily comprise systems and software applications, the cost of which includes the purchase price plus any costs incurred to prepare them for their intended internal use. The intangible assets’ lives are finite and are amortized using the straight-line method over their estimated useful economic lives, which range from three to seven years. Costs related to projects in progress are not subject to amortization until the related intangible asset is available for use. The amortization expense is included in other expenses in the Consolidated Statement of Income.
Notes to the Consolidated Financial StatementsFor the year ended March 31, 2018(in thousands of Canadian dollars)
2018 BDC AR > 62

3. Significant accounting policies (continued)
Property and equipment and intangible assets (continued)
For intangible assets internally developed, expenditures on research (or on the research phase of an internal project) are recognised as an expense when it is incurred.
An intangible asset arising from development (or from the development phase of an internal project) will be recognised if, and only if, all of the following can be demonstrated:
(a) the technical feasibility of completing the intangible asset so that it will be available for use or sale.(b) the intention to complete the intangible asset and use or sell it.(c) the ability to use or sell the intangible asset.(d) how the intangible asset will generate probable future economic benefits. (e) the availability of adequate technical, financial and other resources to complete the development and to use or sell the intangible asset.(f) the ability to measure reliably the expenditure attributable to the intangible asset during its development.
The cost of an internally generated intangible asset is the sum of expenditure incurred from the date when the intangible asset first meets the recognition criteria above. If the above criteria are not met, development costs are recognized as expenses during the fiscal year when they have been incurred.
The residual values, depreciation and amortization methods, as well as useful lives of items of property and equipment and intangible assets, are reviewed, and adjusted if appropriate, at least at each financial reporting date.
These assets are also reviewed for impairment whenever events or changes in circumstances indicate that the carrying amount may not be recoverable. Irrespective of whether there is any indication of impairment, an impairment test is also performed annually for projects in progress related to intangible assets. When impairment tests indicate that the carrying amount of an asset (or group of assets) is greater than its estimated recoverable amount, the carrying amount is written down immediately to its recoverable amount. The recoverable amount is the higher of the asset’s fair value less costs to sell and its value in use.
Net defined benefit asset or liability
BDC maintains a registered defined benefit pension plan, supplemental defined benefit pension plans and other post-employment defined benefits (which include health, dental, critical illness and life insurance coverage) for eligible employees.
The net defined benefit asset or liability is the present value of the defined benefit obligation less the fair value of plan assets.
BDC’s defined benefit obligation in respect of retirement benefit plans is calculated separately for each plan by estimating the amount of future benefits employees have earned in return for their services in the current and prior periods.
The defined benefit obligation is calculated for each plan using the projected unit credit method. In determining the present value of its defined benefit obligation, and the related current service cost and past service cost, BDC attributes the benefit to periods of service under the plan’s benefit formula. The present value of the defined benefit obligation is calculated by discounting the estimated future cash outflows using interest rates of high-quality corporate and provincial bonds that have terms to maturity approximating the terms of the obligation.
Notes to the Consolidated Financial StatementsFor the year ended March 31, 2018(in thousands of Canadian dollars)
2018 BDC AR > 63
3. Significant accounting policies (continued)
Net defined benefit asset or liability (continued)
BDC determines the net interest expense or income on the net defined benefit asset or liability for the period by applying the discount rate used to measure the defined benefit obligation at the beginning of the annual reporting period to both the defined benefit obligation and the plan assets. When the benefits of a plan are changed, or when a plan is curtailed, the portion of the changed benefit related to past service by employees, or the gain or loss on curtailment, is recognized immediately in profit or loss when the plan amendment or curtailment occurs.
Remeasurements, which include actuarial gains and losses, as well as differences between the return on plan assets and interest income on plan assets, are recognized immediately in OCI. Remeasurements recognized in OCI are reflected immediately in retained earnings and are not reclassified to net income. Current service costs, past service costs, gain or loss on curtailment, and net interest on the net defined benefit asset or liability are recognized in net income.
Equity attributable to BDC’s shareholder
Share capital represents the par value of common shares issued and in circulation. Contributed surplus represents the value of assets transferred to BDC by the shareholder without issuance of shares.
Unrealized gains and losses on financial instruments classified as available-for-sale assets are included in AOCI until such time as the financial instruments are derecognized or impaired, at which time these gains or losses are reclassified to net income. Unrealized gains and losses on derivative financial instruments designated as hedging instruments are included in AOCI until such time as the hedged forecasted cash flows are reclassified to net income. BDC elected to de-designate the hedging instruments effective on March 31, 2018 and current AOCI balances are being reclassified to net income over the original contract life remaining.
Retained earnings include all current and prior periods’ net income and remeasurements of net defined benefit asset or liability, net of dividends paid.
Translation of foreign currencies
Assets and liabilities denominated in foreign currencies, all of which are monetary, are translated into Canadian dollars at exchange rates prevailing at the reporting date. Revenues and expenses denominated in foreign currencies are translated into Canadian dollars using the exchange rate at the date of each transaction.
Unrealized and realized foreign exchange gains or losses on foreign exchange forwards, subordinate financing investments, loans, asset-backed securities as well as unrealized foreign exchange gains or losses on venture capital and venture capital action plan investments are included in the Consolidated Statement of Income and reported as net foreign exchange gains or losses, whereas realized and unrealized gains or losses on debts and swaps are reported as net gains or losses on other financial instruments. Realized foreign exchange gains or losses on venture capital and venture capital action plan investments are reported under net realized gains (losses) on investments in the Consolidated Statement of Income.
Segmented information
BDC has the following operating segments, which are based on differences in products, services and government supported initiatives: Financing, Growth & Transition Capital, Venture Capital, Advisory Services, Venture Capital Action Plan and Cleantech Practice.
The operating segments are reported in a manner consistent with the way BDC presents and discloses information that is regularly reviewed by the senior management team and the Board of Directors in assessing performance.
All transactions between business segments are recognized on an arm’s-length basis. Income and expenses directly associated with each segment are included when determining business segment performance.
Notes to the Consolidated Financial StatementsFor the year ended March 31, 2018(in thousands of Canadian dollars)
2018 BDC AR > 64
4.Application of new and amended International Financial Reporting Standards
On April 1, 2017, BDC adopted the following new amendments:
> Amendments to IAS 7- Disclosure initiative
BDC has applied these amendments for the first time in the current year. The amendments require an entity to provide disclosures that enable users of financial statements to evaluate changes in liabilities arising from financing activities, including both cash and non-cash changes. BDC’s liabilities arising from financing activities consist of borrowings (Note 19—Borrowings). A reconciliation between the opening and closing balances of these items is provided in Note 19—Borrowings. Consistent with the transition provisions of the amendments, BDC has not disclosed comparative information for the prior period. Apart from the additional disclosure in Note 19—Borrowings, the application of these amendments has had no impact on BDC’s Consolidated Financial Statements.
5.Future accounting changes
As at March 31, 2018 certain new standards, amendments and interpretations to existing standards had been published by the International Accounting Standards Board (IASB) but had not been adopted early by BDC. These standards include IFRS 9, Financial Instruments, IFRS 15, Revenue from Contracts with Customers, and IFRS 16, Leases, described below. Certain other new standards and interpretations have been issued but are not expected to have a material impact on BDC’s Consolidated Financial Statements.
IFRS 9, Financial InstrumentsOn July 24, 2014, the IASB issued the final version of IFRS 9, Financial Instruments, bringing together the classification and measurement, impairment, and hedge accounting phases of the IASB’s project to replace IAS 39, Financial Instruments: Recognition and Measurement and all previous versions of IFRS 9.
IFRS 9 is effective for annual periods beginning on or after January 1, 2018, and shall be applied retrospectively, subject to certain exemptions. For BDC, IFRS 9 is effective for the fiscal year ended March 31, 2019. The transition date is April 1, 2018, and the first publicly available financial statements prepared using IFRS 9 will be the Quarterly Financial Report for the first quarter of fiscal 2019 (quarter ending June 30, 2018). BDC will be applying the exemption, and therefore, will not be restating comparative information. The differences between the carrying amounts of financial assets and liabilities from the adoption of IFRS 9 will be recorded through retained earnings on April 1, 2018.
BDC has performed a preliminary assessment of the financial impact of adopting IFRS 9, which is summarized below.
Classification & MeasurementIFRS 9 replaced the classification and measurement of financial instruments under IAS 39 with a new model that contains only three classification categories: amortized cost, fair value through other comprehensive income (FVOCI), and fair value through profit or loss (FVTPL). Classification under IFRS 9 must reflect the entity’s business model for managing financial assets and their contractual cash flow characteristics. Financial liabilities are classified at amortized cost unless they are designated at FVTPL or classified as liabilities at FVTPL such as derivative liabilities. BDC concluded that these changes will have no impact on the measurement of its financial assets and liabilities at adoption of IFRS 9.
Notes to the Consolidated Financial StatementsFor the year ended March 31, 2018(in thousands of Canadian dollars)
2018 BDC AR > 65

5. Future accounting changes (continued)
IFRS 9, Financial Instruments (continued)
ImpairmentIFRS 9 introduces a new forward-looking expected credit loss (ECL) impairment model, which replaces the previous incurred loss model under IAS 39. BDC estimates that the financial impact of applying the new impairment model at transition date will result in a reversal of approximately $133 million of the allowance for credit losses and a corresponding increase in the opening retained earnings. BDC continues to monitor and refine certain elements of its impairment process in advance of the first quarter of fiscal 2019 reporting.
IFRS 15, Revenue from Contracts with CustomersOn May 28, 2014, the IASB issued a new standard, IFRS 15, Revenue from Contracts with Customers, replacing IAS 18, Revenue. The new standard is effective for annual periods beginning on or after January 1, 2018. The core principle of the standard is that an entity will recognize revenue when it transfers promised goods or services to customers, in an amount that reflects the consideration to which the entity is expected to be entitled in exchange for those goods or services.
BDC has completed its analysis of IFRS 15 and has concluded that its adoption will not have a material impact on the Consolidated Financial Statements.
IFRS 16, LeasesOn January 13, 2016, the IASB issued a new standard, IFRS 16, Leases, which supersedes IAS 17, Leases and related interpretations. The new standard is effective for annual periods beginning on or after January 1, 2019, which for the BDC is April 1, 2019. IFRS 16 sets out the principles for the recognition, measurement, presentation and disclosure of leases for both the lessee and the lessor. The standard provides a single lessee accounting model requiring lessees to recognize assets and liabilities for all leases, unless the lease term is 12 months or less, or if the underlying asset has a low value. Lessors will continue classifying leases as operating or finance, since IFRS 16’s approach to lessor accounting is substantially unchanged from IAS 17.
BDC has completed an initial assessment of IFRS 16 and has elected to apply the following transition reliefs:
> use the practical expedient where BDC is not required to reassess whether a contract is, or contains, a lease at the date of initial application.
> follow the modified retrospective approach under which a lessee does not restate comparative information.
BDC is continuing to assess the impact of the adoption of IFRS 16 but does not expect this new standard to have a significant impact on its Consolidated Financial Statements.
6.Significant accounting judgements, estimates and assumptions
Preparation of the Consolidated Financial Statements as per IFRS requires management to make judgements and use estimates and assumptions that affect the application of accounting policies and the reported amounts of assets, liabilities, income and expenses.
Significant changes in the underlying assumptions could result in significant changes to these estimates. Consequently, management reviews these assumptions regularly. Revisions to accounting estimates are recognized in the period in which the estimates are revised and in any future period affected.
Information about the significant judgements, estimates and assumptions that have the most significant effect on the amounts recognized in the Consolidated Financial Statements are summarized in this note.
Notes to the Consolidated Financial StatementsFor the year ended March 31, 2018(in thousands of Canadian dollars)
2018 BDC AR > 66
6. Significant accounting judgements, estimates and assumptions (continued)
Estimates and assumptions
Allowance for credit lossesThe allowance for credit losses on loans represents management’s estimate of the losses incurred in the loan portfolio at the reporting date and is established at both the individual and collective asset levels.
BDC reviews its loans individually to assess whether an impairment loss should be recorded. The process requires BDC to make assumptions and judgements by carrying out certain activities, including assessing the impaired status and risk of a loan, and estimating future cash flows and collateral values.
Loans that have been assessed individually and found not to be impaired, and all other loans, are then collectively assessed for any impairment that has been incurred but not yet identified. In assessing collective impairment, BDC uses statistical modelling of historical portfolio trends, such as default rates and loss rates, adjusted to reflect management’s judgement as to whether current economic and credit conditions are such that the actual losses are likely to be greater or less than suggested by historical modelling.
Changes in these assumptions, or the use of other reasonable judgements, can materially affect the allowance level. Refer to Note 11—Loans, for more information on the allowance for credit losses.
Fair value of financial instrumentsWhere the fair value of financial assets and financial liabilities recorded in the Consolidated Statement of Financial Position cannot be derived from active markets (i.e., from quoted market prices or dealer price quotations), it is determined using valuation techniques, including discounted cash flow models.
The inputs to these models, such as interest rate yield curves, equity prices and currency prices and yields, volatilities of underlying assumptions, and correlations between inputs, are taken from observable markets, where possible. Where this is not feasible, a degree of judgement is required in establishing fair values.
These judgements include considerations of inputs such as the discount rate, the expected rate of return by level of risk and the weighted forecast of cash flows. Changes to these inputs could affect the reported fair value of financial instruments. Refer to Note 3—Significant Accounting Policies for more information about the valuation techniques used for each type of financial instrument and to Note 7—Classification and Fair Value of Financial Instruments for additional information on fair value hierarchy levels.
Qualifying hedge relationshipsIn designating financial instruments in qualifying hedge relationships, BDC has determined that it expects the hedges to be highly effective over the period of the hedging relationship. In accounting for derivatives as cash flow hedges, BDC has determined that the hedged cash flow exposure relates to highly probable future cash flows.
Net defined benefit asset or liabilityThe cost of defined benefit pension plans and other post-employment benefits, and the present value of the related obligations, are determined using actuarial valuations. The actuarial valuation involves making assumptions about discount rates used to measure the obligations, expected future salary increases, expected retirement age, expected mortality rates, expected health care cost trends, expected inflation and expected future pension increases. Due to the long-term nature of these plans, such estimates are subject to significant uncertainty. Actual results will differ from results that are estimated based on assumptions.
Refer to Note 20—Net Defined Benefit Asset or Liability for additional information about the key assumptions.
Notes to the Consolidated Financial StatementsFor the year ended March 31, 2018(in thousands of Canadian dollars)
2018 BDC AR > 67
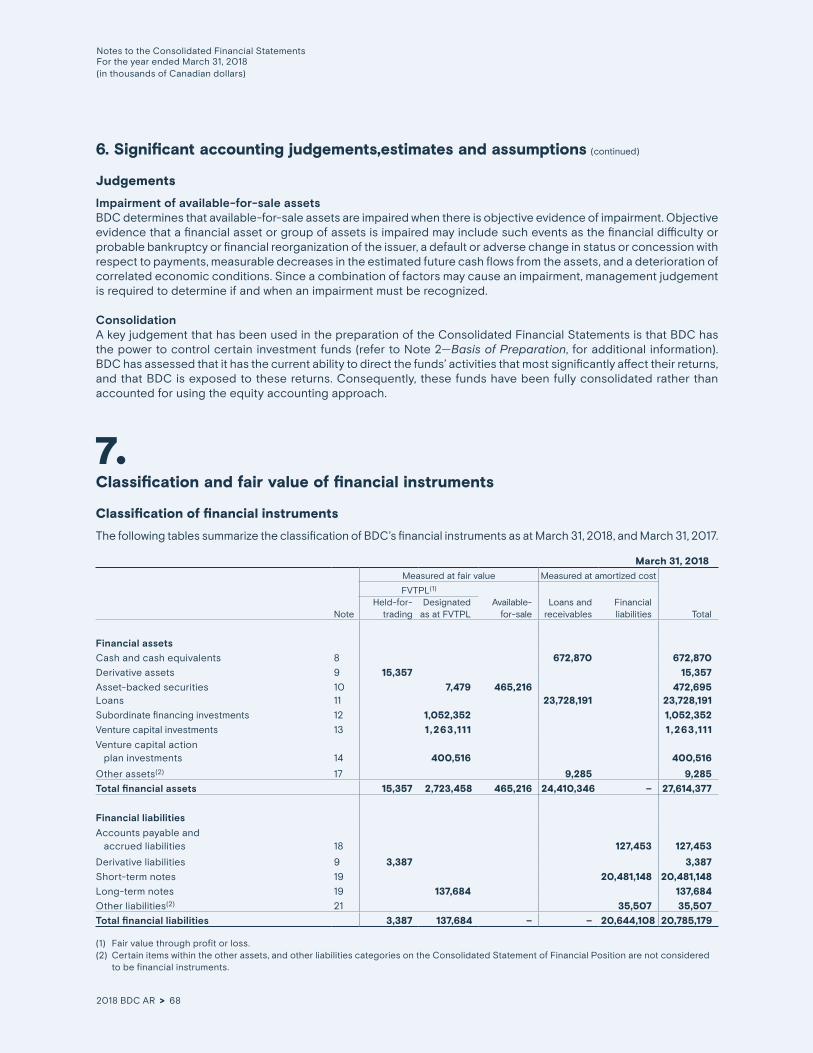
6. Significant accounting judgements,estimates and assumptions (continued)
Judgements
Impairment of available-for-sale assetsBDC determines that available-for-sale assets are impaired when there is objective evidence of impairment. Objective evidence that a financial asset or group of assets is impaired may include such events as the financial difficulty or probable bankruptcy or financial reorganization of the issuer, a default or adverse change in status or concession with respect to payments, measurable decreases in the estimated future cash flows from the assets, and a deterioration of correlated economic conditions. Since a combination of factors may cause an impairment, management judgement is required to determine if and when an impairment must be recognized.
ConsolidationA key judgement that has been used in the preparation of the Consolidated Financial Statements is that BDC has the power to control certain investment funds (refer to Note 2—Basis of Preparation, for additional information). BDC has assessed that it has the current ability to direct the funds’ activities that most significantly affect their returns, and that BDC is exposed to these returns. Consequently, these funds have been fully consolidated rather than accounted for using the equity accounting approach.
7.Classification and fair value of financial instruments
Classification of financial instruments
The following tables summarize the classification of BDC’s financial instruments as at March 31, 2018, and March 31, 2017.
March 31, 2018
Measured at fair value Measured at amortized cost
FVTPL(1)
Note Held-for- trading
Designated as at FVTPL
Available- for-sale
Loans and receivables
Financial liabilities Total
Financial assets
Cash and cash equivalents 8 672,870 672,870
Derivative assets 9 15,357 15,357
Asset-backed securities 10 7,479 465,216 472,695 Loans 11 23,728,191 23,728,191
Subordinate financing investments 12 1,052,352 1,052,352
Venture capital investments 13 1 ,263,111 1 ,263,111
Venture capital action plan investments 14 400,516 400,516
Other assets(2) 17 9,285 9,285
Total financial assets 15,357 2,723,458 465,216 24,410,346 – 27,614,377
Financial liabilities
Accounts payable and accrued liabilities 18 127,453 127,453
Derivative liabilities 9 3,387 3,387
Short-term notes 19 20,481,148 20,481,148
Long-term notes 19 137,684 137,684
Other liabilities(2) 21 35,507 35,507
Total financial liabilities 3,387 137,684 – – 20,644,108 20,785,179
(1) Fair value through profit or loss.(2) Certain items within the other assets, and other liabilities categories on the Consolidated Statement of Financial Position are not considered
to be financial instruments.
Notes to the Consolidated Financial StatementsFor the year ended March 31, 2018(in thousands of Canadian dollars)
2018 BDC AR > 68
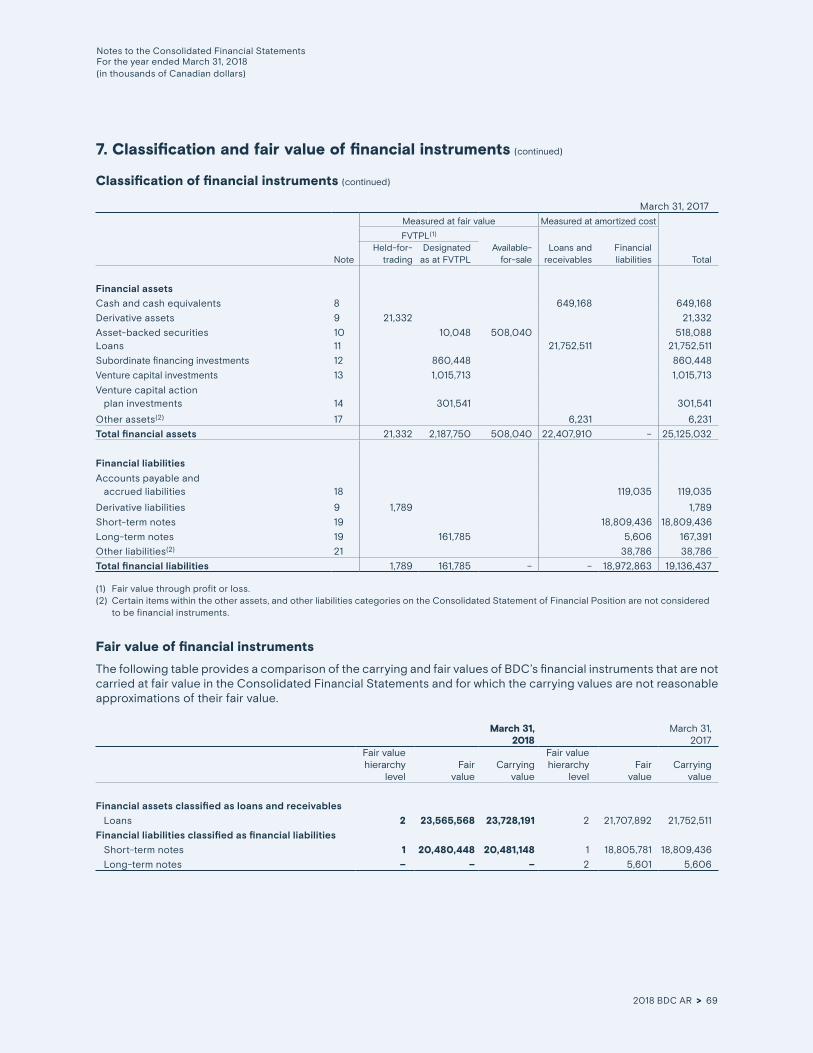
7. Classification and fair value of financial instruments (continued)
Classification of financial instruments (continued)
March 31, 2017
Measured at fair value Measured at amortized cost
FVTPL(1)
Note Held-for- trading
Designated as at FVTPL
Available- for-sale
Loans and receivables
Financial liabilities Total
Financial assets
Cash and cash equivalents 8 649,168 649,168
Derivative assets 9 21,332 21,332
Asset-backed securities 10 10,048 508,040 518,088 Loans 11 21,752,511 21,752,511
Subordinate financing investments 12 860,448 860,448
Venture capital investments 13 1,015,713 1,015,713
Venture capital action plan investments 14 301,541 301,541
Other assets(2) 17 6,231 6,231
Total financial assets 21,332 2,187,750 508,040 22,407,910 – 25,125,032
Financial liabilities
Accounts payable and accrued liabilities 18 119,035 119,035
Derivative liabilities 9 1,789 1,789
Short-term notes 19 18,809,436 18,809,436
Long-term notes 19 161,785 5,606 167,391
Other liabilities(2) 21 38,786 38,786
Total financial liabilities 1,789 161,785 – – 18,972,863 19,136,437
(1) Fair value through profit or loss.(2) Certain items within the other assets, and other liabilities categories on the Consolidated Statement of Financial Position are not considered
to be financial instruments.
Fair value of financial instruments
The following table provides a comparison of the carrying and fair values of BDC’s financial instruments that are not carried at fair value in the Consolidated Financial Statements and for which the carrying values are not reasonable approximations of their fair value.
March 31, 2018
March 31, 2017
Fair value hierarchy
levelFair
valueCarrying
value
Fair value hierarchy
levelFair
valueCarrying
value
Financial assets classified as loans and receivables
Loans 2 23,565,568 23,728,191 2 21,707,892 21,752,511
Financial liabilities classified as financial liabilities
Short-term notes 1 20,480,448 20,481,148 1 18,805,781 18,809,436
Long-term notes – – – 2 5,601 5,606
Notes to the Consolidated Financial StatementsFor the year ended March 31, 2018(in thousands of Canadian dollars)
2018 BDC AR > 69

7. Classification and fair value of financial instruments (continued)
Fair value of financial instruments (continued)
Financial instruments carried at amortized cost Loans classified as loans and receivablesThe carrying value of performing floating-rate loans is a reasonable approximation of their fair value because the carrying value reflects changes in interest rates since the loan was originated. For performing fixed-rate loans, fair value is determined using a discounted cash flow calculation that uses market interest rates prevailing at the end of the period charged for similar new loans with corresponding remaining terms.
For impaired loans, the fair value is equal to the carrying value determined in accordance with the valuation methods described in Note 3—Significant Accounting Policies, under the heading Allowance for credit losses.
Short-term notes classified as financial liabilitiesThe fair value of short-term notes classified as financial liabilities is determined using a quoted market price.
Long-term notes classified as financial liabilitiesThe fair value of long-term notes classified as financial liabilities is determined using a discount cash flow calculation that uses market interest rates based on the remaining time to maturity.
Financial instruments measured at fair valueThe assumptions and methods used to estimate the fair value of those financial assets and liabilities that are measured at fair value are disclosed in Note 3—Significant Accounting Policies.
All financial instruments measured at fair value must be categorized into one of three hierarchy levels for disclosure purposes. Each level is based on the observability of the inputs used to measure the fair value of assets and liabilities, and is defined below:
> level 1—fair values based on quoted prices (unadjusted) observed in active markets for identical assets or liabilities;
> level 2—fair values based on inputs other than quoted prices in active markets that are either directly or indirectly observable; and
> level 3—fair values based on valuation techniques with one or more significant unobservable market inputs.
There have been no transfers between levels 1 and 2 or between levels 2 and 3 in the reporting periods. BDC’s policy is to recognize transfers between levels 1 and 3 when private investments become publicly traded or public investments become private investments during the reporting periods.
Notes to the Consolidated Financial StatementsFor the year ended March 31, 2018(in thousands of Canadian dollars)
2018 BDC AR > 70

7. Classification and fair value of financial instruments (continued)
Fair value of financial instruments (continued)
Financial instruments measured at fair value (continued)
The following tables present financial instruments carried at fair value categorized by hierarchy levels.
March 31, 2018
Fair value measurements using Total fair valueLevel 1 Level 2 Level 3
Assets
Derivative assets 15,357 15,357
Asset-backed securities 472,695 472,695
Subordinate financing investments 1,900 1,050,452 1,052,352
Venture capital investments 149,850 1 ,113 , 261 1 ,263,111
Venture capital action plan investments 400,516 400,516
151,750 488,052 2,564,229 3,204,031
Liabilities
Derivative liabilities 3,387 3,387
Long-term notes designated as at fair value through profit or loss 137,684 137,684
– 141,071 – 141,071
March 31, 2017
Fair value measurements using Total fair valueLevel 1 Level 2 Level 3
Assets
Derivative assets 21,332 21,332
Asset-backed securities 518,088 518,088
Subordinate financing investments 1,405 859,043 860,448
Venture capital investments 13,475 1,002,238 1,015,713
Venture capital action plan investments 301,541 301,541
14,880 539,420 2,162,822 2,717,122
Liabilities
Derivative liabilities 1,789 1,789
Long-term notes designated as at fair value through profit or loss 161,785 161,785
– 163,574 – 163,574
Notes to the Consolidated Financial StatementsFor the year ended March 31, 2018(in thousands of Canadian dollars)
2018 BDC AR > 71

7. Classification and fair value of financial instruments (continued)
Fair value of financial instruments (continued)
Financial instruments measured at fair value (continued)
The following tables present the changes in fair value measurement for financial instruments included in level 3 of the fair value hierarchy.
The procedures and valuation techniques used to determine the fair values of subordinate financing, venture capital and venture capital action plan investments included in level 3 are described in Note 3—Significant Accounting Policies. These valuation techniques draw upon diverse unobservable inputs, none of which, with the exception of the risk-free interest rate, is individually significant enough to have a material impact on BDC’s net earnings if it varied within reasonable possible ranges. For subordinate financing investments, the impact of a 1% variation in the risk-free rate would result in a gain or loss of $9.3 million in the current period and an equivalent change in retained earnings ($9.1 million in 2017). Venture capital and venture capital action plan investments are not risk-free rate sensitive.
March 31, 2018
Subordinate financing
investments
Venture capital
investments
Venture capital
action planinvestments Total
Fair value as at April 1, 2017 859,043 1,002,238 301,541 2,162,822
Net realized gains (losses) on investments 3,472 (23,909) – (20,437)
Net change in unrealized appreciation (depreciation) of investments 1,409 198,906 26,988 227,303
Net unrealized foreign exchange gains (losses) on investments – (16,992) (102) (17,094)
Disbursements for investments 401,332 171,487 74,585 647,404
Repayments of investments and other (211,582) (121,766) (2,496) (335,844)
Transfers from level 3 to level 1 (3,222) (96,703) – (99,925)
Fair value as at March 31, 2018 1,050,452 1,113,261 400,516 2,564,229
March 31, 2017
Subordinate financing
investments
Venture capital
investments
Venture capital
action planinvestments Total
Fair value as at April 1, 2016 750,580 916,095 137,668 1,804,343
Net realized gains (losses) on investments 1,839 2,796 – 4,635
Net change in unrealized appreciation (depreciation) of investments (18,400) 13,699 10,532 5,831
Net unrealized foreign exchange gains (losses) on investments – 10,864 66 10,930
Disbursements for investments 286,486 180,719 157,794 624,999
Repayments of investments and other (161,462) (116,027) (4,519) (282,008)
Transfers from level 3 to level 1 – (5,908) – (5,908)
Fair value as at March 31, 2017 859,043 1,002,238 301,541 2,162,822
Notes to the Consolidated Financial StatementsFor the year ended March 31, 2018(in thousands of Canadian dollars)
2018 BDC AR > 72

7. Classification and fair value of financial instruments (continued)
Fair value of financial instruments (continued)
Financial instruments measured at fair value (continued)
The following table presents total gains or losses for financial instruments included in level 3 that can be attributable to assets held at the end of the reporting periods.
2018 2017
Net realized gains (losses) on investments 15,239 (6,404)
Net change in unrealized appreciation (depreciation) of investments 160,354 4,101
Net unrealized foreign exchange gains (losses) on investments (16,258) 10,781
Total gains (losses) related to level 3 assets still held at the end of the reporting period 159,335 8,478
8.Cash and cash equivalents
As at March 31, 2018, and March 31, 2017, there are no restrictions on cash and cash equivalents. Cash and cash equivalents include the following components.
March 31, 2018 March 31, 2017
Cash 25,348 –
Short-term bank notes 647,522 649,168
Cash and cash equivalents 672,870 649,168
Notes to the Consolidated Financial StatementsFor the year ended March 31, 2018(in thousands of Canadian dollars)
2018 BDC AR > 73
9.Derivative financial instruments
In compliance with BDC’s treasury risk policy, BDC uses the following derivative financial instruments to mitigate its foreign exchange rate risk, as well as its interest rate risk. BDC’s policy is not to use derivative financial instruments for speculative purposes. BDC enters into master netting agreements with counterparties but does not proceed with netting financial assets and liabilities.
Swaps
Swaps are contractual obligations to exchange a series of cash flows on a specific notional amount for a predetermined period. The various swap agreements that BDC enters into are as follows:
> interest rate swaps, which involve exchange of fixed- and floating-rate interest payments; and
> cross-currency interest rate swaps, which involve the exchange of both interest and notional amounts in two different currencies.
The main risk associated with these instruments is related to movements in interest rates and foreign currencies.
Forwards
Forwards are contractual agreements to either buy or sell currencies or financial instruments at specified prices and dates in the future. They are customized contracts transacted in the over-the-counter market.
The main risks associated with these instruments arise from the possible inability of over-the-counter counterparties to meet the terms of the contracts, and from movements in interest rates and foreign exchange rates.
Foreign exchange rateBDC economically hedges its long-term borrowings with cross-currency interest rate swaps, and its loans and subordinate financing investments with foreign exchange forward contracts. Venture capital investments are economically hedged following the occurrence of a liquidity event. These instruments have been classified as held-for-trading.
Notes to the Consolidated Financial StatementsFor the year ended March 31, 2018(in thousands of Canadian dollars)
2018 BDC AR > 74

9. Derivative financial instruments (continued)
Forwards (continued)
Interest rate BDC enters into interest rate swaps to hedge the financial impact of future interest rate fluctuations in relation to changes in the loan portfolio mix. These contracts have been designated as cash flow hedges. BDC elected to de-designate the hedging instruments effective on the last day of the fiscal year.
BDC also uses derivative financial instruments as an economic hedge for its structured notes. These instruments include interest rate swaps and cross-currency interest rate swaps. These instruments have been classified as held-for-trading.
The following tables provide the fair value of BDC’s derivatives portfolio as represented by gross assets and gross liabilities values.
March 31, 2018
Gross assets Gross liabilities Net amount
Held-for-trading
Interest rate swap contracts 13,980 2,349 11,631
Cross-currency interest rate swap contracts 630 – 630
Foreign exchange forward contracts 747 1,038 (291)
Total held-for-trading 15,357 3,387 11,970
March 31, 2017
Gross assets Gross liabilities Net amount
Held-for-trading
Interest rate swap contracts 18,765 1,709 17,056
Cross-currency interest rate swap contracts 1,997 – 1,997
Foreign exchange forward contracts 570 80 490
Total held-for-trading 21,332 1,789 19,543
Notes to the Consolidated Financial StatementsFor the year ended March 31, 2018(in thousands of Canadian dollars)
2018 BDC AR > 75
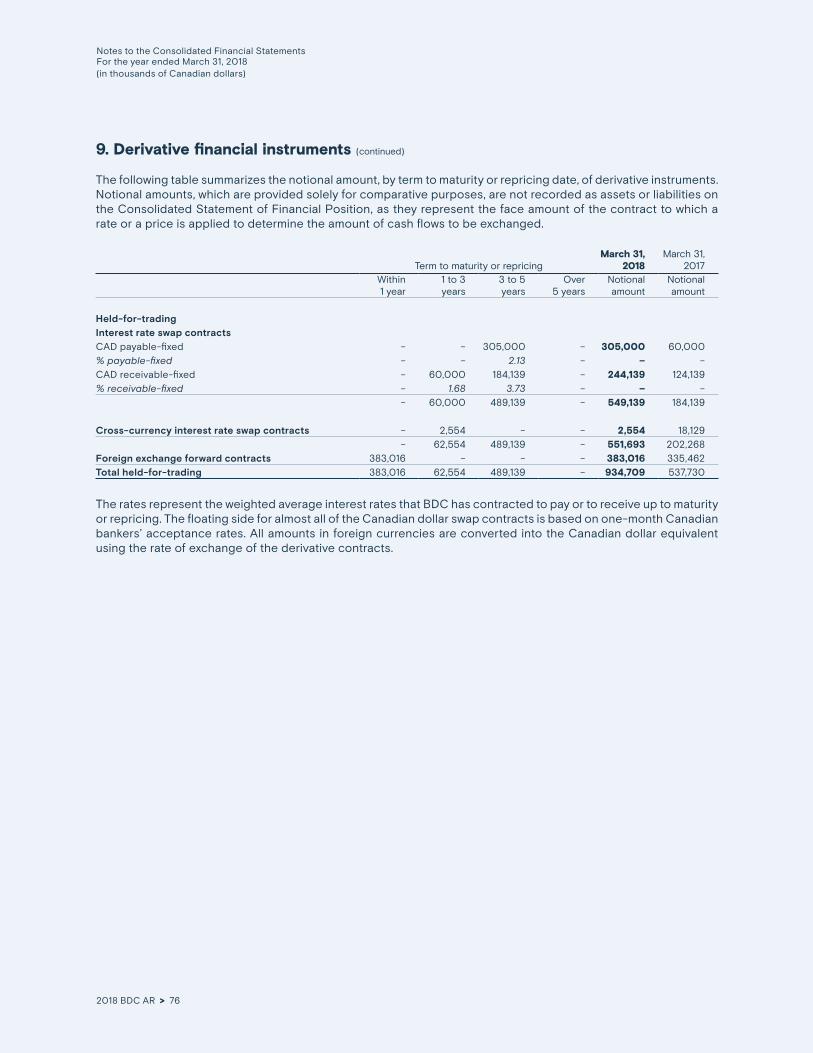
9. Derivative financial instruments (continued)
The following table summarizes the notional amount, by term to maturity or repricing date, of derivative instruments. Notional amounts, which are provided solely for comparative purposes, are not recorded as assets or liabilities on the Consolidated Statement of Financial Position, as they represent the face amount of the contract to which a rate or a price is applied to determine the amount of cash flows to be exchanged.
Term to maturity or repricing March 31, 2018
March 31, 2017
Within1 year
1 to 3years
3 to 5years
Over 5 years
Notionalamount
Notionalamount
Held-for-tradingInterest rate swap contractsCAD payable-fixed – – 305,000 – 305,000 60,000 % payable-fixed – – 2.13 – – –CAD receivable-fixed – 60,000 184,139 – 244,139 124,139 % receivable-fixed – 1.68 3.73 – – –
– 60,000 489,139 – 549,139 184,139
Cross-currency interest rate swap contracts – 2,554 – – 2,554 18,129 – 62,554 489,139 – 551,693 202,268
Foreign exchange forward contracts 383,016 – – – 383,016 335,462 Total held-for-trading 383,016 62,554 489,139 – 934,709 537,730
The rates represent the weighted average interest rates that BDC has contracted to pay or to receive up to maturity or repricing. The floating side for almost all of the Canadian dollar swap contracts is based on one-month Canadian bankers’ acceptance rates. All amounts in foreign currencies are converted into the Canadian dollar equivalent using the rate of exchange of the derivative contracts.
Notes to the Consolidated Financial StatementsFor the year ended March 31, 2018(in thousands of Canadian dollars)
2018 BDC AR > 76

10.Asset-backed securities
The following table summarizes asset-backed securities by classification of financial instruments. As at March 31, 2018, $17,473 in asset-backed securities had maturities of less than five years ($53,101 as at March 31, 2017) and $455,222 had maturities over five years ($464,987 as at March 31, 2017). The asset-backed securities may be redeemed by the issuing trust at par, depending on the terms of the securitization deal, if the balance of the underlying assets or, in some cases, the balance of the notes, amortizes below 10% of the original balance at issuance. No asset-backed securities were impaired as at March 31, 2018, and March 31, 2017. Refer to Note 24—Risk Management, for additional information on credit risk associated with the asset-backed securities portfolio.
March 31, 2018 March 31, 2017
Available-for-sale
Principal amount 469,492 508,751
Cumulative fair value appreciation (depreciation) (4,276) (711)
Carrying value 465,216 508,040
Yield 2.19% 1.86%
Fair value through profit or loss
Principal amount 7,543 10,010
Cumulative fair value appreciation (depreciation) (64) 38
Carrying value 7,479 10,048
Yield 7.79% 6.94%
Asset-backed securities 472,695 518,088
11.Loans
The following tables summarize loans outstanding by contractual maturity date.
2018 Within 1 year
1 to 5 years
Over 5 years
Total gross amount
Collective allowance
Individual allowance
Total allowance
Total net amount
Performing 278,952 2,817,245 20,566,062 23,662,259 (411,000) – (411,000) 23,251,259 Impaired 23,534 118,748 628,290 770,572 – (293,640) (293,640) 476,932 Loans as at March 31, 2018 302,486 2,935,993 21,194,352 24,432,831 (411,000) (293,640) (704,640) 23,728,191
2017 Within 1 year
1 to 5 years
Over 5 years
Total gross amount
Collective allowance
Individual allowance
Total allowance
Total net amount
Performing 203,598 2,581,400 18,946,099 21,731,097 (396,000) – (396,000) 21,335,097 Impaired 23,222 143,872 551,202 718,296 – (300,882) (300,882) 417,414 Loans as at March 31, 2017 226,820 2,725,272 19,497,301 22,449,393 (396,000) (300,882) (696,882) 21,752,511
Notes to the Consolidated Financial StatementsFor the year ended March 31, 2018(in thousands of Canadian dollars)
2018 BDC AR > 77

11. Loans (continued)
Impaired loans March 31, 2018 March 31, 2017
Impaired at beginning of year 718,296 554,653
Downgraded 538,897 544,613
Upgraded (100,045) (78,620)
Write-offs (138,241) (85,655)
Liquidation and other (248,335) (216,695)
Balance at end of year 770,572 718,296
Allowance for credit lossesMarch 31, 2018 March 31, 2017
Balance at beginning of year 696,882 605,724
Write-offs (138,241) (85,655)
Effect of discounting (16,363) (14,948)
Recoveries and other 8,823 12,216
551,101 517,337
Provision for credit losses 153,539 179,545
Balance at end of year 704,640 696,882
Credit risk
The principal collaterals pledged as security if a loan defaults and other credit enhancements for loans include (i) various security on assets; (ii) personal and corporate guarantees; (iii) letters of credit; (iv) assignments of life insurance; (v) assignments or hypothec of third-party loans; and (vi) assignments of lease.
As at March 31, 2018, $47.8 million ($32.8 million as at March 31, 2017) of the impaired loans was secured by assets that BDC had the power to sell in order to satisfy borrower commitments. BDC’s policy is to have these assets sold when other avenues of resolution have been exhausted.
The following table summarizes performing loans outstanding by client credit risk exposure based on BDC classification.
BDC rating Grade equivalent March 31, 2018 March 31, 2017
0.5 to 1.0 Investment grade 1,572,039 7% 1,438,371 7%
1.5 to 2.0 Non-investment grade 6,751,730 28% 5,687,648 26%
2.5 to 4.0 12,079,957 51% 10,961,110 50%
4.5 to 5.0 2,404,276 10% 2,819,576 13%
5.5 Watchlist 854,257 4% 824,392 4%
Performing loans outstanding 23,662,259 100% 21,731,097 100%
The following table summarizes performing loans outstanding, classified by secured risk exposure coverage.
Secured risk exposure March 31, 2018 March 31, 2017
Secured financing(1) 17,830,613 75% 16,615,622 76%
Partially secured financing(2) 2,253,841 10% 2,058,817 10%
Leverage financing(3) 3,577,805 15% 3,056,658 14%
Performing loans outstanding 23,662,259 100% 21,731,097 100%
(1) % of security shorfall at authorization is less than 30%.(2) % of security shorfall at authorization is between 31% and 60%.(3) % of security shorfall at authorization is over 60%.
Notes to the Consolidated Financial StatementsFor the year ended March 31, 2018(in thousands of Canadian dollars)
2018 BDC AR > 78

11. Loans (continued)
Credit risk (continued)
BDC considers a loan past due when a client has not made a payment by the contractual due date. The following table presents the carrying value of loans that are past due but not classified as impaired because they are either less than three months past due or collection efforts are reasonably expected to result in repayment.
Loans past due but not impaired Within 1 month
1 to 3 months
Over 3 months Total
As at March 31, 2018 131,943 36,732 6,599 175,274 As at March 31, 2017 129,856 36,303 9,541 175,700
Concentrations of the total loans outstanding, by province and territory and by industry sector, are set out in the tables below. The largest concentration in one individual or closely related group of clients was less than 1% as at March 31, 2018, and March 31, 2017.
Geographic distribution March 31, 2018
March 31, 2017
Newfoundland and Labrador 877,891 889,754
Prince Edward Island 70,651 60,087
Nova Scotia 562,650 547,775
New Brunswick 494,334 446,742
Quebec 7,658,985 7,040,483
Ontario 6,689,723 5,979,102
Manitoba 726,386 689,135
Saskatchewan 800,563 767,651
Alberta 3,545,959 3,381,974
British Columbia 2,855,772 2,515,417
Yukon 108,548 100,326
Northwest Territories and Nunavut 41,369 30,947
Total loans outstanding 24,432,831 22,449,393
Industry sector March 31, 2018
March 31, 2017
Manufacturing 5,611,342 5,178,805
Wholesale and retail trade 4,579,060 4,314,423
Service industries 3,438,475 3,073,195
Tourism 3,046,763 2,772,742
Commercial properties 2,674,608 2,345,410
Construction 1,903,043 1,888,205
Transportation and storage 1,386,700 1,257,632
Resources 1,018,978 918,982
Other 773,862 699,999
Total loans outstanding 24,432,831 22,449,393
Notes to the Consolidated Financial StatementsFor the year ended March 31, 2018(in thousands of Canadian dollars)
2018 BDC AR > 79

12.Subordinate financing investments
BDC maintains a medium- to high-risk portfolio of subordinate financing investments. The following table summarizes outstanding subordinate financing investments by their contractual maturity date.
Within 1 year
1 to 5 years
Over 5 years
Total cost
Total fair value
As at March 31, 2018 94,090 717,299 278,101 1,089,490 1,052,352 As at March 31, 2017 83,498 664,213 145,202 892,913 860,448
Subordinate financing investments have subordinate status in relationship to the other debt issued by a company. The principal collaterals pledged as security and other credit enhancements related to subordinate financing investments include (i) various security on assets; (ii) personal and corporate guarantees; (iii) assignments of life insurance; and (iv) postponements of third-party loans. When possible, BDC security also includes a first-rank lien on the intellectual property of the borrower.
The concentrations of subordinate financing investments, by geographic and industry distribution, are set out in the tables below. The largest concentration in one individual or closely related group of clients as at March 31, 2018, was 2.1% of total subordinate financing investments at cost (2.2% as at March 31, 2017). Subordinate financing’s portfolio is composed primarily of debentures.
March 31, 2018
March 31, 2017
Geographic distribution Fair value Cost Fair value Cost
Newfoundland and Labrador 5,439 10,694 5,710 6,730
Nova Scotia 13,227 16,260 18,154 19,695
New Brunswick 23,353 22,122 30,421 27,630
Quebec 413,215 422,895 323,096 341,323
Ontario 356,729 362,113 310,532 310,909
Manitoba 7,382 5,864 7,195 5,856
Saskatchewan 46,111 48,557 18,091 18,181
Alberta 103,504 117,849 96,892 112,265
British Columbia 78,181 77,941 46,089 46,009
Yukon 542 565 3,264 3,210
Northwest Territories and Nunavut 4,669 4,630 1,004 1,105
Subordinate financing investments 1,052,352 1,089,490 860,448 892,913
March 31, 2018
March 31, 2017
Industry sector Fair value Cost Fair value Cost
Manufacturing 316,080 329,636 267,839 280,376
Service industries 283,565 291,641 218,745 228,135
Wholesale and retail trade 203,862 212,427 156,008 158,579
Construction 66,390 65,418 63,388 60,859
Information industries 58,201 58,124 34,749 35,060
Resources 49,906 69,166 62,298 75,313
Transportation and storage 26,298 30,454 14,076 14,404
Tourism 8,562 8,867 9,589 9,981
Educational services 8,307 8,157 10,133 10,076
Other 31,181 15,600 23,623 20,130
Subordinate financing investments 1,052,352 1,089,490 860,448 892,913
Notes to the Consolidated Financial StatementsFor the year ended March 31, 2018(in thousands of Canadian dollars)
2018 BDC AR > 80

13.Venture capital investments
BDC maintains a high-risk portfolio of venture capital investments that is focused on early-stage and fast-growing technology companies having promising positions in their respective marketplaces and strong growth potential. Venture capital investments, which are held for a longer term, are non-current assets.
The following table presents a summary of the venture capital portfolio, by type of investment.
March 31, 2018
March 31, 2017
Investment type Fair value Cost Fair value Cost
Common shares 186,542 124,814 53,814 84,690
Preferred shares 506,281 384,751 523,231 452,858
Debentures 33,404 34,738 27,028 34,905
Total direct investments 726,227 544,303 604,073 572,453
Funds(1) 536,884 378,549 411,640 312,450
Venture capital investments 1 ,263,111 922,852 1,015,713 884,903
(1) As at March 31, 2018, BDC has invested in 70 funds (64 funds as at March 31, 2017).
The concentrations by industry sector for direct investments are listed below. The largest single investment within these sectors as at March 31, 2018, was 6.35% of total venture capital direct investments at cost (5.68% as at March 31, 2017).
March 31, 2018
March 31, 2017
Industry sector Fair value Cost Fair value Cost
Information technology 303,064 232,627 253,274 218,443
Biotechnology and pharmacology 174,424 85,288 159,309 129,523
Industrial 57,747 15,197 15,755 16,783
Electronics 54,064 56,141 63,289 79,060
Communications 47,867 51,565 53,710 51,891
Energy 33,258 35,394 11,668 9,762
Medical and health 28,810 53,883 25,001 51,407
Other 26,993 14,208 22,067 15,584
Total direct investments 726,227 544,303 604,073 572,453
14.Venture capital action plan investments
Venture Capital Action Plan is a federal government initiative to invest $400 million to increase private sector venture capital financing for high-potential, innovative Canadian businesses.
Venture Capital Action Plan invests primarily in early-stage and mid-stage venture capital funds across Canada. Venture Capital Action Plan supports the creation of large private sector-led funds of funds and also assists existing high-performing funds in partnership with institutional investors, corporate strategic investors and interested provinces.
As at March 31, 2018, the fair value of venture capital action plan investments stood at $400,516 ($301,541 as at March 31, 2017), and their cost was $363,269 ($291,180 as at March 31, 2017).
Notes to the Consolidated Financial StatementsFor the year ended March 31, 2018(in thousands of Canadian dollars)
2018 BDC AR > 81

15.Property and equipment
2018 Computer and telecommunications equipment
Furniture, fixtures and equipment
Leasehold improvements Total
Cost
Balance as at March 31, 2017 13,502 17,891 28,821 60,214
Additions 8,112 8,270 13,385 29,767
Derecognition(1) (764) (3,075) (6,880) (10,719)
Balance as at March 31, 2018 20,850 23,086 35,326 79,262
Accumulated depreciation
Balance as at March 31, 2017 7,529 8,228 15,354 31,111
Depreciation 2,424 1,807 2,591 6,822
Derecognition(1) (772) (2,538) (6,658) (9,968)
Balance as at March 31, 2018 9,181 7,497 11,287 27,965
Property and equipment as at March 31, 2018 11,669 15,589 24,039 51,297
(1) Derecognition of $10.7 million relates to property and equipment that are no longer in use.
2017 Computer and telecommunications equipment
Furniture, fixtures and equipment
Leasehold improvements Total
Cost
Balance as at March 31, 2016 17,527 19,268 31,186 67,981
Additions 3,141 2,338 6,657 12,136
Derecognition(2) (7,166) (3,715) (9,022) (19,903)
Balance as at March 31, 2017 13,502 17,891 28,821 60,214
Accumulated depreciation
Balance as at March 31, 2016 12,566 10,385 22,181 45,132
Depreciation 2,129 1,543 2,164 5,836
Derecognition(2) (7,166) (3,700) (8,991) (19,857)
Balance as at March 31, 2017 7,529 8,228 15,354 31,111
Property and equipment as at March 31, 2017 5,973 9,663 13,467 29,103
(2) Derecognition of $19.9 million relates to property and equipment that are no longer in use.
No property and equipment was impaired as at March 31, 2018 and 2017.
Notes to the Consolidated Financial StatementsFor the year ended March 31, 2018(in thousands of Canadian dollars)
2018 BDC AR > 82
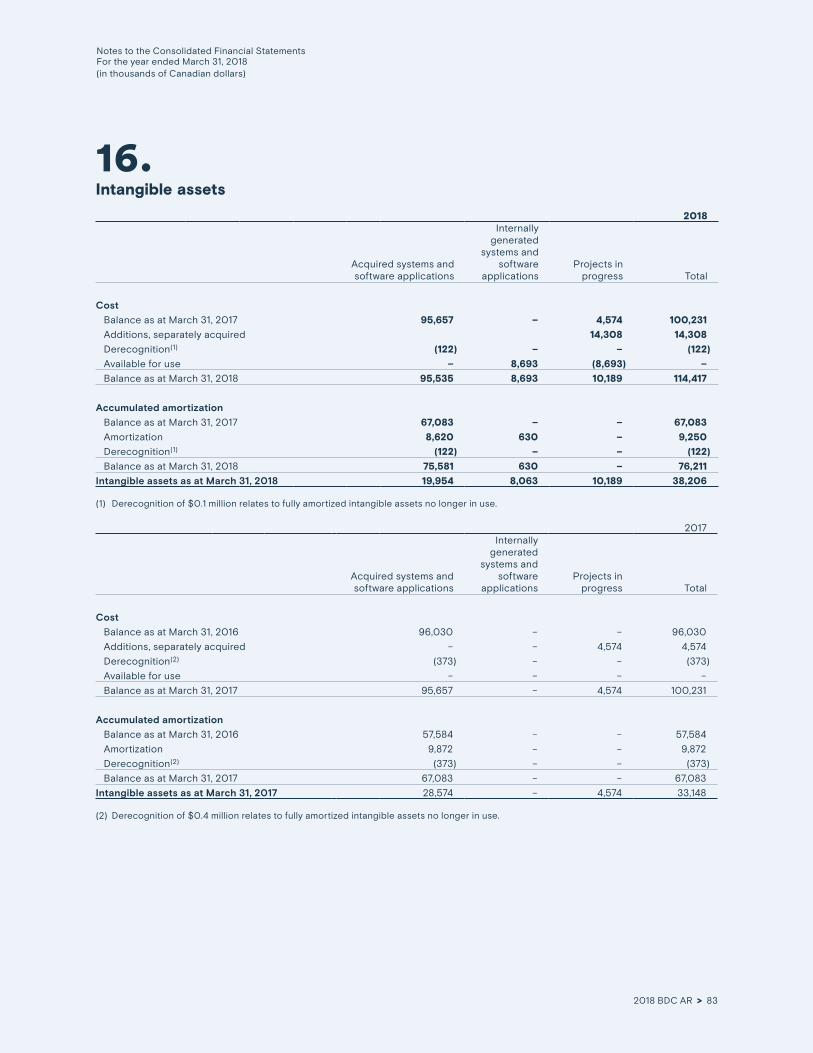
16.Intangible assets
2018
Acquired systems and software applications
Internally generated
systems and software
applicationsProjects in
progress Total
Cost
Balance as at March 31, 2017 95,657 – 4,574 100,231
Additions, separately acquired 14,308 14,308
Derecognition(1) (122) – – (122)
Available for use – 8,693 (8,693) –
Balance as at March 31, 2018 95,535 8,693 10,189 114,417
Accumulated amortization
Balance as at March 31, 2017 67,083 – – 67,083
Amortization 8,620 630 – 9,250
Derecognition(1) (122) – – (122)
Balance as at March 31, 2018 75,581 630 – 76,211
Intangible assets as at March 31, 2018 19,954 8,063 10,189 38,206
(1) Derecognition of $0.1 million relates to fully amortized intangible assets no longer in use.
2017
Acquired systems and software applications
Internally generated
systems and software
applicationsProjects in
progress Total
Cost
Balance as at March 31, 2016 96,030 – – 96,030
Additions, separately acquired – – 4,574 4,574
Derecognition(2) (373) – – (373)
Available for use – – – –
Balance as at March 31, 2017 95,657 – 4,574 100,231
Accumulated amortization
Balance as at March 31, 2016 57,584 – – 57,584
Amortization 9,872 – – 9,872
Derecognition(2) (373) – – (373)
Balance as at March 31, 2017 67,083 – – 67,083
Intangible assets as at March 31, 2017 28,574 – 4,574 33,148
(2) Derecognition of $0.4 million relates to fully amortized intangible assets no longer in use.
Notes to the Consolidated Financial StatementsFor the year ended March 31, 2018(in thousands of Canadian dollars)
2018 BDC AR > 83

17.Other assets
March 31, 2018 March 31, 2017
Financial instruments
Interest receivable on derivatives 1,257 967
Accounts receivable from consulting clients 1,990 1,375
Other 6,038 3,889
9,285 6,231
Prepaids 9,983 8,384
Other assets 19,268 14,615
18.Accounts payable and accrued liabilities
March 31, 2018 March 31, 2017
Current
Salaries and benefits payable 59,788 56,552
Accounts payable 5,483 6,067
Other 23,033 19,085
88,304 81,704
Long-term accrued liabilities 39,149 37,331
Accounts payable and accrued liabilities 127,453 119,035
19.Borrowings
The table below presents the outstanding short-term notes.
March 31, 2018
March 31, 2017
Maturity date Effective rate CurrencyPrincipal
amountCarrying
valuePrincipal
amountCarrying
value
Short-term notes
2018 0.38% - 0.45% CAD 18,805,000 18,808,311
0.70% USD 844 1,125
2019 1.05% - 1.10% CAD 20,470,000 20,480,059
1.55% USD 844 1,089
Total short-term notes 20,481,148 18,809,436
(1) The principal amount is presented in the original currency.
(1) (1)
Notes to the Consolidated Financial StatementsFor the year ended March 31, 2018(in thousands of Canadian dollars)
2018 BDC AR > 84

19. Borrowings (continued)
The table below presents the outstanding long-term notes by maturity. Some long-term notes may be redeemable. As at March 31, 2018, no long-term notes were redeemable prior to maturity ($4,856 as at March 31, 2017).
March 31, 2018
March 31, 2017
Maturity date2018
Effective rate2017
Effective rate CurrencyPrincipal
amountCarrying
valuePrincipal
amountCarrying
value
Long-term notes/ financial liabilities
2018 0.55% CAD 5,600 5,606
5,606 Long-term notes/ designated as at fair value through profit or loss
2018 0.65% JPY 1,000,000 12,322
2021 1.35% 0.63% - 0.64% JPY 260,000 3,171 660,000 7,963
2022 1.27% - 1.37% 0.53% - 3.98% CAD 124,139 134,513 124,139 141,500
137,684 161,785
Total long-term notes 137,684 167,391
(1) The effective rates on long-term notes are established after giving effect to swap contracts, when applicable, and refer to yield to maturity for fixed-rate issues and yield to reset for floating-rate issues.
(2) The principal amount is presented in the original currency.
The total carrying value of the long-term notes designated as at fair value through profit or loss as at March 31, 2018, was $10,991 higher than the total principal amount due at maturity, given respective exchange rates (as at March 31, 2017, it was $19,517 higher).
The table below presents the long-term notes by type.
March 31, 2018 March 31, 2017
Interest-bearing notes 134,513 147,106
Notes linked to currency rates – 12,322
Other structured notes 3,171 7,963
Total long-term notes 137,684 167,391
The following table present the cash flows and non-cash changes for borrowings.
Balance atbeginningof period
Cash flows Non-cash changesBalance at
end ofperiodIssuances Repayments
Fair valuechanges
Accrued interests
Changesin foreign
exchange rate
2018
Other financial liabilities
Short-term notes 18,809,436 26,175,000 (24,510,000) – 6,748 (36) 20,481,148
Long-term notes 5,606 – (5,600) – (6) – –
18,815,042 26,175,000 (24,515,600) – 6,742 (36) 20,481,148 Designated at fair value through profit or loss
Long-term notes 161,785 – (15,575) (1,125) (689) (6,712) 137,684
18,976,827 26,175,000 (24,531,175) (1,125) 6,053 (6,748) 20,618,832
(1) (1) (2) (2)
Notes to the Consolidated Financial StatementsFor the year ended March 31, 2018(in thousands of Canadian dollars)
2018 BDC AR > 85

20.Net defined benefit asset or liability
BDC offers defined benefit plans that provide pension and other post-employment benefits to eligible employees. The defined benefit pension plans provide benefits based on years of service and average earnings at retirement, fully or partially indexed to the Consumer Price Index, depending on the option chosen by eligible employees hired before January 1, 2015, and partially indexed to the Consumer Price Index for employees hired after December 31, 2014. Other post-employment benefit plans include health, dental, critical illness and life insurance coverage, as well as a retirement allowance program for a closed group of employees who meet certain conditions.
These defined benefit plans expose BDC to actuarial risks, such as longevity risk, interest rate risk, inflation risk and market (investment) risk. The interest rate risk arises because, each year, the present value of the defined benefit obligation is calculated using a discount rate determined by reference to current market yields of high-quality corporate and provincial bonds, which may vary in the future. A decrease in the bond interest rate will increase the plan liability; however, this will be partially offset by an increase in the return on the plan’s debt investments. The investment risk arises because the actual return on the plan assets may not be sufficient to fulfill future obligations. The longevity risk arises because the present value of the obligation is calculated using projected cash flows based on a life expectancy table reflecting current expectations, which may change over time, and the inflation risk arises because the actual inflation rate in a given year may be different than the rate used for estimation purposes. For each of these risks, an unfavourable variance in any given year will result in an increase in the present value of the obligation and, ultimately, in higher costs. The risk that such unfavourable variances might arise is considered by the actuaries and management when reviewing the inputs to the annual actuarial valuation report.
BDC is the legal administrator of these plans and has implemented a governance structure, as follows:
> The Management Pension Funds Investment Committee (MPFIC) of BDC is established to act in an advisory capacity to the Human Resources Committee of the Board (HR Committee) on the funds’ investment strategies and to manage the funds according to the statements of investment policies. The MPFIC reports to the HR Committee and is chaired by the Treasurer.
> The HR Committee is responsible for design, funding, administration, communications and compliance related to the plans, as well as for overseeing—in conjunction with a pensioner, acting as an observer—all activities related to the investments of the funds of the Pension Plan for Employees of the Business Development Bank of Canada (registered pension plan) and BDC’s supplemental pension plans (jointly referred to as the fund). The HR Committee reports directly to the board, comprises board members and is supported by BDC’s MPFIC.
> The board is responsible for overall monitoring of the plans and the fund, and for approving recommendations from the HR Committee.
The registered pension plan is governed according to applicable federal legislation, such as the Pension Benefits Standards Act and the Income Tax Act. The plan is under the jurisdiction of the Office of the Superintendent of Financial Institutions. Participants contribute a fixed percentage of their earnings to the plan, while BDC contributes the amount needed to maintain adequate funding, as dictated by the prevailing regulations. BDC may be required to take measures to offset any funding and solvency deficit by increasing its contributions. In addition, BDC pays the entire cost of the supplemental pension plans. The HR Committee is responsible for the investment and funding policies related to the registered and supplemental pension plans.
The registered pension plan is either partly or wholly funded in accordance with actuarially determined amounts required to satisfy employee benefit entitlements. Benefits accruing to members of the contributory component of the registered pension plan are also funded by contributions by plan participants. BDC’s best estimate of contributions to be paid for fiscal 2019 for the registered pension plan is $25.9 million. The supplemental pension plans are partly funded by BDC and BDC’s best estimate of contributions for fiscal 2019 is $7.5 million. The other benefit plans are wholly unfunded. Estimated BDC-paid benefits for other post-employment benefit plans (including the retirement allowance plan) for fiscal 2019 amount to $6.4 million.
Notes to the Consolidated Financial StatementsFor the year ended March 31, 2018(in thousands of Canadian dollars)
2018 BDC AR > 86
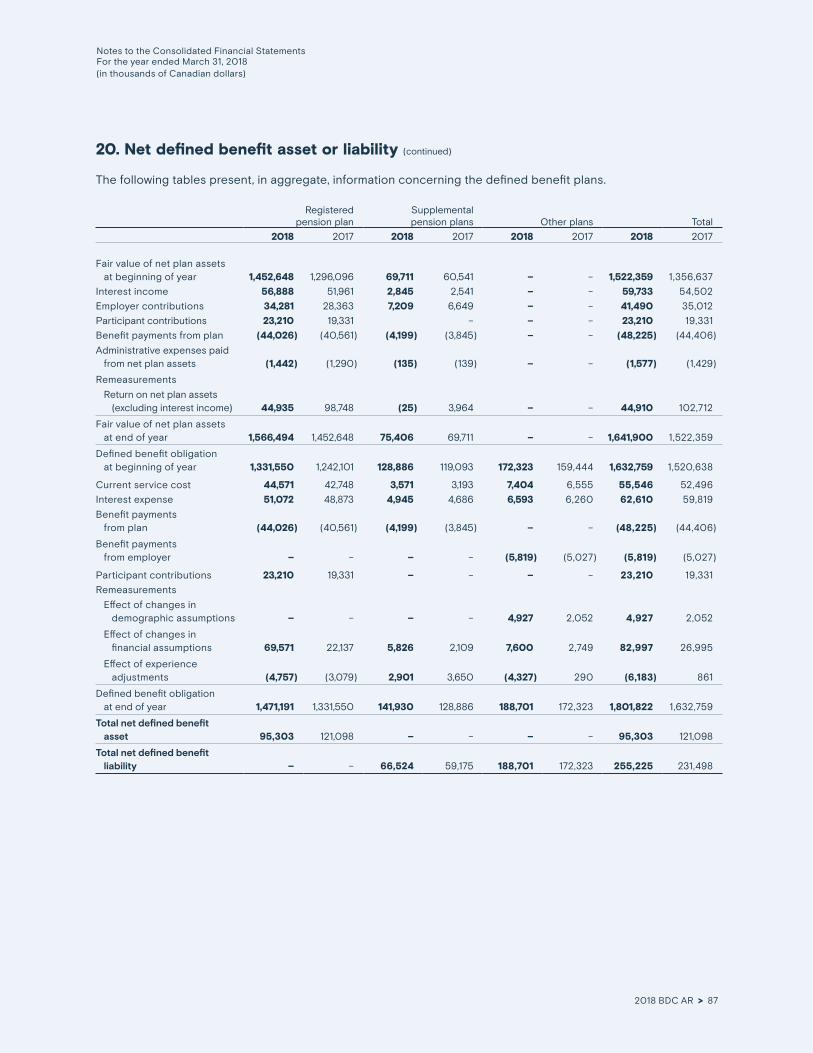
20. Net defined benefit asset or liability (continued)
The following tables present, in aggregate, information concerning the defined benefit plans.
Registered pension plan
Supplemental pension plans Other plans Total
2018 2017 2018 2017 2018 2017 2018 2017
Fair value of net plan assets at beginning of year 1,452,648 1,296,096 69,711 60,541 – – 1,522,359 1,356,637
Interest income 56,888 51,961 2,845 2,541 – – 59,733 54,502
Employer contributions 34,281 28,363 7,209 6,649 – – 41,490 35,012
Participant contributions 23,210 19,331 – – – 23,210 19,331
Benefit payments from plan (44,026) (40,561) (4,199) (3,845) – – (48,225) (44,406)
Administrative expenses paid from net plan assets (1,442) (1,290) (135) (139) – – (1,577) (1,429)
Remeasurements
Return on net plan assets (excluding interest income) 44,935 98,748 (25) 3,964 – – 44,910 102,712
Fair value of net plan assets at end of year 1,566,494 1,452,648 75,406 69,711 – – 1,641,900 1,522,359
Defined benefit obligation at beginning of year 1,331,550 1,242,101 128,886 119,093 172,323 159,444 1,632,759 1,520,638
Current service cost 44,571 42,748 3,571 3,193 7,404 6,555 55,546 52,496
Interest expense 51,072 48,873 4,945 4,686 6,593 6,260 62,610 59,819
Benefit payments from plan (44,026) (40,561) (4,199) (3,845) – – (48,225) (44,406)
Benefit payments from employer – – – – (5,819) (5,027) (5,819) (5,027)
Participant contributions 23,210 19,331 – – – – 23,210 19,331
Remeasurements
Effect of changes in demographic assumptions – – – – 4,927 2,052 4,927 2,052
Effect of changes in financial assumptions 69,571 22,137 5,826 2,109 7,600 2,749 82,997 26,995
Effect of experience adjustments (4,757) (3,079) 2,901 3,650 (4,327) 290 (6,183) 861
Defined benefit obligation at end of year 1,471,191 1,331,550 141,930 128,886 188,701 172,323 1,801,822 1,632,759
Total net defined benefit asset 95,303 121,098 – – – – 95,303 121,098
Total net defined benefit liability – – 66,524 59,175 188,701 172,323 255,225 231,498
Notes to the Consolidated Financial StatementsFor the year ended March 31, 2018(in thousands of Canadian dollars)
2018 BDC AR > 87

20. Net defined benefit asset or liability (continued)
Registered pension plan
Supplemental pension plans Other plans Total
2018 2017 2018 2017 2018 2017 2018 2017
Expense recognized in net income
Current service cost 44,571 42,748 3,571 3,193 7,404 6,555 55,546 52,496
Interest expense on defined benefit obligation 51,072 48,873 4,945 4,686 6,593 6,260 62,610 59,819
Interest income on plan assets (56,888) (51,961) (2,845) (2,541) – – (59,733) (54,502)
Administrative expenses 1,442 1,290 135 139 – – 1,577 1,429
Expense recognized in net income 40,197 40,950 5,806 5,477 13,997 12,815 60,000 59,242
Remeasurements recognized in OCI
Effect of changes in demographic assumptions (4,927) (2,052) (4,927) (2,052)
Effect of changes in financial assumptions (69,571) (22,137) (5,826) (2,109) (7,600) (2,749) (82,997) (26,995)
Effect of experience adjustments 4,757 3,079 (2,901) (3,650) 4,327 (290) 6,183 (861)
Return on plan assets (excluding interest income) 44,935 98,748 (25) 3,964 – – 44,910 102,712
Remeasurement gain (loss) recognized in OCI (19,879) 79,690 (8,752) (1,795) (8,200) (5,091) (36,831) 72,804
Notes to the Consolidated Financial StatementsFor the year ended March 31, 2018(in thousands of Canadian dollars)
2018 BDC AR > 88

20. Net defined benefit asset or liability (continued)
Net plan assets for BDC’s registered and supplemental pension plans can be broken down into the following major categories of investments.
March 31,2018
March 31,2017
Investment type
Quotedon active
market Unquoted Total
Quotedon active
market Unquoted Total
Cash 20,076 – 20,076 31,056 – 31,056
Short-term investments – 14,167 14,167 – 5,716 5,716
Bonds
Government of Canada – 320,442 320,442 – 314,045 314,045
Canadian provinces – 195,834 195,834 – 185,244 185,244
Canadian corporate and municipal – 68,175 68,175 – 63,094 63,094
Equity investments
Canadian equity 165,430 117,352 282,782 155,432 117,435 272,867
Global equity 563,646 40,599 604,245 492,129 46,802 538,931
Private market – 91,165 91,165 – 78,507 78,507
Credit spread overlay strategy, net(1) 880 5,317 6,197 – – –
Other – 38,817 38,817 – 32,899 32,899
Fair value of net plan assets 750,032 891,868 1,641,900 678,617 843,742 1,522,359
(1) The credit spread overlay strategy described below is presented net of investment related liabilities of $999.6 million (nil as at March 31, 2017).
The investment objective for the plan assets of the registered pension plan is to outperform, in the long term, the pension obligation growth rate to compensate for the risk taken. The HR Committee annually reviews the investment policy, which stipulates a diversification strategy, an acceptable level of investment risk and a commensurate rate of return. The plan assets must be invested in a portfolio of diversified securities, according to the investment policy. These investments must be well diversified by industrial sector, based on the industry classification of specific identified indices.
According to the policy, the portfolio can be divided into three large categories of investments: fixed income assets, equity investments and private market investments. The target for fixed income assets is set at 40.0% (40.0% in 2017) of the fair market value of the portfolio. The target for investments in equity should represent approximately 55.0% (53.5% in 2017) of the fair market value of the portfolio: 37.0% in global equity (30.0% in 2017) and 18.0% in Canadian equity (23.5% in 2017). The target for private market investments should represent approximately 5.0% (6.5% in 2017) of the fair market value of the portfolio. The targets exclude the positions from the provincial credit spread overlay strategy described below. The positioning of the asset mix is reviewed monthly to assess the need for rebalancing.
In fiscal 2018, the Fund introduced the provincial credit spread overlay strategy. As part of this strategy, repurchase agreements are contracted to fund the purchase of provincial bonds and reverse repurchase agreements are contracted to obtain the federal bonds to deliver when selling them short. Such repurchase and reverse repurchase positions are rolled over on a quarterly basis to maintain a synthetic long provincial bond and short federal bond position which delivers the provincial credit spread performance. In order to reduce the cost of funding, federal real return bonds are used as collateral on the repurchase transactions, and as more collateral is required, provincial bonds may be used.
Notes to the Consolidated Financial StatementsFor the year ended March 31, 2018(in thousands of Canadian dollars)
2018 BDC AR > 89

20. Net defined benefit asset or liability (continued)
The significant actuarial assumptions adopted in measuring BDC’s defined benefit obligation at year-end are as follows.
Registered pension plan
Supplemental pension plans
Other plans
2018 2017 2018 2017 2018 2017
Discount rate 3.65% 3.90% 3.65% 3.90% 3.65% 3.90%
Inflation rate 2.00% 2.00% 2.00% 2.00% 2.00% 2.00%
Rate of salary increase 3.00% 3.00% 3.00% 3.00% 3.00% 3.00%
Rate of pension increase 2.00% 2.00% 2.00% 2.00% n/a n/a
The average rate of compensation increase is expected to be inflation, plus 0.5% for productivity gains, plus an adjustment for merit and promotion.
The following mortality table has been used to determine the present value of the benefit obligation:
> The 2014 Public Sector Mortality Table with mortality improvement Scale CPM-B, from the Canadian Pensioners’ Mortality (CPM) study published by the Canadian Institute of Actuaries in February 2014, was used for 2018 and 2017.
As at March 31, 2018, the weighted-average duration of the defined benefit obligation was 17.7 years (2017: 17.3 years).
For measurement purposes, health care cost trends were assumed to be as follows:
Medical (drugs) > 5.875% in 2018 reducing by 0.125% each year to 4.0% in 2033
(6.0% in 2017 reducing by 0.125% each year to 4.0% in 2033)
Other medical costs > 4.0% per year
(3.8% per year in fiscal 2017)
Dental costs > 4.0% per year
(4.0% per year in fiscal 2017)
Weighted average health care trend > 4.8% in 2018 reducing by 0.06% each year to 3.9% in 2033
(4.8% in 2017 reducing by 0.056% each year to 3.9% in 2033)
Notes to the Consolidated Financial StatementsFor the year ended March 31, 2018(in thousands of Canadian dollars)
2018 BDC AR > 90
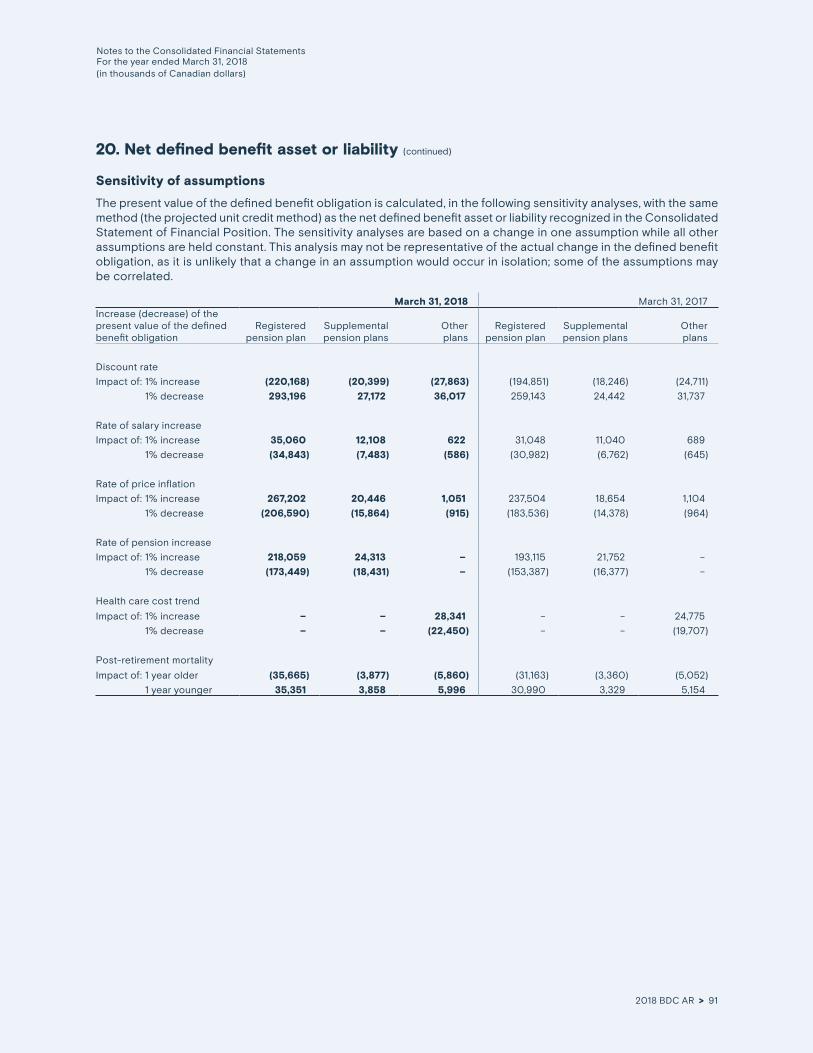
20. Net defined benefit asset or liability (continued)
Sensitivity of assumptions
The present value of the defined benefit obligation is calculated, in the following sensitivity analyses, with the same method (the projected unit credit method) as the net defined benefit asset or liability recognized in the Consolidated Statement of Financial Position. The sensitivity analyses are based on a change in one assumption while all other assumptions are held constant. This analysis may not be representative of the actual change in the defined benefit obligation, as it is unlikely that a change in an assumption would occur in isolation; some of the assumptions may be correlated.
March 31, 2018 March 31, 2017Increase (decrease) of the present value of the defined benefit obligation
Registeredpension plan
Supplemental pension plans
Otherplans
Registeredpension plan
Supplemental pension plans
Otherplans
Discount rate
Impact of: 1% increase (220,168) (20,399) (27,863) (194,851) (18,246) (24,711)
1% decrease 293,196 27,172 36,017 259,143 24,442 31,737
Rate of salary increase
Impact of: 1% increase 35,060 12,108 622 31,048 11,040 689
1% decrease (34,843) (7,483) (586) (30,982) (6,762) (645)
Rate of price inflation
Impact of: 1% increase 267,202 20,446 1,051 237,504 18,654 1,104
1% decrease (206,590) (15,864) (915) (183,536) (14,378) (964)
Rate of pension increase
Impact of: 1% increase 218,059 24,313 – 193,115 21,752 –
1% decrease (173,449) (18,431) – (153,387) (16,377) –
Health care cost trend
Impact of: 1% increase – – 28,341 – – 24,775
1% decrease – – (22,450) – – (19,707)
Post-retirement mortality
Impact of: 1 year older (35,665) (3,877) (5,860) (31,163) (3,360) (5,052)
1 year younger 35,351 3,858 5,996 30,990 3,329 5,154
Notes to the Consolidated Financial StatementsFor the year ended March 31, 2018(in thousands of Canadian dollars)
2018 BDC AR > 91

21.Other liabilities
March 31, 2018 March 31, 2017
Financial instruments
Deposits from clients 33,517 36,812
Other(1) 1,990 1,974
35,507 38,786
Deferred income 5,454 6,620
Other(1) 4,105 2,915
Total other liabilities 45,066 48,321
(1) All other liabilities are non-current.
22.Share capital
An unlimited number of common shares, having a par value of $100 each, is authorized. As at March 31, 2018, there were 24,779,000 common shares outstanding (24,134,000 as at March 31, 2017).
As per BDC’s Capital Management and Dividend Policy, on the date of approval of the fiscal 2018 Consolidated Financial Statements, a $69.7 million dividend was declared based on fiscal 2018 results and no dividend was paid in fiscal 2018 based on fiscal 2017 results.
In fiscal 2018, 645,000 common shares for $64.5 million were issued by BDC (1,250,000 for $125.0 million in 2017).
Reconciliation of the number of common shares issued and oustanding
2018 2017
As at beginning of the year 24,134,000 22,884,000
Shares issued 645,000 1,250,000
As at end of the year 24,779,000 24,134,000
Notes to the Consolidated Financial StatementsFor the year ended March 31, 2018(in thousands of Canadian dollars)
2018 BDC AR > 92

23.Capital management
Statutory limitations
As per the BDC Act, the debt-to-equity ratio of BDC may not exceed 12:1. This ratio is defined as the aggregate of borrowings recognized in the Consolidated Statement of Financial Position and contingent liabilities that exist in the form of financial guarantees issued by BDC over equity attributable to BDC’s shareholder, which excludes accumulated other comprehensive income. BDC’s ratio as at March 31, 2018, was 3.1:1 (3.2:1 as at March 31, 2017).
In addition, the paid-in capital, the contributed surplus and any proceeds that have been prescribed as equity (such as hybrid capital instruments) must not at any time exceed $3.0 billion. In December 2017, this limit was raised from $3.0 billion to $4.5 billion. As at March 31, 2018, these amounts totalled $2.5 billion ($2.4 billion as at March 31, 2017).
During 2018 and 2017, BDC met both of these statutory limitations.
Capital adequacy
In fiscal 2017, BDC’s Capital Management Framework was formalized in a new Capital Management and Dividend Policy and refined to better align with the Capital and Dividend Policy Framework for Financial Crown Corporations and Basel III requirements. The key principles behind BDC’s Capital Management Framework are that:
> BDC has adequate capital to protect itself against risks that could adversely impact its ability to deliver on its mandate and minimize the risk of recapitalization through a complete economic cycle; and
> capital in excess of target capital should be returned to the shareholder in the form of dividends.
BDC’s ICAAP excludes the Venture Capital Action Plan (VCAP), as this program is managed by BDC under a specific capital allocation from the shareholder.
BDC monitors its capital status by comparing available capital to capital demand.
Available capital based on BDC’s ICAAP is composed of equity attributable to BDC’s shareholder and adjustments aligned with industry practices. These adjustments were refined in fiscal 2017 to reflect Basel III requirements.
Notes to the Consolidated Financial StatementsFor the year ended March 31, 2018(in thousands of Canadian dollars)
2018 BDC AR > 93
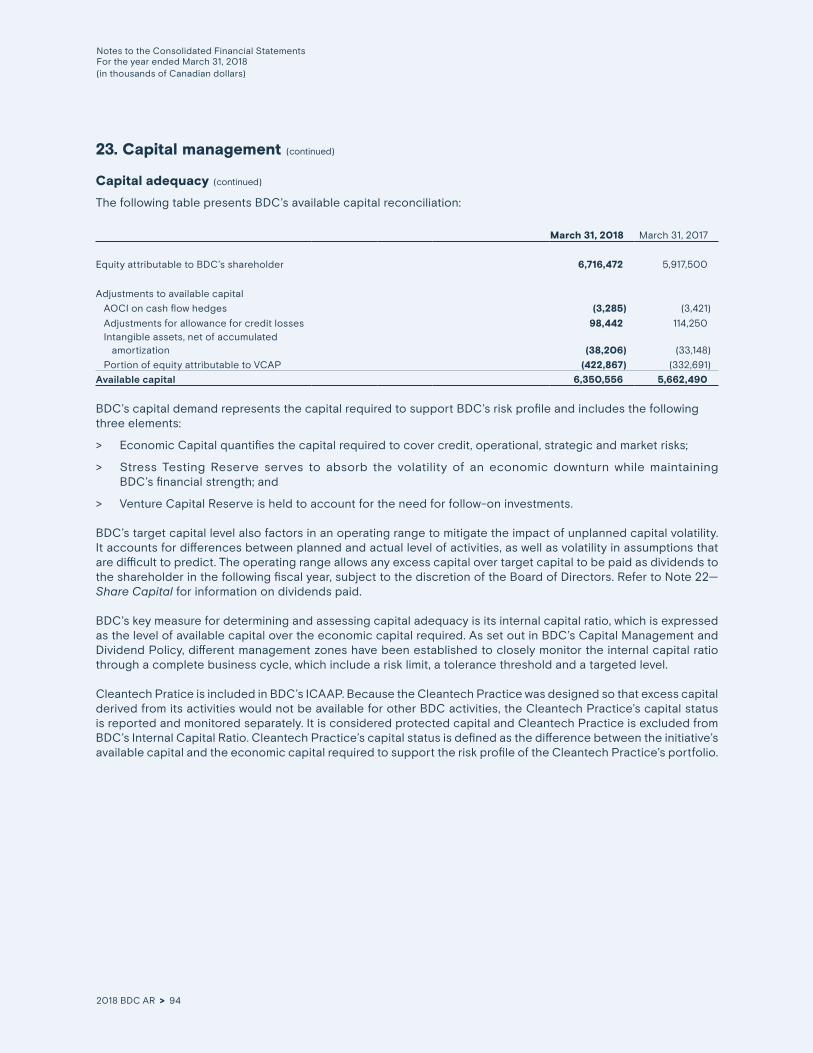
23. Capital management (continued)
Capital adequacy (continued)
The following table presents BDC’s available capital reconciliation:
March 31, 2018 March 31, 2017
Equity attributable to BDC’s shareholder 6,716,472 5,917,500
Adjustments to available capital
AOCI on cash flow hedges (3,285) (3,421)
Adjustments for allowance for credit losses 98,442 114,250 Intangible assets, net of accumulated amortization (38,206) (33,148)
Portion of equity attributable to VCAP (422,867) (332,691)
Available capital 6,350,556 5,662,490
BDC’s capital demand represents the capital required to support BDC’s risk profile and includes the following three elements:
> Economic Capital quantifies the capital required to cover credit, operational, strategic and market risks;
> Stress Testing Reserve serves to absorb the volatility of an economic downturn while maintaining BDC’s financial strength; and
> Venture Capital Reserve is held to account for the need for follow-on investments.
BDC’s target capital level also factors in an operating range to mitigate the impact of unplanned capital volatility. It accounts for differences between planned and actual level of activities, as well as volatility in assumptions that are difficult to predict. The operating range allows any excess capital over target capital to be paid as dividends to the shareholder in the following fiscal year, subject to the discretion of the Board of Directors. Refer to Note 22—Share Capital for information on dividends paid.
BDC’s key measure for determining and assessing capital adequacy is its internal capital ratio, which is expressed as the level of available capital over the economic capital required. As set out in BDC’s Capital Management and Dividend Policy, different management zones have been established to closely monitor the internal capital ratio through a complete business cycle, which include a risk limit, a tolerance threshold and a targeted level.
Cleantech Pratice is included in BDC’s ICAAP. Because the Cleantech Practice was designed so that excess capital derived from its activities would not be available for other BDC activities, the Cleantech Practice’s capital status is reported and monitored separately. It is considered protected capital and Cleantech Practice is excluded from BDC’s Internal Capital Ratio. Cleantech Practice’s capital status is defined as the difference between the initiative’s available capital and the economic capital required to support the risk profile of the Cleantech Practice’s portfolio.
Notes to the Consolidated Financial StatementsFor the year ended March 31, 2018(in thousands of Canadian dollars)
2018 BDC AR > 94

24.Risk management
Governance
Risk is an inherent feature of the financial sector. BDC has strong risk management practices that emphasize risk identification, risk management, transparency and accountability.
Nature and extent of risks arising from financial instruments
BDC is exposed to the following financial risks: credit risk, market risk and liquidity risk. This note provides the definitions of these risks and describes BDC’s risk management policies and risk measurements.
Credit riskCredit risk is the risk that a financial loss will be incurred due to the failure of a counterparty in discharging its contractual commitment or obligation to BDC. For the purposes of credit risk management activities, BDC distinguishes between credit risk arising from asset-backed securities issuers, borrowers and investees, and counterparties to treasury activities.
Asset-backed securities issuersThe asset-backed securities (ABS) portfolio consists of investment-grade senior and subordinated notes issued by way of private placement. ABS are fully backed by security consisting of portfolios of loans and leases on vehicles and equipment, as well as dealer floor plan loans, for which there is no significant concentration risk.
In order to mitigate the credit risk on the underlying asset portfolio, generally, there are structural or credit protections. Also, the face value of the subordinated notes does not exceed 10% of the senior notes. In addition, securities purchased must be of a certain grade. At time of purchase, senior note investments must be, at a minimum, an implied investment grade. The implied rating is calculated by BDC using the same scale as rating agencies. The rating is derived by evaluating the transaction structure and the credit enhancement supporting the securities.
Subsequently, BDC receives portfolio reports that describe the performance of the securities, along with the cash flows associated with the collateral, in order to evaluate the securities. In addition, BDC uses an internal risk rating system to monitor credit risk.
As at March 31, 2018, and March 31, 2017, none of the notes were past due and none had suffered a deterioration in their credit rating. The maximum exposure to credit risk of ABS is limited to the carrying value of the securities. Refer to Note 10—Asset-Backed Securities, for additional information on this portfolio.
Notes to the Consolidated Financial StatementsFor the year ended March 31, 2018(in thousands of Canadian dollars)
2018 BDC AR > 95

24. Risk management (continued)
Credit risk (continued)
Borrowers and investeesBDC uses a number of policies, directives and procedures to manage credit exposures from loans and investments, which include:
> the use of an internal credit risk rating classification;
> credit policies, guidelines and directives, communicated to officers whose activities and responsibilities include credit granting and risk assessment, which ensure early recognition of problem accounts and immediate implementation of steps to protect BDC’s assets;
> independent reviews by Internal Audit of credit valuation, risk classification and credit management procedures, which include reporting the results to senior management, the President and Chief Executive Officer, and the Audit Committee;
> approval of larger transactions by the Board Risk Committee and the Board Investment Committee, based on recommendations made by the Credit Risk Committee;
> review and assessment by the Clean Technology Special Committee of all risks associated with the initiative;
> monitoring of portfolio concentrations to protect BDC from being overly concentrated in any one province or industry sector;
> monitoring to ensure that exposure to a single borrower or associated borrowers, unless approved by the Board of Directors, does not represent more than 10% of the shareholder’s equity;
> an annual review process to ensure appropriate classification of individual credit facilities;
> the conduct of semi-annual valuations of investments; and
> a watchlist report recording accounts with evidence of weaknesses, as well as an impaired loan report covering loans that show impairment.
The maximum exposure to credit risk from borrowers and investees is limited to the carrying amount of the loans, subordinate financing investments and venture capital investments in debentures. Refer to Note 11—Loans, Note 12—Subordinate Financing Investments, Note 13—Venture Capital Investments and Note 14—Venture Capital Action Plan Investments for additional information on loans and investment portfolios.
BDC is also exposed to credit risk on its loan commitments and financial guarantees. Maximum exposure to credit risk is limited to the committed amount or, in the case of financial guarantees, to the maximum amount payable under the guarantees. Refer to Note 27—Guarantees and Contingent Liabilities and Note 28—Commitments for additional information.
Notes to the Consolidated Financial StatementsFor the year ended March 31, 2018(in thousands of Canadian dollars)
2018 BDC AR > 96

24. Risk management (continued)
Credit risk (continued)
Counterparties to treasury activitiesCredit risk inherent to treasury activities is the risk that BDC faces through the non-performance of a counterparty and the possible event of its default. For the purpose of BDC’s treasury activities, a distinction is made between credit risk arising from investments held in the liquidity portfolio (issuer risk) and credit risk arising from the use of derivative products (counterparty risk).
The notional amounts of derivative financial instruments held by BDC are not indicative of the credit risk exposure associated with the contracts. The risk of loss is related to the possibility that a counterparty to a transaction will not perform as agreed. In the event of default by a counterparty, the risk to BDC in these transactions would be limited to the prevailing market values of transactions that are in an unrealized gain position and uncollaterized.
BDC limits its exposure to credit risk by dealing only with financial institutions that have credit ratings in accordance with the Treasury Risk Policy. As at March 31, 2018, and March 31, 2017, BDC had no significant concentrations in any individual financial institution.
BDC continually monitors its position and the credit ratings of its counterparties, and seeks to limit its credit exposure with respect to contracts in a favourable position by entering into master netting agreements with counterparties.
Counterparty credit risk exposure Counterparty ratings
AA- to AA+ A- to A+ BBB to BBB+ Total
Gross positive replacement cost 6,386 8,341 630 15,357
Impact of master netting agreements – (3,248) – (3,248)
Replacement cost (after master netting agreements) – March 31, 2018 6,386 5,093 630 12,109
Replacement cost (after master netting agreements) – March 31, 2017 11,356 7,588 599 19,543
Number of counterparties
March 31, 2018 1 5 1 7
March 31, 2017 2 6 1 9
Finally, to manage the credit risk arising from an issuer of cash equivalents, the Treasury Risk Management Unit ensures the liquidity portfolio is composed of securities issued or guaranteed by entities that have a minimum credit rating of A.
Notes to the Consolidated Financial StatementsFor the year ended March 31, 2018(in thousands of Canadian dollars)
2018 BDC AR > 97
24. Risk management (continued)
Market riskMarket risk is the risk of incurring losses as a result of changes in market factors, such as interest rates, foreign exchange rates, the prices of equities or commodities, or other relevant market factors. Market risk for BDC also arises from volatile unpredictable market events affecting the value of venture capital investments.
Interest rate riskInterest rate risk is defined as the risk that the fair value or future cash flows of a financial instrument will fluctuate as a result of changes in market interest rates. For BDC, the risk and potential variability in earnings arise primarily when cash flows associated with interest-sensitive assets and liabilities have different repricing dates. A positive interest rate gap exists when interest-sensitive assets exceed interest-sensitive liabilities for a specific maturity or repricing period. A positive gap will result in an increase in net interest income when market interest rates rise, since assets reprice earlier than liabilities. The opposite impact will occur when market interest rates fall. As set out in the Treasury Risk Policy, BDC manages market risk by matching the terms of assets and liabilities. As a result, BDC structured notes are economically hedged, using derivatives, to eliminate market risks (refer to Note 9—Derivative Financial Instruments, for additional information).
To manage the interest rate gap on its interest-sensitive assets and interest-sensitive liabilities, BDC establishes policy guidelines for interest rate gap positions, regularly monitors the Bank’s situation and decides future strategies in light of changing market conditions. The objective is to manage the interest rate risk using sound and prudent guidelines. Interest rate risk policies, included in the Treasury Risk Policy, are approved and reviewed at least annually by the Board of Directors.
Exposure to interest rate risk is controlled by managing the size of the static gap positions between interest-sensitive assets and interest-sensitive liabilities. Gap analysis is supplemented by scenario analysis of the asset liability portfolio structure and by a duration analysis. The interest rate gap is measured daily.
Exposure to interest rate risk is also monitored using a net interest income sensitivity stress test. A parallel and sustainable 200-basis-point shock on the Canadian yield curve is simulated and the impact on net interest income has to be less than 10%. As at March 31, 2018, the impact was 1% or $9 million on net income and equity (1% or $14 million as at March 31, 2017).
Notes to the Consolidated Financial StatementsFor the year ended March 31, 2018(in thousands of Canadian dollars)
2018 BDC AR > 98

24. Risk management (continued)
Market risk (continued)
Interest rate risk (continued)
The following tables summarize BDC’s interest rate sensitivity position based on the difference between the carrying value of assets and the carrying value of liabilities and equity, grouped by the earlier of contractual repricing or maturity date. The effective yield represents the weighted-average effective yield based on the earlier of contractual repricing or maturity date. This gap analysis is a static measurement of interest rate-sensitive gaps at a specific time. These gaps can change significantly in a short period of time.
Canadian dollar transactionsImmediately
rate-sensitive Within 3 months
4 to 12 months
1 to 5 years
Over 5 years
Non-rate- sensitive
Allowanceand fair value Total
AssetsCash (overdrawn) and cash equivalents 22,121 647,522 669,643
Effective yield (%) 1.50
Derivative assets 13,980 13,980
Asset-backed securities 17,473 448,597 466,070
Effective yield (%) 1.66 2.27
Loans 16,586,569 726,200 623,960 3,705,734 1,683,724 754,508 (694,632) 23,386,063
Effective yield (%) 5.77 4.31 5.00 4.62 4.57
Subordinate financing investments 465,256 25,062 32,882 245,946 51,379 229,402 (38,565) 1,011,362
Effective yield(1) (%) 10.15 9.97 9.80 9.40 7.30
Venture capital investments 493,022 143,462 636,484
Venture capital action plan investments 357,866 37,993 395,859
Other 204,074 204,074
17,073,946 1,412,764 656,842 3,969,153 2,183,700 2,038,872 (551,742) 26,783,535
Liabilities and equity
Derivative liabilities 2,349 2,349
Short-term notes 20,480,059 20,480,059
Effective yield (%) 1.08
Long-term notes 134,513 134,513
Effective yield (%) 1.34
Other 427,179 427,179
Total equity 6,759,203 6,759,203
– 20,482,408 – 134,513 – 7,186,382 – 27,803,303
Total gap position before derivatives
March 31, 2018 17,073,946 (19,069,644) 656,842 3,834,640 2,183,700 (5,147,510) (551,742) (1,019,768)
March 31, 2017(4) 16,203,313 (17,515,737) 709,804 3,161,429 1,820,709 (4,502,927) (660,540) (783,949)
Total derivative position 60,861 169,139 (230,000) –Total gap position March 31, 2018 17,073,946 (19,008,783) 656,842 4,003,779 1,953,700 (5,147,510) (551,742) (1,019,768)Total gap position March 31, 2017 16,203,313 (17,579,876) 649,804 3,285,568 1,820,709 (4,502,927) (660,540) (783,949)
(1) Excludes non-interest return.(2) This grouping includes asset-backed securities, short-term notes and long-term notes for which interest rates reset monthly. The short-term
notes and long-term notes are used to fund floating-rate assets, the majority of which are categorized as Immediately rate-sensitive.(3) Assets, liabilities and equities that are non-rate sensitive have no specific maturity.(4) In Fiscal 2018, to align with the industry standard, the grouping of the above table was modified and the Floating rate category was
replaced by a new category entitled Immediately rate-sensitive. Comparative figures were reclassified resulting in a transfer of $356 million from the old Floating rate category to the Within 3 months category (increase of $339 million) and to the 4-12 months category (increase of $17 million).
(2) (3)
Notes to the Consolidated Financial StatementsFor the year ended March 31, 2018(in thousands of Canadian dollars)
2018 BDC AR > 99

24. Risk management (continued)
Market risk (continued)
Interest rate risk (continued)
Foreign currency transactions, expressed in Canadian dollars
Immediately rate-sensitive
Within 3 months
4 to 12 months
1 to 5 years
Over 5 years
Non-rate- sensitive
Allowanceand fair value Total
Assets
Cash and cash equivalents 3,227 3,227
Effective yield (%)
Derivative assets 630 747 1,377
Asset-backed securities 6,625 6,625
Effective yield (%) 3.51
Loans 208,832 116,221 8,013 3,006 16,064 (10,008) 342,128
Effective yield (%) 5.77 4.29 4.86 5.46
Subordinate financing investments 39,563 1,427 40,990
Effective yield(1) (%) 10.37
Venture capital investments 429,830 196,797 626,627
Venture capital action plan investments 5,403 (746) 4,657
Other –
251,622 116,851 – 8,013 9,631 452,044 187,470 1,025,631
Liabilities and equity
Derivative liabilities 1,038 1,038
Short-term notes 1,089 1,089
Effective yield (%) 1.55
Long-term notes 3,171 3,171
Effective yield (%) 1.35
Other 565 565
– 1,089 – 3,171 – 1,603 – 5,863
Total gap position before derivatives
March 31, 2018 251,622 115,762 – 4,842 9,631 450,441 187,470 1,019,768
March 31, 2017(4) 145,829 167,786 (12,322) (652) 3,946 406,998 72,364 783,949
Total derivative position – (2,554) – 2,554 – – – – Total gap position March 31, 2018 251,622 113,208 – 7,396 9,631 450,441 187,470 1,019,768 Total gap position March 31, 2017 145,829 149,657 (1,447) 6,602 3,946 406,998 72,364 783,949
(1) Excludes non-interest return.(2) This grouping includes asset-backed securities, short-term notes and long-term notes for which interest rates reset monthly. The short-term
notes and long-term notes are used to fund floating-rate assets, the majority of which are categorized as Immediately rate-sensitive.(3) Assets, liabilities and equities that are non-rate sensitive have no specific maturity.(4) In Fiscal 2018, to align with the industry standard, the grouping of the above table was modified and the Floating rate category was
replaced by a new category entitled Immediately rate-sensitive. Comparative figures were reclassified resulting in a transfer of $47 million from the old Floating rate category to the Within 3 months category (increase of $47 million).
(2) (3)
Notes to the Consolidated Financial StatementsFor the year ended March 31, 2018(in thousands of Canadian dollars)
2018 BDC AR > 100

24. Risk management (continued)
Market risk (continued)
Interest rate risk (continued)
Total transactions, expressed in Canadian dollars
Immediately rate-sensitive
Within 3 months
4 to 12 months
1 to 5 years
Over 5 years
Non-rate- sensitive
Allowanceand fair value Total
Total gap position for Canadian dollar transactions 17,073,946 (19,008,783) 656,842 4,003,779 1,953,700 (5,147,510) (551,742) (1,019,768)
Total gap position for foreign currency transactions 251,622 113,208 – 7,396 9,631 450,441 187,470 1,019,768
Total gap position March 31, 2018 17,325,568 (18,895,575) 656,842 4,011,175 1,963,331 (4,697,069) (364,272) –
Total gap position March 31, 2017 16,349,142 (17,430,219) 648,357 3,292,170 1,824,655 (4,095,929) (588,176) –
Foreign exchange riskForeign exchange risk arises when there is a difference between assets and liabilities held in foreign currencies. Foreign exchange risk is defined as the risk that the fair value or future cash flows of a financial instrument will fluctuate as a result of changes in foreign exchange rates. BDC’s policy and practice are to economically hedge borrowings, subordinate financing investments and loans in foreign currencies so that the residual exposure to foreign exchange risk is not significant. Venture capital investments are hedged following the occurrence of a liquidity event. Refer to Note 9—Derivative Financial Instruments, for more information.
Venture capital market riskUnpredictable financial markets, as well as the presence and appetite of buyers, dictate the timing of venture capital divestitures. This timing, in turn, affects the value of BDC venture capital investments. To manage this risk, BDC uses a rigorous selection process for investments and works closely with its investee companies. BDC also lowers the risk of its venture capital and venture capital action plan investments by applying conservative valuations when purchasing participation in a company, co-investing with other venture capital investors and monitoring investments regularly.
Management reviews all transactions. Larger investment transactions that exceed delegations residing with management are recommended by management to the Board Investment Committee, which, in turn, may recommend them to the board for review, as required. Other transactions will be recommended for review by the Board Risk Committee directly by the chief risk officer.
Liquidity riskLiquidity risk is the risk resulting from the difficulty in converting BDC’s assets into cash for the purpose of servicing and refinancing its debt, for the timely disbursement of its committed loans and investments and for payment of its operating expenses and dividends.
Notes to the Consolidated Financial StatementsFor the year ended March 31, 2018(in thousands of Canadian dollars)
2018 BDC AR > 101

24. Risk management (continued)
Liquidity risk (continued)
The following tables present contractual maturities of financial liabilities and commitments, and are based on future payments, which may differ from carrying values.
Within 1 year 1 to 5 years
Over 5 years
No fixed maturity Total
Accounts payable and accrued liabilities 88,304 39,149 127,453
Derivative liabilities(1) 4,492 27,296 31,788
Short-term notes(2) 20,590,691 20,590,691
Long-term notes(2) 33,372 208,900 242,272
Other financial liabilities 35,507 35,507
Commitments
Asset-backed securities(4) 403,000 403,000
Loans 3,087,536 3,087,536
Subordinate financing investments 108,444 108,444
Venture capital investments(3) 351,327 351,327
Venture capital action plan investments(3) 26,715 26,715
Leases 31,119 91,343 192,475 314,937
Total as at March 31, 2018 24,382,465 366,688 192,475 378,042 25,319,670
Within 1 year 1 to 5 years
Over 5 years
No fixed maturity Total
Accounts payable and accrued liabilities 81,704 37,331 119,035
Derivative liabilities(1) 2,501 2,501
Short-term notes(2) 18,806,582 18,806,582
Long-term notes(2) 54,648 260,983 315,631
Other financial liabilities 38,786 38,786
Commitments
Asset-backed securities(4) 427,000 427,000
Loans 2,861,028 2,861,028
Subordinate financing investments 79,603 79,603
Venture capital investments(3) 345,102 345,102
Venture capital action plan investments(3) 99,178 99,178
Leases 29,290 95,222 203,979 328,491
Total as at March 31, 2017 22,381,142 393,536 203,979 444,280 23,422,937
(1) Derivative liabilities reflect the interest payments to maturity of derivatives.(2) Short-term and long-term notes reflect the future payments that will be paid as per the contractual note agreements.(3) Commitments are mainly related to participation in funds in which BDC legally committed to invest. Timing of investments will vary,
depending on funds’ investment requirements, and should occur over the next several years.(4) Commitments are presented at the earliest possible liquidity event.
Notes to the Consolidated Financial StatementsFor the year ended March 31, 2018(in thousands of Canadian dollars)
2018 BDC AR > 102
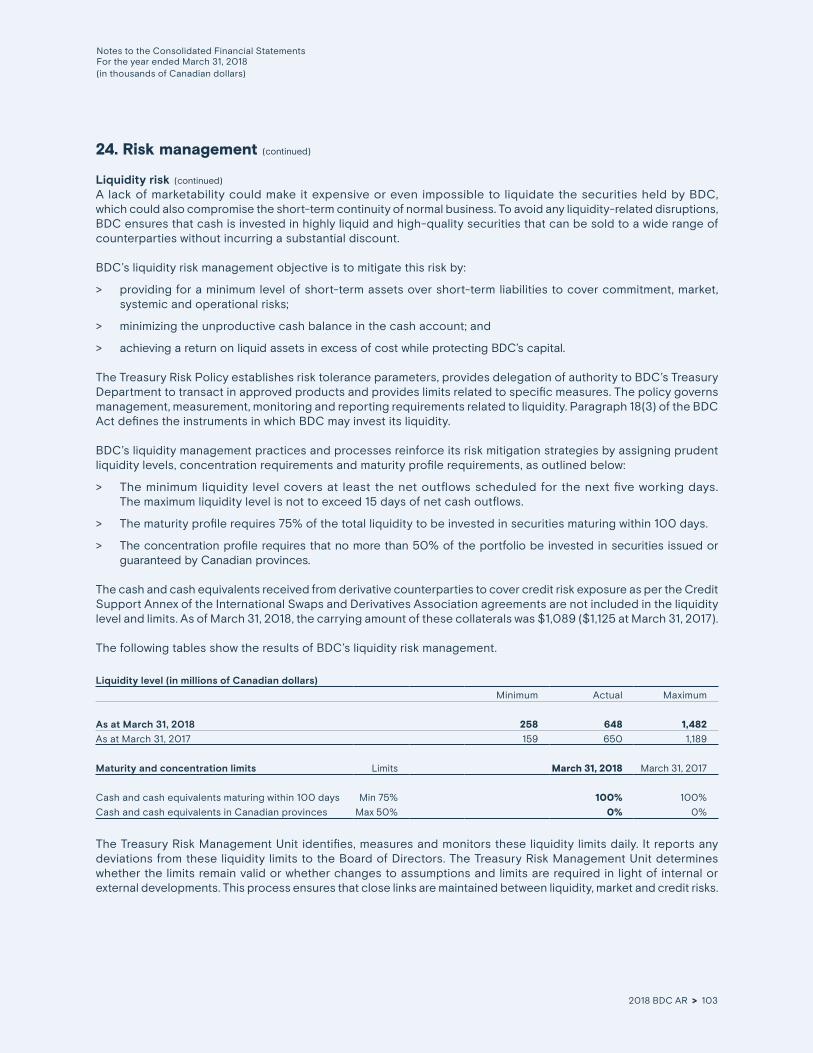
24. Risk management (continued)
Liquidity risk (continued)
A lack of marketability could make it expensive or even impossible to liquidate the securities held by BDC, which could also compromise the short-term continuity of normal business. To avoid any liquidity-related disruptions, BDC ensures that cash is invested in highly liquid and high-quality securities that can be sold to a wide range of counterparties without incurring a substantial discount.
BDC’s liquidity risk management objective is to mitigate this risk by:
> providing for a minimum level of short-term assets over short-term liabilities to cover commitment, market, systemic and operational risks;
> minimizing the unproductive cash balance in the cash account; and
> achieving a return on liquid assets in excess of cost while protecting BDC’s capital.
The Treasury Risk Policy establishes risk tolerance parameters, provides delegation of authority to BDC’s Treasury Department to transact in approved products and provides limits related to specific measures. The policy governs management, measurement, monitoring and reporting requirements related to liquidity. Paragraph 18(3) of the BDC Act defines the instruments in which BDC may invest its liquidity.
BDC’s liquidity management practices and processes reinforce its risk mitigation strategies by assigning prudent liquidity levels, concentration requirements and maturity profile requirements, as outlined below:
> The minimum liquidity level covers at least the net outflows scheduled for the next five working days. The maximum liquidity level is not to exceed 15 days of net cash outflows.
> The maturity profile requires 75% of the total liquidity to be invested in securities maturing within 100 days.
> The concentration profile requires that no more than 50% of the portfolio be invested in securities issued or guaranteed by Canadian provinces.
The cash and cash equivalents received from derivative counterparties to cover credit risk exposure as per the Credit Support Annex of the International Swaps and Derivatives Association agreements are not included in the liquidity level and limits. As of March 31, 2018, the carrying amount of these collaterals was $1,089 ($1,125 at March 31, 2017).
The following tables show the results of BDC’s liquidity risk management.
Liquidity level (in millions of Canadian dollars)
Minimum Actual Maximum
As at March 31, 2018 258 648 1,482
As at March 31, 2017 159 650 1,189
Maturity and concentration limits Limits March 31, 2018 March 31, 2017
Cash and cash equivalents maturing within 100 days Min 75% 100% 100%
Cash and cash equivalents in Canadian provinces Max 50% 0% 0%
The Treasury Risk Management Unit identifies, measures and monitors these liquidity limits daily. It reports any deviations from these liquidity limits to the Board of Directors. The Treasury Risk Management Unit determines whether the limits remain valid or whether changes to assumptions and limits are required in light of internal or external developments. This process ensures that close links are maintained between liquidity, market and credit risks.
Notes to the Consolidated Financial StatementsFor the year ended March 31, 2018(in thousands of Canadian dollars)
2018 BDC AR > 103
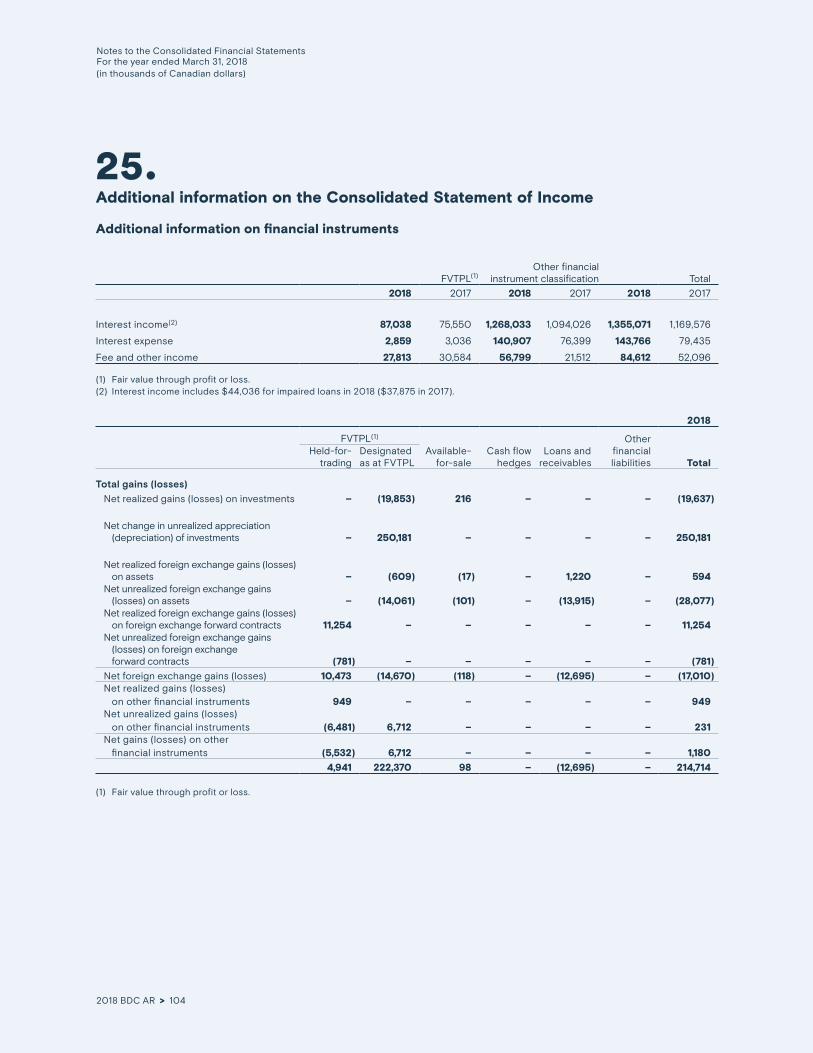
25.Additional information on the Consolidated Statement of Income
Additional information on financial instruments
FVTPLOther financial
instrument classification Total
2018 2017 2018 2017 2018 2017
Interest income(2) 87,038 75,550 1,268,033 1,094,026 1,355,071 1,169,576
Interest expense 2,859 3,036 140,907 76,399 143,766 79,435
Fee and other income 27,813 30,584 56,799 21,512 84,612 52,096
(1) Fair value through profit or loss.(2) Interest income includes $44,036 for impaired loans in 2018 ($37,875 in 2017).
2018
FVTPL(1)
Available- for-sale
Cash flow hedges
Loans and receivables
Other financialliabilities Total
Held-for- trading
Designated as at FVTPL
Total gains (losses)
Net realized gains (losses) on investments – (19,853) 216 – – – (19,637)
Net change in unrealized appreciation (depreciation) of investments – 250,181 – – – – 250,181
Net realized foreign exchange gains (losses) on assets – (609) (17) – 1,220 – 594 Net unrealized foreign exchange gains (losses) on assets – (14,061) (101) – (13,915) – (28,077) Net realized foreign exchange gains (losses) on foreign exchange forward contracts 11,254 – – – – – 11,254 Net unrealized foreign exchange gains (losses) on foreign exchange forward contracts (781) – – – – – (781)
Net foreign exchange gains (losses) 10,473 (14,670) (118) – (12,695) – (17,010) Net realized gains (losses) on other financial instruments 949 – – – – – 949 Net unrealized gains (losses) on other financial instruments (6,481) 6,712 – – – – 231 Net gains (losses) on other financial instruments (5,532) 6,712 – – – – 1,180
4,941 222,370 98 – (12,695) – 214,714
(1) Fair value through profit or loss.
(1)
Notes to the Consolidated Financial StatementsFor the year ended March 31, 2018(in thousands of Canadian dollars)
2018 BDC AR > 104

25. Additional information on the Consolidated Statement of Income (continued)
Additional information on financial instruments (continued)
2017
FVTPL(1)
Available- for-sale
Cash flow hedges
Loans and receivables
Other financialliabilities Total
Held-for- trading
Designated as at FVTPL
Total gains (losses)
Net realized gains (losses) on investments – 6,744 – – – – 6,744
Net change in unrealized appreciation (depreciation) of investments – 2,940 (43) – – – 2,897
Net realized foreign exchange gains (losses) on assets – (94) – – 5,114 – 5,020 Net unrealized foreign exchange gains (losses) on assets – 11,084 4 – 4,770 – 15,858 Net realized foreign exchange gains (losses) on foreign exchange forward contracts (1,421) – – – – – (1,421) Net unrealized foreign exchange gains (losses) on foreign exchange forward contracts (6,621) – – – – – (6,621)
Net foreign exchange gains (losses) (8,042) 10,990 4 – 9,884 – 12,836 Net realized gains (losses) on other financial instruments – 1,996 – 407 – – 2,403 Net unrealized gains (losses) on other financial instruments (19,429) 18,531 – (181) – (31) (1,110) Net gains (losses) on other financial instruments (19,429) 20,527 – 226 – (31) 1,293
(27,471) 41,201 (39) 226 9,884 (31) 23,770
(1) Fair value through profit or loss.
Other additional information
2018 2017
Salaries and benefits
Salaries and other benefits 332,157 312,175
Defined benefit plan expense (Note 20) 60,000 59,242
392,157 371,417
Other expenses
Professional and outsourcing fees 49,460 53,112
Computers and software, including amortization and depreciation 29,467 26,729
Communications, advertising and promotion 24,002 26,003
Other 23,037 24,351
125,966 130,195
Notes to the Consolidated Financial StatementsFor the year ended March 31, 2018(in thousands of Canadian dollars)
2018 BDC AR > 105
26.Segmented information
BDC reports on six business lines: Financing, Growth & Transition Capital, Venture Capital (VC), Advisory Services, Venture Capital Action Plan (VCAP) and a newly created business line, Cleantech Practice, in response to the 2017 Federal Budget. Each business line offers different products and services, and is managed separately based on BDC’s management and internal reporting structure.
In past years, Financing and Securitization were presented as separate segments. Starting in fiscal 2018, BDC no longer reports on Securitization separately and presents asset-backed securities (ABS) as a product of Financing. Comparative information for previous years has been restated accordingly.
The following summary describes the operations in each of the Bank’s reportable segments.
> Financing provides secured, partially secured and unsecured loans with a focus on small and medium-sized enterprises across Canada. It also purchases investments in asset-backed securities through the Funding Platform for Independent Lenders (F-PIL). These securities are backed by vehicle and equipment loans and leases, as well as dealer floor plan loans.
> Advisory Services provides consulting services, supports high-impact firms, and provides group programs and other services related to business activities.
> Growth & Transition Capital provides subordinate financing by way of flexible debt, with or without convertible features, and equity-type financing.
> Venture Capital provides investments to cover every stage of a technology-based company’s development cycle, from seed funding to expansion. BDC also makes indirect investments via venture capital investment funds.
> Venture Capital Action Plan supports the creation of large private sector-led funds of funds and also assists existing high-performing funds in partnership with institutional investors, corporate strategic investors and interested provinces.
> Cleantech Practice provides subordinate financing and venture capital investments to promising clean technology firms.
The assumptions and methodologies used in BDC’s reporting framework are periodically reviewed by management to ensure they remain valid. The main allocation methods used by BDC are described below.
Notes to the Consolidated Financial StatementsFor the year ended March 31, 2018(in thousands of Canadian dollars)
2018 BDC AR > 106

26. Segmented information (continued)
Interest expense is allocated to each operating segment based on its business portfolio and the capital attributed to the segment. The attribution of capital to BDC’s business segments is maintained in accordance with BDC’s internal capital adequacy assessment process and is consistently aligned to the economic risks of each specific business segment. Refer to Note 23—Capital Management, for more information.
Operating and administrative expenses include costs that were incurred directly by the business segments. Indirect costs incurred at the enterprise level are attributed to each segment using management’s internal reporting framework.
Loan and investment portfolios are managed separately based on BDC’s business segments. None of the other assets or liabilities are managed by segment.
The following tables present financial information regarding the results of each reportable segment.
March 31, 2018
BDC FinancingAdvisoryServices
Growth & Transition Capital
VentureCapital
Venture Capital
Action Plan Cleantech Practice
Interest income 1,355,071 1,269,399 – 85,616 – – 56
Interest expense 143,766 138,357 – 5,394 – – 15
Net interest income (expense) 1,211,305 1,131,042 – 80,222 – – 41
Net realized gains (losses) on investments (19,637) 227 – 4,094 (23,958) – –
Revenue from Advisory Services 19,603 – 19,603 – – – –
Fee and other income 84,612 56,759 175 26,852 512 152 162
Net revenue (loss) 1,295,883 1,188,028 19,778 111,168 (23,446) 152 203
Provision for credit losses (153,539) (153,539) – – – – –
Net change in unrealized appreciation (depreciation) of investments 250,181 210 – (946) 223,929 26,988 –
Net foreign exchange gains (losses) (17,010) (2,948) – (83) (13,877) (102) –
Net gains (losses) on other financial instruments 1,180 1,180 – – – – –
Income (loss) before operating and administrative expenses 1,376,695 1,032,931 19,778 110,139 186,606 27,038 203
Salaries and benefits 392,157 290,957 47,957 32,225 19,241 1,124 653
Premises and equipment 40,309 32,875 3,515 1,984 1,845 68 22
Other expenses 125,966 95,370 19,388 4,756 6,248 105 99
Operating and administrative expenses 558,432 419,202 70,860 38,965 27,334 1,297 774
Net income (loss) 818,263 613,729 (51,082) 71,174 159,272 25,741 (571)
Net income (loss) attributable to:
BDC's shareholder 775,004 613,729 (51,082) 58,813 128,374 25,741 (571)
Non-controlling interests 43,259 – – 12,361 30,898 – –
Net income (loss) 818,263 613,729 (51,082) 71,174 159,272 25,741 (571)
Business segment portfolio as at March 31, 2018
Asset-backed securities 472,695 472,695
Loans 23,728,191 23,728,191
Subordinate financing investments 1,052,352 9,784 1,032,716 9,852
Venture capital investments 1 ,263,111 1,263,111
Venture capital action plan investments 400,516 400,516
Total portfolio 26,916,865 24,210,670 – 1,032,716 1,263,111 400,516 9,852
Notes to the Consolidated Financial StatementsFor the year ended March 31, 2018(in thousands of Canadian dollars)
2018 BDC AR > 107

26. Segmented information (continued)
March 31, 2017
BDC FinancingAdvisoryServices
Growth & Transition Capital
VentureCapital
Venture Capital
Action Plan Cleantech Practice
Interest income 1,169,576 1,094,587 – 74,989 – – –
Interest expense 79,435 75,362 – 4,073 – – –
Net interest income (expense) 1,090,141 1,019,225 – 70,916 – – –
Net realized gains (losses) on investments 6,744 – – 1,839 4,905 – –
Revenue from Advisory Services 20,332 – 20,332 – – – –
Fee and other income 52,096 21,555 103 25,914 4,469 55 –
Net revenue (loss) 1,169,313 1,040,780 20,435 98,669 9,374 55 –
Provision for credit losses (179,545) (179,545) – – – – –
Net change in unrealized appreciation (depreciation) of investments 2,897 (8) – (17,819) 10,192 10,532 –
Net foreign exchange gains (losses) 12,836 1,995 – 53 10,722 66 –
Net gains (losses) on other financial instruments 1,293 1,293 – – – – –
Income (loss) before operating and administrative expenses 1,006,794 864,515 20,435 80,903 30,288 10,653 –
Salaries and benefits 371,417 278,796 42,832 31,576 17,746 467 –
Premises and equipment 40,366 32,765 4,088 1,649 1,810 54 –
Other expenses 130,195 102,287 19,299 3,047 5,505 57 –
Operating and administrative expenses 541,978 413,848 66,219 36,272 25,061 578 –
Net income (loss) 464,816 450,667 (45,784) 44,631 5,227 10,075 –
Net income (loss) attributable to:
BDC's shareholder 465,974 450,667 (45,784) 44,371 6,645 10,075 –
Non-controlling interests (1,158) – – 260 (1,418) – –
Net income (loss) 464,816 450,667 (45,784) 44,631 5,227 10,075 –
Business segment portfolio as at March 31, 2017
Asset-backed securities 518,088 518,088
Loans 21,752,511 21,752,511
Subordinate financing investments 860,448 860,448
Venture capital investments 1,015,713 1,015,713
Venture capital action plan investments 301,541 301,541
Total portfolio 24,448,301 22,270,599 – 860,448 1,015,713 301,541 –
Notes to the Consolidated Financial StatementsFor the year ended March 31, 2018(in thousands of Canadian dollars)
2018 BDC AR > 108

27.Guarantees and contingent liabilities
Financial guarantees
GuaranteesBDC issues “letters of credit, loan guarantees and portfolio guarantees” (guarantees) to support businesses. These guarantees represent BDC’s obligation to make payments to third parties if clients are unable to meet their contractual commitments. Collateral requirements for guarantees are consistent with BDC collateral requirements for loans. The fee income earned is calculated on a straight-line basis over the life of the instrument and recognized in fee and other income in the Consolidated Statement of Income. The maximum contractual obligation under the guarantees totalled $45.5 million as at March 31, 2018 ($341.8 million as at March 31, 2017) and the existing terms expire within 139 months (within 151 months as at March 31, 2017). However, the actual exposure as at March 31, 2018, was $34.4 million ($41.7 million as at March 31, 2017).
These financial guarantees were initially recognized at fair value on the date the guarantees were given. The fair value was considered nil, as all guarantees were agreed to on arm’s-length terms and no initial fee was received. In addition, no receivable for the future expected fees was recognized. Subsequent recognition of a liability will only occur when it becomes more likely than not that a client will not meet its contractual commitments. As at March 31, 2018, and March 31, 2017, there were no liabilities recognized in BDC’s Consolidated Statement of Financial Position related to these guarantees.
Indemnification agreementsIn the ordinary course of business, BDC enters into many contracts that contain indemnification provisions, such as purchase contracts, employment contracts, service agreements and leasing arrangements. In such contracts, BDC may indemnify counterparties to the contracts for certain aspects of BDC’s past conduct if other parties fail to perform, or if certain events occur, such as changes in laws and regulations (including tax legislation), changes in the financial condition of third parties, infringements and breaches of representations and warranties, undisclosed liabilities, and loss caused by the actions of third parties, or as a result of litigation claims by third parties.
These indemnification obligations will vary based upon each contract. In many cases, there are no predetermined amounts or limits included in these contracts, and the occurrence of contingent events that will trigger payment under them is difficult to predict. The nature of these indemnification contracts is such that BDC cannot reasonably estimate the maximum potential future amount that may be payable to counterparties. Historically, BDC has not made any significant payments under these indemnities and there were no significant provisions for indemnities as of March 31, 2018, and March 31, 2017.
Contingent liabilities
Various legal proceedings arising from the normal course of business are pending against BDC. Management believes that should BDC be found liable pursuant to one or more of these proceedings, the aggregate liability resulting from such proceedings would not be material.
Notes to the Consolidated Financial StatementsFor the year ended March 31, 2018(in thousands of Canadian dollars)
2018 BDC AR > 109
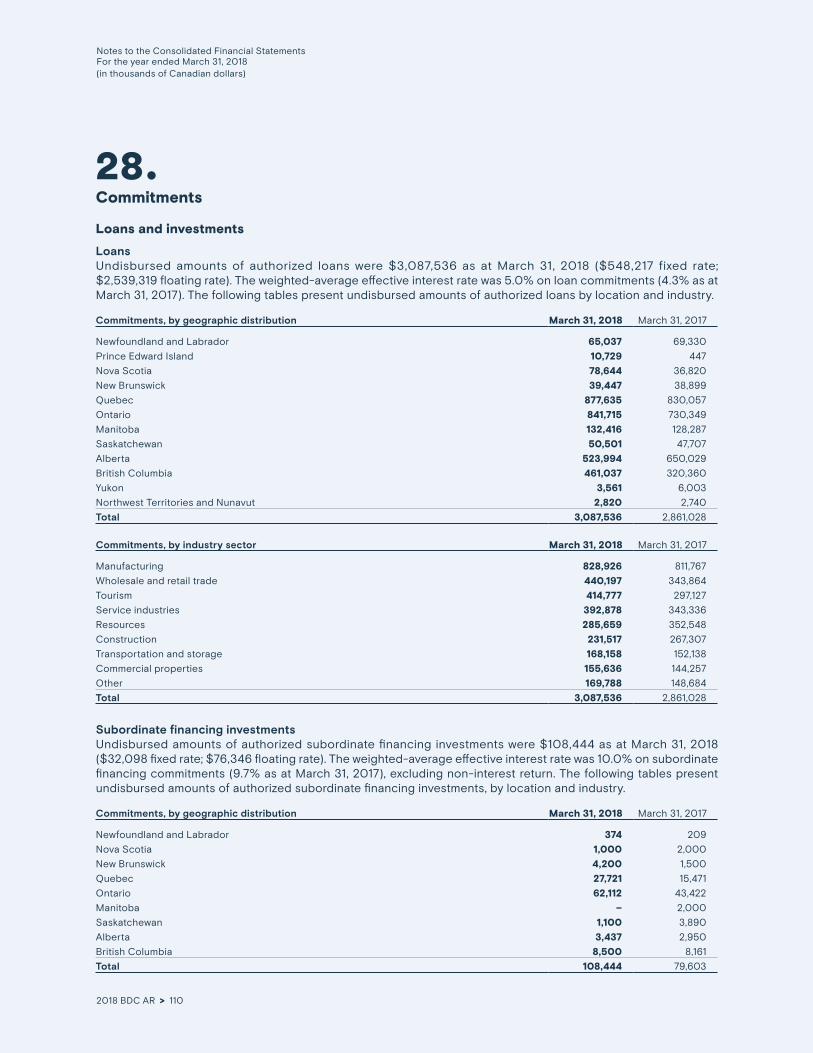
28.Commitments
Loans and investments
LoansUndisbursed amounts of authorized loans were $3,087,536 as at March 31, 2018 ($548,217 fixed rate; $2,539,319 floating rate). The weighted-average effective interest rate was 5.0% on loan commitments (4.3% as at March 31, 2017). The following tables present undisbursed amounts of authorized loans by location and industry.
Commitments, by geographic distribution March 31, 2018 March 31, 2017
Newfoundland and Labrador 65,037 69,330
Prince Edward Island 10,729 447
Nova Scotia 78,644 36,820
New Brunswick 39,447 38,899
Quebec 877,635 830,057
Ontario 841,715 730,349
Manitoba 132,416 128,287
Saskatchewan 50,501 47,707
Alberta 523,994 650,029
British Columbia 461,037 320,360
Yukon 3,561 6,003
Northwest Territories and Nunavut 2,820 2,740
Total 3,087,536 2,861,028
Commitments, by industry sector March 31, 2018 March 31, 2017
Manufacturing 828,926 811,767
Wholesale and retail trade 440,197 343,864
Tourism 414,777 297,127
Service industries 392,878 343,336
Resources 285,659 352,548
Construction 231,517 267,307
Transportation and storage 168,158 152,138
Commercial properties 155,636 144,257
Other 169,788 148,684
Total 3,087,536 2,861,028
Subordinate financing investmentsUndisbursed amounts of authorized subordinate financing investments were $108,444 as at March 31, 2018 ($32,098 fixed rate; $76,346 floating rate). The weighted-average effective interest rate was 10.0% on subordinate financing commitments (9.7% as at March 31, 2017), excluding non-interest return. The following tables present undisbursed amounts of authorized subordinate financing investments, by location and industry.
Commitments, by geographic distribution March 31, 2018 March 31, 2017
Newfoundland and Labrador 374 209
Nova Scotia 1,000 2,000
New Brunswick 4,200 1,500
Quebec 27,721 15,471
Ontario 62,112 43,422
Manitoba – 2,000
Saskatchewan 1,100 3,890
Alberta 3,437 2,950
British Columbia 8,500 8,161
Total 108,444 79,603
Notes to the Consolidated Financial StatementsFor the year ended March 31, 2018(in thousands of Canadian dollars)
2018 BDC AR > 110

28. Commitments (continued)
Loans and investments (continued)
Subordinate financing investments (continued)
Commitments, by industry sector March 31, 2018 March 31, 2017
Manufacturing 44,948 25,748
Services industries 27,895 25,856
Wholesale and retail trade 14,784 12,090
Information industries 7,450 6,059
Construction 6,200 4,900
Tourism 2,750 750
Transportation and storage 2,650 2,100
Resources 1,767 2,100
Total 108,444 79,603
Venture capital investmentsUndisbursed amounts of authorized venture capital direct investments were related to the following industry sectors.
Commitments, by industry sector March 31, 2018 March 31, 2017
Information technology 10,962 1,702
Energy 10,000 –
Electronics 3,570 3,884
Biotechnology and pharmacology 3,150 3,734
Medical and health 2,680 2,433
Communications 1,080 –
Industrial – 318
Total 31,442 12,071
Undisbursed amounts of authorized venture capital funds were $319,885 as at March 31, 2018 ($333,031 as at March 31, 2017).
Venture capital action plan investmentsUndisbursed amounts of authorized venture capital action plan investments were $26,715 as at March 31, 2018 ($99,178 as at March 31, 2017).
Asset-backed securitiesUndisbursed amounts of authorized asset-backed securities were $403,000 as at March 31, 2018 ($427,000 as at March 31, 2017).
Intangible assets
As at March 31, 2018, and March 31, 2017, there were no significant contractual commitments to acquire systems and software.
Property and equipment
As at March 31, 2018, contractual commitments to acquire property and equipment were $4,515 (no significant contractual commitments as at March 31, 2017).
Notes to the Consolidated Financial StatementsFor the year ended March 31, 2018(in thousands of Canadian dollars)
2018 BDC AR > 111

28. Commitments (continued)
Leases
BDC entered into a number of lease agreements to provide office space for its head office and business centres. BDC’s future minimum lease payments and cost for services under operating leases related to the rental of premises are approximately as follows.
March 31, 2018 March 31, 2017
Within 1 year 31,119 29,290
1 to 5 years 91,343 95,222
After 5 years 192,475 203,979
Total 314,937 328,491
During the year, lease payments recognized as an expense amounted to $28.8 million ($27.7 million in 2017). This amount consists of minimum lease payments. No significant sublease payments or contingent rent payments were made or received.
29.Related party transactions
BDC is a Crown corporation that is wholly owned by the Government of Canada and is accountable for its affairs through the Minister of Innovation, Science and Economic Development. BDC is also related to all Government of Canada-created departments, agencies and Crown corporations. BDC enters into transactions with these entities in the normal course of business, under terms and conditions similar to those that apply to unrelated parties.
The defined benefit plans referred to in Note 20—Net Defined Benefit Asset or Liability, are also related parties. BDC’s transactions with these funds include contributions paid to the plans, which are disclosed in Note 20. BDC has no other transactions or balances related to these defined benefit plans.
Borrowings with the Minister of Finance
During the reporting periods, BDC has borrowed funds from Her Majesty the Queen in Right of Canada acting through the Minister of Finance. This borrowing is in accordance with the FAA and the BDC Act and is compliant with (i) BDC’s borrowing plan, which is approved by the Minister of Finance, and (ii) the Crown Borrowing Program Framework.
The following table presents the transactions and outstanding balances related to the borrowings with the Minister of Finance. Refer to Note 19—Borrowings, for additional information on short-term and long-term notes.
Short-term notes Long-term notes Total
2018 2017 2018 2017 2018 2017
Balance at beginning of year 18,808,311 16,846,936 5,606 98,352 18,813,917 16,945,288
Net change in short-term notes 1,665,000 1,961,000 – – 1,665,000 1,961,000
Net changes in accrued interest 6,748 375 (6) (246) 6,742 129
Repayment of long-term notes – – (5,600) (92,500) (5,600) (92,500)
Balance at end of year 20,480,059 18,808,311 – 5,606 20,480,059 18,813,917
During the year, BDC recorded $147.6 million in interest expense related to these borrowings ($81.7 million in 2017). In addition, no borrowings with the Minister of Finance were repurchased in 2018 and 2017.
Notes to the Consolidated Financial StatementsFor the year ended March 31, 2018(in thousands of Canadian dollars)
2018 BDC AR > 112

29. Related party transactions (continued)
Key management personnel
Key management personnel are defined as those officers having authority and responsibility for planning, directing and controlling the activities of BDC, including members of the Board of Directors. The following table presents the compensation expense of key management personnel.
2018 2017
Salaries and short-term employee benefits 6,378 6,094
Post-employment benefits 1,459 1,306
Other long-term benefits 1,232 1,557
Total 9,069 8,957
The following loans or investments were approved by BDC’s Board of Directors. A member of the Board of Directors or a BDC officer either owns an interest in, or is a director or officer of, BDC’s client. Said board member or BDC officer disclosed his or her interest to the board, was not present when the loan or investment was discussed, and, if applicable, did not vote on the resolution of the Board of Directors to approve the related transaction.
Name of client Amount of the loan or investment
Futurpreneur 20,000
IC2 Technologies 100
Total 20,100
Subsidiaries and associates
The relationship between BDC and its subsidiaries meets the definition of a related party. All transactions between the Bank and its subsidiaries have been eliminated on consolidation, and as such are not disclosed as related party transactions.
In the normal course of business, BDC provides certain services to associates, including equity-type financing and investments. These transactions meet the definition of related-party transactions and are made on terms equivalent to those that prevail in arm’s-length transactions.
Notes to the Consolidated Financial StatementsFor the year ended March 31, 2018(in thousands of Canadian dollars)
2018 BDC AR > 113

30.Comparative figures
BDC has reviewed the presentation of foreign exchange gains and losses included in the Consolidated Statement of Income. In addition, realized and unrealized gains (losses) on loans and investments as well as gains and losses on other financial instruments are now presented on a net basis to better reflect their net impact on the Consolidated Statement of Income.
These reclassifications did not have an impact on the income before operating and administrative expenses presented in the Consolidated Statement of Income.
The impact on the Consolidated Statement of Income is as follows:
Consolidated Statement of Income
Year ended March 31, 2017As previously
reportedReclassification -
Foreign exchangeReclassification -
Net basis Reclassified
Fee and other income 54,103 (2,007) – 52,096
Net realized gains (losses) on other financial instruments 2,392 11 (2,403) –
Net unrealized gains (losses) on other financial instruments (1,210) 100 1,110 –
Net gains (losses) on other financial instruments – – 1,293 1,293
Net unrealized foreign exchange gains (losses) on investments 10,940 1,896 (12,836) –
Net foreign exchange gains (losses) – – 12,836 12,836
Total 66,225 – – 66,225
Related comparative information provided in the Notes to the Consolidated Financial Statements were also reclassified.
Notes to the Consolidated Financial StatementsFor the year ended March 31, 2018(in thousands of Canadian dollars)
2018 BDC AR > 114

Corporate Governance
1. Committees 1192. Board of Directors 1233. Senior Management Team 123
2018 BDC AR > 115

At BDC, we have established a robust and effective corporate governance structure to maintain the confidence and trust of our most important stakeholders: entrepreneurs, employees, the public and our shareholder.
We achieve high standards of governance through a clear understanding of our mandate, well-defined roles, strong leadership and alignment of our corporate governance framework from the board level to the operational level.
BDC’s corporate governance frameworkFederal statutes and Treasury Board guidelinesOur principal guidelines derive from three documents. The Business Development Bank of Canada Act sets out BDC’s purpose, powers and mandate. The Financial Administration Act sets out the control regime for Crown corporations, including strategic planning and financial accountability. Finally, BDC’s bylaws prescribe the rules that govern the functioning of the Bank.
We look to the Treasury Board of Canada Secretariat for guidance on public sector governance practices. BDC meets all of the governance standards recommended by Treasury Board. We also regularly benchmark ourselves against corporate governance and risk management best practices in the financial services sector, and update our corporate governance framework as appropriate.
Board governanceOur board sets BDC’s strategic direction and holds senior management accountable for achieving BDC’s statutory mandate while respecting its complementary role. Our board’s mandate, the Board Code of Conduct and board committees’ terms of reference define the board’s corporate governance framework, oversight responsibilities, stewardship role and decision-making authority. The board is composed of dedicated, hard-working directors. Their expertise, integrity and commitment to ethical business conduct allows them to transform principles into action that builds trust among our stakeholders. Together, our directors have the required mix of skills and experience needed to guide management to
deliver on BDC’s mandate. They bring a diverse range of perspectives that helps us support our clients’ goals and aspirations.
The board committees do indepth work in their areas of responsibility and provide regular reports to the board on the activities and performance of the Bank. The board and its committees regularly assess their effectiveness and perform peer-to-peer evaluations. Except for the president and CEO, all board members are independent of management. The segregated roles and responsibilities of the chairperson of the board and the president and CEO reflect best practices. There is extensive communication and collaboration between board members and senior management. The board also holds regular in camera sessions with the heads of the risk oversight functions in the absence of management.
Risk governanceBDC’s core challenge is to carry out its role as a development bank that supports entrepreneurs while prudently managing risk and remaining financially sustainable. The board works closely with management to instill and monitor an appropriate risk culture. BDC continues to refine its risk management framework under the leadership of the chief risk officer who is responsible for the effectiveness of risk management and risk oversight functions.
Transparency and ethicsBDC’s directors, executives and employees are committed to the highest standards of business ethics and corporate governance. Our operations and activities are characterized by an open and ethical governance culture. The Board Code of Conduct and the Employee Code of Conduct, Ethics and Values are regularly updated to ensure they provide ethical guidance at all levels of our organization. They are reinforced by policies on personal trading, disclosure of wrongdoing, anti-fraud, anti-money laundering and anti-terrorism financing. Robust processes are in place to manage conflicts of interest. We have procedures whereby directors and officers declare if they have an interest in a given applicant, BDC client or supplier. The corporate secretary ensures that they recuse themselves and are not present at meetings discussing those files nor do they have access to the materials. Any loan or investment made to a company with respect to which a director or officer has declared an interest and recused himself or herself from the decision-making is approved by a committee of the board. Such transactions are disclosed in
Corporate Governance
2018 BDC AR > 116
BDC’s Annual Report in compliance with the BDC Act. Each year, directors, employees and consultants declare they have read, understood and complied with our codes of conduct.
Government oversightEach year, Parliament receives an update on BDC’s five-year corporate plan, which has been approved by the board, the Treasury Board of Canada Secretariat, and the Minister of Innovation, Science and Economic Development. Parliament also receives BDC’s Annual Report. It contains our financial statements, which have been audited by both the Auditor General of Canada and an external audit firm.
The Office of the Auditor General of Canada does a special examination of BDC at least once every 10 years that goes beyond strictly financial issues to examine systems and practices to ensure that BDC’s operations and resources are efficient and effective. The OAG worked with the board on the plan for the special examination in the summer of 2017 and moved to the execution phase in January of 2018. At 10-year intervals, the Minister of Innovation, Science and Economic Development reviews the provisions and operation of the BDC Act, in consultation with the Minister of Finance. The most recent legislative review was completed in 2014.
Highlights of the yearThe board oversaw the continued transformation of BDC Advisory Services, with a focus on providing mentoring and advisory services to high-impact firms. The board continued to monitor new trends in financing markets and the successful deployment of the Venture Capital Action Plan. It also oversaw the results of a rebranding and advertising strategy that has enhanced awareness of BDC’s brand and increased our reach to more clients across Canada. As well, the corporate compliance team continued to refine its regulatory compliance framework in line with best practices.
The President and CEO, Michael Denham, made progress with the implementation of his priorities. These include developing innovative technological solutions to improve BDC’s service delivery, enhancing the ease of client interactions with BDC and expediting loan approvals; increasing the number of BDC business centres; stimulating innovation in Canadian businesses and encouraging entrepreneurs to invest more in technology; and helping more companies export and grow internationally.
To showcase our own commitment to innovation and technology adoption, BDC progressed its eFirst project to enhance lending platform, the Virtual Business Centre, to support online applications and expedite the loan approval process. Mobile applications were deployed to allow account managers to complete forms at clients’ place of business, saving them from having to come into a BDC business centre. BDC also transformed its work spaces to next generation offices that support enhanced collaboration and communication. This helps BDC attract and retain the employees it needs to fulfill its mandate.
The Increased Reach and Visibility program saw the opening of eight new business centres and 18 new shared offices as well as the relocation of 27 business centres. As a result of these and other visibility efforts over the last three years, BDC’s market penetration rates have increased continuously in every province.
Key governance highlightsDuring the year, the board focused on risk governance and strategy. The chairperson and the Corporate Secretariat worked with the Department of Innovation, Science and Economic Development and the Privy Council Office on the nomination of new directors under the shareholder’s new director nomination process. Five BDC board members chose to reapply under the process and were reappointed. Three new directors were appointed to the board on June 21, 2017. They are Vijay Kanwar, Tracey Scarlett and Brian O’Neil. They bring a wealth of experience with entrepreneurship, venture capital, private equity and financing, and the empowerment of underrepresented groups. Vijay joined the Audit and Board Risk Committees; Tracey joined the Board Risk and Human Resources Committees; and Brian joined the Board Investment, Human Resources Committee and Clean Technology Special Committee.
During the year, the board constituted a working group comprised of five board members and management to examine how to improve access to BDC’s services for under-represented entrepreneurs in response to the shareholder’s prioritization of diversity and inclusion. The first accessibility review working group focused on women and how to make women entrepreneurs more aware of BDC’s services. BDC has since committed to invest $1.4 billion to programs for women entrepreneurs, in addition to support for Women in Tech, investing in women-founded venture capital funds.
Corporate Governance
2018 BDC AR > 117

Corporate Governance
Director Rosemary Zigrossi retired from the board after nine years of service to BDC. She provided invaluable guidance with respect to the venture capital strategy and the effective management of BDC’s pension assets. Her commitment to BDC’s mandate and diligent work translated into meaningful guidance to management. She was extremely hard working, sitting on every standing committee of the Bank at one time or another. Thank you Rosemary for your unwavering commitment to public service and BDC.
We also saw the term of our Chairperson, Samuel L. Duboc, come to an end on January 2, 2018. Sam embraced the mandate of the BDC and brought his vision, dynamism and tenacity to bear in support of Canadian entrepreneurs. Sam ensured BDC understood and responded to the challenges that entrepreneurs face. Under his leadership, the Bank lived up to our innovation message by making focused technology investments. We also expanded our reach in Canada and accelerated our pace of doing business. BDC and Canadian entrepreneurs will continue to reap the benefits of this leadership for years to come. Thank you Sam for your ideas, drive and dedication.
Robert Pitfield served as interim Chairperson from January 2 to March 4, 2018. Rob provided leadership, stability and continuity to enable the Bank to operate seamlessly during the transition. Thank you, Rob.
Our new Chairperson, Mike Pedersen, assumed his responsibilities on March 5, 2018. He brings a wealth of experience in areas where entrepreneurs need it most, in particular, international banking as BDC strives to support the efforts of Canadian entrepreneurs to expand globally. Most recently, he was President and CEO of TD Bank Group’s U.S. retail and commercial banking business. In this role, he was responsible for leading one of America’s top ten banks. Before this, he served as Group Head for TD Bank Group’s global wealth and insurance businesses. He also had long and successful tenures in senior leadership roles at several global banks and significant board experience. He served as Chair of the Canadian Bankers Association in 2000-2001 and has acted as an advisor to various governments.
Board mandateThe board is responsible for the following:
> approving BDC’s strategic direction and corporate plan to meet its public policy mandate
> setting performance targets and monitoring progress
> approving the risk appetite framework, which includes the risk appetite statement, to ensure BDC is identifying and managing its risks properly
> ensuring the highest standards of corporate governance and board effectiveness are respected
> establishing compensation policies and ensuring they are aligned with BDC’s risk appetite
> reviewing and approving management’s succession plan, which includes approving appointments to the senior management team
> setting the president and CEO’s performance objectives and evaluating his performance
> reviewing BDC’s financial matters and internal controls
> overseeing communications and public disclosures
> overseeing BDC’s pension plans, including establishing their funding policies and practices
> approving financing and investment activities beyond management’s authority, and overseeing financial and consulting services
> ensuring the complementarity of BDC’s market approach and activities
2018 BDC AR > 118

Board Risk Committee
ChairpersonRobert H. Pitfield
Number of meetings 14
Members Michael CalyniukVijay KanwarClaude Mc Master Tracey ScarlettMary-Alice Vuicic
This committee’s main duties are as follows:
> review and recommend to the board the risk management framework
> oversee the work of the chief risk officer and the risk oversight functions
> identify and manage BDC’s principal financial, business and operational risks, and oversee the Bank’s risk culture
> regularly review the enterprise risk management policy and other policies concerning key risks, such as credit, market, strategic, reputational, operational and other principal risks
> review and recommend to the board all strategies related to BDC’s material financial offerings
> approve and assess the effectiveness of BDC’s risk appetite statement and monitor compliance with the models and limits contained in it
> review reports and indicators related to BDC’s risk profile regarding enterprise risk management, portfolio risk management, capital management and adequacy, treasury operations risks, and information technology security, including emerging risks and exceptions to the risk appetite statement and policies
> approve the framework for assessing and approving new business activities, products and services, except those related to venture capital
> ensure the effectiveness of stress testing procedures, and review reports on BDC’s risk profile, stress testing processes, and the stress testing methodology, including review of the internal capital adequacy assessment process
> periodically review the business continuity plan
> approve loans and transactions that exceed the delegated authorities of senior management
> review policies and guidelines related to the delegation of authority for all financial products, except venture capital products
Audit Committee
ChairpersonMichael Calyniuk
Number of meetings 6
Members Vijay KanwarNancy M. LairdClaude Mc Master Anne Whelan
This committee promotes an overall corporate culture of quality financial reporting and ethical behaviour. Its main duties are as follows:
> review and advise the board on annual and quarterly financial statements before disclosure in accordance with accounting principles
> review the integrity, adequacy and effectiveness of the internal control framework, information management systems, and, in particular, controls related to major IT, accounting and financial reporting systems
> recommend the appointment and removal of, and succession planning for, the chief audit executive
> oversee the activities and assess the performance of the chief audit executive and the internal audit function
> give advice and recommendations on the appointments and terms of auditors and special examiners
> review the scope and terms of engagement of auditors and special examiners who report directly to the committee and are accountable to the board
> oversee the activities and assess the performance of external auditors
> oversee the activities of the corporate compliance function, including regulatory compliance, and assess its performance
> oversee capital management, allocation and adequacy
> oversee BDC’s standards of integrity and conduct, including the process for disclosing wrongdoing and reports from the ombudsman
> review directors’ and officers’ expenses
2018 BDC AR > 119
➀ Committees
Corporate Governance
Governance/Nominating Committee
ChairpersonRobert H. Pitfield
Number of meetings 6
Members Sandra Bosela Michael CalyniukMary-Alice Vuicic
This committee helps the board fulfill its corporate governance oversight responsibilities. Its main duties are as follows:
> continually review best practices and regulations related to governance in Canada and, if necessary, recommend changes to BDC’s approach
> annually review BDC’s corporate governance policies, including the Board Code of Conduct, and the Employee Code of Conduct, Ethics and Values
> annually assess the board’s compliance with these policies
> monitor procedures established to detect and manage potential conflicts of interest
> regularly review the mandates, structures and memberships of the board and its committees
> develop selection criteria for the president and CEO position
> recommend to the board, for the consideration of the Minister of Innovation, Science and Economic Development, the reappointment of the chairperson of the board, the president and CEO, and members
> retain a search firm to identify candidates for the positions of the chairperson of the board, the president and CEO, and members
> review and annually approve the list of skills directors require
> develop processes to assess the performance of the board, its committees and its members
> ensure that comprehensive director orientation and continuous training programs are in place
Human Resources Committee
ChairpersonMary-Alice Vuicic
Number of meetings 6
Members Sandra Bosela Shahir GuindiBrian O’NeilRobert H. PitfieldTracey Scarlett
This committee’s main duties are as follows:
> assess the “tone at the top” established by senior management regarding integrity and ethics, and review policies for managing personnel effectively
> recommend the human resources strategy—including key human resources objectives, plans and workforce requirements—to the board
> review—and, if appropriate, recommend to the board for approval—any major organizational structure changes, including the president and CEO’s and other committees’ recommendations for appointments of senior management committee members, the chief audit executive, the chief risk officer and the ombudsman
> assess the president and CEO’s objectives, performance, evaluation and benefits
> review compensation for senior executives
> review and approve the design of compensation policies, programs and plans
> approve performance measures and metrics
> receive and examine actuarial evaluation reports and financial statements related to BDC pension plans, as well as recommend funding contributions
> ensure there is a valid succession plan in place for all critical positions, including the chief risk officer and chief audit executive
> assess human resources risks, such as those related to employee attraction, retention, engagement and performance
> recommend to the board funding and design changes to the pension plans
> monitor the funded status of the plans
> recommend the pension plan funds’ financial statements to the board
> advise the board on investment strategies and the asset mix
2018 BDC AR > 120

Corporate Governance
Board Investment Committee
ChairpersonSandra Bosela
Number of meetings 24
Members Shahir GuindiNancy M. LairdBrian O’NeilAnne Whelan
This committee’s duties are as follows:
> regularly review the investment policy, and other policies and processes for investment activities
> review and assess all risks associated with investments and the management thereof
> review all strategies, guardrails and capital allocations for all material investment activities, including venture capital and private equity
> approve the business plans of the three venture capital internal funds, as well as their investment strategies, capital allocation and guardrails
> review strategic initiatives aimed at improving the venture capital ecosystem
> review and recommend delegations of authority
> monitor portfolio performance
> approve investments that exceed the delegated authorities of senior management
Clean Technology Special Committee
ChairpersonSandra Bosela
Number of meetings 5
Members Shahir GuindiNancy M. LairdBrian O’NeilRobert H. Pitfield
This committee’s duties are as follows:
> review the implementation of the Cleantech Practice.
> oversee the performance of the Cleantech Practice portfolio
> approve all transactions until authority is delegated to senior management
> review and assess all risks associated with the Cleantech Practice, the transactions and the management thereof
> review quarterly reports on activities, portfolio performance and capital requirements and usage
Working Group on Accessibility Review
ChairpersonMary-Alice Vuicic
Number of meetings 5
Members Michael CalyniukShahir GuindiNancy M. LairdAnne Whelan
The accessibility review working group was comprised of directors and various members of management. They completed an accessibility review that examined how to improve access to BDC’s services, with a particular focus on women entrepreneurs. They also provided a report to the shareholder and were instrumental in the creation of multiple programs at BDC to support women entrepreneurs.
To see board committees’ mandates, please go to www.bdc.ca.
2018 BDC AR > 121
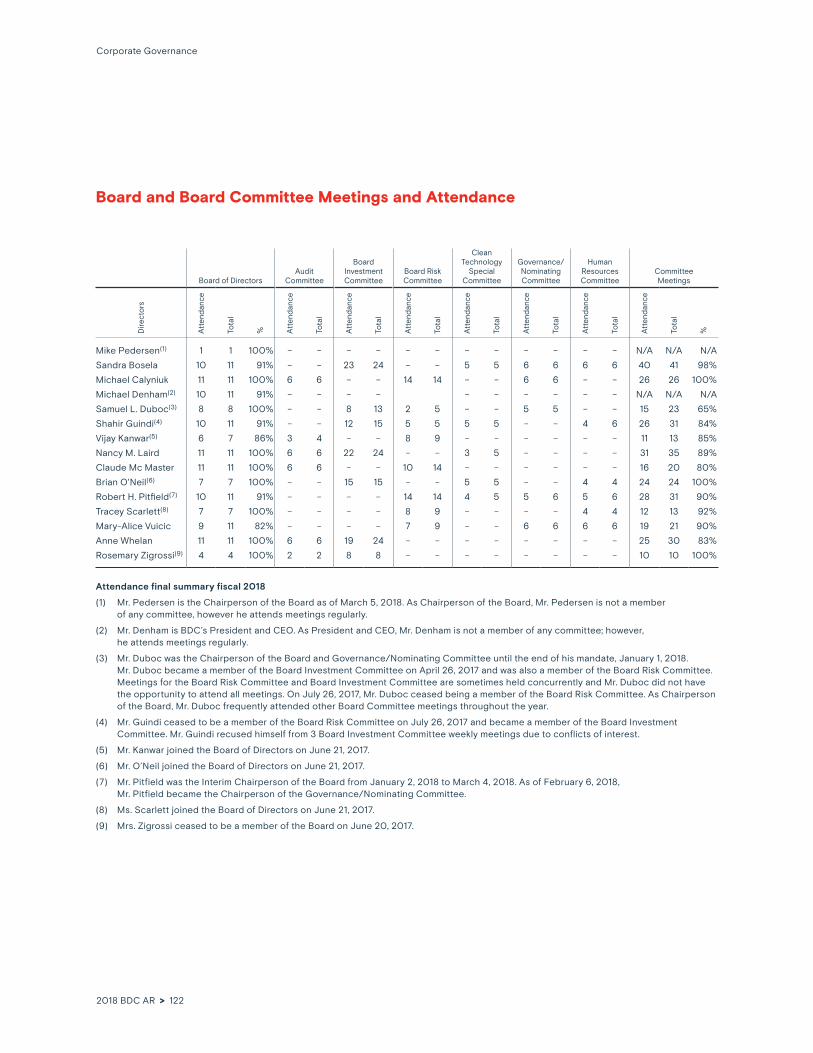
Corporate Governance
Board and Board Committee Meetings and Attendance
Board of DirectorsAudit
Committee
Board Investment Committee
Board Risk Committee
Clean Technology
Special Committee
Governance/Nominating Committee
Human Resources Committee
Committee Meetings
Dire
cto
rs
Att
end
ance
Tota
l
% Att
end
ance
Tota
l
Att
end
ance
Tota
l
Att
end
ance
Tota
l
Att
end
ance
Tota
l
Att
end
ance
Tota
l
Att
end
ance
Tota
l
Att
end
ance
Tota
l
%
Mike Pedersen(1) 1 1 100% – – – – – – – – – – – – N/A N/A N/A
Sandra Bosela 10 11 91% – – 23 24 – – 5 5 6 6 6 6 40 41 98%
Michael Calyniuk 11 11 100% 6 6 – – 14 14 – – 6 6 – – 26 26 100%
Michael Denham(2) 10 11 91% – – – – – – – – – – N/A N/A N/A
Samuel L. Duboc(3) 8 8 100% – – 8 13 2 5 – – 5 5 – – 15 23 65%
Shahir Guindi(4) 10 11 91% – – 12 15 5 5 5 5 – – 4 6 26 31 84%
Vijay Kanwar(5) 6 7 86% 3 4 – – 8 9 – – – – – – 11 13 85%
Nancy M. Laird 11 11 100% 6 6 22 24 – – 3 5 – – – – 31 35 89%
Claude Mc Master 11 11 100% 6 6 – – 10 14 – – – – – – 16 20 80%
Brian O'Neil(6) 7 7 100% – – 15 15 – – 5 5 – – 4 4 24 24 100%
Robert H. Pitfield(7) 10 11 91% – – – – 14 14 4 5 5 6 5 6 28 31 90%
Tracey Scarlett(8) 7 7 100% – – – – 8 9 – – – – 4 4 12 13 92%
Mary-Alice Vuicic 9 11 82% – – – – 7 9 – – 6 6 6 6 19 21 90%
Anne Whelan 11 11 100% 6 6 19 24 – – – – – – – – 25 30 83%
Rosemary Zigrossi(9) 4 4 100% 2 2 8 8 – – – – – – – – 10 10 100%
Attendance final summary fiscal 2018
(1) Mr. Pedersen is the Chairperson of the Board as of March 5, 2018. As Chairperson of the Board, Mr. Pedersen is not a member of any committee, however he attends meetings regularly.
(2) Mr. Denham is BDC’s President and CEO. As President and CEO, Mr. Denham is not a member of any committee; however, he attends meetings regularly.
(3) Mr. Duboc was the Chairperson of the Board and Governance/Nominating Committee until the end of his mandate, January 1, 2018. Mr. Duboc became a member of the Board Investment Committee on April 26, 2017 and was also a member of the Board Risk Committee. Meetings for the Board Risk Committee and Board Investment Committee are sometimes held concurrently and Mr. Duboc did not have the opportunity to attend all meetings. On July 26, 2017, Mr. Duboc ceased being a member of the Board Risk Committee. As Chairperson of the Board, Mr. Duboc frequently attended other Board Committee meetings throughout the year.
(4) Mr. Guindi ceased to be a member of the Board Risk Committee on July 26, 2017 and became a member of the Board Investment Committee. Mr. Guindi recused himself from 3 Board Investment Committee weekly meetings due to conflicts of interest.
(5) Mr. Kanwar joined the Board of Directors on June 21, 2017.
(6) Mr. O’Neil joined the Board of Directors on June 21, 2017.
(7) Mr. Pitfield was the Interim Chairperson of the Board from January 2, 2018 to March 4, 2018. As of February 6, 2018, Mr. Pitfield became the Chairperson of the Governance/Nominating Committee.
(8) Ms. Scarlett joined the Board of Directors on June 21, 2017.
(9) Mrs. Zigrossi ceased to be a member of the Board on June 20, 2017.
2018 BDC AR > 122

To see BDC’s directors’ biographies, please go to www.bdc.ca.
(March 31, 2018)
Mike PedersenChairperson of the BoardBDCToronto, Ontario
Michael DenhamPresident and CEOBDCMontreal, Quebec
Sandra BoselaCo-Head, Managing Director and Global Head Private EquityOPTrust Private Markets GroupToronto, Ontario
Michael CalyniukPresidentMEC Dynamics Inc.Vancouver, British Columbia
Shahir GuindiCo-ChairOsler, Hoskin & Harcourt LLPMontreal, Quebec
Michael DenhamPresident and CEO
Stefano LucarelliExecutive Vice President and Chief Financial Officer
Pierre DubreuilExecutive Vice PresidentFinancing
Peter LawlerExecutive Vice PresidentBDC Advisory Services
Jérôme NyczExecutive Vice PresidentBDC Capital
Vijay KanwarPresidentKMH Cardiology and Diagnostic Centres Inc.
Founder and PresidentLambardar Inc. Mississauga, Ontario
Nancy M. LairdCorporate DirectorCalgary, Alberta
Claude Mc MasterPresident and CEO D-BOX Technologies Inc.Longueuil, Quebec
Brian O’NeilManaging PartnerA Faire Aujourd’hui Inc. Toronto, Ontario
Robert H. PitfieldExecutive Chairman of the BoardTravelEdge GroupToronto, Ontario
Christopher RankinExecutive Vice President and Chief Risk Officer
Stéphane BilodeauSenior Vice President and Chief Information Officer
Michel BergeronSenior Vice President Marketing and Public Affairs
Mary KaramanosSenior Vice PresidentHuman Resources
François LecavalierSenior Vice PresidentCorporate Development
Louise ParadisSenior Vice PresidentLegal Affairs andCorporate Secretary
Tracey ScarlettCorporate DirectorEdmonton, Alberta
Mary-Alice VuicicChief People OfficerThomson ReutersToronto, Ontario
Anne WhelanPresident and CEOSeafair Capital Inc.St. John’s, Newfoundland and Labrador
Corporate Governance
(March 31, 2018)
To see BDC’s senior management team members’ biographies, please go to www.bdc.ca.
➁
➂
Board of Directors
Senior Management Team
2018 BDC AR > 123

Additional Information
Five-Year Operational and Financial Summary
Operational Statistics 2018 2017 2016 2015 2014
Loans Committed to clients(1)
as at March 31 Amount 27,651,518 25,766,208 23,013,157 21,256,479 19,723,747
Number of clients 43,982 39,203 34,428 32,213 29,929
Acceptances
Amount 6,810,666 6,620,880 4,800,062 4,711,675 4,102,065
Number 17,557 16,432 14,434 12,012 10,976
Subordinate Financing(includes both BDC and Caisse portion)Committed to clients(1)
as at March 31 Amount 1,186,167 953,833 816,452 706,866 636,277
Number of clients 640 594 537 471 427
Acceptances
Amount 456,908 320,527 259,060 231,514 186,606
Number 200 180 174 177 126
Venture CapitalCommitted to clients(1)
as at March 31 Amount 1,274,179 1,230,005 1,178,321 1,026,967 861,881
Number of clients 247 253 235 209 183
Authorizations
Amount 188,277 160,812 253,086 185,421 154,754
Number 67 91 130 101 94
Asset-backed securitiesAmount committed to clients(1)
as at March 31 880,000 945,000 805,000 630,000 530,000
Amount authorized (cancelled) and renewed (65,000) 140,000 575,000 100,000 (175,000)
Venture Capital Action Plan
Commited to clients(1)
as at March 31
Amount 389,984 390,358 390,159 324,746 210,000 Number of clients 8 8 8 8 5
Authorizations
Amount – – 64,976 114,845 210,000
Number – – – 3 5
BDC
Total committed to clients 31,381,848 29,295,404 26,203,089 23,945,058 21,961,905
(1) Amount committed to clients represents portfolio outstanding and amount undisbursed, at cost.
(2) Amount cancelled includes $60,000 of authorizations and $125,000 of cancellations in fiscal 2018; $25,000 of authorizations and $200,000 of cancellations in fiscal 2014.
(2) (2)
for the years ended March 31 (in thousands of Canadian dollars)
2018 BDC AR > 124

Additional Information
Financial Information 2018 2017 2016 2015 2014
Net Income and Comprehensive Income – by Business Segments(1)
for the years ended March 31
Financing 613,729 450,667 444,879 457,393 439,655
Advisory Services (51,082) (45,784) (31,569) (24,245) (16,855)
Growth & Transition Capital 71,174 44,631 53,697 38,525 23,305
Venture Capital 159,272 5,227 67,440 23,268 (12,075)
Venture Capital Action Plan 25,741 10,075 3,284 (4,251) (1,418)
Cleantech Practice (571) – – – –
Net income 818,263 464,816 537,731 490,690 432,612
Net income attributable to:
BDC's shareholder 775,004 465,974 535,448 490,516 425,968
Non-controlling interests 43,259 (1,158) 2,283 174 6,644
Net income 818,263 464,816 537,731 490,690 432,612
Other comprehensive income (loss)(2) (40,532) 71,702 (43,653) (30,247) 49,633
Total comprehensive income 777,731 536,518 494,078 460,443 482,245
Total comprehensive income attributable to:
BDC's shareholder 734,472 537,676 491,795 460,269 475,601
Non-controlling interests 43,259 (1,158) 2,283 174 6,644
Total comprehensive income 777,731 536,518 494,078 460,443 482,245
Financial Position Information
as at March 31
Asset-backed securities 472,695 518,088 509,758 407,731 336,477
Loans, net of allowance for credit losses 23,728,191 21,752,511 19,717,706 18,414,044 17,241,064
Subordinate financing investments 1,052,352 860,448 751,404 642,810 576,677
Venture Capital investments 1,263,111 1,015,713 928,000 709,639 495,096
Venture Capital Action Plan investments 400,516 301,541 137,668 47,643 5,169
Total assets 27,809,166 25,316,765 22,905,903 21,129,017 19,569,957
Total liabilities 21,049,963 19,377,470 17,556,384 16,349,896 15,179,908
Total equity attributable to:
BDC’s shareholder 6,716,472 5,917,500 5,323,473 4,744,566 4,338,910
Non-controlling interests 42,731 21,795 26,046 34,554 51,139
Total equity 6,759,203 5,939,295 5,349,519 4,779,120 4,390,049
(1) For detailed information on fiscal 2018 and fiscal 2017 segmented information, please also refer to Note 26—Segmented information to the Consolidated Financial Statements.
(2) For detailed information on fiscal 2018 and fiscal 2017 Other comprehensive income, please refer to Consolidated Statement of Comprehensive Income (p. 50).
(in thousands of Canadian dollars)
2018 BDC AR > 125

Additional Information
Acceptance – The point at which the client has agreed to the authorized financing terms and conditions that BDC has offered him or her. Client acceptance follows BDC authorization. (Information on acceptances disclosed in this report is net of cancellations or reductions after client acceptance.)
Allowance for credit losses – Represents an amount that management deems adequate to fully provide for impairment in the existing loan portfolio. Allowance for credit losses can be individual or collective, and is recorded on the financial position as a deduction from loans.
Asset-backed securities – Securities created through the securitization of a pool of assets. For example, BDC’s securitization contains Canadian AAA-rated term securities backed by loans and leases on vehicles and equipment, as well as dealer floor plan loans.
Authorization – The point at which BDC has completed its due diligence and approved the financing request or venture capital investment. Authorization precedes acceptance. (Information on authorizations disclosed in this report is net of cancellations or reductions after BDC authorization.)
Collective allowance – Established by management to recognize credit losses in the existing performing loan portfolio that have occurred as at the financial position date but have not yet been specifically identified on an individual loan basis.
Cross-currency swaps – Agreements to exchange payments in different currencies over pre-determined periods of time.
Debt-to-equity ratio – A measure to ensure BDC operates within its statutory limitations on debts, calculated as the aggregate of borrowings and contingent liabilities over the equity attributable to BDC’s shareholder. It also includes preferred shares classified as liabilities, and excludes accumulated other comprehensive income or loss. The statutory limit of BDC’s debt-to-equity ratio is 12:1.
Derivative financial instruments – Contracts whose value is “derived” from movements in interest or foreign exchange rates, or equity or commodity prices. Use of derivatives allows for the transfer, modification or reduction of current or expected risks from changes in rates and prices.
Direct investments – Investments BDC makes directly in investee companies.
Fair value – The price that knowledgeable, willing parties—under no compulsion to act—would agree to in an arm’s-length transaction. Fair value represents management’s best estimate of the net worth of an investment at the financial position date and may not reflect the ultimate realizable value upon disposal of the investment.
Financing efficiency ratio – A measure of the efficiency with which BDC incurs expenses to generate income on its financing operations. It is calculated as operating and administrative expenses, as a percentage of net interest and other income. Other income includes fee income and net realized gains or losses on other financial instruments. A lower ratio indicates improved efficiency.
Hedging – A risk management technique used to insulate financial results from market, interest rate or foreign currency exchange risk (exposure) arising from normal banking operations.
Impaired loans – Loans are deemed impaired when the interest or principal of the loan is in arrears for three consecutive months or more or if there is reason to believe that a portion of the principal or interest cannot be collected.
Individual allowance – An allowance that management establishes to recognize credit losses in the existing loan portfolios that have occurred and are identified on an individual loan basis, as at the financial position date.
Interest rate swaps – Agreements to exchange streams of interest payments—typically, one at a floating rate and the other at a fixed rate—over a specified period, based on notional principal amounts.
Master netting agreement – A standard bilateral contract that enables trading counterparties to agree to net collateral requirements and, in a close-out situation, settlement amounts related to underlying master trading contracts for sales and purchases of financial instruments. The master netting agreement offsets positive balances of one transaction with negative balances of another.
Net change in unrealized appreciation or depreciation of investments – Amount included in income resulting from movements in the fair value of investments for the period.
Net interest income – The difference between interest revenues generated by interest-bearing portfolios, as well as cash equivalents and securities, and the cost of borrowings to fund these assets.
Net realized gains or losses on investments – Gains realized, net of realized capital losses, upon sale or write-off of investments, excluding the net change in unrealized appreciation or depreciation of venture capital and subordinate financing investments.
Net realized gains or losses on other financial instruments – Amounts that are related to structured notes and their associated derivatives. Realized gains or losses occur when financial instruments are repurchased prior to maturity at a price higher or lower than the original purchase price.
Net unrealized gains or losses on other financial instruments – Amounts that are related to structured notes and their associated derivatives. These represent the amounts included in income resulting from movements in the fair value of financial instruments for the period.
Non-controlling interest – The equity in a subsidiary not attributable, directly or indirectly, to BDC.
Performing portfolio – Loans for which there is reasonable assurance that BDC can collect the principal and interest on time.
Provision for credit losses – A charge to income that represents an amount that management deems adequate to fully provide for impairment in the existing loan portfolios, given the composition of the loan portfolios, the probability of default on the loans, the economic environment and the allowance for credit losses already established.
Return on common equity (ROE) – Net income, less preferred share dividends, expressed as a percentage of average common equity. It excludes other comprehensive income or loss on post-employment benefits, accumulated other comprehensive income or loss, and non-controlling interest.
Revenue from Advisory Services – Fees from services provided by BDC’s national network of consultants to assess, plan and implement management solutions.
Start-up – A business that is being established for the first time. Also included in this category are existing enterprises that have not yet registered 12 consecutive months of sales.
Subordinate financing – A hybrid instrument that brings together some features of both debt financing and equity financing.
Glossary
2018 BDC AR > 126

CG
3 in
c. |
Co
mm
unic
atio
ns |
Gra
ph
ism
elu
l30
-20
18E
-PD
F
Ce
do
cum
ent
est
aus
si d
isp
oni
ble
en
fran
çais
.IS
SN
14
95
-672
1

bdc.ca