2017 sn analyst & investor day presentation - january 23, 2017
TRANSCRIPT

www.sanchezenergycorp.com
Results Driven. Manufacturing Focused.
SN Analyst & Investor Day January 23, 2017 January 23, 2017

© 2017 Sanchez Energy Corporation
2
Legal DisclaimersComanche Asset Acquisition The “Comanche asset acquisition” refers to the transaction contemplated by the purchase and sale agreement Sanchez Energy Corporation (“Sanchez Energy”, “SN” or the “Company”) enteredinto with an entity controlled by The Blackstone Group L.P. (“Blackstone”) and Anadarko E&P Onshore LLC and Kerr‐McGee Oil & Gas Onshore LP (“Anadarko”), on January 12, 2017 (the “Purchase Agreement”), which isexpected to close in the first quarter of 2017. The consummation of the Comanche asset acquisition is subject to certain closing conditions, including conditions that must be met by Anadarko and which are beyond SanchezEnergy’s control. In addition, under certain circumstances, Sanchez Energy, Blackstone or Anadarko is able to terminate the Purchase Agreement. There can be no assurances that the Comanche asset acquisition will beconsummated in the anticipated timeframe, on the terms described herein, or at all.Our estimated reserve information includes that of Sanchez Energy and, unless otherwise stated, the reserves to be acquired in the Comanche asset acquisition. Unless otherwise stated, this presentation gives pro formaeffect to the completion of the Comanche asset acquisition and all references in this presentation to (i) reserves as of year‐end 2016 or 2016 and (ii) acreage, drilling locations, operational and production information as ofyear‐end 2016, 2016 or later are pro forma for the Comanche asset acquisition, except for where context indicates otherwise, which do not give pro forma effect to the Comanche asset acquisition.
Forward Looking Statements This presentation contains, and our officers and representatives may from time to time make, “forward‐looking statements” within the meaning of the safe harbor provisions of the PrivateSecurities Litigation Reform Act of 1995. All statements, other than statements of historical facts, included in this presentation that address activities, events, conditions or developments that Sanchez Energy expects,estimates, believes or anticipates will or may occur or exist in the future are forward‐looking statements. These statements are based on certain assumptions made by the Company based on management’s experience,perception of historical trends and technical analyses, current conditions, anticipated future developments and other factors believed to be appropriate and reasonable by management. When used in this presentation, wordssuch as “will,” “potential,” “believe,” “estimate,” “intend,” “expect,” “may,” “should,” “anticipate,” “could,” “plan,” “predict,” “project,” “profile,” “model,” “strategy,” “future” or their negatives or the statements that includethese words or other words that convey the uncertainty of future events or outcomes, are intended to identify forward‐looking statements, although not all forward‐looking statements contain such identifying words. Inparticular, statements, express or implied, concerning Sanchez Energy’s future operating results and returns, Sanchez Energy’s strategy and plans or view of the market, or Sanchez Energy’s ability to replace or increasereserves, increase production, generate income or cash flows, and reduce leverage ratios are forward‐looking statements. Forward‐looking statements are not guarantees of performance. Such statements are subject to anumber of assumptions, risks and uncertainties, many of which are beyond our control. Although Sanchez Energy believes that the expectations reflected in its forward‐looking statements are reasonable and are based onreasonable assumptions, no assurance can be given that these assumptions are accurate or that any of these expectations will be achieved (in full or at all) or will prove to have been correct. Important factors that could causeSanchez Energy’s actual results to differ materially from the expectations reflected in its forward‐looking statements include, among others: Sanchez Energy’s ability to successfully execute its business and financial strategies;the timing and extent of changes in prices for, and demand for, crude oil and condensate, natural gas liquids, natural gas and related commodities; Sanchez Energy’s ability to utilize the services personnel and other assets ofSanchez Oil and Gas pursuant to existing services agreements; Sanchez Energy’s ability to replace the reserves it produces through drilling and property acquisitions; Sanchez Energy’s ability to successfully close the Comancheasset acquisition; the realized benefits of Sanchez Energy’s various acquisitions and the liabilities assumed in connection with these acquisitions, including the Comanche asset acquisition; the realized benefits of SanchezEnergy’s ventures; the realized benefits of Sanchez Energy’s transactions with Sanchez Production Partners LP; the realized benefits of Sanchez Energy’s partnership with Blackstone; the extent to which Sanchez Energy’sdrilling plans are successful in economically developing its acreage in, and to produce reserves and achieve anticipated production levels from, its existing and future projects; the accuracy of reserve estimates, which by theirnature involve the exercise of professional judgment and may therefore be imprecise; the extent to which Sanchez Energy can optimize reserve recovery and economically develop its plays utilizing horizontal and verticaldrilling, advanced completion technologies and hydraulic fracturing; Sanchez Energy’s ability to successfully execute its hedging strategy and the resulting realized prices therefrom; The credit worthiness and performance ofour counterparts including financial institutions, operating partners and other parties; competition in the oil and gas exploration and production industry for employees and other personnel, equipment, materials and servicesand, related thereto, the availability and cost of employees and other personnel, equipment, materials and services; Sanchez Energy’s ability to access the credit and capital markets to obtain financing on terms it deemsacceptable, if at all, and to otherwise satisfy its capital expenditure requirements; the availability, proximity and capacity of, and costs associated with, gathering, processing, compression and transportation facilities; SanchezEnergy’s ability to compete with other companies in the oil and natural gas industry; the impact of, and changes in, government policies, laws and regulations, including tax laws and regulations, environmental laws andregulations relating to air emissions, waste disposal, hydraulic fracturing and access to and use of water, laws and regulations imposing conditions and restrictions on drilling and completion operations and laws andregulations with respect to derivatives and hedging activities; developments in oil‐producing and natural‐gas producing countries, the actions of the Organization of Petroleum Exporting Countries and other factors affectingthe supply of oil and natural gas; Sanchez Energy’s ability to effectively integrate acquired crude oil and natural gas properties into its operations, fully identify existing and potential problems with respect to such propertiesand accurately estimate reserves, production and costs with respect to such properties; unexpected results of litigation filed against Sanchez Energy; the extent to which Sanchez Energy’s crude oil and natural gas propertiesoperated by others are operated successfully and economically; the use of competing energy sources and the development of alternative energy sources; the extent to which Sanchez Energy incurs uninsured losses andliabilities or losses and liabilities in excess of its insurance coverage; and the other factors described under ITEM 1A, “Risk Factors,” in Sanchez Energy’s Annual Report on Form 10‐K for the fiscal year ended December 31, 2015and any updates to those factors set forth in its subsequent Quarterly Reports on Form 10‐Q or Current Reports on Form 8‐K.In light of these risks, uncertainties and assumptions, the events anticipated by Sanchez Energy’s forward‐looking statements may not occur, and, if any of such events do, Sanchez Energy may not have correctly anticipated thetiming of their occurrence or the extent of their impact on its actual results. Accordingly, you should not place any undue reliance on any of Sanchez Energy’s forward‐looking statements. Any forward‐looking statement speaksonly as of the date on which such statement is made and Sanchez Energy undertakes no obligation to correct or update any forward‐looking statement, whether as a result of new information, future events or otherwise,except as required by applicable law.
Oil and Gas Reserves The Securities and Exchange Commission (“SEC”) requires oil and gas companies, in their filings with the SEC, to disclose “proved oil and gas reserves” (i.e., quantities of oil and gas that are estimated withreasonable certainty to be economically producible) and permits oil and gas companies to disclose “probable reserves” (i.e., quantities of oil and gas that are as likely as not to be recovered) and “possible reserves” (i.e.,additional quantities of oil and gas that might be recovered, but with a lower probability than probable reserves). We may use certain terms in this presentation, such as “resource potential” or “EURs” that the SEC’s guidelinesstrictly prohibit us from including in filings with the SEC. The calculation of resource potential, EURs and any other estimates of reserves and resources that are not proved, probable or possible reserves are not necessarilycalculated in accordance with SEC guidelines. Investors are urged to consider closely the disclosure in Sanchez Energy’s Annual Report on Form 10‐K for the fiscal year ended December 31, 2015.
Non‐GAAP Measures Included in this presentation are certain non‐GAAP financial measures as defined under Securities and Exchange Commission Regulation G. Investors are urged to consider closely the disclosure in SanchezEnergy’s Annual Report on Form 10‐K for the fiscal year ended December 31, 2015, Quarterly Reports on Form 10‐Q and Current Reports on Form 8‐K and the reconciliation to GAAP measures provided in this presentation.

© 2017 Sanchez Energy Corporation
Time Topic Presenter9:00 a.m. – 9:25 a.m. Executive Summary Tony Sanchez, III, CEO
Eduardo Sanchez, President
9:25 a.m. – 9:45 a.m. Competitive AdvantagesSections 1‐2
Eduardo Sanchez, PresidentChris Heinson, SVP, COO
9:45 a.m. – 9:50 a.m. Q&A
9:50 a.m. – 10:00 a.m. Break
10:00 a.m. – 11:10 a.m. Asset Detail Section 4
Chris Heinson, SVP, COOSteve Adam, SVP, OperationsWill Satterfield, SVP, Asset Development
11:10 a.m. – 11:20 a.m. Q&A
11:20 a.m. – 11:30 a.m. Financial ProjectionsSection 5
Howard Thill, EVP, CFO
11:30 a.m. – 11:45 a.m. Q&A
12:00 p.m. Lunch
2017 Analyst Day Agenda
3

© 2017 Sanchez Energy Corporation
Sanchez Energy: Transformation in 2016…
4
Along with Blackstone, agreed to acquire Anadarko’s Eagle Ford acreage
$2.3 Billion Comanche AcquisitionWill acquire 300 MMBoe of proved reserves and ~67,000 Boe/d in the Eagle Ford
Organically Leased Additional 110,000 Net Eagle Ford AcresComplementary to existing acreage position
Announced ~$300 MM of DivestituresDivested midstream assets and non‐core Eagle Ford acreage
Factory Model Based on Robust Manufacturing ProcessesWell cost reduction of over 60% and increased EURs
2016
Note: Comanche acquisition was signed and announced on 1/12/2017

© 2017 Sanchez Energy Corporation
…Leads to Creation of Shareholder Value
3 yr. Projected Production CAGR Over 30%
EBITDA Projected to More Than Double by 2018
Leverage Ratio Reduced to Less Than 3.0x in 2018
On the Path To Generate Significant Free Cash Flow in 2018 and Beyond
Results in the ability to deliver both free cash flow and production growth
Improves the balance sheet at a quick pace
Provides flexibility to pursue additional opportunities for growth
5

© 2017 Sanchez Energy Corporation
Eagle Ford Shale – Focusing on Western Part of the Play
6
Large Play with
Multiple Benches
Western Eagle Ford is roughly 7,000 square miles within the oil to dry gas window
At least 4 distinct benches with significant development potential in the Lower, Middle, Upper Eagle Ford and Lower Austin Chalk
Strategic Location
Direct access to Gulf Coast markets and potential export to Mexico
No midstream bottlenecks or takeaway issues
Impressive Drilling Rate of Returns
Flow rates significantly increasing with improved completion techniques that continue to evolve
Drilling rate of returns that have been in excess of 50%
Western Eagle Ford Multi‐Bench Formation
Catarina
Javelina
Maverick
Comanche

© 2017 Sanchez Energy Corporation
0
100,000
200,000
300,000
400,000
500,000
600,000
Net Eagle Ford Acres
Top 15 Eagle Ford Acreage Positions(1)
Sanchez Energy – Building Asset Base in 2016
7
YE 2015: ~200,000 Net Eagle Ford Acres
Current Position ~585,000 Gross (~335,000 Net) Operated EF Acres
Through a series of strategic initiatives, Sanchez Energy is now one of the
largest operators in the basin, focused on multiple‐bench development in the
Western Eagle Ford
(1) RBC Capital Markets Research Report 1/3/17
SN Added ~170,000 Net Acres

© 2017 Sanchez Energy Corporation
Comanche Acquisition Compliments Strength of Asset Base…
8*Price Deck: 12/30/2016 Strip; NGLs 30% WTI; Prices held flat subsequent to 2021NPV10= Future Projected Cash Flows discounted at 10%; See “Legal Disclaimers – Non‐GAAP Measures” and “Non‐GAAP Reconciliation and Measures”.
Inventory of over 4,000 High Rate of Return Net Drilling Locations
Catarina
Javelina
Maverick
Comanche
Comanche Net Drilling Locations ~1,000 3‐Stream EUR (MBoe) ~625Est. Capital Cost ($MM) $3.2 IRR (%)* 70‐100%+NPV10 / Well($M)* $3,079 ‐ $5,247
CatarinaNet Drilling Locations 1,400+3‐Stream EUR (MBoe) 600 – 1,150 Est. Capital Cost ($MM) $3.2IRR (%)* 45‐100%+NPV10 / Well($M)* $2,247 ‐ $4,546
Javelina
Net Drilling Locations 300+
3‐Stream EUR (MMcfe) 12,000
Est. Capital Cost ($MM) $6.0 ‐ $7.5
MaverickNet Drilling Locations ~1,0003‐Stream EUR (MBoe) 350 Est. Capital Cost ($MM) $3.0IRR (%)* 60‐80%NPV10 / Well($M)* $3,371

© 2017 Sanchez Energy Corporation
AreaNet Producing +
DUC WellsNet Engineered Locations(1)
Net Contingent Locations(2)
Total Net Undrilled Wells
Total Net Locations
Comanche 392 832 162 994 1,386Catarina 333 846 626 1,472 1,805Maverick 47 522 480 1,002 1,049Javelina 0 170 170 340 340Palmetto 18 153 77 230 248Other 75 134 9 143 218Total 865 2,657 1,524 4,181 5,046
AreaNet Producing Well & DUC
Value
Net Engineered Locations(1)
Net Contingent Locations(2)
Total Net Undrilled Locations
Total Value
Comanche $922 $1,448 $222 $1,670 $2,592Catarina $482 $1,205 $139 $1,344 $1,826Maverick $89 $765 $189 $954 $1,043Javelina ‐ $384 $217 $601 $601Palmetto $8 $410 $121 $531 $539Other $44 $117 $7 $124 $168
PDP + Development Value $1,545 $4,329 $895 $5,224 $6,769Grand Total $6,769
Location Summary
Net Present Value at 12/30/16 Strip ($MM)(3)
9
…And Drives Strong Net Asset Value
Location Counts and Values as of 12/31/2016 for Legacy Assets and 3/1/2017 for the Comanche AssetPrice Deck: 12/30/16 Strip; Assumes NGL Pricing @ 30% of WTIDoes not include Prospective Locations(1) Engineered Locations – SEC Proved locations + locations that are geologically un‐risked but do not qualify as SEC PUDs due to factors such as assumed drill timing(2) Contingent Locations – Drilling Locations have between a 75% and 90% chance of being commercially economic at the assumed price deck (3) Net Present Value = Future Projected Cash Flows discounted at 10%; See “Legal Disclaimers – Non‐GAAP Measures” and “Non‐GAAP Reconciliation and Measures”.

© 2017 Sanchez Energy Corporation
59
135 128
~190
~340
0
50
100
150
200
250
300
350
2013 2014 2015 2016E PF 2016
(MMBo
e)
Proved Developed Proved Undeveloped
10
Sanchez Energy Transformation Snapshot
Net Acreage Position
SN ProductionProved Reserves
Net Drilling Locations*
*Location counts do not include prospective locations All pro forma 2016 and 2017E information assumes closing of the Comanche acquisition
2017 Focus on Converting PUDs & PDNP to PDP
138,977
273,432 262,371
324,661
397,314
‐
50,000
100,000
150,000
200,000
250,000
300,000
350,000
400,000
450,000
2013 2014 2015 2016E PF 2016
Net Acres
Eagle Ford Non‐EF
1,700 2,000
2,275
3,187
4,181
‐
500
1,000
1,500
2,000
2,500
3,000
3,500
4,000
4,500
2013 2014 2015 2016E PF 2016
Net Locations
9,100
30,430
52,524 ~53,000
~80,000
0
10,000
20,000
30,000
40,000
50,000
60,000
70,000
80,000
90,000
2013 2014 2015 2016E 2017E
Boe/d
© 2017 Sanchez Energy Corporation
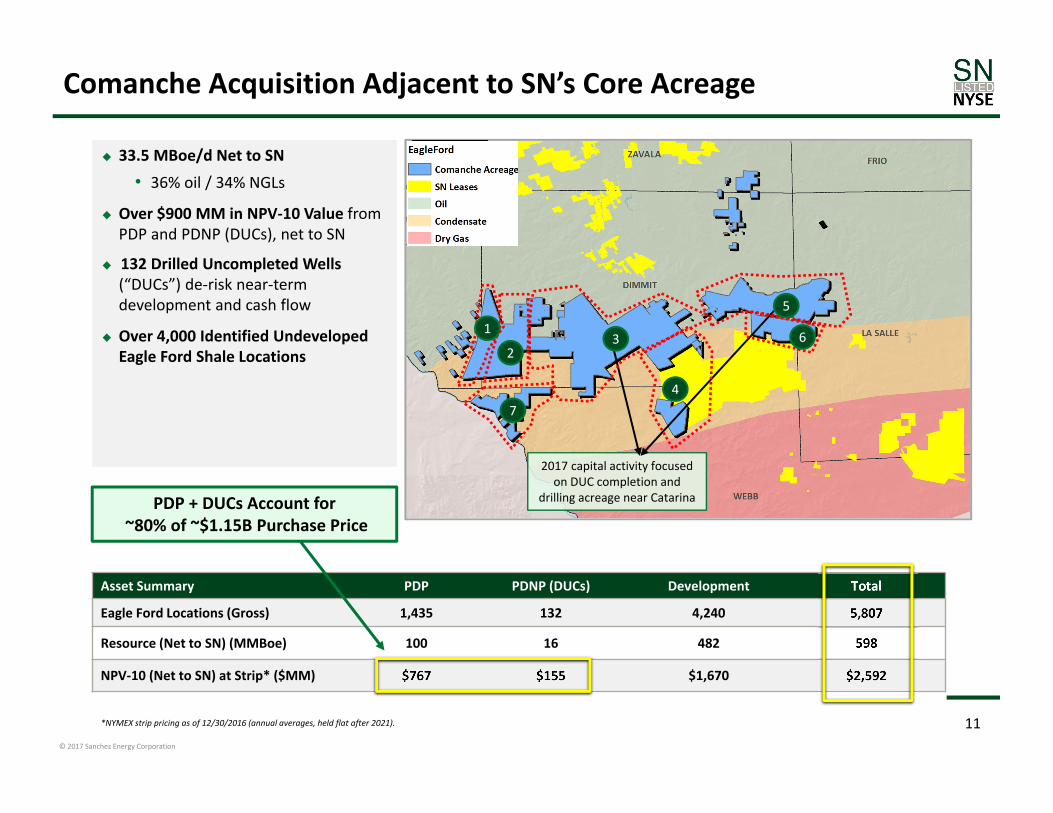
Asset Summary PDP PDNP (DUCs) Development Total
Eagle Ford Locations (Gross) 1,435 132 4,240 5,807
Resource (Net to SN) (MMBoe) 100 16 482 598
NPV‐10 (Net to SN) at Strip* ($MM) $767 $155 $1,670 $2,592
33.5 MBoe/d Net to SN
• 36% oil / 34% NGLs
Over $900 MM in NPV‐10 Value from PDP and PDNP (DUCs), net to SN
132 Drilled Uncompleted Wells (“DUCs”) de‐risk near‐term development and cash flow
Over 4,000 Identified Undeveloped Eagle Ford Shale Locations
*NYMEX strip pricing as of 12/30/2016 (annual averages, held flat after 2021). 11
Comanche Acquisition Adjacent to SN’s Core Acreage
2017 capital activity focused on DUC completion and
drilling acreage near Catarina
1
26
47
5
3
PDP + DUCs Account for~80% of ~$1.15B Purchase Price

© 2017 Sanchez Energy Corporation
12
Strategic Joint Venture Facilitates Comanche Acquisition
See press release issued on 1/12/2017 for additional information
Repeatable Structure – Matches Cash Flow with Appropriate Financing
Comanche Eagle Ford Assets
Blackstone Energy Partners
50% of Assets$1.15 billion
Sanchez Energy
50% of Assets$1.15 billion
Non‐Recourse Unrestricted Subsidiary$750 million100% PDP
40% DUCs & PUD+ Preferred Equity
Restricted Subsidiary$400 million
60% DUCs & PUD+
Non‐Recourse RBL
Comanche Eagle Ford Assets
© 2017 Sanchez Energy Corporation
13
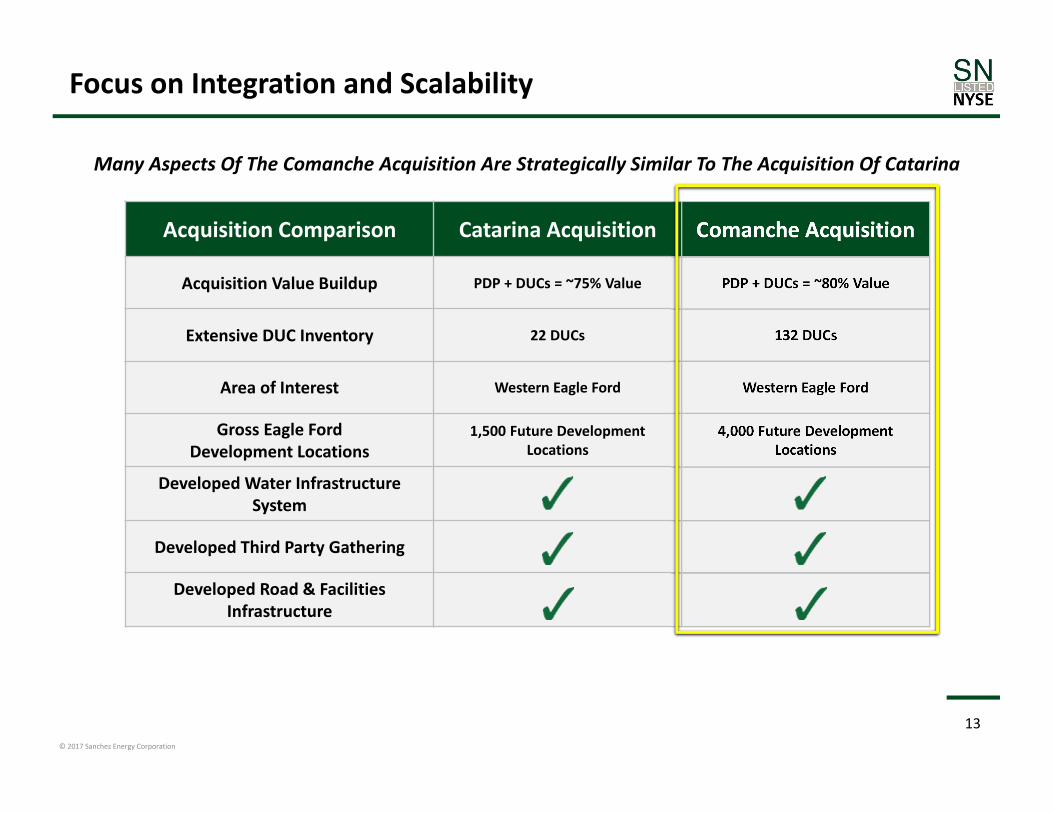
Focus on Integration and Scalability
Acquisition Comparison Catarina Acquisition Comanche Acquisition
Acquisition Value Buildup PDP + DUCs = ~75% Value PDP + DUCs = ~80% Value
Extensive DUC Inventory 22 DUCs 132 DUCs
Area of Interest Western Eagle Ford Western Eagle Ford
Gross Eagle Ford Development Locations
1,500 Future Development Locations
4,000 Future Development Locations
Developed Water Infrastructure System
Developed Third Party Gathering
Developed Road & Facilities Infrastructure
Many Aspects Of The Comanche Acquisition Are Strategically Similar To The Acquisition Of Catarina
© 2017 Sanchez Energy Corporation
0
5,000
10,000
15,000
20,000
25,000
30,000
35,000
40,000
45,000
50,000
55,000
60,000
65,000
70,000
Jan‐11 Jul‐11 Jan‐12 Jul‐12 Jan‐13 Jul‐13 Jan‐14 Jul‐14 Jan‐15 Jul‐15 Jan‐16 Jul‐16
Shell
SN2014
SN2015
SN2016
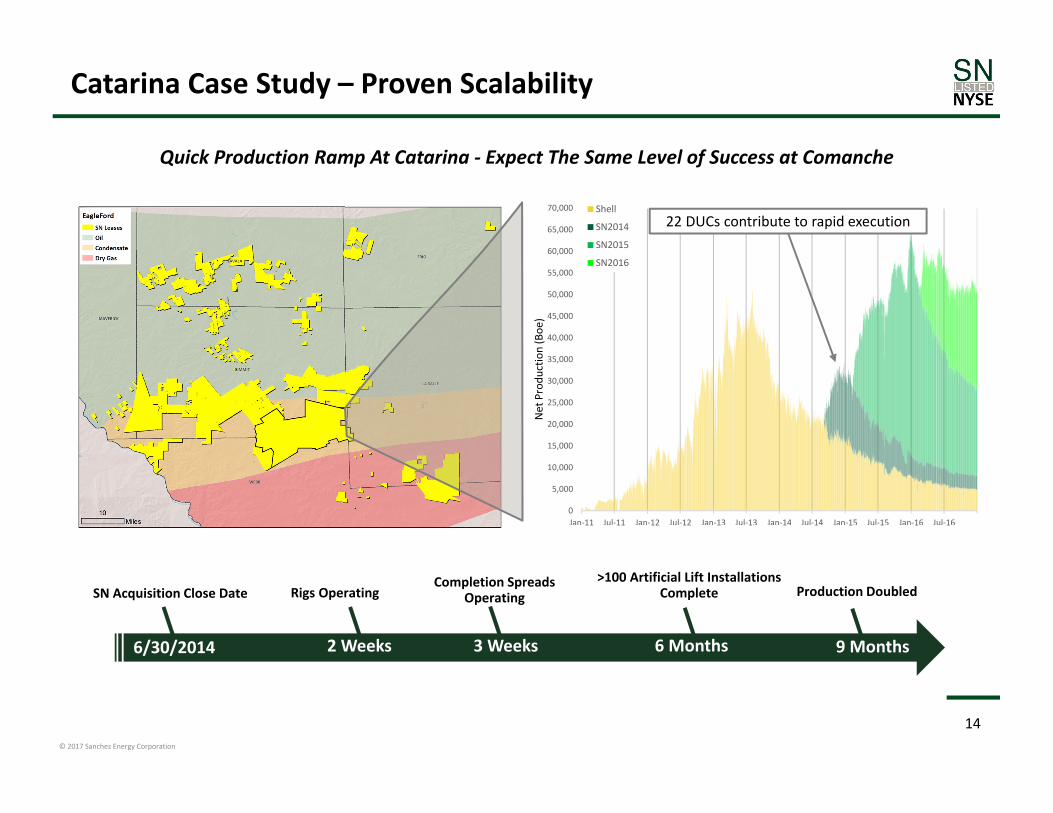
Catarina Case Study – Proven Scalability
Quick Production Ramp At Catarina ‐ Expect The Same Level of Success at Comanche
6/30/2014 2 Weeks 3 Weeks 6 Months 9 Months
SN Acquisition Close Date Rigs OperatingCompletion Spreads
Operating>100 Artificial Lift Installations
Complete Production Doubled
22 DUCs contribute to rapid execution
Net Produ
ction (Boe
)
14

© 2017 Sanchez Energy Corporation
15
2016 Western Eagle Ford Lease Program Adds 110,000 Net Acres
*Price Deck:12/30/2016 Strip; NGLs 30% WTI; Prices held flat subsequent to 2021
MAVERICK
JAVELINA
Maverick Leasing Program:
Leased an additional 65,000 net acres of high quality drilling inventory in Western Eagle Ford oil play.
Javelina Leasing Program :
Leased 45,000 net acres in Javelina down‐dip Eagle Ford gas play.
Synergies with midstream and Sanchez Production Partners, LP (“SPP”) growth
Multiple takeaway options

© 2017 Sanchez Energy Corporation
16
SPP Relationship Provides Optionality and Liquidity
Carnero Gathering Line Carnero Gathering Line reduced SN’s transportation fees
Raptor Gas Processing Facility
Raptor Gas Processing Facility reduced the processing fees associated with the majority of Catarina gas
Raptor SECO Pipeline Improved end markets expected to allow for increased realizations Estimated in service date April 2017
VelociFracFractionator
Improved end markets expected to allow for increased NGL price realizations Estimated in service date post 2017
SN Margin Increases as Additional Midstream Infrastructure Comes On‐Line
Improved Financial Flexibility
Increased Cash
2015 asset sales to SPP provided ~$430 million in cash Carnero Gathering JV interest sold to SPP in 2016 for $44.4 million in total consideration* Producing assets and Raptor Gas Processing Facility sold to SPP in 2016 for $107 million in total
consideration*
Reduced Future Funding Liabilities
Carnero divestiture removed $7.4 million in future capital commitments Raptor divestiture removed $24.5 million in future capital commitments
* Before normal and customary closing adjustments

© 2017 Sanchez Energy Corporation
17
SPP Midstream Relationship
Western Eagle Ford Focus Results in Synergies Through SPP’s Midstream Asset Base
© 2017 Sanchez Energy Corporation
18
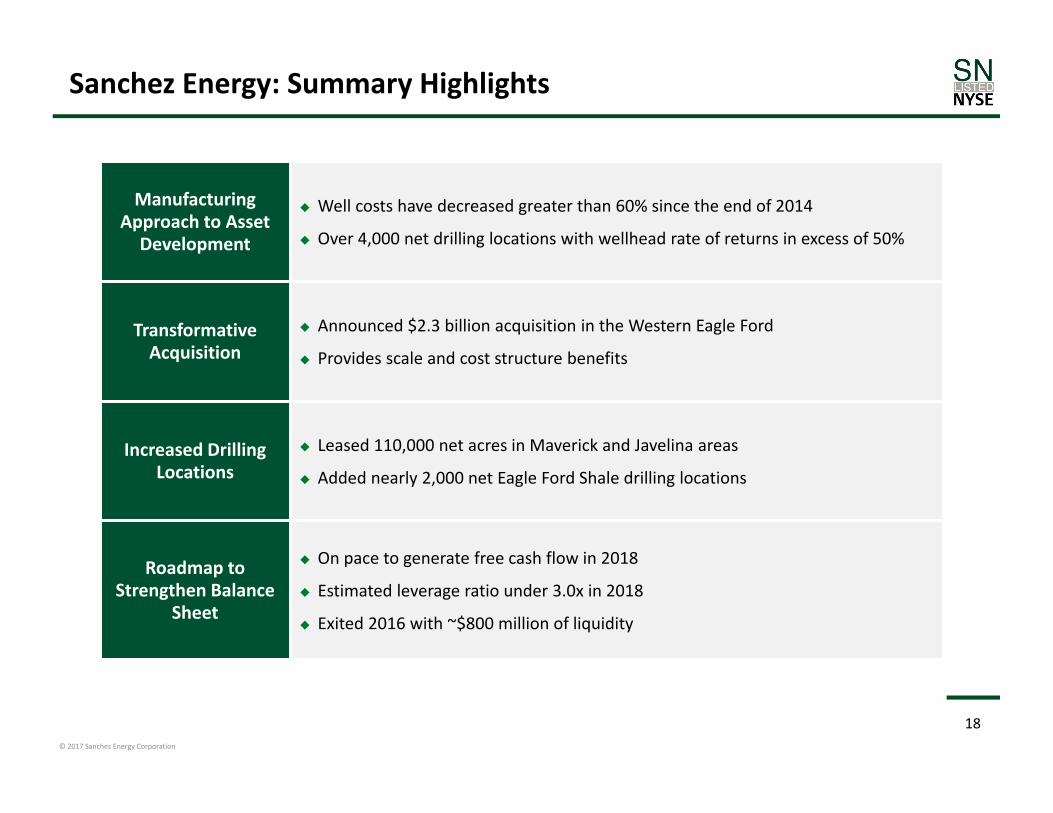
Sanchez Energy: Summary Highlights
Manufacturing Approach to Asset Development
Well costs have decreased greater than 60% since the end of 2014
Over 4,000 net drilling locations with wellhead rate of returns in excess of 50%
TransformativeAcquisition
Announced $2.3 billion acquisition in the Western Eagle Ford
Provides scale and cost structure benefits
Increased Drilling Locations
Leased 110,000 net acres in Maverick and Javelina areas
Added nearly 2,000 net Eagle Ford Shale drilling locations
Roadmap to Strengthen Balance
Sheet
On pace to generate free cash flow in 2018
Estimated leverage ratio under 3.0x in 2018
Exited 2016 with ~$800 million of liquidity
© 2017 Sanchez Energy Corporation
Production and Cash Flow Highlights
19

© 2017 Sanchez Energy Corporation
20
Sanchez Energy Positioned for Significant Growth
0
200
400
600
800
1,000
1,200
1,400
‐
20
40
60
80
100
120
2017 2018 2019
Capital Spe
nding ($Million)
Prod
uctio
n (M
Boe/d)
SN Standalone Capital SN + Comanche Capital SN Standalone Production SN + Comanche Production
Comanche Provides Significant Production Growth While Operating Within Cash Flow in the Next 12‐18 Months
Increased Production Growth Outlook
3 year organic production growth CAGR now projected over 10% per year
Production levels double 2016 exit rate by 2018
Legacy Asset Production Continues to Grow
Additional locations in Maverick and improved type curves in South Central Catarina help grow legacy production

© 2017 Sanchez Energy Corporation
Rigs Net WellsCapital ($MM)
Catarina 1.5 53 $160 ‐ $170
Maverick 1 35 $100 ‐ $110
Comanche 3.5 21 $90 ‐ $100
Comanche DUC ‐‐ 32 $40 ‐ $50
Total 141 $390 ‐ $430
21
2017 Capital Guidance
Eagle Ford Operated
Eagle Ford Non ‐ Operated
Other
Rigs Net WellsCapital ($MM)
Palmetto <1 3 $5 ‐ $10
Land/Infrastructure/G&G $30 ‐ $35
2017 Capital Budget
37%
23%
21%
10%
2%
7%
Catarina Maverick
Comanche Comanche DUC
Palmetto Land/Infrastructure/G&G
2017 Total Capital Budget: $425 MM ‐ $475MM2018 Total Capital Budget: ~$500 MM

© 2017 Sanchez Energy Corporation
($100)
($50)
$0
$50
$100
$150
2017E 2018E 2019E
22
Asset Base Expected to Yield Sustainable Cash Flow Growth…
SN Free Cash Flow ($MM)*
* Price Deck: 12/30/2016 NYMEX Strip; Assumes NGL Pricing @ 30% of WTIFree Cash Flow is a non‐GAAP financial measure see “Non‐GAAP Reconciliation and Measures”
Comanche Expected to Deliver Production Growth While Internally Funding CapEx in 2018
SN + Comanche Free Cash Flow ($MM)*
Cash Flow Neutral
($100)
($50)
$0
$50
$100
$150
2017E 2018E 2019E

© 2017 Sanchez Energy Corporation
23
…And Strengthens the Balance Sheet
* Price Deck: 12/30/2016 NYMEX Strip; Assumes NGL Pricing @ 30% of WTI
Production Growth and Free Cash Flow Expected to Reduce Leverage Ratios Significantly Over the Next Two Years
SN Leverage SN + Comanche Leverage
Long‐Term Outlook
EBITDA Projected to Double by 2018 Generate Free Cash Flow in 2018
Debt Leverage Below 3.0x in 2018
1.0x
2.0x
3.0x
4.0x
5.0x
2017E 2018E 2019ESTRIP* $65/$3.50
1.0x
2.0x
3.0x
4.0x
5.0x
2017E 2018E 2019ESTRIP* $65/$3.50

© 2017 Sanchez Energy Corporation
Sanchez Energy: Competitive Advantages1. Multi‐Bench Development2. Sustainable Cost Structure
24
Financial StrategyAsset DetailCompetitive Advantages

© 2017 Sanchez Energy Corporation
1. Multi‐Bench Development
2525

© 2017 Sanchez Energy Corporation
Western Eagle Ford Supports Multi‐Bench Development
26
1
Multi‐Bench Development Across Western Eagle Ford Lower, Middle and Upper Eagle Ford Shale with upside in Austin Chalk and Pearsall Shale
Western Eagle Ford Has a Lower Well Density Than the Rest of the Eagle Ford SN holds 335,000 net acres in the Eagle Ford; 4,000+ net drilling locations
Presence of large contiguous ranches facilitate efficient development
Western Eagle Ford Has Seen Limited Industry Activity over the past 2‐3 Years Current completion designs yielding significant increase to well results
Eagle Ford Well DensityTotal Eagle Ford Thickness
Western Eagle FordWestern Eagle Ford

© 2017 Sanchez Energy Corporation
Targeting Strategy in the Western Eagle Ford
27
LOWER EAGLE FORD A
UPPER EAGLE FORD B
UPPER EAGLE FORD C
LOWER EAGLE FORD B
UPPER EAGLE FORD A
TARGET BENCH
FRAC BARRIER
UPPER EAGLE FORD
MIDDLE EAGLE FORD
LOWER EAGLE FORD
DEVELOPMENT ZONE
The Western Eagle Ford Is Unique in that the Thickness and Mineralogy Provide for a Multi‐Bench Development Strategy
LOWER AUSTIN CHALKAUSTIN CHALK E
TOC
Brittlene
ss
UPPER EAGLE FORD DFRAC BARRIER
LOWER EAGLE FORD CFRAC BARRIER
1

© 2017 Sanchez Energy Corporation
Current Extent of Multi‐Bench Development
28
Sanchez Now Has a Western Eagle Ford Position of Approximately 335,000 Surface Net Acres, Over 1,000,000 Effective Net Acres, and Over 4,000 Net Drilling Locations
1

© 2017 Sanchez Energy Corporation
Sanchez is a Leader in Existing Multi‐Bench Development
29
Sanchez is a leader in multi‐bench development of the Eagle Ford Over 300 producing wells currently online
Stacked development accounts for greater than 90% of current Catarina development program
Development of multiple zones concurrently enhances total hydrocarbon recovery per acre
Wellhead returns in excess of 50% at current strip*
0
10
20
30
40
50
60
2014 2015 2016 2017E
Num
ber o
f Wells Drilled
Development Year
Multi‐Bench Development of Existing Sanchez Assets
Catarina Drilled Wells in Middle & Upper Eagle Ford
* Price Deck: 12/30/2016 NYMEX Strip; Assumes NGL Pricing @ 30% of WTI
1

© 2017 Sanchez Energy Corporation
AA’
A A’CatarinaComanche
UEF
MEF
LEF
UEF
MEF
LEF
UEF
MEF
LEF
Regional Extension of Stacked Targeting
30
All Three Benches in Catarina Thicken Towards the Northwest
Lower, Middle, and Upper Eagle Ford targets proven at Catarina
Quality of the Middle and Upper Eagle Ford increases through the extent acquired asset
Quality and thickness of the Lower Eagle Ford significantly increases moving West from Catarina
Comanche asset is located on the crossover between volatile oil and condensate widows yielding ideal recoveries and returns
1

© 2017 Sanchez Energy Corporation
Drilling Inventory – Breakeven Analysis
31Note: Assumes Flat $3.50 Gas; NGL Pricing @ 30% of WTIDoes not include Contingent or Prospective locationsEngineered Locations includes SEC Proved locations + locations that are geologically un‐risked but do not qualify as SEC PUDs due to factors such as assumed drill timing
2,657 Total Net Engineered Locations – Average Estimated Breakeven Price ~$35/Bbl
0
8
16
24
32
40
48
0
100
200
300
400
500
600
ComancheArea 5
Maverick Catarina SouthCentral
ComancheArea 3
ComancheArea 4
Palmetto ComancheArea 7
CatarinaWestern
CatarinaWesternStacked
WTI Breakeven
Oil Price @ 10%
IRR
Net Engineered Drillin
g Locatio
ns
Net Locations Breakeven Oil Price
1

© 2017 Sanchez Energy Corporation
2. Sustainable Cost Structure
32

© 2017 Sanchez Energy Corporation
Sustainable Low Cost Position
Basin‐Centric Operations Contiguous acreage with active service support Dense activities providing level‐loaded services
Execution Competencies Experienced staff with cyclical market knowledge Staffed with service and operator backgrounds
Direct Sourcing Capabilities De‐bundled assessments and trials Selective optionality for changing times/markets
Unit Based Initial consideration (processes being restricted) Disciplined approach with rigorous negotiations
Process Oriented No changes in functional recipes Optimization of parallel and flat‐time processes
Cross‐Functional Integrated process and design structures Performance driven accountabilities
2
33
Sustainable Cost Structure
$3.1 $0.0
$2.0
$4.0
$6.0
$8.0
2014 Well Cost Drilling Unit CostReductions
Rig Day RateReductions
CompletionService/LaborReductions
Drilling EfficiencyGains
Completion De‐bundled
Commodities
CompletionEfficiency Gains
Current Well Cost
$MM
$7.4
>50% of Achieved Cost Reductions Are Sustainable

© 2017 Sanchez Energy Corporation
SN Cost Structure Comparison to Eagle Ford Peers
34
$0.0
$1.0
$2.0
$3.0
$4.0
$5.0
$6.0
$7.0
$8.0
$9.0
0
1,000
2,000
3,000
4,000
5,000
6,000
7,000
8,000
9,000
Average Lateral Len
gth (Ft)
Eagle Ford Com
pany Disc
losed Drilling and Co
mpletions Cost
($MM)
Average Lateral Length
* Source: All data excluding the “SN Current” was obtained from RS Energy Group, based on wells drilled in 2016. ** Peers include: APC , CHK, COG, CRZO, DVN, ECA, EOG, EPE, Lonestar, MRO, MUR, NBL, PVA, SFY, SM
2

© 2017 Sanchez Energy Corporation
Centralized Project Management
35
Scalability: streamlined systems for business intelligence and resource allocations
Tracking: drives an accountable, assembly‐line approach to all functions
Differentiation: exception analysis with competitive targets and granular cost support
Commerciality: Finance Team embedded within engineering for economic analysis and decision making
OPERATIONAL SUPPORT SYSTEM
Task management with professional accountability andcross‐functional collaboration
2
© 2017 Sanchez Energy Corporation
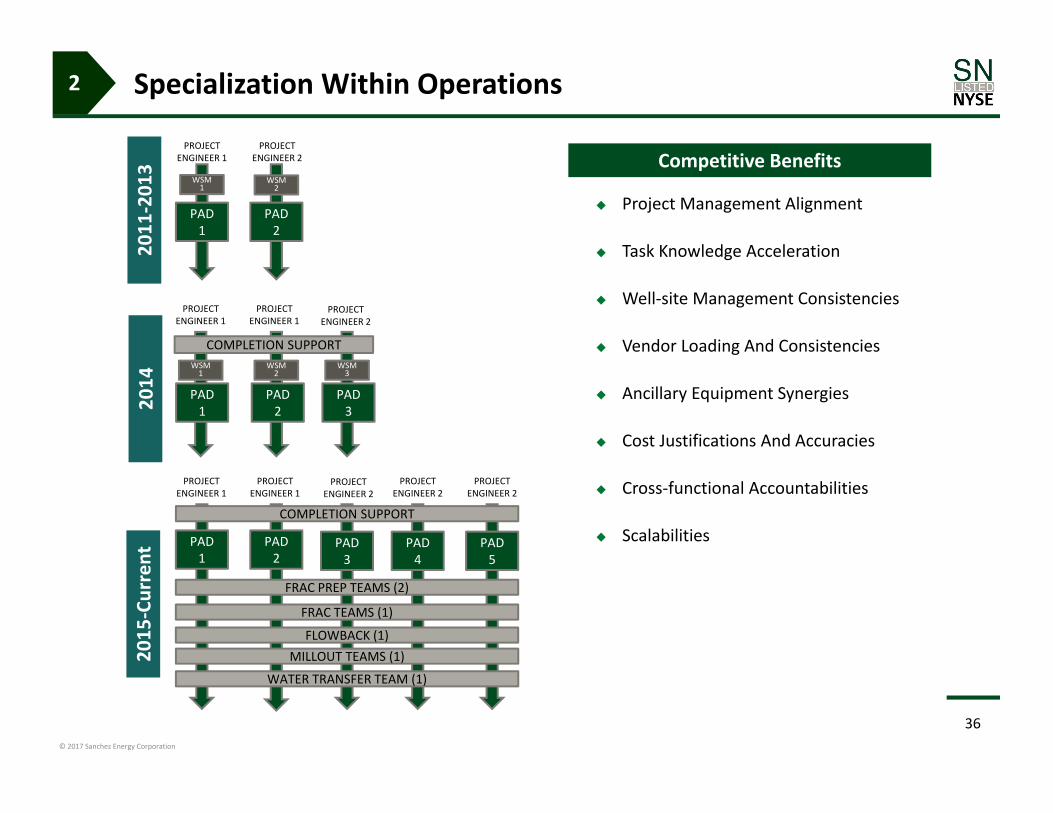
Specialization Within Operations
Project Management Alignment
Task Knowledge Acceleration
Well‐site Management Consistencies
Vendor Loading And Consistencies
Ancillary Equipment Synergies
Cost Justifications And Accuracies
Cross‐functional Accountabilities
Scalabilities
Competitive Benefits
36
PAD 1
PAD 2
PAD 1
PAD 3
PAD 2
PAD 1
PAD 2
PAD 3
PAD 4
PROJECT ENGINEER 1
PROJECT ENGINEER 2
PROJECT ENGINEER 1
PROJECT ENGINEER 1
PROJECT ENGINEER 2
COMPLETION SUPPORT
PAD 5
COMPLETION SUPPORT
MILLOUT TEAMS (1)
FRAC PREP TEAMS (2)
FRAC TEAMS (1)
FLOWBACK (1)
WATER TRANSFER TEAM (1)
PROJECT ENGINEER 1
PROJECT ENGINEER 1
PROJECT ENGINEER 2
PROJECT ENGINEER 2
PROJECT ENGINEER 2
WSM 1
WSM 2
WSM 2
WSM 3
WSM 1
2011
‐201
320
1420
15‐Current
2

© 2017 Sanchez Energy Corporation
Concentrated Acreage Position
37
Acreage Position Within a 50 Mile Radius Provides SN a Competitive Advantage
Concentrated Acreage Leads to Synergies of Scale
Cost savings from moving rigs and equipment
Shared resources for in‐field gathering, water transportation, etc.
More efficient drilling process
Asset level knowledge retained and applied to neighboring acreage
More efficient field level operations
Better pricing due to volume and location
50 Mile Radius
2

© 2017 Sanchez Energy Corporation
Process Optimization
38
1.88
1.35
0.00
0.20
0.40
0.60
0.80
1.00
1.20
1.40
1.60
1.80
2.00
Conventional Offline Cementing
Days
Average Days on SurfacePrior Conventional Cementing Cement jobs pumped before rig moves to next
surface well or batch
Current Offline Cementing Rig released from surface hole once casing run Rig moves to next well and spuds same before
previous well is cemented
Example of Process Optimization – Offline Surface Cementing
Line‐Management Approach Subdivide well into smaller (and smaller) segments
Construct granular approach to reviewing performances Focus on flat and non‐productive times Maximize parallel activities
2

© 2017 Sanchez Energy Corporation
Selective De‐Bundling & Efficiency Contributes to Sustainability
39
Reduces Handling Costs
Improves Supplier Flexibilities
Generates Granular Market Intel
Drives Product Consistencies
Enables Execution Discipline
Pre‐Direct Sourcing
Sand Fuel Logistics Chemicals
SN
Acid
Completion Services Vendor
Direct Sourcing
Sand Vendor Fuel Vendor
Logistics Vendor
Chemicals Vendor
Acid Vendor
Completion CrewOnly
SN
$‐
$0.05
$0.10
$0.15
$0.20
$0.25
0
500
1000
1500
2000
2500
2012 2013 2014 2015 2016Prop
pant Per Lateral Foo
t (Lbs.)
Prop Intensity (lb/ft) Prop Cost ($/lb)
Benefits of Direct Sourcing Proppant Volume and Cost Over Time
2

© 2017 Sanchez Energy Corporation
Manufacturing Efficiency Driven by Scale
40
2013
Operations Scale
100,000+ Eagle Ford Gross Acres ~9,100 Average Boe/d
Manufacturing Initiatives
Centralized Project Management Time‐Motion Studies Line‐Management Practices Geo‐Science Integration
2015
Operations Scale
200,000+ Eagle Ford Gross Acres ~52,500 Average Boe/d
Manufacturing Initiatives
Direct Sourcing Task Level Specializations Granular Cost Analysis Optimized Technologies
2017
Operations Scale
585,000+ Eagle Ford Gross Acres 78,000 ‐ 82,000 Average Boe/d
Manufacturing Initiatives
Vertical Integration of Services Dedicated Plant Runs Customized Tools and Equipment Big Data Analytics
2

© 2017 Sanchez Energy Corporation
Storage Tanks
Light Towers
Generators
Misc Trucking
Drilling Cost Reduction Durability
41
SN Owned Service Equipment Rig Rates
Rig Moves
Mud Services
OCTG & Logistics
Contracted Costs– Long‐term Rig Rates
Ancillary Services
Site Constructions
OCTG & Logistics
Contracted Costs ‐ Short‐term
$1.7
0.6 0.6
0.7
1.0
$0.0
$0.2
$0.4
$0.6
$0.8
$1.0
$1.2
$1.4
$1.6
$1.8
$2.0
2015 Cost Current Cost Future Cost ‐ Projected Services Inflation
$ MM
$1.3
$1.6
46% of Drilling Services Contracted Through 2017
Inflation Risk:23% of Current Cost
Sustainable Costs $480,000 Sustainable Costs $75,000 Sustainable Costs $30,000
$0.4MMEfficiency Savings
Term Contracted
Market Rate
2

© 2017 Sanchez Energy Corporation
$1.0 $1.0
$2.3
$0.5 $0.7
$‐
$0.5
$1.0
$1.5
$2.0
$2.5
2015 Cost Current Cost Future Cost ‐ Projected Services Inflation
$ MM
Completions Cost Reduction Durability
42
Inflation Risk:13% of Current Cost
Frac Stacks
Zipper Manifolds
Choke Manifolds
Frac Tanks
Water Transfer Pumps
Light Towers
SN Owned Service EquipmentContracted Costs– Long‐Term Frac Hydraulic Horsepower
Wireline Perforating
Frac Plugs
Cranes
Frac Stack Services
Proppant and Logistics
Coil Tubing and Tools
Service Rigs
Frac and Coil Tubing Chemicals
Contracted Costs – Short‐Term
67% of Completion Services Contracted Through 2017
$1.5$1.7
$0.8MMEfficiency Savings
Term Contracted
Market Rate
Sustainable Costs $345,000 Sustainable Costs $590,000 Sustainable Costs $45,000
2

© 2017 Sanchez Energy Corporation
Sensitivity & Sustainability
43
Oil Price ($/Bbl) $55 $65 $75
Gas Price ($/MMBtu) $3.00 $3.25 $3.50
Estimated Well Costs $3.2MM $3.8MM $4.3MM
F&D ($/Boe) $2.80 $3.33 $3.77
NPV $4,026M $5,283M $6,640M
IRR 86% 95% 100%+
Catarina South Central Well Economics
Note: Assumes areas average well design
2
NGL Price Assumption = 30% WTI Oil

© 2017 Sanchez Energy Corporation
Sanchez Energy: Asset Detail3. Asset Detail
o Comancheo Catarinao Mavericko Javelina
44
Financial StrategyAsset DetailCompetitive Advantages

© 2017 Sanchez Energy Corporation
Western Eagle Ford Assets
45
3
MAVERICK
COMANCHE
CATARINAJAVELINA

© 2017 Sanchez Energy Corporation
Comanche
46

© 2017 Sanchez Energy Corporation
Comanche Asset Development
47
2017 Development Activity
Net Capital Allocation $130‐$150MM
D&C Activity 53 Net Wells
Rig Activity 3.5 Rigs
Transformative Acquisition Results in Addition of ~$2.6 Billion in Net Asset Value
Total Net EF Acreage ~61,000
Net Locations ~1,000 Locations
Average EUR ~625 MBoe
Average IRR 70‐100%+
Average NPV10 ($M)
$3,079 ‐ $5,247
Net Asset Value ~$2.6 Billion
*Price Deck: Price Deck: 12.30.16 Strip; Assumes NGL Pricing @ 30% of WTI
3
2017 Capital Activity Focused on DUC Completion and Drilling in Areas 3 and 5 Offsetting Catarina
1
26
4
7
5
3

© 2017 Sanchez Energy Corporation
Completion Enhancements Unlocking Increased Type Curves
Pre‐2014 Completions
Proppant Loading (lbs/ft) 750 – 1,200
Stage Spacing (ft.) 250‐300
Well Cost ($MM) $7.5
3 Stream EUR (MBoe) <450
2016 Completions
Proppant Loading (lbs/ft) 1,750 – 2,000
Stage Spacing (ft.) 200‐250
Well Cost ($MM) $3.0
3 Stream EUR (MBoe) 600 – 1,150
48
Pre‐2014 Completion
2015 Completion
2016 Completion
Cumulative Bo
e
Producing Days
Impact of Completion Design on Catarina Well Results
3

© 2017 Sanchez Energy Corporation
Extensive Field Infrastructure Ready for Development
Extensive Field Gathering and Water Infrastructure Throughout Comanche
548 miles of gas pipeline and 241 miles of oil pipeline
24 compressor stations with centralized delivery points
Water infrastructure is sufficient in Areas 3, 4, 5, and 7 Pipeline system will support up to 12 rigs and 6 frac spreads of simultaneous activity
18” and 22” trunk lines with 18” spur lines to ~85% of the acreage position
49
3rd Party Gathering System Comanche Water Infrastructure
Comanche AcreageGas GatheringOil GatheringWater Infrastructure
Water Infrastructure
Identified for further Infrastructure Buildout
3

© 2017 Sanchez Energy Corporation
Western Eagle Ford Stacked Development
50
There Has Been Significant Development of the MEF and UEF Across Western Eagle Ford SN Leading the Way With Stacked Development in Catarina
Upper Eagle Ford Hydrocarbon ThicknessUpper Eagle Ford Thickness
3
© 2017 Sanchez Energy Corporation
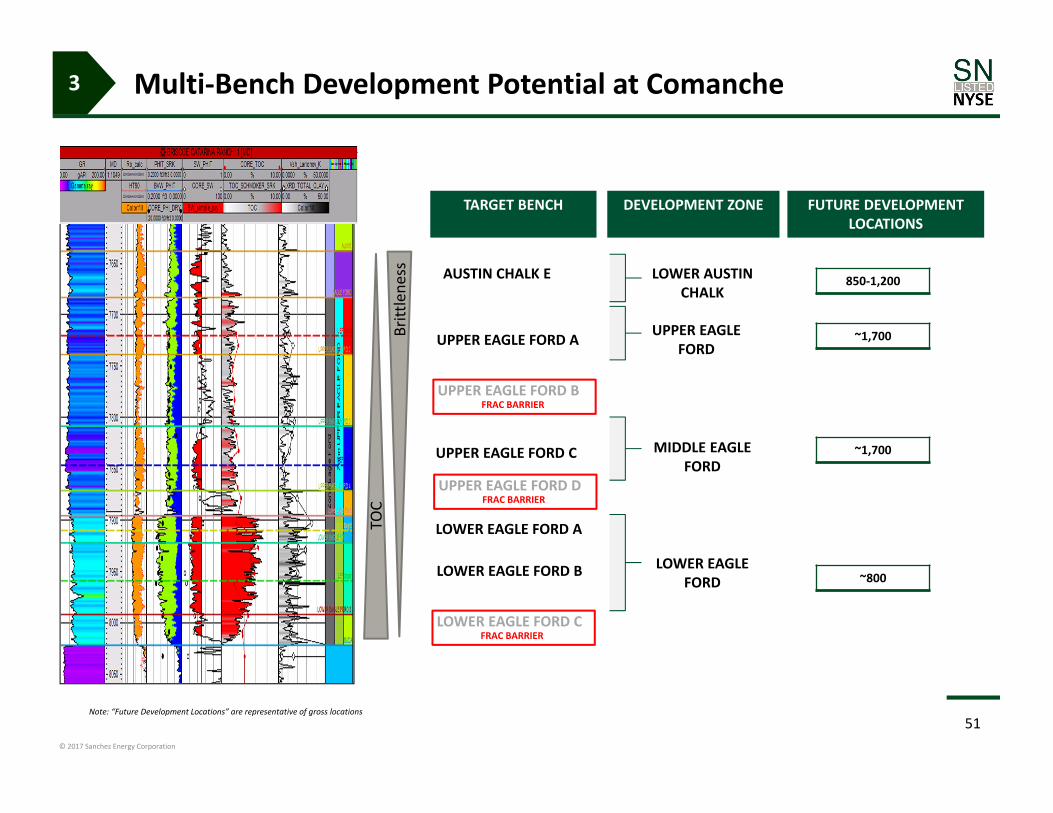
Multi‐Bench Development Potential at Comanche
51
LOWER EAGLE FORD A
UPPER EAGLE FORD B
UPPER EAGLE FORD C
LOWER EAGLE FORD B
UPPER EAGLE FORD A
TARGET BENCH
FRAC BARRIER
UPPER EAGLE FORD
MIDDLE EAGLE FORD
LOWER EAGLE FORD
DEVELOPMENT ZONE
LOWER AUSTIN CHALK
AUSTIN CHALK E
TOC
Brittlene
ss
UPPER EAGLE FORD DFRAC BARRIER
LOWER EAGLE FORD CFRAC BARRIER
850‐1,200
~1,700
~1,700
~800
FUTURE DEVELOPMENT LOCATIONS
3
Note: “Future Development Locations” are representative of gross locations

© 2017 Sanchez Energy Corporation
Comanche: Area 3 Asset Development
52
Area 3
Total Acreage ~100,000 Gross Acres
Gross Locations 2,000+ Locations
Average WI/NRI 24%/18%
Average IRR 71%
Average EUR 633 MBoe
*Price Deck: Price Deck: 12/30/16 Strip; Assumes NGL Pricing @ 30% of WTI
3

© 2017 Sanchez Energy Corporation
Comanche: Area 3 Overview
53
Comanche Area 3
Oil
IP (Bbl/d) 520Initial Decline (%) 78.0%
Oil EUR (MBbl) 258
Gas
IP (Mcf/d) 2,487Initial Decline (%) 74.0%Gas EUR (MMcf) 1,123
NGL NGL Yield (Bbl/MMcf) 129
NGL EUR (MBbl) 1883 Stream EUR (MBoe) 633
% Oil 41%Well Cost ($M) $3,200 NPV10 ($M)* $3,079
IRR (%)* 71%
140’
100’
*Price Deck: Price Deck: 12.30.16 Strip; Assumes NGL Pricing @ 30% of WTI
3
2017 Activity In Area 3
Net Capital ~$80MM
Drilling of 61 Gross Development Wells
Completions of 40 Gross Development Wells
Completions of 80 Gross DUCs
Area 3 – Target Strategy
Upper EF
Middle EF
Lower EF
AC
BUDA600’

© 2017 Sanchez Energy Corporation
Comanche: Area 3 Well Economics
NGL Price Assumption = 30% WTI Oil
54
Oil Price ($/Bbl) $55 $65 $75
Gas Price ($/MMBtu) $3.00 $3.25 $3.50
Estimated Well Costs $3.2MM $3.8MM $4.3MM
F&D ($/Boe) $5.06 $6.00 $6.79
NPV 2,968 4,010 5,149
IRR 66% 76% 92%
3

© 2017 Sanchez Energy Corporation
Comanche: Area 5 Asset Development
55
Total Acreage ~50,000 Gross Acres
Gross Locations 600+ Locations
Average WI/NRI 25%/19%
Average IRR 100%+
Average EUR 607 MBoe
*Price Deck: Price Deck: 12.30.16 Strip; Assumes NGL Pricing @ 30% of WTI
Area 5
3

© 2017 Sanchez Energy Corporation
Comanche: Area 5 Overview
56
Comanche Area 5
Oil
IP (Bbl/d) 740Initial Decline (%) 77.0%
Oil EUR (MBbl) 413
Gas
IP (Mcf/d) 1,289Initial Decline (%) 71.0%Gas EUR (MMcf) 582
NGL NGL Yield (Bbl/MMcf) 129
NGL EUR (MBbl) 983 Stream EUR (MBoe) 607
% Oil 68%Well Cost ($M) $3,200NPV10 ($M)* $5,247
IRR (%)* 100%+
160’
*Price Deck: Price Deck: 12.30.16 Strip; Assumes NGL Pricing @ 30% of WTI
Area 5 – Target Strategy
Upper EF
Middle EF
Lower EF
AC
BUDA600’
3
2017 Activity In Area 5
Net Capital ~$55MM
Drilling of 51 Gross Development Wells
Completions of 20 Gross Development Wells
Completions of 50 Gross DUCs

© 2017 Sanchez Energy Corporation
Comanche: Area 5 Well Economics
NGL Price Assumption = 30% WTI Oil
57
Oil Price ($/Bbl) $55 $65 $75
Gas Price ($/MMBtu) $3.00 $3.25 $3.50
Estimated Well Costs $3.2MM $3.8MM $4.3MM
F&D ($/Boe) $5.27 $6.26 $7.08
NPV 5,020 6,480 8,035
IRR 100%+ 100%+ 100%+
3

© 2017 Sanchez Energy Corporation
Regional Correlation to Appraisal Areas 1/2/7
A A’
Areas 1, 2, & 7 are on trend at similar present‐day depths & subsurface properties to SN properties in Dimmit and Zavalla Counties, where we completed an active 2016 stacked zone appraisal program.
MEF
LEF
UEF
MEF
LEF
UEF
MEF
LEF
UEF
Comanche Area 2 Maverick Area
A’
A1/2
7
3
58

© 2017 Sanchez Energy Corporation
Comanche Development Plan
59
DUCs In Focus for 2017
Acquired 132 gross Lower Eagle Ford Shale drilled but uncompleted wells
Over 40% of 2017’s Comanche capital budget allocated to DUCs
Completing DUC inventory is the highest rate of return projects in Sanchez’s portfolio
Costs approximately $1.7 MM to complete a well
Ramping Up Drilling Activity – 2H17 Impact on Production
Infill drilling opportunities around current DUC inventory
Drilling in areas where current midstream & water infrastructure already exists
Activity focused on areas 3 and 5
Drilling activity focused on Lower, Middle & Upper Eagle Ford
2017 DUC Production Schedule
Comanche Operated Rig Count
50‐60
30‐40
20‐30
0
10
20
30
40
50
60
1Q 2017E 2Q 2017E 3Q 2017E 4Q 2017E
# of DUCs Turne
d to Sales
4
5 5
0
1
2
3
4
5
6
1Q 2017E 2Q 2017E 3Q 2017E 4Q 2017E
Rig Co
unt b
y Quarter
3

© 2017 Sanchez Energy Corporation
Catarina
60

© 2017 Sanchez Energy Corporation
Catarina Asset Development
61
2017 Development Activity
Capital Allocation $160‐$170 MM
D&C Activity 53 Net Wells
Rig Activity 1.5 Rigs
Significant Expansion of South Central and Western Stacked Inventory
Total Gross Acreage ~106,000
Net Locations 1,400+ Locations
Average EUR 600 ‐ 1,150 MBoe
Average IRR 45‐100%+
Average NPV10 ($M) $2,247 ‐ $4,546
Net Asset Value ~$1.8 Billion
*Price Deck: Price Deck: 12.30.16 Strip; Assumes NGL Pricing @ 30% of WTI
3
© 2017 Sanchez Energy Corporation
Potential R
ecovery
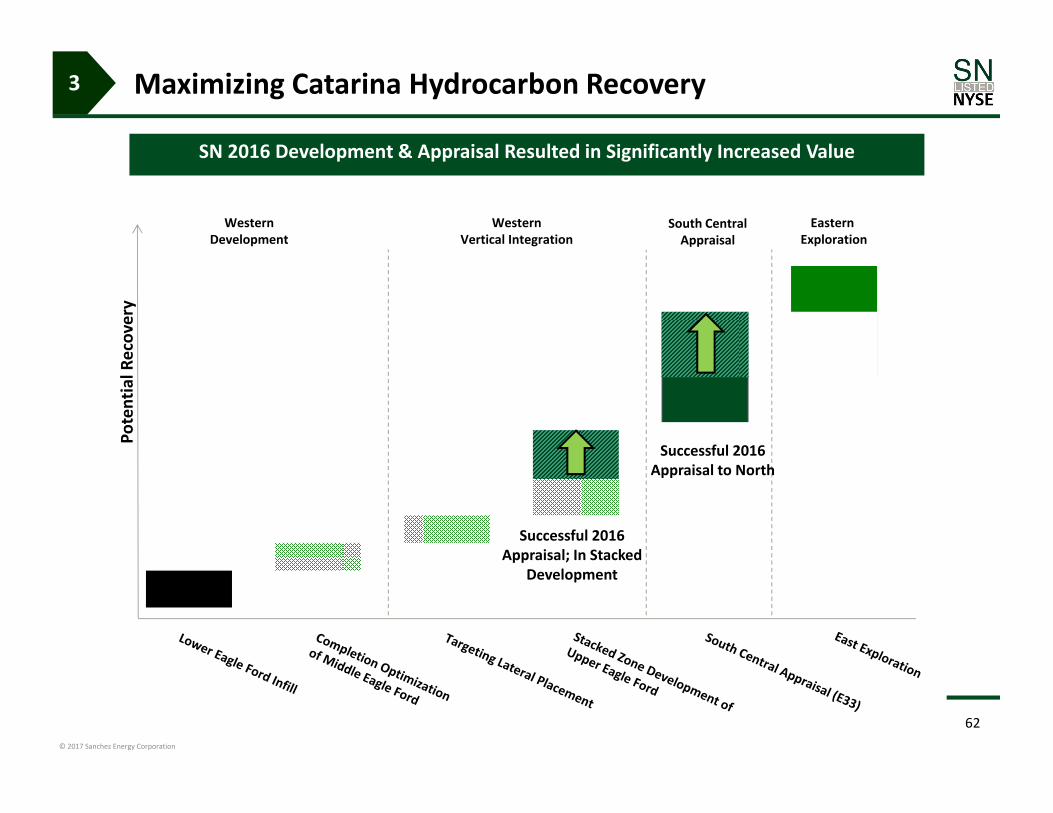
Maximizing Catarina Hydrocarbon Recovery
62
SN 2016 Development & Appraisal Resulted in Significantly Increased Value
WesternDevelopment
Western Vertical Integration
South CentralAppraisal
Eastern Exploration
Successful 2016 Appraisal; In Stacked
Development
3
Successful 2016 Appraisal to North
© 2017 Sanchez Energy Corporation
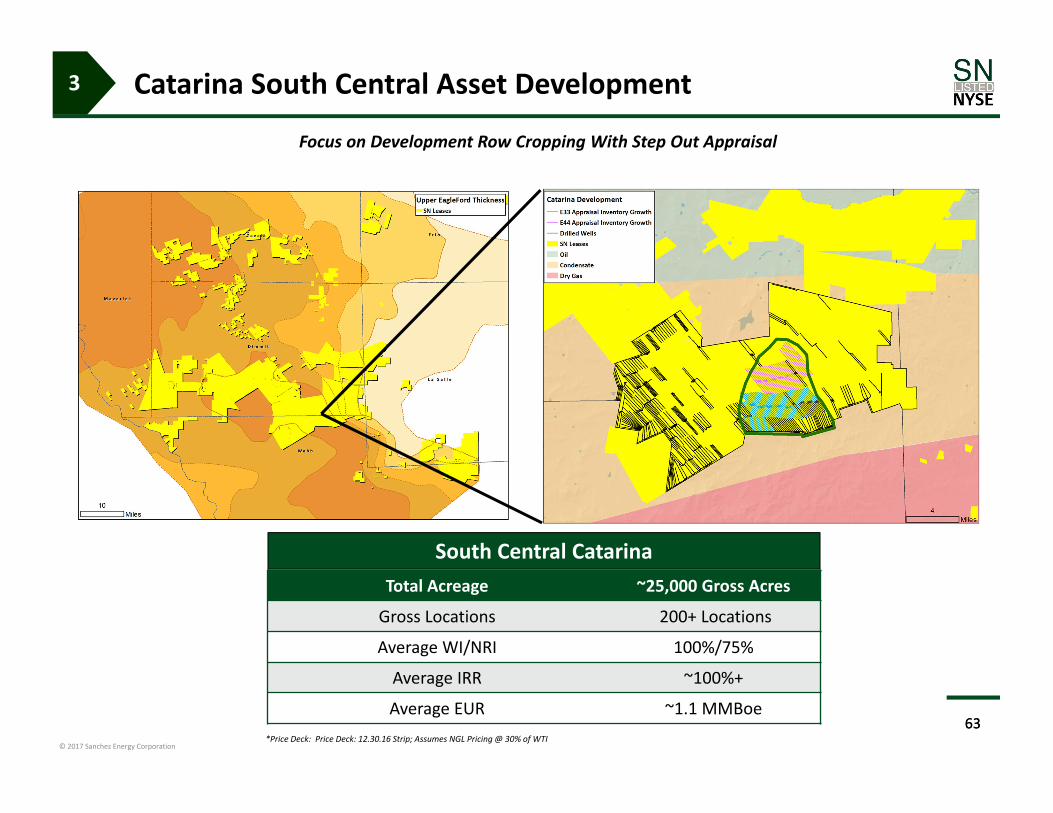
Catarina South Central Asset Development
63
Total Acreage ~25,000 Gross Acres
Gross Locations 200+ Locations
Average WI/NRI 100%/75%
Average IRR ~100%+
Average EUR ~1.1 MMBoe63
Focus on Development Row Cropping With Step Out Appraisal
*Price Deck: Price Deck: 12.30.16 Strip; Assumes NGL Pricing @ 30% of WTI
South Central Catarina
3

© 2017 Sanchez Energy Corporation
South Central Catarina
64
SC Calculated Net Pay
Gas Rate (M
CFD)
Days
South Central Catarina Development Driven by 3D Seismic Data And Stratigraphy, Further Defining the High Rate of Return Target Window
*Price Deck: Price Deck: 12/30/16 Strip; Assumes NGL Pricing @ 30% of WTI
SC CATARINA
Oil
IP (BBl/d) 420Initial Decline (%) 78%
Oil EUR (MBbl) 236
Gas
IP (Mcf/d) 4,300Initial Decline (%) 68%Gas EUR (MMcf) 2,874
NGL NGL Yield (Bbl/MMcf) 119
NGL EUR (MBbl) 4273 Stream EUR (MBoe) 1,142
% Oil 21%Well Cost ($M) $3,200NPV10 ($M)* $4,546
IRR (%)* 100%+
3

© 2017 Sanchez Energy Corporation
South Central Delineation & Expansion
65
Strong Results from E33 driving appraisal to test northern extent of seismic body
Seismic and well based stratigraphy trend
Further appraisal has potential to open up 60+ additional development locations
Recent B1 results show similar geology to South Central and similar oil cut as Western Catarina
3D Seismic Spectral Decomposition
E33
C1
E44
B1
3D Seismic Spectral Decomposition3D Seismic Spectral DecompositionSouth Central Appraisal & Inventory Growth
2017 Appraisal Activity
2016 Appraisal Activity
3

© 2017 Sanchez Energy Corporation
2016 Catarina Appraisal Results
66
Piloncillo E33 (Pilot + 4 MEF laterals)
Highest IP rate pad brought online to date (1,500‐1,800 Boe/d per well)
Exceeds south central type curve
Piloncillo A25 (Pilot + 3 UEF/MEF laterals)
Successful step out test of UEF/MEF stack
High fluid volume test and high proppant volume test
Piloncillo B1 (Pilot + 4 MEF laterals)
North Central step‐out appraisal linking West Stack to South Central
Completions design testing
Performance exceeds west stack type curve, particularly for yield
SC CATARINA E33
Oil
IP (Bbl/d) 575Initial Decline (%) 73.0%
Oil EUR (MBbl) 411
Gas
IP (Mcf/d) 5,000Initial Decline (%) 70.0%Gas EUR (MMcf) 3,200
NGL NGL Yield (Bbl/MMcf) 119
NGL EUR (MBbl) 4763 Stream EUR (MBoe) 1,420
% Oil 29%Well Cost ($M) $3,200
3

© 2017 Sanchez Energy Corporation
South Central Catarina Well Economics
NGL Price Assumption = 30% WTI Oil
67
Oil Price ($/Bbl) $55 $65 $75
Gas Price ($/MMBtu) $3.00 $3.25 $3.50
Estimated Well Costs $3.2MM $3.8MM $4.3MM
F&D ($/Boe) $2.80 $3.33 $3.77
NPV $4,026M $5,283M $6,640M
IRR 86% 95% 100%+
3

© 2017 Sanchez Energy Corporation
Western Catarina Multi‐Bench Development
68
Focus On Stacked UEF – MEF Row Cropping Development Following Successful 2015‐16 Appraisal
Total Acreage ~30,000 Gross Acres
Gross Locations ~700 Locations
Average WI/NRI 100%/75%
Average IRR ~47%
Average EUR 600 ‐ 900 MBoe*Price Deck: Price Deck: 12.30.16 Strip; Assumes NGL Pricing @ 30% of WTI
Western Catarina
3
West Stack
West

© 2017 Sanchez Energy Corporation
Western Catarina Development
Stacked development focused in the Lower and Middle Eagle Ford
Significant amount of additional high rate of return drilling inventory remaining
Successful infill and step‐out drilling program to date continues to yield strong returns at current strip pricing
Gas Rate (M
cf/d)
Western Catarina Type Curve
WESTERN CATARINA
Oil
IP (Bbl/d) 200Initial Decline (%) 65.0%
Oil EUR (MBbl) 181
Gas
IP (Mcf/d) 3,000Initial Decline (%) 65.0%Gas EUR (MMcf) 2,175
NGL NGL Yield (Bbl/MMcf) 119
NGL EUR (MBbl) 3243 Stream EUR (MBoe) 867
% Oil 21%Well Cost ($M) $3,200 NPV10 ($M) $2,451
IRR (%) 46%Producing Days
69*Price Deck: Price Deck: 12.30.16 Strip; Assumes NGL Pricing @ 30% of WTI
3

© 2017 Sanchez Energy Corporation
Western Catarina Stacked Development
70
Catarina is now being developed exclusively through stacked development in Northwest Catarina
~300 wells currently producing in the Middle and Upper Eagle Ford
Upper Eagle Ford southern limit delineated using existing pilots
Regionally extensive across Maverick Basin; direct tie to SN’s Maverick Eagle Ford area
Gas Rate (M
CFD)
Days
*Price Deck: Price Deck: 12.30.16 Strip; Assumes NGL Pricing @ 30% of WTI
WEST STACKED CATARINA
Oil
IP (Bbl/d) 375Initial Decline (%) 77.0%
Oil EUR (MBbl) 214
Gas
IP (Mcf/d) 2,100Initial Decline (%) 70.0%Gas EUR (MMcf) 1,267
NGL NGL Yield (Bbl/MMcf) 119
NGL EUR (MBbl) 1883 Stream EUR (MBoe) 614
% Oil 35%Well Cost ($M) $3,200NPV10 ($M)* $2,247
IRR (%)* 48%
UEF
MEF
LEF
3

© 2017 Sanchez Energy Corporation
Western Stacked Development ‐ Catarina Well Economics
NGL Price Assumption = 30% WTI Oil
71
Oil Price ($/Bbl) $55 $65 $75
Gas Price ($/MMBtu) $3.00 $3.25 $3.50
Estimated Well Costs $3.2MM $3.8MM $4.3MM
F&D ($/Boe) $5.21 $6.19 $7.00
NPV $1,932M $2,655M $3,480M
IRR 41% 46% 52%
3

© 2017 Sanchez Energy Corporation
Resulting Impact of Catarina Asset Development
72
28 Years of Drilling Inventory at 50 Wells Per Year
Catarina Development PotentialTotal Drilling Locations
EUR(Per Well)
Average Breakeven Price Undeveloped Asset Value
At Acquisition* 162 ~450 MBoe ~$75 ~$150 MM
Current 1,400+ 600 – 1,150 MBoe ~$35 ~$1,400 MM
*Acquisition Price Deck: Oil($/Bbl) / Gas($/Mcf): 2014: $98.00/$4.75; 2015: $89.00/$4.25; 2016+: $80.00/$4.00; Assumes NGL Pricing @ 30% of WTI
PDP at Acquisition Current View of Engineered Locations
3

© 2017 Sanchez Energy Corporation
Maverick
73

© 2017 Sanchez Energy Corporation
Added Over 750 Total Net Drilling Locations
Maverick Asset Leasing & Development
74
Total Gross Acreage ~100,000
Net Locations ~1,000 Locations
Average EUR 350 MBoe
Average IRR 60‐80%
Average NPV10 ($M) $3,371
Net Asset Value ~$1 Billion
2017 Development Activity
Capital Allocation $100‐$110 MM
D&C Activity 35 Net Wells
Rig Activity 1 Net Rig
*Price Deck: Price Deck: 12.30.16 Strip; Assumes NGL Pricing @ 30% of WTI
3

© 2017 Sanchez Energy Corporation
Maverick Inventory Growth
75
65,000 net acres leased in 2016
518 drilling locations (single zone LEF) identified at 75 acre spacing
More than 1,000 net locations when stacking used in two zones
Dual and triple stacking appraisals ongoing
3
Current View of Engineered Locations

© 2017 Sanchez Energy Corporation
0
20,000
40,000
60,000
80,000
100,000
120,000
140,000
160,000
180,000
200,000
0 100 200 300 400 500 600 700
Completion Design
Unlocking Maverick Updip Oil Play
76
Eagle Ford Thickness
Lift
Combination of targeting, completion design and lift has effectively unlocked large up‐dip oil resource in the Western Eagle Ford of Zavala and Dimmit Counties
Modern completion design has yielded significant improvement in oil rates and EUR’s
Targeting incorporates reservoir quality (OOIP & TOC) as well as completion quality (Brittleness)
Lift techniques are being used to optimize long term well stable performance
Cum Boe
Days
Eagle Ford Thickness
CURRENT COMPLETION DESIGN
PRE‐2014 COMPLETION DESIGN
Lift Install
Lift Install
3

© 2017 Sanchez Energy Corporation
ACUEF
MEF
LEF
Maverick Organic Stacked Zone Growth
Eagle Ford high oil saturation unlocked through targeting & completion design Stacking success at Catarina directly applicable to Maverick oily acreage
77
LEF/UEF stack in flow back
LEF/MEF/UEF stack in flow back
3

© 2017 Sanchez Energy Corporation
Maverick Regional
78
2017 Maverick development activity
35 net wells at 750 ft in‐zone spacing
2016 appraisal focused on double and triple stacking Eagle Ford target intervals
500+ well inventory for single zone LEF; nearly doubles with UEF stack
Oil Ra
te (B
OPD
)
Days*Price Deck: Price Deck: 12/30/16 Strip; Assumes NGL Pricing @ 30% of WTI
MAVERICK Type Curve
Oil
IP (Bbl/d) 550Initial Decline (%) 76%
Oil EUR (MBbl) 329
Gas
IP (Mcf/d) 120Initial Decline (%) 68%Gas EUR (MMcf) 62
NGL NGL Yield (Bbl/MMcf) 117
NGL EUR (MBbl) 113 Stream EUR (MBoe) 350
% Oil 94%Well Cost ($M) $3,000 NPV10 ($M)* $3,371
IRR (%)* 79%
3
Maverick TC

© 2017 Sanchez Energy Corporation
Maverick Well Economics
NGL Price Assumption = 30% WTI Oil
79
Oil Price ($/Bbl) $55 $65 $75
Gas Price ($/MMBtu) $3.00 $3.25 $3.50
Estimated Well Costs $3.0MM $3.6MM $4.1MM
F&D ($/Boe) $8.57 $10.29 $11.71
NPV $3,139M $3,994 $4,951M
IRR 74% 77% 83%
3

© 2017 Sanchez Energy Corporation
Javelina
80

© 2017 Sanchez Energy Corporation
Javelina Leasing
81
Significant Eagle Ford Dry Gas Optionality
Total Net Acreage ~45,000
Net Locations ~300 Locations
Average EUR 12 Bcfe
Net Asset Value ~$600 Million
*Price Deck: Price Deck: 12.30.16 Strip; Assumes NGL Pricing @ 30% of WTI
3

© 2017 Sanchez Energy Corporation
Javelina Eagle Ford Down‐dip Gas
JAVELINA
Gas
IP (Mcf/d) 11,800Initial Decline (%) 64.0%Gas EUR (MMcf) 12,000
1 Stream EUR (MBoe) 2,000% Oil 0%
Well Cost ($MM) $6.0 ‐ $7.5
Javelina Gas Play encompasses proven Eagle Ford down‐dip areas in Webb & LaSalle Counties
Accumulated 45,000 acres through organic leasing in 2016
Proven Lower Eagle Ford Shale with Upper Eagle Ford as upside value
Synergies with SN Western Eagle Ford operations and near term midstream expansion
82
A
A’
SC Catarina Javelina
Eagle Ford
A A’
*Price Deck: Price Deck: 12.30.16 Strip; Assumes NGL Pricing @ 30% of WTI
3

© 2017 Sanchez Energy Corporation
Sanchez Energy: Financial Strategy4. Financial Strategy
83
Financial StrategyAsset DetailCompetitive Advantages

© 2017 Sanchez Energy Corporation
Financial Strategy
84
Maintain Adequate Liquidity Monetized non‐core assets to build liquidity No near term debt maturities
Achieve Upside Through Balanced Commodity Mix
Continue Active Hedge Program to De‐Risk Cash Flows
Focus on Remaining a Low Cost Leader Improves margins Drives value creation for shareholders
Decrease Leverage Through Cash Flow Growth
4

© 2017 Sanchez Energy Corporation
Maintain Adequate Liquidity
85
Year‐End 2016 Cash Balance of Approximately $500 Million
$300 Million Undrawn Revolver At Restricted Subsidiaries $350 million borrowing base New non‐recourse senior revolver planned for Comanche acquisition
Significant Headroom To Senior Debt Leverage Covenant Under Revolver Comanche acquisition expected to improve total leverage ratio over one turn in 12 to 18 months
4

© 2017 Sanchez Energy Corporation
Monetize Non‐Core Assets to Build Liquidity
86
2015 Asset Sales to SPP Provided ~$430 Million in Cash
Carnero Gathering JV Interest Sold to SPP in 2016 for $44.4 Million in Total Consideration* $37.0 million in cash $7.4 million in capital obligations transferred to SPP
Producing Assets and Raptor Gas Processing Facility Sold to SPP in 2016 for $107 Million in Total Consideration* $74.7 million in cash $32.3 million in capital obligations transferred to SPP
Sale of Non‐Core Eagle Ford Assets in 2016 for ~$181 Million*
4
* Before normal and customary closing adjustments

© 2017 Sanchez Energy Corporation
Extended Debt Maturity Runway
87Note: 7.75% Senior Notes mature June 2021; 6.125% Senior Notes mature January 2023
No Bonds Maturing Until 2021
Revolver Currently Undrawn
Robust Covenant Headroom High yield has no financial maintenance covenants Maintenance covenants under existing revolver are:
1.0x Current Ratio 2.0x Net First Lien Debt/LTM EBITDA
$300
$600
$1,150
$0
$200
$400
$600
$800
$1,000
$1,200
$1,400
2016 2017 2018 2019 2020 2021 2022 2023
($ M
M)
7.75% Senior Notes 6.125% Senior NotesUndrawn Revolving Credit Facility
4

© 2017 Sanchez Energy Corporation
Achieve Upside Through Blended Commodity Mix
88
NGL Discount to WTI Expected to Shrink Multiple ethane crackers expected to come online starting in 2017 Growing propane exports
Natural Gas Strategically located near export lines to Mexico LNG exports growing
Oil Higher realized prices than Permian and Bakken Ability to ramp oil by focusing activity in high oil cut areas
Oil32%
Gas37%
NGL31%
Oil Gas NGL
Oil56%Gas
25%
NGL19%
Oil Gas NGL
2016 Commodity Mix (% of Production)* 2016 Commodity Mix (% of Revenue)*
Diversified Exposure To All Three Commodity Streams Allows for Capital Allocation Decisions To Be Product Neutral
4
* Reflects commodity mix for nine months ended 9/30/16

© 2017 Sanchez Energy Corporation
Continue Active Hedging Program to De‐Risk Cash Flow
89
Protect capital budget and guarantee a certain level of cash flows through the hedging program
Lock in attractive rates of return by opportunistic hedging
Consistent hedging program limits exposure to commodity cycle
Natural Gas Hedging Oil Hedging
4
$2.50
$2.60
$2.70
$2.80
$2.90
$3.00
$3.10
$3.20
0%
10%
20%
30%
40%
50%
60%
70%
80%
90%
100%
Q1 Q2 Q3 Q4 Q1 Q2 Q3 Q4
2017 2018$/M
MBtu
% of 3
Q16
produ
ction
$30.00
$40.00
$50.00
$60.00
$70.00
$80.00
$90.00
0%
10%
20%
30%
40%
50%
60%
70%
80%
90%
100%
Q1 Q2 Q3 Q4 Q1 Q2 Q3 Q4
2017 2018
$/Bbl
% of 3
Q16
produ
ction

© 2017 Sanchez Energy Corporation
$30.91
$24.95
$2.89 $4.40 $2.89 $2.98
$9.37
$7.26
$9.21 $8.46 $8.30 $8.23
$4.78
$4.53
$4.47 $3.89 $1.43 $0.83
$4.72
$10.99 $9.34
$7.10 $7.13
$45.06
$41.46
$27.56 $26.09
$19.72 $19.17
$‐
$5.00
$10.00
$15.00
$20.00
$25.00
$30.00
$35.00
$40.00
$45.00
$50.00
2011 2012 2013 2014 2015 3Q 2016
Total Cash Ope
ratin
g Co
st Per Barrel
Cash G&A LOE Taxes Interest & Dividends
Focus on Remaining a Low Cost Leader
90
SN’s Low Cost Leadership Improves Margins and Supports the Company’s Capital Program
(1) For the years ended Dec. 31, 2012, 2013, 2014, 2015 and three months ended Sept. 30, 2016 cash G&A excludes non‐cash stock‐based compensation of approximately $25.5 million ($54.49/Boe), $17.8 million ($4.58/Boe), $12.8 million ($1.15/Boe), $14.8 million ($0.77) and $12.8 million ($2.70/Boe), respectively.
(2) For the years ended Dec. 31, 2013, 2014 and 2015 cash G&A excludes acquisition and divestiture cost of $4.1 million ($1.07), $1.8 million ($0.16) and $3.8 million ($0.20/Boe), respectively.(3) Includes preferred dividends paid in common equity in Interest and Dividends and amortization of deferred gain associated with Western Catarina Midstream divestitureNote: Cash G&A is a non‐GAAP financial measure see “Non‐GAAP Reconciliation and Measures” and LOE represents oil and natural gas production expense.
4
(1)(2) (1)(2) (1)(2)(1)(2) (1)(2) (1)(3)
© 2017 Sanchez Energy Corporation
2017 Production and Cost Guidance
91
4
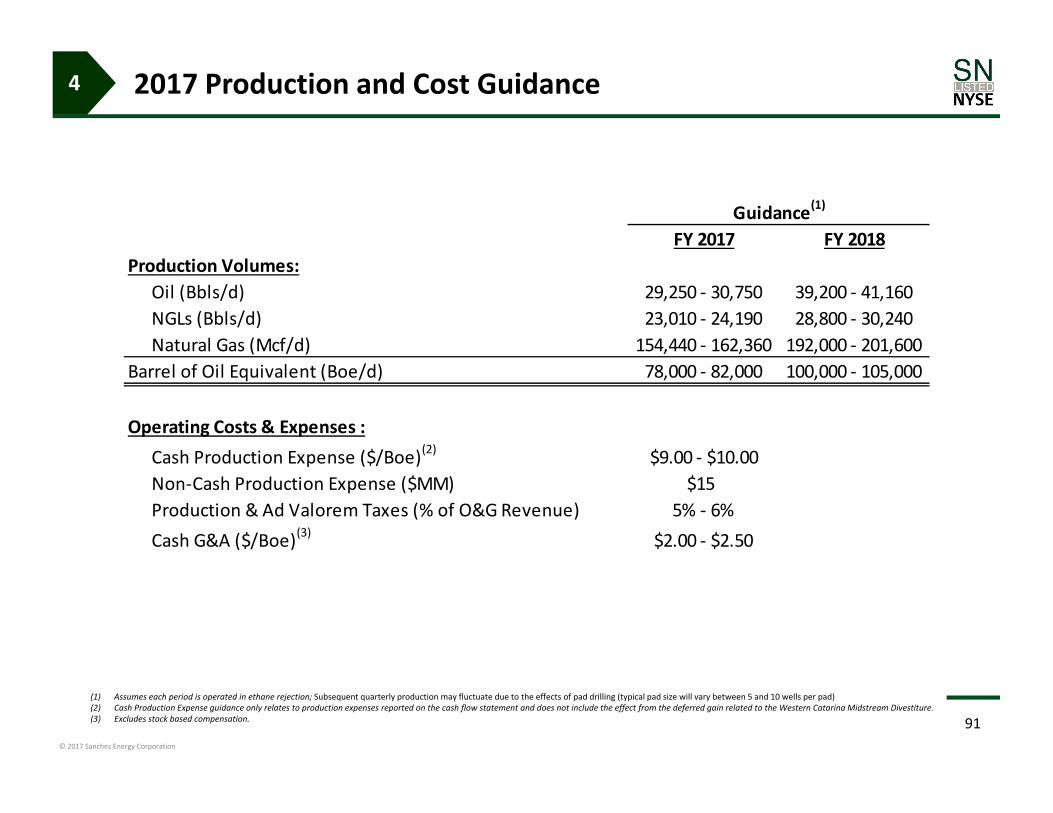
(1) Assumes each period is operated in ethane rejection; Subsequent quarterly production may fluctuate due to the effects of pad drilling (typical pad size will vary between 5 and 10 wells per pad)(2) Cash Production Expense guidance only relates to production expenses reported on the cash flow statement and does not include the effect from the deferred gain related to the Western Catarina Midstream Divestiture.(3) Excludes stock based compensation.
FY 2017 FY 2018Production Volumes:
Oil (Bbls/d) 29,250 ‐ 30,750 39,200 ‐ 41,160NGLs (Bbls/d) 23,010 ‐ 24,190 28,800 ‐ 30,240Natural Gas (Mcf/d) 154,440 ‐ 162,360 192,000 ‐ 201,600
Barrel of Oil Equivalent (Boe/d) 78,000 ‐ 82,000 100,000 ‐ 105,000
Operating Costs & Expenses :Cash Production Expense ($/Boe)(2) $9.00 ‐ $10.00Non‐Cash Production Expense ($MM) $15Production & Ad Valorem Taxes (% of O&G Revenue) 5% ‐ 6%Cash G&A ($/Boe)(3) $2.00 ‐ $2.50
Guidance(1)

© 2017 Sanchez Energy Corporation
Roadmap To Financial Strength
92
4
* Price Deck: 12/30/2016 NYMEX Strip; Assumes NGL Pricing @ 30% of WTI
SN Leverage SN + Comanche Leverage
Long‐Term Outlook
EBITDA Projected to Double by 2018 Generate Free Cash Flow in 2018
Debt Leverage Below 3.0x in 2018
1.0x
2.0x
3.0x
4.0x
5.0x
2017E 2018E 2019ESTRIP* $65/$3.50
1.0x
2.0x
3.0x
4.0x
5.0x
2017E 2018E 2019ESTRIP* $65/$3.50

© 2017 Sanchez Energy Corporation
Financial Strategy = Roadmap to Financial Strength
93
Maintain Adequate Liquidity Monetize non‐core assets to build liquidity No near term debt maturities
Achieve Upside Through Balanced Commodity Mix
Continue Active Hedge Program to De‐risk Cash Flows
Focus on Remaining a Low Cost Leader Improves margins Drives value creation for shareholders
Decrease Leverage Through Cash Flow Growth
4

© 2017 Sanchez Energy Corporation
Summary
9494

© 2017 Sanchez Energy Corporation
Execution Focused in 2017
Integrate Acquired Assets
Leverage Increased Scale of Operations to Further Improve Cost Structure
Work Off Drilled and Uncompleted Well (DUC) Backlog in 2017
Expand Multi‐Bench Development to Acquired Acreage
Key Components to 2017 Operating Strategy
Successful Track Record of Acquisition Integration
Capacity to Integrate Acquisition
Manufacturing Efficiency Driven by Scale
95

© 2017 Sanchez Energy Corporation
Appendix
9696

© 2017 Sanchez Energy Corporation
Detailed Hedge Position
97
Crude Oil HedgesDaily Volume
QuarterType of Contract Bbls/d Floor Price Ceiling Price
Swaps 5,000 $51.70 Collars 2,000 $45.00 $62.00
1Q17 Total Volume 7,000Swaps 5,000 $51.70 Collars 2,000 $45.00 $62.00
2Q17 Total Volume 7,000Swaps 5,000 $51.70 Collars 2,000 $45.00 $62.00
3Q17 Total Volume 7,000Swaps 5,000 $51.70 Collars 2,000 $45.00 $62.00
4Q17 Total Volume 7,000
Natural Gas HedgesDaily Volume
Quarter Type of Contract MMBtus/d Swap PriceSwaps 120 $3.07
1Q17 Total Volume 120Swaps 104 $3.05
2Q17 Total Volume 104Swaps 120 $3.08
3Q17 Total Volume 120Swaps 103 $3.05
4Q17 Total Volume 103Swaps 94 $3.03
1Q18 Total Volume 94Swaps 84 $3.02
2Q18 Total Volume 84Swaps 75 $3.02
3Q18 Total Volume 75Swaps 71 $3.01
4Q18 Total Volume 71Swaps 20 $3.02
1Q19 Total Volume 20Swaps 20 $3.02
2Q19 Total Volume 20Swaps 20 $3.02
3Q19 Total Volume 20Swaps 20 $3.02
4Q19 Total Volume 20

© 2017 Sanchez Energy Corporation
Non–GAAP Reconciliation and Measures
Disclosure of Net Present Value (“NPV”)
Explanation of Non‐GAAP MeasuresEBITDA is defined by the Company as net income (loss) PLUS: (1) interest expense, including net losses (gains) on interest rate derivative contracts; (2) net losses (gains) on commodity derivatives; (3) net settlementsreceived (paid) on commodity derivatives; (4) depletion, depreciation, amortization, and accretion; (5) stock‐based compensation expense; (6) acquisition costs included general and administrative; (7) income tax expense(benefit); (8) loss (gain) on sale of oil and natural gas properties; (9) impairment of oil and natural gas properties; and (10) other non‐recurring items that we deem appropriate; LESS: (1) premiums on commodity derivativecontracts; (2) interest income; and (3) other non‐recurring items that we deem appropriate.
Adjusted EBITDA is used as a supplemental financial measure by our management and by external users of our financial statements, such as investors, commercial banks and others, to assess our operating performance ascompared to that of other companies in our industry, without regard to financing methods, capital structure, or historical cost basis. It is also used to assess our ability to incur and service debt and fund capital expenditures.
Our Adjusted EBITDA should not be considered an alternative to net income (loss), operating income (loss), cash flow provided by or used in operating activities or any other measure of financial performance or liquiditypresented in accordance with GAAP. Our Adjusted EBITDAmay not be comparable to similarly titled measures of another company because all companies may not calculate Adjusted EBITDA in the same manner.
This presentation contains disclosure of free cash flow, which is a “non‐GAAP financial measure,” as defined in SEC rules. Free cash flow is presented herein because of the wide acceptance of such measure by theinvestment community as financial indicators of a company’s ability to internally fund exploration and development activities. We also view the non‐GAAP measure of free cash flow as a useful tool for comparisons of ourfinancial indicators with those of peer companies that follow the full cost method of accounting. Free cash flow should not be considered as an alternative to net income or other cash flow presentations, as defined byGAAP. We have not included in this presentation forward‐looking cash flows from operating activities because such information is not accessible on a forward‐looking basis without an unreasonable effort. We are unable toprovide a reconciliation of the forward‐looking non‐GAAP financial measure, free cash flow, to the most directly comparable GAAP financial measure, cash flows from operating activities, because the information necessaryfor a quantitative reconciliation of the forward‐looking non‐GAAP financial measure to the most directly comparable GAAP financial measure is not available to us without unreasonable efforts. The probable significance ofproviding this forward‐looking non‐GAAP financial measure without the directly comparable GAAP financial measure is that such GAAP financial measure may be materially different from the corresponding non‐GAAPfinancial measure.
This presentation contains disclosure of cash production expense, which is a “non‐GAAP financial measure,” as defined in SEC rules. Cash production expense equals production expense minus non‐cash productionexpenses. Cash production expense is presented herein in an attempt to assist the public in understanding the difference between production expense as will be reported in SEC filed financials. We also view the non‐GAAPmeasure of cash production expense as a useful tool for comparisons of our financial indicators with those of peer companies. Cash production expense should not be considered as an alternative to production expensepresentations, as defined by GAAP.
This presentation contains disclosure of cash G&A per Boe, which is a “non ‐GAAP financial measure,” as defined in SEC rules. Cash G&A expense equals G&A excluding certain non‐recurring acquisition and divestitureexpenses and stock based compensation. Cash G&A is reported herein because this measure is commonly used by management, analysts and investors as an indicator of cost management and operating efficiency on acomparable basis from period to period. In addition, management believes cash G&A per Boe is used by analysts and others in valuation, comparison and investment recommendations of companies in the oil and gasindustry to allow for analysis of G&A spend without regard to stock‐based compensation programs which can vary substantially from company to company. Cash G&A per Boe should not be considered as an alternative to,or more meaningful than, total G&A per Boe as determined in accordance with U.S. GAAP and may not be comparable to other similar titled measures of other companies. We have not included in this presentationforward‐looking G&A per Boe because such information is not accessible on a forward‐looking basis without an unreasonable effort. We are unable to provide a reconciliation of the forward‐looking non‐GAAP financialmeasure, cash G&A per Boe, to the most directly comparable GAAP financial measure, G&A per Boe, because the information necessary for a quantitative reconciliation of the forward‐looking non‐GAAP financial measureto the most directly comparable GAAP financial measure is not available to us without unreasonable efforts. The probable significance of providing this forward‐looking non‐GAAP financial measure without the directlycomparable GAAP financial measure is that such GAAP financial measure may be materially different from the corresponding non‐GAAP financial measure.
The Company presents the net present value (denoted “NPV” or “NPV10” in the presentation) of our reserves attributable to our Engineered and Contingent Locations as of December 30, 2016, which is equal to the presentvalue, discounted at 10% per annum, of the estimated fair value of future cash flows of our these net of capital and operating costs, before deducting future income taxes. The Company has used a specified price deck andreserve classifications as described in this presentation. These assumptions do not coincide with SEC pricing or reserve classification guidelines. The Company does not believe NPV to be a “Non‐GAAP financial measure,” asdefined in SEC rules, since GAAP does not provide for disclosure of the Standardized Measure as of an interim date or when using non‐SEC guided assumptions and the Company believes there is no directly comparable GAAPmeasure; therefore it is not practicable to provide a reconciliation to any GAAP measure. The Company uses NPV as an arbitrary reserve asset value measure to compare against past reserve bases and the reserve bases ofother business entities. NPV should not be considered as an estimate of fair market value or as an alternative to PV‐10 or Standardized Measure. The Company’s calculations of NPV are based on numerous assumptions thatmay change as a result of future activities or circumstances.
98