2017 sftp update final report · 2019-12-20 · page 2 2017 sftp update final report • san...
TRANSCRIPT
2 0 1 7 S F T P U P D AT E F I N A L R E P O R T
O C T O B E R 2 0 1 7
PAGE 1
2017 SFTP UPDATE FINAL REPORT • SAN FRANCISCO TRANSPORTATION PLAN
SAN FRANCISCO COUNTY TRANSPORTATION AUTHORITY • OCTOBER 2017 S A N F R A N C I S C OT R A N S P O R T A T I O N P L A N
2040
CONTENTS
ACRONYMS USED IN THIS REPORT 2
INTRODUCTION 3
WHAT IS THE SAN FRANCISCO TRANSPORTATION PLAN? 3
WHAT IS THE 2017 SAN FRANCISCO TRANSPORTATION PLAN UPDATE? 3
PUBLIC INVOLVEMENT 4
INVESTMENTS BEARING FRUIT 5
IMPLEMENTATION SINCE THE ADOPTION OF 2013 SFTP 5
NEW PLANNING STUDIES COMPLETED 11
NEW TRANSPORTATION REVENUE SOURCES 17
EXISTING AND FUTURE CONDITIONS AND TRENDS 18
SAN FRANCISCO TRANSPORTATION INVESTMENT STRATEGY 25
REVENUE PROJECTIONS 26
PROJECT COST AND EVALUATION UPDATE 26
THE UPDATED INVESTMENT PLAN 27
NEED FOR NEW REVENUE ADVOCACY 28
WHAT’S NEXT? 28
NEW PLANNING EFFORTS 28
NEW REVENUE ADVOCACY 30
CONCLUSION 31
APPENDICES 32
APPENDIX A. MAP OF COMMUNITIES OF CONCERN 2017 VS. 2013 32
APPENDIX B. SUMMARY TABLE OF NTIP PROJECTS 33
APPENDIX C. PLAN AND VISION FUNDING LEVELS BY EXPENDITURE CATEGORY 34
1455 Market Street, 22nd Floor, San Francisco, CA 94103tel 415.522.4800 fax 415.522.4829 email [email protected] web www.sfcta.org
ACKNOWLEDGEMENTSWe wish to thank the following current and former staff members who contributed to the development of this report:
Michelle BeaulieuJoe CastilgioneTilly ChangAmber CrabbeCamille GuiribaJeff HobsonMaria LombardoLinda MeckelPaige MillerColin PietheMichael SchwartzDan TischlerEric Young
Report design by Bridget Smith, SFCTAPhoto credits: p. 2
2017 SFTP UPDATE FINAL REPORT • SAN FRANCISCO TRANSPORTATION PLAN
SAN FRANCISCO COUNTY TRANSPORTATION AUTHORITY • OCTOBER 20
S A N F R A N C I S C O C O U N T Y T R A N S P O R T A T I O N A U T H O R I T Y

PAGE 2
2017 SFTP UPDATE FINAL REPORT • SAN FRANCISCO TRANSPORTATION PLAN
SAN FRANCISCO COUNTY TRANSPORTATION AUTHORITY • OCTOBER 2017 S A N F R A N C I S C OT R A N S P O R T A T I O N P L A N
2040
ACRONYMS USED IN THIS REPORT
ABAG Association of Bay Area Governments
BART Bay Area Rapid Transit District
BATA Bay Area Toll Authority
BRT Bus Rapid Transit
Caltrans California Department of Transportation
CASA Committee for Affordable and Sustainable Accommodations
CoCs Communities of Concern
DMV California Department of Motor Vehicles
DTX Caltrain Downtown Extension
FCMS San Francisco Freeway Corridor Management Study
FHWA Federal Highway Administration
LRV light rail vehicles
MTC Metropolitan Transportation Commission
NTIP Neighborhood Transportation Improvement Program
OEWD Office of Economic and Workforce Development
PCI Pavement Condition Index
RAB Railyard Alternatives and I-280 Boulevard Feasibility Study
RM3 Regional Measure 3
SB 1 Senate Bill 1 (Beall and Frazier)
SFMTA San Francisco Municipal Transportation Agency
SFTP San Francisco Transportation Plan
SoMa South of Market
T2030 Transportation 2030
TDM Transportation Demand Management
TIDA Treasure Island Development Authority
TIMMA Treasure Island Mobility Management Agency
TJPA Transbay Joint Powers Authority
TNC Transportation networking company
TSP Transportation Sustainability Program
TTC Transbay Transit Center
TTF 2045 Transportation Task Force 2045
VMT vehicle miles traveled
WETA Water Emergency Transportation Authority
WTA Waterfront Transportation Assessment
YBI Yerba Buena Island
PHOTO CREDITS
Uncredited photos are from the Transportation Authority photo library. The photographers cited below, identified by their screen names, have made their work available for use on flickr Commons: Follow the link for use and licensing information.
Cover: Ed Brownson, https://flic.kr/p/eeWa9v; Contents page: Sergio Ruiz, https://flic.kr/p/9a1VCZ pp. 5, 9, 14 (top): © 2017 SFMTA pp. 7, 9 (left): TJPA p. 9 (right): Central Subway
p. 12: Freeside510, https://flic.kr/p/qJNrL2 p. 13: Sergio Ruiz, https://flic.kr/p/eF4NyK p. 16: Michael Emery, allrights reserved p. 31: Daniel Parks, https://flic.kr/p/e7tonA

PAGE 3
2017 SFTP UPDATE FINAL REPORT • SAN FRANCISCO TRANSPORTATION PLAN
SAN FRANCISCO COUNTY TRANSPORTATION AUTHORITY • OCTOBER 2017 S A N F R A N C I S C OT R A N S P O R T A T I O N P L A N
2040
INTRODUCTION
WHAT IS THE SAN FRANCISCO TRANSPORTATION PLAN?
The San Francisco Transportation Plan, or SFTP, is the county-wide, long-range investment and policy blueprint for San Fran-cisco’s multi-modal transportation system.
The SFTP, outlines a diverse investment strategy to make progress toward four important goals through the year 2040:
• Safe and livable neighborhoods
• Economic competitiveness
• World class infrastructure
• Environmental health
The plan also identifies complementary policy initiatives to help us make the most out of these investments.
As the Congestion Management Agency for San Francisco, the
San Francisco County Transportation Au-thority is responsible for developing the SFTP. We developed the plan through ro-bust technical analysis, consultation with part-ner agencies, and com-munity outreach.
WHAT IS THE 2017 SAN FRANCISCO TRANSPORTATION PLAN UPDATE?
The Transportation Authority will update the SFTP, on a periodic basis to report on progress and incorporate new information. This report serves as an update to the 2013 SFTP.
Strengthen the city’s economic competitiveness
Ensure a healthy
environment
Create a more livable
city
Provide world-class
infrastructure and service
EQUITY EQUITY
E
QUITY
E
QUI
TY
Figure 1. SFTP Goal Areas
SFTP GOALS
As we strive to make progress toward the four goals outlined in the SFTP (see Figure 1. SFTP Goal Areas), we must address several critical challenges.
To offer world-class infrastructure, we must address decades of underinvestment in Muni and regional transit and ensure that streets and sidewalks are well-maintained. We will need to complement these rehab efforts with operational and technology initiatives to increase overall transit efficiency.
To achieve safe and livable neighborhoods, we need to ensure reliable transit access for residents in areas further from the city center and during off-peak and night time hours. We also need to ensure safe biking and walking for all ages.
To remain economically competitive, we must provide affordable and reliable transportation that addresses current transit ca-pacity issues and keeps pace with our rapidly growing population and job market.
And to, maintain a healthy environment, we must reduce greenhouse gas emissions. We can achieve this goal through com-prehensive demand management strategies that reduce vehicle miles traveled. These include congestion and vehicle pricing; major core capacity upgrades (e.g. new vehicles for transit operators and study of a second transbay tube across the bay); and employer outreach and incentives.
Importantly, the SFTP approaches all of these goals through the lens of equity. For example, when expanding access to transit, we must address the needs of vulnerable and underserved communities through efforts like fare discount policies and late-night transit needs assessments. And when evaluating neighborhood-scale planning needs, it is important to address socio-economic and geographic equity disparities such as impacts on communities of concern as well as the outer neighborhoods.
PAGE 4
2017 SFTP UPDATE FINAL REPORT • SAN FRANCISCO TRANSPORTATION PLAN
SAN FRANCISCO COUNTY TRANSPORTATION AUTHORITY • OCTOBER 2017 S A N F R A N C I S C OT R A N S P O R T A T I O N P L A N
2040
The 2017 SFTP Update reaffirms the 2013 plan’s goals, invest-ment plan, and supporting policy recommendations. It provides a progress report on projects, policies, and planning studies that were recommended in the 2013 plan and incorporates new topics that have emerged since the prior plan’s adoption. The update also includes the latest data on existing and future conditions such as population growth, employment rates, traffic congestion, and af-fordability trends that impact San Francisco’s transportation sys-tem.
The Transportation Authority gathered input from the authority’s board, partner agencies, and the public to establish the priorities and objectives outlined in this update. These efforts will guide ad-vocacy for other near-term transportation funding and prioritiza-tion decisions and inform the next major update of the SFTP and Plan Bay Area (see “Relation to Plan Bay Area” box below).
PUBLIC INVOLVEMENT
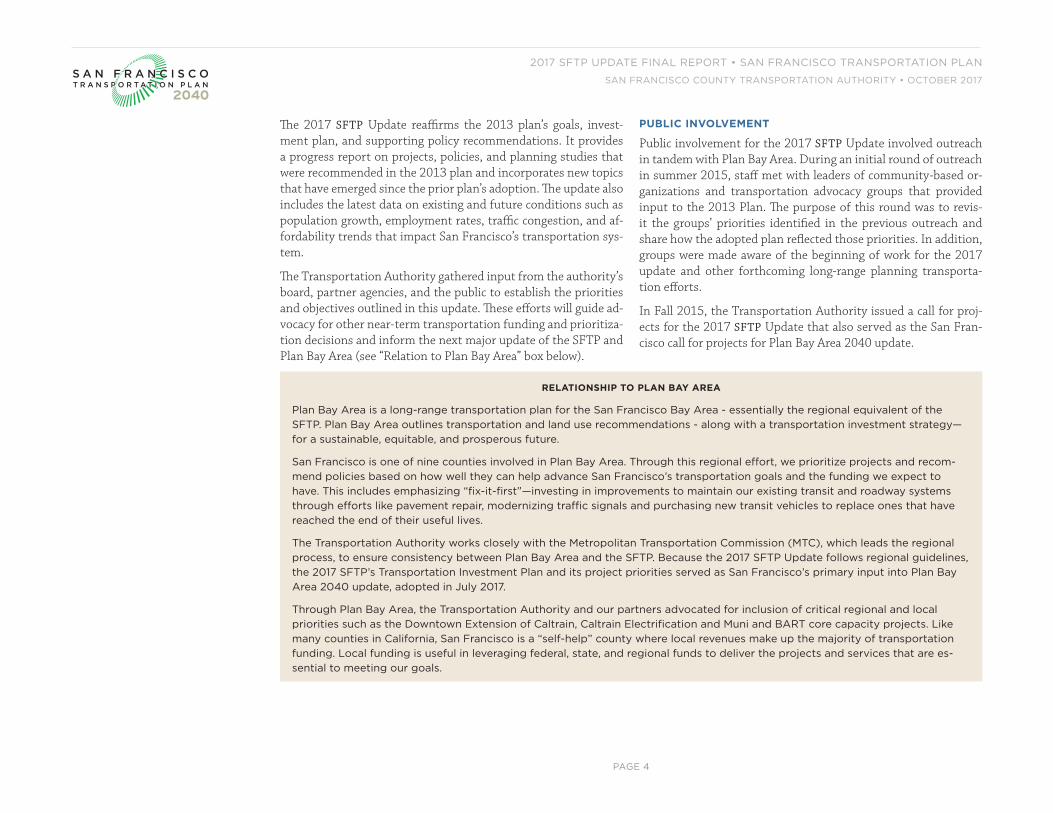
Public involvement for the 2017 SFTP Update involved outreach in tandem with Plan Bay Area. During an initial round of outreach in summer 2015, staff met with leaders of community-based or-ganizations and transportation advocacy groups that provided input to the 2013 Plan. The purpose of this round was to revis-it the groups’ priorities identified in the previous outreach and share how the adopted plan reflected those priorities. In addition, groups were made aware of the beginning of work for the 2017 update and other forthcoming long-range planning transporta-tion efforts.
In Fall 2015, the Transportation Authority issued a call for proj-ects for the 2017 SFTP Update that also served as the San Fran-cisco call for projects for Plan Bay Area 2040 update.
RELATIONSHIP TO PLAN BAY AREA
Plan Bay Area is a long-range transportation plan for the San Francisco Bay Area - essentially the regional equivalent of the SFTP. Plan Bay Area outlines transportation and land use recommendations - along with a transportation investment strategy—for a sustainable, equitable, and prosperous future.
San Francisco is one of nine counties involved in Plan Bay Area. Through this regional effort, we prioritize projects and recom-mend policies based on how well they can help advance San Francisco’s transportation goals and the funding we expect to have. This includes emphasizing “fix-it-first”—investing in improvements to maintain our existing transit and roadway systems through efforts like pavement repair, modernizing traffic signals and purchasing new transit vehicles to replace ones that have reached the end of their useful lives.
The Transportation Authority works closely with the Metropolitan Transportation Commission (MTC), which leads the regional process, to ensure consistency between Plan Bay Area and the SFTP. Because the 2017 SFTP Update follows regional guidelines, the 2017 SFTP’s Transportation Investment Plan and its project priorities served as San Francisco’s primary input into Plan Bay Area 2040 update, adopted in July 2017.
Through Plan Bay Area, the Transportation Authority and our partners advocated for inclusion of critical regional and local priorities such as the Downtown Extension of Caltrain, Caltrain Electrification and Muni and BART core capacity projects. Like many counties in California, San Francisco is a “self-help” county where local revenues make up the majority of transportation funding. Local funding is useful in leveraging federal, state, and regional funds to deliver the projects and services that are es-sential to meeting our goals.
PAGE 5
2017 SFTP UPDATE FINAL REPORT • SAN FRANCISCO TRANSPORTATION PLAN
SAN FRANCISCO COUNTY TRANSPORTATION AUTHORITY • OCTOBER 2017 S A N F R A N C I S C OT R A N S P O R T A T I O N P L A N
2040
In September 2017, local and regional partner agencies were in-formed of the draft 2017 SFTP Update document with emphasis on progress on 1) 2013 SFTP recommendations and initiatives, and 2) the results of our input and advocacy on Plan Bay Area 2040 update.
INVESTMENTS BEARING FRUIT
IMPLEMENTATION SINCE THE ADOPTION OF 2013 SFTP
Within a constrained budget largely set by local forecasts and MTC financial projections, the 2013 SFTP recommends three key categories of expenditures in the Transportation Investment Strategy:
• ONGOING MAINTENANCE AND OPERATIONS FUNDING. Each investment scenario recommends funding levels for the on-going maintenance, operations, and replacement of our street network and transit system. The vast majority of total fund-ing is dedicated to this category. The category includes proj-ects like roadway repaving, traffic signal maintenance, and buying new transit vehicles to replace ones that have reached the end of their useful life.
• TRANSPORTATION PROGRAM AND ENHANCEMENTS. This cat-egory includes investment in seven transportation programs that improve safety and expand or enhance the transportation system through small-to-medium scale improvements for all modes. The seven programs are Walking and Traffic Calming, Bicycling, Regional Transit Enhancements, Muni Enhance-ments and Customer First Treatments, Street and Signal Up-grades and Street Network Development, Transportation De-mand Management, and Equity.
• EFFICIENCY AND EXPANSION PROJECTS. This category rec-ommends funding for a list of major capital projects and pro-grams that would improve the efficiency of the existing system or cost-effectively expand system capacity.
These categories address San Francisco’s current twin challenges of experiencing both “aging pains” (aging and undermaintained infrastructure) and “growing pains” (rapidly increasing demands
from a robust economy and growing city). The following sections highlight key milestones and progress since adoption of the 2013 SFTP, that contribute towards the SFTP’s goals, grouped by expenditure category.
Ongoing Maintenance and OperationsNEW SFMTA BUSES AND LIGHT RAIL VEHICLES
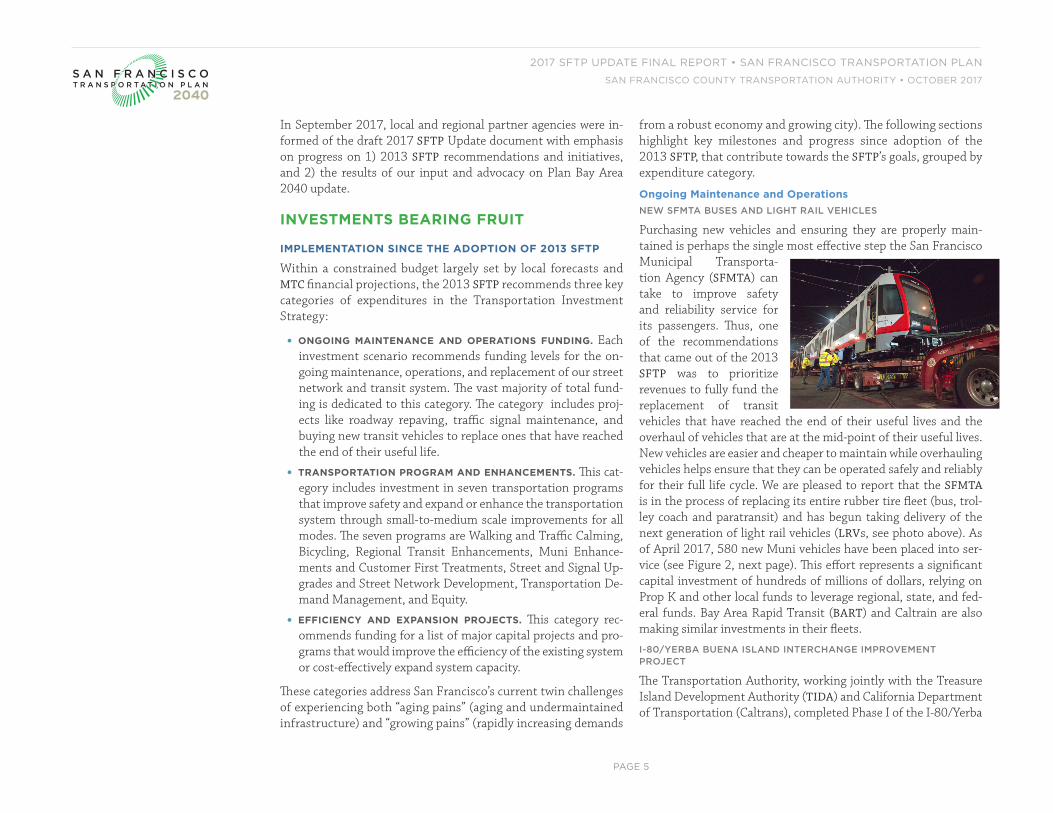
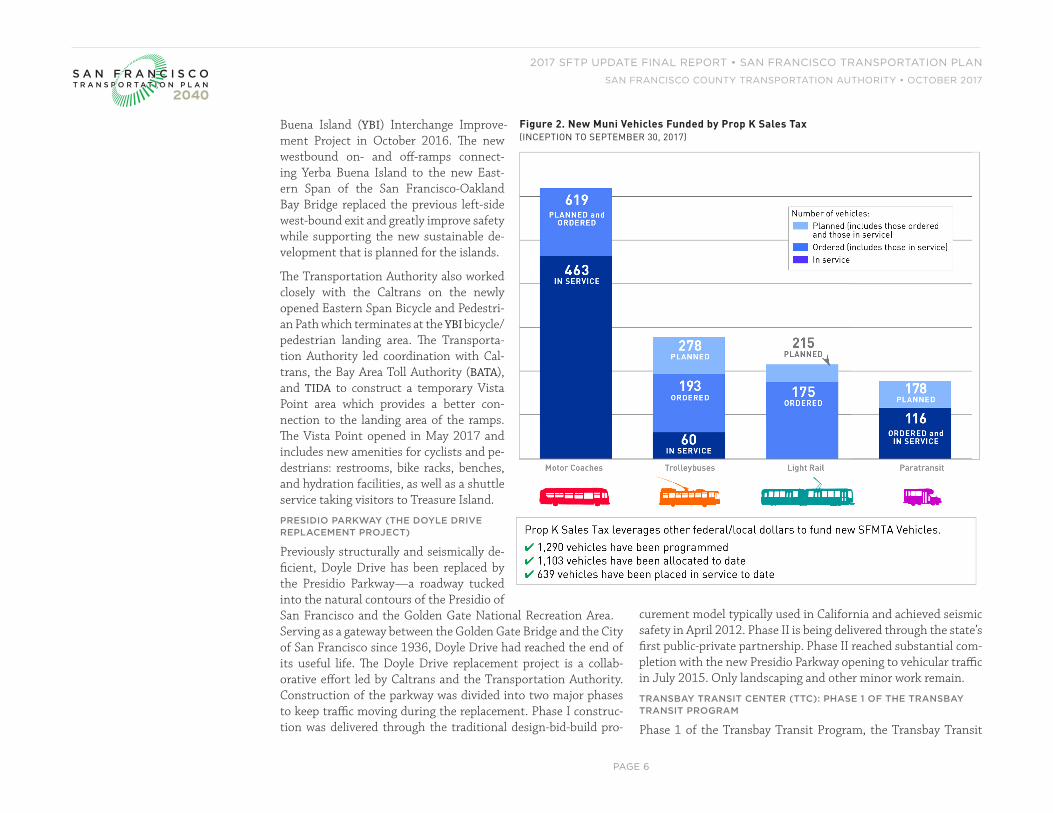
Purchasing new vehicles and ensuring they are properly main-tained is perhaps the single most effective step the San Francisco Municipal Transporta-tion Agency (SFMTA) can take to improve safety and reliability service for its passengers. Thus, one of the recommendations that came out of the 2013 SFTP was to prioritize revenues to fully fund the replacement of transit vehicles that have reached the end of their useful lives and the overhaul of vehicles that are at the mid-point of their useful lives. New vehicles are easier and cheaper to maintain while overhauling vehicles helps ensure that they can be operated safely and reliably for their full life cycle. We are pleased to report that the SFMTA is in the process of replacing its entire rubber tire fleet (bus, trol-ley coach and paratransit) and has begun taking delivery of the next generation of light rail vehicles (LRVs, see photo above). As of April 2017, 580 new Muni vehicles have been placed into ser-vice (see Figure 2, next page). This effort represents a significant capital investment of hundreds of millions of dollars, relying on Prop K and other local funds to leverage regional, state, and fed-eral funds. Bay Area Rapid Transit (BART) and Caltrain are also making similar investments in their fleets.
I-80/YERBA BUENA ISLAND INTERCHANGE IMPROVEMENT PROJECT
The Transportation Authority, working jointly with the Treasure Island Development Authority (TIDA) and California Department of Transportation (Caltrans), completed Phase I of the I-80/Yerba
PAGE 6
2017 SFTP UPDATE FINAL REPORT • SAN FRANCISCO TRANSPORTATION PLAN
SAN FRANCISCO COUNTY TRANSPORTATION AUTHORITY • OCTOBER 2017 S A N F R A N C I S C OT R A N S P O R T A T I O N P L A N
2040
Buena Island (YBI) Interchange Improve-ment Project in October 2016. The new westbound on- and off-ramps connect-ing Yerba Buena Island to the new East-ern Span of the San Francisco-Oakland Bay Bridge replaced the previous left-side west-bound exit and greatly improve safety while supporting the new sustainable de-velopment that is planned for the islands.
The Transportation Authority also worked closely with the Caltrans on the newly opened Eastern Span Bicycle and Pedestri-an Path which terminates at the YBI bicycle/pedestrian landing area. The Transporta-tion Authority led coordination with Cal-trans, the Bay Area Toll Authority (BATA), and TIDA to construct a temporary Vista Point area which provides a better con-nection to the landing area of the ramps. The Vista Point opened in May 2017 and includes new amenities for cyclists and pe-destrians: restrooms, bike racks, benches, and hydration facilities, as well as a shuttle service taking visitors to Treasure Island.
PRESIDIO PARKWAY (THE DOYLE DRIVE REPLACEMENT PROJECT)
Previously structurally and seismically de-ficient, Doyle Drive has been replaced by the Presidio Parkway—a roadway tucked into the natural contours of the Presidio of San Francisco and the Golden Gate National Recreation Area. Serving as a gateway between the Golden Gate Bridge and the City of San Francisco since 1936, Doyle Drive had reached the end of its useful life. The Doyle Drive replacement project is a collab-orative effort led by Caltrans and the Transportation Authority. Construction of the parkway was divided into two major phases to keep traffic moving during the replacement. Phase I construc-tion was delivered through the traditional design-bid-build pro-
curement model typically used in California and achieved seismic safety in April 2012. Phase II is being delivered through the state’s first public-private partnership. Phase II reached substantial com-pletion with the new Presidio Parkway opening to vehicular traffic in July 2015. Only landscaping and other minor work remain.
TRANSBAY TRANSIT CENTER (TTC): PHASE 1 OF THE TRANSBAY TRANSIT PROGRAM
Phase 1 of the Transbay Transit Program, the Transbay Transit
Figure 2. New Muni Vehicles Funded by Prop K Sales Tax(INCEPTION TO SEPTEMBER 30, 2017)

PAGE 7
2017 SFTP UPDATE FINAL REPORT • SAN FRANCISCO TRANSPORTATION PLAN
SAN FRANCISCO COUNTY TRANSPORTATION AUTHORITY • OCTOBER 2017 S A N F R A N C I S C OT R A N S P O R T A T I O N P L A N
2040
Center, transforms the for-mer bus terminal at First and Mission streets into a destination bus and rail hub (see photo of the Grand Hall at left). It will connect eight Bay Area counties and other parts of the state through 11 transit systems: AC Transit, BART, Caltrain, Golden Gate
Transit, Greyhound, Muni, SamTrans, WestCAT Lynx, Amtrak, paratransit and future high-speed rail from San Francisco to Los Angeles/Anaheim. In addition to improved transit access, Phase 1 includes a new 5.4-acre rooftop park and more than 100,000 square feet of retail space to serve both transit riders and the new neighborhood that is emerging in the area surrounding the Tran-sit Center. The Transit Center is projected to have 100,000 visitors each day. Phase 1 is expected to be complete by winter 2017/18, and bus service will begin by spring 2018.
STREET RESURFACING
Smooth, repaved streets improve safety and the comfort of travel whether getting around by foot, bike, bus, or car. The City uses the Pavement Condition Index (PCI) to rate road conditions on a scale from 0-100, with zero being a pothole-riddled crumbling street and 100 being a newly surfaced roadway.1 Continued con-tributions primarily from the General Fund and the 2011 Prop B Road Repaving and Street Safety Bonds as well as Prop K sales tax and Prop AA vehicle registration fees, have enabled San Francisco Public Works to steadily improve the quality of the streets from a PCI score of 63 in 2009 to 69 in 2016 (see Figure 3). The City is working toward a goal of a PCI score of 70 which would take street conditions from its current “at-risk” rating to “good.”
Transportation Program and Enhancements BICYCLE IMPROVEMENT PROJECTS
Since adoption of the 2013 SFTP, the SFMTA completed many bi-cycle projects with funding from several sources such as Prop K, Prop AA, One Bay Area Grant and the Transportation Fund for Clean Air. These include the Civic Center BART/Muni Station bike
station, the two-block pilot Market Street Raised Cycletrack, bike facility improve-ments on Arguello Blvd and Golden Gate Ave, intersection im-provements at 7th and Lincoln, a barrier protected bike lane on San Jose Avenue, and bicycle facilities on Mansell through McLaren Park. Re-cently, protected bi-cycle facilities opened on 7th and 8th streets
1 http://sfgov.org/scorecards/pavement-condition-index
2005 2006 2007 2008 2009 2010 2011 2012 2013 2014 2015 2016
At RiskGoodBay AreaSan Francisco
80
75
70
65
60
55
50
Figure 3. Pavement Condition Index (PCI) 2005-2016
65
64 64 64 64 6465
66
6768
69
63
PAGE 8
2017 SFTP UPDATE FINAL REPORT • SAN FRANCISCO TRANSPORTATION PLAN
SAN FRANCISCO COUNTY TRANSPORTATION AUTHORITY • OCTOBER 2017 S A N F R A N C I S C OT R A N S P O R T A T I O N P L A N
2040
and 13th/Division Street. Protected bicycle facilities were recently approved by the SFMTA Board for several blocks of upper Market Street. Through the short-term bike parking program, the SFMTA has also installed hundreds of new racks and on-street corrals and continues to respond to areas of need and public requests.
Other projects continue to advance like the expansion of the Ford GoBike bike share system from fewer than 400 to 4,500 bikes. The SFMTA is developing exclusive bicycle and pedestrian facilities at Twin Peaks, installing additional counters and barometers, and implementing citywide bicycle wayfinding. They are also planning and conducting conceptual design work on corridors identified in their Bicycle Strategy (e.g. a “neighborway” in the Richmond dis-trict) and through Neighborhood Transportation Improvement Program (NTIP) efforts (e.g. Alemany Interchange Improvement Study and Western Addition Community-Based Plan). All these projects reinforce the 2013 SFTP recommendation to establish safer neighborhood bicycle networks citywide.
VISION ZERO
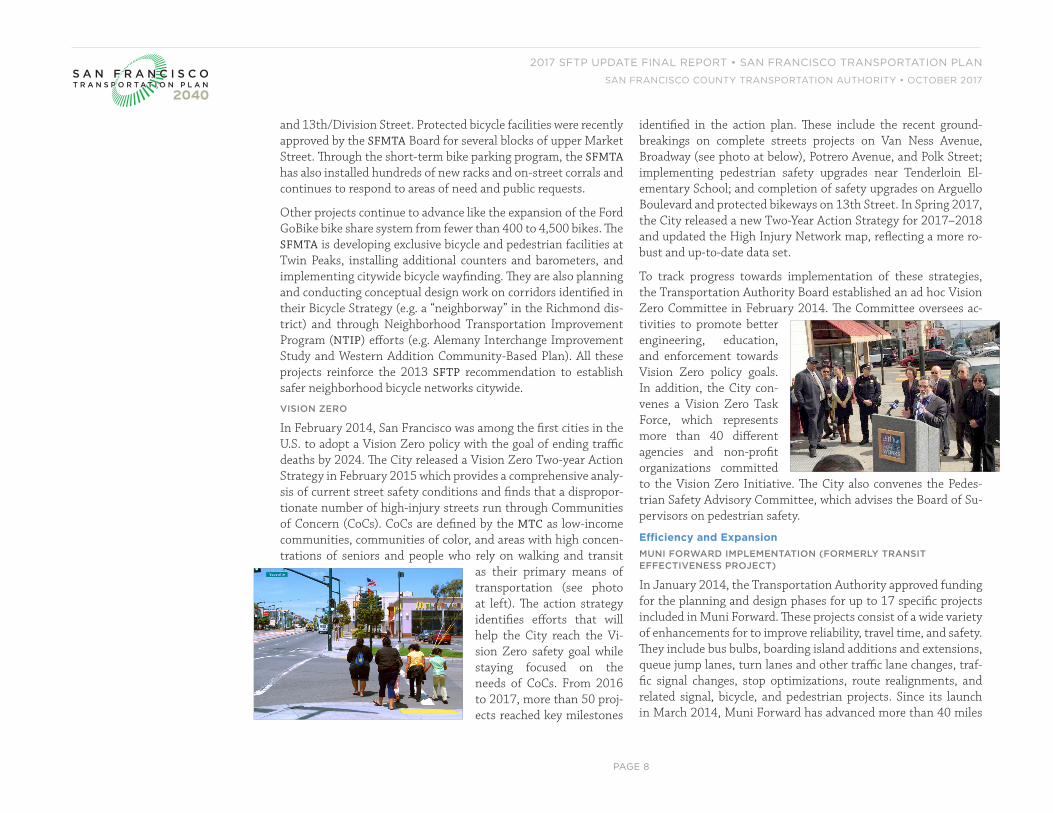
In February 2014, San Francisco was among the first cities in the U.S. to adopt a Vision Zero policy with the goal of ending traffic deaths by 2024. The City released a Vision Zero Two-year Action Strategy in February 2015 which provides a comprehensive analy-sis of current street safety conditions and finds that a dispropor-tionate number of high-injury streets run through Communities of Concern (CoCs). CoCs are defined by the MTC as low-income communities, communities of color, and areas with high concen-trations of seniors and people who rely on walking and transit
as their primary means of transportation (see photo at left). The action strategy identifies efforts that will help the City reach the Vi-sion Zero safety goal while staying focused on the needs of CoCs. From 2016 to 2017, more than 50 proj-ects reached key milestones
identified in the action plan. These include the recent ground-breakings on complete streets projects on Van Ness Avenue, Broadway (see photo at below), Potrero Avenue, and Polk Street; implementing pedestrian safety upgrades near Tenderloin El-ementary School; and completion of safety upgrades on Arguello Boulevard and protected bikeways on 13th Street. In Spring 2017, the City released a new Two-Year Action Strategy for 2017–2018 and updated the High Injury Network map, reflecting a more ro-bust and up-to-date data set.
To track progress towards implementation of these strategies, the Transportation Authority Board established an ad hoc Vision Zero Committee in February 2014. The Committee oversees ac-tivities to promote better engineering, education, and enforcement towards Vision Zero policy goals. In addition, the City con-venes a Vision Zero Task Force, which represents more than 40 different agencies and non-profit organizations committed to the Vision Zero Initiative. The City also convenes the Pedes-trian Safety Advisory Committee, which advises the Board of Su-pervisors on pedestrian safety.
Efficiency and Expansion MUNI FORWARD IMPLEMENTATION (FORMERLY TRANSIT EFFECTIVENESS PROJECT)
In January 2014, the Transportation Authority approved funding for the planning and design phases for up to 17 specific projects included in Muni Forward. These projects consist of a wide variety of enhancements for to improve reliability, travel time, and safety. They include bus bulbs, boarding island additions and extensions, queue jump lanes, turn lanes and other traffic lane changes, traf-fic signal changes, stop optimizations, route realignments, and related signal, bicycle, and pedestrian projects. Since its launch in March 2014, Muni Forward has advanced more than 40 miles
PAGE 9
2017 SFTP UPDATE FINAL REPORT • SAN FRANCISCO TRANSPORTATION PLAN
SAN FRANCISCO COUNTY TRANSPORTATION AUTHORITY • OCTOBER 2017 S A N F R A N C I S C OT R A N S P O R T A T I O N P L A N
2040
of improvements through the planning phase and legislative ap-proval. The SFMTA is conducting outreach for additional projects to prepare for legislation that will allow these projects to advance to detailed design.
The SFMTA completed construction for the 5-Fulton, 10-Townsend and 14-Mission lines. Improvements for the 5-Fulton line include new transit bulbs and flashing beacon pedestrian crossings. For the 10-Townsend line, the SFMTA recently completed the exten-sion of a southbound contraflow lane (traveling in the opposite di-rection of other lanes) on Sansome from Clay Street to Broadway intended for exclusive use by Muni, taxis and commercial vehicles from 6 A.M. to 8 P.M. daily. With this new, direct route, riders on the 10-Townsend and 12-Folsom/Pacific are expected to save up to three minutes per outbound trip. The SFMTA has also con-structed improvements on 2.4 miles of the 14-Mission line add-ing transit-only lanes and new bus zones.
More recently, the Transportation Authority and the SFMTA boards in 2017 adopted the Geary Bus Rapid Transit (BRT) pre-ferred alternative and state environmental review findings. The initial phase of the project, from the Transbay Terminal in South of Market (SoMa) to Inner Richmond, is undergoing design and final Federal approvals, and is scheduled to begin construction in 2018. The SFMTA has also advanced planning for other major transit corridors including the 16th Street 22-Fillmore line, Gene-va BRT and Better Market Street. Muni Forward has been funded with a combination of local, regional, state and federal sources such as Prop K, Prop A general obligation bonds, General Fund, and regional Transit Performance Initiative funds.
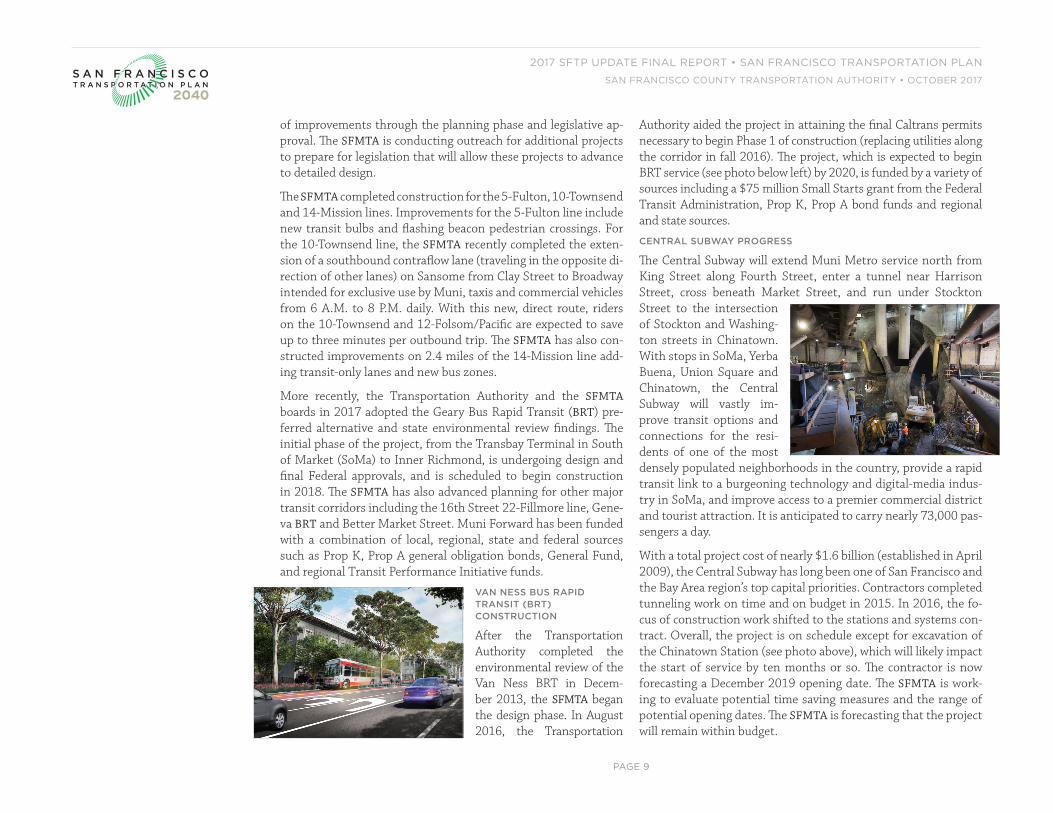
VAN NESS BUS RAPID TRANSIT (BRT) CONSTRUCTION
After the Transportation Authority completed the environmental review of the Van Ness BRT in Decem-ber 2013, the SFMTA began the design phase. In August 2016, the Transportation
Authority aided the project in attaining the final Caltrans permits necessary to begin Phase 1 of construction (replacing utilities along the corridor in fall 2016). The project, which is expected to begin BRT service (see photo below left) by 2020, is funded by a variety of sources including a $75 million Small Starts grant from the Federal Transit Administration, Prop K, Prop A bond funds and regional and state sources.
CENTRAL SUBWAY PROGRESS
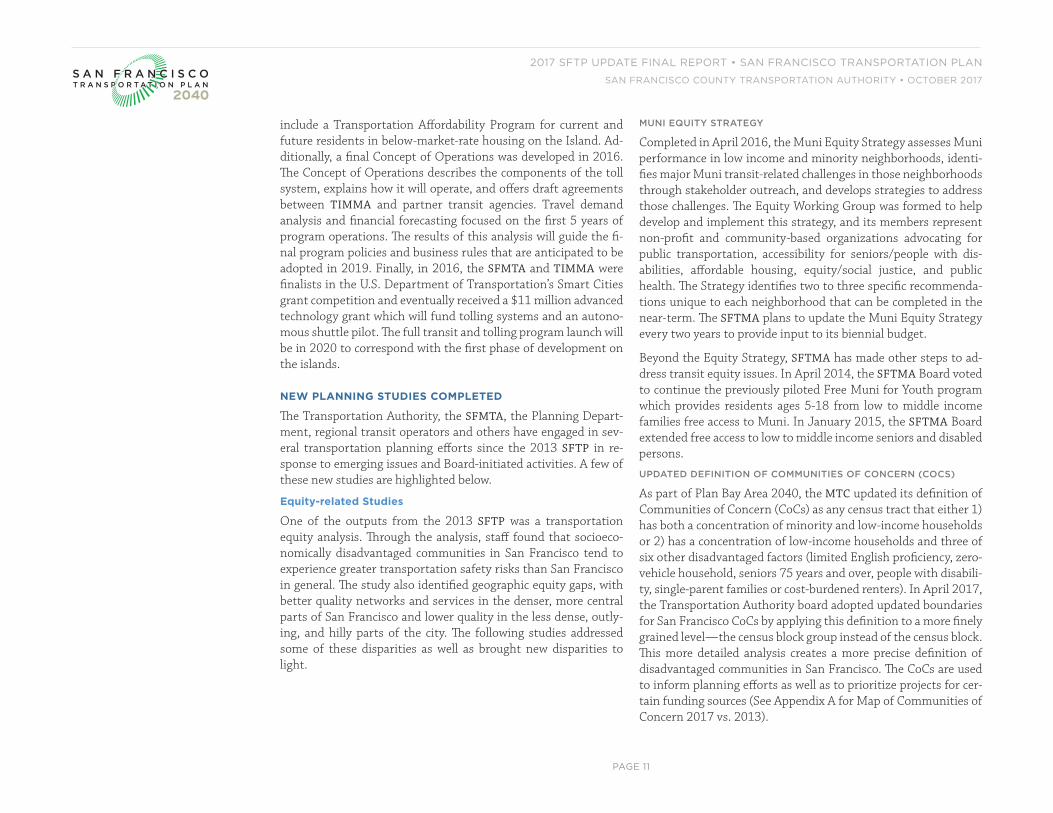
The Central Subway will extend Muni Metro service north from King Street along Fourth Street, enter a tunnel near Harrison Street, cross beneath Market Street, and run under Stockton Street to the intersection of Stockton and Washing-ton streets in Chinatown. With stops in SoMa, Yerba Buena, Union Square and Chinatown, the Central Subway will vastly im-prove transit options and connections for the resi-dents of one of the most densely populated neighborhoods in the country, provide a rapid transit link to a burgeoning technology and digital-media indus-try in SoMa, and improve access to a premier commercial district and tourist attraction. It is anticipated to carry nearly 73,000 pas-sengers a day.
With a total project cost of nearly $1.6 billion (established in April 2009), the Central Subway has long been one of San Francisco and the Bay Area region’s top capital priorities. Contractors completed tunneling work on time and on budget in 2015. In 2016, the fo-cus of construction work shifted to the stations and systems con-tract. Overall, the project is on schedule except for excavation of the Chinatown Station (see photo above), which will likely impact the start of service by ten months or so. The contractor is now forecasting a December 2019 opening date. The SFMTA is work-ing to evaluate potential time saving measures and the range of potential opening dates. The SFMTA is forecasting that the project will remain within budget.

PAGE 10
2017 SFTP UPDATE FINAL REPORT • SAN FRANCISCO TRANSPORTATION PLAN
SAN FRANCISCO COUNTY TRANSPORTATION AUTHORITY • OCTOBER 2017 S A N F R A N C I S C OT R A N S P O R T A T I O N P L A N
2040
CALTRAIN DOWNTOWN EXTENSION (DTX): PHASE 2 OF THE TRANSBAY TRANSIT PROGRAM
The Caltrain Downtown Extension (DTX), Phase 2 of the Transbay Transit Program, will extend commuter rail service 1.3 miles from its current terminus at Fourth and King streets into the lower lev-el of the new Transbay Transit Center (see p. 8 and visualization at
left). As prioritized in Plan Bay Area 2040, the DTX is a regional Federal New Starts rail program priority, which will eventually accom-modate blended Caltrain/High-Speed Rail service and provide direct transit access to downtown San Francisco from points south. DTX also
responds to some of the findings of the Core Circulation Study in Appendix C of the 2013 SFTP.
While DTX is a major milestone that will build momentum for High-Speed Rail, stakeholder cities and regional governments must provide strong leadership to keep the project moving for-ward particularly given the project’s funding gap. Since the 2013 SFTP, the DTX underwent a MTC-led cost review, increasing the estimated total project cost to $3.9 billion. This adjustment pri-marily reflects cost escalation due to inflation and the addition of scope elements such as an underground pedestrian connec-tor to the BART/Muni Embarcadero Station. So far, the Transbay Joint Powers Authority (TJPA) has environmentally cleared its preferred alignment and is working to bring all elements of the DTX to 30% conceptual engineering. At the same time, the TJPA is exploring engineering options and new construction methods that would reduce impacts of construction on surface transporta-tion and local businesses.
Concurrently, the TJPA is coordinating with the Planning Depart-ment which is leading the Railyard Alternatives and I-280 Boule-vard Feasibility Study (RAB). The Study considers the transporta-tion investments of DTX in relation to potential land use changes
in the SoMa, Mission Bay, and Showplace Square/Lower Potrero Hill neighborhoods. The study looks at various elements: poten-tial alternate alignments for the DTX, modifying or relocating the 4th and King Street railyard, and ensuring that the east-west run-ning 16th Street remains at grade with railway tracks dipping be-low the street and Muni’s 22-Fillmore line at this location. By late 2017, the City, the Transportation Authority, and the TJPA, are anticipated to act on whether they wish to further evaluate any of the RAB alternative alignments for the DTX or proceed with advancing the current environmentally cleared alignment.
TREASURE ISLAND MOBILITY MANAGEMENT AGENCY (TIMMA) PROGRAM
In July 2014, at the recommendation of the TIDA board, the Board of Supervisors officially designated the Transportation Authority as the Treasure Island Mobility Management Agency (TIMMA). In September, Governor Brown signed Assembly Bill 141, establish-ing the TIMMA as a legal entity distinct from the Transportation Authority. TIMMA is responsible for developing and operating an innovative mobility management and congestion pricing pro-gram on Treasure Island as it redevelops. As proposed, the rede-velopment includes 8,000 homes, 500 hotel rooms, and 550,000 square feet of office and retail uses. The major goal of the Mobility Manage-ment program is to ensure vehicle mode shares are maintained below 50% and that mobility options (e.g. tolled vehicle trips and multiple transit ser-vices (see proposed ferry terminal at right) to be funded by tolls and other sources) are af-fordable and accessible by the public.
In 2016, the TIMMA Board, comprised of the San Francisco Board of Supervisors, adopted preliminary congestion toll policies. The recommendations, adopted as the Treasure Island Mobility Management Study, in response to Board and community input,
PAGE 11
2017 SFTP UPDATE FINAL REPORT • SAN FRANCISCO TRANSPORTATION PLAN
SAN FRANCISCO COUNTY TRANSPORTATION AUTHORITY • OCTOBER 2017 S A N F R A N C I S C OT R A N S P O R T A T I O N P L A N
2040
include a Transportation Affordability Program for current and future residents in below-market-rate housing on the Island. Ad-ditionally, a final Concept of Operations was developed in 2016. The Concept of Operations describes the components of the toll system, explains how it will operate, and offers draft agreements between TIMMA and partner transit agencies. Travel demand analysis and financial forecasting focused on the first 5 years of program operations. The results of this analysis will guide the fi-nal program policies and business rules that are anticipated to be adopted in 2019. Finally, in 2016, the SFMTA and TIMMA were finalists in the U.S. Department of Transportation’s Smart Cities grant competition and eventually received a $11 million advanced technology grant which will fund tolling systems and an autono-mous shuttle pilot. The full transit and tolling program launch will be in 2020 to correspond with the first phase of development on the islands.
NEW PLANNING STUDIES COMPLETED
The Transportation Authority, the SFMTA, the Planning Depart-ment, regional transit operators and others have engaged in sev-eral transportation planning efforts since the 2013 SFTP in re-sponse to emerging issues and Board-initiated activities. A few of these new studies are highlighted below.
Equity-related Studies
One of the outputs from the 2013 SFTP was a transportation equity analysis. Through the analysis, staff found that socioeco-nomically disadvantaged communities in San Francisco tend to experience greater transportation safety risks than San Francisco in general. The study also identified geographic equity gaps, with better quality networks and services in the denser, more central parts of San Francisco and lower quality in the less dense, outly-ing, and hilly parts of the city. The following studies addressed some of these disparities as well as brought new disparities to light.
MUNI EQUITY STRATEGY
Completed in April 2016, the Muni Equity Strategy assesses Muni performance in low income and minority neighborhoods, identi-fies major Muni transit-related challenges in those neighborhoods through stakeholder outreach, and develops strategies to address those challenges. The Equity Working Group was formed to help develop and implement this strategy, and its members represent non-profit and community-based organizations advocating for public transportation, accessibility for seniors/people with dis-abilities, affordable housing, equity/social justice, and public health. The Strategy identifies two to three specific recommenda-tions unique to each neighborhood that can be completed in the near-term. The SFTMA plans to update the Muni Equity Strategy every two years to provide input to its biennial budget.
Beyond the Equity Strategy, SFTMA has made other steps to ad-dress transit equity issues. In April 2014, the SFTMA Board voted to continue the previously piloted Free Muni for Youth program which provides residents ages 5-18 from low to middle income families free access to Muni. In January 2015, the SFTMA Board extended free access to low to middle income seniors and disabled persons.
UPDATED DEFINITION OF COMMUNITIES OF CONCERN (COCS)
As part of Plan Bay Area 2040, the MTC updated its definition of Communities of Concern (CoCs) as any census tract that either 1) has both a concentration of minority and low-income households or 2) has a concentration of low-income households and three of six other disadvantaged factors (limited English proficiency, zero-vehicle household, seniors 75 years and over, people with disabili-ty, single-parent families or cost-burdened renters). In April 2017, the Transportation Authority board adopted updated boundaries for San Francisco CoCs by applying this definition to a more finely grained level—the census block group instead of the census block. This more detailed analysis creates a more precise definition of disadvantaged communities in San Francisco. The CoCs are used to inform planning efforts as well as to prioritize projects for cer-tain funding sources (See Appendix A for Map of Communities of Concern 2017 vs. 2013).

PAGE 12
2017 SFTP UPDATE FINAL REPORT • SAN FRANCISCO TRANSPORTATION PLAN
SAN FRANCISCO COUNTY TRANSPORTATION AUTHORITY • OCTOBER 2017 S A N F R A N C I S C OT R A N S P O R T A T I O N P L A N
2040
LATE NIGHT TRANSPORTATION PLAN
In January 2015, the Transportation Authority, the San Francis-co Entertainment Commission and the Office of Economic and Workforce Development (OEWD) released the Late Night Trans-
portation Plan.2 The study contains recommendations to improve service, accessi-bility, reliability and safety for those who travel in the overnight/early morning hours, either for work or recreation. Since then, the Transportation Authority has developed a prioritized
set of recommended changes and expansions to the network of All-Nighter transit service provided by SFTMA (see photo at left), AC Transit, and SamTrans. AC Transit and SamTrans have ini-tiated new late night/“All Nighter” services to respond to these needs. Since BART and Caltrain are unable to provide 24-hour ser-vice due to maintenance needs, these operators were consulted on how the All-Nighter could to provide overnight bus service to and between major points in their systems. These changes are de-signed to better match the service provided to areas of greatest need, particularly for overnight shift workers who rely on transit to reach jobs in San Francisco and around the region.
Transportation Demand Management (TDM) Efforts
The 2013 SFTP offered up a number of policy recommendations related to transportation demand management (TDM) with the goal of reducing vehicle trips in San Francisco to in turn reduce climate change impacts. The below planning efforts worked to-ward this goal through agency partnership and in-depth analysis on TDM efforts.
2 NightlifeSF, “The Other 9-to-5: Improving Late-Night and Early-Morning Transportation for San Francisco Workers, Residents, and Visitors,” http://nightlifesf.org/the-other-9-to-5-improving-late-night-and-early-morning-transportation-for-san-francisco-workers-residents-and-visitors/, (February 12, 2015).
TRANSPORTATION SUSTAINABILITY PROGRAM AND TDM ORDINANCE3
The Transportation Sustainability Program (TSP) is San Fran-cisco’s comprehensive approach to managing the transportation impacts of new development so that people can continue to move safely and comfortably even as the city grows. The TSP is com-prised of three components to achieve this goal (see Figure 4). The first is the Transportation Sustainability Fee (TSF) (see San Fran-cisco Locally-Controlled Revenues on p. 17), which requires devel-opers to pay their fair share to help offset the growth created by their project. The second is the implementation of a new method to measure the environmental impacts of new land use and trans-portation projects. Consistent with reform at the state level, San Francisco has opted to measure how often and far people drive (i.e., vehicle miles traveled) rather than automobile intersection delay (level of service) to assess environmental traffic related im-pacts under the California Environmental Quality Act. The third component is a TDM ordinance that ensures new developments in San Francisco include on-site improvements that provide trans-portation choices to residents and workers. All three components of the program were adopted by the City in 2015 and 2016.
3 http://sf-planning.org/transportation-sustainability-program
Figure 4. Components of the Transportation Sustainability Program
PAGE 13
2017 SFTP UPDATE FINAL REPORT • SAN FRANCISCO TRANSPORTATION PLAN
SAN FRANCISCO COUNTY TRANSPORTATION AUTHORITY • OCTOBER 2017 S A N F R A N C I S C OT R A N S P O R T A T I O N P L A N
2040
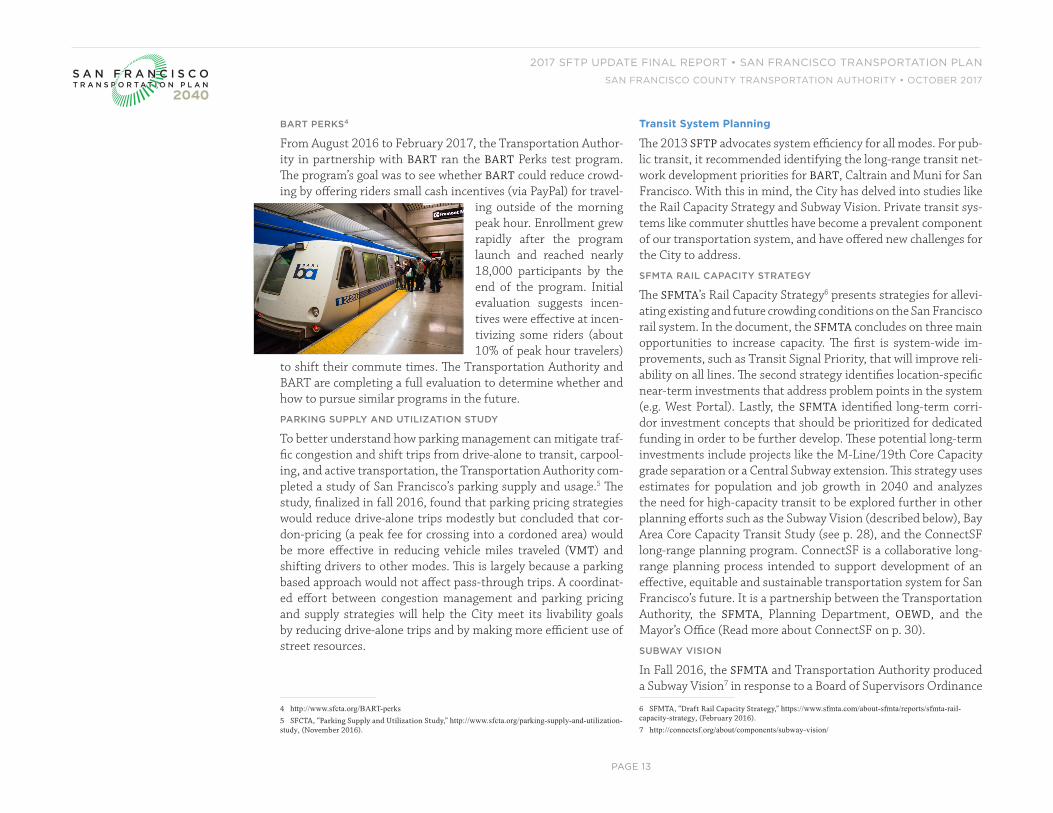
BART PERKS4
From August 2016 to February 2017, the Transportation Author-ity in partnership with BART ran the BART Perks test program. The program’s goal was to see whether BART could reduce crowd-ing by offering riders small cash incentives (via PayPal) for travel-
ing outside of the morning peak hour. Enrollment grew rapidly after the program launch and reached nearly 18,000 participants by the end of the program. Initial evaluation suggests incen-tives were effective at incen-tivizing some riders (about 10% of peak hour travelers)
to shift their commute times. The Transportation Authority and BART are completing a full evaluation to determine whether and how to pursue similar programs in the future.
PARKING SUPPLY AND UTILIZATION STUDY
To better understand how parking management can mitigate traf-fic congestion and shift trips from drive-alone to transit, carpool-ing, and active transportation, the Transportation Authority com-pleted a study of San Francisco’s parking supply and usage.5 The study, finalized in fall 2016, found that parking pricing strategies would reduce drive-alone trips modestly but concluded that cor-don-pricing (a peak fee for crossing into a cordoned area) would be more effective in reducing vehicle miles traveled (VMT) and shifting drivers to other modes. This is largely because a parking based approach would not affect pass-through trips. A coordinat-ed effort between congestion management and parking pricing and supply strategies will help the City meet its livability goals by reducing drive-alone trips and by making more efficient use of street resources.
4 http://www.sfcta.org/BART-perks5 SFCTA, “Parking Supply and Utilization Study,” http://www.sfcta.org/parking-supply-and-utilization-study, (November 2016).
Transit System Planning
The 2013 SFTP advocates system efficiency for all modes. For pub-lic transit, it recommended identifying the long-range transit net-work development priorities for BART, Caltrain and Muni for San Francisco. With this in mind, the City has delved into studies like the Rail Capacity Strategy and Subway Vision. Private transit sys-tems like commuter shuttles have become a prevalent component of our transportation system, and have offered new challenges for the City to address.
SFMTA RAIL CAPACITY STRATEGY
The SFMTA’s Rail Capacity Strategy6 presents strategies for allevi-ating existing and future crowding conditions on the San Francisco rail system. In the document, the SFMTA concludes on three main opportunities to increase capacity. The first is system-wide im-provements, such as Transit Signal Priority, that will improve reli-ability on all lines. The second strategy identifies location-specific near-term investments that address problem points in the system (e.g. West Portal). Lastly, the SFMTA identified long-term corri-dor investment concepts that should be prioritized for dedicated funding in order to be further develop. These potential long-term investments include projects like the M-Line/19th Core Capacity grade separation or a Central Subway extension. This strategy uses estimates for population and job growth in 2040 and analyzes the need for high-capacity transit to be explored further in other planning efforts such as the Subway Vision (described below), Bay Area Core Capacity Transit Study (see p. 28), and the ConnectSF long-range planning program. ConnectSF is a collaborative long-range planning process intended to support development of an effective, equitable and sustainable transportation system for San Francisco’s future. It is a partnership between the Transportation Authority, the SFMTA, Planning Department, OEWD, and the Mayor’s Office (Read more about ConnectSF on p. 30).
SUBWAY VISION
In Fall 2016, the SFMTA and Transportation Authority produced a Subway Vision7 in response to a Board of Supervisors Ordinance
6 SFMTA, “Draft Rail Capacity Strategy,” https://www.sfmta.com/about-sfmta/reports/sfmta-rail-capacity-strategy, (February 2016).
7 http://connectsf.org/about/components/subway-vision/
PAGE 14
2017 SFTP UPDATE FINAL REPORT • SAN FRANCISCO TRANSPORTATION PLAN
SAN FRANCISCO COUNTY TRANSPORTATION AUTHORITY • OCTOBER 2017 S A N F R A N C I S C OT R A N S P O R T A T I O N P L A N
2040
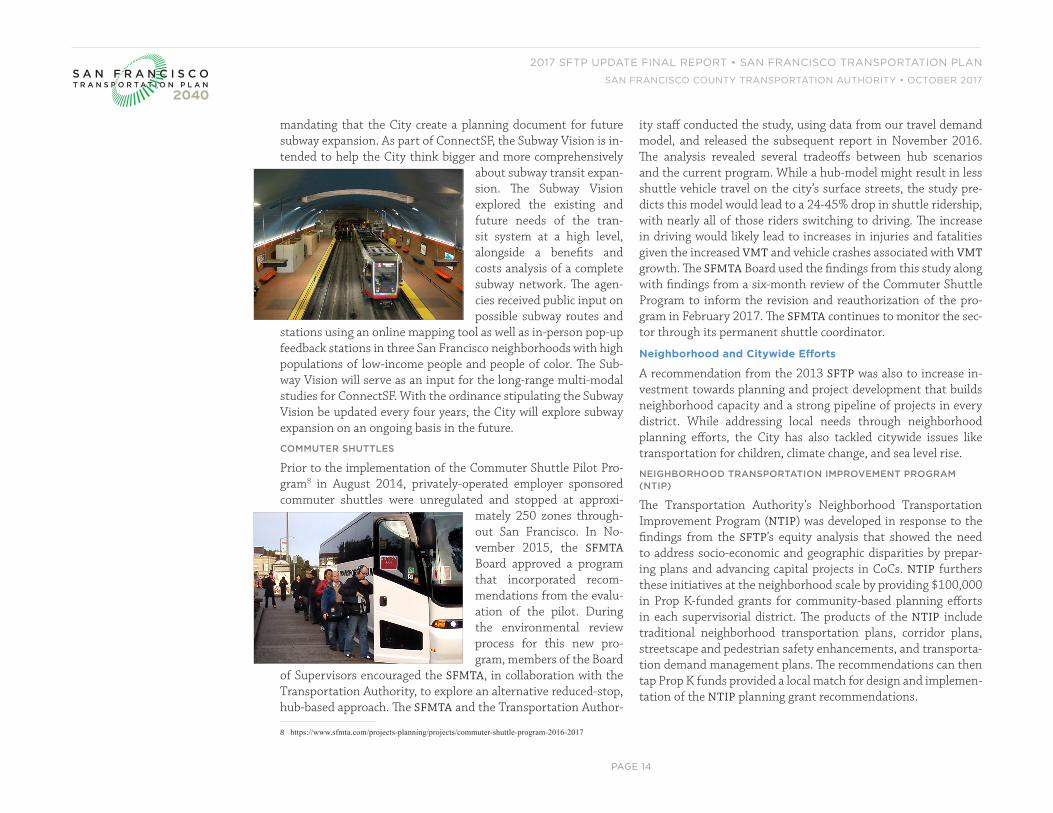
mandating that the City create a planning document for future subway expansion. As part of ConnectSF, the Subway Vision is in-tended to help the City think bigger and more comprehensively
about subway transit expan-sion. The Subway Vision explored the existing and future needs of the tran-sit system at a high level, alongside a benefits and costs analysis of a complete subway network. The agen-cies received public input on possible subway routes and
stations using an online mapping tool as well as in-person pop-up feedback stations in three San Francisco neighborhoods with high populations of low-income people and people of color. The Sub-way Vision will serve as an input for the long-range multi-modal studies for ConnectSF. With the ordinance stipulating the Subway Vision be updated every four years, the City will explore subway expansion on an ongoing basis in the future.
COMMUTER SHUTTLES
Prior to the implementation of the Commuter Shuttle Pilot Pro-gram8 in August 2014, privately-operated employer sponsored commuter shuttles were unregulated and stopped at approxi-
mately 250 zones through-out San Francisco. In No-vember 2015, the SFMTA Board approved a program that incorporated recom-mendations from the evalu-ation of the pilot. During the environmental review process for this new pro-gram, members of the Board
of Supervisors encouraged the SFMTA, in collaboration with the Transportation Authority, to explore an alternative reduced-stop, hub-based approach. The SFMTA and the Transportation Author-
8 https://www.sfmta.com/projects-planning/projects/commuter-shuttle-program-2016-2017
ity staff conducted the study, using data from our travel demand model, and released the subsequent report in November 2016. The analysis revealed several tradeoffs between hub scenarios and the current program. While a hub-model might result in less shuttle vehicle travel on the city’s surface streets, the study pre-dicts this model would lead to a 24-45% drop in shuttle ridership, with nearly all of those riders switching to driving. The increase in driving would likely lead to increases in injuries and fatalities given the increased VMT and vehicle crashes associated with VMT growth. The SFMTA Board used the findings from this study along with findings from a six-month review of the Commuter Shuttle Program to inform the revision and reauthorization of the pro-gram in February 2017. The SFMTA continues to monitor the sec-tor through its permanent shuttle coordinator.
Neighborhood and Citywide Efforts
A recommendation from the 2013 SFTP was also to increase in-vestment towards planning and project development that builds neighborhood capacity and a strong pipeline of projects in every district. While addressing local needs through neighborhood planning efforts, the City has also tackled citywide issues like transportation for children, climate change, and sea level rise.
NEIGHBORHOOD TRANSPORTATION IMPROVEMENT PROGRAM (NTIP)
The Transportation Authority’s Neighborhood Transportation Improvement Program (NTIP) was developed in response to the findings from the SFTP’s equity analysis that showed the need to address socio-economic and geographic disparities by prepar-ing plans and advancing capital projects in CoCs. NTIP furthers these initiatives at the neighborhood scale by providing $100,000 in Prop K-funded grants for community-based planning efforts in each supervisorial district. The products of the NTIP include traditional neighborhood transportation plans, corridor plans, streetscape and pedestrian safety enhancements, and transporta-tion demand management plans. The recommendations can then tap Prop K funds provided a local match for design and implemen-tation of the NTIP planning grant recommendations.

2017 SFTP UPDATE FINAL REPORT • SAN FRANCISCO TRANSPORTATION PLAN
SAN FRANCISCO COUNTY TRANSPORTATION AUTHORITY • OCTOBER 2017 S A N F R A N C I S C OT R A N S P O R T A T I O N P L A N
2040
Since the program’s inception in fall 2014, the Transportation Authority has funded a diverse portfolio of NTIP planning proj-ects in nine supervisorial districts and cap-ital projects in six supervisorial districts. Several NTIP planning efforts have been completed, such as the Western Addition Community-Based Transportation Plan, Improving Connections to Golden Gate Park, Lombard Crooked Street Study, and Alemany Interchange Improvement Study (See Appendix B. for Summary Table of NTIP projects).
WATERFRONT TRANSPORTATION ASSESSMENT
From late 2012 to Summer 2015, the SFMTA led the Waterfront Transporta-tion Assessment (WTA)9, a comprehensive evaluation of transportation system im-provements in relation to a series of simi-larly timed major development proposals in the neighborhoods of SoMa, Mission Bay, and the Central Waterfront. This study was spurred in part by the findings of the Core Circulation Study (Appendix C of the 2013 SFTP). The SFMTA collaborat-ed on the study with the Transportation Authority, Port of San Francisco, Planning Department, and OEWD. Considering the growth anticipated, existing planned and funded improvements will begin to ad-dress some of area’s needs. The WTA team identified other key investments that will help alleviate anticipated growth but still had funding shortfalls. These include Cal-train Electrification (which has been fully
9 https://www.sfmta.com/projects-planning/projects/waterfront-transportation-assessment-0.
1
2
3
4
5
67
8
9
11
12
13
18
15
19
16
20
17
21
14
10
PLANNING PROJECTS
1. Improving Connections to Golden Gate Park (1)2. Lombard Study: Managing Access to the “Crooked Street” (2)3. Kearny St. Multimodal Implementation (3)4. 66-Quintara Reconfiguration Study (4)5. Western Addition Community-Based Transportation Plan (5)6. Pedestrian Safety in SoMa Youth and Family Zone, Folsom-Howard Streetscape Project (6)7. Pedestrian Safety in SoMa Youth and Family Zone, Vision Zero Ramps Intersection Study (6)8. Balboa Area Transportation Demand Management Study (7)9. Alemany Interchange Improvement Study (9)10. District 10 Mobility Management Study (10)11. Geneva-San Jose Intersection Study (11)
CAPITAL PROJECTS
12. Arguello Blvd. Near-Term Improvements (1) 13. Lombard St./US-101 Corridor Pedestrian Safety (2)14. Sloat/Skyline Intersection Alternatives Analysis (4)15. Golden Gate Ave. Buffered Bike Lane (6)16. Bessie Carmichael Crosswalk (6)17.South Park Traffic Calming (6)18. Elk St. at Sussex St. Pedestrian Safety Improvements (8)19. Alemany Interchange Improvement Phase 1 (9)20. Cesar Chavez/Bayshore/Potrero Intersection Improvements (10)21. Potrero Hill Pedestrian Safety and Transit Access (10)
(Supervisoral District shown in parentheses)
Figure 5. Map of NTIP Projects
PAGE 16
2017 SFTP UPDATE FINAL REPORT • SAN FRANCISCO TRANSPORTATION PLAN
SAN FRANCISCO COUNTY TRANSPORTATION AUTHORITY • OCTOBER 2017 S A N F R A N C I S C OT R A N S P O R T A T I O N P L A N
2040
funded since then) and its extension Downtown to the new Trans-bay Transit Center; BART’s train signal upgrade and new mainte-nance facility; the rest of Muni’s fleet expansion; and implementa-tion of the rest of the Bicycle Strategy and Walk First. The study highlighted the need to fill these funding shortfalls. Additionally, the study points to the need for greater definition of investments that will be further refined through efforts such as the Bay Area Core Capacity Transit Study and Freeway Corridor Management Study (see p. 28, 29).
CHILD TRANSPORTATION STUDY10
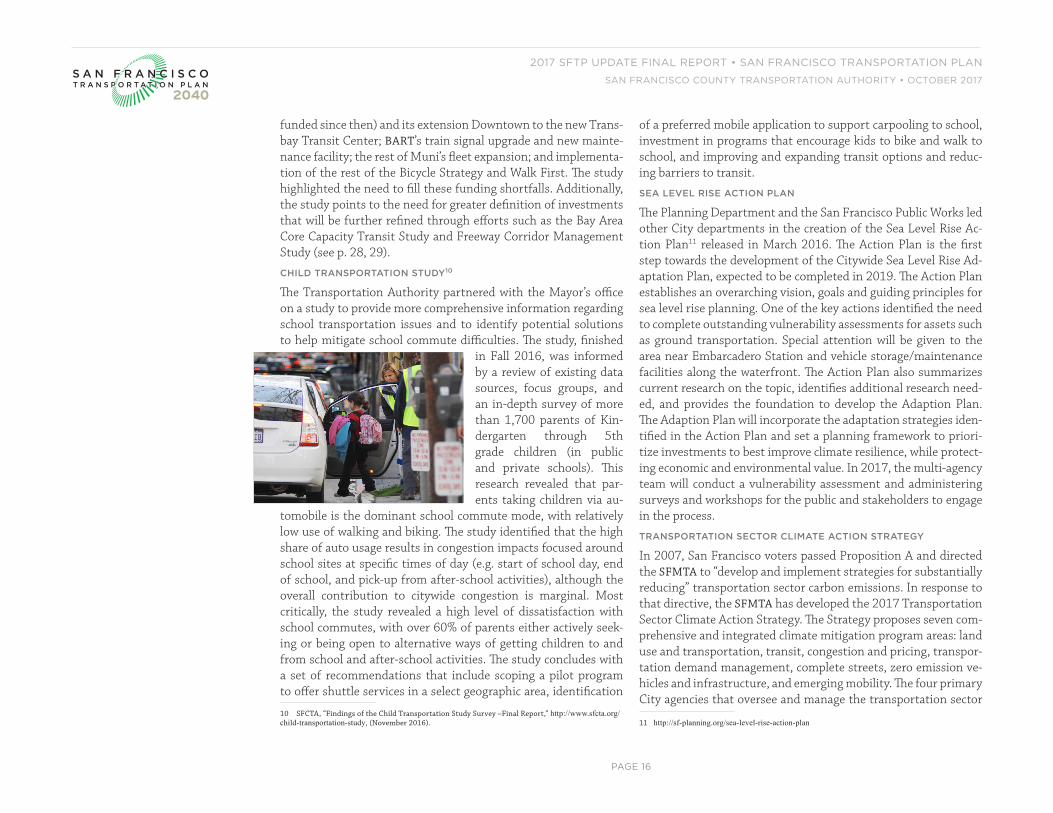
The Transportation Authority partnered with the Mayor’s office on a study to provide more comprehensive information regarding school transportation issues and to identify potential solutions to help mitigate school commute difficulties. The study, finished
in Fall 2016, was informed by a review of existing data sources, focus groups, and an in-depth survey of more than 1,700 parents of Kin-dergarten through 5th grade children (in public and private schools). This research revealed that par-ents taking children via au-
tomobile is the dominant school commute mode, with relatively low use of walking and biking. The study identified that the high share of auto usage results in congestion impacts focused around school sites at specific times of day (e.g. start of school day, end of school, and pick-up from after-school activities), although the overall contribution to citywide congestion is marginal. Most critically, the study revealed a high level of dissatisfaction with school commutes, with over 60% of parents either actively seek-ing or being open to alternative ways of getting children to and from school and after-school activities. The study concludes with a set of recommendations that include scoping a pilot program to offer shuttle services in a select geographic area, identification
10 SFCTA, “Findings of the Child Transportation Study Survey –Final Report,” http://www.sfcta.org/child-transportation-study, (November 2016).
of a preferred mobile application to support carpooling to school, investment in programs that encourage kids to bike and walk to school, and improving and expanding transit options and reduc-ing barriers to transit.
SEA LEVEL RISE ACTION PLAN
The Planning Department and the San Francisco Public Works led other City departments in the creation of the Sea Level Rise Ac-tion Plan11 released in March 2016. The Action Plan is the first step towards the development of the Citywide Sea Level Rise Ad-aptation Plan, expected to be completed in 2019. The Action Plan establishes an overarching vision, goals and guiding principles for sea level rise planning. One of the key actions identified the need to complete outstanding vulnerability assessments for assets such as ground transportation. Special attention will be given to the area near Embarcadero Station and vehicle storage/maintenance facilities along the waterfront. The Action Plan also summarizes current research on the topic, identifies additional research need-ed, and provides the foundation to develop the Adaption Plan. The Adaption Plan will incorporate the adaptation strategies iden-tified in the Action Plan and set a planning framework to priori-tize investments to best improve climate resilience, while protect-ing economic and environmental value. In 2017, the multi-agency team will conduct a vulnerability assessment and administering surveys and workshops for the public and stakeholders to engage in the process.
TRANSPORTATION SECTOR CLIMATE ACTION STRATEGY
In 2007, San Francisco voters passed Proposition A and directed the SFMTA to “develop and implement strategies for substantially reducing” transportation sector carbon emissions. In response to that directive, the SFMTA has developed the 2017 Transportation Sector Climate Action Strategy. The Strategy proposes seven com-prehensive and integrated climate mitigation program areas: land use and transportation, transit, congestion and pricing, transpor-tation demand management, complete streets, zero emission ve-hicles and infrastructure, and emerging mobility. The four primary City agencies that oversee and manage the transportation sector
11 http://sf-planning.org/sea-level-rise-action-plan

PAGE 17
2017 SFTP UPDATE FINAL REPORT • SAN FRANCISCO TRANSPORTATION PLAN
SAN FRANCISCO COUNTY TRANSPORTATION AUTHORITY • OCTOBER 2017 S A N F R A N C I S C OT R A N S P O R T A T I O N P L A N
2040
(the Transportation Authority, the SFMTA, Planning Department and Department of Environment) will implement the actions identified under each program area to help meet San Francisco’s goal of reducing emissions 80 percent below 1990 levels by 2050. The Strategy also contains five new climate adaptation program areas which provide the framework for increasing the resilience of the transportation sector in the face of climate impacts such as sea level rise. The SFMTA board is expected to adopt the final document in December 2017.
NEW TRANSPORTATION REVENUE SOURCES
Since the 2013 SFTP’s release, voters and legislators have ap-proved new revenue measures that have increased the amount of funding available to transportation. San Francisco’s estimated share of revenues from each of the below mentioned sources is included in the Investment Plan for this 2017 SFTP Update (see the section titled “The Updated Investment Plan” on p. 27 for ad-ditional detail).
San Francisco Locally-Controlled Revenues
In 2014, San Francisco voters approved two transportation fund-ing measures. Proposition A is a $500 million general obliga-tion bond for transportation. The bond was a recommendation of the Transportation 2030 (T2030) Task Force. The T2030 was convened by the Mayor in 2013 to develop a coordinated set of priorities and actionable recommendations for funding the City’s transportation infrastructure through 2030. Proposition A was focused heavily on SFMTA capital maintenance needs for transit and for streets (e.g. signals), as well as funds for safer, complete streets and transit reliability. The SFMTA administers the Prop A program as part of its Capital Improvement Plan.
Proposition B is a charter amendment that increased the general fund’s annual base contribution to the SFMTA’s budget for transit improvements (capital or operations) and capital improvements in street safety for all users tied to changes in the city’s daytime and nighttime populations. Proposition B sets aside capital in-vestment revenues, 75% of for Muni transit and 25% for street safety for all users (pedestrians, cyclists, transit passengers, au-
tomobile users, etc.). To provide a sense of scale, in FY 2016/17, the appropriations to the SFMTA were $23 million for transit and $7.8 million for street safety.
As previously discussed, the City’s new Transportation Sustain-ability Fee (TSF), passed in 2015, expanded a prior development impact fee to ensure that developers pay their fair share for trans-portation impacts from new residents and workers. The revenue generated will fund projects that are consistent with the TSF Ex-penditure Plan. While the revenues are fairly modest given the magnitude of transportation need, the TSF was designed to com-plement other aspects of the Transportation Sustainability Pro-gram (TSP) from a policy standpoint (see p. 12). Together these send strong policy signals and create revenue to support the City’s transit first approach.
Regional BART Measure RR
In 2016, voters in the three-county BART district (Alameda, Contra Costa and San Francisco) approved a $3.5 billion general obligation bond (Measure RR). Its primary purpose is to pay for repairs and upgrades to BART’s aging infrastructure (about $3.2 billion) with about 5% set aside to relieve crowding and modern-ize and improve access to stations ($335 million). Importantly, San Francisco advocated for the measure to include 10% for sys-tem expansion/enhancements such as study of a second Transbay Crossing as discussed in the Core Capacity Transit Study.
State Cap and Trade Program Revenues
At the state level, implementation of the Cap and Trade program has directed more than $2 billion to transportation over the last four fiscal years. This includes direct funding to transit opera-tors and for competitive statewide programs, such as the Transit and Intercity Rail Program from which the SFMTA received $45 million to expand its light rail vehicle fleet. The Cap and Trade program has faced legal challenges and issues related to the ap-proaching sunset date in 2020, both of which are believed to have contributed to significant variability and a recent drop in rev-enues. That outlook improved in late July when Governor Brown signed AB 398, extending the Cap and Trade program to 2030. This is expected to both stabilize and increase this revenue stream.

PAGE 18
2017 SFTP UPDATE FINAL REPORT • SAN FRANCISCO TRANSPORTATION PLAN
SAN FRANCISCO COUNTY TRANSPORTATION AUTHORITY • OCTOBER 2017 S A N F R A N C I S C OT R A N S P O R T A T I O N P L A N
2040
Senate Bill 1 (Beall and Frazier): The Road Repair and Accountability Act
In April 2017, the state legislature approved a major state trans-portation funding package, backed by increases in transportation-related taxes and fees. Senate Bill 1 (SB 1) (Beall and Frazier) is expected to generate $52.4 billion statewide over the next ten years. It will largely fund operations and maintenance costs for state highways and local streets and roads with some money for transit and congestion relief. Early estimates show approximately $73 million in additional annual formula funding to San Francisco from SB 1. Following MTC’s lead and to maintain consistency with Plan Bay Area 2040 revenue projections, we account for these revenues in the 2017 SFTP Update as part of the $3.3 billion in “Anticipated/Unspecified” total assumed in the Investment Plan rather than as net new revenues. They will become part of the base revenue forecast in the next SFTP update.
EXISTING AND FUTURE CONDITIONS AND TRENDSResidential and employment growth has been booming in San Francisco since 2010, and this growth is projected to increase steadily into the future. Under the Plan Bay Area preferred scenario adopted by the MTC and the Association of Bay Area Governments (ABAG), San Francisco is anticipated to increase in size by 137,000 new households and 295,000 new jobs by 2040.12 A total of 63,600 units13, or about 46% of housing pro-jections, are already in the development pipeline due to this economic boom following the lack of development during the recession (see Figure 6). Between 2010 and 2014, San Francisco gained 120,000 new jobs14 over 40% of the job growth projected through 2040 in Plan Bay Area (see Figure 7). Additionally, un-employment is low at 3.3%,15 and tourism has reached record-
12 MTC and ABAG, “Final Preferred Scenario” http://mtc.ca.gov/sites/default/files/Final%20Preferred%20Scenario%20POWERPOINT.pdf, (November 2016).
13 San Francisco Planning Department, Memo to Planning Commission, http://commissions.sfplanning.org/cpcpackets/Memo%20to%20CPC_2Mar2017_InfoHearing_JobHousingTrends.pdf, (March 2, 2017), 2.
14 San Francisco Planning Department, “Update on Office Development Pipeline,” http://default.sfplanning.org/Commission/presentations/job_growth_office_pipeline-042816.pdf, (April 28, 2016), 9.
15 State of California Employment Development Department, “Monthly Labor Force Data for Counties: Annual Average 2016—Revised,” http://www.labormarketinfo.edd.ca.gov/file/lfhist/16aacou.pdf, (March 3, 2017).
breaking highs16. As has been well-documented elsewhere, the combination of high population and job growth and very limited housing is putting more stress on the city’s affordability leading to more trips across all modes, putting more stress on the trans-portation system.
Transit crowding has increased significantly in the past several years. In the Transbay peak hour/direction, BART has been op-erating beyond their own capacity standards since 2014. BART surpassed national subway capacity standards in 2015.17 On an average weekday morning, 6 of 22 Caltrain trains arrive at the 4th and King station above 100% seated capacity, meaning dozens of passengers of those trains are standing for a portion of their trip.18
16 The San Francisco Travel Association, “San Francisco Travel Reports Record-Breaking Tourism in 2016,” http://www.sftravel.com/article/san-francisco-travel-reports-record-breaking-tourism-2016, (January 18, 2017).
17 BART staff.
18 Caltrain 2017 Annual Count by Trains, Weekdays, http://www.caltrain.com/Assets/_Marketing/caltrain/pdf/2016/2017+Annual+Count+by+Trains+$!e2$!80$!93+Weekdays.xls.
0 50 100 150 200 250 300
Plan Bay Area 2017 forecast through
2040
Actual growththrough 2014
Figure 7. San Francisco Job Growth (from 2010)
120,000
295,000
JOB GROWTH (IN THOUSANDS)
Plan Bay Area 2017 forecast 2010–2040
Units currentlyin pipeline
Figure 6. Housing Units in San Francisco
HOUSING UNITS (IN THOUSANDS)0 50 100 150 200 250 300
137,000
63,600

PAGE 19
2017 SFTP UPDATE FINAL REPORT • SAN FRANCISCO TRANSPORTATION PLAN
SAN FRANCISCO COUNTY TRANSPORTATION AUTHORITY • OCTOBER 2017 S A N F R A N C I S C OT R A N S P O R T A T I O N P L A N
2040
Although recent trends show ridership growth abating or even turning negative, transit ridership has increased across the board in the recent period. BART ridership has increased by 29% (about 98,000 daily weekday riders) since 2010.19 Caltrain commuter rail ridership nearly doubled over the last six years, jumping from 34,000 to 62,000 average weekday riders.20 Muni also saw an in-crease in ridership of 49,000 average weekday riders from 2010–2016.21 Water Emergency Transportation Authority’s (WETA) ferry service daily ridership more than doubled in that time from 3,344 riders in 2010 to 8,139 in 2016.22 These ridership increases have put excessive stress on transit systems and patrons during peak commute periods. As a result, all major operators are seeking adequate funding to maintain their systems (facilities, guideways, vehicles) as well as seeking to replace and expand vehicle fleets. They also wish to increase throughput and efficiency through in-vestments in train control and communications systems as well as capital improvements to improve safety and operational efficiency (e.g. remove bottlenecks through building passing tracks, turn-arounds and crossing tracks for flexibility).
Our roads and freeways are also becoming more congested. Since the adoption of the 2013 SFTP, in keeping with the strong eco-nomic recovery and rapid subsequent growth in employment, congestion in San Francisco has worsened at a faster rate than the rest of the region (see Figure 9, next page). In 2015, we saw that 8.6% of all miles driven in San Francisco were in congestion, whereas the region as a whole experienced only 5.7% of total 19 BART, “Total Annual Exits FY1973 - FY2016,” www.bart.gov/about/reports/ridership.
20 Caltrain, “Annual Passenger Counts,” www.caltrain.com/about/statsandreports/Ridership.html.
21 SFMTA staff.
22 National Transit Database and WETA staff.
miles in congestion.23 In 2015, over 205,000 people commuted into San Francisco from other counties in the Bay Area (see Table 2, next page). Per the Planning Department, San Francisco’s mid-dle and lower wage workforce is increasingly commuting into the city from other parts of the region as housing prices increase (see Table 3, p. 21). Each auto commuter in the SF-Oakland urban area on average experiences 78 hours of delay annually, ranking third in worst commutes behind Washington, D.C. and the Los Angeles-Long Beach-Anaheim urban areas.24
23 MTC, Vital Signs, http://www.vitalsigns.mtc.ca.gov/miles-traveled-congestion, (Updated October 2016).
24 Auto Insurance center, “JAMMED: How much Time and Money Does Traffic Congestion Waste?”, https://www.autoinsurancecenter.com/traffic-jammed.htm,
Figure 9. Share of VMT in Congestion (Source: MTC Vital Signs)
2010 2011 2012 2013 2014 2015 2016
Muni 676,800 669,800 701,300 703,300 705,700 711,000 726,100
BART 334,984 345,256 366,565 392,293 399,145 423,120 433,394
Caltrain 34,120 37,779 42,354 47,060 52,611 58,245 62,416
WETA 3,344 N/A N/A 4,677 6,086 N/A 8,139Sources: BART “Total Annual Exits,” Caltrain “Annual Passenger Counts,” SFMTA staff, BART Staff, WETA staff and National Transit Database.
Table 1. Average Daily Ridership FY2010-2016
49,300
98,410
28,296
4,795
7%
23%
45%
59%In ridersIn percent
Muni BART Caltrain WETA
120,000
100,000
80,000
60,000
40,000
20,000
0
Figure 8. Growth in Average Weekday Ridership Between 2010 and 2016
70%
60%
50%
40%
30%
20%
10%
0%
49,300
98,410
45%
59%
7%
23%
28,296
4,795

PAGE 20
2017 SFTP UPDATE FINAL REPORT • SAN FRANCISCO TRANSPORTATION PLAN
SAN FRANCISCO COUNTY TRANSPORTATION AUTHORITY • OCTOBER 2017 S A N F R A N C I S C OT R A N S P O R T A T I O N P L A N
2040
From 2013 to 2015, the mean auto travel speed on key arterials became 15% slower during the morning peak and 21% slower during the evening peak.25 At the same time, transit speeds de-clined from 8.1 mph to 7.9 mph for the rubber-tire (bus) fleet in the evening peak period. Despite the slower speeds, transit per-
25 SFCTA, “2015 Congestion Management Program Report,” http://www.sfcta.org/congestion-management-program, (December 2015), 21.
forms better, relative to auto speeds, in 2015 than it did in 2013.26 Traffic volumes measured just south of the city border on southbound US 101 show an increase of 7% from 2014 to 2015 during the evening peak period.27 Annual bridge crossings
26 Ibid., 25.
27 Fehr & Peers, “San Mateo County US 101 Ramp Metering Project: Final Report - After Study,” (June 1, 2016), Appendix B: Freeway Mainline and On-Ramp Count Data.
Figure 11. Change in Number of Commuters by Mode Choice (2006-2015)
2004 2005 2006 2007 2008 2009 2010 2011 2012 2013 2014 2015 2016
10%
8%
6%
4%
2%
0%
Figure 9. Historical Trend for Share of Highway Miles Traveled in Congestion
San Francisco CountyBay Area
SF RESIDENTS WHO WORK WORKERS IN SF NET IN-COMMUTE
CHANGE IN NET IN-COMMUTE
SINCE 1990
Bay Area Total 484,532 689,896 205,365 29,385
Alameda 21,859 107,075 85,216 44,289
Contra Costa 4,040 62,794 58,754 17,520
Marin 7,134 30,399 23,265 (5,534)
San Francisco 370,247 370,247 — 62,330
San Mateo 49,179 81,867 32,688 (12,858)
Santa Clara 30,541 17,173 (13,368) (13,918)
Rest of Bay Area 1,533 20,343 18,810 (115)SOURCE: SF Planning Department
Table 2. Worker Flows To and From San Francisco in 2015

PAGE 21
2017 SFTP UPDATE FINAL REPORT • SAN FRANCISCO TRANSPORTATION PLAN
SAN FRANCISCO COUNTY TRANSPORTATION AUTHORITY • OCTOBER 2017 S A N F R A N C I S C OT R A N S P O R T A T I O N P L A N
2040
into San Francisco via the Golden Gate and Bay Bridges has steadily increased in recent years from 62.9 million in 2010 to 68.3 million in 2016, surpassing pre-recession crossings28 (see Figure 10). Beyond the increased volumes of vehicles, San Fran-cisco streets have also been slowed down by construction. Cor-ridors with a higher number of construction sites were found to have slower speeds during construction.29
28 MTC Finance Section and State of California, “Comprehensive Annual Financial Report for Fiscal Years Ended June 30, 2015 and June 30, 2014,”
Golden Gate Bridge Highway and Transportation District, “Comprehensive Annual Financial Report for the fiscal years ended June 30, 2016 and 2015, San Francisco, Ca.”
29 Joe Fitzgerald Rodriguez, “Analysis: Traffic-slowing construction projects have doubled in SF in past decade,” http://www.sfexaminer.com/analysis-traffic-slowing-construction-projects-doubled-sf-past-decade/, (San Francisco Examiner, April 12, 2017).
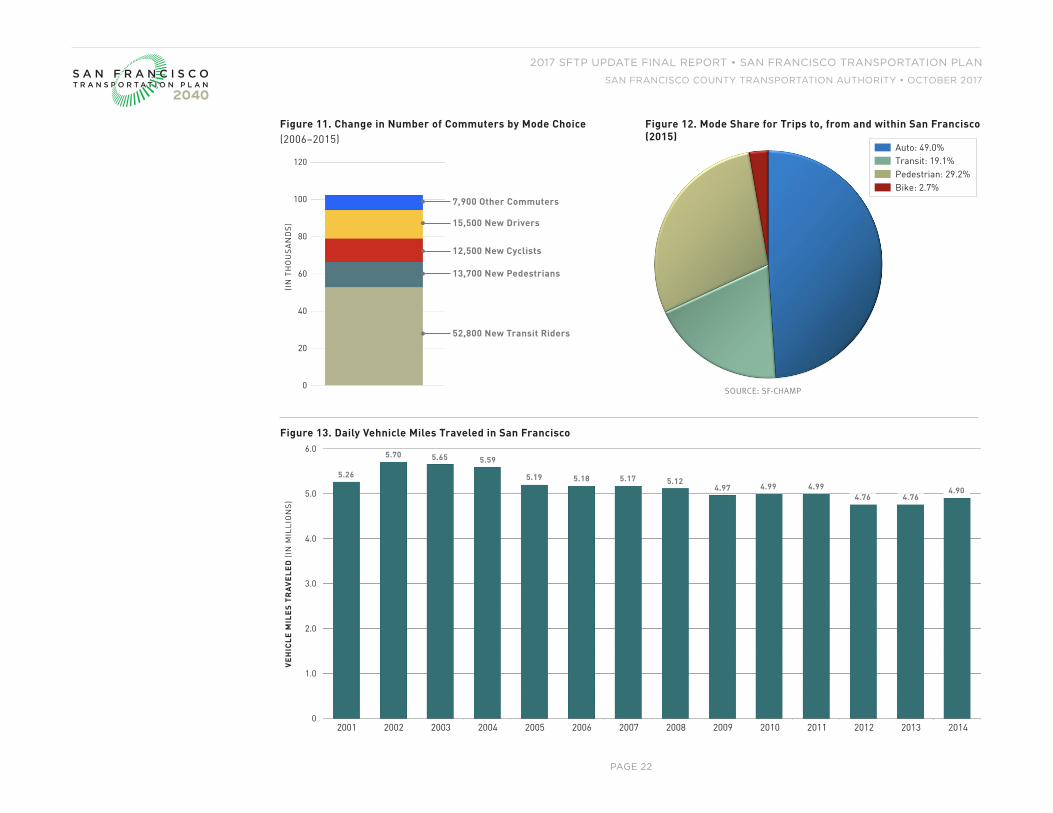
While more cars are on the road, there are also more people walk-ing, biking, and taking transit. From 2006-2015, 79,000 of 102,000 (about 76%) of new San Francisco commuters chose these modes to work (see Figure 11, next page).30 Model results show that autos represented 49% of mode share in 2015 (see Figure 12, next page). Bicycle counter machines on Market Street at Van Ness report that on an average weekday in 2016, about 2,000 cyclists take the route headed downtown, up from 1,500 in 2010.31 In addition, VMT within San Francisco from 2001–2014 has generally been declining32 (see Figure 13, next page) and car ownership levels from 2010–2015 have stayed constant with about 31% zero-car households.33 San Francisco’s carbon footprint has decreased perhaps in part due to this shift to more active modes and the City’s history of planning for transit-ori-ented developments (TODs). As of 2015, greenhouse gas emis-sions are 28% below 1990 levels34 despite an increase in popula-tion and their associated transportation activities (see Figure 14, p. 23).
While these shifts towards more sustainable modes are good news, we are also seeing emerging mobility services rapidly altering the
30 2015 American Community Survey: 1 Year Supplemental Estimates, U.S. Census Bureau.
31 SFMTA
32 Caltrans Annual California Public Road Data reports, 2001-2014.
33 U.S. Census Bureau, 2010, 2011, 2012, 2013, 2014 and 2015 American Community Survey 1-year estimates.
34 San Francisco Department of the Environment, https://sfenvironment.org/carbon-footprint.
INCOME GROUP 1990 2014-2015 CHANGE
30% or less 75% 65% 30%–50% 72% 54% 50%–80% 64% 53% 80%–100% 55% 50% 100%–120% 53% 48% 120%–140% 50% 49% 140%–200% 45% 49% 200% or more 43% 54% SOURCE: SF Planning Department
Table 3. Percentage of SF Workers Living In SF by Income Group
2007 2008 2009 2010 2011 2012 2013 2014 2015 2016
2.0
1.5
1.0
0.5
0
(0.5)
(1.0)
(1.5)
(2.0)
Figure 10. Change in Annual Inbound Bridge Crossings to San Francisco(Golden Gate and SF-Oakland Bay Bridges)
(IN
MIL
LIO
NS
)
(403,028)(529,438)
(163,260)
(1,759,849)
526,946 475,859 570,727
898,310
1,733,810
1,231,023
PAGE 22
2017 SFTP UPDATE FINAL REPORT • SAN FRANCISCO TRANSPORTATION PLAN
SAN FRANCISCO COUNTY TRANSPORTATION AUTHORITY • OCTOBER 2017 S A N F R A N C I S C OT R A N S P O R T A T I O N P L A N
2040
120
100
80
60
40
20
0
Figure 11. Change in Number of Commuters by Mode Choice(2006–2015)
(IN
TH
OU
SA
ND
S)
7,900 Other Commuters
15,500 New Drivers
12,500 New Cyclists
13,700 New Pedestrians
52,800 New Transit Riders
2001 2002 2003 2004 2005 2006 2007 2008 2009 2010 2011 2012 2013 2014
6.0
5.0
4.0
3.0
2.0
1.0
0
Figure 13. Daily Vehnicle Miles Traveled in San Francisco
VE
HIC
LE
MIL
ES
TR
AV
EL
ED
(IN
MIL
LIO
NS
)
5.26
5.70 5.65 5.59
5.19 5.18 5.17 5.124.97 4.99 4.99
4.76 4.764.90
Figure 12. Mode Share for Trips to, from and within San Francisco (2015)
SOURCE: SF-CHAMP
Auto: 49.0%Transit: 19.1%Pedestrian: 29.2%Bike: 2.7%

PAGE 23
2017 SFTP UPDATE FINAL REPORT • SAN FRANCISCO TRANSPORTATION PLAN
SAN FRANCISCO COUNTY TRANSPORTATION AUTHORITY • OCTOBER 2017 S A N F R A N C I S C OT R A N S P O R T A T I O N P L A N
2040
transportation landscape. Transportation networking companies (TNCs) such as Uber and Lyft have become household names in re-cent years. On a typical weekday, TNCs make more than 170,000 trips within San Francisco, representing an estimated 15% of intra-city trips.35 From 2014-2016, TNC pick-ups and drop-offs at San Francisco International Airport increased six-fold, a trend that BART theorizes is impacting ridership on their system.36 Shared mobility services such as bike share and car share offer pathways to car-free or car-light lifestyles, private transit opera-tors have become popular, and autonomous vehicle technology is expected to be operable soon. An estimated 9,800 people com-mute via private employer shuttle each day from San Francisco.37 Many of these new services and technologies, especially TNCs, have prompted transportation professionals and policymakers to assess the adequacy of existing regulatory frameworks.
Several companies have been testing semi-autonomous vehicles on San Francisco streets. In December 2016, Uber begun its self-driving vehicle pilot in San Francisco. They suspended the pro-gram after a week when they received pushback from the Califor-nia Department of Motor Vehicles (DMV) and the City for not obtaining the proper permits.
While there are many exciting prospects for the future of trans-portation, we must understand and address the operational and equity implications of the trends described above. Rapid growth in population and economy, combined with a lack of continued housing construction, has resulted in the displacement of many San Franciscans in communities of concern and other vulnerable groups. This in turn has resulted in longer and longer commutes, exacerbating congestion regionally and locally.
Serious equity impacts arise from these trends: housing has be-come disproportionately unaffordable for low-income and disad-
35 SFCTA, “TNCs Today”, http://www.sfcta.org/sites/default/files/content/Planning/TNCs/TNCs_Today_061317.pdf.
36 Joe Fitzgerald Rodriguez, “Uber and Lyft use at SFO increases six-fold in two years, BART loses ridership,” http://www.sfexaminer.com/uber-lyft-use-sfo-increases-six-fold-two-years-bart-loses-ridership/, (San Francisco Examiner, December 5, 2016).
37 SFMTA, “Commuter Shuttle Program: April – September 2016 Status Report,” https://www.sfmta.com/sites/default/files/projects/2016/Commuter%20Shuttle%20Program%20Mid%20Term%20Status%20Report.pdf, 15.
1900 2000 2005 2010 2012 2015
7.0
6.0
5.0
4.0
3.0
2.0
1.0
0.0
Figure 14. San Francisco’s Carbon Footprint
mtC
O2e
(IN
MIL
LIO
NS
)
-28%
Figure 15. TNCs Weekday Pickup Hotspots

PAGE 24
2017 SFTP UPDATE FINAL REPORT • SAN FRANCISCO TRANSPORTATION PLAN
SAN FRANCISCO COUNTY TRANSPORTATION AUTHORITY • OCTOBER 2017 S A N F R A N C I S C OT R A N S P O R T A T I O N P L A N
2040
vantaged groups and there is diminishing ethnic diversity in San Francisco. Since 1970, San Francisco has lost more than 50% of its black population. San Francisco lost 36% of its black population from 1990 to 2010, a time period when the population of all oth-er racial groups increased.38 The city’s shrinking black population also saw its median household income fall by close to 5 percent to $29,500 from 2011 to 2014, while the median white household income climbed 14 percent to $104,300 during the same period.39 In December 2016, MTC and ABAG adopted the Final Preferred Scenarios for Plan Bay Area 2040. Their analysis of the Final Pre-ferred Scenario found that performance targets for Housing and Transportation Affordability, Displacement, and Access to Jobs will continue to move in the wrong direction without local juris-dictions adding more affordable housing stock.40 MTC’s analysis showed that housing was more of a factor than transportation in driving this result. As a result, MTC and ABAG are bringing to-gether diverse interests under a Committee for Affordable and Sustainable Accommodations (CASA). CASA, supported by re-gional planning staff and consultants, began working together this year to explore regional housing initiatives and create a Re-gional Housing Implementation Strategy.
While transportation may not be the driving factor resulting in these dynamics nor offer a comprehensive solution, these poten-tial regional outcomes challenge the City to identify local ways transportation can address equity impacts. One recent example is an equity analysis performed for the 2013 SFTP. Through this analysis, staff found that “communities of concern” tend to expe-rience disproportionately worse safety conditions with more pe-destrian and bike injuries and higher rates of street crime.41
38 Metropolitan Transportation Commission and Association of Bay Area Governments, Bay Area Census, http://www.bayareacensus.ca.gov/counties/SanFranciscoCounty.htm.
39 Joaquin Palomino, “Incomes rise across S.F., except for African Americans,” San Francisco Chronicle, http://www.sfchronicle.com/bayarea/article/Incomes-rise-across-S-F-except-for-African-6548522.php, (October 3, 2015).
40 MTC and ABAG, Plan Bay Area Final Preferred Scenario, http://www.planbayarea.org/2040-plan/final-preferred-scenario.
41 SFCTA, San Francisco Transportation Plan 2040, http://www.sfcta.org/sites/default/files/content/Planning/SFTP2/FinalReport/Appendix%20F%20Transportation%20Equity%20Analysis.pdf, (December 2013), Appendix F: 2
The City has elevated another major threat to San Francisco in the years to come: sea level rise. The City’s Sea Level Rise Action Plan estimates that sea level rise would inundate 6% of the city by the end of the century.42 Many areas expected to be impacted by sea level rise are those where there is much planned development and accompanying new transportation infrastructure (see Figure 16).
Together, these trends present serious challenges to planning San Francisco’s transportation system and are the focus of the City’s Climate Action Strategy and other planning efforts including the next major update of this document and Play Bay Area.
42 City & County of San Francisco, “Sea Level Rise Action Plan,” http://default.sfplanning.org/plans-and-programs/planning-for-the-city/sea-level-rise/160309_SLRAP_Final_ED.pdf, (March 2016), 2-3.
Figure 16. SF Sea Level Rise Vulnerability Zone and Major Waterfront Projects Incorporating Innovative Adaptive Management (From San Francisco Sea Level Rise Action Plan, Executive Summary)

PAGE 25
2017 SFTP UPDATE FINAL REPORT • SAN FRANCISCO TRANSPORTATION PLAN
SAN FRANCISCO COUNTY TRANSPORTATION AUTHORITY • OCTOBER 2017 S A N F R A N C I S C OT R A N S P O R T A T I O N P L A N
2040
SAN FRANCISCO TRANSPORTATION INVESTMENT STRATEGYOne of the key elements of the 2013 SFTP was the Transportation Investment Strategy which included two scenarios:
• The San Francisco Investment Plan details a list of projects and programs that can be funded partially or entirely within a rea-sonably anticipated forecast of federal, state, regional, and local revenues expected to be available to San Francisco through 2040.
• The San Francisco Investment Vision builds on the Investment Plan by illustrating additional projects and program invest-ments that could be made, helping to achieve SFTP’s goals, if new revenues are secured.
The 2013 SFTP identified about $75 billion in federal, state, re-gional and local revenue expected for transportation in San Fran-
cisco through 2040. The vast majority of these revenues were already committed to specific projects or purposes, leaving only a relatively small amount (approximately $5 billion) in discretion-ary funds not already committed to existing projects and purpos-es. This breakdown of committed versus discretionary revenues closely mirrors the breakdown of revenues in Plan Bay Area and is not unique to San Francisco.
Because the funding needs were so great relative to funds projected to be available, the 2013 SFTP outlined an SF Investment Vision. The Vision serves as an advocacy tool and a guide to spending in a scenario where an additional $7.5 billion in new locally-controlled discretionary revenues created a total Investment Vision scenario of $82.5 billion. The SFTP Investment Vision identified potential sources of new locally controlled funding that were closely coordi-nated with those identified by the T2030 task force.
Figure 17. 2017 Updated Investment Plan and SF Investment Vision
$74.5BCOMMITTED
$85B INVESTMENT
PLAN
$9.6B DISCRETIONARY
$92.9B INVESTMENT
VISION
$7.9B DISCRETIONARY
Plan Revenues by Source (IN BILLIONS OF YEAR-OF-EXPENDITURE DOLLARS THROUGH 2040)
Private Sector Funds: $0.50
SOURCES OF ADDITIONAL DISCRETIONARY REVENUES IN
INVESTMENT VISION
Parcel Tax: $0.50
General Obligation Bonds: $0.80
Vehicle License Fee: $2.10
Additional Half-Cent Sales Tax: $4.00
10-cent Regional Gas Tax (SF Share): $0.44
Unspecified: $2.0Discretionary
from Existing Sources: $6.30
SOURCES OF DISCRETIONARY REVENUES IN INVESTMENT PLAN
Bridge Toll Increase: $0.83
Local: $60.3
Federal: $4.6
State: $5.8
Regional: $4.7
SOURCES OF COMMITTED REVENUES IN INVESTMENT PLAN
PAGE 26
2017 SFTP UPDATE FINAL REPORT • SAN FRANCISCO TRANSPORTATION PLAN
SAN FRANCISCO COUNTY TRANSPORTATION AUTHORITY • OCTOBER 2017 S A N F R A N C I S C OT R A N S P O R T A T I O N P L A N
2040
As previously described in the Investment Bearing Fruit section, the Investment Plan and Investment Vision are organized into three major categories of spending:
• Ongoing Maintenance and Operations Funding
• Transportation Program and Enhancements
• Efficiency and Expansion Projects
This 2017 SFTP Update maintains the same framework. This up-date retains the same two investment scenarios, with minor up-dates to account for changes in project costs and revenue projec-tions (see Figure 17):
• The Investment Plan totaling $85 billion of which $9.6 billion is discretionary or not already committed to specific projects and program
• The Investment Vision adding $7.9 billion in new local rev-enues on top of the Investment Plan for a total Investment Vision of $92.9 billion.
The rest of this section provides highlights of how the 2013 In-vestment Plan and Investment Vision for the 2017 SFTP Update were specifically revised.
REVENUE PROJECTIONS
As the first step in updating the Transportation Investment Strat-egy, we revisited revenue projections drawing upon the projec-tions of federal, state, regional, and local funds prepared by MTC
for the concurrent Plan Bay Area update. Revenue projections for the 2013 SFTP update covered Fiscal Years 2013/14 through 2039/40. For the 2017 update, the new projections cover Fiscal Years 2016/17 through 2039/40.
For the Investment Vision, we assumed the same suite of new lo-cal sources as for the 2013 SFTP—an additional half cent sales tax, general obligation bonds, a vehicle license fee, a parcel tax, and private sector revenues. We maintained the same assump-tions for these sources from 2013 except to decrease general obli-gation bond revenues by $500 million to reflect the Prop A general obligation bond that passed in 2014 (the bond that passed was less than what 2013 SFTP had assumed). This decrease in funds was offset by higher projections for sales tax and vehicle license fee revenues in the Investment Plan. The result is an estimated $7.9 billion in new local revenues in the Investment Vision.
PROJECT COST AND EVALUATION UPDATE
While we are making progress in securing new revenues to close the funding gap, San Francisco’s transportation needs continue to outpace available revenues. Working with the SFMTA, MTC, Pub-lic Works and other local and regional partners, we reassessed San Francisco’s transportation needs as part of the 2017 SFTP Update and parallel Plan Bay Area update. We updated the costs for all the projects and programs in the Investment Plan and Investment Vision, occasionally shifting projects into or out of programmatic categories depending on how far they had advanced in project
MORE ABOUT REVENUE PROJECTIONS
There were many changes to individual revenue source forecasts since 2013. The most prominent decreases in revenues were associated with more conservative growth assumptions for the Federal Transit Formula funds. The assumptions reflect recent trends and less optimistic prospects for federal transit funds in the near future, as well as decreases in prior federal funds com-mitted to major capital projects that have significantly advanced or completed construction since 2013 like the Central Subway, Doyle Drive, Transbay Transit Center, and Yerba Buena Island Ramps projects.
The 2017 updated investment plan makes up for these changes—with a growth in revenues by about $10 billion—largely through increased projections for local revenue sources from transit fare and non-fare revenues, the Measure RR BART bond, sales tax, and congestion pricing and Treasure Island pricing revenues. The pie charts of Figure 17. 2017 Updated Investment Plan and SF investment Vision show revenues by source for the 2017 SFTP Update.
PAGE 27
2017 SFTP UPDATE FINAL REPORT • SAN FRANCISCO TRANSPORTATION PLAN
SAN FRANCISCO COUNTY TRANSPORTATION AUTHORITY • OCTOBER 2017 S A N F R A N C I S C OT R A N S P O R T A T I O N P L A N
2040
delivery since 2013. For projects previously included in the 2013 SFTP, costs already incurred (and the associated revenues) were not included in the 2017 SFTP Update, consistent with MTC guid-ance related to Plan Bay Area. Thus, the 2017 Update shows sig-nificantly lower costs (and revenues) associated with projects like the Central Subway which are well into the construction phase.
Generally, we observed increasing costs in the following areas:
• STATE OF GOOD REPAIR AND OPERATIONS AND MAINTE-
NANCE: San Francisco’s system suffers from chronic underin-vestment and deferred maintenance work often costs more to address. Even in the Investment Vision scenario, state of good repair needs are not fully funded for local streets or for transit operators’ capital assets. Further, as our system expands and the existing elements age, the need for additional investment grows.
• CAPITAL PROJECTS: As project development progresses, total estimated costs often increase to reflect refinements to project definitions and sometimes inclusion of additional elements. New elements may reflect new policy focus areas such as add-ing scope to address safety consistent with the City’s Vision Zero policy or other complete street elements. Increased cost to reflect inflation is often a significant factor especially for larger, more complicated projects that are more expensive and take longer to deliver.
The 2013 SFTP proposed ways to invest funds most effectively to make progress towards the plan’s goals. One of the ways we ac-complished this was through project performance evaluation. To prioritize projects within the financially-constrained Investment Plan or the more inclusive Investment Vision, we evaluated proj-ects by several factors: benefit to the Plan goal areas (safety and livability, economic competitiveness, world-class infrastructure, and healthy environment), project costs, and additional consid-erations (safety, operational benefits, support for Priority Devel-opment Area growth, and equity). The methodology for project evaluation is described in detail in Appendix A of the 2013 SFTP.
For this 2017 SFTP Update, we revisited the project evaluation with consideration for updated costs and scopes, and new proj-ects. This information was obtained through a call for projects that also served as the San Francisco call for projects for Plan Bay Area 2040. Even those projects with significant cost increases still performed well enough to remain in the Investment Plan.
Two high performing projects have been added to the financially-constrained Investment Plan and are included in Plan Bay Area 2040 update:
• Re-build and Widen Harney Way
• Mission Bay Ferry Landing
In addition to the above two projects, one additional project was added to the Investment Vision:
• Geneva Avenue Light Rail Phase I: Operational Improvements
This reflects advancements in the project’s status and is consistent with operational benefits highlighted in the Geneva-Harney Bus Rapid Transit Feasibility Study, led by the Transportation Author-ity in coordination with the SFMTA. A small amount of funding is included in the Investment Plan to complete planning and envi-ronmental phases, in order to ready the project for implementa-tion funding that is assumed in the Investment Vision scenario.
THE UPDATED INVESTMENT PLAN
With the updated revenue projections, project costs, and project evaluation complete, Transportation Authority staff assigned rev-enues to the Investment Plan and Investment Vision projects and programs to ensure consistency with eligibility requirements of revenue sources (e.g. restrictions on use of funds). Following this assignment, staff concluded that all the projects and programs in the Investment Plan and Investment Vision still fit within the projected amount of revenues available. Projects are shown as fully funded through construction or partially funded, reflecting a combination of current project status (e.g. is it environmentally cleared? In final design?) and available funding relative to the size of the project’s funding gap (the net need after accounting for funds already committed to the project).
PAGE 28
2017 SFTP UPDATE FINAL REPORT • SAN FRANCISCO TRANSPORTATION PLAN
SAN FRANCISCO COUNTY TRANSPORTATION AUTHORITY • OCTOBER 2017 S A N F R A N C I S C OT R A N S P O R T A T I O N P L A N
2040
Detailed expenditures for the updated Investment Plan and In-vestment Vision are shown in Appendix C organized into the three major categories:
• Ongoing Maintenance and Operations
• Transportation Program and Enhancements
• Efficiency and Expansion
As a reminder, the SFTP is a long-range plan and not a program-ming document that assigns specific funds to specific projects. If a project is shown through implementation in the Investment Plan, it may not be fully funded with specific funds committed to the project. Rather, it means that the project has been prioritized as part of the Investment Plan and that sufficient funds will be avail-able for the phase or phases included in the SFTP over the 25-plus year horizon of the SFTP. As a result, all of the Investment Plan projects have been included in the Plan Bay Area update and are eligible to seek discretionary federal and state funds, and to seek federal approvals such as for environmental documents.
NEED FOR NEW REVENUE ADVOCACY
In total, the 2017 SFTP Update estimates an increase in the amount of revenue available for San Francisco transportation projects from $75 billion to $84.5 billion. The forecast accounts for existing federal, state, regional, and local revenues and also includes an estimated $3.3 billion in anticipated but unspecified sources,43 a 10-cent regional gas tax, and a toll increase on the Bay Area state-owned toll bridges (all but the Golden Gate Bridge)—all of which require various legislative and/or voter approvals in order to be put into place.
While our revenue forecast has increased, needs have also in-creased across all investment categories. For example, the total funding shortfall just to maintain our existing transit systems has increased significantly, from $5.7 billion in 2013 to $12.5 billion with the updated Investment Plan. Further, many projects and
43 The FHWA has allowed MTC to assume a certain amount of anticipated but unidentified revenues in Plan Bay Area based on analyses of historic revenue patterns. The 2017 SFTP Update assumes a San Francisco share of these revenues.
programs included in the Investment Plan are only partially fund-ed, meaning the $7.9 billion in additional new local revenues in the Investment Vision are insufficient to meet the SFTP goals. All of this underscores the need for continued new revenue advocacy, concurrent with ongoing efforts to reduce project delivery costs and ensure we are investing the funds we have in the most effec-tive and most needed projects.
WHAT’S NEXT? As described in the preceding sections of this document, we are making progress on delivering the projects and programs iden-tified in the 2013 SFTP by establishing supportive policies and funding mechanisms, completing plans that inform current and future investments, and securing new revenues for San Francisco. Despite the successes in these first four years of implementing a 25-plus year investment plan, needs remain in all areas. As previ-ously discussed, new trends now challenge the existing transpor-tation system. Some strategies to address the challenges remain the same: maintaining our existing infrastructure in a state of good repair, stabilizing and protecting transportation revenues from being diverted to other uses, and seeking new revenues.
Moving forward, more research should be conducted, and new policies and planning efforts should be initiated to figure out how to best address new and emerging trends and technologies into our transportation vision. The sections below highlight new plan-ning efforts (underway or on the horizon) and new revenue advo-cacy that will help the City seek solutions to our transportation issues.
NEW PLANNING EFFORTSBay Area Core Capacity Transit Study
The Core Capacity Transit Study is an inter-agency effort to identi-fy investments and improvements that will increase transit capac-ity and reduce transit crowding in San Francisco’s core, which in-cludes portions of the Financial District, SoMa, Mid-Market, and Mission Bay Neighborhoods and the transbay corridor. Led by the MTC, this study is a joint effort with BART, the SFMTA, AC Tran-
PAGE 29
2017 SFTP UPDATE FINAL REPORT • SAN FRANCISCO TRANSPORTATION PLAN
SAN FRANCISCO COUNTY TRANSPORTATION AUTHORITY • OCTOBER 2017 S A N F R A N C I S C OT R A N S P O R T A T I O N P L A N
2040
sit, Caltrain, Water Emergency Transportation Authority (WETA), and the Transportation Authority. The study has provided the basis for a strategy to address crowding and capacity in these corridors within the Plan Bay Area 2040 update. It has catalyzed funding for near-term improvements such as alternative seat configurations on BART and funding the purchase of additional AC Transit transbay buses. Early results of the study identified a shared understanding of high priority baseline improvements and investments in the transit system such as expansion of fleet and facility capacity across Muni, BART, WETA, and AC Transit and the funding and completion of capital projects such as Muni For-ward, DTX, and Van Ness and Geary BRT, all of which will be prior-itized for local and regional funding as it becomes available. With its conclusion coinciding with the publishing of this document, the study recommends further short and medium-term invest-ments and strategies, as well as provide a framework for ongoing long-term planning that includes further study of a new transbay transit crossing for BART, standard gauge rail, or both services.
San Francisco Freeway Corridor Management Study
Through the San Francisco Freeway Corridor Management Study (FCMS), one of the key recommendations from the 2013 SFTP, the Transportation Authority is exploring strategies to manage travel in the US 101 and I-280 corridors in San Francisco. These two heavily-traveled regional routes will see large increases in demand with projected jobs and housing growth. This feasibility study focuses on applying technology and efficiency-related ap-proaches, such as managed lanes for high-occupancy vehicles, to improve the throughput of the existing facilities. The study began with a multi-faceted technical analysis of potential improvements based on the Vision and Goals adopted by the Transportation Au-thority Board in 2015.
Additionally, with the recognition that freeway travel in the Bay Area extends across county lines, the Transportation Authority began coordination with partners in San Mateo County to plan for a continuous freeway management scheme, including opportuni-ties for regional bus service with priority lanes along the entire US 101 corridor. After an existing conditions analysis shared with
the Transportation Authority Board in fall 2016, the FCMS team is proceeding with an evaluation of improvements to address ex-isting and future conditions. In addition, staff is conducting com-munity outreach and identifying potential scenarios for managed-lanes. The study is funded by Prop K and the Caltrans Partnership Planning for Sustainable Transportation grant program. In FY 2017/18, the project will move into the Caltrans project initia-tion document phase, a pre-environmental study planning phase required by Caltrans for projects on the state highway system.
Emerging Mobility Services and Technology Studies
The Transportation Authority has initiated a series of Emerging Mobility Services and Technology Studies. The first phase of the series of studies will consist of 1) an inventory of services in San Francisco including their legislative framework, user statistics and potential outcomes; 2) a set of guiding principles for how to un-derstand and evaluate existing and future services; 3) an evalu-ation of the emerging mobility services; and 4) development of a set of policy recommendations. During this process, the team will conduct outreach and provide reports to agency stakeholders, community partners, and tech-industry representatives. Future phases of the effort may include a) developing a comprehensive data reporting policy, protocols, and strategy for implementation, b) potential pilot projects, and c) an ongoing research plan.
Treasure Island Autonomous Shuttle Pilot
The Federal Highway Administration (FHWA) awarded the SFMTA and TIMMA $11 million in Advanced Transportation and Con-gestion Management Technologies Deployment funding in 2016. Among the projects funded by this award is the pilot of an autono-mous shuttle vehicle and service on Treasure Island. The project will procure, test, deploy, and evaluate an autonomous shuttle to serve as the first-last mile connection between the Treasure Island Intermodal Terminal and the neighborhoods on Treasure and Yerba Buena Islands. The project tasks include systems engineer-ing; analysis of business model; vehicle systems integration and testing; and evaluation. Some of the issues to be tested include vehicle design with respect to accessibility, safety, security, grade, and ease of use. Service plan issues to be evaluated include service

PAGE 30
2017 SFTP UPDATE FINAL REPORT • SAN FRANCISCO TRANSPORTATION PLAN
SAN FRANCISCO COUNTY TRANSPORTATION AUTHORITY • OCTOBER 2017 S A N F R A N C I S C OT R A N S P O R T A T I O N P L A N
2040
plan opportunities and constraints. Operator issues to be ana-lyzed include upfront capital/systems engineering costs; testing duration and cost; and vehicle ongoing operating costs including energy cost and maintenance cost. The project will identify insti-tutional and stakeholder issues, conduct stakeholder outreach, and provide an oversight and monitoring approach for evaluation. Testing of the shuttle is expected to begin in early 2019.
ConnectSF
Guided by community input, ConnectSF is a multi-agency effort that seeks to define a 50-year vision of San Francisco’s future that represents our priorities, goals and aspirations as a city and part of the region. ConnectSF will anchor San Francisco’s future trans-portation planning in the priorities we care most about: safety and livability, equity, environmental sustainability, and economic vitality. The ConnectSF vision will ensure land use, transportation and economic development considers long-range implications, are coordinated, and informs regional planning. The Long-Range Transportation Vision will help the City make better decisions and more strategic investments.
The ConnectSF vision will help guide follow-on studies and the next major update of the SFTP (SFTP 2050). For example, the Transit Modal Concept Study will seek to prioritize the next gen-eration of transit expansion projects in the city. This will be a major technical and community-based prioritization process, given the tremendous desire and need for rapid transit and lack of existing funds to build new systems. The Freeway and Street Traffic Man-agement Strategy will look at ways to improve the efficiency and safety of our highway and streets network using active congestion management tools such as managed lanes. The SFTP 2050 will draw from these modal plans along with other bicycle, pedestrian and transportation sector plans, and use them to create financially constrained, multimodal investment scenarios that will be evalu-ated against their ability to implement the Vision and SFTP goals. Following SFTP 2050, the Planning Department will update the Transportation Element of the San Francisco General Plan, one of the guiding policy documents for San Francisco’s transportation system. More information can be found at www.connectsf.org.
NEW REVENUE ADVOCACY
Over the past few years, voters and elected officials have approved new funding for transportation and housing (which can help us with some of our transportation challenges), and yet the city’s and region’s transportation needs still far exceed resources avail-able. The City and County of San Francisco continues to strongly support efforts to pursue additional transportation revenues at all levels of government and will work with MTC and other agencies to advocate for a greater share of local, federal and state dollars.
In tandem with preparation of this SFTP update, the Transporta-tion Authority has prepared a white paper detailing potential new local revenue sources for transportation funding as local revenue sources are the ones we can most directly influence. This document is intended to serve as a reference document and will be used to inform discussions about potential local revenue measures.
In the remainder of this section we highlight three new revenue advocacy efforts that are presently underway.
Caltrain Sales Tax
The Transportation Authority been participating in efforts to se-cure state legislative authorization that would enable Caltrain to place a 1/8-cent sales tax on the ballot in San Francisco, San Ma-teo and Santa Clara Counties to fund operating and capital needs for Caltrain rail service. SB 797 (Hill) is, as of the writing of this report, still active in the current legislative session. Caltrain is severely challenged by the lack of a dedicated funding source to help operate, maintain and improve its system. We will continue to work with our San Francisco and regional partners on this leg-islation and, if approved, on identifying an expenditure plan and complementary policy changes.
Regional Measure 3 Bridge Tolls
There is currently a significant regional opportunity under consid-eration that could raise new revenue for Bay Area transportation. MTC is seeking state authority for Regional Measure 3 (RM3), a $1–$3 toll increase (amount yet to be decided) for the region’s seven state-owned toll bridges (all except for the Golden Gate Bridge). RM3 has the potential of raising $1.7 to $5 billion (esti-

PAGE 31
2017 SFTP UPDATE FINAL REPORT • SAN FRANCISCO TRANSPORTATION PLAN
SAN FRANCISCO COUNTY TRANSPORTATION AUTHORITY • OCTOBER 2017 S A N F R A N C I S C OT R A N S P O R T A T I O N P L A N
2040
mated bonded amount over a 25-year period) for transportation projects and programs that improve mobility and enhance travel options in the toll bridge corridors. In other words, while SB 1 (see p. 18) focused primarily on repairing and maintaining local roads and the state highway system (“aging pains”), RM3 would will focus on the region’s “growing pains”—helping to address the significant traffic congestion and overcrowding on core transit systems serving the bridge corridors, including, the San Francis-co-Oakland Bay Bridge corridor. Senator Jim Beall introduced SB 595 that would provide the legislative authority needed to place RM3 on the ballot in all nine Bay Area counties at an election date to be determined. The bill has already passed through legislation and awaits the governor’s signature. Because it is considered a fee, RM3 would require a simple 50% + 1 (aggregate vote) in the nine counties to be approved.
Building off the San Francisco project priorities identified for the PBA 2040 and the 2017 SFTP updates, we have been engaged with other San Francisco stakeholders, MTC, regional transit operators and our state delegation to identify San Francisco priorities for RM3 to help shape the details of the Expenditure Plan. We ad-opted a set of principles to guide development of the Expenditure Plan, as well as a list of local and San Francisco-endorsed regional priorities for RM3, which was also adopted by the SFMTA. Some of our priorities include funding for additional BART cars, additional Muni vehicles and associated facilities improvements to properly maintain the expanded fleet, the Downtown Extension, recom-mendations from the Bay Area Core Capacity Study (see previous section), and a new Mission Bay Ferry Terminal.
San Francisco Transportation Task Force 2045
Recognizing that we can’t expect the federal or state governments to address our pressing local transportation needs in their en-tirety, and complementing the regional conversations about RM3, Mayor Lee and Board of Supervisors’ President Breed have estab-lished the San Francisco Transportation Task Force 2045 (TTF 2045). The purpose of the task force is to address transportation needs, gaps and local revenue options over the next quarter cen-tury, targeting the 2018 election cycle. The Task Force includes members representing neighborhood organizations; transpor-
tation, environmental justice and housing advocates; large and small businesses; transportation agencies; and others. The Task Force is charged with building and expanding upon T2030 (see p. 17), Props J/K (2016) and the SFTP to identify preferred revenue source(s) and an expenditure plan for 2018 and beyond. This ef-fort is coordinated with the RM3 effort to ensure that the City has the local matching funds needed to match and/or prepare projects to compete for new regional funding in the potential RM3 as well as new state funding such as SB 1. The first meeting of the Task Force was held in June 2017. Meeting materials can be found at www.sftransportation2045.org. The Transportation Authority is actively staffing this effort along with the SFMTA, Mayor’s Office and other City agencies.
CONCLUSIONSan Francisco’s transportation goals are ambitious but achiev-able if we stay focused and coordinated across our community. This SFTP update combines a progress report on activities recom-mended in the 2013 Plan with an updated look at sector needs and trends, revenues and investments, all with the guidance of our Board and input from the public. We will continue to deliver on the projects and policies included in the plan, as we plan and fund the next cycle of improvements to help deliver safe, afford-able and equitable transportation for all San Franciscans.
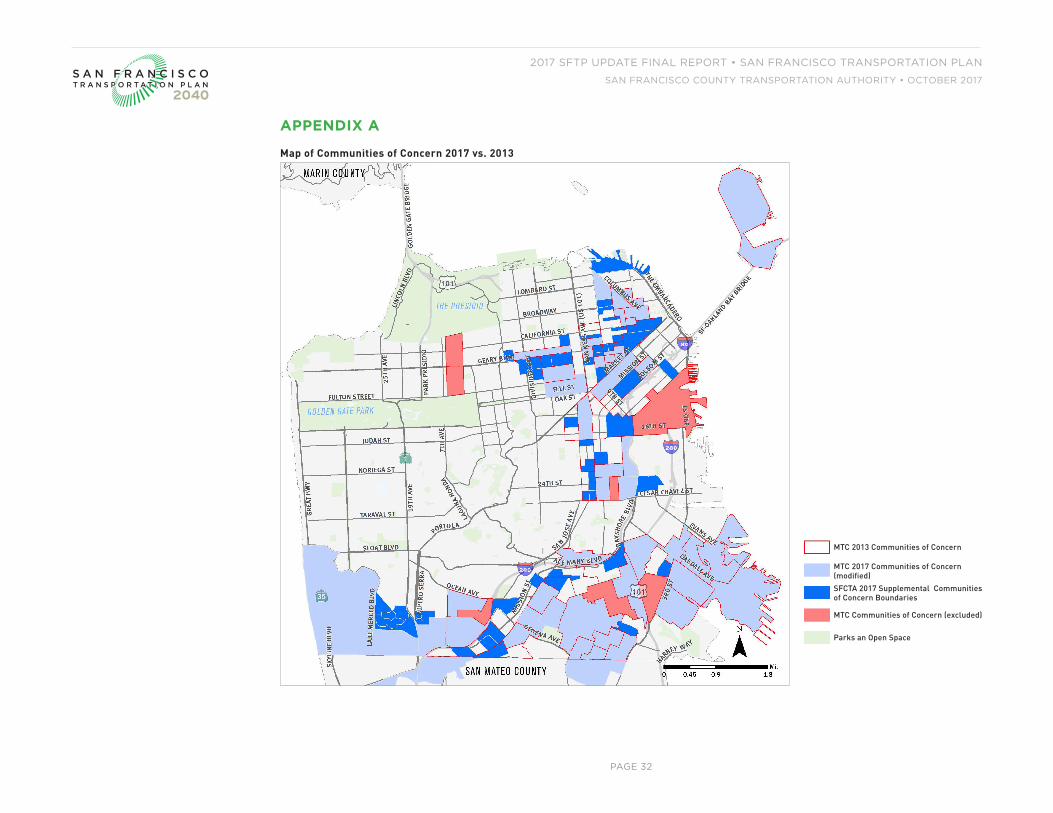
PAGE 32
2017 SFTP UPDATE FINAL REPORT • SAN FRANCISCO TRANSPORTATION PLAN
SAN FRANCISCO COUNTY TRANSPORTATION AUTHORITY • OCTOBER 2017 S A N F R A N C I S C OT R A N S P O R T A T I O N P L A N
2040
APPENDIX A
Map of Communities of Concern 2017 vs. 2013
MTC 2013 Communities of Concern
MTC 2017 Communities of Concern (modified)
SFCTA 2017 Supplemental Communities of Concern Boundaries
MTC Communities of Concern (excluded)
Parks an Open Space
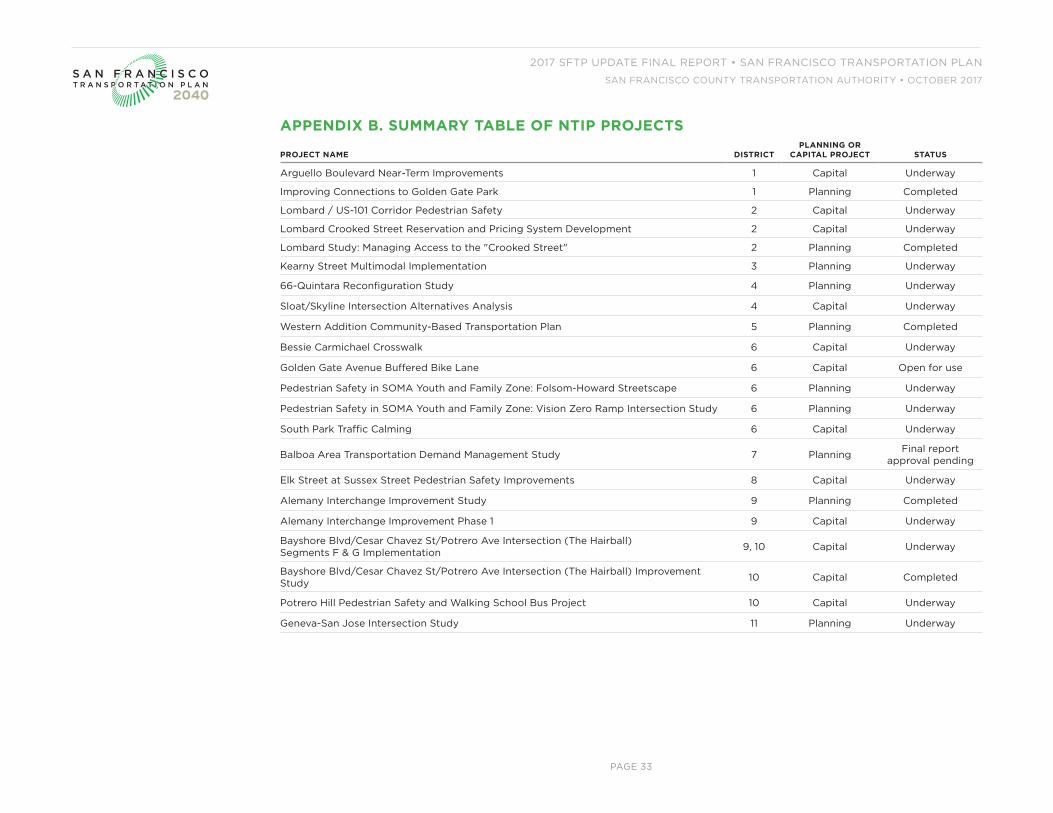
PAGE 33
2017 SFTP UPDATE FINAL REPORT • SAN FRANCISCO TRANSPORTATION PLAN
SAN FRANCISCO COUNTY TRANSPORTATION AUTHORITY • OCTOBER 2017 S A N F R A N C I S C OT R A N S P O R T A T I O N P L A N
2040
APPENDIX B. SUMMARY TABLE OF NTIP PROJECTS
PROJECT NAME DISTRICTPLANNING OR
CAPITAL PROJECT STATUS
Arguello Boulevard Near-Term Improvements 1 Capital Underway
Improving Connections to Golden Gate Park 1 Planning Completed
Lombard / US-101 Corridor Pedestrian Safety 2 Capital Underway
Lombard Crooked Street Reservation and Pricing System Development 2 Capital Underway
Lombard Study: Managing Access to the "Crooked Street" 2 Planning Completed
Kearny Street Multimodal Implementation 3 Planning Underway
66-Quintara Reconfiguration Study 4 Planning Underway
Sloat/Skyline Intersection Alternatives Analysis 4 Capital Underway
Western Addition Community-Based Transportation Plan 5 Planning Completed
Bessie Carmichael Crosswalk 6 Capital Underway
Golden Gate Avenue Buffered Bike Lane 6 Capital Open for use
Pedestrian Safety in SOMA Youth and Family Zone: Folsom-Howard Streetscape 6 Planning Underway
Pedestrian Safety in SOMA Youth and Family Zone: Vision Zero Ramp Intersection Study 6 Planning Underway
South Park Traffic Calming 6 Capital Underway
Balboa Area Transportation Demand Management Study 7 Planning Final report approval pending
Elk Street at Sussex Street Pedestrian Safety Improvements 8 Capital Underway
Alemany Interchange Improvement Study 9 Planning Completed
Alemany Interchange Improvement Phase 1 9 Capital Underway
Bayshore Blvd/Cesar Chavez St/Potrero Ave Intersection (The Hairball) Segments F & G Implementation 9, 10 Capital Underway
Bayshore Blvd/Cesar Chavez St/Potrero Ave Intersection (The Hairball) Improvement Study 10 Capital Completed
Potrero Hill Pedestrian Safety and Walking School Bus Project 10 Capital Underway
Geneva-San Jose Intersection Study 11 Planning Underway
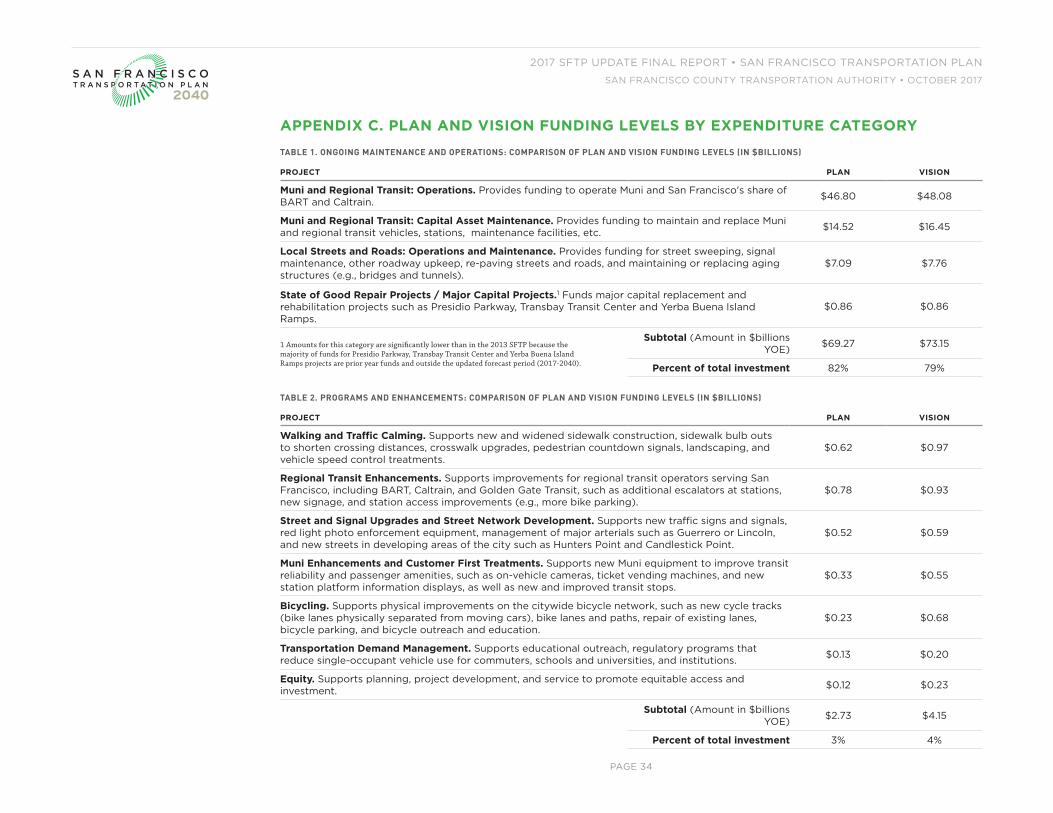
PAGE 34
2017 SFTP UPDATE FINAL REPORT • SAN FRANCISCO TRANSPORTATION PLAN
SAN FRANCISCO COUNTY TRANSPORTATION AUTHORITY • OCTOBER 2017 S A N F R A N C I S C OT R A N S P O R T A T I O N P L A N
2040
APPENDIX C. PLAN AND VISION FUNDING LEVELS BY EXPENDITURE CATEGORY
TABLE 1. ONGOING MAINTENANCE AND OPERATIONS: COMPARISON OF PLAN AND VISION FUNDING LEVELS (IN $BILLIONS)
PROJECT PLAN VISION
Muni and Regional Transit: Operations. Provides funding to operate Muni and San Francisco's share of BART and Caltrain. $46.80 $48.08
Muni and Regional Transit: Capital Asset Maintenance. Provides funding to maintain and replace Muni and regional transit vehicles, stations, maintenance facilities, etc. $14.52 $16.45
Local Streets and Roads: Operations and Maintenance. Provides funding for street sweeping, signal maintenance, other roadway upkeep, re-paving streets and roads, and maintaining or replacing aging structures (e.g., bridges and tunnels).
$7.09 $7.76
State of Good Repair Projects / Major Capital Projects.1 Funds major capital replacement and rehabilitation projects such as Presidio Parkway, Transbay Transit Center and Yerba Buena Island Ramps.
$0.86 $0.86
1 Amounts for this category are significantly lower than in the 2013 SFTP because the majority of funds for Presidio Parkway, Transbay Transit Center and Yerba Buena Island Ramps projects are prior year funds and outside the updated forecast period (2017-2040).
Subtotal (Amount in $billions YOE) $69.27 $73.15
Percent of total investment 82% 79%
TABLE 2. PROGRAMS AND ENHANCEMENTS: COMPARISON OF PLAN AND VISION FUNDING LEVELS (IN $BILLIONS)
PROJECT PLAN VISION
Walking and Traffic Calming. Supports new and widened sidewalk construction, sidewalk bulb outs to shorten crossing distances, crosswalk upgrades, pedestrian countdown signals, landscaping, and vehicle speed control treatments.
$0.62 $0.97
Regional Transit Enhancements. Supports improvements for regional transit operators serving San Francisco, including BART, Caltrain, and Golden Gate Transit, such as additional escalators at stations, new signage, and station access improvements (e.g., more bike parking).
$0.78 $0.93
Street and Signal Upgrades and Street Network Development. Supports new traffic signs and signals, red light photo enforcement equipment, management of major arterials such as Guerrero or Lincoln, and new streets in developing areas of the city such as Hunters Point and Candlestick Point.
$0.52 $0.59
Muni Enhancements and Customer First Treatments. Supports new Muni equipment to improve transit reliability and passenger amenities, such as on-vehicle cameras, ticket vending machines, and new station platform information displays, as well as new and improved transit stops.
$0.33 $0.55
Bicycling. Supports physical improvements on the citywide bicycle network, such as new cycle tracks (bike lanes physically separated from moving cars), bike lanes and paths, repair of existing lanes, bicycle parking, and bicycle outreach and education.
$0.23 $0.68
Transportation Demand Management. Supports educational outreach, regulatory programs that reduce single-occupant vehicle use for commuters, schools and universities, and institutions. $0.13 $0.20
Equity. Supports planning, project development, and service to promote equitable access and investment. $0.12 $0.23
Subtotal (Amount in $billions YOE) $2.73 $4.15
Percent of total investment 3% 4%
PAGE 34
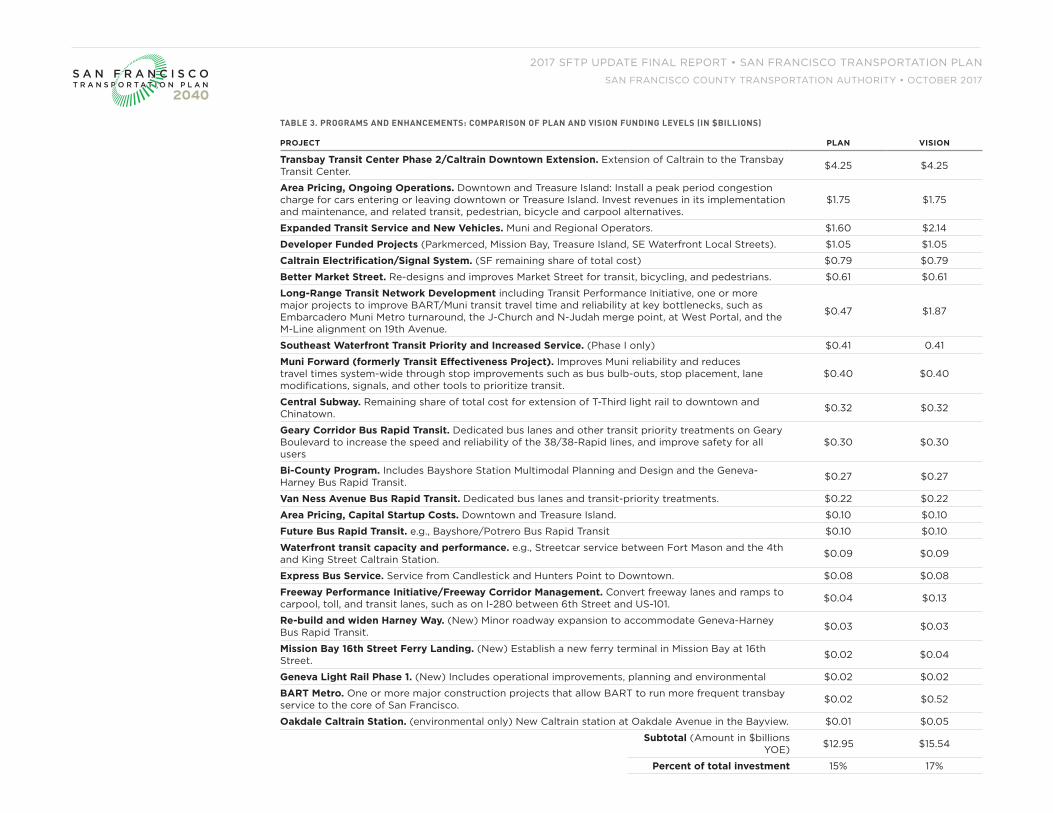
PAGE 35
2017 SFTP UPDATE FINAL REPORT • SAN FRANCISCO TRANSPORTATION PLAN
SAN FRANCISCO COUNTY TRANSPORTATION AUTHORITY • OCTOBER 2017 S A N F R A N C I S C OT R A N S P O R T A T I O N P L A N
2040
TABLE 3. PROGRAMS AND ENHANCEMENTS: COMPARISON OF PLAN AND VISION FUNDING LEVELS (IN $BILLIONS)
PROJECT PLAN VISION
Transbay Transit Center Phase 2/Caltrain Downtown Extension. Extension of Caltrain to the Transbay Transit Center. $4.25 $4.25
Area Pricing, Ongoing Operations. Downtown and Treasure Island: Install a peak period congestion charge for cars entering or leaving downtown or Treasure Island. Invest revenues in its implementation and maintenance, and related transit, pedestrian, bicycle and carpool alternatives.
$1.75 $1.75
Expanded Transit Service and New Vehicles. Muni and Regional Operators. $1.60 $2.14
Developer Funded Projects (Parkmerced, Mission Bay, Treasure Island, SE Waterfront Local Streets). $1.05 $1.05
Caltrain Electrification/Signal System. (SF remaining share of total cost) $0.79 $0.79
Better Market Street. Re-designs and improves Market Street for transit, bicycling, and pedestrians. $0.61 $0.61
Long-Range Transit Network Development including Transit Performance Initiative, one or more major projects to improve BART/Muni transit travel time and reliability at key bottlenecks, such as Embarcadero Muni Metro turnaround, the J-Church and N-Judah merge point, at West Portal, and the M-Line alignment on 19th Avenue.
$0.47 $1.87
Southeast Waterfront Transit Priority and Increased Service. (Phase I only) $0.41 0.41
Muni Forward (formerly Transit Effectiveness Project). Improves Muni reliability and reduces travel times system-wide through stop improvements such as bus bulb-outs, stop placement, lane modifications, signals, and other tools to prioritize transit.
$0.40 $0.40
Central Subway. Remaining share of total cost for extension of T-Third light rail to downtown and Chinatown. $0.32 $0.32
Geary Corridor Bus Rapid Transit. Dedicated bus lanes and other transit priority treatments on Geary Boulevard to increase the speed and reliability of the 38/38-Rapid lines, and improve safety for all users
$0.30 $0.30
Bi-County Program. Includes Bayshore Station Multimodal Planning and Design and the Geneva-Harney Bus Rapid Transit. $0.27 $0.27
Van Ness Avenue Bus Rapid Transit. Dedicated bus lanes and transit-priority treatments. $0.22 $0.22
Area Pricing, Capital Startup Costs. Downtown and Treasure Island. $0.10 $0.10
Future Bus Rapid Transit. e.g., Bayshore/Potrero Bus Rapid Transit $0.10 $0.10
Waterfront transit capacity and performance. e.g., Streetcar service between Fort Mason and the 4th and King Street Caltrain Station. $0.09 $0.09
Express Bus Service. Service from Candlestick and Hunters Point to Downtown. $0.08 $0.08
Freeway Performance Initiative/Freeway Corridor Management. Convert freeway lanes and ramps to carpool, toll, and transit lanes, such as on I-280 between 6th Street and US-101. $0.04 $0.13
Re-build and widen Harney Way. (New) Minor roadway expansion to accommodate Geneva-Harney Bus Rapid Transit. $0.03 $0.03
Mission Bay 16th Street Ferry Landing. (New) Establish a new ferry terminal in Mission Bay at 16th Street. $0.02 $0.04
Geneva Light Rail Phase 1. (New) Includes operational improvements, planning and environmental $0.02 $0.02
BART Metro. One or more major construction projects that allow BART to run more frequent transbay service to the core of San Francisco. $0.02 $0.52
Oakdale Caltrain Station. (environmental only) New Caltrain station at Oakdale Avenue in the Bayview. $0.01 $0.05
Subtotal (Amount in $billions YOE) $12.95 $15.54
Percent of total investment 15% 17%