2017 nuclear decommissioning funding study - callan · 2018-07-30 · knowledge. experience....
TRANSCRIPT

CALLAN INSTITUTE
Study
2017 Nuclear Decommissioning Funding StudyNDT Fund Balances, Annual Contributions, and Decommissioning Cost Estimates as of Dec. 31, 2016


2017 Nuclear Decommissioning Funding Study 1Knowledge. Experience. Integrity.
Table of Contents
Executive Summary 2
Methodology 4
Investor-Owned Utilities 5
Public Power Utilities 6
Fund Balances 7
Contributions 8
Cost Estimates 9
Funding Status 10
Pro Forma vs. Actual Contributions 12
Cost Comparisons 14
Escalation Rates 15
Asset Allocations 16
Investment Returns of Investor-Owned Utilities 17
Global Nuclear Power Generation 19
Endnotes 20
Certain information herein has been compiled by Callan and is based on information provided by a variety of sources believed to be reliable for which Callan has not necessarily verified the accuracy or completeness of or updated. This report is for informational purposes only and should not be construed as legal or tax advice on any matter. Any investment decision you make on the basis of this report is your sole responsibility. You should consult with legal and tax advisers before applying any of this information to your particular situation. Reference in this report to any product, service, or entity should not be construed as a rec-ommendation, approval, affiliation, or endorsement of such product, service, or entity by Callan. Past performance is no guarantee of future results. This report may consist of statements of opinion, which are made as of the date they are expressed and are not statements of fact. The Callan Institute (the “Institute”) is, and will be, the sole owner and copyright holder of all material prepared or developed by the Institute. No party has the right to reproduce, revise, resell, dis-seminate externally, disseminate to subsidiaries or parents, or post on internal websites any part of any material prepared or developed by the Institute, without the Institute’s permission.

2017 Nuclear Decommissioning Funding Study 2Knowledge. Experience. Integrity.
Callan’s annual Nuclear Decommissioning Funding Study offers key insights into the status of nuclear decommissioning funding in the U.S. to make peer comparisons more accurate and rel-evant. The 2017 study covers 27 investor-owned and 27 public power utilities (excluding public power owners with small shares)1 with an ownership interest in the 99 operating nuclear reactors and 11 of the non-operating reactors in the U.S. The number of utilities with an ownership interest declined steadily in the early- to mid-2000s, due primarily to mergers/acquisitions and the sale of nuclear-generating facilities. However, in recent years the number of these utilities has remained fairly steady.
What Is Nuclear Decommissioning?After a nuclear power plant is closed, the facility must be decommissioned by safely removing it from service and reducing residual radioactivity to a level that permits release of the property and termination of the operating license. Decommissioning involves removing spent fuel from the reactor vessel, dismantling and disposing of radioactive components and materials such as the reactor and piping, and clean-ing up any radioactive or hazardous contamination that remains on site.
Decommissioning Funding and Reporting The U.S. Nuclear Regulatory Commission (NRC) oversees the decommissioning of nuclear facilities and requires owners to set aside funds for the work. Approximately 70% of licensees are authorized to accumulate decommissioning funds over the operating life of their plants. These owners—gener-ally traditional, rate-regulated utilities—gradually build up money for decommissioning over the plant’s operating life by collecting money from customers through rates that are then placed in a nuclear decommissioning trust (NDT). The remaining licensees (approximately 30%) must provide financial assurance through other methods, such as prepaid decommissioning funds and/or a surety method or guarantee.
Executive Summary
1 Public power owners excluded: Dalton Utilities (Edwin Hatch 1 & 2 and Vogtle 1 & 2), Hudson Light and Power Department (Seabrook 1), Seminole Electric Cooperative (Crystal River 3), Taunton Municipal Lighting Plant (Seabrook 1), and seven munici-palities in Florida (Crystal River 3).
5
3
2
4
4
11
2
1
6
1
2
4
3
1
1
1
5
29
7
2
1
4
4
4
2
11
42
99 Operating Nuclear Power Reactors in the U.S.
(Number of Reactors per State)
Source: Nuclear Energy Institute
West of the Mississippi East of the Mississippi
Investor-owned vs. Public Power
NDTFund Balances
CostEstimates
87%
83%
13%
17%

2017 Nuclear Decommissioning Funding Study 3Knowledge. Experience. Integrity.
Each year, owners must review the decommissioning cost requirements and the status of their decommissioning funding for each reactor or share of a reactor they own. The findings must be reported to the NRC every two years, or annually within five years of shutdown or once the plant ceases operation.
Labor, energy, and waste material transportation and disposal are the primary components of decommissioning costs. Costs can be based on either the NRC minimum cost formula or a site-specific cost estimate calculated by an engineer-ing firm—as long as that amount is greater than the NRC cost figure. Site-specific engineering studies provide the most reliable decommissioning cost estimates. These studies often include costs beyond the NRC’s scope of decommission-ing, such as spent fuel management and site restoration (also known as “green fielding”), which together can run into the hundreds of millions of dollars.
Executive Summary
Labor
Energy
Waste material transportation & disposal
Decommissioning Costs Include:
$64billion
in total NDT funds
6.1%
The shrinking gap between assets and liabilities in 2016 resulted in an increase in the funding level from 67% in 2015 to 70% in 2016
1.3%
Incr
ease
in
cos
ts
Incr
ease
in
fund
s
Key Findings
$64million
In 2016 NDT contributions fell
Cost Estimates of Decommissioning(2008 v. 2016)
= $10 billion
2008: $55 billion 2016: $91 billion
See page 9 for details.
See page 8 for details.See page 7 for details.See pages 7, 9, and 11 for details.

2017 Nuclear Decommissioning Funding Study 4Knowledge. Experience. Integrity.
2017 Nuclear Decommissioning Funding Study 5Knowledge. Experience. Integrity.
Investor-Owned Utilities
Lic Exp [Avg Yrs]
MW Nuclear Capacity
Decommissioning Cost Estimate ($mm)
Fund Balance ($mm)
Pro Forma Fund Shortfall
($mm)
Annual Contribution ($mm)
Company Cost Est Amt/KWCost or
$847/KWCurrent Amount
Pro Forma Amount Shortfall/Avg Yrs
1 Ameren Corporation 1, 2 2044 [28] 1,236 $865 $700 $1,047 $557 $489 $7 $182 American Electric Power Company 3 2034-2037 [19] 2,285 $1,961 $858 $1,961 $1,803 $158 $9 $83 Constellation Energy Nuclear Group 4, 5 2029-2046 [20] 4,117 $2,491 $605 $3,486 $2,185 $1,301 $0 $664 Dominion Resources 6, 7 2032-2045 [17] 6,726 $4,345 $646 $5,695 $4,484 $1,211 $2 $705 DTE Energy Company 1, 7 2045 [28] 1,217 $1,700 $1,397 $1,700 $1,291 $409 $0 $14
6 Duke Energy Corporation 8 2030-2046 [19] 10,155 $8,150 $803 $8,598 $6,207 $2,391 $14 $1247 El Paso Electric Company 2045-2047 [30] 665 $433 $651 $563 $248 $315 $5 $118 Energy Future Holdings Corporation 3 2030-2033 [15] 2,430 $1,798 $740 $2,057 $938 $1,119 $17 $779 Entergy Corporation 9 2013-2044 [12] 8,779 $9,241 $1,053 $9,241 $4,910 $4,331 $49 $351
10 Exelon Corporation 5, 10 2026-2049 [22] 18,351 $10,738 $585 $15,538 $8,809 $6,728 $23 $305
11 FirstEnergy Corporation 1, 11 2026-2047 [15] 4,989 $5,260 $1,054 $5,260 $2,511 $2,749 $2 $17912 Great Plains Energy 1 2045 [28] 596 $360 $603 $505 $223 $282 $3 $1013 Green Mountain Power Corporation 7, 12 2045 [29] 22 $13 $575 $19 $10 $8 $0 $014 MidAmerican Energy Company 4, 7 2032 [16] 505 $316 $625 $428 $460 -$32 $2 -$215 NextEra Energy 7, 13 2030-2043 [17] 6,494 $5,539 $853 $5,539 $5,410 $129 $0 $7
16 NRG Energy 2, 7, 14 2027-2028 [11] 1,192 $986 $827 $1,009 $610 $399 $1 $3517 Pacifi c Gas and Electric Company 15 2024-2025 [8] 2,388 $4,423 $1,852 $4,423 $2,606 $1,817 $96 $22618 Pinnacle West Capital Corporation 2045-2047 [30] 1,225 $696 $568 $1,037 $726 $311 $2 $1119 Public Service Company of New Mexico 7 2045-2047 [30] 429 $244 $569 $363 $254 $109 $4 $420 Public Service Enterprise Group 7 2033-2046 [23] 3,945 $3,645 $924 $3,645 $1,862 $1,783 $0 $79
21 San Diego Gas and Electric Company 1, 16 [0] 430 $717 $1,666 $717 $751 -$35 $0 N.A.22 SCANA Corporation 7 2042 [26] 687 $739 $1,076 $739 $123 $616 $3 $2423 Southern California Edison 16, 17 2045-2047 [8] 2,347 $3,322 $1,415 $3,322 $3,622 -$300 $0 -$3624 Southern Company 18 2034-2049 [24] 3,699 $3,148 $851 $3,148 $1,604 $1,544 $6 $6425 Talen Energy Corporation 4, 7 2042-2044 [26] 2,336 $1,200 $514 $1,978 $1,033 $945 $0 $36
26 Westar Energy 1 2045 [28] 596 $360 $603 $505 $200 $305 $5 $1127 Xcel Energy 7 2030-2034 [16] 1,871 $3,271 $1,748 $3,271 $1,861 $1,410 $20 $89
Investor-Owned Utilities Totals 89,712 $75,959 $847 $85,793 $55,298 $30,495 $271 $1,780
See page 20 for endnotes.
This Nuclear Decommissioning Funding Study covers two types of utilities: 1. Investor-owned utilities, which are publicly traded companies that provide for-profit electric service, and2. Public power utilities, which are operated by local governments to provide not-for-profit electric service.
We list these companies in alphabetical order in two separate tables (pages 5 and 6). For each table, the first column provides the range of the years of license expiration (Lic Exp) for each unit owned along with the average years to expiration in brackets.1 We collected the decommissioning cost estimates, NDT fund balances, and annual contribu-tions from sources including (but not limited to): company 10-K filings with the Securities and Exchange Commis-sion (SEC), company decommissioning report filings with the NRC in accordance with 10 CFR 50.75, and company annual reports. The NRC and Nuclear Energy Institute’s websites were also valuable resources in collecting and verifying information in this report.
Unless otherwise noted, cost estimates are in 2016 dollars and based on site-specific studies representing the total cost (license termination, spent fuel management, and site restoration) to decommission the facility. In order to make the data comparable, we have calculated a “pro forma” decommissioning cost estimate, which is the higher of either the company cost estimate of decommissioning or $847/kilowatt (KW). We arrived at $847/KW by taking the average cost per KW reported for all investor-owned utilities. Trust fund balances represent liquidation values and include any internal reserves dedicated to decommissioning unless otherwise noted. Contributions include those to both external trust funds and any internal reserves dedicated to decommissioning.
Pro forma fund shortfall is the difference between the “pro forma” cost estimate of decommissioning and the fund balance. Pro forma contribution is the pro forma fund shortfall divided by the average years until license expiration as represented in brackets under the license expiration column. The average years until license expiration weights each unit’s license by its percent of the total megawatts owned by that particular utility, and takes into account license extensions granted by the NRC as of Dec. 31, 2016.
Methodology
2017 Nuclear Decommissioning Funding Study 5Knowledge. Experience. Integrity.
Investor-Owned Utilities
Lic Exp [Avg Yrs]
MW Nuclear Capacity
Decommissioning Cost Estimate ($mm)
Fund Balance ($mm)
Pro Forma Fund Shortfall
($mm)
Annual Contribution ($mm)
Company Cost Est Amt/KWCost or
$847/KWCurrent Amount
Pro Forma Amount Shortfall/Avg Yrs
1 Ameren Corporation 1, 2 2044 [28] 1,236 $865 $700 $1,047 $557 $489 $7 $182 American Electric Power Company 3 2034-2037 [19] 2,285 $1,961 $858 $1,961 $1,803 $158 $9 $83 Constellation Energy Nuclear Group 4, 5 2029-2046 [20] 4,117 $2,491 $605 $3,486 $2,185 $1,301 $0 $664 Dominion Resources 6, 7 2032-2045 [17] 6,726 $4,345 $646 $5,695 $4,484 $1,211 $2 $705 DTE Energy Company 1, 7 2045 [28] 1,217 $1,700 $1,397 $1,700 $1,291 $409 $0 $14
6 Duke Energy Corporation 8 2030-2046 [19] 10,155 $8,150 $803 $8,598 $6,207 $2,391 $14 $1247 El Paso Electric Company 2045-2047 [30] 665 $433 $651 $563 $248 $315 $5 $118 Energy Future Holdings Corporation 3 2030-2033 [15] 2,430 $1,798 $740 $2,057 $938 $1,119 $17 $779 Entergy Corporation 9 2013-2044 [12] 8,779 $9,241 $1,053 $9,241 $4,910 $4,331 $49 $351
10 Exelon Corporation 5, 10 2026-2049 [22] 18,351 $10,738 $585 $15,538 $8,809 $6,728 $23 $305
11 FirstEnergy Corporation 1, 11 2026-2047 [15] 4,989 $5,260 $1,054 $5,260 $2,511 $2,749 $2 $17912 Great Plains Energy 1 2045 [28] 596 $360 $603 $505 $223 $282 $3 $1013 Green Mountain Power Corporation 7, 12 2045 [29] 22 $13 $575 $19 $10 $8 $0 $014 MidAmerican Energy Company 4, 7 2032 [16] 505 $316 $625 $428 $460 -$32 $2 -$215 NextEra Energy 7, 13 2030-2043 [17] 6,494 $5,539 $853 $5,539 $5,410 $129 $0 $7
16 NRG Energy 2, 7, 14 2027-2028 [11] 1,192 $986 $827 $1,009 $610 $399 $1 $3517 Pacifi c Gas and Electric Company 15 2024-2025 [8] 2,388 $4,423 $1,852 $4,423 $2,606 $1,817 $96 $22618 Pinnacle West Capital Corporation 2045-2047 [30] 1,225 $696 $568 $1,037 $726 $311 $2 $1119 Public Service Company of New Mexico 7 2045-2047 [30] 429 $244 $569 $363 $254 $109 $4 $420 Public Service Enterprise Group 7 2033-2046 [23] 3,945 $3,645 $924 $3,645 $1,862 $1,783 $0 $79
21 San Diego Gas and Electric Company 1, 16 [0] 430 $717 $1,666 $717 $751 -$35 $0 N.A.22 SCANA Corporation 7 2042 [26] 687 $739 $1,076 $739 $123 $616 $3 $2423 Southern California Edison 16, 17 2045-2047 [8] 2,347 $3,322 $1,415 $3,322 $3,622 -$300 $0 -$3624 Southern Company 18 2034-2049 [24] 3,699 $3,148 $851 $3,148 $1,604 $1,544 $6 $6425 Talen Energy Corporation 4, 7 2042-2044 [26] 2,336 $1,200 $514 $1,978 $1,033 $945 $0 $36
26 Westar Energy 1 2045 [28] 596 $360 $603 $505 $200 $305 $5 $1127 Xcel Energy 7 2030-2034 [16] 1,871 $3,271 $1,748 $3,271 $1,861 $1,410 $20 $89
Investor-Owned Utilities Totals 89,712 $75,959 $847 $85,793 $55,298 $30,495 $271 $1,780
See page 20 for endnotes.
1 Non-operating units are included in all figures except the range of license expiration years.

2017 Nuclear Decommissioning Funding Study 5Knowledge. Experience. Integrity.
Investor-Owned Utilities
Lic Exp [Avg Yrs]
MW Nuclear Capacity
Decommissioning Cost Estimate ($mm)
Fund Balance ($mm)
Pro Forma Fund Shortfall
($mm)
Annual Contribution ($mm)
Company Cost Est Amt/KWCost or
$847/KWCurrent Amount
Pro Forma Amount Shortfall/Avg Yrs
1 Ameren Corporation 1, 2 2044 [28] 1,236 $865 $700 $1,047 $557 $489 $7 $182 American Electric Power Company 3 2034-2037 [19] 2,285 $1,961 $858 $1,961 $1,803 $158 $9 $83 Constellation Energy Nuclear Group 4, 5 2029-2046 [20] 4,117 $2,491 $605 $3,486 $2,185 $1,301 $0 $664 Dominion Resources 6, 7 2032-2045 [17] 6,726 $4,345 $646 $5,695 $4,484 $1,211 $2 $705 DTE Energy Company 1, 7 2045 [28] 1,217 $1,700 $1,397 $1,700 $1,291 $409 $0 $14
6 Duke Energy Corporation 8 2030-2046 [19] 10,155 $8,150 $803 $8,598 $6,207 $2,391 $14 $1247 El Paso Electric Company 2045-2047 [30] 665 $433 $651 $563 $248 $315 $5 $118 Energy Future Holdings Corporation 3 2030-2033 [15] 2,430 $1,798 $740 $2,057 $938 $1,119 $17 $779 Entergy Corporation 9 2013-2044 [12] 8,779 $9,241 $1,053 $9,241 $4,910 $4,331 $49 $351
10 Exelon Corporation 5, 10 2026-2049 [22] 18,351 $10,738 $585 $15,538 $8,809 $6,728 $23 $305
11 FirstEnergy Corporation 1, 11 2026-2047 [15] 4,989 $5,260 $1,054 $5,260 $2,511 $2,749 $2 $17912 Great Plains Energy 1 2045 [28] 596 $360 $603 $505 $223 $282 $3 $1013 Green Mountain Power Corporation 7, 12 2045 [29] 22 $13 $575 $19 $10 $8 $0 $014 MidAmerican Energy Company 4, 7 2032 [16] 505 $316 $625 $428 $460 -$32 $2 -$215 NextEra Energy 7, 13 2030-2043 [17] 6,494 $5,539 $853 $5,539 $5,410 $129 $0 $7
16 NRG Energy 2, 7, 14 2027-2028 [11] 1,192 $986 $827 $1,009 $610 $399 $1 $3517 Pacific Gas and Electric Company 15 2024-2025 [8] 2,388 $4,423 $1,852 $4,423 $2,606 $1,817 $96 $22618 Pinnacle West Capital Corporation 2045-2047 [30] 1,225 $696 $568 $1,037 $726 $311 $2 $1119 Public Service Company of New Mexico 7 2045-2047 [30] 429 $244 $569 $363 $254 $109 $4 $420 Public Service Enterprise Group 7 2033-2046 [23] 3,945 $3,645 $924 $3,645 $1,862 $1,783 $0 $79
21 San Diego Gas and Electric Company 1, 16 [0] 430 $717 $1,666 $717 $751 -$35 $0 N.A.22 SCANA Corporation 7 2042 [26] 687 $739 $1,076 $739 $123 $616 $3 $2423 Southern California Edison 16, 17 2045-2047 [8] 2,347 $3,322 $1,415 $3,322 $3,622 -$300 $0 -$3624 Southern Company 18 2034-2049 [24] 3,699 $3,148 $851 $3,148 $1,604 $1,544 $6 $6425 Talen Energy Corporation 4, 7 2042-2044 [26] 2,336 $1,200 $514 $1,978 $1,033 $945 $0 $36
26 Westar Energy 1 2045 [28] 596 $360 $603 $505 $200 $305 $5 $1127 Xcel Energy 7 2030-2034 [16] 1,871 $3,271 $1,748 $3,271 $1,861 $1,410 $20 $89
Investor-Owned Utilities Totals 89,712 $75,959 $847 $85,793 $55,298 $30,495 $271 $1,780
See page 20 for endnotes.
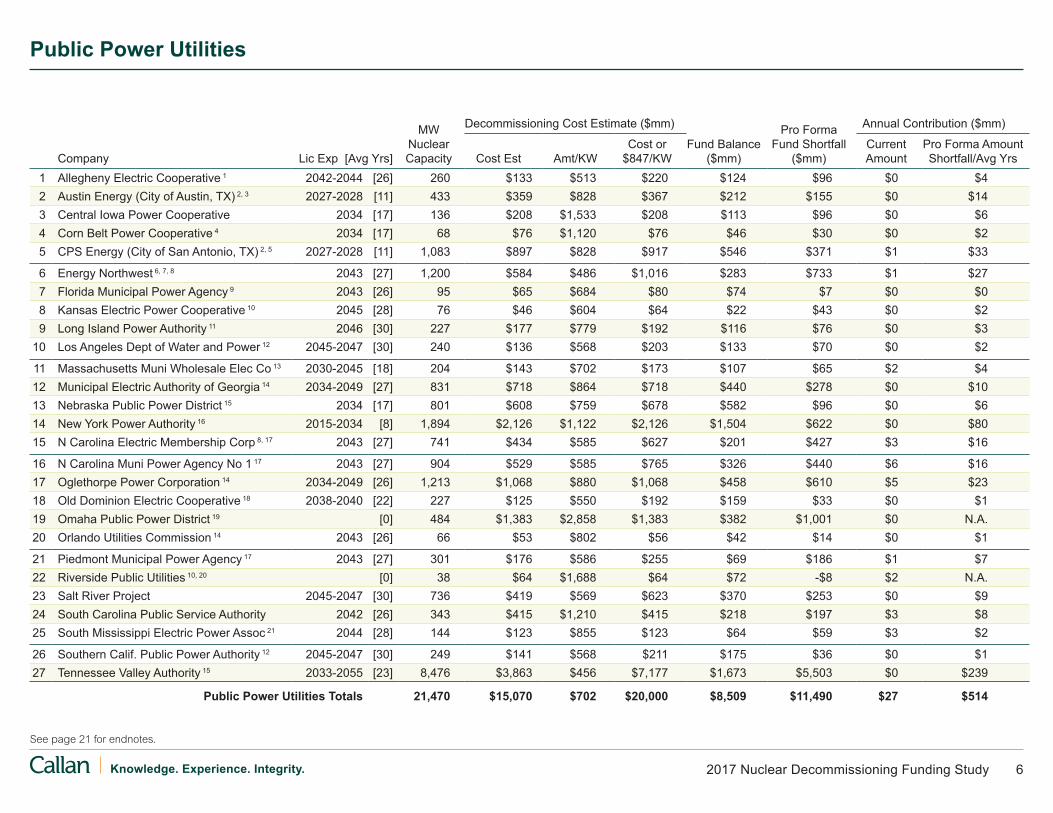
2017 Nuclear Decommissioning Funding Study 6Knowledge. Experience. Integrity.
Public Power Utilities
Lic Exp [Avg Yrs]
MW Nuclear Capacity
Decommissioning Cost Estimate ($mm)
Fund Balance ($mm)
Pro Forma Fund Shortfall
($mm)
Annual Contribution ($mm)
Company Cost Est Amt/KWCost or
$847/KWCurrent Amount
Pro Forma Amount Shortfall/Avg Yrs
1 Allegheny Electric Cooperative 1 2042-2044 [26] 260 $133 $513 $220 $124 $96 $0 $42 Austin Energy (City of Austin, TX) 2, 3 2027-2028 [11] 433 $359 $828 $367 $212 $155 $0 $143 Central Iowa Power Cooperative 2034 [17] 136 $208 $1,533 $208 $113 $96 $0 $64 Corn Belt Power Cooperative 4 2034 [17] 68 $76 $1,120 $76 $46 $30 $0 $25 CPS Energy (City of San Antonio, TX) 2, 5 2027-2028 [11] 1,083 $897 $828 $917 $546 $371 $1 $33
6 Energy Northwest 6, 7, 8 2043 [27] 1,200 $584 $486 $1,016 $283 $733 $1 $277 Florida Municipal Power Agency 9 2043 [26] 95 $65 $684 $80 $74 $7 $0 $08 Kansas Electric Power Cooperative 10 2045 [28] 76 $46 $604 $64 $22 $43 $0 $29 Long Island Power Authority 11 2046 [30] 227 $177 $779 $192 $116 $76 $0 $3
10 Los Angeles Dept of Water and Power 12 2045-2047 [30] 240 $136 $568 $203 $133 $70 $0 $2
11 Massachusetts Muni Wholesale Elec Co 13 2030-2045 [18] 204 $143 $702 $173 $107 $65 $2 $412 Municipal Electric Authority of Georgia 14 2034-2049 [27] 831 $718 $864 $718 $440 $278 $0 $1013 Nebraska Public Power District 15 2034 [17] 801 $608 $759 $678 $582 $96 $0 $614 New York Power Authority 16 2015-2034 [8] 1,894 $2,126 $1,122 $2,126 $1,504 $622 $0 $8015 N Carolina Electric Membership Corp 8, 17 2043 [27] 741 $434 $585 $627 $201 $427 $3 $16
16 N Carolina Muni Power Agency No 1 17 2043 [27] 904 $529 $585 $765 $326 $440 $6 $1617 Oglethorpe Power Corporation 14 2034-2049 [26] 1,213 $1,068 $880 $1,068 $458 $610 $5 $2318 Old Dominion Electric Cooperative 18 2038-2040 [22] 227 $125 $550 $192 $159 $33 $0 $119 Omaha Public Power District 19 [0] 484 $1,383 $2,858 $1,383 $382 $1,001 $0 N.A.20 Orlando Utilities Commission 14 2043 [26] 66 $53 $802 $56 $42 $14 $0 $1
21 Piedmont Municipal Power Agency 17 2043 [27] 301 $176 $586 $255 $69 $186 $1 $722 Riverside Public Utilities 10, 20 [0] 38 $64 $1,688 $64 $72 -$8 $2 N.A.23 Salt River Project 2045-2047 [30] 736 $419 $569 $623 $370 $253 $0 $924 South Carolina Public Service Authority 2042 [26] 343 $415 $1,210 $415 $218 $197 $3 $825 South Mississippi Electric Power Assoc 21 2044 [28] 144 $123 $855 $123 $64 $59 $3 $2
26 Southern Calif. Public Power Authority 12 2045-2047 [30] 249 $141 $568 $211 $175 $36 $0 $127 Tennessee Valley Authority 15 2033-2055 [23] 8,476 $3,863 $456 $7,177 $1,673 $5,503 $0 $239
Public Power Utilities Totals 21,470 $15,070 $702 $20,000 $8,509 $11,490 $27 $514
See page 21 for endnotes.

2017 Nuclear Decommissioning Funding Study 7Knowledge. Experience. Integrity.
NDT fund balances have risen substantially since a sharp decline in 2008. The NDT funds covered in this study totaled nearly $64 billion in 2016. The $3.6 billion (6.1%) increase from a year earlier can be attributed largely to capital market performance in 2016, which saw the U.S. stock and bond markets up roughly 10% and 3%, respectively. Investor-owned funds have accounted for approximately 87% of total NDT fund balances over the past decade, with public power funds accounting for the remainder.
Fund Balances
NDT Fund Balances
$0
$10
$20
$30
$40
$50
$60
$70
2008 201120102009 2014 20162007
Investor-Owned Public Power Total
2012
($ b
illio
ns)
2013 2015
Investor-Owned ($bn) 38.0 30.0 35.7 39.1 40.9 44.6 50.5 52.8 52.1 55.3Public Power ($bn) 5.8 4.9 5.5 6.1 6.4 7.0 7.6 8.2 8.0 8.5
Total ($bn) 43.8 34.9 41.1 45.2 47.3 51.6 58.0 61.0 60.2 63.8
Did You Know?
2016 U.S. Electricity Generation by Source
Source: U.S. Energy Information Administration
PetroleumLiquids
<1%
OtherEnergy
1%
Other Renewables
Hydroelectric
Natural Gas Coal Nuclear
34% 30% 20%
8% 6%

2017 Nuclear Decommissioning Funding Study 8Knowledge. Experience. Integrity.
Total contributions fell for the second straight year, declining almost $64 million in 2016 to below $300 million for the first time. In 2016, investor-owned contributions were 60% of their 2007 level while public power contributions were just 25% of their 2007 level.
Contributions
Annual Contributions to NDT Funds
$0
$100
$200
$300
$400
$500
$600
2008 201120102009 2014 20162007
Investor-Owned Public Power Total
2012
($ m
illio
ns)
2013 2015
Investor-Owned ($mm) 449 461 407 429 424 388 315 344 335 271Public Power ($mm) 109 101 46 57 20 18 18 25 27 27
Total ($mm) 558 562 453 486 444 406 333 369 362 298
Did You Know?
The top five U.S. states in terms of number of operating nuclear power reactors:
1. Illinois (11)
2. Pennsylvania (9)
3. South Carolina (7)
4. New York (6)
5. Alabama and North Carolina (tie 5 each)
Source: Nuclear Energy Institute

2017 Nuclear Decommissioning Funding Study 9Knowledge. Experience. Integrity.
Total decommissioning cost estimates have risen from a low of $55 billion in 2008, reaching $91 bil-lion in 2016. The modest $1.1 billion (1.3%) increase from the $90 billion in 2015 is likely due to a combi-nation of updated site-specific cost studies by sev-eral owners and NRC minimum amounts that fell from their 2014 estimates.
As with NDT fund balances, investor-owned costs have accounted for more than four-fifths of total costs over the past decade, with public power costs accounting for the rest.
Cost Estimates
Cost Estimates of Decommissioning in Current Dollars
$0
$20
$40
$60
$80
$100
2008 201120102009 2014 20162007
Investor-Owned Public Power Total
2012 2013 2015
($ b
illio
ns)
Investor-Owned ($bn) 49.2 45.1 50.8 57.7 59.3 64.0 66.6 74.4 76.3 76.0Public Power ($bn) 9.5 10.0 10.6 11.7 11.2 12.1 12.8 13.6 13.5 15.1
Total ($bn) 58.7 55.1 61.5 69.4 70.5 76.2 79.4 88.1 89.9 91.0
Did You Know?
Of the U.S. operating nuclear power plants:
Largest: Palo Verde in Arizona
Smallest and Oldest: Oyster Creek in New
Jersey
Newest: Watts Bar in Tennessee
Source: Nuclear Energy Institute

2017 Nuclear Decommissioning Funding Study 10Knowledge. Experience. Integrity.
Investor-owned assets have lagged behind costs by approximately $11 billion to $24 billion over the past decade. Public power assets have lagged behind costs by approximately $3 billion to $7 billion over the same period.
The total deficit declined from a 10-year high of almost $30 billion in 2015 to $27 billion in 2016. The improve-ment is due to strong market performance as well as modest growth in costs in 2016.
Funding Status
Decommissioning Funding Status (Assets Less Costs)
-$30
-$25
-$20
-$15
-$10
-$5
$0
2008 201120102009 2014 20162007
Investor-Owned Public Power Total
2012
($ b
illio
ns)
2013 2015
Investor-Owned ($bn) -11.2 -15.2 -15.2 -18.6 -18.5 -19.5 -16.1 -21.6 -24.2 -20.7Public Power ($bn) -3.7 -5.0 -5.2 -5.6 -4.7 -5.1 -5.3 -5.4 -5.5 -6.6
Total ($bn) -14.9 -20.2 -20.3 -24.2 -23.2 -24.6 -21.4 -27.0 -29.7 -27.2

2017 Nuclear Decommissioning Funding Study 11Knowledge. Experience. Integrity.
Assets as a percentage of costs averaged approxi-mately 71% for investor-owned utilities over the past decade versus just 56% for public power utilities. Total funding stood at approximately 70% in 2016, an improvement from the previous year (67%). The improved funding status is largely due to the strong market performance of 2016.
Funding Status
Decommissioning Funding Status (Assets as Percentage of Costs)
40%
50%
60%
70%
80%
2008 201120102009 2014 20162007
Investor-Owned Public Power Total
2012 2013 2015
Investor-Owned 77.3% 66.4% 70.2% 67.8% 68.9% 69.6% 75.8% 70.9% 68.3% 72.8%Public Power 60.9% 49.5% 51.4% 52.2% 57.8% 57.7% 58.8% 60.4% 59.4% 56.5%
Total 74.7% 63.3% 66.9% 65.2% 67.1% 67.7% 73.1% 69.3% 66.9% 70.1%
Did You Know?
There are 99 nuclear power reactors operating in the U.S. in 30 states.
Watts Bar 2 began commercial operation in 2016, the first nuclear power plant to come online in the U.S. since Watts Bar 1 in 1996.
2016 also saw the closure of Fort Calhoun in Nebraska, keeping the number of operating reactors in the U.S. at 99.
65 are pressurized water reactors
34 are boiling water reactors
While 4 reactors are under construction (Virgil C. Summer 2 & 3 in South Carolina and Vogtle 3 & 4 in Georgia), a handful of owners say they plan to close a number of plants in the coming years.
Source: Nuclear Energy Institute

2017 Nuclear Decommissioning Funding Study 12Knowledge. Experience. Integrity.
Actual investor-owned contributions outpaced the pro forma estimate in the late 1990s before falling behind in 2000. In 2016, actual contributions were $1.5 bil-lion lower than the pro forma estimate. Actual con-tributions were just 15% of the pro forma estimate in 2016, the lowest percentage in the 16-year period.
Investor-Owned Pro Forma Contributions vs. Actual Contributions
Investor-Owned Utilities
$0
$400
$800
$1,200
$1,600
$2,000
2010 2012 20162000
Pro Forma Actual
2014200820062002 2004
1,49
01,
490
424
892
1,16
0
1,61
5
429
889
1,22
5
1,55
1
407
875 1,
003
1,03
546
1
983
901
449
1,01
5 1,15
6
1,12
3
564
1,13
770
3
1,74
8 33
91,
865
335
1,43
038
8
($ m
illio
ns)
1,24
4
1,31
4 31
5
1,78
027
1
In order to make the data among companies more comparable, we have calculated a “pro forma” decommissioning cost estimate, which is the higher of either the company cost estimate of decommissioning or the product of the company KW times the average cost per KW reported for all investor-owned utilities. In 2016, this average cost was $847/KW. Pro forma contribution is the pro forma fund shortfall (the difference between the “pro forma” cost estimate of decommissioning and the fund balance) divided by the average years until license expi-ration. The average years until license expiration weights each unit’s license by its percent of the total megawatts owned by that particular utility and takes into account license extensions granted by the NRC as of the end of each year listed.

2017 Nuclear Decommissioning Funding Study 13Knowledge. Experience. Integrity.
Actual public power contributions have lagged well behind the pro forma estimate from 2000 to 2016. While pro forma contributions grew from $324 million in 2000 to $514 million in 2016, actual contributions fell from $112 million to just $27 million. Actual contribu-tions as a percentage of the pro forma estimate were at 35% in 2000, but have fallen to just 5% in 2016.
Public Power Pro Forma Contributions vs. Actual Contributions
Public Power Utilities
$0
$100
$200
$300
$400
$500
$600
2010 2012 20162000
Pro Forma Actual
2014200820062002 2004
($ m
illio
ns)
401
401
19
84
36940
2
57
95
406
382
46
96
386
383
101
111
32134
8
109
112
376
324
100
405
87
1854
325
426 46
518
484
2751
427
In order to make the data among companies more comparable, we have calculated a “pro forma” decommissioning cost estimate, which is the higher of either the company cost estimate of decommissioning or the product of the company KW times the average cost per KW reported for all investor-owned utilities. In 2016, this average cost was $847/KW. Pro forma contribution is the pro forma fund shortfall (the difference between the “pro forma” cost estimate of decommissioning and the fund balance) divided by the average years until license expi-ration. The average years until license expiration weights each unit’s license by its percent of the total megawatts owned by that particular utility and takes into account license extensions granted by the NRC as of the end of each year listed.
Did You Know?
Public vs. Investor-Owned Generation Capacity
Public power 19% Investor-owned 81%
Source: Data from tables on pages 5-6.

2017 Nuclear Decommissioning Funding Study 14Knowledge. Experience. Integrity.
AllInvestor- Owned
Public Power
75th Percentile 220% 224% 220%
Median 177% 182% 175%
25th Percentile 156% 156% 157%
Average 190% 189% 204%
We gather both NRC and site-specific total cost esti-mates where possible in order to capture the relative magnitude of the two figures. This page is updated biennially to coincide with the NRC’s filing schedule.
Site-specific cost estimates totaled approximately $73 billion versus $39 billion under the NRC minimum for-mula in 2016, a difference of $34 billion. The median site-specific total cost estimate was approximately 1.75 times the NRC minimum formula amount for all plants regardless of ownership. Assuming license termination costs (the NRC portion of decommission-ing) represent approximately 60% of total site-specific costs, the NRC formula amounts are roughly in line with the site-specific estimates for license termination. Taking the assumption one step further, if the license termination portions of the site-specific estimates are roughly in line with the NRC formula amounts, then spent fuel management and site restoration costs are what account for most of the additional $34 billion in decommissioning costs.
The distributions are positively skewed, which results in average cost comparison figures that are approximately 5%–15% greater in absolute terms than the medians.
Cost Comparisons
Utilities Plants* Reactors*
24
46
76
24
21
1645
62
100
Investor-OwnedPublic PowerTotal
Decommissioning Cost Comparisons (Site-Specific Total/NRC Minimum)
0%
100%
200%
300%
400%
Investor-Owned Public PowerTotal
Dataset Breakdown
*Not necessarily distinct or wholly owned plants/reactors.
Notes
This page is updated biennially
to coincide with the NRC’s filing
schedule.
Bars depict the full range of cost
comparisons (site-specific total/
NRC minimum) while the darker
shading represents the 25th to
75th percentiles. The percentages
to the left show site-specific cost
estimates as a percentage of the
NRC minimum formula amounts.
The data set includes 2016 cost
estimates for 62 plants—not
necessarily distinct or wholly-
owned—owned by 45 utilities.

2017 Nuclear Decommissioning Funding Study 15Knowledge. Experience. Integrity.
Utilities employ escalation rates to forecast future decommissioning expenditures given current dollar cost estimates. The escalation rates shown to the right are a blend of escalation rates specific to the different cost categories such as labor, energy, and burial. The data set includes escalation rates for 68 plants—not necessarily distinct or wholly-owned—owned by 39 utilities.
The median escalation rate for all plants is 2.69% with an average of 3.15%. Public power plant escalation rates tend to be approximately 10–20 basis points above those of investor-owned plants. The median public power plant rate is 2.72% and average is 3.26%, contrasted with the median investor-owned plant esca-lation rate of 2.60% and average of 3.09%.
From an owner perspective, the median public power utility rate is 2.86% and the average is 3.32%, versus a median investor-owned utility escalation rate of 3.00% and average of 3.20%. The median escalation rate for all owners is 3.00% with an average of 3.26%.
Escalation Rates
Escalation Rates by Plant* Escalation Rates by Owner
AllInvestor- Owned
Public Power All
Investor- Owned
Public Power
75th Percentile 4.00% 3.79% 4.00% 4.00% 3.54% 4.00%
Median 2.69% 2.60% 2.72% 3.00% 3.00% 2.86%
25th Percentile 2.47% 2.40% 2.49% 2.49% 2.49% 2.49%
Average 3.15% 3.09% 3.26% 3.26% 3.20% 3.32%
Count 68 43 25 39 19 20
0%
1%
2%
3%
4%
5%
6%
Investor-Owned Public PowerTotal
0%
1%
2%
3%
4%
5%
6%
Decommissioning Escalation Rates
*Not necessarily distinct or wholly owned plants.
Note: Bars depict the full range of escalation rates while the darker shading represents the 25th to 75th percentiles.

2017 Nuclear Decommissioning Funding Study 16Knowledge. Experience. Integrity.
Asset allocation information is gathered each year for all NDT owners. Unfortunately, the public power data set is too limited to be meaningful so only investor-owned utility asset allocation data is displayed here; 25 of the 27 investor-owned utilities are represented in the data set.
All 25 NDTs are invested in equity and fixed income securities with a median allocation of 56% equity and 39% fixed income.
Approximately two-thirds of the owners reported a cash equivalent allocation that tended to range in the low single digits.
Four of the utilities reported allocations to real estate, private equity, and/or hedge funds with one-fifth indi-cating an “other” allocation. In most instances the other allocation could represent cash, alternatives, or other securities.
Asset Allocations
Investor-Owned Utilities’ Asset Allocations (as of 12/31/2016)
Equity Fixed Cash Alternatives Other75th Percentile 66% 43% 2% 17% 3%
Median 56% 39% 1% 12% 2%
25th Percentile 51% 32% 1% 7% 2%
Percent Invested 100% 100% 64% 16% 20%
Count 25 25 16 4 5
20%
60%
40%
80%
0%
Note: Bars depict the full range of asset allocations while the darker shading represents the 25th to 75th percentiles.

2017 Nuclear Decommissioning Funding Study 17Knowledge. Experience. Integrity.
We show the range of returns for 23 of the 27 inves-tor-owned utilities for periods ended Dec. 31, 2016. Investor-owned utilities with nuclear power reactors outperformed the S&P 500 Utilities Index over all peri-ods with mixed results compared to the broad market S&P 500 Index.
Investment Returns of Investor-Owned Utilities
Last Quarter
Last Year
Last 3 Years
Last 5 Years
Last 10 Years
75th Percentile 5.6 25.3 18.1 14.8 10.3
Median 0.4 17.8 14.7 12.2 7.9
25th Percentile -1.6 11.9 8.6 5.9 3.1
S&P 500 3.8 12.0 8.9 14.7 6.9
S&P 500 Utilities 0.1 16.3 12.6 10.4 7.0
Count 23 23 23 23 23
-20%0%
20%40%60%80%
100%120%
Investor-Owned Utilities’ Returns (Periods ended 12/31/2016)
Note: Bars depict the range of returns from the 5th to 95th percentile while the darker shading represents the 25th to 75th percentiles. Last year return figures include a 125% return for Talen Energy.

2017 Nuclear Decommissioning Funding Study 18Knowledge. Experience. Integrity.
This chart shows the 10-year return and standard devi-ation ended Dec. 31, 2016, for the 23 investor-owned utilities along with the S&P 500 Utilities and S&P 500 Indices. A majority of investor-owned utilities had a more volatile (greater standard deviation) return pat-tern than both the indices over the past 10 years.
It is important to note that nuclear power generation accounts for varying degrees of the utilities’ overall businesses.
Investment Returns of Investor-Owned Utilities (Continued)
Annualized Return vs. Standard Deviation (10 years ended 12/31/2016)
10% 15% 20% 25% 30% 35%
-10%
-5%
0%
5%
10%
15%
20%
Investor-Owned Utilities
Ann
ualiz
ed R
etur
n
S&P 500Utilities
S&P 500
Standard Deviation

2017 Nuclear Decommissioning Funding Study 19Knowledge. Experience. Integrity.
#1 United States805.3 bn kWh19.7% total electricity99 operating units
#6 Canada97.4 bn kWh15.6% total electricity19 operating units
#4 Russia179.7 bn kWh17.1% total electricity37 operating units
#10 Sweden60.6 bn kWh40.0% total electricity10 operating units
#5 South Korea154.3 bn kWh30.3% total electricity25 operating units
#3 China210.5 bn kWh3.6% total electricity36 operating units
#9 United Kingdom65.1 bn kWh20.4% total electricity15 operating units
#2 France384.0 bn kWh72.3% total electricity58 operating units
#7 Ukraine81.0 bn kWh52.3% total electricity15 operating units
#8 Germany80.1 bn kWh13.1% total electricity8 operating units
Global Nuclear Power Generation
Top 10 Nuclear Generating Countries in 2016
Top 10 Countries by Nuclear Power as a Percentage of Total Electricity Generation
Share ofCountry Total ElectricityFrance 72.3%Slovakia 54.1%Ukraine 52.3%Belgium 51.7%Hungary 51.3%Sweden 40.0%Slovenia 35.2%Bulgaria 35.0%Switzerland 34.4%Finland 33.7%
Source: Nuclear Energy Institute

2017 Nuclear Decommissioning Funding Study 20Knowledge. Experience. Integrity.
Endnotes from page 5:1 Cost estimate in 2014 dollars2 2014 contribution3 Cost estimate in 2015 dollars4 NRC mininum cost estimate5 Fair market value; license termination funds only6 Includes 660 MW Millstone Unit 1 and 566 MW Kewaunee, which have been shut down permanently. Total
cost less certain spent fuel costs expected to be recovered from the Department of Energy.7 Fair market value8 Includes 860 MW Crystal River Unit 3, which has been shut down permanently. Cost estimate in 2013 and
2014 dollars.9 Includes 620 MW Vermont Yankee, which has been shut down permanently. Excludes Indian Point Unit 3
and James A. Fitzpatrick (trust funds retained by New York Power Authority). Cost estimates in 2012 and 2014–2017 dollars.
10 Includes 210 MW Dresden Unit 1 and 115 MW Peach Bottom Unit 1, which have been shut down perma-nently. Combination of site-specific license termination cost estimates and NRC minimums.
11 Includes 906 MW Three Mile Island Unit 2, which has been shut down permanently12 Total cost less certain spent fuel costs expected to be recovered from the Department of Energy13 Combination of site-specific total cost estimates in 2015 dollars and NRC minimums14 Cost estimate in 2012 dollars15 Includes 65 MW Humboldt Bay Unit 3, which has been shut down permanently16 Includes 1,070 MW San Onofre Unit 2 and 1,080 MW San Onofre Unit 3, which have shut down
permanently17 Cost estimate in 2014 and 2016 dollars18 Cost estimate in 2013 and 2015 dollars
Endnotes

2017 Nuclear Decommissioning Funding Study 21Knowledge. Experience. Integrity.
Endnotes
Endnotes from page 6:1 NRC mininum cost estimate in 2010 dollars2 Cost estimate in 2012 dollars3 Fund balance as of Sept. 30, 20164 Cost estimate in 2008 dollars5 2015 contribution6 Cost estimate in 2015 dollars7 Fund balance as of June 30, 2016, and Dec. 31, 20168 2014 contribution9 2015 cost estimate less certain spent fuel costs expected to be recovered from the Department of Energy10 Cost estimate in 2014 dollars11 Cost estimate in 2012 dollars and represents license termination costs only12 Fund balance as of June 30, 201613 Cost estimate in 2015 and 2016 dollars14 Cost estimate in 2015 dollars15 NRC mininum cost estimate16 Cost estimate in 2007 and 2012 dollars17 Cost estimate in 2013 dollars18 2016 cost estimate less certain spent fuel costs expected to be recovered from the Department of Energy19 Includes 484 MW Fort Calhoun Unit 1, which shut down permanently in 201620 Includes 1,070 MW San Onofre Unit 2 and 1,080 MW San Onofre Unit 3, which shut down permanently in
2013 and are decommissioning21 Cost estimate in 2017 dollars

2017 Nuclear Decommissioning Funding Study 22Knowledge. Experience. Integrity.
Julia A. Moriarty, CFA, is a Senior Vice President and Co-Manager of Callan’s Capital Markets
Research group. The Capital Markets group helps Callan’s fund sponsor clients with their strategic
planning, conducting asset/liability studies, developing optimal investment manager structures, and
providing custom research on a variety of investment topics. The group consults to a wide range of
clients, including defined benefit and defined contribution employee-benefit plans (corporate, public,
and Taft-Hartley), endowments, foundations, insurance, hospitals, health-care systems, and nuclear
decommissioning trusts. Julia also conducts target date and diversified real return manager research
and publishes Callan’s annual Nuclear Decommissioning Funding Study. Julia is a shareholder of the
firm and is a member of Callan’s Management Committee.
Julia earned an MBA from the University of California at Berkeley’s Haas School of Business and a
BS in Finance from California Polytechnic State University at San Luis Obispo. She earned the right to
use the Chartered Financial Analyst designation and is a member of the CFA Society of San Francisco
and CFA Institute.
About the Author

About Callan Callan was founded as an employee-owned investment consulting firm in 1973. Ever since, we have empowered institu-tional clients with creative, customized investment solutions that are backed by proprietary research, exclusive data, and ongoing education. Today, Callan advises on more than $2 trillion in total fund sponsor assets, which makes it among the largest independently owned investment consulting firms in the U.S. Callan uses a client-focused consulting model to serve pension and defined contribution plan sponsors, endowments, foundations, independent investment advisers, invest-ment managers, and other asset owners. Callan has five offices throughout the U.S. For more information, please visit www.callan.com.
About the Callan InstituteThe Callan Institute, established in 1980, is a source of continuing education for those in the institutional investment community. The Institute conducts conferences and workshops and provides published research, surveys, and newslet-ters. The Institute strives to present the most timely and relevant research and education available so our clients and our associates stay abreast of important trends in the investments industry.
For more information about this report, please contact: Your Callan consultant or Julia Moriarty at [email protected]
© 2017 Callan LLC.

Corporate Headquarters
600 Montgomery StreetSuite 800San Francisco, CA 94111800.227.3288415.974.5060
www.callan.com
Regional Offices
Atlanta800.522.9782
Chicago800.999.3536
Denver855.864.3377
New Jersey800.274.5878
@CallanLLC Callan